Exhibit 99.1
FOURTH QUARTER 2008
FINANCIAL SUPPLEMENT
If you need further information, please contact:
Dave Miller, Investor Relations
901-523-4162
dwmiller@firsthorizon.com
| TABLE OF CONTENTS | |||||||||||
| Page | |||||||||||
| First Horizon National Corporation Segment Structure | 3 | ||||||||||
| Performance Highlights | 4 | ||||||||||
| Charges for Restructuring, Repositioning, & Efficiency Initiatives | 6 | ||||||||||
| Consolidated Results | |||||||||||
| Income Statement | |||||||||||
| Summary Income Statement | 7 | ||||||||||
| Income Statement | 8 | ||||||||||
| Other Income and Other Expense | 9 | ||||||||||
| Balance Sheet | |||||||||||
| Period End Balance Sheet | 10 | ||||||||||
| Average and Period End Loans | 11 | ||||||||||
| Average Balance Sheet | 12 | ||||||||||
| Average Balance Sheet: Income & Expense | 13 | ||||||||||
| Average Balance Sheet: Yields & Rates | 14 | ||||||||||
| Mortgage Servicing Rights | 15 | ||||||||||
| Business Segment Detail | |||||||||||
| Segment Highlights | 16 | ||||||||||
| Regional Banking | 17 | ||||||||||
| Capital Markets | 18 | ||||||||||
| National Specialty Lending | 19 | ||||||||||
| Mortgage Banking | 20 | ||||||||||
| Mortgage Banking: Servicing | 21 | ||||||||||
| Corporate | 22 | ||||||||||
| Capital Highlights | 23 | ||||||||||
| Asset Quality | |||||||||||
| Asset Quality: Consolidated | 24 | ||||||||||
| Analysis of FAS 114 Loans, ORE, & NPL Rollforward | 26 | ||||||||||
| Asset Quality: Regional Banking | 27 | ||||||||||
| Asset Quality: National Specialty Lending | 28 | ||||||||||
| Asset Quality: Mortgage Banking & Capital Markets | 29 | ||||||||||
| Asset Quality Highlights: Key Portfolios - Commercial | 30 | ||||||||||
| Asset Quality Highlights: Key Portfolios - Consumer | 31 | ||||||||||
| Asset Quality Process | 32 | ||||||||||
| Glossary of Terms | 33 | ||||||||||
| Other Information | |||||||||||
This financial supplement contains forward-looking statements involving significant risks and uncertainties. A number of important factors could cause actual results to differ materially from those in the forward-looking information. Those factors include general economic and financial market conditions, including expectations of and actual timing and amount of interest rate movements including the slope of the yield curve, competition, customer and investor responses to these conditions, ability to execute business plans, geopolitical developments, recent and future legislative and regulatory developments, natural disasters, and items mentioned in this financial supplement and in FHN's most recent press release, as well as critical accounting estimates and other factors described in FHN’s recent filings with the SEC. FHN disclaims any obligation to update any such factors or to publicly announce the result of any revisions to any of the forward-looking statements included herein or therein to reflect future events or developments. | |||||||||||
| FIRST HORIZON NATIONAL CORPORATION SEGMENT STRUCTURE | ||||||||||
| Regional Banking | ||||
| -Traditional banking services for consumers and business | ||||
| -Activities include lending and deposit taking, investments, insurance, financial planning, trust services, asset management, | ||||
| cash management, and health savings accounts | ||||
| -Primarily southeastern US footprint, with approximately 200 financial centers in Tennessee and nearby markets | ||||
| -First Tennessee banking franchise and middle market lending are key businesses | ||||
| -First Horizon Banks included for periods prior to divestiture | ||||
| Capital Markets | ||||
| -Fixed income sales, trading, and strategies for institutional clients in U.S. and abroad | ||||
| -Other capital markets products include: | ||||
| -Equity research, portfolio advisory, derivatives, and loan trading | ||||
| -Correspondent banking provides credit, depository, and other banking related services to other financial institutions | ||||
| National Specialty Lending | ||||
| -Wind-down portfolio that includes lending activities such as consumer lending and construction lending outside Regional Banking footprint | ||||
| -Construction lending includes national home builder, one-time close, and commercial real estate portfolios | ||||
| -In January 2008, FHN announced the discontinuation of national home builder and commercial real estate | ||||
| lending through its First Horizon Construction Lending offices | ||||
| -Consumer lending consists mainly of national retail-originated home equity loans and lines | ||||
| Mortgage Banking | ||||
| -Primarily consists of first lien mortgage originations and servicing | ||||
| -In a transaction that closed on August 31, 2008, First Horizon National Corp sold its mortgage servicing platform | ||||
| and origination offices outside Tennessee to MetLife Bank, N.A. | ||||
| Corporate | ||||
| -Includes executive management, enterprise-wide risk management, corporate finance, | ||||
| corporate communications, and legal functions | ||||
| -Also includes funding function for the corporation and any impact from balance sheet positioning | ||||
3
| PERFORMANCE HIGHLIGHTS | |||||||||
| Summary of Fourth Quarter 2008 Significant Items (in millions) | |||||||||
| Segment | Item | Income Statement | Pre-Tax | Comments | |||||
| National Specialty Lending | MSR Valuation Adjustment | Noninterest income: Revenue from loan sales and securitizations | $(5.1) | Reduction in valuation of MSR related to prior consumer loan sales primarily due to interest rate changes. | |||||
| Mortgage Banking | Reinsurance Reserve | Noninterest expense: Other | $(16.5) | Increase in reserves for PMI reinsurance contracts due to increasing mortgage defaults. | |||||
| Servicing Sale Obligation | Noninterest income: Mortgage Banking | $(6.5) | Recognition of liability for minimum servicing fee guarantee on prior servicing sales. | ||||||
| Corporate | Reduction of Visa Contingent Liability | Noninterest expense: Other | $11.0 | Reversal of proportionate share of escrow funding by Visa for certain Visa litigation matters for which FHN has a contingent guarantee. | |||||
| Venture Capital Investment Dividends | Net interest income | $3.6 | Dividends received as part of wind down of venture capital investments. | ||||||
| Sales of Venture Capital Investments | Securities Gains/(Losses) | $1.3 | Gains from marks to sales price for venture capital investments. | ||||||
| Restructuring, Repositioning & Efficiency Initiatives | Noninterest expense: Various | $(10.2) | Expenses from contract terminations, severance, and office closures. Detailed further on page 6. | ||||||
| Restructuring, Repositioning & Efficiency Initiatives | Noninterest income: Various | $(.1) | True up from Mortgage divestiture & repurchase reserves from First Horizon Bank branch sales. Detailed further on page 6. | ||||||
| (Fourth Quarter 2008 vs. Third Quarter 2008) | ||||
| Asset Quality | ||||
| - Provision decreased to $280.0 million in the fourth quarter compared to $340.0 million in third quarter 2008 | ||||
| - Portfolio deterioration in fourth quarter due to declining economic conditions | ||||
| - Continuing commercial portfolio deterioration | ||||
| - Residential CRE seeing downward trend in provisioning as credits are further along in credit cycle | ||||
| - Income CRE and C&I experiencing negative grade migration | ||||
| - Improved delinquency trends | ||||
| - Consumer portfolios experiencing continued stress | ||||
| - Home equity delinquencies increased | ||||
| - OTC provisioning limited due to third quarter efforts to identify inherent losses | ||||
| - Permanent mortgage portfolio experiencing increased loss severities | ||||
| - Net charge-offs were 361 annualized basis points of average loans driven by residential CRE, C&I, home equity and OTC portfolios | ||||
| - Net charge-offs of $191.2 million in fourth quarter compared to $154.7 million in prior quarter | ||||
| - Charging off almost all impaired commercial loan balances down to most likely estimate of collateral value net of costs to sell | ||||
| - NPAs increased to 538 basis points from 463 basis points reflecting portfolio deterioration from current economic conditions | ||||
| - Total NPAs increased to $1.2 billion from $1.0 billion primarily from deterioration in national construction portfolios | ||||
| - Allowance as a percentage of loans ratio increased to 399 basis points from 352 basis points in prior quarter | ||||
| Capital | ||||
| - Continued quarterly dividend payable in common stock | ||||
| - Received $866.5 million of funds from Capital Purchase Program | ||||
| - Considered part of Tier I Capital | ||||
| - Current ratios also continue to benefit from balance sheet contraction (estimated based on period end balances) | ||||
| - 7.3% for tangible common equity to tangible assets | ||||
| - 14.9% for Tier I | ||||
| - 20.1% for Total Capital | ||||
4
| PERFORMANCE HIGHLIGHTS (continued) | |||||
| (Fourth Quarter 2008 vs. Third Quarter 2008) | |||||
| Regional Banking | |||||
| - Net interest margin decreased to 4.22% compared to 4.43% in third quarter | |||||
| - Reflects competition for deposit accounts and increase in nonaccrual loans | |||||
| - Noninterest income declined to $82.6 million from $87.9 million | |||||
| - Reduced deposit and wealth management fees in fourth quarter due to weak economic conditions | |||||
| - Provision expense in third and fourth quarters primarily reflects deterioration in commercial loans | |||||
| - Noninterest expense increased to $167.8 million compared to $158.6 million in prior quarter | |||||
| - Primarily from higher personnel, infrastructure and credit-related costs | |||||
| Capital Markets | |||||
| - Fixed income revenues were $156.5 million in fourth quarter compared to $80.1 million in prior quarter | |||||
| - Increase due to Federal Reserve rate reductions in fourth quarter creating a steeper yield curve | |||||
| - Also benefited from market volatility | |||||
| - Other product revenues were $20.8 million in fourth quarter compared to $18.4 million in third quarter | |||||
| - Provision expense decreased to $8.1 million from $38.5 million | |||||
| - Current stress in financial system continuing to impact correspondent banking loans | |||||
| - Increase in noninterest expense resulted from higher production levels | |||||
| National Specialty Lending | |||||
| - Sequential decline in net interest income as loan portfolios continue to wind down | |||||
| - Net interest margin decreased to 1.85% compared to 2.14% in third quarter | |||||
| - Primarily results from an increase in nonaccrual loans | |||||
| - Provision for loan losses continues to reflect deterioration within national construction and consumer lending portfolios | |||||
| - Noninterest income decreased sequentially | |||||
| - $5.1 million reduction in value of MSR primarily due to interest rate changes | |||||
| - Charge of $2.3 million recognized in fourth quarter for repurchase reserves | |||||
| - $1.7 million charge recognized in third quarter | |||||
| - Noninterest expense decreased primarily due to the effects of winding down operations | |||||
| Mortgage Banking | |||||
| - Decreased origination income due to completion of MetLife transaction in August | |||||
| - Net effect of adopting new accounting standards negatively affected pre-tax earnings by negligible amount | |||||
| - $14.4 million negative effect on third quarter 2008 | |||||
| - Third quarter adjustment of $15.5 million to reflect revised cash flow expectations related to mortgage origination activities | |||||
| - Hedging results positively impacted earnings by $64.6 million vs. $50.8 million in third quarter | |||||
| - Falling rates and a steeper yield curve combined with positive convexity in the portfolio to benefit the hedge position | |||||
| - Servicing runoff decreased to $9.9 million for fourth quarter from $20.1 million in prior quarter | |||||
| - Consistent with decline in servicing portfolio | |||||
| - Other income declined due to completion of MetLife transaction | |||||
| - $6.5 million charge recognized in fourth quarter related to servicing fee guarantees on prior servicing sales | |||||
| - Net interest income declines consistent with decrease in warehouse | |||||
| - Provision of $22.0 million in fourth quarter due to deterioration in permanent mortgage portfolio | |||||
| - $2.9 million of provision in prior quarter | |||||
| - Noninterest expense declined to $39.5 million in fourth quarter compared to $89.0 million in prior quarter | |||||
| - Due to sale of national mortgage offices and servicing platform at the end of August | |||||
| - Fourth quarter includes $16.5 million of expense for PMI reinsurance liability due to increased mortgage defaults | |||||
| - Provision for foreclosure losses of $1.8 million in fourth quarter | |||||
| - $3.4 million in third quarter | |||||
| Taxes | |||||
| - Approximate $8 million positive quarterly effect from permanent tax credits | |||||
| Corporate Segment | |||||
| - Net charges of $10.3 million recognized for restructuring, repositioning and efficiency initiatives (detail on next page) | |||||
| - Fourth quarter included $10.2 million of expenses | |||||
| - Primarily for contract terminations, severance and office closures | |||||
| - $0.1 million of net charges related to Mortgage and First Horizon Bank branch sales presented in (Losses)/Gains on Divestitures | |||||
| - Prior quarter included $33.9 million of net charges for these initiatives | |||||
| - $11.0 million of expense reductions recognized in fourth quarter related to contingent liability for Visa litigation matters | |||||
| - Represents FHN's proportionate share of Visa's escrow funding in fourth quarter | |||||
| - $11.0 million of expense recognized in third quarter to increase contingent liability | |||||
| - $3.6 million of dividends received from venture capital investments included in interest income | |||||
| - $1.3 million of securities gains from marks to sales price for venture capital investments | |||||
| - Fourth quarter includes $2.3 million of gains on repurchase of $35.0 million of debt | |||||
| - Prior quarter included $18.9 million of gains on repurchase of $91.7 million of debt | |||||
5
CHARGES FOR RESTRUCTURING, REPOSITIONING, & EFFICIENCY INITIATIVES | ||||||||||||||||||||
| Unaudited | ||||||||||||||||||||
| By Income Statement Impact (Thousands, rounded) | 4Q08 | 3Q08 | 2Q08 | 1Q08 | 4Q07 | |||||||||||||||
| Noninterest income | ||||||||||||||||||||
| Mortgage banking | $ | - | $ | (700 | ) | $ | (9,300 | ) | $ | (2,700 | ) | $ | (6,400 | ) | ||||||
| Gains/(Losses) on divestitures | (100 | ) | (17,500 | ) | (400 | ) | (1,000 | ) | 15,700 | |||||||||||
| Noninterest expense | ||||||||||||||||||||
| Employee compensation, incentives, and benefits | 600 | 10,700 | 5,700 | 7,400 | 8,400 | |||||||||||||||
| Occupancy | (200 | ) | 3,900 | 3,400 | 1,000 | 5,500 | ||||||||||||||
| Operations services | - | - | - | - | 400 | |||||||||||||||
| Equipment rentals, depreciation, and maintenance | - | 100 | 4,200 | - | 500 | |||||||||||||||
| All other expense | 9,800 | 1,000 | 3,000 | 9,200 | 21,100 | |||||||||||||||
| Total (loss) before income taxes | $ | (10,300 | ) | $ | (33,900 | ) | $ | (26,000 | ) | $ | (21,300 | ) | $ | (26,600 | ) | |||||
6
| CONSOLIDATED SUMMARY RESULTS | ||||||||||||||||||||||||||||
| Quarterly, Unaudited | ||||||||||||||||||||||||||||
| 4Q08 Change vs. | ||||||||||||||||||||||||||||
| (Thousands) | 4Q08 | 3Q08 | 2Q08 | 1Q08 | 4Q07 | 3Q08 | 4Q07 | |||||||||||||||||||||
| Income Statement Highlights | ||||||||||||||||||||||||||||
| Net interest income | $ | 204,948 | $ | 223,147 | $ | 238,895 | $ | 228,092 | $ | 225,987 | (8 | )% | (9 | )% | ||||||||||||||
| Noninterest income | 336,672 | 305,383 | 400,018 | 383,130 | 103,429 | 10 | % | 226 | % | |||||||||||||||||||
| Securities gains/(losses), net | 1,346 | (210 | ) | (972 | ) | 65,946 | (10,442 | ) | NM | NM | ||||||||||||||||||
| Total revenue | 542,966 | 528,320 | 637,941 | 677,168 | 318,974 | 3 | % | 70 | % | |||||||||||||||||||
| Noninterest expense | 349,658 | 402,274 | 465,843 | 438,277 | 561,559 | (13 | )% | (38 | )% | |||||||||||||||||||
| Provision | 280,000 | 340,000 | 220,000 | 240,000 | 156,519 | (18 | )% | 79 | % | |||||||||||||||||||
| Pre-tax income/(loss) | (86,692 | ) | (213,954 | ) | (47,902 | ) | (1,109 | ) | (399,104 | ) | 59 | % | 78 | % | ||||||||||||||
| Benefit for income taxes | (30,988 | ) | (88,859 | ) | (28,821 | ) | (8,146 | ) | (146,342 | ) | 65 | % | 79 | % | ||||||||||||||
| Income/(loss) from continuing operations | (55,704 | ) | (125,095 | ) | (19,081 | ) | 7,037 | (252,762 | ) | 55 | % | 78 | % | |||||||||||||||
Income from discontinued operations, net of tax | - | - | - | 883 | 4,137 | - | (100 | )% | ||||||||||||||||||||
| Net income/(loss) | $ | (55,704 | ) | $ | (125,095 | ) | $ | (19,081 | ) | $ | 7,920 | $ | (248,625 | ) | 55 | % | 78 | % | ||||||||||
| Preferred stock dividends | - | - | - | - | - | - | - | |||||||||||||||||||||
| Income/(loss) available to common shareholders | $ | (55,704 | ) | $ | (125,095 | ) | $ | (19,081 | ) | $ | 7,920 | $ | (248,625 | ) | 55 | % | 78 | % | ||||||||||
| Common Stock Data | ||||||||||||||||||||||||||||
| Diluted EPS from continuing operations (a) | $ | (.27 | ) | $ | (.61 | ) | $ | (.11 | ) | $ | .05 | $ | (1.91 | ) | 56 | % | 86 | % | ||||||||||
| Diluted EPS (a) | (.27 | ) | (.61 | ) | (.11 | ) | .06 | (1.88 | ) | 56 | % | 86 | % | |||||||||||||||
| Diluted shares (a) | 204,882 | 204,880 | 180,186 | 132,938 | 132,336 | * | 55 | % | ||||||||||||||||||||
| Period-end shares outstanding (a) | 205,819 | 205,837 | 205,994 | 133,639 | 133,218 | * | 54 | % | ||||||||||||||||||||
| Dividends declared per share (b) | NM (c) | NM (d) | $ | .19 | (e) | $ | .19 | (e) | $ | .43 | (e) | NM | NM | |||||||||||||||
| Balance Sheet Highlights (Period End) | ||||||||||||||||||||||||||||
| Total loans, net of unearned income | $ | 21,278,190 | $ | 21,601,898 | $ | 22,225,232 | $ | 21,932,020 | $ | 22,103,516 | (1 | )% | (4 | )% | ||||||||||||||
| Total loans held for sale-divestiture | - | - | - | 207,672 | 289,878 | - | (100 | )% | ||||||||||||||||||||
| Total deposits | 14,241,814 | 13,778,235 | 15,093,947 | 16,188,542 | 17,032,285 | 3 | % | (16 | )% | |||||||||||||||||||
| Total deposits-divestiture | - | - | 296,632 | 118,720 | 230,418 | - | (100 | )% | ||||||||||||||||||||
| Total assets | 31,021,980 | 32,804,376 | 35,549,961 | 37,267,945 | 37,015,461 | (5 | )% | (16 | )% | |||||||||||||||||||
| Total assets-divestiture | - | - | 395,628 | 216,431 | 305,734 | - | (100 | )% | ||||||||||||||||||||
| Total liabilities | 27,447,348 | 29,931,458 | 32,557,238 | 34,860,441 | 34,584,588 | (8 | )% | (21 | )% | |||||||||||||||||||
| Total liabilities-divestiture | - | - | 298,098 | 120,590 | 232,343 | - | (100 | )% | ||||||||||||||||||||
| Total shareholders' equity | 3,279,467 | 2,577,641 | 2,697,446 | 2,112,227 | 2,135,596 | 27 | % | 54 | % | |||||||||||||||||||
| Key Ratios & Other | ||||||||||||||||||||||||||||
| Return on average assets | (.71 | )% | (1.49 | )% | (.21 | )% | .09 | % | (2.65 | )% | ||||||||||||||||||
| Return on average equity (f) | (7.14 | )% | (18.30 | )% | (3.02 | )% | 1.47 | % | (42.52 | )% | ||||||||||||||||||
| Net interest margin | 2.96 | % | 3.01 | % | 3.01 | % | 2.81 | % | 2.77 | % | ||||||||||||||||||
| Efficiency ratio | 64.4 | % | 76.1 | % | 73.0 | % | 64.7 | % | 176.1 | % | ||||||||||||||||||
| Book value per common share | $ | 12.13 | $ | 12.52 | $ | 13.09 | $ | 15.81 | $ | 16.03 | ||||||||||||||||||
| Tangible book value per common share | $ | 10.98 | $ | 11.36 | $ | 11.92 | $ | 13.98 | $ | 14.16 | ||||||||||||||||||
| FTE employees | 6,095 | 6,195 | 9,386 | 9,711 | 10,174 | (2 | )% | (40 | )% | |||||||||||||||||||
| NM - Not meaningful | |
| * Amount is less than one percent. | |
| Certain previously reported amounts have been reclassified to agree with current presentation. | |
| (a) | Shares restated for October 1, 2008 and January 1, 2009 stock dividends. |
| (b) | Third and fourth quarter 2008 dividend declared paid in shares. |
| (c) | Stock dividend rate of 1.837% per share. |
| (d) | Stock dividend rate of 3.0615% per share. |
| (e) | Cash dividends per share restated for October 1, 2008, and January 1, 2009, stock dividends. |
| (f) | Ratio includes preferred stock related to the CPP. |
7
| CONSOLIDATED INCOME STATEMENT | ||||||||||||||||||||||||||||
| Quarterly, Unaudited | ||||||||||||||||||||||||||||
| 4Q08 Change vs. | ||||||||||||||||||||||||||||
| (Thousands) | 4Q08 | 3Q08 | 2Q08 | 1Q08 | 4Q07 | 3Q08 | 4Q07 | |||||||||||||||||||||
| Interest income | $ | 331,554 | $ | 383,243 | $ | 415,485 | $ | 476,443 | $ | 545,136 | (13 | )% | (39 | )% | ||||||||||||||
| Less interest expense | 126,606 | 160,096 | 176,590 | 248,351 | 319,149 | (21 | )% | (60 | )% | |||||||||||||||||||
| Net interest income | 204,948 | 223,147 | 238,895 | 228,092 | 225,987 | (8 | )% | (9 | )% | |||||||||||||||||||
| Provision for loan losses | 280,000 | 340,000 | 220,000 | 240,000 | 156,519 | (18 | )% | 79 | % | |||||||||||||||||||
| Net interest income/(loss) after | ||||||||||||||||||||||||||||
| provision for loan losses | (75,052 | ) | (116,853 | ) | 18,895 | (11,908 | ) | 69,468 | 36 | % | (208 | )% | ||||||||||||||||
| Noninterest income: | ||||||||||||||||||||||||||||
| Capital markets | 174,671 | 95,954 | 122,338 | 131,457 | 98,482 | 82 | % | 77 | % | |||||||||||||||||||
| Deposit transactions | ||||||||||||||||||||||||||||
| and cash management | 43,882 | 45,802 | 46,797 | 42,553 | 47,971 | (4 | )% | (9 | )% | |||||||||||||||||||
| Mortgage banking (a) (b) (c) | 80,087 | 106,817 | 172,418 | 158,712 | (113,965 | ) | (25 | )% | 170 | % | ||||||||||||||||||
| Trust services and investment | ||||||||||||||||||||||||||||
| management | 7,675 | 8,154 | 8,883 | 9,109 | 10,097 | (6 | )% | (24 | )% | |||||||||||||||||||
| Insurance commissions | 6,806 | 7,332 | 6,822 | 8,144 | 7,529 | (7 | )% | (10 | )% | |||||||||||||||||||
| Revenue from loan sales and securitizations (d) | (782 | ) | 3,238 | (6,984 | ) | (4,097 | ) | (171 | ) | (124 | )% | (357 | )% | |||||||||||||||
| Securities gains/(losses), net | 1,346 | (210 | ) | (972 | ) | 65,946 | (10,442 | ) | NM | NM | ||||||||||||||||||
| Gains/(losses) on divestitures (e) | (106 | ) | (17,489 | ) | (429 | ) | (995 | ) | 15,695 | 99 | % | (101 | )% | |||||||||||||||
| Other | 24,439 | 55,575 | 50,173 | 38,247 | 37,791 | (56 | )% | (35 | )% | |||||||||||||||||||
| Total noninterest income | 338,018 | 305,173 | 399,046 | 449,076 | 92,987 | 11 | % | 264 | % | |||||||||||||||||||
| Adjusted gross income after | ||||||||||||||||||||||||||||
| provision for loan losses | 262,966 | 188,320 | 417,941 | 437,168 | 162,455 | 40 | % | 62 | % | |||||||||||||||||||
| Noninterest expense: | ||||||||||||||||||||||||||||
| Employee compensation, | ||||||||||||||||||||||||||||
| incentives and benefits (c) (e) | 180,871 | 215,498 | 277,078 | 287,470 | 226,905 | (16 | )% | (20 | )% | |||||||||||||||||||
| Occupancy (e) | 19,149 | 27,210 | 30,018 | 28,591 | 34,209 | (30 | )% | (44 | )% | |||||||||||||||||||
| Operations services | 19,345 | 20,041 | 19,124 | 18,964 | 20,148 | (3 | )% | (4 | )% | |||||||||||||||||||
| Equipment rentals, depreciation | ||||||||||||||||||||||||||||
| and maintenance | 11,454 | 12,336 | 18,268 | 15,011 | 16,252 | (7 | )% | (30 | )% | |||||||||||||||||||
| Legal and professional fees | 17,711 | 16,955 | 14,030 | 15,022 | 17,629 | 4 | % | * | ||||||||||||||||||||
| Communications and courier | 7,754 | 9,628 | 11,477 | 11,004 | 10,664 | (19 | )% | (27 | )% | |||||||||||||||||||
| Amortization of intangible assets | 1,805 | 1,802 | 2,182 | 2,440 | 2,864 | * | (37 | )% | ||||||||||||||||||||
| Goodwill impairment | - | - | - | - | 71,074 | NM | NM | |||||||||||||||||||||
| Other (c) (e) (f) (g) | 91,569 | 98,804 | 93,666 | 59,775 | 161,814 | (7 | )% | (43 | )% | |||||||||||||||||||
| Total noninterest expense | 349,658 | 402,274 | 465,843 | 438,277 | 561,559 | (13 | )% | (38 | )% | |||||||||||||||||||
| Pretax (loss) | (86,692 | ) | (213,954 | ) | (47,902 | ) | (1,109 | ) | (399,104 | ) | 59 | % | 78 | % | ||||||||||||||
| Benefit for income taxes | (30,988 | ) | (88,859 | ) | (28,821 | ) | (8,146 | ) | (146,342 | ) | 65 | % | 79 | % | ||||||||||||||
| Income/(loss) from continuing operations | $ | (55,704 | ) | $ | (125,095 | ) | $ | (19,081 | ) | $ | 7,037 | $ | (252,762 | ) | 55 | % | 78 | % | ||||||||||
| Income from discontinued operations, | ||||||||||||||||||||||||||||
| net of tax | - | - | - | 883 | 4,137 | NM | NM | |||||||||||||||||||||
| Net income/(loss) | $ | (55,704 | ) | $ | (125,095 | ) | $ | (19,081 | ) | $ | 7,920 | $ | (248,625 | ) | 55 | % | 78 | % | ||||||||||
| Preferred stock dividends | - | - | - | - | - | NM | NM | |||||||||||||||||||||
| Income/(loss) available to common shareholders | $ | (55,704 | ) | $ | (125,095 | ) | $ | (19,081 | ) | $ | 7,920 | $ | (248,625 | ) | 55 | % | 78 | % | ||||||||||
| NM - Not meaningful | |
| * Amount is less than one percent. | |
| Certain previously reported amounts have been reclassified to agree with current presentation. | |
| 4Q08 Key Impacts | |
| (a) | Includes recognition of liability for minimum servicing fee guarantee related to prior servicing sales. |
| (b) | Includes effects of electing fair value for mortgage warehouse loans. |
| (c) | Includes effect of adopting new accounting standards. |
| (d) | Includes MSR valuation adjustment related to prior consumer loan sales. |
| (e) | Includes a portion of net charges for $10.3 million, see Restructuring, Repositioning & Efficiency Initiatives page for further details. |
| (f) | Includes increase in reinsurance reserves for PMI reinsurance contracts. |
| (g) | Includes reversal of expense related to Visa litigation matters for which FHN is contingently liable. |
8
| OTHER INCOME AND OTHER EXPENSE | ||||||||||||||||||||||||||||
| Quarterly, Unaudited | ||||||||||||||||||||||||||||
| 4Q08 Change vs. | ||||||||||||||||||||||||||||
| (Thousands) | 4Q08 | 3Q08 | 2Q08 | 1Q08 | 4Q07 | 3Q08 | 4Q07 | |||||||||||||||||||||
| Other Income | ||||||||||||||||||||||||||||
| Brokerage management fees and | ||||||||||||||||||||||||||||
| commissions | $ | 7,307 | $ | 7,824 | $ | 8,690 | $ | 8,413 | $ | 8,747 | (7 | )% | (16 | )% | ||||||||||||||
| Bank owned life insurance | 5,107 | 6,731 | 6,343 | 6,962 | 6,697 | (24 | )% | (24 | )% | |||||||||||||||||||
| Bankcard income | 5,226 | 5,587 | 5,728 | 5,540 | 6,221 | (6 | )% | (16 | )% | |||||||||||||||||||
| Other service charges | 3,002 | 3,043 | 3,189 | 3,396 | 3,357 | (1 | )% | (11 | )% | |||||||||||||||||||
| Remittance processing | 3,160 | 3,314 | 3,206 | 3,273 | 3,450 | (5 | )% | (8 | )% | |||||||||||||||||||
| Reinsurance fees | 2,624 | 2,830 | 3,320 | 3,145 | 2,794 | (7 | )% | (6 | )% | |||||||||||||||||||
| ATM interchange fees | 2,485 | 2,263 | 2,238 | 2,238 | 2,224 | 10 | % | 12 | % | |||||||||||||||||||
| Deferred compensation | (12,531 | ) | (5,145 | ) | 1,325 | (6,550 | ) | (1,667 | ) | 144 | % | 652 | % | |||||||||||||||
| Letter of credit | 1,322 | 1,603 | 1,274 | 1,458 | 1,759 | (18 | )% | (25 | )% | |||||||||||||||||||
| Electronic banking fees | 1,492 | 1,535 | 1,572 | 1,618 | 1,636 | (3 | )% | (9 | )% | |||||||||||||||||||
| Check clearing fees | 538 | 838 | 887 | 862 | 1,125 | (36 | )% | (52 | )% | |||||||||||||||||||
| Federal flood certifications | - | 863 | 1,259 | 1,523 | 1,084 | (100 | )% | (100 | )% | |||||||||||||||||||
| Other | 4,707 | 24,289 | 11,142 | 6,369 | 364 | (81 | )% | NM | ||||||||||||||||||||
| Total | $ | 24,439 | $ | 55,575 | $ | 50,173 | $ | 38,247 | $ | 37,791 | (56 | )% | (35 | )% | ||||||||||||||
| Other Expense | ||||||||||||||||||||||||||||
| Computer software (a) | 7,151 | 7,162 | 8,120 | 7,956 | 26,185 | * | (73 | )% | ||||||||||||||||||||
| Advertising and public relations (a) | 7,366 | 9,142 | 7,179 | 9,327 | 10,297 | (19 | )% | (28 | )% | |||||||||||||||||||
| Travel and entertainment (a) | 3,314 | 3,358 | 5,672 | 5,027 | 5,829 | (1 | )% | (43 | )% | |||||||||||||||||||
| Low income housing expense | 4,289 | 5,064 | 4,815 | 4,566 | 6,605 | (15 | )% | (35 | )% | |||||||||||||||||||
| Contract employment (a) | 11,569 | 9,033 | 7,359 | 5,584 | 5,202 | NM | NM | |||||||||||||||||||||
| Distributions on preferred stock | ||||||||||||||||||||||||||||
| of subsidiary | 4,209 | 2,875 | 2,844 | 4,061 | 4,679 | 46 | % | (10 | )% | |||||||||||||||||||
| Foreclosed real estate | 10,941 | 4,979 | 10,720 | 6,362 | 8,871 | 120 | % | 23 | % | |||||||||||||||||||
| Supplies (a) | 2,053 | 2,725 | 2,942 | 3,020 | 3,496 | (25 | )% | (41 | )% | |||||||||||||||||||
| Loan closing costs | 3,129 | 10,314 | 11,718 | 13,060 | 1,279 | (70 | )% | 145 | % | |||||||||||||||||||
| Customer relations | 1,897 | 2,727 | 2,544 | 1,707 | 2,834 | (30 | )% | (33 | )% | |||||||||||||||||||
| Other insurance and taxes | 2,305 | 749 | 2,036 | 1,758 | 2,684 | 208 | % | (14 | )% | |||||||||||||||||||
| Employee training and dues | 1,771 | 1,485 | 1,632 | 1,398 | 1,183 | 19 | % | 50 | % | |||||||||||||||||||
| Fed services fees | 1,526 | 1,975 | 1,941 | 1,611 | 1,463 | (23 | )% | 4 | % | |||||||||||||||||||
| Complimentary check expense | 1,065 | 1,259 | 1,154 | 1,298 | 1,206 | (15 | )% | (12 | )% | |||||||||||||||||||
| Loan insurance expense | 1,482 | 1,477 | 1,198 | 1,113 | 1,073 | * | 38 | % | ||||||||||||||||||||
| Bank examination costs | 514 | 1,523 | 1,054 | 1,053 | 1,142 | (66 | )% | (55 | )% | |||||||||||||||||||
| Deposit insurance premium | 4,288 | 4,146 | 3,403 | 2,827 | 1,223 | 3 | % | 251 | % | |||||||||||||||||||
| Other (a) (b) (c) | 22,700 | 28,811 | 17,335 | (11,953 | ) | 76,563 | (21 | )% | (70 | )% | ||||||||||||||||||
| Total | $ | 91,569 | $ | 98,804 | $ | 93,666 | $ | 59,775 | $ | 161,814 | (7 | )% | (43 | )% | ||||||||||||||
| NM - Not meaningful | |
| * Amount is less than one percent. | |
| Certain previously reported amounts have been reclassified to agree with current presentation. | |
| 4Q08 Key Impacts | |
| (a) | Includes a portion of net charges for $9.8 million, see Restructuring, Repositioning & Efficiency Initiatives page for further details. |
| (b) | Includes increase in reinsurance reserves for PMI reinsurance contracts. |
| (c) | Includes reversal of expense related to Visa litigation matters for which FHN is contingently liable. |
9
| CONSOLIDATED PERIOD-END BALANCE SHEET | ||||||||||||||||||||||||||||
| Quarterly, Unaudited | ||||||||||||||||||||||||||||
| 4Q08 Change vs. | ||||||||||||||||||||||||||||
| (Thousands) | 4Q08 | 3Q08 | 2Q08 | 1Q08 | 4Q07 | 3Q08 | 4Q07 | |||||||||||||||||||||
| Assets | ||||||||||||||||||||||||||||
| Investment securities | $ | 3,125,153 | $ | 2,840,739 | $ | 2,896,928 | $ | 3,034,798 | $ | 3,032,791 | 10 | % | 3 | % | ||||||||||||||
| Loans held for sale | 566,654 | 718,029 | 2,554,030 | 3,616,018 | 3,461,712 | (21 | )% | (84 | )% | |||||||||||||||||||
| Loans held for sale-divestiture (a) | - | - | - | 207,672 | 289,878 | NM | NM | |||||||||||||||||||||
| Loans, net of unearned income | 21,278,190 | 21,601,898 | 22,225,232 | 21,932,020 | 22,103,516 | (1 | )% | (4 | )% | |||||||||||||||||||
| Federal funds sold and securities | ||||||||||||||||||||||||||||
| purchased under agreements to resell | 772,357 | 921,295 | 1,166,982 | 898,615 | 1,089,495 | (16 | )% | (29 | )% | |||||||||||||||||||
| Interest bearing cash | 207,792 | 37,546 | 39,829 | 46,382 | 39,422 | 453 | % | 427 | % | |||||||||||||||||||
| Trading securities | 945,766 | 1,561,024 | 1,473,815 | 1,553,053 | 1,768,763 | (39 | )% | (47 | )% | |||||||||||||||||||
| Trading securities-divestiture (a) | - | - | 89,239 | - | - | NM | NM | |||||||||||||||||||||
| Total earning assets | 26,895,912 | 27,680,531 | 30,446,055 | 31,288,558 | 31,785,577 | (3 | )% | (15 | )% | |||||||||||||||||||
| Cash and due from banks | 552,423 | 815,935 | 838,376 | 851,875 | 1,170,220 | (32 | )% | (53 | )% | |||||||||||||||||||
| Capital markets receivables | 1,178,932 | 1,651,547 | 994,571 | 1,680,057 | 524,419 | (29 | )% | 125 | % | |||||||||||||||||||
| Mortgage servicing rights, net | 376,844 | 798,491 | 903,634 | 895,923 | 1,159,820 | (53 | )% | (68 | )% | |||||||||||||||||||
| Mortgage servicing rights, net-divestiture (a) | - | - | 235,761 | - | - | NM | NM | |||||||||||||||||||||
| Goodwill | 192,408 | 192,408 | 192,408 | 192,408 | 192,408 | NM | NM | |||||||||||||||||||||
| Other intangible assets, net | 45,081 | 46,887 | 48,615 | 52,017 | 56,907 | (4 | )% | (21 | )% | |||||||||||||||||||
| Premises and equipment, net | 333,931 | 336,078 | 344,410 | 382,488 | 399,305 | * | (16 | )% | ||||||||||||||||||||
| Real estate acquired by foreclosure (b) | 125,538 | 151,461 | 141,857 | 106,018 | 103,982 | (17 | )% | 21 | % | |||||||||||||||||||
| Allowance for loan losses | (849,210 | ) | (760,456 | ) | (575,149 | ) | (483,203 | ) | (342,341 | ) | 12 | % | 148 | % | ||||||||||||||
| Other assets | 2,170,121 | 1,891,494 | 1,908,795 | 2,293,045 | 1,949,308 | 15 | % | 11 | % | |||||||||||||||||||
| Other assets-divestiture (a) | - | - | 70,628 | 8,759 | 15,856 | NM | NM | |||||||||||||||||||||
| Total assets | $ | 31,021,980 | $ | 32,804,376 | $ | 35,549,961 | $ | 37,267,945 | $ | 37,015,461 | (5 | )% | (16 | )% | ||||||||||||||
| Liabilities and Shareholders' Equity | ||||||||||||||||||||||||||||
| Deposits | ||||||||||||||||||||||||||||
| Savings | $ | 4,824,939 | $ | 4,350,832 | $ | 4,041,352 | $ | 4,217,215 | $ | 3,872,684 | 11 | % | 25 | % | ||||||||||||||
| Other interest-bearing deposits | 1,783,362 | 1,638,731 | 1,880,678 | 1,986,556 | 1,946,933 | 9 | % | (8 | )% | |||||||||||||||||||
| Time deposits | 2,294,644 | 2,510,344 | 2,468,521 | 2,648,339 | 2,826,301 | (9 | )% | (19 | )% | |||||||||||||||||||
| Interest bearing deposits-divestiture (a) | - | - | - | 99,370 | 189,051 | NM | NM | |||||||||||||||||||||
| Total interest-bearing core deposits | 8,902,945 | 8,499,907 | 8,390,551 | 8,951,480 | 8,834,969 | 5 | % | * | ||||||||||||||||||||
| Noninterest-bearing deposits | 3,956,633 | 3,808,239 | 4,453,332 | 4,995,696 | 5,026,417 | 4 | % | (21 | )% | |||||||||||||||||||
| Noninterest-bearing deposits-divestiture (a) | - | - | 296,632 | 18,197 | 28,750 | NM | NM | |||||||||||||||||||||
| Total core deposits | 12,859,578 | 12,308,146 | 13,140,515 | 13,965,373 | 13,890,136 | 4 | % | (7 | )% | |||||||||||||||||||
| Certificates of deposit $100,000 and more | 1,382,236 | 1,470,089 | 1,953,432 | 2,222,016 | 3,129,532 | (6 | )% | (56 | )% | |||||||||||||||||||
| Certificates of deposit $100,000 and more-divestiture (a) | - | - | - | 1,153 | 12,617 | NM | NM | |||||||||||||||||||||
| Total deposits | 14,241,814 | 13,778,235 | 15,093,947 | 16,188,542 | 17,032,285 | 3 | % | (16 | )% | |||||||||||||||||||
| Federal funds purchased and securities | ||||||||||||||||||||||||||||
| sold under agreements to repurchase | 1,751,079 | 1,890,681 | 2,620,014 | 3,678,217 | 4,829,597 | (7 | )% | (64 | )% | |||||||||||||||||||
| Federal funds purchased and securities | ||||||||||||||||||||||||||||
| sold under agreements to repurchase-divestiture (a) | - | - | - | 11,572 | 20,999 | NM | NM | |||||||||||||||||||||
| Trading liabilities | 359,502 | 380,896 | 464,225 | 531,259 | 556,144 | (6 | )% | (35 | )% | |||||||||||||||||||
| Other short term borrowings and commercial paper (c) | 4,279,689 | 6,149,073 | 5,998,810 | 4,753,582 | 3,422,995 | (30 | )% | 25 | % | |||||||||||||||||||
| Term borrowings | 4,022,297 | 4,545,791 | 5,783,407 | 6,060,795 | 6,027,967 | (12 | )% | (33 | )% | |||||||||||||||||||
| Other collateralized borrowings | 745,363 | 749,797 | 767,010 | 809,273 | 800,450 | * | (7 | )% | ||||||||||||||||||||
| Total long-term debt | 4,767,660 | 5,295,588 | 6,550,417 | 6,870,068 | 6,828,417 | (10 | )% | (30 | )% | |||||||||||||||||||
| Capital markets payables | 1,115,428 | 1,645,118 | 868,883 | 1,688,870 | 586,358 | (32 | )% | 90 | % | |||||||||||||||||||
| Other liabilities | 932,176 | 785,061 | 959,476 | 1,136,461 | 1,305,868 | 19 | % | (29 | )% | |||||||||||||||||||
| Other liabilities-divestiture (a) | - | - | 1,466 | 1,870 | 1,925 | NM | NM | |||||||||||||||||||||
| Total liabilities | 27,447,348 | 29,924,652 | 32,557,238 | 34,860,441 | 34,584,588 | (8 | )% | (21 | )% | |||||||||||||||||||
| Preferred stock of subsidiary | 295,165 | 295,277 | 295,277 | 295,277 | 295,277 | * | * | |||||||||||||||||||||
| Shareholders' Equity | ||||||||||||||||||||||||||||
| Preferred stock capital surplus - (CPP) | 782,680 | - | - | - | - | NM | NM | |||||||||||||||||||||
| Common stock | 128,302 | 125,996 | 122,345 | 79,242 | 78,979 | 2 | % | 62 | % | |||||||||||||||||||
| Capital surplus | 1,048,602 | 1,016,498 | 980,428 | 362,823 | 361,826 | 3 | % | 190 | % | |||||||||||||||||||
| Capital surplus common stock warrants - (CPP) | 83,860 | - | - | - | - | NM | NM | |||||||||||||||||||||
| Undivided profits | 1,387,854 | 1,489,990 | 1,646,272 | 1,704,559 | 1,742,892 | (7 | )% | (20 | )% | |||||||||||||||||||
| Accumulated other comprehensive loss, net | (151,831 | ) | (48,037 | ) | (51,599 | ) | (34,397 | ) | (48,101 | ) | (216 | )% | (216 | )% | ||||||||||||||
| Total shareholders' equity | 3,279,467 | 2,584,447 | 2,697,446 | 2,112,227 | 2,135,596 | 27 | % | 54 | % | |||||||||||||||||||
| Total liabilities and shareholders' equity | $ | 31,021,980 | $ | 32,804,376 | $ | 35,549,961 | $ | 37,267,945 | $ | 37,015,461 | (5 | )% | (16 | )% | ||||||||||||||
| NM - Not meaningful | |
| * Amount is less than one percent. | |
| Certain previously reported amounts have been reclassified to agree with current presentation. | |
| (a) | Second quarter 2008 associated with the sale of certain mortgage operations, prior periods associated with the sale of First Horizon Bank branches. |
| (b) | Fourth quarter 2008 includes $21.2 million of foreclosed assets related to government insured mortgages. |
| (c) | Fourth quarter 2008 includes $4.0 billion of FRB Term Auction Facility borrowings. |
10
| CONSOLIDATED AVERAGE AND PERIOD-END LOANS | ||||||||||||||||||||||||||||
| Quarterly, Unaudited | ||||||||||||||||||||||||||||
| 4Q08 Change vs. | ||||||||||||||||||||||||||||
| (Thousands) | 4Q08 | 3Q08 | 2Q08 | 1Q08 | 4Q07 | 3Q08 | 4Q07 | |||||||||||||||||||||
| Average Loans (Net) | ||||||||||||||||||||||||||||
| Commercial | ||||||||||||||||||||||||||||
| Commercial, financial and industrial | $ | 7,516,557 | $ | 7,530,724 | $ | 7,212,907 | $ | 7,121,890 | $ | 6,957,498 | * | 8 | % | |||||||||||||||
| Real estate commercial (a) | 1,479,582 | 1,497,773 | 1,401,267 | 1,347,377 | 1,301,866 | (1 | )% | 14 | % | |||||||||||||||||||
| Real estate construction (b) | 1,917,647 | 2,162,817 | 2,481,680 | 2,713,253 | 2,825,210 | (11 | )% | (32 | )% | |||||||||||||||||||
| Total commercial loans | 10,913,786 | 11,191,314 | 11,095,854 | 11,182,520 | 11,084,574 | (2 | )% | (2 | )% | |||||||||||||||||||
| Retail | ||||||||||||||||||||||||||||
| Real estate residential (c) | 8,172,174 | 8,166,295 | 7,878,845 | 7,774,415 | 7,605,345 | * | 7 | % | ||||||||||||||||||||
| Real estate construction (d) | 1,087,752 | 1,350,092 | 1,666,007 | 1,909,061 | 2,096,561 | (19 | )% | (48 | )% | |||||||||||||||||||
| Other retail | 137,185 | 138,848 | 138,242 | 141,961 | 144,116 | (1 | )% | (5 | )% | |||||||||||||||||||
| Credit card receivables | 190,189 | 193,517 | 193,850 | 195,081 | 201,153 | (2 | )% | (5 | )% | |||||||||||||||||||
| Real estate loans pledged against | ||||||||||||||||||||||||||||
| other collateralized borrowings (e) | 716,925 | 721,760 | 735,828 | 755,071 | 779,013 | (1 | )% | (8 | )% | |||||||||||||||||||
| Total retail loans | 10,304,225 | 10,570,512 | 10,612,772 | 10,775,589 | 10,826,188 | (3 | )% | (5 | )% | |||||||||||||||||||
| Total loans, net of unearned income | $ | 21,218,011 | $ | 21,761,826 | $ | 21,708,626 | $ | 21,958,109 | $ | 21,910,762 | (2 | )% | (3 | )% | ||||||||||||||
| Period-End Loans (Net) | ||||||||||||||||||||||||||||
| Commercial | ||||||||||||||||||||||||||||
| Commercial, financial and industrial | $ | 7,863,727 | $ | 7,642,684 | $ | 7,717,110 | $ | 7,238,630 | $ | 7,140,087 | 3 | % | 10 | % | ||||||||||||||
| Real estate commercial (a) | 1,454,040 | 1,492,323 | 1,463,726 | 1,345,526 | 1,294,922 | (3 | )% | 12 | % | |||||||||||||||||||
| Real estate construction (b) | 1,778,140 | 2,020,455 | 2,271,533 | 2,602,968 | 2,753,475 | (12 | )% | (35 | )% | |||||||||||||||||||
| Total commercial loans | 11,095,907 | 11,155,462 | 11,452,369 | 11,187,124 | 11,188,484 | (1 | )% | (1 | )% | |||||||||||||||||||
| Retail | ||||||||||||||||||||||||||||
| Real estate residential (c) | 8,161,435 | 8,192,926 | 8,196,622 | 7,858,109 | 7,791,885 | * | 5 | % | ||||||||||||||||||||
| Real estate construction (d) | 980,798 | 1,201,911 | 1,513,845 | 1,814,863 | 2,008,289 | (18 | )% | (51 | )% | |||||||||||||||||||
| Other retail | 135,779 | 139,441 | 138,970 | 138,253 | 144,019 | (3 | )% | (6 | )% | |||||||||||||||||||
| Credit card receivables | 189,554 | 194,966 | 195,703 | 191,119 | 204,812 | (3 | )% | (7 | )% | |||||||||||||||||||
| Real estate loans pledged against | ||||||||||||||||||||||||||||
| other collateralized borrowings (e) | 714,717 | 717,192 | 727,723 | 742,552 | 766,027 | * | (7 | )% | ||||||||||||||||||||
| Total retail loans | 10,182,283 | 10,446,436 | 10,772,863 | 10,744,896 | 10,915,032 | (3 | )% | (7 | )% | |||||||||||||||||||
| Total loans, net of unearned income | $ | 21,278,190 | $ | 21,601,898 | $ | 22,225,232 | $ | 21,932,020 | $ | 22,103,516 | (1 | )% | (4 | )% | ||||||||||||||
| * Amount is less than one percent. | |
| Certain previously reported amounts have been reclassified to agree with current presentation. | |
| (a) | Includes nonconstruction income property loans. |
| (b) | Includes home builder, condominium, and income property construction loans. |
| (c) | Includes home equity loans, home equity lines of credit and permanent mortgages. |
| (d) | Includes one-time close product. |
| (e) | Includes on balance sheet securitizations of home equity loans. |
11
| CONSOLIDATED AVERAGE BALANCE SHEET | ||||||||||||||||||||||||||||
| Quarterly, Unaudited | ||||||||||||||||||||||||||||
| 4Q08 Change vs. | ||||||||||||||||||||||||||||
| (Thousands) | 4Q08 | 3Q08 | 2Q08 | 1Q08 | 4Q07 | 3Q08 | 4Q07 | |||||||||||||||||||||
| Assets: | ||||||||||||||||||||||||||||
| Earning assets: | ||||||||||||||||||||||||||||
| Loans, net of unearned income (a) | $ | 21,218,011 | $ | 21,761,826 | $ | 21,708,626 | $ | 21,958,109 | $ | 21,910,762 | (2 | )% | (3 | )% | ||||||||||||||
| Loans held for sale | 650,844 | 1,950,831 | 3,606,621 | 3,728,008 | 3,337,237 | (67 | )% | (80 | )% | |||||||||||||||||||
| Loans held for sale-divestiture (b) | - | - | 195,175 | 248,751 | 467,424 | NM | NM | |||||||||||||||||||||
| Investment securities: | ||||||||||||||||||||||||||||
| U.S. Treasuries | 48,415 | 47,843 | 47,123 | 43,305 | 36,062 | 1 | % | 34 | % | |||||||||||||||||||
| U.S. government agencies | 2,576,587 | 2,524,895 | 2,649,651 | 2,725,948 | 2,787,078 | 2 | % | (8 | )% | |||||||||||||||||||
| States and municipalities | 75,084 | 31,682 | 31,347 | 12,847 | 1,740 | 137 | % | NM | ||||||||||||||||||||
| Other | 282,639 | 268,939 | 257,907 | 232,472 | 230,808 | 5 | % | 22 | % | |||||||||||||||||||
| Total investment securities | 2,982,725 | 2,873,359 | 2,986,028 | 3,014,572 | 3,055,688 | 4 | % | (2 | )% | |||||||||||||||||||
| Capital markets securities inventory | 1,135,270 | 1,355,501 | 1,630,501 | 1,961,964 | 1,934,055 | (16 | )% | (41 | )% | |||||||||||||||||||
| Mortgage banking trading securities | 242,930 | 304,278 | 387,469 | 405,579 | 527,453 | (20 | )% | (54 | )% | |||||||||||||||||||
| Mortgage banking trading securities-divestiture (b) | - | 62,131 | 981 | - | - | NM | NM | |||||||||||||||||||||
| Other earning assets: | ||||||||||||||||||||||||||||
| Federal funds sold and securities | ||||||||||||||||||||||||||||
| purchased under agreements to resell | 911,387 | 1,213,510 | 1,275,548 | 1,304,707 | 1,237,957 | (25 | )% | (26 | )% | |||||||||||||||||||
| Interest bearing cash | 546,732 | 39,666 | 36,573 | 46,093 | 28,968 | NM | NM | |||||||||||||||||||||
| Total other earning assets | 1,458,119 | 1,253,176 | 1,312,121 | 1,350,800 | 1,266,925 | 16 | % | 15 | % | |||||||||||||||||||
| Total earning assets | 27,687,899 | 29,561,102 | 31,827,522 | 32,667,783 | 32,499,544 | (6 | )% | (15 | )% | |||||||||||||||||||
| Allowance for loan losses | (741,076 | ) | (619,977 | ) | (529,124 | ) | (359,600 | ) | (246,916 | ) | 20 | % | 200 | % | ||||||||||||||
| Cash and due from banks | 495,500 | 638,467 | 697,013 | 786,693 | 846,793 | (22 | )% | (41 | )% | |||||||||||||||||||
| Capital markets receivables | 432,614 | 196,285 | 251,667 | 297,908 | 182,358 | 120 | % | 137 | % | |||||||||||||||||||
| Premises and equipment, net | 334,642 | 339,575 | 373,403 | 390,291 | 407,212 | (1 | )% | (18 | )% | |||||||||||||||||||
| Other assets | 2,839,665 | 3,219,952 | 3,517,017 | 3,367,729 | 3,540,575 | (12 | )% | (20 | )% | |||||||||||||||||||
| Other assets-divestiture (b) | - | 46,091 | 8,603 | 11,581 | 20,868 | NM | NM | |||||||||||||||||||||
| Total assets | $ | 31,049,244 | $ | 33,381,495 | $ | 36,146,101 | $ | 37,162,385 | $ | 37,250,434 | (7 | )% | (17 | )% | ||||||||||||||
| Liabilities and shareholders' equity: | ||||||||||||||||||||||||||||
| Interest-bearing liabilities: | ||||||||||||||||||||||||||||
| Interest-bearing deposits: | ||||||||||||||||||||||||||||
| Interest bearing deposits-divestiture (b) | $ | - | $ | - | $ | 30,695 | $ | 127,352 | $ | 292,615 | NM | NM | ||||||||||||||||
| Other interest-bearing deposits | 1,615,764 | 1,724,504 | 1,911,341 | 1,922,506 | 1,685,749 | (6 | )% | (4 | )% | |||||||||||||||||||
| Savings | 4,741,073 | 4,002,907 | 4,180,739 | 4,134,308 | 3,749,222 | 18 | % | 26 | % | |||||||||||||||||||
| Time deposits | 2,461,921 | 2,422,189 | 2,530,300 | 2,763,335 | 2,850,719 | 2 | % | (14 | )% | |||||||||||||||||||
| Total interest-bearing core deposits | 8,818,758 | 8,149,600 | 8,653,075 | 8,947,501 | 8,578,305 | 8 | % | 3 | % | |||||||||||||||||||
| Certificates of deposit $100,000 and more | 1,491,297 | 1,839,651 | 2,022,972 | 2,696,781 | 4,464,070 | (19 | )% | (67 | )% | |||||||||||||||||||
| Certificates of deposit $100,000 and more-divestiture (b) | - | - | 279 | 4,770 | 30,499 | NM | NM | |||||||||||||||||||||
| Federal funds purchased and securities | ||||||||||||||||||||||||||||
| sold under agreements to repurchase | 2,021,033 | 2,593,485 | 3,810,955 | 5,236,736 | 4,936,968 | (22 | )% | (59 | )% | |||||||||||||||||||
| Federal funds purchased and securities | ||||||||||||||||||||||||||||
| sold under agreements to repurchase-divestiture (b) | - | - | 3,102 | 16,171 | 33,370 | NM | NM | |||||||||||||||||||||
| Capital markets trading liabilities | 488,102 | 708,875 | 768,565 | 846,369 | 812,969 | (31 | )% | (40 | )% | |||||||||||||||||||
| Other short-term borrowings and commercial paper (c) | 5,096,108 | 6,083,691 | 5,513,454 | 3,850,704 | 2,651,882 | (16 | )% | 92 | % | |||||||||||||||||||
| Long term debt: | ||||||||||||||||||||||||||||
| Term borrowings | 4,266,510 | 5,193,319 | 5,886,694 | 6,013,433 | 5,981,215 | (18 | )% | (29 | )% | |||||||||||||||||||
| Other collateralized borrowings | 747,824 | 756,999 | 792,388 | 790,811 | 813,075 | (1 | )% | (8 | )% | |||||||||||||||||||
| Total long-term debt | 5,014,334 | 5,950,318 | 6,679,082 | 6,804,244 | 6,794,290 | (16 | )% | (26 | )% | |||||||||||||||||||
| Total interest-bearing liabilities | 22,929,632 | 25,325,620 | 27,451,484 | 28,403,276 | 28,302,353 | (9 | )% | (19 | )% | |||||||||||||||||||
| Noninterest-bearing deposits | 3,652,161 | 4,031,157 | 4,619,333 | 4,743,479 | 4,838,363 | (9 | )% | (25 | )% | |||||||||||||||||||
| Other noninterest-bearing deposits-divestiture (b) | - | 3,038 | 8,902 | 21,327 | 54,928 | NM | NM | |||||||||||||||||||||
| Capital markets payables | 374,368 | 178,289 | 232,282 | 292,846 | 173,351 | 110 | % | 116 | % | |||||||||||||||||||
| Other liabilities | 692,759 | 827,244 | 995,931 | 1,234,695 | 1,262,345 | (16 | )% | (45 | )% | |||||||||||||||||||
| Other liabilities-divestiture (b) | - | 1,397 | 1,022 | 2,335 | 3,885 | NM | NM | |||||||||||||||||||||
| Preferred stock of subsidiary | 295,165 | 295,277 | 295,277 | 295,277 | 295,277 | * | * | |||||||||||||||||||||
| Shareholders' equity | 3,105,159 | 2,719,473 | 2,541,870 | 2,169,150 | 2,319,932 | 14 | % | 34 | % | |||||||||||||||||||
| Total liabilities and shareholders' equity | $ | 31,049,244 | $ | 33,381,495 | $ | 36,146,101 | $ | 37,162,385 | $ | 37,250,434 | (7 | )% | (17 | )% | ||||||||||||||
| NM - Not meaningful | |
| * Amount is less than one percent. | |
| Certain previously reported amounts have been reclassified to agree with current presentation. | |
| (a) | Includes loans on nonaccrual status. |
| (b) | Third and second quarters 2008 associated with the sale of certain mortgage operations, prior periods associated with the sale of First Horizon Bank branches. |
| (c) | In fourth quarter 2008, FRB Term Auction Facility borrowings averaged $3.1 billion and FHLB borrowings averaged $1.7 billion. |
12
| CONSOLIDATED AVERAGE BALANCE SHEET: INCOME & EXPENSE | ||||||||||||||||||||||||||||
| Quarterly, Unaudited | ||||||||||||||||||||||||||||
| 4Q08 Change vs. | ||||||||||||||||||||||||||||
| (Thousands) | 4Q08 | 3Q08 | 2Q08 | 1Q08 | 4Q07 | 3Q08 | 4Q07 | |||||||||||||||||||||
| Assets: | ||||||||||||||||||||||||||||
| Earning assets: | ||||||||||||||||||||||||||||
| Loans, net of unearned income (a) | $ | 254,946 | $ | 281,777 | $ | 285,539 | $ | 331,803 | $ | 385,027 | (10 | )% | (34 | )% | ||||||||||||||
| Loans held for sale | 9,821 | 29,078 | 54,217 | 58,438 | 62,249 | (66 | )% | (84 | )% | |||||||||||||||||||
| Investment securities: | ||||||||||||||||||||||||||||
| U.S. Treasuries | 233 | 250 | 249 | 340 | 434 | (7 | )% | (46 | )% | |||||||||||||||||||
| U.S. government agencies | 36,565 | 34,886 | 36,573 | 37,954 | 39,027 | 5 | % | (6 | )% | |||||||||||||||||||
| States and municipalities | 944 | 372 | 324 | 220 | 4 | 154 | % | NM | ||||||||||||||||||||
| Other | 6,080 | 3,336 | 2,159 | 2,290 | 2,904 | 82 | % | 109 | % | |||||||||||||||||||
| Total investment securities | 43,822 | 38,844 | 39,305 | 40,804 | 42,369 | 13 | % | 3 | % | |||||||||||||||||||
| Capital markets securities inventory | 12,790 | 15,898 | 18,131 | 22,652 | 25,261 | (20 | )% | (49 | )% | |||||||||||||||||||
| Mortgage banking trading securities | 8,253 | 11,781 | 12,120 | 13,363 | 16,436 | (30 | )% | (50 | )% | |||||||||||||||||||
| Other earning assets: | ||||||||||||||||||||||||||||
| Federal funds sold and securities | ||||||||||||||||||||||||||||
| purchased under agreements to resell | 1,493 | 5,944 | 6,266 | 9,341 | 13,485 | (75 | )% | (89 | )% | |||||||||||||||||||
| Interest bearing cash | 850 | 253 | 189 | 357 | 450 | 236 | % | 89 | % | |||||||||||||||||||
| Total other earning assets | 2,343 | 6,197 | 6,455 | 9,698 | 13,935 | (62 | )% | (83 | )% | |||||||||||||||||||
| Total earning assets/interest income | $ | 331,975 | $ | 383,575 | $ | 415,767 | $ | 476,758 | $ | 545,277 | (13 | )% | (39 | )% | ||||||||||||||
| Liabilities and shareholders' equity: | ||||||||||||||||||||||||||||
| Interest-bearing liabilities: | ||||||||||||||||||||||||||||
| Interest-bearing deposits: | ||||||||||||||||||||||||||||
| Other interest-bearing deposits | $ | 1,552 | $ | 2,849 | $ | 3,556 | $ | 5,906 | $ | 5,976 | (46 | )% | (74 | )% | ||||||||||||||
| Savings | 18,666 | 17,005 | 18,362 | 25,888 | 30,864 | 10 | % | (40 | )% | |||||||||||||||||||
| Time deposits | 21,739 | 22,443 | 25,540 | 31,502 | 35,234 | (3 | )% | (38 | )% | |||||||||||||||||||
| Total interest-bearing core deposits | 41,957 | 42,297 | 47,458 | 63,296 | 72,074 | (1 | )% | (42 | )% | |||||||||||||||||||
| Certificates of deposit $100,000 and more | 12,680 | 15,184 | 17,361 | 31,069 | 59,851 | (16 | )% | (79 | )% | |||||||||||||||||||
| Federal funds purchased and securities | ||||||||||||||||||||||||||||
| sold under agreements to repurchase | 2,738 | 10,696 | 17,834 | 38,521 | 52,635 | (74 | )% | (95 | )% | |||||||||||||||||||
| Capital markets trading liabilities | 5,876 | 8,304 | 9,400 | 9,615 | 10,588 | (29 | )% | (45 | )% | |||||||||||||||||||
| Other short-term borrowings and commercial paper | 20,164 | 36,496 | 31,591 | 31,527 | 30,229 | (45 | )% | (33 | )% | |||||||||||||||||||
| Long term debt: | ||||||||||||||||||||||||||||
| Term borrowings | 38,062 | 41,598 | 47,129 | 66,303 | 82,870 | (9 | )% | (54 | )% | |||||||||||||||||||
| Other collateralized borrowings | 5,129 | 5,521 | 5,817 | 8,020 | 10,902 | (7 | )% | (53 | )% | |||||||||||||||||||
| Total long-term debt | 43,191 | 47,119 | 52,946 | 74,323 | 93,772 | (8 | )% | (54 | )% | |||||||||||||||||||
| Total interest-bearing liabilities/interest expense | $ | 126,606 | $ | 160,096 | $ | 176,590 | $ | 248,351 | $ | 319,149 | (21 | )% | (60 | )% | ||||||||||||||
| Net interest income-tax equivalent basis | $ | 205,369 | $ | 223,479 | $ | 239,177 | $ | 228,407 | $ | 226,128 | (8 | )% | (9 | )% | ||||||||||||||
| Fully taxable equivalent adjustment | (421 | ) | (332 | ) | (282 | ) | (315 | ) | (141 | ) | (27 | )% | (199 | )% | ||||||||||||||
| Net interest income | $ | 204,948 | $ | 223,147 | $ | 238,895 | $ | 228,092 | $ | 225,987 | (8 | )% | (9 | )% | ||||||||||||||
| NM - Not meaningful | |
| Certain previously reported amounts have been reclassified to agree with current presentation. | |
| Income amounts are adjusted to a fully taxable equivalent. Earning assets income is expressed net of unearned income. | |
| (a) | Includes loans on nonaccrual status. |
13
| CONSOLIDATED AVERAGE BALANCE SHEET: YIELDS & RATES | ||||||||||||||||||||
| Quarterly, Unaudited | ||||||||||||||||||||
| (Thousands) | 4Q08 | 3Q08 | 2Q08 | 1Q08 | 4Q07 | |||||||||||||||
| Assets: | ||||||||||||||||||||
| Earning assets: | ||||||||||||||||||||
| Loans, net of unearned income (a) | 4.78 | % | 5.16 | % | 5.29 | % | 6.07 | % | 6.98 | % | ||||||||||
| Loans held for sale | 6.04 | 5.96 | 5.70 | 5.88 | 6.54 | |||||||||||||||
| Investment securities: | ||||||||||||||||||||
| U.S. Treasuries | 1.92 | 2.08 | 2.13 | 3.15 | 4.77 | |||||||||||||||
| U.S. government agencies | 5.68 | 5.53 | 5.52 | 5.57 | 5.60 | |||||||||||||||
| States and municipalities | 5.03 | 4.70 | 4.14 | 6.87 | .82 | |||||||||||||||
| Other | 8.60 | 4.96 | 3.35 | 3.94 | 5.03 | |||||||||||||||
| Total investment securities | 5.88 | 5.41 | 5.27 | 5.41 | 5.55 | |||||||||||||||
| Capital markets securities inventory | 4.51 | 4.69 | 4.45 | 4.62 | 5.22 | |||||||||||||||
| Mortgage banking trading securities | 13.59 | 12.86 | 12.48 | 13.18 | 12.46 | |||||||||||||||
| Other earning assets: | ||||||||||||||||||||
| Federal funds sold and securities | ||||||||||||||||||||
| purchased under agreements to resell | .65 | 1.95 | 1.98 | 2.88 | 4.32 | |||||||||||||||
| Interest bearing cash | .62 | 2.54 | 2.08 | 3.11 | 6.17 | |||||||||||||||
| Total other earning assets | .64 | 1.97 | 1.98 | 2.89 | 4.36 | |||||||||||||||
| Total earning assets/interest income | 4.78 | % | 5.17 | % | 5.24 | % | 5.86 | % | 6.67 | % | ||||||||||
| Liabilities and shareholders' equity: | ||||||||||||||||||||
| Interest-bearing liabilities: | ||||||||||||||||||||
| Interest-bearing deposits: | ||||||||||||||||||||
| Other interest-bearing deposits | .38 | % | .66 | % | .74 | % | 1.19 | % | 1.33 | % | ||||||||||
| Savings | 1.57 | 1.69 | 1.76 | 2.50 | 3.19 | |||||||||||||||
| Time deposits | 3.51 | 3.69 | 4.06 | 4.55 | 4.73 | |||||||||||||||
| Total interest-bearing core deposits | 1.89 | 2.06 | 2.21 | 2.85 | 3.33 | |||||||||||||||
| Certificates of deposit $100,000 and more | 3.38 | 3.28 | 3.45 | 4.63 | 5.28 | |||||||||||||||
| Federal funds purchased and securities | ||||||||||||||||||||
| sold under agreements to repurchase | .54 | 1.64 | 1.88 | 2.95 | 4.20 | |||||||||||||||
| Capital markets trading liabilities | 4.79 | 4.66 | 4.92 | 4.57 | 5.17 | |||||||||||||||
| Other short-term borrowings and commercial paper | 1.57 | 2.39 | 2.30 | 3.29 | 4.52 | |||||||||||||||
| Long term debt: | ||||||||||||||||||||
| Term borrowings | 3.57 | 3.21 | 3.20 | 4.41 | 5.55 | |||||||||||||||
| Other collateralized borrowings | 2.74 | 2.92 | 2.94 | 4.06 | 5.36 | |||||||||||||||
| Total long-term debt | 3.45 | 3.17 | 3.17 | 4.37 | 5.52 | |||||||||||||||
| Total interest-bearing liabilities/interest expense | 2.20 | % | 2.52 | % | 2.58 | % | 3.51 | % | 4.49 | % | ||||||||||
| Net interest spread | 2.58 | % | 2.65 | % | 2.66 | % | 2.35 | % | 2.18 | % | ||||||||||
| Effect of interest-free sources used to fund | ||||||||||||||||||||
| earning assets | .38 | .36 | .35 | .46 | .59 | |||||||||||||||
| Net interest margin | 2.96 | % | 3.01 | % | 3.01 | % | 2.81 | % | 2.77 | % | ||||||||||
| Certain previously reported amounts have been reclassified to agree with current presentation. | |
| Yields are adjusted to a fully taxable equivalent. | |
| Earning assets yields are expressed net of unearned income. | |
| Rates are expressed net of unamortized debenture cost for long-term debt. | |
| Net interest margin is computed using total net interest income. | |
| (a) | Includes loans on nonaccrual status. |
14
| MORTGAGE SERVICING RIGHTS | ||||||||||||||||||||||||||||
| Quarterly, Unaudited | ||||||||||||||||||||||||||||
| 4Q08 Change vs. | ||||||||||||||||||||||||||||
| (Thousands) | 4Q08 | 3Q08 | 2Q08 | 1Q08 | 4Q07 | 3Q08 | 4Q07 | |||||||||||||||||||||
| First Liens | ||||||||||||||||||||||||||||
| Fair value beginning balance | $ | 770,635 | $ | 1,111,204 | $ | 865,855 | $ | 1,122,415 | $ | 1,429,245 | (31 | )% | (46 | )% | ||||||||||||||
| Addition of mortgage servicing rights | 1,073 | 61,501 | 100,305 | 78,871 | 67,300 | |||||||||||||||||||||||
| Reductions due to loan payments | (10,771 | ) | (22,179 | ) | (38,598 | ) | (37,448 | ) | (40,930 | ) | ||||||||||||||||||
| Reductions due to sale | (52,006 | ) | (317,640 | ) | (72,271 | ) | (43,842 | ) | (96,502 | ) | ||||||||||||||||||
| Changes in fair value due to: | ||||||||||||||||||||||||||||
| Changes in valuation model inputs | ||||||||||||||||||||||||||||
| or assumptions (a) | (354,558 | ) | (63,061 | ) | 255,890 | (254,076 | ) | (236,695 | ) | |||||||||||||||||||
| Other changes in fair value | 21 | 810 | 23 | (65 | ) | (3 | ) | |||||||||||||||||||||
| Fair value ending balance | $ | 354,394 | $ | 770,635 | $ | 1,111,204 | $ | 865,855 | $ | 1,122,415 | (54 | )% | (68 | )% | ||||||||||||||
| Second Liens | ||||||||||||||||||||||||||||
| Fair value beginning balance | $ | 17,513 | $ | 18,138 | $ | 20,126 | $ | 25,832 | $ | 28,747 | (3 | )% | (39 | )% | ||||||||||||||
| Addition of mortgage servicing rights | - | - | - | - | - | |||||||||||||||||||||||
| Reductions due to loan payments | (1,517 | ) | (614 | ) | (1,737 | ) | (2,617 | ) | (2,097 | ) | ||||||||||||||||||
| Changes in fair value due to: | ||||||||||||||||||||||||||||
| Changes in valuation model inputs | ||||||||||||||||||||||||||||
| or assumptions (a) | (2,438 | ) | (14 | ) | (254 | ) | (3,089 | ) | (834 | ) | ||||||||||||||||||
| Other changes in fair value | - | 3 | 3 | - | 16 | |||||||||||||||||||||||
| Fair value ending balance | $ | 13,558 | $ | 17,513 | $ | 18,138 | $ | 20,126 | $ | 25,832 | (23 | )% | (48 | )% | ||||||||||||||
| HELOC | ||||||||||||||||||||||||||||
| Fair value beginning balance | $ | 10,343 | $ | 10,053 | $ | 9,942 | $ | 11,573 | $ | 12,597 | 3 | % | (18 | )% | ||||||||||||||
| Addition of mortgage servicing rights | 43 | 43 | 215 | 887 | 174 | |||||||||||||||||||||||
| Reductions due to loan payments | (432 | ) | (483 | ) | (491 | ) | (707 | ) | (736 | ) | ||||||||||||||||||
| Changes in fair value due to: | ||||||||||||||||||||||||||||
| Changes in valuation model inputs | ||||||||||||||||||||||||||||
| or assumptions (a) | (1,401 | ) | - | (230 | ) | (1,935 | ) | (462 | ) | |||||||||||||||||||
| Other changes in fair value | 339 | 730 | 617 | 124 | - | |||||||||||||||||||||||
| Fair value ending balance | $ | 8,892 | $ | 10,343 | $ | 10,053 | $ | 9,942 | $ | 11,573 | (14 | )% | (23 | )% | ||||||||||||||
| Total Consolidated | ||||||||||||||||||||||||||||
| Fair value beginning balance | $ | 798,491 | $ | 1,139,395 | $ | 895,923 | $ | 1,159,820 | $ | 1,470,589 | (30 | )% | (46 | )% | ||||||||||||||
| Addition of mortgage servicing rights | 1,116 | 61,544 | 100,520 | 79,758 | 67,474 | |||||||||||||||||||||||
| Reductions due to loan payments | (12,720 | ) | (23,276 | ) | (40,826 | ) | (40,772 | ) | (43,763 | ) | ||||||||||||||||||
| Reductions due to sale | (52,006 | ) | (317,640 | ) | (72,271 | ) | (43,842 | ) | (96,502 | ) | ||||||||||||||||||
| Changes in fair value due to: | ||||||||||||||||||||||||||||
| Changes in valuation model inputs | ||||||||||||||||||||||||||||
| or assumptions (a) | (358,397 | ) | (63,075 | ) | 255,406 | (259,100 | ) | (237,991 | ) | |||||||||||||||||||
| Other changes in fair value | 360 | 1,543 | 643 | 59 | 13 | |||||||||||||||||||||||
| Fair value ending balance | $ | 376,844 | $ | 798,491 | $ | 1,139,395 | $ | 895,923 | $ | 1,159,820 | (53 | )% | (68 | )% | ||||||||||||||
| Certain previously reported amounts have been reclassified to agree with current presentation. | |
| (a) | Principally reflects changes in discount rates and prepayment speed assumptions, mostly due to changes in interest rates. |
15
| BUSINESS SEGMENT HIGHLIGHTS | ||||||||||||||||||||||||||||
| Quarterly, Unaudited | ||||||||||||||||||||||||||||
| 4Q08 Change vs. | ||||||||||||||||||||||||||||
| (Thousands) | 4Q08 | 3Q08 | 2Q08 | 1Q08 | 4Q07 | 3Q08 | 4Q07 | |||||||||||||||||||||
| Regional Banking | ||||||||||||||||||||||||||||
| Total revenues (a) | $ | 199,974 | $ | 210,298 | $ | 212,920 | $ | 207,636 | $ | 229,125 | (5 | )% | (13 | )% | ||||||||||||||
| Provision for loan losses | 105,825 | 58,201 | 89,477 | 75,264 | 15,831 | 82 | % | 568 | % | |||||||||||||||||||
| Noninterest expenses | 167,828 | 158,628 | 150,294 | 150,523 | 159,882 | 6 | % | 5 | % | |||||||||||||||||||
| Pre-tax income/(loss) | (73,679 | ) | (6,531 | ) | (26,851 | ) | (18,151 | ) | 53,412 | NM | (238 | )% | ||||||||||||||||
| Provision/(benefit) for income taxes | (27,511 | ) | (11,670 | ) | (19,838 | ) | (13,541 | ) | 27,026 | (136 | )% | (202 | )% | |||||||||||||||
| Net income/(loss) from continuing operations | (46,168 | ) | 5,139 | (7,013 | ) | (4,610 | ) | 26,386 | NM | (275 | )% | |||||||||||||||||
| Income from discontinued operations, net of tax | - | - | - | 883 | 4,137 | NM | NM | |||||||||||||||||||||
| Net income/(loss) | $ | (46,168 | ) | $ | 5,139 | $ | (7,013 | ) | $ | (3,727 | ) | $ | 30,523 | NM | (251 | )% | ||||||||||||
| National Specialty Lending | ||||||||||||||||||||||||||||
| Total revenues (a) | $ | 36,332 | $ | 49,424 | $ | 39,052 | $ | 55,040 | $ | 54,321 | (26 | )% | (33 | )% | ||||||||||||||
| Provision for loan losses | 144,049 | 240,470 | 108,000 | 149,483 | 139,398 | (40 | )% | 3 | % | |||||||||||||||||||
| Noninterest expenses | 21,873 | 23,487 | 26,675 | 25,146 | 31,067 | (7 | )% | (30 | )% | |||||||||||||||||||
| Pre-tax (loss) | (129,590 | ) | (214,533 | ) | (95,623 | ) | (119,589 | ) | (116,144 | ) | 40 | % | (12 | )% | ||||||||||||||
| Benefit for income taxes | (48,830 | ) | (79,488 | ) | (33,528 | ) | (46,359 | ) | (43,859 | ) | 39 | % | (11 | )% | ||||||||||||||
| Net (loss) | $ | (80,760 | ) | $ | (135,045 | ) | $ | (62,095 | ) | $ | (73,230 | ) | $ | (72,285 | ) | 40 | % | (12 | )% | |||||||||
| Mortgage Banking | ||||||||||||||||||||||||||||
| Total revenues (a) | $ | 96,967 | $ | 138,337 | $ | 222,297 | $ | 198,066 | $ | (79,826 | ) | (30 | )% | 221 | % | |||||||||||||
| Provision for loan losses | 22,018 | 2,878 | 4,001 | 222 | 46 | NM | NM | |||||||||||||||||||||
| Noninterest expenses | 39,503 | 89,040 | 149,062 | 147,543 | 174,203 | (56 | )% | (77 | )% | |||||||||||||||||||
| Pre-tax income/(loss) | 35,446 | 46,419 | 69,234 | 50,301 | (254,075 | ) | (24 | )% | 114 | % | ||||||||||||||||||
| Provision/(benefit) for income taxes | 12,941 | 16,645 | 22,960 | 18,129 | (99,185 | ) | (22 | )% | 113 | % | ||||||||||||||||||
| Net income/(loss) | $ | 22,505 | $ | 29,774 | $ | 46,274 | $ | 32,172 | $ | (154,890 | ) | (24 | )% | 115 | % | |||||||||||||
| Capital Markets | ||||||||||||||||||||||||||||
| Total revenues (a) | $ | 197,471 | $ | 117,527 | $ | 143,150 | $ | 153,579 | $ | 119,191 | 68 | % | 66 | % | ||||||||||||||
| Provision for loan losses | 8,108 | 38,451 | 18,522 | 15,031 | 1,244 | (79 | )% | 552 | % | |||||||||||||||||||
| Noninterest expenses | 114,955 | 87,674 | 100,559 | 115,728 | 87,042 | 31 | % | 32 | % | |||||||||||||||||||
| Pre-tax income/(loss) | 74,408 | (8,598 | ) | 24,069 | 22,820 | 30,905 | NM | 141 | % | |||||||||||||||||||
| Provision/(benefit) for income taxes | 27,910 | (3,375 | ) | 8,960 | 8,437 | 11,572 | NM | 141 | % | |||||||||||||||||||
| Net income/(loss) | $ | 46,498 | $ | (5,223 | ) | $ | 15,109 | $ | 14,383 | $ | 19,333 | NM | 141 | % | ||||||||||||||
| Corporate | ||||||||||||||||||||||||||||
| Total revenues (a) | $ | 12,222 | $ | 12,734 | $ | 20,522 | $ | 62,847 | $ | (3,837 | ) | (4 | )% | 419 | % | |||||||||||||
| Provision for loan losses | - | - | - | - | - | NM | NM | |||||||||||||||||||||
| Noninterest expenses | 5,499 | 43,445 | 39,253 | (663 | ) | 109,365 | (87 | )% | (95 | )% | ||||||||||||||||||
| Pre-tax income/(loss) | 6,723 | (30,711 | ) | (18,731 | ) | 63,510 | (113,202 | ) | 122 | % | 106 | % | ||||||||||||||||
| Provision/(benefit) for income taxes | 4,502 | (10,970 | ) | (7,375 | ) | 25,188 | (41,896 | ) | 141 | % | 111 | % | ||||||||||||||||
| Net income/(loss) | $ | 2,221 | $ | (19,741 | ) | $ | (11,356 | ) | $ | 38,322 | $ | (71,306 | ) | 111 | % | 103 | % | |||||||||||
| Total Consolidated | ||||||||||||||||||||||||||||
| Total revenues (a) | $ | 542,966 | $ | 528,320 | $ | 637,941 | $ | 677,168 | $ | 318,974 | 3 | % | 70 | % | ||||||||||||||
| Provision for loan losses | 280,000 | 340,000 | 220,000 | 240,000 | 156,519 | (18 | )% | 79 | % | |||||||||||||||||||
| Noninterest expenses | 349,658 | 402,274 | 465,843 | 438,277 | 561,559 | (13 | )% | (38 | )% | |||||||||||||||||||
| Pre-tax income/(loss) | (86,692 | ) | (213,954 | ) | (47,902 | ) | (1,109 | ) | (399,104 | ) | 59 | % | 78 | % | ||||||||||||||
| Benefit for income taxes | (30,988 | ) | (88,859 | ) | (28,821 | ) | (8,146 | ) | (146,342 | ) | 65 | % | 79 | % | ||||||||||||||
| Net income/(loss) from continuing operations | (55,704 | ) | (125,095 | ) | (19,081 | ) | 7,037 | (252,762 | ) | 55 | % | 78 | % | |||||||||||||||
| Income from discontinued operations, net of tax | - | - | - | 883 | 4,137 | NM | NM | |||||||||||||||||||||
| Net income/(loss) | $ | (55,704 | ) | $ | (125,095 | ) | $ | (19,081 | ) | $ | 7,920 | $ | (248,625 | ) | 55 | % | 78 | % | ||||||||||
| NM - Not meaningful | |
| Certain previously reported amounts have been reclassified to agree with current presentation. | |
| (a) | Includes noninterest income and net interest income/(expense). |
16
| REGIONAL BANKING | ||||||||||||||||||||||||||||
| Quarterly, Unaudited | ||||||||||||||||||||||||||||
| 4Q08 Change vs. | ||||||||||||||||||||||||||||
| (Thousands) | 4Q08 | 3Q08 | 2Q08 | 1Q08 | 4Q07 | 3Q08 | 4Q07 | |||||||||||||||||||||
| Income Statement | ||||||||||||||||||||||||||||
| Net interest income | $ | 117,356 | $ | 122,379 | $ | 120,384 | $ | 120,565 | $ | 133,613 | (4 | )% | (12 | )% | ||||||||||||||
| Noninterest income | 82,618 | 87,919 | 92,536 | 87,071 | 95,511 | (6 | )% | (13 | )% | |||||||||||||||||||
| Securities gains/(losses), net | - | - | - | - | 1 | NM | NM | |||||||||||||||||||||
| Total revenue | 199,974 | 210,298 | 212,920 | 207,636 | 229,125 | (5 | )% | (13 | )% | |||||||||||||||||||
| Total noninterest expense | 167,828 | 158,628 | 150,294 | 150,523 | 159,882 | 6 | % | 5 | % | |||||||||||||||||||
| Provision | 105,825 | 58,201 | 89,477 | 75,264 | 15,831 | 82 | % | 568 | % | |||||||||||||||||||
| Pretax income/(loss) | $ | (73,679 | ) | $ | (6,531 | ) | $ | (26,851 | ) | $ | (18,151 | ) | $ | 53,412 | NM | NM | ||||||||||||
| Efficiency ratio | 83.92 | % | 75.43 | % | 70.59 | % | 72.49 | % | 69.78 | % | ||||||||||||||||||
| Balance Sheet (millions) | ||||||||||||||||||||||||||||
| Average loans | $ | 10,898 | $ | 10,915 | $ | 10,801 | $ | 10,705 | $ | 10,667 | * | 2 | % | |||||||||||||||
| Other earning assets | 163 | 65 | 242 | 339 | 525 | 151 | % | (69 | )% | |||||||||||||||||||
| Total earning assets | 11,061 | 10,980 | 11,043 | 11,044 | 11,192 | 1 | % | (1 | )% | |||||||||||||||||||
| Core deposits | 9,753 | 9,564 | 9,970 | 10,059 | 9,854 | 2 | % | (1 | )% | |||||||||||||||||||
| Other deposits | 978 | 976 | 1,053 | 1,160 | 1,369 | * | (29 | )% | ||||||||||||||||||||
| Deposits - divestiture | - | - | 37 | 153 | 378 | NM | (100 | )% | ||||||||||||||||||||
| Total deposits | 10,731 | 10,540 | 11,060 | 11,372 | 11,601 | 2 | % | (7 | )% | |||||||||||||||||||
| Total period end deposits | 10,993 | 10,621 | 11,035 | 11,370 | 11,679 | 4 | % | (6 | )% | |||||||||||||||||||
| Total period end assets | $ | 11,999 | $ | 12,301 | $ | 12,234 | $ | 12,172 | $ | 12,674 | (2 | )% | (5 | )% | ||||||||||||||
| Net interest margin | 4.22 | % | 4.43 | % | 4.38 | % | 4.39 | % | 4.74 | % | ||||||||||||||||||
| Noninterest Income Detail | ||||||||||||||||||||||||||||
| Deposit transactions & cash mgmt | $ | 42,388 | $ | 44,470 | $ | 45,404 | $ | 41,230 | $ | 46,648 | (5 | )% | (9 | )% | ||||||||||||||
| Insurance commissions | 7,027 | 7,160 | 7,033 | 7,854 | 7,485 | (2 | )% | (6 | )% | |||||||||||||||||||
| Trust services & investment mgmt | 7,697 | 8,192 | 8,915 | 9,147 | 10,137 | (6 | )% | (24 | )% | |||||||||||||||||||
| Bankcard Income | 4,416 | 4,706 | 4,752 | 4,491 | 5,035 | (6 | )% | (12 | )% | |||||||||||||||||||
| Other service charges | 3,500 | 3,556 | 3,780 | 4,037 | 4,152 | (2 | )% | (16 | )% | |||||||||||||||||||
| Miscellaneous revenue | 17,590 | 19,835 | 22,652 | 20,312 | 22,054 | (11 | )% | (20 | )% | |||||||||||||||||||
| Total noninterest income | $ | 82,618 | $ | 87,919 | $ | 92,536 | $ | 87,071 | $ | 95,511 | (6 | )% | (13 | )% | ||||||||||||||
| Key Statistics | ||||||||||||||||||||||||||||
| Locations | ||||||||||||||||||||||||||||
| Financial Centers | 202 | 200 | 198 | 206 | 216 | 1 | % | (6 | )% | |||||||||||||||||||
| First Tennessee | 202 | 200 | 198 | 197 | 197 | 1 | % | 3 | % | |||||||||||||||||||
| First Horizon Bank | - | - | - | 9 | 19 | NM | (100 | )% | ||||||||||||||||||||
| Trust Assets | ||||||||||||||||||||||||||||
| Total assets (millions) | $ | 9,606 | $ | 11,015 | $ | 11,291 | $ | 11,681 | $ | 12,300 | (13 | )% | (22 | )% | ||||||||||||||
| Total managed assets (millions) | 4,664 | 5,089 | 5,373 | 5,641 | 5,880 | (8 | )% | (21 | )% | |||||||||||||||||||
| NM - Not meaningful |
| * Amount is less than one percent. |
| Certain previously reported amounts have been reclassified to agree with current presentation. |
17
| CAPITAL MARKETS | ||||||||||||||||||||||||||||
| Quarterly, Unaudited | ||||||||||||||||||||||||||||
| 4Q08 Change vs. | ||||||||||||||||||||||||||||
| (Thousands) | 4Q08 | 3Q08 | 2Q08 | 1Q08 | 4Q07 | 3Q08 | 4Q07 | |||||||||||||||||||||
| Income Statement | ||||||||||||||||||||||||||||
| Net interest income | ||||||||||||||||||||||||||||
| Correspondent Banking | $ | 12,337 | $ | 11,841 | $ | 12,399 | $ | 12,808 | $ | 11,437 | 4 | % | 8 | % | ||||||||||||||
| Capital Markets | 7,829 | 7,151 | 6,094 | 6,841 | 4,389 | 9 | % | 78 | % | |||||||||||||||||||
| Total net interest income | 20,166 | 18,992 | 18,493 | 19,649 | 15,826 | 6 | % | 27 | % | |||||||||||||||||||
| Noninterest income: | ||||||||||||||||||||||||||||
| Fixed income | 156,522 | 80,104 | 105,002 | 152,208 | 77,126 | 95 | % | 103 | % | |||||||||||||||||||
| Other | 20,783 | 18,431 | 19,655 | (18,278 | ) | 26,239 | 13 | % | (21 | )% | ||||||||||||||||||
| Total noninterest income | 177,305 | 98,535 | 124,657 | 133,930 | 103,365 | 80 | % | 72 | % | |||||||||||||||||||
| Total revenue | 197,471 | 117,527 | 143,150 | 153,579 | 119,191 | 68 | % | 66 | % | |||||||||||||||||||
| Noninterest expense | 114,955 | 87,674 | 100,559 | 115,728 | 87,042 | 31 | % | 32 | % | |||||||||||||||||||
| Provision | 8,108 | 38,451 | 18,522 | 15,031 | 1,244 | (79 | )% | 552 | % | |||||||||||||||||||
| Pretax income/(loss) | $ | 74,408 | $ | (8,598 | ) | $ | 24,069 | $ | 22,820 | $ | 30,905 | NM | 141 | % | ||||||||||||||
| Efficiency ratio | 58.21 | % | 74.60 | % | 70.25 | % | 75.35 | % | 73.03 | % | ||||||||||||||||||
| Balance Sheet (millions) | ||||||||||||||||||||||||||||
| Trading inventory | $ | 1,135 | $ | 1,356 | $ | 1,631 | $ | 1,962 | $ | 1,934 | (16 | )% | (41 | )% | ||||||||||||||
| Average Loans (a) | 1,719 | 1,759 | 1,491 | 1,465 | 1,402 | (2 | )% | 23 | % | |||||||||||||||||||
| Other earning assets | 981 | 1,275 | 1,656 | 1,728 | 1,708 | (23 | )% | (43 | )% | |||||||||||||||||||
| Total earning assets | 3,835 | 4,390 | 4,778 | 5,155 | 5,044 | (13 | )% | (24 | )% | |||||||||||||||||||
| Total period end assets | $ | 5,055 | $ | 5,968 | $ | 5,602 | $ | 6,154 | $ | 5,265 | (15 | )% | (4 | )% | ||||||||||||||
| Net interest margin: | ||||||||||||||||||||||||||||
| Correspondent Banking | 3.46 | % | 2.97 | % | 3.06 | % | 3.28 | % | 3.01 | % | ||||||||||||||||||
| Capital Markets | 1.29 | % | 1.01 | % | .78 | % | .77 | % | .49 | % | ||||||||||||||||||
| Total Capital Markets | 2.09 | % | 1.72 | % | 1.56 | % | 1.53 | % | 1.24 | % | ||||||||||||||||||
| NM - Not meaningful |
| * Amount is less than one percent. |
| Certain previously reported amounts have been reclassified to agree with current presentation. |
| (a) Includes trust preferred warehouse loans moved from loans held for sale to loans held to maturity in 2Q08. |
18
| NATIONAL SPECIALTY LENDING | ||||||||||||||||||||||||||||
| Quarterly, Unaudited | ||||||||||||||||||||||||||||
| 4Q08 Change vs. | ||||||||||||||||||||||||||||
| (Thousands) | 4Q08 | 3Q08 | 2Q08 | 1Q08 | 4Q07 | 3Q08 | 4Q07 | |||||||||||||||||||||
| Income Statement | ||||||||||||||||||||||||||||
| Net interest income | $ | 36,841 | $ | 45,243 | $ | 53,555 | $ | 54,389 | $ | 58,698 | (19 | )% | (37 | )% | ||||||||||||||
| Noninterest income | (509 | ) | 4,181 | (14,503 | ) | 651 | (4,377 | ) | (112 | )% | 88 | % | ||||||||||||||||
| Total revenue | 36,332 | 49,424 | 39,052 | 55,040 | 54,321 | (26 | )% | (33 | )% | |||||||||||||||||||
| Total noninterest expense | 21,873 | 23,487 | 26,675 | 25,146 | 31,067 | (7 | )% | (30 | )% | |||||||||||||||||||
| Provision | 144,049 | 240,470 | 108,000 | 149,483 | 139,398 | (40 | )% | 3 | % | |||||||||||||||||||
| Pretax (loss) | $ | (129,590 | ) | $ | (214,533 | ) | $ | (95,623 | ) | $ | (119,589 | ) | $ | (116,144 | ) | 40 | % | (12 | )% | |||||||||
| Efficiency ratio | 60.20 | % | 47.52 | % | 68.31 | % | 45.69 | % | 57.19 | % | ||||||||||||||||||
| Balance Sheet (millions) | ||||||||||||||||||||||||||||
| Average loans | $ | 7,922 | $ | 8,415 | $ | 8,966 | $ | 9,393 | $ | 9,450 | (6 | )% | (16 | )% | ||||||||||||||
| Other earning assets | 9 | 8 | 17 | 21 | 175 | 13 | % | (95 | )% | |||||||||||||||||||
| Total earning assets | 7,931 | 8,423 | 8,983 | 9,414 | 9,625 | (6 | )% | (18 | )% | |||||||||||||||||||
| Total deposits | 140 | 181 | 240 | 291 | 353 | (23 | )% | (60 | )% | |||||||||||||||||||
| Total period end deposits | 126 | 156 | 208 | 260 | 317 | (19 | )% | (60 | )% | |||||||||||||||||||
| Net interest margin | 1.85 | % | 2.14 | % | 2.40 | % | 2.32 | % | 2.42 | % | ||||||||||||||||||
| NM - Not meaningful |
| * Amount is less than one percent. |
| Certain previously reported amounts have been reclassified to agree with current presentation. |
19
| MORTGAGE BANKING | ||||||||||||||||||||||||||||
| Quarterly, Unaudited | ||||||||||||||||||||||||||||
| 4Q08 Change vs. | ||||||||||||||||||||||||||||
| (Thousands) | 4Q08 | 3Q08 | 2Q08 | 1Q08 | 4Q07 | 3Q08 | 4Q07 | |||||||||||||||||||||
| Income Statement | ||||||||||||||||||||||||||||
| Net interest income | $ | 10,937 | $ | 22,517 | $ | 31,835 | $ | 30,052 | $ | 22,852 | NM | NM | ||||||||||||||||
| Noninterest income | ||||||||||||||||||||||||||||
| Net origination fees (a) | (14,383 | ) | 19,828 | 134,095 | 84,056 | 5,008 | NM | NM | ||||||||||||||||||||
| Net servicing fees | 99,402 | 80,603 | 42,614 | 69,344 | (118,107 | ) | NM | NM | ||||||||||||||||||||
| Other fees | 1,011 | 15,389 | 13,753 | 14,614 | 10,421 | NM | NM | |||||||||||||||||||||
| Total noninterest income | 86,030 | 115,820 | 190,462 | 168,014 | (102,678 | ) | NM | NM | ||||||||||||||||||||
| Total revenue | 96,967 | 138,337 | 222,297 | 198,066 | (79,826 | ) | NM | NM | ||||||||||||||||||||
| Noninterest expense (b) | 39,503 | 89,040 | 149,062 | 147,543 | 174,203 | NM | NM | |||||||||||||||||||||
| Provision | 22,018 | 2,878 | 4,001 | 222 | 46 | NM | NM | |||||||||||||||||||||
| Pretax income/(loss) | $ | 35,446 | $ | 46,419 | $ | 69,234 | $ | 50,301 | $ | (254,075 | ) | NM | NM | |||||||||||||||
| Efficiency ratio | 40.74 | % | 64.36 | % | 67.06 | % | 74.49 | % | (218.23 | )% | ||||||||||||||||||
| Average Balance Sheet (millions) | ||||||||||||||||||||||||||||
| Warehouse | $ | 489 | $ | 1,810 | $ | 3,182 | $ | 3,230 | $ | 2,672 | NM | NM | ||||||||||||||||
| Trading securities | 235 | 359 | 372 | 387 | 511 | NM | NM | |||||||||||||||||||||
| Mortgage servicing rights | 633 | 1,003 | 974 | 1,020 | 1,354 | NM | NM | |||||||||||||||||||||
| Permanent Mortgages & other assets | 1,424 | 1,711 | 1,692 | 1,473 | 1,348 | NM | NM | |||||||||||||||||||||
| Total assets | 2,781 | 4,883 | 6,220 | 6,110 | 5,885 | NM | NM | |||||||||||||||||||||
| Escrow balances | 725 | 989 | 1,516 | 1,691 | 1,709 | NM | NM | |||||||||||||||||||||
| Net interest margin | 2.84 | % | 3.05 | % | 3.16 | % | 2.98 | % | 2.48 | % | ||||||||||||||||||
| Warehouse Spread | NM | 3.83 | % | 3.14 | % | 2.63 | % | 1.54 | % | |||||||||||||||||||
| Noninterest Expense Detail | ||||||||||||||||||||||||||||
| Commissions & incentives (a) | $ | 130 | $ | 18,415 | $ | 41,369 | $ | 45,956 | $ | 39,359 | ||||||||||||||||||
| FAS 91 cost deferral (a) | 492 | 1,097 | 1,789 | 764 | (3,878 | ) | ||||||||||||||||||||||
| Other salaries & benefits | (2,090 | ) | 22,011 | 39,228 | 35,700 | 38,727 | ||||||||||||||||||||||
| Total salaries & benefits | (1,468 | ) | 41,523 | 82,386 | 82,420 | 74,208 | NM | NM | ||||||||||||||||||||
| Contract labor & outsourcing | 7,381 | 5,207 | 3,654 | 2,781 | 1,968 | |||||||||||||||||||||||
| Equipment & occupancy | 3,448 | 8,882 | 13,513 | 14,895 | 14,814 | |||||||||||||||||||||||
| Foreclosure provision | 2,752 | 849 | 5,535 | 2,395 | 4,872 | |||||||||||||||||||||||
| Other expenses (a) | 25,674 | 32,636 | 43,536 | 45,115 | 120,155 | |||||||||||||||||||||||
| Total expenses before FAS 91 reclass | 37,787 | 89,097 | 148,624 | 147,606 | 216,017 | NM | NM | |||||||||||||||||||||
| FAS 91 reclassification (a)(c) | (517 | ) | (3,064 | ) | (4,520 | ) | (3,962 | ) | (46,133 | ) | ||||||||||||||||||
| Total noninterest expense before | ||||||||||||||||||||||||||||
| segment allocations | 37,270 | 86,033 | 144,104 | 143,644 | 169,884 | |||||||||||||||||||||||
| Segment allocations | 2,233 | 3,007 | 4,958 | 3,899 | 4,319 | |||||||||||||||||||||||
| Total noninterest expense | $ | 39,503 | $ | 89,040 | $ | 149,062 | $ | 147,543 | $ | 174,203 | NM | NM | ||||||||||||||||
| Origination Income | ||||||||||||||||||||||||||||
| Origination fees | $ | (55 | ) | $ | 22,995 | $ | 48,555 | $ | 54,636 | $ | 47,789 | |||||||||||||||||
| FAS 91 fee deferral (a) | 496 | 937 | 1,381 | - | (4,818 | ) | ||||||||||||||||||||||
| Appraisal, final inspection, | ||||||||||||||||||||||||||||
| credit report fees | 45 | 2,824 | 5,537 | 5,953 | 5,387 | |||||||||||||||||||||||
| Total origination fees | $ | 486 | $ | 26,756 | $ | 55,473 | $ | 60,589 | $ | 48,358 | NM | NM | ||||||||||||||||
| Total Origination Income | $ | (14,383 | ) | $ | 19,828 | $ | 134,095 | $ | 84,056 | $ | 5,008 | NM | NM | |||||||||||||||
| Warehouse/Pipeline (millions) | ||||||||||||||||||||||||||||
| Ending Warehouse Balance | $ | 408 | $ | 541 | $ | 2,433 | $ | 3,130 | $ | 2,971 | NM | NM | ||||||||||||||||
| Production (millions) | ||||||||||||||||||||||||||||
| First lien production | $ | 88 | $ | 3,107 | $ | 6,826 | $ | 7,510 | $ | 6,308 | NM | NM | ||||||||||||||||
| NM - Not meaningful due to Mortgage sale in 3Q08 | |
| * Amount is less than one percent. | |
| Certain previously reported amounts have been reclassified to agree with current presentation. | |
| (a) | 3Q08, 2Q08, and 1Q08 include effect of adopting accounting standards, including fair value election for warehouse loans. |
| (b) | 4Q07 includes $71.1 million of goodwill impairment. |
| (c) | See Glossary of Terms. |
20
| MORTGAGE BANKING: SERVICING | ||||||||||||||||||||||||||||
| Quarterly, Unaudited | ||||||||||||||||||||||||||||
| 4Q08 Change vs. | ||||||||||||||||||||||||||||
| (Thousands) | 4Q08 | 3Q08 | 2Q08 | 1Q08 | 4Q07 | 3Q08 | 4Q07 | |||||||||||||||||||||
| Servicing Income | ||||||||||||||||||||||||||||
| Gross Service Fees | $ | 47,810 | $ | 57,326 | $ | 74,941 | $ | 88,891 | $ | 90,153 | ||||||||||||||||||
| Guarantee Fees | (7,626 | ) | (11,073 | ) | (16,762 | ) | (18,791 | ) | (19,775 | ) | ||||||||||||||||||
| Sub-Service Fee Income | 103 | 394 | 504 | 243 | 244 | |||||||||||||||||||||||
| Lender Paid MI | 5 | (1,029 | ) | (3 | ) | (4 | ) | (21 | ) | |||||||||||||||||||
| Net Service Fees | 40,292 | 45,618 | 58,680 | 70,339 | 70,601 | (12 | )% | (43 | )% | |||||||||||||||||||
| Early Payoff Interest Expense | (1,562 | ) | (1,733 | ) | (4,477 | ) | (5,446 | ) | (3,626 | ) | ||||||||||||||||||
| Ancillary Fees | 5,949 | 5,994 | 8,991 | 9,214 | 9,192 | |||||||||||||||||||||||
| Total Service Fees | 44,679 | 49,879 | 63,194 | 74,107 | 76,167 | (10 | )% | (41 | )% | |||||||||||||||||||
| Change in MSR Value - Runoff | (9,899 | ) | (20,091 | ) | (37,079 | ) | (37,449 | ) | (40,930 | ) | 51 | % | 76 | % | ||||||||||||||
| Net hedging results: | ||||||||||||||||||||||||||||
| Change in MSR Value - Other than Runoff (a) | (327,310 | ) | (39,180 | ) | 237,816 | (255,485 | ) | (234,998 | ) | |||||||||||||||||||
| MSR Hedge Gains/(Losses) | 502,268 | 91,804 | (219,454 | ) | 280,935 | 119,651 | ||||||||||||||||||||||
| Change in Trading Asset Value (a) | (99,354 | ) | (11,198 | ) | 83,543 | (74,136 | ) | (73,496 | ) | |||||||||||||||||||
| Trading Asset Hedge Gains/(Losses) | (8,172 | ) | 21,505 | (78,832 | ) | 86,322 | 59,022 | |||||||||||||||||||||
| Option Expense on Servicing Hedges | (2,811 | ) | (12,116 | ) | (6,574 | ) | (4,950 | ) | (23,523 | ) | ||||||||||||||||||
| Total net hedging results | 64,621 | 50,815 | 16,499 | 32,686 | (153,344 | ) | 27 | % | 142 | % | ||||||||||||||||||
| Total Servicing Income | $ | 99,401 | $ | 80,603 | $ | 42,614 | $ | 69,344 | $ | (118,107 | ) | 23 | % | 184 | % | |||||||||||||
| Key Servicing Metrics (millions) | �� | |||||||||||||||||||||||||||
| Beginning Servicing Portfolio | $ | 65,346 | $ | 98,385 | $ | 99,022 | $ | 103,709 | $ | 108,401 | ||||||||||||||||||
| Additions to portfolio | (83 | ) | 3,107 | 6,991 | 7,650 | 6,399 | ||||||||||||||||||||||
| Prepayments | (1,146 | ) | (1,350 | ) | (2,811 | ) | (4,144 | ) | (2,931 | ) | ||||||||||||||||||
| Amortization | (420 | ) | (550 | ) | (672 | ) | (675 | ) | (725 | ) | ||||||||||||||||||
| Service Release Sales | (31 | ) | (117 | ) | (76 | ) | (69 | ) | (166 | ) | ||||||||||||||||||
| Bulk Sale | (5 | ) | (34,129 | ) | (4,069 | ) | (7,449 | ) | (7,269 | ) | ||||||||||||||||||
| Ending Servicing Portfolio (Owned) | $ | 63,661 | $ | 65,346 | $ | 98,385 | $ | 99,022 | $ | 103,709 | (3 | )% | (39 | )% | ||||||||||||||
| Avg. Servicing Portfolio (Owned) | $ | 64,550 | $ | 81,130 | $ | 95,124 | $ | 103,794 | $ | 107,259 | (20 | )% | (40 | )% | ||||||||||||||
| Average Loans Serviced (#) | 351,157 | 450,651 | 547,828 | 618,505 | 632,482 | (22 | )% | (44 | )% | |||||||||||||||||||
| Portfolio Product Mix (Average) | ||||||||||||||||||||||||||||
| GNMA | 4 | % | 5 | % | 10 | % | 8 | % | 8 | % | ||||||||||||||||||
| FNMA/FHLMC | 58 | % | 64 | % | 63 | % | 64 | % | 65 | % | ||||||||||||||||||
| Private | 37 | % | 30 | % | 24 | % | 25 | % | 24 | % | ||||||||||||||||||
| Sub-Total | 99 | % | 99 | % | 97 | % | 97 | % | 97 | % | ||||||||||||||||||
| Warehouse | 1 | % | 1 | % | 3 | % | 3 | % | 3 | % | ||||||||||||||||||
| Total | 100 | % | 100 | % | 100 | % | 100 | % | 100 | % | ||||||||||||||||||
| Other Portfolio Statistics | ||||||||||||||||||||||||||||
| Net Service Fees - Annualized (bps) | 25 | 22 | 25 | 27 | 26 | |||||||||||||||||||||||
| Total Service Fees - Annualized (bps) | 28 | 25 | 27 | 29 | 28 | |||||||||||||||||||||||
| Ancillary Income per Loan (Annualized) | $ | 67.77 | $ | 53.20 | $ | 65.65 | $ | 59.59 | $ | 58.13 | 27 | % | 17 | % | ||||||||||||||
| Servicing Cost per Loan (Annualized) | $ | 79.80 | $ | 62.45 | $ | 61.22 | $ | 56.39 | $ | 50.56 | 28 | % | 58 | % | ||||||||||||||
| Average Servicing Asset (millions) (b) | 632 | 1,002 | 973 | 1,019 | 1,353 | |||||||||||||||||||||||
| Servicing Book Value (bps) | 98 | 124 | 102 | 98 | 126 | |||||||||||||||||||||||
| 90+ Delinquency Rate, excluding foreclosures | 3.47 | % | 2.58 | % | 2.08 | % | 1.73 | % | 1.48 | % | ||||||||||||||||||
| Change in MSR Asset / | ||||||||||||||||||||||||||||
| Average Servicing Asset | (105 | )% | (13 | )% | 8 | % | 5 | % | 46 | % | ||||||||||||||||||
| Run-Off Rate - Annualized | 10 | % | 10 | % | 14 | % | 18 | % | 14 | % | ||||||||||||||||||
| NM - Not meaningful | |
| * Amount is less than one percent. | |
| Certain previously reported amounts have been reclassified to agree with current presentation. | |
| (a) | 4Q07 includes a portion of the $135 million valuation adjustment. |
| (b) | Includes valuation reserve/MSRs only. |
21
| CORPORATE | ||||||||||||||||||||||||||||
| Quarterly, Unaudited | ||||||||||||||||||||||||||||
| 4Q08 Change vs. | ||||||||||||||||||||||||||||
| (Thousands) | 4Q08 | 3Q08 | 2Q08 | 1Q08 | 4Q07 | 3Q08 | 4Q07 | |||||||||||||||||||||
| Income Statement | ||||||||||||||||||||||||||||
| Net interest income/(expense) | $ | 20,202 | $ | 14,382 | $ | 14,771 | $ | 3,558 | $ | (4,795 | ) | 40 | % | 521 | % | |||||||||||||
| Net interest expense from | ||||||||||||||||||||||||||||
| deferred compensation | (554 | ) | (366 | ) | (143 | ) | (121 | ) | (207 | ) | (51 | )% | (168 | )% | ||||||||||||||
| Total net interest income/(expense) | 19,648 | 14,016 | 14,628 | 3,437 | (5,002 | ) | 40 | % | 493 | % | ||||||||||||||||||
| Noninterest income | 3,759 | 4,073 | 5,541 | 14 | 13,275 | (8 | )% | (72 | )% | |||||||||||||||||||
| Noninterest income from | ||||||||||||||||||||||||||||
| deferred compensation | (12,531 | ) | (5,145 | ) | 1,325 | (6,550 | ) | (1,667 | ) | (144 | )% | (652 | )% | |||||||||||||||
| Total noninterest income | (8,772 | ) | (1,072 | ) | 6,866 | (6,536 | ) | 11,608 | (718 | )% | (176 | )% | ||||||||||||||||
| Securities gains/(losses), net | 1,346 | (210 | ) | (972 | ) | 65,946 | (10,443 | ) | NM | NM | ||||||||||||||||||
| Total revenue | 12,222 | 12,734 | 20,522 | 62,847 | (3,837 | ) | (4 | )% | 419 | % | ||||||||||||||||||
| Noninterest expense | 20,102 | 50,900 | 37,433 | 7,414 | 110,753 | (61 | )% | (82 | )% | |||||||||||||||||||
| Deferred compensation expense | (14,603 | ) | (7,455 | ) | 1,820 | (8,077 | ) | (1,388 | ) | (96 | )% | (952 | )% | |||||||||||||||
| Total noninterest expense | 5,499 | 43,445 | 39,253 | (663 | ) | 109,365 | (87 | )% | (95 | )% | ||||||||||||||||||
| Pretax income/(loss) | $ | 6,723 | $ | (30,711 | ) | $ | (18,731 | ) | $ | 63,510 | $ | (113,202 | ) | 122 | % | 106 | % | |||||||||||
| Average Balance Sheet (millions) | ||||||||||||||||||||||||||||
| Total earning assets | 3,329 | 2,835 | 2,974 | 3,001 | 2,986 | 17 | % | 11 | % | |||||||||||||||||||
| Net interest margin | 2.35 | % | 1.97 | % | 1.98 | % | .46 | % | (.66 | )% | ||||||||||||||||||
| NM - Not meaningful |
| * Amount is less than one percent. |
| Certain previously reported amounts have been reclassified to agree with current presentation. |
22
| CAPITAL HIGHLIGHTS | ||||||||||||||||||||||||||||
| Quarterly, Unaudited | ||||||||||||||||||||||||||||
| 4Q08 Change vs. | ||||||||||||||||||||||||||||
| (Dollars in millions, except per share amounts) | 4Q08 | 3Q08 | 2Q08 | 1Q08 | 4Q07 | 3Q08 | 4Q07 | |||||||||||||||||||||
| Tier 1 Capital (a) | $ | 3,767.4 | $ | 2,934.0 | $ | 3,034.7 | $ | 2,443.9 | $ | 2,459.5 | 28 | % | 53 | % | ||||||||||||||
| Tier 2 Capital (a) | 1,300.2 | 1,313.7 | 1,341.7 | 1,421.0 | 1,400.5 | (1 | )% | (7 | )% | |||||||||||||||||||
| Total Capital (a) | $ | 5,067.6 | $ | 4,247.7 | $ | 4,376.4 | $ | 3,864.9 | $ | 3,860.0 | 19 | % | 31 | % | ||||||||||||||
| Risk-Adjusted Assets (a) | $ | 25,247.8 | $ | 26,427.2 | $ | 28,884.7 | $ | 29,709.3 | $ | 30,271.9 | (4 | )% | (17 | )% | ||||||||||||||
| Tier 1 Ratio (a) | 14.92 | % | 11.10 | % | 10.51 | % | 8.23 | % | 8.12 | % | ||||||||||||||||||
| Tier 2 Ratio (a) | 5.15 | 4.97 | 4.64 | 4.78 | 4.63 | |||||||||||||||||||||||
| Total Capital Ratio (a) | 20.07 | % | 16.07 | % | 15.15 | % | 13.01 | % | 12.75 | % | ||||||||||||||||||
| Leverage Ratio (a) | 12.12 | % | 8.84 | % | 8.45 | % | 6.62 | % | 6.64 | % | ||||||||||||||||||
| Shareholders' Equity/Assets Ratio (b) | 10.57 | 7.86 | 7.59 | 5.67 | 5.77 | |||||||||||||||||||||||
| Tangible Common Equity/RWA (a) | 8.78 | 8.78 | 8.45 | 6.17 | 6.16 | |||||||||||||||||||||||
| Tangible Common Equity/Tangible Assets | 7.34 | 7.18 | 6.96 | 5.04 | 5.13 | |||||||||||||||||||||||
| Tangible Book Value (c) | $ | 10.98 | $ | 11.36 | $ | 11.92 | $ | 13.98 | $ | 14.16 | ||||||||||||||||||
| Book Value (c) | 12.13 | 12.52 | 13.09 | 15.81 | 16.03 | |||||||||||||||||||||||
| NM - Not meaningful |
| * Amount is less than one percent. |
| Certain previously reported amounts have been reclassified to agree with current presentation. |
| (a) Current quarter is an estimate. |
| (b) Calculated on period-end balances. |
| (c) Shares restated for October 1, 2008 and January 1, 2009 stock dividends. |
23
| ASSET QUALITY: CONSOLIDATED | ||||||||||||||||||||||||||||
| Quarterly, Unaudited | ||||||||||||||||||||||||||||
| 4Q08 Change vs. | ||||||||||||||||||||||||||||
| (Thousands) | 4Q08 | 3Q08 | 2Q08 | 1Q08 | 4Q07 | 3Q08 | 4Q07 | |||||||||||||||||||||
| Allowance for Loan Losses Walk-Forward | ||||||||||||||||||||||||||||
| Beginning Reserve | $ | 760,456 | $ | 575,149 | $ | 483,203 | $ | 342,341 | $ | 236,611 | 32 | % | 221 | % | ||||||||||||||
| Provision | 280,000 | 340,000 | 220,000 | 240,000 | 156,519 | (18 | )% | 79 | % | |||||||||||||||||||
| Divestitures/acquisitions/transfers | - | - | (382 | ) | - | 4 | NM | (100 | )% | |||||||||||||||||||
| Charge-offs | (199,075 | ) | (160,200 | ) | (131,385 | ) | (101,756 | ) | (54,891 | ) | (24 | )% | (263 | )% | ||||||||||||||
| Recoveries | 7,829 | 5,507 | 3,713 | 2,618 | 4,098 | 42 | % | 91 | % | |||||||||||||||||||
| Ending Balance | $ | 849,210 | $ | 760,456 | $ | 575,149 | $ | 483,203 | $ | 342,341 | 12 | % | 148 | % | ||||||||||||||
| Reserve for off-balance sheet commitments | 18,752 | 19,109 | 22,303 | 11,786 | 10,726 | (2 | )% | 75 | % | |||||||||||||||||||
| Total allowance for loan losses plus reserve | $ | 867,962 | $ | 779,565 | $ | 597,452 | $ | 494,989 | $ | 353,067 | 11 | % | 146 | % | ||||||||||||||
| Allowance for Loan Losses | ||||||||||||||||||||||||||||
| Regional Banking | $ | 311,399 | $ | 269,397 | $ | 240,507 | $ | 184,472 | $ | 139,150 | 16 | % | 124 | % | ||||||||||||||
| Capital Markets | 63,554 | 63,654 | 42,745 | 24,338 | 13,522 | * | 370 | % | ||||||||||||||||||||
| National Specialty Lending | 446,254 | 420,220 | 287,212 | 273,127 | 188,550 | 6 | % | 137 | % | |||||||||||||||||||
| Mortgage Banking | 28,003 | 7,185 | 4,685 | 1,266 | 1,119 | 290 | % | NM | ||||||||||||||||||||
| Total allowance for loan losses | $ | 849,210 | $ | 760,456 | $ | 575,149 | $ | 483,203 | $ | 342,341 | 12 | % | 148 | % | ||||||||||||||
| Non-Performing Assets | ||||||||||||||||||||||||||||
| Regional Banking | ||||||||||||||||||||||||||||
| Nonperforming loans | $ | 163,933 | $ | 133,138 | $ | 115,264 | $ | 81,244 | $ | 30,608 | 23 | % | 436 | % | ||||||||||||||
| Foreclosed real estate | 31,665 | 32,078 | 37,594 | 38,019 | 35,026 | (1 | )% | (10 | )% | |||||||||||||||||||
| Total Regional Banking | 195,598 | 165,216 | 152,858 | 119,263 | 65,634 | 18 | % | 198 | % | |||||||||||||||||||
| Capital Markets | ||||||||||||||||||||||||||||
| Nonperforming loans | 27,339 | 27,284 | 41,527 | 13,030 | 8,970 | * | 205 | % | ||||||||||||||||||||
| Foreclosed real estate | 600 | 600 | 600 | 600 | 810 | * | (26 | )% | ||||||||||||||||||||
| Total Capital Markets | 27,939 | 27,884 | 42,127 | 13,630 | 9,780 | * | 186 | % | ||||||||||||||||||||
| National Specialty Lending | ||||||||||||||||||||||||||||
| Nonperforming loans | 834,042 | 718,624 | 582,523 | 433,285 | 243,711 | 16 | % | 242 | % | |||||||||||||||||||
| Foreclosed real estate | 52,725 | 57,251 | 45,384 | 29,680 | 34,120 | (8 | )% | 55 | % | |||||||||||||||||||
| Total National Specialty Lending | 886,767 | 775,875 | 627,907 | 462,965 | 277,831 | 14 | % | 219 | % | |||||||||||||||||||
| Mortgage Banking | ||||||||||||||||||||||||||||
| Nonperforming loans - including held for sale (a) | 28,335 | 20,930 | 30,704 | 9,693 | 23,797 | 35 | % | 19 | % | |||||||||||||||||||
| Foreclosed real estate | 19,318 | 25,589 | 22,542 | 15,373 | 15,385 | (25 | )% | 26 | % | |||||||||||||||||||
| Total Mortgage Banking | 47,653 | 46,519 | 53,246 | 25,066 | 39,182 | 2 | % | 22 | % | |||||||||||||||||||
| Total nonperforming assets | $ | 1,157,957 | $ | 1,015,494 | $ | 876,138 | $ | 620,924 | $ | 392,427 | 14 | % | 195 | % | ||||||||||||||
| Net Charge-Offs | ||||||||||||||||||||||||||||
| Regional Banking | $ | 63,822 | $ | 29,310 | $ | 33,337 | $ | 29,942 | $ | 12,421 | 118 | % | 414 | % | ||||||||||||||
| Capital Markets | 8,207 | 17,543 | 114 | 4,215 | 2,794 | (53 | )% | 194 | % | |||||||||||||||||||
| National Specialty Lending | 118,017 | 107,462 | 93,640 | 64,906 | 35,635 | 10 | % | 231 | % | |||||||||||||||||||
| Mortgage Banking | 1,200 | 378 | 581 | 75 | (57 | ) | 217 | % | NM | |||||||||||||||||||
| Total net charge-offs | $ | 191,246 | $ | 154,693 | $ | 127,672 | $ | 99,138 | $ | 50,793 | 24 | % | 277 | % | ||||||||||||||
| Consolidated Key Ratios (b) | ||||||||||||||||||||||||||||
| NPL % | 4.91 | % | 4.12 | % | 3.42 | % | 2.41 | % | 1.28 | % | ||||||||||||||||||
| NPA % | 5.38 | 4.63 | 3.88 | 2.78 | 1.66 | |||||||||||||||||||||||
| Net charge-offs % | 3.61 | 2.84 | 2.35 | 1.81 | .93 | |||||||||||||||||||||||
| Allowance / Loans | 3.99 | 3.52 | 2.59 | 2.20 | 1.55 | |||||||||||||||||||||||
| Allowance to loans excluding insured loans | 4.11 | 3.63 | 2.68 | 2.26 | 1.62 | |||||||||||||||||||||||
| Allowance / NPL | .81 | x | .85 | x | .76 | x | .92 | x | 1.21 | x | ||||||||||||||||||
| Allowance / NPA | .74 | x | .76 | x | .66 | x | .79 | x | .93 | x | ||||||||||||||||||
| Allowance / Charge-offs | 1.11 | x | 1.23 | x | 1.13 | x | 1.22 | x | 1.68 | x | ||||||||||||||||||
| Other | ||||||||||||||||||||||||||||
| Loans past due 90 days or more (c) | $ | 133,067 | $ | 119,588 | $ | 157,277 | $ | 300,185 | $ | 251,509 | 11 | % | (47 | )% | ||||||||||||||
| Guaranteed portion (c) | 42,478 | 50,419 | 64,696 | 223,572 | 190,899 | (16 | )% | (78 | )% | |||||||||||||||||||
| Foreclosed real estate from GNMA loans | 21,230 | 35,943 | 35,737 | 22,346 | 18,642 | (41 | )% | 14 | % | |||||||||||||||||||
| Period-end loans, net of unearned income (millions) | $ | 21,278 | $ | 21,602 | $ | 22,225 | $ | 21,932 | $ | 22,104 | (1 | )% | (4 | )% | ||||||||||||||
| Insured loans (millions) | 591 | 652 | 739 | 809 | 913 | (9 | )% | (35 | )% | |||||||||||||||||||
| Total loans excluding insured loans (millions) | $ | 20,687 | $ | 20,950 | $ | 21,486 | $ | 21,123 | $ | 21,191 | (1 | )% | * | |||||||||||||||
| Off-balance sheet commitments (millions) (d) | $ | 6,442 | $ | 6,746 | $ | 6,444 | $ | 6,826 | $ | 6,929 | (5 | )% | (7 | )% | ||||||||||||||
| NM - Not meaningful | |
| * Amount is less than one percent | |
| Certain previously reported amounts have been reclassified to agree with current presentation. | |
| (a) | 4Q 2008 includes $19,867 of loans held-to-maturity. |
| (b) | See Glossary of Terms for definitions of Consolidated Key Ratios. |
| (c) | Includes loans held for sale. |
| (d) | Amount of off-balance sheet commitments for which a reserve has been provided. |
24
| ASSET QUALITY: CONSOLIDATED | ||||||||||||||||||||||||||||
| Quarterly, Unaudited | ||||||||||||||||||||||||||||
| 4Q08 Change vs. | ||||||||||||||||||||||||||||
| 4Q08 | 3Q08 | 2Q08 | 1Q08 | 4Q07 | 3Q08 | 4Q07 | ||||||||||||||||||||||
| Key Portfolio Details | ||||||||||||||||||||||||||||
| Commercial (C&I & Other) | ||||||||||||||||||||||||||||
| Period-end loans ($ millions) | $ | 7,806 | $ | 7,618 | $ | 7,721 | $ | 7,225 | $ | 6,969 | 2 | % | 12 | % | ||||||||||||||
| 30+ Delinq. % | .53 | % | 1.15 | % | 1.46 | % | .93 | % | .50 | % | ||||||||||||||||||
| NPL % | 1.03 | 1.05 | 1.20 | .64 | .24 | |||||||||||||||||||||||
| Charge-offs % (qtr. annualized) | 2.21 | 1.64 | .84 | .83 | .20 | |||||||||||||||||||||||
| Allowance / Loans % | 2.46 | % | 2.29 | % | 1.90 | % | 1.59 | % | ||||||||||||||||||||
| Allowance / Charge-offs | 1.16 | x | 1.41 | x | 2.46 | x | 2.31 | x | ||||||||||||||||||||
| Income CRE (Income-producing Commercial Real Estate) | ||||||||||||||||||||||||||||
| Period-end loans ($ millions) | $ | 1,988 | $ | 2,038 | $ | 2,039 | $ | 1,982 | $ | 1,948 | (2 | )% | 2 | % | ||||||||||||||
| 30+ Delinq. % | 2.42 | % | 3.47 | % | 1.43 | % | .57 | % | 1.96 | % | ||||||||||||||||||
| NPL % | 5.02 | 3.72 | 3.54 | 2.01 | .27 | |||||||||||||||||||||||
| Charge-offs % (qtr. annualized) | 2.73 | .24 | .63 | 1.94 | .13 | |||||||||||||||||||||||
| Allowance / Loans % | 4.71 | % | 3.73 | % | 2.89 | % | 2.47 | % | ||||||||||||||||||||
| Allowance / Charge-offs | 1.70 | x | 15.48 | x | 4.82 | x | 1.28 | x | ||||||||||||||||||||
| Residential CRE (Homebuilder and Condominium Construction) | ||||||||||||||||||||||||||||
| Period-end loans ($ millions) | $ | 1,288 | $ | 1,480 | $ | 1,739 | $ | 1,980 | $ | 2,093 | (13 | )% | (38 | )% | ||||||||||||||
| 30+ Delinq. % | 3.74 | % | 5.73 | % | 6.36 | % | 2.73 | % | 3.56 | % | ||||||||||||||||||
| NPL % | 30.71 | 23.64 | 16.65 | 12.07 | 6.43 | |||||||||||||||||||||||
| Charge-offs % (qtr. annualized) | 15.79 | 11.95 | 6.23 | 5.93 | 3.82 | |||||||||||||||||||||||
| Allowance / Loans % | 8.25 | % | 7.55 | % | 5.26 | % | 3.64 | % | ||||||||||||||||||||
| Allowance / Charge-offs | .49 | x | .58 | x | .76 | x | .58 | x | ||||||||||||||||||||
| Consumer Real Estate (Home Equity Installment and HELOC) | ||||||||||||||||||||||||||||
| Period-end loans ($ millions) | $ | 7,749 | $ | 7,830 | $ | 7,909 | $ | 7,964 | $ | 8,182 | (1 | )% | (5 | )% | ||||||||||||||
| 30+ Delinq. % | 1.97 | % | 1.49 | % | 1.27 | % | 1.55 | % | 1.43 | % | ||||||||||||||||||
| NPL % | .07 | .07 | .09 | .11 | .09 | |||||||||||||||||||||||
| Charge-offs % (qtr. annualized) | 1.81 | 1.41 | 1.78 | .93 | .62 | |||||||||||||||||||||||
| Allowance / Loans % | 2.35 | % | 1.58 | % | 1.70 | % | 1.19 | % | ||||||||||||||||||||
| Allowance / Charge-offs | 1.29 | x | 1.12 | x | 0.95 | x | 1.28 | x | ||||||||||||||||||||
| OTC (Consumer Residential Construction Loans) | ||||||||||||||||||||||||||||
| Period-end loans ($ millions) | $ | 981 | $ | 1,202 | $ | 1,522 | $ | 1,815 | $ | 2,008 | (18 | )% | (51 | )% | ||||||||||||||
| 30+ Delinq. % | 4.43 | % | 4.92 | % | 2.69 | % | 2.67 | % | 2.50 | % | ||||||||||||||||||
| NPL % | 43.03 | 28.94 | 17.61 | 11.01 | 5.68 | |||||||||||||||||||||||
| Charge-offs % (qtr. annualized) | 14.80 | 12.29 | 9.90 | 4.63 | 2.18 | |||||||||||||||||||||||
| Allowance / Loans % | 20.44 | % | 20.16 | % | 7.75 | % | 6.49 | % | ||||||||||||||||||||
| Allowance / Charge-offs | 1.25 | x | 1.46 | x | 0.78 | x | 1.33 | x | ||||||||||||||||||||
| Permanent Mortgage | ||||||||||||||||||||||||||||
| Period-end loans ($ millions) | $ | 1,127 | $ | 1,080 | $ | 1,004 | $ | 647 | $ | 562 | 4 | % | 100 | % | ||||||||||||||
| 30+ Delinq. % | 6.94 | % | 7.38 | % | 6.36 | % | 7.73 | % | 5.59 | % | ||||||||||||||||||
| NPL % | 3.73 | 2.94 | 3.04 | - | - | |||||||||||||||||||||||
| Charge-offs % (qtr. annualized) | .57 | .22 | 1.15 | .41 | .55 | |||||||||||||||||||||||
| Allowance / Loans % | 4.76 | % | 1.17 | % | 1.24 | % | .20 | % | ||||||||||||||||||||
| Allowance / Charge-offs | 8.59 | x | 5.48 | x | 1.12 | x | 1.75 | x | ||||||||||||||||||||
| Credit Card and Other | ||||||||||||||||||||||||||||
| Period-end loans ($ millions) | $ | 339 | $ | 354 | $ | 291 | $ | 319 | $ | 342 | (4 | )% | (1 | )% | ||||||||||||||
| 30+ Delinq. % | 2.47 | % | 2.08 | % | 2.11 | % | 2.37 | % | 2.17 | % | ||||||||||||||||||
| NPL % | - | - | - | - | - | |||||||||||||||||||||||
| Charge-offs % (qtr. annualized) | 5.09 | % | 5.30 | % | 3.29 | % | 5.14 | % | 2.45 | % | ||||||||||||||||||
| Allowance / Loans % | 6.35 | % | 5.52 | % | 5.43 | % | 4.58 | % | ||||||||||||||||||||
| Allowance / Charge-offs | 1.24 | x | 1.06 | x | 1.45 | x | .89 | x | ||||||||||||||||||||
| NM - Not meaningful |
| * Amount is less than one percent |
| Certain previously reported amounts have been reclassified to agree with current presentation. |
25
| Analysis of FAS 114 Loans, ORE, & NPL Rollforward | |||||||
| Unaudited | |||||||
| ($ in millions) | |||||||
| Commercial Portfolio | |||||||
| Reserves | Reserves | Balances | % | ||||
| FAS 114 Impaired Loans with Reserves | $12.3 | $59.2 | 20.80% | ||||
| FAS 114 Impaired Loans without Reserves | - | 414.9 | - | ||||
| All Other Loans | 379.5 | 10,608.6 | 3.58% | ||||
| Total | $391.8 | $11,082.7 | 3.54% | ||||
| NRV Assessment of Commercial FAS 114 Impaired Assets with no Reserves | |||||||
| # | Appraised Value | Legal Balance | Cumulative C/O | Book Balance | Book Bal / Appraised Val | ||
| FAS 114 Relationships with no Reserves | 180 | $723.0 | $606.0 | $191.0 | $414.9 | 57.4% | |
| ORE Inventory Rollforward | |||||||
| Q4 | Q3 | Q2 | |||||
| Beginning ORE | $115.5 | $106.1 | $83.7 | ||||
| - Dispositions | (33.0) | (28.2) | (12.9) | ||||
| + Additions | 21.8 | 37.6 | 35.3 | ||||
| Ending ORE | $104.3 | $115.5 | $106.1 | ||||
| NPL Rollforward (a) | |||||||
| Q4 | Q3 | Q2 | |||||
| Beginning NPLs | $854 | $722 | $501 | ||||
| + Additions | 393 | 356 | 365 | ||||
| + Principal Increase | 7 | 4 | 3 | ||||
| - Payments | (82) | (75) | (36) | ||||
| - Charge-Offs | (150) | (122) | (86) | ||||
| - Transfer to ORE | (18) | (30) | (24) | ||||
| - Upgrade to Accrual | (6) | (1) | (1) | ||||
| Ending NPLs | $998 | $854 | $722 | ||||
| (a) Includes Commercial & One Time Close Portfolios only | |||||||
26
| ASSET QUALITY: REGIONAL BANKING | ||||||||||||||||||||||||||||
| Quarterly, Unaudited | ||||||||||||||||||||||||||||
| 4Q08 Change vs. | ||||||||||||||||||||||||||||
| 4Q08 | 3Q08 | 2Q08 | 1Q08 | 4Q07 | 3Q08 | 4Q07 | ||||||||||||||||||||||
| Total Regional Banking | ||||||||||||||||||||||||||||
| Period-end loans ($ millions) | $ | 11,017 | $ | 11,008 | $ | 11,037 | $ | 10,803 | $ | 10,631 | * | 4 | % | |||||||||||||||
| 30+ Delinq. % | 1.07 | % | 1.45 | % | 1.50 | % | 1.23 | % | 1.16 | % | ||||||||||||||||||
| NPL % | 1.49 | 1.21 | 1.04 | .75 | .29 | |||||||||||||||||||||||
| Charge-offs % (qtr. annualized) | 2.34 | 1.07 | 1.23 | 1.16 | .50 | |||||||||||||||||||||||
| Allowance / Loans % | 2.83 | % | 2.45 | % | 2.18 | % | 1.71 | % | 1.31 | % | ||||||||||||||||||
| Allowance / Charge-offs | 1.22 | x | 2.30 | x | 1.80 | x | 1.54 | x | 2.80 | x | ||||||||||||||||||
| Key Portfolio Details | ||||||||||||||||||||||||||||
| Commercial (C&I & Other) | ||||||||||||||||||||||||||||
| Period-end loans ($ millions) | $ | 6,132 | �� | $ | 6,064 | $ | 6,107 | $ | 6,134 | $ | 5,940 | 1 | % | 3 | % | |||||||||||||
| 30+ Delinq. % | .54 | % | 1.37 | % | 1.40 | % | .98 | % | .50 | % | ||||||||||||||||||
| NPL % | 1.18 | 1.09 | .92 | .62 | .30 | |||||||||||||||||||||||
| Charge-offs % (qtr. annualized) | 2.36 | .96 | 1.03 | .75 | .31 | |||||||||||||||||||||||
| Allowance / Loans % | 2.34 | % | 2.10 | % | 1.92 | % | 1.59 | % | ||||||||||||||||||||
| Allowance / Charge-offs | 1.01 | x | 2.21 | x | 1.98 | x | 2.29 | x | ||||||||||||||||||||
| Income CRE (Income-producing Commercial Real Estate) | ||||||||||||||||||||||||||||
| Period-end loans ($ millions) | $ | 1,462 | $ | 1,504 | $ | 1,484 | $ | 1,365 | $ | 1,320 | (3 | )% | 11 | % | ||||||||||||||
| 30+ Delinq. % | 1.25 | % | 1.21 | % | .99 | % | .52 | % | 2.60 | % | ||||||||||||||||||
| NPL % | 2.31 | 1.73 | 1.60 | 1.42 | .04 | |||||||||||||||||||||||
| Charge-offs % (qtr. annualized) | 1.50 | .07 | .46 | 2.57 | .04 | |||||||||||||||||||||||
| Allowance / Loans % | 4.70 | % | 3.45 | % | 2.80 | % | 2.35 | % | ||||||||||||||||||||
| Allowance / Charge-offs | 3.09 | x | 49.80 | x | 6.68 | x | .93 | x | ||||||||||||||||||||
| Residential CRE (Homebuilder and Condominium Construction) | ||||||||||||||||||||||||||||
| Period-end loans ($ millions) | $ | 435 | $ | 473 | $ | 528 | $ | 526 | $ | 570 | (8 | )% | (24 | )% | ||||||||||||||
| 30+ Delinq. % | 4.97 | % | 3.94 | % | 5.43 | % | 2.61 | % | 2.10 | % | ||||||||||||||||||
| NPL % | 13.27 | 8.71 | 6.68 | 4.68 | 2.14 | |||||||||||||||||||||||
| Charge-offs % (qtr. annualized) | 9.97 | 4.55 | 2.02 | 2.30 | 2.30 | |||||||||||||||||||||||
| Allowance / Loans % | 8.54 | % | 8.52 | % | 5.61 | % | 3.92 | % | ||||||||||||||||||||
| Allowance / Charge-offs | .83 | x | 1.75 | x | 2.93 | x | 1.65 | x | ||||||||||||||||||||
| Consumer Real Estate (Home Equity Installment and HELOC) | ||||||||||||||||||||||||||||
| Period-end loans ($ millions) | $ | 2,644 | $ | 2,606 | $ | 2,614 | $ | 2,486 | $ | 2,491 | 1 | % | 6 | % | ||||||||||||||
| 30+ Delinq. % | 1.41 | % | 1.32 | % | 1.22 | % | 1.83 | % | 1.70 | % | ||||||||||||||||||
| Charge-offs % (qtr. annualized) | 1.23 | .81 | 1.50 | .76 | .64 | |||||||||||||||||||||||
| Allowance / Loans % | 1.70 | % | 1.26 | % | 1.36 | % | .70 | % | ||||||||||||||||||||
| Allowance / Charge-offs | 1.40 | x | 1.57 | x | .90 | x | .92 | x | ||||||||||||||||||||
| Credit Card, Permanent Mortgage, and Other | ||||||||||||||||||||||||||||
| Period-end loans ($ millions) | $ | 345 | $ | 361 | $ | 304 | $ | 293 | $ | 310 | (5 | )% | 11 | % | ||||||||||||||
| 30+ Delinq. % | 2.09 | % | 1.66 | % | 1.71 | % | 1.89 | % | 1.77 | % | ||||||||||||||||||
| Charge-offs % (qtr. annualized) | 4.04 | 4.69 | 2.37 | 4.69 | 1.71 | |||||||||||||||||||||||
| Allowance / Loans % | 5.07 | % | 5.31 | % | 5.55 | % | 4.43 | % | ||||||||||||||||||||
| Allowance / Charge-offs | 1.25 | x | 1.16 | x | 2.34 | x | .95 | x | ||||||||||||||||||||
| NM - Not meaningful |
| * Amount is less than one percent |
| Certain previously reported amounts have been reclassified to agree with current presentation. |
27
| ASSET QUALITY: NATIONAL SPECIALTY LENDING | ||||||||||||||||||||||||||||
| Quarterly, Unaudited | ||||||||||||||||||||||||||||
| 4Q08 Change vs. | ||||||||||||||||||||||||||||
| 4Q08 | 3Q08 | 2Q08 | 1Q08 | 4Q07 | 3Q08 | 4Q07 | ||||||||||||||||||||||
| Total National Specialty Lending | ||||||||||||||||||||||||||||
| Period-end loans ($ millions) | $ | 7,668 | $ | 8,058 | $ | 8,622 | $ | 9,114 | $ | 9,554 | (5 | )% | (20 | )% | ||||||||||||||
| 30+ Delinq. % | 3.46 | % | 3.67 | % | 2.67 | % | 1.85 | % | 2.02 | % | ||||||||||||||||||
| NPL % | 10.88 | 8.92 | 6.76 | 4.75 | 2.55 | |||||||||||||||||||||||
| Charge-offs % (qtr. annualized) | 6.00 | 5.14 | 4.18 | 2.80 | 1.50 | |||||||||||||||||||||||
| Allowance / Loans % | 5.82 | % | 5.21 | % | 3.33 | % | 3.00 | % | 1.97 | % | ||||||||||||||||||
| Allowance / Charge-offs | .95 | x | .98 | x | .77 | x | 1.05 | x | 1.32 | x | ||||||||||||||||||
| Key Portfolio Details | ||||||||||||||||||||||||||||
| Income CRE (Income-producing Commercial Real Estate) | ||||||||||||||||||||||||||||
| Period-end loans ($ millions) | $ | 356 | $ | 378 | $ | 395 | $ | 428 | $ | 393 | (6 | )% | (10 | )% | ||||||||||||||
| 30+ Delinq. % | 7.51 | % | 13.37 | % | .80 | % | .55 | % | .76 | % | ||||||||||||||||||
| NPL % | 18.22 | 12.77 | 12.15 | 4.65 | 1.18 | |||||||||||||||||||||||
| Charge-offs % (qtr. annualized) | 8.74 | .91 | 1.43 | .87 | - | |||||||||||||||||||||||
| Allowance / Loans % | 4.67 | % | 4.28 | % | 2.63 | % | 3.07 | % | ||||||||||||||||||||
| Allowance / Charge-offs | .50 | x | 4.53 | x | 1.72 | x | 3.67 | x | ||||||||||||||||||||
| Residential CRE (Homebuilder and Condominium Construction) | ||||||||||||||||||||||||||||
| Period-end loans ($ millions) | $ | 780 | $ | 927 | $ | 1,133 | $ | 1,363 | $ | 1,431 | (16 | )% | (46 | )% | ||||||||||||||
| 30+ Delinq. % | 3.19 | % | 5.05 | % | 6.62 | % | 2.78 | % | 4.28 | % | ||||||||||||||||||
| NPL % | 40.97 | 32.03 | 22.02 | 15.36 | 7.80 | |||||||||||||||||||||||
| Charge-offs % (qtr. annualized) | 19.26 | 16.06 | 8.18 | 7.45 | 4.01 | |||||||||||||||||||||||
| Allowance / Loans % | 8.03 | % | 6.79 | % | 4.90 | % | 3.53 | % | ||||||||||||||||||||
| Allowance / Charge-offs | .38 | x | .38 | x | .50 | x | .46 | x | ||||||||||||||||||||
| Consumer Real Estate (Home Equity Installment and HELOC) | ||||||||||||||||||||||||||||
| Period-end loans ($ millions) | $ | 5,105 | $ | 5,223 | $ | 5,295 | $ | 5,478 | $ | 5,691 | (2 | )% | (10 | )% | ||||||||||||||
| 30+ Delinq. % | 2.26 | % | 1.57 | % | 1.30 | % | 1.44 | % | 1.33 | % | ||||||||||||||||||
| NPL % | .10 | .11 | .13 | .12 | .09 | |||||||||||||||||||||||
| Charge-offs % (qtr. annualized) | 2.10 | 1.70 | 1.91 | 1.02 | .62 | |||||||||||||||||||||||
| Allowance / Loans % | 2.68 | % | 1.74 | % | 1.84 | % | 1.43 | % | ||||||||||||||||||||
| Allowance / Charge-offs | 1.26 | x | 1.01 | x | .96 | x | 1.41 | x | ||||||||||||||||||||
| OTC (Consumer Residential Construction Loans) | ||||||||||||||||||||||||||||
| Period-end loans ($ millions) | $ | 981 | $ | 1,202 | $ | 1,522 | $ | 1,815 | $ | 2,008 | (18 | )% | (51 | )% | ||||||||||||||
| 30+ Delinq. % | 4.43 | % | 4.92 | % | 2.69 | % | 2.67 | % | 2.50 | % | ||||||||||||||||||
| NPL % | 43.03 | 28.94 | 17.61 | 11.01 | 5.68 | |||||||||||||||||||||||
| Charge-offs % (qtr. annualized) | 14.80 | 12.29 | 9.90 | 4.63 | 2.18 | |||||||||||||||||||||||
| Allowance / Loans % | 20.44 | % | 20.16 | % | 7.75 | % | 6.49 | % | ||||||||||||||||||||
| Allowance / Charge-offs | 1.25 | x | 1.46 | x | .78 | x | 1.33 | x | ||||||||||||||||||||
| Permanent Mortgage | ||||||||||||||||||||||||||||
| Period-end loans ($ millions) | $ | 417 | $ | 297 | $ | 249 | n/a | n/a | 40 | % | NM | |||||||||||||||||
| 30+ Delinq. % | 12.60 | % | 18.39 | % | 16.43 | % | n/a | n/a | ||||||||||||||||||||
| NPL % | 5.32 | 6.71 | 7.14 | n/a | n/a | |||||||||||||||||||||||
| Charge-offs % (qtr. annualized) | - | - | - | n/a | n/a | |||||||||||||||||||||||
| Allowance / Loans % | 6.13 | % | 1.84 | % | 2.38 | % | n/a | |||||||||||||||||||||
| Allowance / Charge-offs | NM | - | - | n/a | ||||||||||||||||||||||||
| Other Consumer | ||||||||||||||||||||||||||||
| Period-end loans ($ millions) | $ | 29 | $ | 30 | $ | 28 | $ | 29 | $ | 32 | (4 | )% | (10 | )% | ||||||||||||||
| 30+ Delinq. % | 8.14 | % | 6.65 | % | 6.39 | % | 6.90 | % | 6.00 | % | ||||||||||||||||||
| NPL % | - | - | - | - | - | |||||||||||||||||||||||
| Charge-offs % (qtr. annualized) | 11.31 | % | 11.66 | % | 13.26 | 9.13 | 9.61 | |||||||||||||||||||||
| Allowance / Loans % | 13.87 | % | 7.84 | % | 4.06 | % | 5.46 | % | ||||||||||||||||||||
| Allowance / Charge-offs | 1.22 | x | .66 | x | .31 | x | .60 | x | ||||||||||||||||||||
| NM - Not meaningful |
| * Amount is less than one percent |
| Certain previously reported amounts have been reclassified to agree with current presentation. |
28
| ASSET QUALITY: MORTGAGE BANKING & CAPITAL MARKETS | ||||||||||||||||||||||||||||
| Quarterly, Unaudited | ||||||||||||||||||||||||||||
| 4Q08 Change vs. | ||||||||||||||||||||||||||||
| 4Q08 | 3Q08 | 2Q08 | 1Q08 | 4Q07 | 3Q08 | 4Q07 | ||||||||||||||||||||||
| Total Mortgage Banking | ||||||||||||||||||||||||||||
| Period-end loans ($ millions) | $ | 674 | $ | 746 | $ | 715 | $ | 647 | $ | 562 | (10 | )% | 20 | % | ||||||||||||||
| 30+ Delinq. % | 3.63 | % | 3.35 | % | 2.88 | % | 7.73 | % | 5.59 | % | ||||||||||||||||||
| Allowance / Loans % | 4.15 | % | .96 | % | .66 | % | .20 | % | .20 | % | ||||||||||||||||||
| Total Capital Markets | ||||||||||||||||||||||||||||
| Period-end loans ($ millions) | $ | 1,918 | $ | 1,790 | $ | 1,851 | $ | 1,368 | $ | 1,356 | 7 | % | 41 | % | ||||||||||||||
| 30+ Delinq. % | .68 | % | 1.45 | % | 2.44 | % | .82 | % | .99 | % | ||||||||||||||||||
| NPL % | 1.43 | 1.52 | 2.24 | .95 | .66 | |||||||||||||||||||||||
| Charge-offs % (qtr. annualized) | 1.91 | 3.99 | .03 | 1.23 | .86 | |||||||||||||||||||||||
| Allowance / Loans % | 3.31 | % | 3.56 | % | 2.31 | % | 1.78 | % | 1.00 | % | ||||||||||||||||||
| Allowance / Charge-offs | 1.94 | x | .91 | x | 93.74 | x | 1.44 | x | 1.21 | x | ||||||||||||||||||
| NM - Not meaningful |
| * Amount is less than one percent |
| Certain previously reported amounts have been reclassified to agree with current presentation. |
29
| ASSET QUALITY HIGHLIGHTS: KEY PORTFOLIOS - COMMERCIAL | |||||||||||
| Unaudited | |||||||||||
| C&I Portfolio: $7.8 Billion (37% of Total Loans) | |||||||||||
| - Impacted by deterioration in economic conditions and impacts of housing market | |||||||||||
| - Diverse and granular portfolio | |||||||||||
| - Mostly relationship customers in TN and regional middle market lending efforts | |||||||||||
| Homebuilder Portfolio: $1.3 Billion (6% of Total Loans) | Top 10 States | ||||||||||
| % OS | % NPL | ||||||||||
| - Loans to residential builders and developers | TN | 22.48% | 13.65% | ||||||||
| - Performance under pressure from housing market (oversupply and lack of mortgage availability) | FL | 11.02% | 48.15% | ||||||||
| - Most severe market conditions in Florida, California, Virginia/DC, Arizona, Maryland, and Colorado | WA | 10.45% | 11.84% | ||||||||
| - Condominium construction balances small ($171.7 million) but individual commitments tend to be larger | CA | 6.69% | 25.56% | ||||||||
| - Managing existing relationships (shrinking business into 2009) | NC | 6.32% | 9.10% | ||||||||
| - Devoting additional resources to manage problem loans | VA | 4.38% | 45.60% | ||||||||
| - Ceased originations for national CRE business in January 2008: wind-down portfolio | TX | 4.08% | 17.42% | ||||||||
| CO | 3.97% | 57.38% | |||||||||
| MD | 3.57% | 50.90% | |||||||||
| AZ | 3.41% | 42.23% | |||||||||
| As of 12/31/08 | |||||||||||
| Income CRE Portfolio: $2.0 Billion (9% of Total Loans) | Top 10 States | ||||||||||
| % OS | % NPL | ||||||||||
| - Traditional commercial real estate construction and mini-permanent loans | TN | 42.84% | 2.24% | ||||||||
| - Three-Fourths managed by Regional Banking segment (approx) | NC | 8.68% | 7.62% | ||||||||
| - Less than 18% in national CRE business: wind-down portfolio | FL | 8.53% | 30.11% | ||||||||
| - Performance showing spillover impact from housing market | GA | 6.00% | .47% | ||||||||
| MS | 4.03% | .28% | |||||||||
| WA | 3.82% | 1.12% | |||||||||
| TX | 3.42% | - | |||||||||
| SC | 2.97% | - | |||||||||
| AZ | 2.79% | 5.28% | |||||||||
| CA | 2.09% | 17.18% | |||||||||
| As of 12/31/08 | |||||||||||
30
| ASSET QUALITY HIGHLIGHTS: KEY PORTFOLIOS - CONSUMER | |||||||||||
| Unaudited | |||||||||||
| Consumer Real Estate (primarily Home Equity) Portfolio: $7.7 Billion (36% of Total Loans) | |||||||||||
- Performance continues to show deterioration in Q4 primarily related to areas with significant home price depreciation. | Top 10 States | ||||||||||
| - Geographically diverse | % OS | Del. % | C/O % | ||||||||
| - Top States (TN= 27%, CA = 14%, VA = 4%, WA = 4%, MD = 3%, FL = 3%, GA = 3%) | TN | 27% | 1.50% | .97% | |||||||
| - Strong borrower quality | CA | 14% | 2.12% | 2.23% | |||||||
| - 735 avg. portfolio origination FICO; 732 avg. portfolio FICO (refreshed) | VA | 4% | 2.27% | 3.73% | |||||||
| - Good collateral position | WA | 4% | 1.46% | .89% | |||||||
| - High LTV loans managed through whole loan insurance | MD | 3% | 2.07% | .52% | |||||||
| - 27% 1st lien and 73% second lien | FL | 3% | 3.58% | 5.02% | |||||||
| - 86% of uninsured portfolio <90 CLTV | GA | 3% | 2.69% | 1.59% | |||||||
| - 14% of uninsured portfolio is HLTV, 65% of which (or 9.1%) have FICO >700 | AZ | 2% | 3.28% | 5.04% | |||||||
| - No longer originating loans >89.9% CLTV | PA | 2% | 2.06% | 1.96% | |||||||
| - Good borrower capacity (37% avg. DTI) | NJ | 2% | 2.02% | .29% | |||||||
| - Primarily retail-sourced (85% retail) | As of 12/31/08 | ||||||||||
| - Mix of older vintage loans | |||||||||||
| - 52% originated prior to 2006 | Retail vs. Wholesale Originations | ||||||||||
| % OS | Del. % | C/O % | |||||||||
| Retail | 85.23% | 1.72% | 1.50% | ||||||||
| Wholesale | 12.41% | 3.84% | 4.52% | ||||||||
| Other | 2.36% | 1.76% | 1.50% | ||||||||
| As of 12/31/08 | |||||||||||
| Portfolio Breakdown by LTV and FICO | |||||||||||
| <=80% | 80% - 90% | >90% | |||||||||
| >=740 | 31.8% | 13.9% | 5.2% | ||||||||
| 720-739 | 7.1% | 4.5% | 2.0% | ||||||||
| 700-719 | 7.0% | 4.4% | 1.9% | ||||||||
| 660-699 | 7.9% | 4.0% | 3.2% | ||||||||
| 620-659 | 2.6% | 1.4% | 1.3% | ||||||||
| <620 | .8% | .3% | .4% | ||||||||
| *excludes whole loan insurance | |||||||||||
| As of 12/31/08 | |||||||||||
| Balance | Origination Characteristics | QTD | YTD | ||||||||
| Vintage | % | CLTV | FICO | % Broker * | % TN | % 1st lien | NCO's % | NCO's % | |||
| pre-2002 | 6% | 76% | 717 | 16% | 50% | 37% | 1.91% | 2.18% | |||
| 2003 | 9% | 73% | 730 | 14% | 38% | 47% | .95% | .67% | |||
| 2004 | 14% | 79% | 729 | 21% | 26% | 29% | 1.54% | 1.34% | |||
| 2005 | 22% | 80% | 732 | 20% | 20% | 17% | 2.31% | 2.43% | |||
| 2006 | 18% | 77% | 735 | 6% | 26% | 18% | 2.69% | 2.54% | |||
| 2007 | 21% | 79% | 741 | 15% | 22% | 19% | 1.75% | 1.12% | |||
| 2008 | 10% | 76% | 749 | 11% | 33% | 53% | 1.05% | .32% | |||
| Total | 100% | 78% | 735 | 15% | 27% | 27% | 1.81% | 1.48% | |||
| * Correspondent and Wholesale | |||||||||||
| One-Time Close (OTC) Portfolio: $981 Million (5% of Total Loans) | Top 10 States | ||||||||||
| % OS | % NPL | ||||||||||
| - Construction-to-perm loans with short duration | CA | 27% | 46% | ||||||||
| - Performance under pressure from housing market, borrower stress | TX | 11% | 31% | ||||||||
| and lack of product salability in the secondary market | UT | 11% | 54% | ||||||||
| - Actively identifying and remediating problem accounts | ID | 7% | 36% | ||||||||
| - Devoting additional resources to manage problem loans | WA | 7% | 76% | ||||||||
| - Ceased originations for national OTC lending: wind-down portfolio | FL | 6% | 95% | ||||||||
| AZ | 5% | 60% | |||||||||
| OR | 4% | 21% | |||||||||
| VA | 2% | 38% | |||||||||
| NC | 2% | 30% | |||||||||
| As of 12/31/08 | |||||||||||
31
| ASSET QUALITY: PROCESS HIGHLIGHTS |
| Product Current Process |
| Commercial Loans (Real Estate / C&I) |
| Risk Grading |
| Reserves are established using historical loss factors by grade level. Relationship managers risk rate each loan using grades that reflect both the probability of default and estimated loss in the event of default. Loans with emerging weaknesses receive increased oversight through our Watch List process. |
| Portfolio Reviews are conducted regularly to provide oversight of risk grading decisions for larger credits. |
| Watch List Process |
| For new Watch List loans, senior credit management reviews risk grade appropriateness and action plans. After initial identification, relationship managers prepare regular updates for review and discussion by more senior business line and credit officers. This oversight is intended to bring consistent grading and allow timely identification of loans that need to be further downgraded or placed on non-accrual status. |
| Classified & Non-Accruals |
| When a loan becomes classified, the asset generally transfers to the specialists in our Loan Rehab and Recovery group where the accounts receive more detailed monitoring; at this time, new appraisals are typically ordered for real estate collateral dependent credits. |
| Loans are placed on non-accrual status if it becomes evident that full collection of principal and interest is at risk or if the loans become 90 days or more past due. |
| Impairment Assessment |
| Generally, classified non-accrual loans over $1 million are deemed to be impaired in accordance with SFAS 114 and are assessed for impairment measurement. For impaired assets viewed as collateral dependent, fair value estimates are obtained from a recently received and reviewed appraisal. Appraised values are adjusted down for costs associated with asset disposal and for our estimate of any further deterioration in values since the most recent appraisal. Upon the determination of impairment, we charge off the full difference between book value and our best estimate of the asset’s net realizable value. |
| One-Time Close (OTC) Loans |
| For OTC real estate construction loans, reserve levels are established based on portfolio modeling and monthly portfolio reviews conducted with business line managers and credit officers. The inherent risk in credits is examined and evaluated based on factors such as draw inactivity and borrower conditions, often recognizing problems prior to delinquency. In addition, OTC loans that reach 90 days past due are placed on non-accrual. A new appraisal is ordered for loans that reach 90 days past due or are classified as substandard during the monthly portfolio review. Loans are initially written down to current appraised value. Loans are then assessed for charge down again when they reach 180 days past due, and again when they are taken into OREO. |
| Home Equity Loans & Lines |
| For home equity loans and lines, reserve levels are established through the use of several models that look at historical losses, cumulative vintage performance, and roll rates. Loans are classified substandard at 90 days delinquent. Our collateral position is assessed prior to the asset becoming 180 days delinquent. If the value does not support foreclosure, balances are charged-off and other avenues of recovery are pursued. If the value supports foreclosure, the loan is charged down to net realizable value and is placed on non-accrual status. When collateral is taken to OREO, the asset is assessed for further write down to appraised value. |
32
| GLOSSARY OF TERMS |
Appraisal Fees: A fee charged to the borrower for the cost of appraising a property. |
Credit Report Fee: A fee charged to the borrower for the cost of obtaining the borrower’s credit report. |
FAS 91 Fee Deferral: The timing difference between collecting and recognizing origination fees on a loan not carried at elected fair value. For loans held for sale not carried at elected fair value, origination fees are recognized at the time the loan is sold, not at the time the loan is originated. |
FAS 91 Reclassification: The reclassification of the cost of originating mortgage warehouse loans, not carried at elected fair value, sold during the period. |
FAS 114 Loans: Commercial loans over $1 million that are not expected to pay all contractually due principal and interest and consumer loans that have experienced a troubled debt restructuring. These loans are generally written down to an estimate of collateral value less cost to sell. |
Final Inspection Fee: A fee charged to the borrower to inspect a property. |
Lower of Cost or Market (LOCOM): A method of accounting for certain assets by recording them at the lower of their historical cost or their current market value. |
Origination Fees: A fee charged to the borrower by the lender to originate a loan. Usually stated as a percentage of the face value of the loan. |
Tangible Equity/RWA: Shareholders' equity excluding intangible assets and unrealized gains/losses on available for sale securities and cash flow hedges divided by risk weighted assets. |
| Asset Quality - Consolidated Key Ratios |
NPL %: Ratio is nonperforming loans in the loan portfolio to total period end loans. |
NPA %: Ratio is nonperforming assets related to the loan portfolio to total period end loans plus foreclosed real estate and other assets. |
Net charge-offs %: Ratio is annualized net charge-offs to total average loans. |
Allowance / Loans: Ratio is allowance for loan losses to total period end loans. |
Allowance to loans excluding insured loans: Ratio is allowance for loan losses to total period end loans excluding insured loans. |
Allowance / NPL: Ratio is allowance for loan losses to nonperforming loans in the loan portfolio. |
Allowance / NPA: Ratio is allowance for loan losses to nonperforming assets related to the loan portfolio. |
Allowance / Charge-offs: Ratio is allowance for loan losses to annualized net charge-offs. |
33

1
First Horizon National Corporation
Fourth Quarter 2008 Earnings
January 16, 2009

2
§ Portions of this presentation use non-GAAP financial information. Each of those portions is so
noted, and a reconciliation of that non-GAAP information to comparable GAAP information is
provided in a footnote or in the Appendix at the end of this presentation.
noted, and a reconciliation of that non-GAAP information to comparable GAAP information is
provided in a footnote or in the Appendix at the end of this presentation.
§ This presentation contains forward-looking statements, which may include guidance, involving
significant risks and uncertainties which will be identified by words such as “believe” “expect”
“anticipate” “intend” “estimate” “should” “is likely” “will” “going forward” and other expressions
that indicate future events and trends and may be followed by or reference cautionary
statements. A number of factors could cause actual results to differ materially from those in the
forward-looking information. These factors are outlined in our recent earnings and other press
releases and in more detail in the most current 10-Q and 10-K. First Horizon disclaims any
obligation to update any of the forward-looking statements that are made from time to time to
reflect future events or developments.

3
Financial Highlights: Fourth Quarter 2008
1Pretax, pre-provision is a non-GAAP number and is pretax income excluding provision. Pretax loss was $87mm and
provision was $280mm at 4Q08. 2Current quarter is estimate
provision was $280mm at 4Q08. 2Current quarter is estimate
§ Earnings per share of $(0.27)
§ Net loss of $(56) million
§ Loan loss reserve increased to 3.99% of total loans, as provision of $280 million exceeded
$191 million in net charge-offs
$191 million in net charge-offs
§ Solid financial performance with pretax, pre-provision income1 of $193 million, up from
$126 million in prior quarter
$126 million in prior quarter
§ Fourth quarter includes $34 million of favorable significant items
§ Net interest margin at 2.96%, down 5bps linked quarter
§ Tier I capital ratio improved to 14.9%2, TCE/TA improved to 7.3%2
§ P/E tangible book value per share at $10.98

4
Significant Strategic Progress in 2008
Attractive
Growth Opportunities
Industry-Leading
Strengths
Strengths
§ Sources of excess liquidity estimated at $5B
Ability
To
Execute
§ Tier 1 ratio improved to 14.9%1 in 4Q08
§ TCE/TA improved to 7.3%1 in 4Q08
§ Increased reserves/loans to 3.99% in 4Q08
§ Identified inherent loss content in OTC portfolio
Exited National Lending Platforms
Bolstered Capital Position
Reduced Balance Sheet Risk
Proactive on Asset Quality
Strong Capital Position
Solid Liquidity Position
Significant Loan Loss Reserves
Strong Regional Banking Franchise
Focused Capital Markets Business
§ Raised $690mm in new common equity
§ Received $866mm from U.S. Treasury CPP
§ Strong fixed income distribution platform
§ Strategic growth of sales & trading
§ Proactively identified problem loans
§ Wrote non-performers down to net realizable values
§ Reduced unsecured wholesale funding
§ Retired $3.5 billion in maturing debt
Improved Liquidity Profile
1Current quarter is estimate
§ Sold national mortgage platform outside TN
§ Ceased construction/consumer lending outside
regional banking footprint
regional banking footprint
§ Sold 34 First Horizon Bank branches
§ Reduced total assets by $6.0B
§ Reduced construction portfolios by $2.0B
§ Reduced mortgage servicing by $40B ($1.1B assets)
§ Strong customer and account growth
§ Stable deposit base, growing since August
§ 27% client share / 41% share of wallet in target customer
segments
segments
§ Service: #2 JD Power ranking in satisfaction

5
Asset Quality

6
Other
52%
OTC &
National Res CRE
70%
Other
30%
2008 Net Charge-Offs
NPLs at 12/31/08
1Asset quality ratios as of 4Q08
OTC &
National Res CRE
48%
Asset Quality Overview
§ Managing asset quality proactively
§ Aggressive loss recognition
§ Significant balance reductions in national construction portfolios
§ Net charge-offs totaled $191 million, annualized 3.61% of loans1
§ Reserves increased $89 million to $849 million, 3.99% of loans1
§ Reserve increase driven by home equity and permanent mortgage portfolios
reflecting higher inherent losses in these portfolios
reflecting higher inherent losses in these portfolios
§ Reserve decreases in Res CRE and OTC, as national portfolios continue to
wind-down
wind-down
§ NPLs increased to 4.91% of loans1
§ Continued to charge-down to net realizable values vs. carrying reserve for
future loss recognition
future loss recognition
§ Inflows up slightly, offset by slightly higher resolutions at levels consistent
with carrying values
with carrying values

7
Home Equity - Delinquency & Loss Trends
30+ Delinquency: National vs. Regional
30+ Delinquency: 1st vs. 2nd Liens
30+ Delinquency: Lines vs. Loans
Net-Charge Offs
*Note: 30+Delinquency exclude divested First Horizon Banks
Net Charge-Offs are annualized
2.13%
1.78%
2.22%
1.34%
2.29%
1.33%

8
§ OTC balances are expected to decline through end
of 2009
of 2009
§ Completed loans either pay off or are modified to
the permanent mortgage portfolio
the permanent mortgage portfolio
§ Reserves at 20.4% of loans
§ National Res CRE balances are expected to decline
through end of 2009
through end of 2009
§ Reserves at 8.0% of loans
61%
55%
Commitments
Balances
One-Time Close
National Res CRE
National Construction Portfolios Winding-Down Rapidly
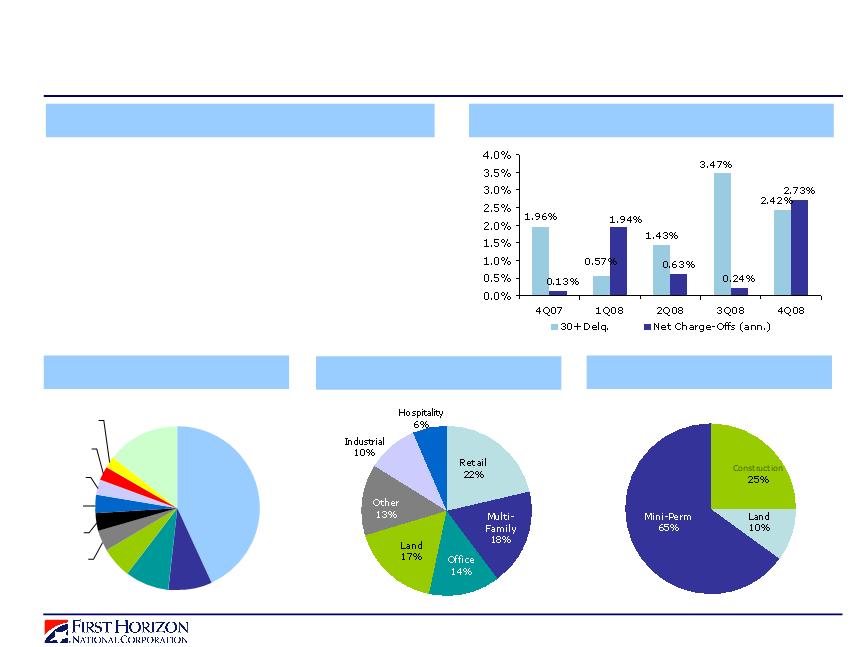
9
Income CRE Portfolio
§ Traditional commercial real estate construction and
mini-permanent loans
mini-permanent loans
§ Balances of $2B at 4Q08
§ Three-fourths managed in regional banking
§ Housing market and broader economic conditions
impacting performance of portfolio
impacting performance of portfolio
Portfolio Characteristics
Performance
Geography1
Collateral Type1
Loan Type1
1As of 12/31/08
WA
4%
AZ
3%
CA
2%
SC
3%
TX
3%
MS
4%
GA
6%
Fl
9%
NC
9%
TN
43%
Other
14%

10
C & I Portfolio Summary
§ Largely Tennessee portfolio diversified by
industry
industry
§ Balances of $7.8B at 4Q08
§ Trust preferred loans of $0.5B on our balance
sheet in HTM
sheet in HTM
§ Whole loans carried with ~$40mm LOCOM
§ 4Q08 losses impacted by weakening economic
conditions
conditions
§ C&I net charge-offs at $41mm
§ Ongoing, proactive reviews of portfolio and
enhanced processes illuminating individual
problem credits
enhanced processes illuminating individual
problem credits
Performance
Line of Business
Regional Banking
79%
Remaining
21%

11
Problem Loans - Inflows Stable, Resolutions Increasing
ORE Flows
NPL Flows1
Non-Performing Assets
1Includes Commercial & One Time Close Portfolios only
($ mm)
2Q08
3Q08
4Q08
Beginning NPLs
$501
$722
$854
+ Additions
$365
$356
$393
+ Principal Increase
$3
$4
$7
- Payments
($36)
($75)
($82)
- Charge-Offs
($86)
($122)
($150)
- Transfer to ORE
($24)
($30)
($18)
- Upgrade to Accrual
($1)
($6)
Ending NPLs
$722
$854
$998
$0
$200
$400
$600
$800
$1,000
$1,200
$1,400
4Q07
1Q08
2Q08
3Q08
4Q08
NPLs
ORE
($ mm)
2Q08
3Q08
4Q08
Beginning ORE
$84
$106
$115
+ Additions
$35
$37
$22
- Dispositions
($13)
($28)
($33)
Ending ORE
$106
$115
$104
§ Growth of NPLs similar to last quarter
§ Decline in ORE due to fewer additions and
more dispositions
more dispositions
§ NPL/ORE resolutions increased slightly to
$115 million in 4Q08
$115 million in 4Q08
§ Pricing supportive of carrying valuation

12
§ 4Q08 reserve increase of $89 million smallest in last five quarters
§ 4Q08 reserve increase drivers
§ Unfavorable: Home Equity, Permanent Mortgage, C&I/Income CRE grade migration
§ Favorable: OTC and Residential CRE
Pace of Reserve Growth Slowing

13
Credit Expectations and Risks Summary
2Other includes permanent mortgage, other consumer and credit card
§ Prior expectations and current outlook assume weak economic conditions through 2009
§ GDP contraction, rising unemployment, further home price declines
§ 2008 net charge-offs of $573mm in line with communicated expectation
§ 2009 expectations
§ Charge-offs expected to be at or above 4Q08 run-rate in first half, then moderate in second half
§ Reserve expected to decline as national construction portfolios wind-down
Balance
Balance
Change
Portfolio
12/31/08
12/31/08
($mm)
9/30/08
($mm)
1Q08
(Actual)
2Q08
(Actual)
3Q08
(Actual)
(Actual)
1H09
1H09
Drivers
Residential CRE
$106
$29
$30
$49
Liquidating portfolio with
significant reserves
One-Time Close
201
22
38
41
Liquidating portfolio with
significant reserves
Home Equity
182
19
36
27
Increased frequency, higher roll-
rates (unemployment rate)
Commercial
192
15
15
30
General economic weakness,
but benefit from 2008 process
Income CRE
94
10
3
1
Economic weakness impact on
retail, office, industrial
Other
2
74
4
6
7
Increased frequency,
losses above LOCOM on perm mtg.
Total
$849
$99
$128
$155
Allowance
($mm)
Net Charge-Offs
Reserves
Expected Trend
Expected Trend
Net Charge-Offs

14
Financial Results

15
Numbers may not add to total due to rounding
1Pretax, pre-provision is a non-GAAP number and is pretax income excluding provision.
2Estimated capital ratios at 12/31/08
Consolidated Financial Results
§ Solid financial performance with pretax, pre-
provision income1 of $193 million
provision income1 of $193 million
§ Includes $(34) million of significant items
§ Loan loss reserve increased to 3.99% of total
loans
loans
§ Provision of $280 million exceeded $191 million
in net charge-offs
in net charge-offs
§ Period-end shares increased to 206mm
§ Shares have been restated for previous quarters
to reflect stock dividend
to reflect stock dividend
§ Capital ratios improved significantly2
§ TCE/TA = 7.3%
§ Tier 1 = 14.9%

16
Pretax Impact
Item
($ mm)
Reinsurance reserve increase
(16.5)
Restructuring, repositioning, & efficiency related initiatives
(10.3)
Reversal of Visa liability accrual
11.0
Mortgage MSR net hedging
64.6
Mortgage Warehouse valuation adjustment
(15.0)
Significant Items: Fourth Quarter 2008

17
Consolidated Net Interest Margin
Numbers may not add to total due to rounding
1Includes divestiture balances. Mortgage I/O assets included in Trading Securities. Mortgage hedge assets included in Other
1Includes divestiture balances. Mortgage I/O assets included in Trading Securities. Mortgage hedge assets included in Other
Balance Sheet Contraction Continuing, Reducing Risk
§ NIM impacts in 4Q08
§ Excess Fed balances (-7bps)
§ Venture capital dividends (+5 bps)
§ Short-term margin pressure from deposit
competition, asset sensitivity in the
Regional Bank
competition, asset sensitivity in the
Regional Bank
§ Long-term, NIM should expand as lower
margin businesses reduced
margin businesses reduced

18
Wholesale Funding1 Period-End Balances ($B)
Numbers may not add due to rounding
Source: First Horizon Internal Information
1Excluding Securities Sold Repos, Trading Liabilities and sub-debt and other collateralized borrowings of $4.0B
§ Core deposits increased $550mm, or 4.5%, linked quarter to $12.9B
§ Balance sheet reduction offsetting debt maturities
§ $1.5B more retired at bank in 4Q08
§ $1.0B in 2009 maturities should be covered by planned asset reductions
§ Sources of excess liquidity increased to ~$5B in 4Q08
§ FHLB availability, term MMDAs, repos, unpledged securities and Fed TAF
§ Credit sensitive funding replaced with secured, non-credit sensitive sources
Improved Liquidity Position

19
Summary
TCE / TA
Total Capital Ratio
Tier 1 Ratio
Well-Capitalized Threshold
= 6.0%
= 6.0%
Well-Capitalized Threshold
= 10.0%
= 10.0%
$2,557mm
$3,933mm pretax2
Numbers may not add to total due to rounding 14Q08 ratios estimated at 12/31/08
2Assumes tax rate of 35%
Excess to Well-Capitalized
$2,267mm
$3,488mm pretax2
Excess to Well-Capitalized
§ Impact of $866 million TARP Capital Purchase
Program
Program
§ Preferred equity = $783 million
§ Common equity (warrants) = $84 million
§ Reduction in net income available to common
shareholders ~$15 million quarterly starting 1Q09
shareholders ~$15 million quarterly starting 1Q09
§ Significant excess capital above regulatory
minimums
minimums
1
1
1
5.1
7.2
7.3
0
1
2
3
4
5
6
7
8
4Q07
3Q08
4Q08
8.1
11.1
14.9
0
2
4
6
8
10
12
14
16
4Q07
3Q08
4Q08
Capital Among Best in Industry, Significant Excess

20
TARP Capital Contributes to Investment in Core Banking
Communities
Communities
§ Facilitating lending to consumers
§ Originated over 2,300 new consumer loans totaling $155 million in 4Q08
§ Originated over 600 mortgage loans totaling $90 million
§ Facilitating lending to small businesses & commercial clients
§ Originated new loans of $680 million in 4Q08
§ Significant new lending relationships
§ Supported customers through commitment of balance sheet
§ Maintaining consistent underwriting standards
§ Improving infrastructure and productivity to increase lending capacity
§ Extending banking services to the community
§ Opened two new branch locations in Middle Tennessee & DeSoto County, MS
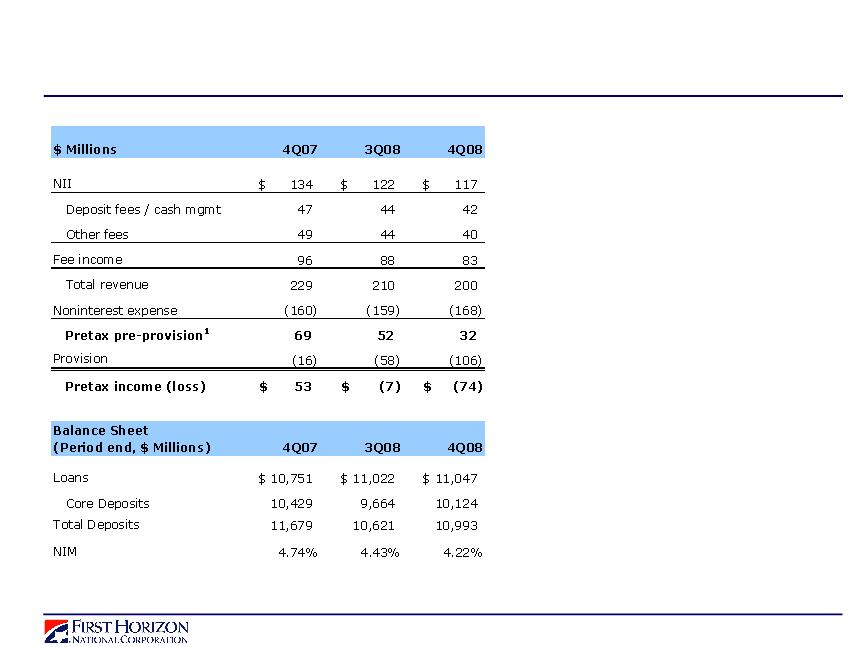
21
Numbers may not add to total due to rounding
1Pretax, pre-provision is a non-GAAP number and is pretax income excluding provision.
Segment Results: Regional Banking
§ Strong linked quarter core deposit growth of
4.8%
4.8%
§ Targeted marketing investments
§ New branches in key TN-area metros
§ Customer accounts up 4% year over year
§ NIM decreased by 21 bps in 4Q08
§ Expenses up linked quarter
§ Environment-driven costs: foreclosure, credit,
pension/benefits
pension/benefits
§ Investments in locations & people
§ Retained infrastructure post-mortgage
§ Pretax pre-provision income of $32mm
§ Elevated provision drove pre-tax loss of
$74mm
$74mm
§ Proactive account management
§ Commercial loan grade migration
1

22
Numbers may not add to total due to rounding 1Pretax, pre-provision is a non-GAAP number
and is pretax income excluding provision
Segment Results: Capital Markets
§ Pre-Tax Income of $74 million, the best quarter in
the 80-year history
the 80-year history
§ Record fixed income revenues, up $77 million
linked quarter
linked quarter
§ Expense increase due to increase in production
§ Provision decreased $30mm linked quarter
§ Continued management of balance sheet usage
from trading inventory
from trading inventory

23
§ Successful execution of strategic priorities in 2008
§ Exited national real estate lending platforms
§ Reduced balance sheet risk
§ Improved capital and liquidity
§ Proactively addressed problem loans
§ First Horizon well positioned to manage through challenges of 2009
§ Strong capital position
§ Significant loan loss reserves
§ Solid liquidity position
§ Solid long-term earnings power in core franchises - regional banking and capital markets
§ Maintaining high quality of customer service
§ Growing business with targeted client segments
§ Aligning loan pricing to new market conditions
§ Focused on improving efficiency
Summary

24
Appendix

25
Credit Quality
§ Majority of credit deterioration observed in National Specialty Lending portfolios
§ Remainder of portfolio showing some deterioration related to general economic conditions
§ Substantially all of our impaired assets greater than $1mm are considered
collateral-dependent and written-down to net realizable values (a percentage of
appraised value, net of disposition costs)
appraised value, net of disposition costs)
Numbers may not add to total due to rounding
Commercial
Income
Residential
HE &
(2)
Income
Residential
HE &
(3)
30+ Delinquency
0.53%
1.32%
4.59%
1.41%
2.09%
4.43%
7.51%
3.19%
2.26%
7.09%
Dollars
$41
$22
$23
$37
$7
$43
$27
$25
$115
$79
NPL %
1.03%
2.15%
14.99%
0.00%
0.00%
43.03%
18.22%
40.97%
0.10%
3.76%
Dollars
$80
$35
$76
$0
$0
$422
$65
$319
$5
$42
4Q08 Charge-offs % (ann.)
2.21%
1.35%
10.19%
1.23%
4.04%
14.80%
8.74%
19.26%
2.10%
0.87%
4Q08 Dollars
$41
$6
$13
$8
$4
$40
$8
$41
$27
$2
Allowance
$192
$77
$44
$45
$17
$201
$17
$63
$137
$58
Allowance / Loans %
2.46%
4.72%
8.60%
1.70%
5.07%
20.44%
4.67%
8.03%
2.68%
5.14%
(1) Includes Regional Banking and Capital Markets segments
(2) Credit Card, Permanent Mortgage, and Other
(3) Permanent Mortgage and Other Consumer
Core Franchise
(1)
National Specialty

26
Portfolio Characteristics
Geographic Distribution
Core Banking
Customers
Customers
<=2004
29%
Channel Mix
Vintage Profile
1Broker includes wholesale and correspondent
As of 12/31/08
Balance
$2.1B
$5.6B
$7.7B
Original FICO
732
735
735
Original CLTV
70%
80%
78%
Full Doc
76%
69%
71%
Owner Occupied
85%
96%
93%
HELOCs
$0.7B
$3.8B
$4.5B
Weighted Avg.
HELOC Utilization
48%
57%
55%
Home Equity - Differentiated Portfolio Characteristics

27
$0
$100
$200
$300
$400
$500
$600
$700
$800
Appraised
Value
Pre-Charge
Down Balance
Cumulative
Charge Down
Book Balance
(12/31/08)
Problem Loans Written Down to Net Realizable Value
FAS 114 Charge-Downs1
FAS 114 Loan Reserves
723
606
415
32%
write-down
(191)
43% below
appraised
value
1 Approximation based on appraisals
As of 12/31/08
Reserves/
($ mm)
Reserves
Loans
Loans
FAS114 Impaired Loans w/o
Reserves
$0
$415
0.00%
FAS114 Impaired Loans w/
Reserves
$12
$59
20.80%
Other Commercial Loans
$380
$10,609
3.58%
Total
$392
$11,083
3.54%
§ Generally, all classified non-accrual loans over $1mm are assessed for impairment in
accordance with FAS-114
accordance with FAS-114
§ Loans typically charged-down to net realizable value rather than holding reserves
§ OTC loans 90 days past due or classified substandard initially written-down to current
appraised value (based on new appraisals)
§ Loans are then charged-down to 85% of appraised value when they reach 180 days past due and to
78% of value when they are taken into ORE
78% of value when they are taken into ORE