Exhibit 99.1

SECOND QUARTER 2012
FINANCIAL SUPPLEMENT
If you need further information, please contact:
Aarti Bowman, Investor Relations
901-523-4017
aagoorha@firsthorizon.com
TABLE OF CONTENTS
| | | | |
| | | Page | |
First Horizon National Corporation Segment Structure | | | 3 | |
| |
Performance Highlights | | | 4 | |
| |
Charges for Restructuring, Repositioning, & Efficiency Initiatives | | | 6 | |
| |
Consolidated Results | | | | |
Income Statement | | | | |
Summary Results | | | 7 | |
Income Statement | | | 8 | |
Other Income and Other Expense | | | 9 | |
Balance Sheet | | | | |
Period End Balance Sheet | | | 10 | |
Average Balance Sheet | | | 11 | |
Net Interest Income | | | 12 | |
Average Balance Sheet: Yields and Rates | | | 13 | |
Mortgage Servicing Rights | | | 14 | |
| |
Business Segment Detail | | | | |
Segment Highlights | | | 15 | |
Regional Banking | | | 16 | |
Capital Markets | | | 17 | |
Corporate | | | 18 | |
Non-Strategic | | | 19 | |
| |
Capital Highlights | | | 20 | |
| |
Asset Quality | | | | |
Asset Quality: Consolidated | | | 21 | |
Asset Quality: Regional Banking and Corporate | | | 23 | |
Asset Quality: Non-Strategic | | | 24 | |
Rollforwards of Nonperforming Loans and ORE Inventory and Commercial Loans - Portfolio Metrics | | | 25 | |
Consumer Loans - Portfolio Metrics | | | 26 | |
| |
Non-GAAP to GAAP Reconciliation | | | 27 | |
| |
Glossary of Terms | | | 28 | |
Other Information
This financial supplement contains forward-looking statements involving significant risks and uncertainties. A number of important factors could cause actual results to differ materially from those in the forward-looking information. Those factors include general economic and financial market conditions, including expectations of and actual timing and amount of interest rate movements including the slope of the yield curve, competition, customer and investor responses to these conditions, ability to execute business plans, geopolitical developments, recent and future legislative and regulatory developments, natural disasters, and items mentioned in this financial supplement and in First Horizon National Corporation’s (“FHN”) most recent press release, as well as critical accounting estimates and other factors described in FHN’s recent filings with the SEC. FHN disclaims any obligation to update any such factors or to publicly announce the result of any revisions to any of the forward-looking statements included herein or therein to reflect future events or developments.
Use of Non-GAAP Measures
Certain ratios are included in this financial supplement that are non-GAAP, meaning they are not presented in accordance with generally accepted accounting principles (“GAAP”) in the U.S. FHN’s management believes such ratios are relevant to understanding the capital position and results of the Company. The non-GAAP ratios presented in this financial supplement are tangible common equity to tangible assets, tangible book value per common share, tier 1 common to risk weighted assets, adjusted tangible common equity to risk weighted assets, and net interest margin adjusted for fully taxable equivalent (“FTE”). These ratios are reported to FHN’s management and Board of Directors through various internal reports. Additionally, disclosure of non-GAAP capital ratios provides a meaningful base for comparability to other financial institutions as demonstrated by their use by the various banking regulators in reviewing the capital adequacy of financial institutions. Non-GAAP measures are not formally defined by GAAP or codified in the federal banking regulations, and other entities may use calculation methods that differ from those used by FHN. Tier 1 capital is a regulatory term and is generally defined as the sum of core capital (including common equity and instruments that can not be redeemed at the option of the holder) adjusted for certain items under risk based capital regulations. Also a regulatory term, risk weighted assets includes total assets adjusted for credit risk and is used to determine capital ratios. Refer to the tabular reconciliation of non-GAAP to GAAP measures and presentation of the most comparable GAAP items on page 27 of this financial supplement.
2
| | |
| FIRST HORIZON NATIONAL CORPORATION SEGMENT STRUCTURE | |  |
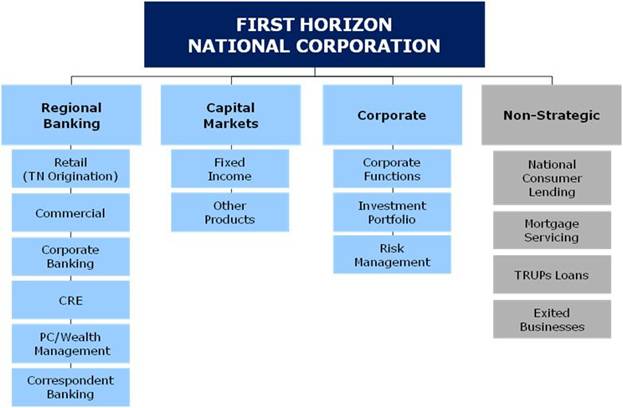
Regional Banking
| | • | | Traditional lending and deposit taking, investments, financial planning, trust services, asset management, and cash management |
| | • | | Correspondent banking which provides credit, depository, and other banking related services to other financial institutions |
Capital Markets
| | • | | Fixed income sales, trading, and strategies for institutional clients in the U.S. and abroad |
| | • | | Other capital markets products such as portfolio advisory, derivatives, and loan trading |
Corporate
| | • | | Executive management, enterprise-wide risk management, corporate, finance, corporate communications, low income housing activities, legal functions and funding for the corporation including any impact from balance sheet positioning |
| | • | | Various charges related to restructuring, repositioning, and efficiency initiatives |
Non-Strategic
| | • | | Wind-down businesses that include: |
| | • | | National consumer lending loan portfolios |
| | • | | Trust preferred loan portfolio |
| | • | | Legacy mortgage servicing |
| | • | | Exited businesses such as First Horizon Msaver, Inc. (“Msaver”), First Horizon Insurance, Inc. (“FHI”), and Highland Capital Management Corporation (“Highland Capital”) and associated restructuring, repositioning, and efficiency charges |
3
PERFORMANCE HIGHLIGHTS
Summary of Second Quarter 2012 Significant Items
(Millions)
| | | | | | | | |
| Segment | | Item | | Income Statement | | Amount | | Comments |
| | | | | |
| Non Strategic | | Repurchase Provision | | Noninterest Expense: Repurchase and foreclosure provision | | $(250.0) million | | Pre-tax charge related to repurchase obligations for mortgage loans (see discussion under Non-strategic section) |
| | | | | |
| Non Strategic | | Legal Expense | | Noninterest Expense: Other | | $(22.0) million | | Pre-tax loss accrual related to pending legal matters |
| | | | | |
| Non Strategic | | Investment Security
Gain | | Noninterest Income: Security Gains/Losses | | $5.1 million | | Pre-tax gain on the sale of venture capital investment |
(Second Quarter 2012 vs. First Quarter 2012)
Consolidated
• Net loss available to common shareholders was $124.8 million, or $.50 loss per diluted share, compared to net income of $30.5 million, or $.12 per diluted share in first quarter
• Net interest income (“NII”) increased slightly in second quarter to $172.7 million; The net interest margin (“NIM”) increased to 3.16 percent from 3.12 percent
• The increase in NII is primarily attributable to an increase in commercial loan fees coupled with lower funding costs
• The increase in NIM is largely due to a decline in excess cash held at the Fed and an increase in commercial loan fees which were partially offset by a lower yielding securities portfolio
• Noninterest income (including security gains) was $158.9 million in second quarter, a decrease of $43.5 million from first quarter
• Decrease primarily driven by lower fixed income revenue within capital markets in second quarter and a decline in mortgage banking income within the non-strategic segment
• Provision expense was $15.0 million in second quarter compared to $8.0 million in first quarter
• Noninterest expense was $527.2 million in second quarter compared to $322.0 million in first quarter
• Increase primarily driven by an increase to the repurchase and foreclosure provision
• These increases were partially offset by a decline in personnel costs within capital markets commensurate with lower fixed income revenue
• Period-end loans were $16.2 billion for the second quarter compared to $16.0 billion in first quarter; average loan balances were $16.0 billion for both quarters
• The increase in the period-end loan portfolio is primarily driven by the increase in loans to mortgage companies and real estate installment loans, partially offset by continued run-off within the non-strategic portfolios
• Average core deposits decreased slightly to $15.6 billion in second quarter, period-end decreased 5% to $15.5 billion
Regional Banking
• Net interest income increased $1.1 million in second quarter
• Increase in NII primarily attributable to higher commercial loan fees in second quarter
• Provision was $4.8 million in second quarter compared to a provision credit of $7.4 million in prior quarter
• Commercial reserve levels reflect continued stabilization of the commercial portfolio; slight increase in the level of consumer reserves
• Period-end loans increased $380.8 million to $12.0 billion primarily due to an increase in loans to mortgage companies and real estate installment loans
• Noninterest income increased to $64.8 million in second quarter from $59.9 million in first quarter
• Deposit fee income increased primarily due to seasonality in non-sufficient funds (“NSF”) fee structure
• Second quarter includes $1.8 million gain related to the sale of a branch
• Noninterest expense increased to $142.4 million in second quarter from $139.4 million in prior quarter
Capital Markets
• Fixed income revenues declined to $68.2 million in second quarter from $98.6 million in first quarter
• Fixed income average daily revenue (“ADR”) was $1.1 million in second quarter compared to $1.6 million in first quarter
• Noninterest expense decreased to $60.9 million in second quarter from $80.3 million in prior quarter
• Variable compensation costs decreased consistent with the decrease in fixed income ADR
Corporate
• NII was negative $4.1 million in second quarter compared to negative $4.7 million in first quarter
• Noninterest income (including securities gains) was $3.8 million in second quarter compared to $9.3 million in prior quarter
• Decline primarily resulting from lower deferred compensation income due to market conditions and is mirrored by a reduction in deferred compensation expense
• Noninterest expense decreased to $19.4 million in second quarter from $22.5 million in prior quarter
• The decline in deferred compensation expense was partially offset by an increase in restructuring costs, primarily severance
4
PERFORMANCE HIGHLIGHTS (continued)
(Second Quarter 2012 vs. First Quarter 2012)
Non-Strategic
• NII decreased $.9 million to $24.0 million in second quarter due to the continued contraction of loan portfolios
• Provision expense decreased to $10.2 million in second quarter from $15.4 million in prior quarter due to continued stabilization and runoff of the consumer portfolio
• Noninterest income (including securities gains) decreased to $15.3 million in second quarter from $26.5 million in prior quarter primarily due to a decline in mortgage banking income
• Positive net hedging results decreased to $1.8 million in second quarter from $9.1 million in prior quarter
• Mortgage banking was also negatively affected by a decline in servicing fees and adjustment made as a result of contingencies related to prior servicing sales
• Decline in mortgage banking income was partially offset by a $5.1 million gain on sale of a venture capital investment
• Noninterest expense increased to $304.5 million in second quarter from $79.8 million in prior quarter
• Provisioning for repurchase and foreclosure losses was $250.0 million in second quarter compared to $49.3 million in first quarter
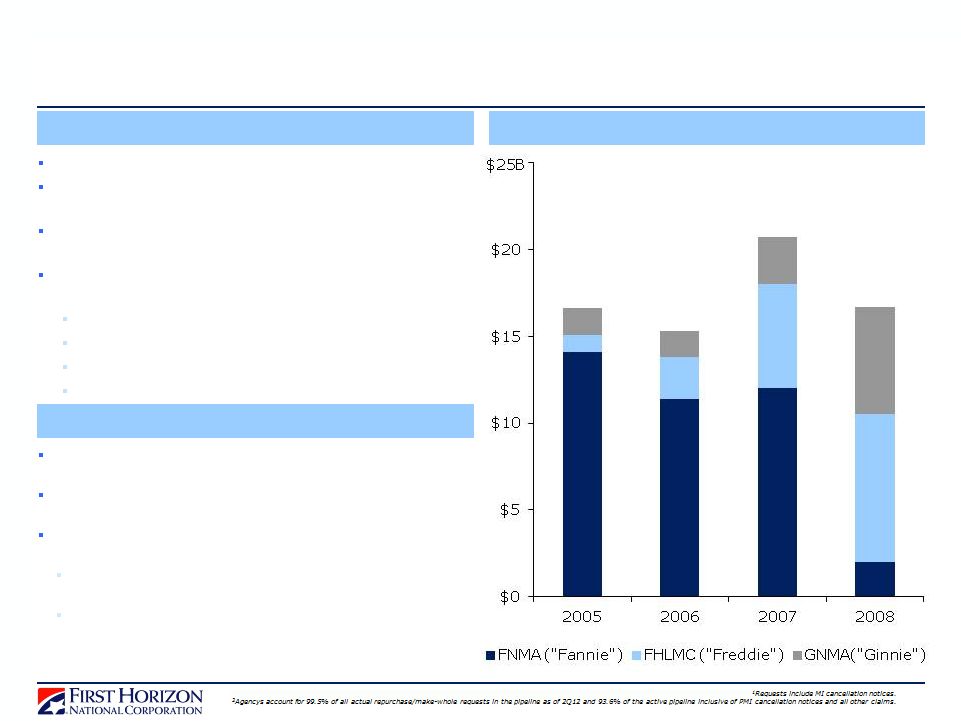
• The repurchase liability for first lien mortgage loans increased to $360.5 million in second quarter from $161.2 million in first quarter
• Second quarter provision reflects a change in estimate of FHN’s repurchase obligations for alleged breaches of reps and warranties related to mortgage loans sold to Fannie and Freddie
• Change in estimate reflects significant new information from Fannie including loans currently selected for review; information supporting anticipated future selections (primarily from seriously delinquent and liquidated loan pools); and asset quality statistics for loans sold to Fannie (primarily loans no longer serviced by FHN)
• Data utilized to extrapolate probable incurred losses related to loans sold to Freddie; Ginnie loans were not included in the extrapolation
• Unless GSE repurchase practices or outcomes change significantly, FHN expects that the mortgage repurchase reserve established as of the end of the second quarter will be sufficient for losses resulting from current pending and projected repurchase requests from Fannie and Freddie
• Active pipeline increased to $430.6 million from $380.3 million in prior quarter
• Repurchase/make whole requests were $363.4 million as of the end of second quarter and primarily relate to requests from Fannie/Freddie
• Cumulative average rescission rates ranging between 45 percent and 55 percent with cumulative average loss severities ranging between 50 percent and 60 percent
• Second quarter includes a $22.0 million loss accrual related to pending legal matters
Asset Quality
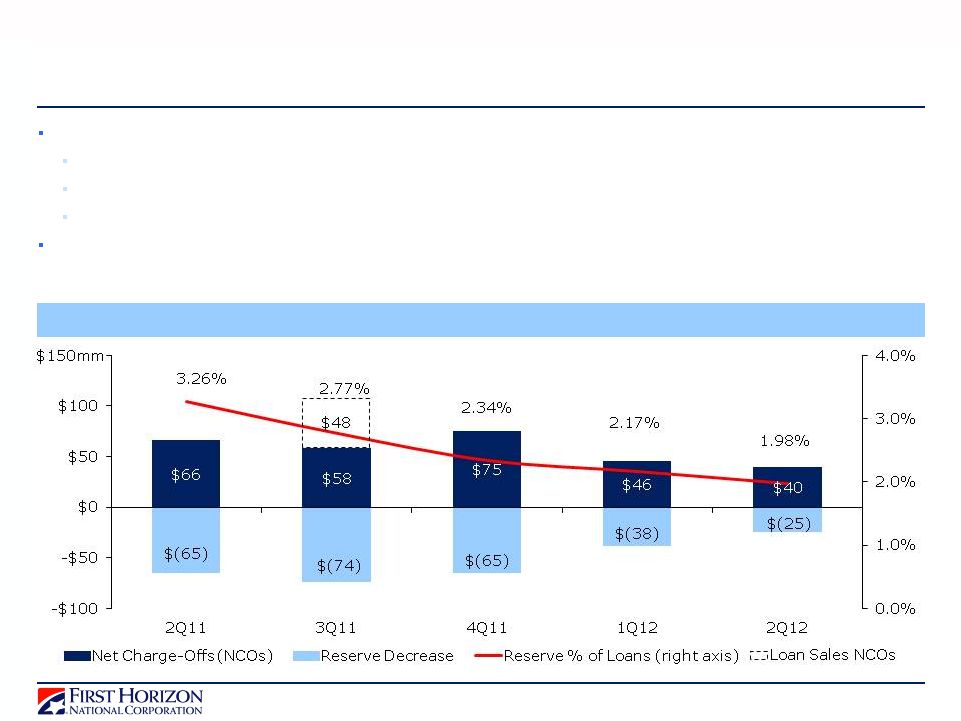
• Allowance as a percentage of loans ratio decreased to 198 basis points from 217 basis points in prior quarter
• Second quarter allowance reflects continued stabilization of loan portfolios and improving asset quality metrics
• Provision expense increased to $15.0 million during second quarter from $8.0 million in prior quarter
• Annualized net charge-offs decreased to 101 basis points of average loans from 116 basis points in prior quarter
• Net charge-offs were $40.0 million in second quarter compared to $46.3 million in prior quarter
• Commercial net charge-offs were flat at $11.0 million in second quarter
• Consumer net charge-offs were $29.0 million in second quarter, a $6.6 million decline from prior quarter
• Nonperforming assets (“NPAs”) decreased 8.69 percent from prior quarter; NPA ratio declined to 232 basis points from 256 basis points
• Foreclosed assets declined as disposition activity more than offset new inflow
• Troubled debt restructurings (“TDRs”) were $478.1 million at the end of second quarter compared with $429.6 million prior quarter
• Commercial Portfolio:
• Reserves decreased $13.4 million from prior quarter primarily driven by the C&I portfolio within the regional bank
• Reserve levels reflect continued aggregate improvement of the portfolio as upgrades outpaced downgrades
• Some upgrades within the TRUPs and bank stock portfolio; the lowest tier borrowers remain stressed and are closely monitored
• Consumer Portfolio:
• Reserves decreased $11.5 million in second quarter from $180.4 million in first quarter driven by consumer real estate portfolio within the non-strategic segment
• Balances of consumer real estate loans increased within the regional banking segment, partially offsetting runoff from the non-strategic portfolios
• Performance of the home equity portfolio improved in second quarter; 30+ delinquency rates decreased to 129 basis points from 142 basis points in prior quarter
• Reserves for the Permanent Mortgage portfolio decreased $3.5 million; Allowance to loans increased to 3.77 percent from 3.62 percent
• The decrease in reserves was driven by lower delinquencies as 30+ delinquency declined to 149 basis points from 216 basis points in the prior quarter
• The decline was mitigated by an increase in TDR reserves in second quarter
Taxes
• Second quarter includes approximately $7 million of positive effect from permanent tax credits
• Permanent credits primarily relate to affordable housing credits, life insurance, and tax-exempt interest
Capital and Liquidity
• Paid $0.01 per share dividend July 1, 2012
• Increased stock repurchase program to $200 million; repurchased shares costing $36.9 million in second quarter
• Repurchased shares costing $44.5 million in prior quarter
• Volume weighted average price for all share repurchases under the stock repurchase program of $8.28 per share (before $.03 per share broker commission)
• Capital ratios (regulatory capital ratios estimated based on period-end balances)
• 8.13% for tangible common equity to tangible assets
• 13.10% for Tier 1
• 15.94% for Total Capital
• 10.63% for Tier 1 Common
5
CHARGES FOR RESTRUCTURING, REPOSITIONING, & EFFICIENCY INITIATIVES
Quarterly, Unaudited
| | | | | | | | | | | | | | | | | | | | |
| (Thousands) | | 2Q12 | | | 1Q12 | | | 4Q11 | | | 3Q11 | | | 2Q11 | |
By Income Statement Impact | | | | | | | | | | | | | | | | | | | | |
Noninterest income | | | | | | | | | | | | | | | | | | | | |
All other income and commissions (a) | | $ | (2,287 | ) | | $ | — | | | $ | — | | | $ | 1,200 | | | $ | — | |
Gain on divestiture | | | — | | | | 200 | | | | — | | | | — | | | | — | |
Noninterest expense | | | | | | | | | | | | | | | | | | | | |
Employee compensation, incentives, and benefits | | | 2,191 | | | | (152 | ) | | | 3,760 | | | | 2,128 | | | | 7,511 | |
Occupancy | | | (219 | ) | | | 44 | | | | 39 | | | | 1,031 | | | | 59 | |
Legal and professional fees | | | — | | | | 15 | | | | (27 | ) | | | — | | | | — | |
All other expense | | | 12 | | | | 5 | | | | 220 | | | | 74 | | | | 9,026 | |
| | | | | | | | | | | | | | | | | | | | |
Total gain/(loss) before income taxes | | | (4,271 | ) | | | 288 | | | | (3,992 | ) | | | (2,033 | ) | | | (16,596 | ) |
Income/(loss) from discontinued operations (b) | | | 485 | | | | (96 | ) | | | (84 | ) | | | 8,951 | | | | 441 | |
| | | | | | | | | | | | | | | | | | | | |
Net impact resulting from restructuring, repositioning, and efficiency initiatives | | $ | (3,786 | ) | | $ | 192 | | | $ | (4,076 | ) | | $ | 6,918 | | | $ | (16,155 | ) |
| | | | | | | | | | | | | | | | | | | | |
| (a) | Reflects adjustment due to contingencies associated with prior mortgage servicing sales. |
| (b) | Includes amounts related to Msaver, First Horizon Insurance, and Highland Capital. |
6
CONSOLIDATED SUMMARY RESULTS
Quarterly, Unaudited
| | | | | | | | | | | | | | | | | | | | | | | | | | | | |
| | | | | | | | | | | | | | | | | | 2Q12 Change vs. | |
| (Dollars in thousands, except per share data) | | 2Q12 | | | 1Q12 | | | 4Q11 | | | 3Q11 | | | 2Q11 | | | 1Q12 | | | 2Q11 | |
Income Statement Highlights | | | | | | | | | | | | | | | | | | | | | | | | | | | | |
Net interest income | | $ | 172,675 | | | $ | 171,929 | | | $ | 178,877 | | | $ | 176,340 | | | $ | 172,860 | | | | | * | | | | * |
Noninterest income | | | 153,842 | | | | 202,113 | | | | 180,993 | | | | 185,725 | | | | 187,592 | | | | (24 | )% | | | (18 | )% |
Securities gains/(losses), net | | | 5,065 | | | | 328 | | | | 203 | | | | 35,162 | | | | 1 | | | | NM | | | | NM | |
| | | | | | | | | | | | | | | | | | | | | | | | | | | | |
Total revenue | | | 331,582 | | | | 374,370 | | | | 360,073 | | | | 397,227 | | | | 360,453 | | | | (11 | )% | | | (8 | )% |
| | | | | | | | | | | | | | | | | | | | | | | | | | | | |
Noninterest expense | | | 527,177 | | | | 321,994 | | | | 312,036 | | | | 322,708 | | | | 344,455 | | | | 64 | % | | | 53 | % |
Provision for loan losses | | | 15,000 | | | | 8,000 | | | | 10,000 | | | | 32,000 | | | | 1,000 | | | | 88 | % | | | NM | |
| | | | | | | | | | | | | | | | | | | | | | | | | | | | |
Income/(loss) before income taxes | | | (210,595 | ) | | | 44,376 | | | | 38,037 | | | | 42,519 | | | | 14,998 | | | | NM | | | | NM | |
Provision/(benefit) for income taxes | | | (88,178 | ) | | | 10,570 | | | | (526 | ) | | | 8,367 | | | | (4,167 | ) | | | NM | | | | NM | |
| | | | | | | | | | | | | | | | | | | | | | | | | | | | |
Income/(loss) from continuing operations | | | (122,417 | ) | | | 33,806 | | | | 38,563 | | | | 34,152 | | | | 19,165 | | | | NM | | | | NM | |
Income/(loss) from discontinued operations, net of tax | | | 487 | | | | (435 | ) | | | (752 | ) | | | 4,828 | | | | 3,671 | | | | NM | | | | (87 | )% |
| | | | | | | | | | | | | | | | | | | | | | | | | | | | |
Net income/(loss) | | | (121,930 | ) | | | 33,371 | | | | 37,811 | | | | 38,980 | | | | 22,836 | | | | NM | | | | NM | |
| | | | | | | | | | | | | | | | | | | | | | | | | | | | |
Net income attributable to noncontrolling interest | | | 2,844 | | | | 2,844 | | | | 2,871 | | | | 2,875 | | | | 2,844 | | | | | * | | | | * |
| | | | | | | | | | | | | | | | | | | | | | | | | | | | |
Net income/(loss) available to common shareholders | | $ | (124,774 | ) | | $ | 30,527 | | | $ | 34,940 | | | $ | 36,105 | | | $ | 19,992 | | | | NM | | | | NM | |
| | | | | | | | | | | | | | | | | | | | | | | | | | | | |
| | | | | | | |
Common Stock Data | | | | | | | | | | | | | | | | | | | | | | | | | | | | |
Diluted EPS from continuing operations | | $ | (0.50 | ) | | $ | 0.12 | | | $ | 0.13 | | | $ | 0.12 | | | $ | 0.06 | | | | NM | | | | NM | |
Diluted EPS | | $ | (0.50 | ) | | $ | 0.12 | | | $ | 0.13 | | | $ | 0.14 | | | $ | 0.08 | | | | NM | | | | NM | |
Diluted shares (thousands) | | | 249,104 | | | | 255,369 | | | | 260,372 | | | | 262,803 | | | | 262,756 | | | | (2 | )% | | | (5 | )% |
Period-end shares outstanding (thousands) | | | 248,810 | | | | 252,667 | | | | 257,468 | | | | 263,619 | | | | 263,699 | | | | (2 | )% | | | (6 | )% |
Cash dividends declared per share | | $ | 0.01 | | | $ | 0.01 | | | $ | 0.01 | | | $ | 0.01 | | | $ | 0.01 | | | | | | | | | |
| | | | | | | | | | | | | | | | | | | | | | | | | | | | |
| | | | | | | |
Balance Sheet Highlights (Period-End) | | | | | | | | | | | | | | | | | | | | | | | | | | | | |
Total loans, net of unearned income (Restricted—$ .1 billion) (a) | | $ | 16,185,763 | | | $ | 15,971,330 | | | $ | 16,397,127 | | | $ | 16,241,402 | | | $ | 16,061,646 | | | | 1 | % | | | 1 | % |
Total deposits | | | 16,117,443 | | | | 16,935,170 | | | | 16,213,009 | | | | 15,698,255 | | | | 15,896,027 | | | | (5 | )% | | | 1 | % |
Total assets (Restricted—$ .1 billion) (a) | | | 25,492,955 | | | | 25,678,969 | | | | 24,789,384 | | | | 25,571,469 | | | | 25,054,066 | | | | (1 | )% | | | 2 | % |
Total liabilities (Restricted—$ .1 billion) (a) | | | 22,978,549 | | | | 23,004,796 | | | | 22,104,747 | | | | 22,828,239 | | | | 22,372,684 | | | | | * | | | 3 | % |
Total equity | | | 2,514,406 | | | | 2,674,173 | | | | 2,684,637 | | | | 2,743,230 | | | | 2,681,382 | | | | (6 | )% | | | (6 | )% |
| | | | | | | | | | | | | | | | | | | | | | | | | | | | |
| | | | | | | |
Asset Quality Highlights | | | | | | | | | | | | | | | | | | | | | | | | | | | | |
Allowance for loan losses (Restricted—$ 6.0 million) (a) | | $ | 321,051 | | | $ | 346,016 | | | $ | 384,351 | | | $ | 449,645 | | | $ | 524,091 | | | | (7 | )% | | | (39 | )% |
Allowance / period-end loans | | | 1.98 | % | | | 2.17 | % | | | 2.34 | % | | | 2.77 | % | | | 3.26 | % | | | | | | | | |
Net charge-offs | | $ | 39,965 | | | $ | 46,335 | | | $ | 75,294 | | | $ | 106,446 | | | $ | 66,037 | | | | (14 | )% | | | (39 | )% |
Net charge-offs (annualized) / average loans | | | 1.01 | % | | | 1.16 | % | | | 1.84 | % | | | 2.65 | % | | | 1.67 | % | | | | | | | | |
Non-performing assets (NPA) (b) | | $ | 466,873 | | | $ | 511,320 | | | $ | 521,161 | | | $ | 582,572 | | | $ | 747,860 | | | | (9 | )% | | | (38 | )% |
NPA % (b) (c) | | | 2.32 | % | | | 2.56 | % | | | 2.57 | % | | | 3.02 | % | | | 4.09 | % | | | | | | | | |
| | | | | | | | | | | | | | | | | | | | | | | | | | | | |
| | | | | | | |
Key Ratios & Other | | | | | | | | | | | | | | | | | | | | | | | | | | | | |
Return on average assets (annualized) (d) | | | (1.96 | )% | | | 0.53 | % | | | 0.60 | % | | | 0.62 | % | | | 0.37 | % | | | | | | | | |
Return on average common equity (annualized)(e) | | | (21.06 | )% | | | 5.15 | % | | | 5.69 | % | | | 5.90 | % | | | 3.36 | % | | | | | | | | |
Net interest margin(f) (g) | | | 3.16 | % | | | 3.12 | % | | | 3.23 | % | | | 3.23 | % | | | 3.20 | % | | | | | | | | |
Fee income to total revenue(h) | | | 47.12 | % | | | 54.03 | % | | | 50.29 | % | | | 51.30 | % | | | 52.04 | % | | | | | | | | |
Efficiency ratio(i) | | | 161.45 | % | | | 86.08 | % | | | 86.71 | % | | | 89.13 | % | | | 95.56 | % | | | | | | | | |
Book value per common share | | $ | 8.92 | | | $ | 9.42 | | | $ | 9.28 | | | $ | 9.29 | | | $ | 9.05 | | | | | | | | | |
Tangible book value per common share(g) | | $ | 8.28 | | | $ | 8.78 | | | $ | 8.66 | | | $ | 8.68 | | | $ | 8.43 | | | | | | | | | |
Adjusted tangible common equity to risk weighted assets(g) | | | 9.96 | % | | | 10.79 | % | | | 10.73 | % | | | 11.09 | % | | | 11.05 | % | | | | | | | | |
Full time equivalent employees | | | 4,619 | | | | 4,629 | | | | 4,718 | | | | 4,812 | | | | 5,036 | | | | | * | | | (8 | )% |
| | | | | | | | | | | | | | | | | | | | | | | | | | | | |
NM - Not meaningful
* Amount is less than one percent.
Certain previously reported amounts have been reclassified to agree with current presentation.
| (a) | Restricted balances parenthetically presented are as of June 30, 2012. |
| (b) | In 2Q12, the process for identifying current junior liens behind delinquent or modified first liens for nonaccrual status was refined. Q1 consumer NPLs have been represented to agree with Q2 presentation. |
| (c) | NPAs related to the loan portfolio over period-end loans plus foreclosed real estate and other assets. |
| (d) | Calculated using net income. |
| (e) | Calculated using net income available to common shareholders. |
| (f) | Net interest margin is computed using total net interest income adjusted for FTE. |
| (g) | Refer to the Non-GAAP to GAAP Reconciliation on page 27 of this financial supplement. |
| (h) | Ratio excludes securities gains/(losses). |
| (i) | Noninterest expense divided by total revenue excluding securities gains/(losses). |
7
CONSOLIDATED INCOME STATEMENT
Quarterly, Unaudited
| | | | | | | | | | | | | | | | | | | | | | | | | | | | |
| | | | | | | | | | | | | | | | | | 2Q12 Change vs. | |
| (Thousands) | | 2Q12 | | | 1Q12 | | | 4Q11 | | | 3Q11 | | | 2Q11 | | | 1Q12 | | | 2Q11 | |
Interest income | | $ | 200,735 | | | $ | 201,503 | | | $ | 209,715 | | | $ | 208,360 | | | $ | 206,757 | | | | | * | | | (3 | )% |
Less: interest expense | | | 28,060 | | | | 29,574 | | | | 30,838 | | | | 32,020 | | | | 33,897 | | | | (5 | )% | | | (17 | )% |
| | | | | | | | | | | | | | | | | | | | | | | | | | | | |
Net interest income | | | 172,675 | | | | 171,929 | | | | 178,877 | | | | 176,340 | | | | 172,860 | | | | | * | | | | * |
Provision for loan losses (a) | | | 15,000 | | | | 8,000 | | | | 10,000 | | | | 32,000 | | | | 1,000 | | | | 88 | % | | | NM | |
| | | | | | | | | | | | | | | | | | | | | | | | | | | | |
Net interest income after provision for loan losses | | | 157,675 | | | | 163,929 | | | | 168,877 | | | | 144,340 | | | | 171,860 | | | | (4 | )% | | | (8 | )% |
| | | | | | | | | | | | | | | | | | | | | | | | | | | | |
Noninterest income: | | | | | | | | | | | | | | | | | | | | | | | | | | | | |
Capital markets | | | 74,913 | | | | 106,743 | | | | 87,756 | | | | 99,557 | | | | 77,921 | | | | (30 | )% | | | (4 | )% |
Mortgage banking | | | 9,889 | | | | 23,341 | | | | 18,008 | | | | 12,751 | | | | 32,101 | | | | (58 | )% | | | (69 | )% |
Deposit transactions and cash management (b) | | | 30,123 | | | | 28,741 | | | | 31,349 | | | | 35,701 | | | | 34,726 | | | | 5 | % | | | (13 | )% |
Trust services and investment management | | | 6,477 | | | | 5,808 | | | | 5,822 | | | | 6,086 | | | | 6,684 | | | | 12 | % | | | (3 | )% |
Brokerage management fees and commissions | | | 8,759 | | | | 8,496 | | | | 7,572 | | | | 9,576 | | | | 7,662 | | | | 3 | % | | | 14 | % |
Insurance commissions | | | 830 | | | | 568 | | | | 1,399 | | | | 739 | | | | 764 | | | | 46 | % | | | 9 | % |
Securities gains/(losses), net (c) | | | 5,065 | | | | 328 | | | | 203 | | | | 35,162 | | | | 1 | | | | NM | | | | NM | |
Gain on divestiture | | | — | | | | 200 | | | | — | | | | — | | | | — | | | | NM | | | | | * |
Other | | | 22,851 | | | | 28,216 | | | | 29,087 | | | | 21,315 | | | | 27,734 | | | | (19 | )% | | | (18 | )% |
| | | | | | | | | | | | | | | | | | | | | | | | | | | | |
Total noninterest income | | | 158,907 | | | | 202,441 | | | | 181,196 | | | | 220,887 | | | | 187,593 | | | | (22 | )% | | | (15 | )% |
| | | | | | | | | | | | | | | | | | | | | | | | | | | | |
Adjusted gross income after provision for loan losses | | | 316,582 | | | | 366,370 | | | | 350,073 | | | | 365,227 | | | | 359,453 | | | | (14 | )% | | | (12 | )% |
| | | | | | | | | | | | | | | | | | | | | | | | | | | | |
Noninterest expense: | | | | | | | | | | | | | | | | | | | | | | | | | | | | |
Employee compensation, incentives, and benefits | | | 149,616 | | | | 175,458 | | | | 149,013 | | | | 153,540 | | | | 151,160 | | | | (15 | )% | | | (1 | )% |
Repurchase and foreclosure provision (d) | | | 250,000 | | | | 49,256 | | | | 45,033 | | | | 52,791 | | | | 24,563 | | | | NM | | | | NM | |
Operations services | | | 9,477 | | | | 9,127 | | | | 10,601 | | | | 11,978 | | | | 13,907 | | | | 4 | % | | | (32 | )% |
Occupancy | | | 11,486 | | | | 12,119 | | | | 12,168 | | | | 13,523 | | | | 13,061 | | | | (5 | )% | | | (12 | )% |
Legal and professional fees | | | 8,417 | | | | 6,067 | | | | 12,708 | | | | 18,132 | | | | 20,451 | | | | 39 | % | | | (59 | )% |
FDIC premium expense | | | 6,801 | | | | 6,336 | | | | 5,504 | | | | 5,904 | | | | 8,839 | | | | 7 | % | | | (23 | )% |
Computer software | | | 9,960 | | | | 9,465 | | | | 9,507 | | | | 8,689 | | | | 8,375 | | | | 5 | % | | | 19 | % |
Contract employment and outsourcing (e) | | | 10,844 | | | | 11,115 | | | | 12,514 | | | | 14,352 | | | | 8,142 | | | | (2 | )% | | | 33 | % |
Equipment rentals, depreciation, and maintenance | | | 7,789 | | | | 7,616 | | | | 7,748 | | | | 8,795 | | | | 8,481 | | | | 2 | % | | | (8 | )% |
Foreclosed real estate | | | 1,908 | | | | 4,170 | | | | 4,793 | | | | 4,691 | | | | 5,803 | | | | (54 | )% | | | (67 | )% |
Communications and courier | | | 4,484 | | | | 4,499 | | | | 4,384 | | | | 4,428 | | | | 5,069 | | | | | * | | | (12 | )% |
Miscellaneous loan costs | | | 1,298 | | | | 1,327 | | | | 1,354 | | | | 959 | | | | 859 | | | | (2 | )% | | | 51 | % |
Amortization of intangible assets | | | 979 | | | | 973 | | | | 1,000 | | | | 1,004 | | | | 1,006 | | | | 1 | % | | | (3 | )% |
Other (f) (g) | | | 54,118 | | | | 24,466 | | | | 35,709 | | | | 23,922 | | | | 74,739 | | | | NM | | | | (28 | )% |
| | | | | | | | | | | | | | | | | | | | | | | | | | | | |
Total noninterest expense | | | 527,177 | | | | 321,994 | | | | 312,036 | | | | 322,708 | | | | 344,455 | | | | 64 | % | | | 53 | % |
| | | | | | | | | | | | | | | | | | | | | | | | | | | | |
Income/(loss) before income taxes | | | (210,595 | ) | | | 44,376 | | | | 38,037 | | | | 42,519 | | | | 14,998 | | | | NM | | | | NM | |
Provision/(benefit) for income taxes | | | (88,178 | ) | | | 10,570 | | | | (526 | ) | | | 8,367 | | | | (4,167 | ) | | | NM | | | | NM | |
| | | | | | | | | | | | | | | | | | | | | | | | | | | | |
Income/(loss) from continuing operations | | | (122,417 | ) | | | 33,806 | | | | 38,563 | | | | 34,152 | | | | 19,165 | | | | NM | | | | NM | |
Income/(loss) from discontinued operations, net of tax | | | 487 | | | | (435 | ) | | | (752 | ) | | | 4,828 | | | | 3,671 | | | | NM | | | | (87 | )% |
| | | | | | | | | | | | | | | | | | | | | | | | | | | | |
Net income/(loss) | | | (121,930 | ) | | | 33,371 | | | | 37,811 | | | | 38,980 | | | | 22,836 | | | | NM | | | | NM | |
| | | | | | | | | | | | | | | | | | | | | | | | | | | | |
Net income attributable to noncontrolling interest | | | 2,844 | | | | 2,844 | | | | 2,871 | | | | 2,875 | | | | 2,844 | | | | | * | | | | * |
| | | | | | | | | | | | | | | | | | | | | | | | | | | | |
Net income/(loss) available to common shareholders | | $ | (124,774 | ) | | $ | 30,527 | | | $ | 34,940 | | | $ | 36,105 | | | $ | 19,992 | | | | NM | | | | NM | |
| | | | | | | | | | | | | | | | | | | | | | | | | | | | |
NM - Not meaningful
* Amount is less than one percent.
Certain previously reported amounts have been reclassified to agree with current presentation.
| (a) | 3Q11 includes approximately $36 million of losses on sales of nonperforming loans. |
| (b) | Fees impacted by the Durbin Amendment which became effective in 4Q11 resulting in lower interchange income. |
| (c) | 2Q12 includes a $5.1 million gain on sale of venture capital investment; 3Q11 includes a $35.1 million gain associated with the sale of a portion of Visa Class B Shares. |
| (d) | 2Q12 includes $250.0 million charge to the repurchase and foreclosure provision primarily related to a revision in estimate based on new information received from a GSE. |
| (e) | Beginning in 3Q11, FHN transitioned to a new mortgage subservicer resulting in elevated base servicing costs. |
| (f) | 4Q11 includes an $8.3 million increase in derivative liabilities associated with prior sales of Visa shares related to the decline in the conversion ratio for Visa Class B shares. |
| (g) | 2Q12 includes $22.0 million loss accrual related to pending legal matters, $3.4 million in ancillary expenses associated with legacy mortgage wind-down activities, and $2.8 million related to the write-off of unrecoverable servicing advances; 2Q11 includes $36.7 million associated with a litigation settlement. |
8
OTHER INCOME AND OTHER EXPENSE
Quarterly, Unaudited
| | | | | | | | | | | | | | | | | | | | | | | | | | | | |
| | | | | | | | | | | | | | | | | | 2Q12 Changes vs. | |
| (Thousands) | | 2Q12 | | | 1Q12 | | | 4Q11 | | | 3Q11 | | | 2Q11 | | | 1Q12 | | | 2Q11 | |
Other Income | | | | | | | | | | | | | | | | | | | | | | | | | | | | |
Bank owned life insurance | | $ | 4,659 | | | $ | 4,772 | | | $ | 4,764 | | | $ | 5,116 | | | $ | 4,920 | | | | (2 | )% | | | (5 | )% |
Bankcard income (a) | | | 5,705 | | | | 5,615 | | | | 7,259 | | | | 5,258 | | | | 5,151 | | | | 2 | % | | | 11 | % |
ATM interchange fees (b) | | | 2,669 | | | | 2,556 | | | | 2,655 | | | | 3,709 | | | | 3,791 | | | | 4 | % | | | (30 | )% |
Other service charges | | | 3,212 | | | | 3,293 | | | | 3,541 | | | | 2,969 | | | | 2,819 | | | | (2 | )% | | | 14 | % |
Electronic banking fees | | | 1,632 | | | | 1,706 | | | | 1,546 | | | | 1,609 | | | | 1,536 | | | | (4 | )% | | | 6 | % |
Letter of credit fees | | | 1,560 | | | | 1,334 | | | | 1,230 | | | | 1,407 | | | | 1,869 | | | | 17 | % | | | (17 | )% |
Deferred compensation (c) | | | (1,020 | ) | | | 3,119 | | | | 376 | | | | (2,093 | ) | | | 221 | | | | NM | | | | NM | |
Other (d) | | | 4,434 | | | | 5,821 | | | | 7,716 | | | | 3,340 | | | | 7,427 | | | | (24 | )% | | | (40 | )% |
| | | | | | | | | | | | | | | | | | | | | | | | | | | | |
Total | | $ | 22,851 | | | $ | 28,216 | | | $ | 29,087 | | | $ | 21,315 | | | $ | 27,734 | | | | (19 | )% | | | (18 | )% |
| | | | | | | | | | | | | | | | | | | | | | | | | | | | |
| | | | | | | |
Other Expense | | | | | | | | | | | | | | | | | | | | | | | | | | | | |
Losses from litigation and regulatory matters (e) | | $ | 22,100 | | | $ | 153 | | | $ | 694 | | | $ | — | | | $ | 38,260 | | | | NM | | | | (42 | )% |
Advertising and public relations | | | 3,153 | | | | 4,250 | | | | 4,965 | | | | 4,571 | | | | 3,558 | | | | (26 | )% | | | (11 | )% |
Low income housing expense | | | 4,214 | | | | 4,608 | | | | 5,974 | | | | 4,712 | | | | 4,973 | | | | (9 | )% | | | (15 | )% |
Other insurance and taxes | | | 3,130 | | | | 3,199 | | | | 3,395 | | | | 3,352 | | | | 3,507 | | | | (2 | )% | | | (11 | )% |
Travel and entertainment | | | 2,435 | | | | 1,864 | | | | 2,342 | | | | 2,075 | | | | 2,137 | | | | 31 | % | | | 14 | % |
Customer relations | | | 1,348 | | | | 855 | | | | 1,301 | | | | 1,185 | | | | 1,152 | | | | 58 | % | | | 17 | % |
Employee training and dues | | | 1,230 | | | | 1,092 | | | | 1,172 | | | | 1,009 | | | | 1,342 | | | | 13 | % | | | (8 | )% |
Supplies | | | 817 | | | | 1,033 | | | | 953 | | | | 1,092 | | | | 792 | | | | (21 | )% | | | 3 | % |
Bank examination costs | | | 800 | | | | 799 | | | | 1,127 | | | | 1,138 | | | | 1,117 | | | | | * | | | (28 | )% |
Loan insurance expense | | | 636 | | | | 589 | | | | 676 | | | | 744 | | | | 706 | | | | 8 | % | | | (10 | )% |
Federal services fees | | | 328 | | | | 321 | | | | 342 | | | | 338 | | | | 291 | | | | 2 | % | | | 13 | % |
Other (f) (g) | | | 13,927 | | | | 5,703 | | | | 12,768 | | | | 3,706 | | | | 16,904 | | | | NM | | | | (18 | )% |
| | | | | | | | | | | | | | | | | | | | | | | | | | | | |
Total | | $ | 54,118 | | | $ | 24,466 | | | $ | 35,709 | | | $ | 23,922 | | | $ | 74,739 | | | | NM | | | | (28 | )% |
| | | | | | | | | | | | | | | | | | | | | | | | | | | | |
NM - Not meaningful
* Amount is less than one percent.
| (a) | 4Q11 includes $2.0 million related to Visa volume incentives. |
| (b) | Fees primarily impacted by the Durbin Amendment which became effective in 4Q11 resulting in lower interchange income. |
| (c) | Amounts driven by market conditions and are mirrored by changes in deferred compensation expense which is included in employee compensation expense. |
| (d) | 1Q12 includes $2.3 million associated with resolution of a legal matter. 4Q11 includes $4.0 million of interest related to a tax refund. |
| (e) | 2Q12 includes $22.0 million loss accrual related to pending legal matters; 2Q11 includes $36.7 million associated with a litigation settlement. |
| (f) | 4Q11 includes an $8.3 million increase in derivative liabilities associated with prior sales of Visa shares related to the decline in the conversion ratio for Visa Class B shares. |
| (g) | 2Q12 includes $3.4 million in ancillary expenses associated with legacy mortgage wind-down activities and $2.8 million related to the write-off of unrecoverable servicing advances. |
9
CONSOLIDATED PERIOD-END BALANCE SHEET
Quarterly, Unaudited
| | | | | | | | | | | | | | | | | | | | | | | | | | | | |
| | | | | | | | | | | | | | | | | | 2Q12 Changes vs. | |
| (Thousands) | | 2Q12 | | | 1Q12 | | | 4Q11 | | | 3Q11 | | | 2Q11 | | | 1Q12 | | | 2Q11 | |
Assets | | | | | | | | | | | | | | | | | | | | | | | | | | | | |
Investment securities | | $ | 3,264,866 | | | $ | 3,296,603 | | | $ | 3,066,272 | | | $ | 3,327,846 | | | $ | 3,230,477 | | | | (1 | )% | | | 1 | % |
Loans held-for-sale | | | 424,051 | | | | 431,905 | | | | 413,897 | | | | 386,147 | | | | 397,931 | | | | (2 | )% | | | 7 | % |
Loans, net of unearned income (Restricted—$.1 billion) (a) | | | 16,185,763 | | | | 15,971,330 | | | | 16,397,127 | | | | 16,241,402 | | | | 16,061,646 | | | | 1 | % | | | 1 | % |
Federal funds sold and securities purchased under agreements to resell | | | 525,504 | | | | 614,705 | | | | 443,588 | | | | 719,400 | | | | 598,000 | | | | (15 | )% | | | (12 | )% |
Interest-bearing cash (b) | | | 484,430 | | | | 761,098 | | | | 452,856 | | | | 358,537 | | | | 263,441 | | | | (36 | )% | | | 84 | % |
Trading securities | | | 1,361,717 | | | | 1,238,041 | | | | 988,217 | | | | 1,227,197 | | | | 1,196,380 | | | | 10 | % | | | 14 | % |
| | | | | | | | | | | | | | | | | | | | | | | | | | | | |
Total earning assets | | | 22,246,331 | | | | 22,313,682 | | | | 21,761,957 | | | | 22,260,529 | | | | 21,747,875 | | | | | * | | | 2 | % |
| | | | | | | | | | | | | | | | | | | | | | | | | | | | |
Cash and due from banks | | | 330,931 | | | | 349,604 | | | | 384,667 | | | | 339,895 | | | | 313,416 | | | | (5 | )% | | | 6 | % |
Capital markets receivables | | | 377,496 | | | | 522,001 | | | | 164,987 | | | | 521,198 | | | | 625,243 | | | | (28 | )% | | | (40 | )% |
Mortgage servicing rights, net | | | 129,291 | | | | 142,956 | | | | 144,069 | | | | 150,803 | | | | 186,958 | | | | (10 | )% | | | (31 | )% |
Goodwill | | | 134,242 | | | | 134,242 | | | | 133,659 | | | | 133,659 | | | | 135,683 | | | | | * | | | (1 | )% |
Other intangible assets, net | | | 24,659 | | | | 25,638 | | | | 26,243 | | | | 27,243 | | | | 28,384 | | | | (4 | )% | | | (13 | )% |
Premises and equipment, net | | | 311,753 | | | | 314,903 | | | | 321,253 | | | | 326,667 | | | | 330,392 | | | | (1 | )% | | | (6 | )% |
Real estate acquired by foreclosure (c) | | | 69,603 | | | | 78,947 | | | | 85,244 | | | | 91,492 | | | | 92,662 | | | | (12 | )% | | | (25 | )% |
Allowance for loan losses (Restricted—$6.0 million) (a) | | | (321,051 | ) | | | (346,016 | ) | | | (384,351 | ) | | | (449,645 | ) | | | (524,091 | ) | | | (7 | )% | | | (39 | )% |
Other assets (Restricted—$2.6 million) (a) | | | 2,189,700 | | | | 2,143,012 | | | | 2,151,656 | | | | 2,169,628 | | | | 2,117,544 | | | | 2 | % | | | 3 | % |
| | | | | | | | | | | | | | | | | | | | | | | | | | | | |
Total assets (Restricted—$.1 billion) (a) | | $ | 25,492,955 | | | $ | 25,678,969 | | | $ | 24,789,384 | | | $ | 25,571,469 | | | $ | 25,054,066 | | | | (1 | )% | | | 2 | % |
| | | | | | | | | | | | | | | | | | | | | | | | | | | | |
| | | | | | | |
Liabilities and Equity | | | | | | | | | | | | | | | | | | | | | | | | | | | | |
Deposits | | | | | | | | | | | | | | | | | | | | | | | | | | | | |
Savings | | $ | 5,979,874 | | | $ | 6,615,289 | | | $ | 6,624,405 | | | $ | 6,467,377 | | | $ | 6,382,963 | | | | (10 | )% | | | (6 | )% |
Other interest-bearing deposits | | | 3,565,873 | | | | 3,500,445 | | | | 3,193,697 | | | | 3,096,621 | | | | 2,784,787 | | | | 2 | % | | | 28 | % |
Time deposits | | | 1,109,163 | | | | 1,142,249 | | | | 1,173,375 | | | | 1,210,661 | | | | 1,277,905 | | | | (3 | )% | | | (13 | )% |
| | | | | | | | | | | | | | | | | | | | | | | | | | | | |
Total interest-bearing core deposits | | | 10,654,910 | | | | 11,257,983 | | | | 10,991,477 | | | | 10,774,659 | | | | 10,445,655 | | | | (5 | )% | | | 2 | % |
Noninterest-bearing deposits | | | 4,833,994 | | | | 4,969,597 | | | | 4,613,014 | | | | 4,412,375 | | | | 4,937,103 | | | | (3 | )% | | | (2 | )% |
| | | | | | | | | | | | | | | | | | | | | | | | | | | | |
Total core deposits (d) | | | 15,488,904 | | | | 16,227,580 | | | | 15,604,491 | | | | 15,187,034 | | | | 15,382,758 | | | | (5 | )% | | | 1 | % |
| | | | | | | | | | | | | | | | | | | | | | | | | | | | |
Certificates of deposit $100,000 and more | | | 628,539 | | | | 707,590 | | | | 608,518 | | | | 511,221 | | | | 513,269 | | | | (11 | )% | | | 22 | % |
| | | | | | | | | | | | | | | | | | | | | | | | | | | | |
Total deposits | | | 16,117,443 | | | | 16,935,170 | | | | 16,213,009 | | | | 15,698,255 | | | | 15,896,027 | | | | (5 | )% | | | 1 | % |
| | | | | | | | | | | | | | | | | | | | | | | | | | | | |
Federal funds purchased and securities sold under agreements to repurchase | | | 1,780,990 | | | | 1,801,234 | | | | 1,887,052 | | | | 2,101,953 | | | | 2,005,999 | | | | (1 | )% | | | (11 | )% |
Trading liabilities | | | 470,631 | | | | 567,571 | | | | 347,285 | | | | 471,120 | | | | 498,915 | | | | (17 | )% | | | (6 | )% |
Other short-term borrowings (e) | | | 1,094,179 | | | | 181,570 | | | | 172,550 | | | | 621,998 | | | | 187,902 | | | | NM | | | | NM | |
Term borrowings (Restricted—$ .1 billion) (a) | | | 2,294,224 | | | | 2,340,706 | | | | 2,481,660 | | | | 2,509,804 | | | | 2,502,517 | | | | (2 | )% | | | (8 | )% |
Capital markets payables | | | 203,548 | | | | 361,018 | | | | 164,708 | | | | 509,164 | | | | 464,993 | | | | (44 | )% | | | (56 | )% |
Other liabilities | | | 1,017,534 | | | | 817,527 | | | | 838,483 | | | | 915,945 | | | | 816,331 | | | | 24 | % | | | 25 | % |
| | | | | | | | | | | | | | | | | | | | | | | | | | | | |
Total liabilities (Restricted—$ .1 billion) (a) | | | 22,978,549 | | | | 23,004,796 | | | | 22,104,747 | | | | 22,828,239 | | | | 22,372,684 | | | | | * | | | 3 | % |
| | | | | | | | | | | | | | | | | | | | | | | | | | | | |
Equity | | | | | | | | | | | | | | | | | | | | | | | | | | | | |
Common stock(f) | | | 155,506 | | | | 157,917 | | | | 160,918 | | | | 164,762 | | | | 164,812 | | | | (2 | )% | | | (6 | )% |
Capital surplus(f) | | | 1,528,161 | | | | 1,560,343 | | | | 1,601,346 | | | | 1,641,878 | | | | 1,638,423 | | | | (2 | )% | | | (7 | )% |
Undivided profits | | | 658,157 | | | | 785,361 | | | | 757,364 | | | | 724,977 | | | | 691,490 | | | | (16 | )% | | | (5 | )% |
Accumulated other comprehensive loss, net | | | (122,583 | ) | | | (124,613 | ) | | | (130,156 | ) | | | (83,552 | ) | | | (108,508 | ) | | | (2 | )% | | | 13 | % |
Noncontrolling interest(g) | | | 295,165 | | | | 295,165 | | | | 295,165 | | | | 295,165 | | | | 295,165 | | | | | * | | | | * |
| | | | | | | | | | | | | | | | | | | | | | | | | | | | |
Total equity | | | 2,514,406 | | | | 2,674,173 | | | | 2,684,637 | | | | 2,743,230 | | | | 2,681,382 | | | | (6 | )% | | | (6 | )% |
| | | | | | | | | | | | | | | | | | | | | | | | | | | | |
Total liabilities and equity | | $ | 25,492,955 | | | $ | 25,678,969 | | | $ | 24,789,384 | | | $ | 25,571,469 | | | $ | 25,054,066 | | | | (1 | )% | | | 2 | % |
| | | | | | | | | | | | | | | | | | | | | | | | | | | | |
NM - Not meaningful
* Amount is less than one percent.
| (a) | Restricted balances parenthetically presented are as of June 30, 2012. |
| (b) | Includes excess balances held at Fed. |
| (c) | 2Q12 includes $20.7 million of foreclosed assets related to government insured mortgages. |
| (d) | 2Q12 average core deposits were $15.6 billion. |
| (e) | 2Q12 includes increased FHLB borrowings as a result of deposit fluctuations and an increase in loans to mortgage companies near the end of the quarter. |
| (f) | Decreases in 2Q12, 1Q12 and 4Q11 relate to shares purchased under the share repurchase program. |
| (g) | Consists of preferred stock of subsidiary. |
10
CONSOLIDATED AVERAGE BALANCE SHEET
Quarterly, Unaudited
| | | | | | | | | | | | | | | | | | | | | | | | | | | | |
| | | | | | | | | | | | | | | | | | 2Q12 Change vs. | |
| (Thousands) | | 2Q12 | | | 1Q12 | | | 4Q11 | | | 3Q11 | | | 2Q11 | | | 1Q12 | | | 2Q11 | |
Assets: | | | | | | | | | | | | | | | | | | | | | | | | | | | | |
Earning assets: | | | | | | | | | | | | | | | | | | | | | | | | | | | | |
Loans, net of unearned income: | | | | | | | | | | | | | | | | | | | | | | | | | | | | |
Commercial, financial, and industrial (C&I) | | $ | 7,712,551 | | | $ | 7,709,856 | | | $ | 7,740,802 | | | $ | 7,181,058 | | | $ | 6,867,893 | | | | | * | | | 12 | % |
Income CRE | | | 1,236,016 | | | | 1,255,713 | | | | 1,295,079 | | | | 1,308,059 | | | | 1,362,459 | | | | (2 | )% | | | (9 | )% |
Residential CRE | | | 94,531 | | | | 111,823 | | | | 132,669 | | | | 169,049 | | | | 203,721 | | | | (15 | )% | | | (54 | )% |
Consumer real estate | | | 5,406,435 | | | | 5,290,632 | | | | 5,295,881 | | | | 5,346,893 | | | | 5,436,358 | | | | 2 | % | | | (1 | )% |
Permanent mortgage | | | 755,391 | | | | 771,187 | | | | 814,335 | | | | 985,359 | | | | 1,009,804 | | | | (2 | )% | | | (25 | )% |
Credit card and other | | | 276,017 | | | | 279,150 | | | | 289,189 | | | | 292,800 | | | | 299,904 | | | | (1 | )% | | | (8 | )% |
Restricted and secured real estate loans | | | 479,327 | | | | 622,931 | | | | 654,142 | | | | 681,469 | | | | 708,966 | | | | (23 | )% | | | (32 | )% |
| | | | | | | | | | | | | | | | | | | | | | | | | | | | |
Total loans, net of unearned income (Restricted - $ .1 billion) (a) (b) | | | 15,960,268 | | | | 16,041,292 | | | | 16,222,097 | | | | 15,964,687 | | | | 15,889,105 | | | | (1 | )% | | | | * |
| | | | | | | | | | | | | | | | | | | | | | | | | | | | |
Loans held-for-sale | | | 425,176 | | | | 424,086 | | | | 399,271 | | | | 384,108 | | | | 366,557 | | | | | * | | | 16 | % |
Investment securities: | | | | | | | | | | | | | | | | | | | | | | | | | | | | |
U.S. treasuries | | | 42,424 | | | | 40,088 | | | | 42,935 | | | | 43,812 | | | | 62,970 | | | | 6 | % | | | (33 | )% |
U.S. government agencies | | | 2,981,090 | | | | 2,802,651 | | | | 2,919,690 | | | | 2,990,375 | | | | 2,938,623 | | | | 6 | % | | | 1 | % |
States and municipalities | | | 18,005 | | | | 18,070 | | | | 17,681 | | | | 19,365 | | | | 23,869 | | | | | * | | | (25 | )% |
Other | | | 223,924 | | | | 224,000 | | | | 224,530 | | | | 221,664 | | | | 220,440 | | | | | * | | | 2 | % |
| | | | | | | | | | | | | | | | | | | | | | | | | | | | |
Total investment securities | | | 3,265,443 | | | | 3,084,809 | | | | 3,204,836 | | | | 3,275,216 | | | | 3,245,902 | | | | 6 | % | | | 1 | % |
| | | | | | | | | | | | | | | | | | | | | | | | | | | | |
Capital markets securities inventory | | | 1,327,596 | | | | 1,277,372 | | | | 1,263,427 | | | | 1,250,249 | | | | 1,235,642 | | | | 4 | % | | | 7 | % |
Mortgage banking trading securities | | | 22,841 | | | | 25,797 | | | | 26,927 | | | | 30,320 | | | | 32,263 | | | | (11 | )% | | | (29 | )% |
Other earning assets: | | | | | | | | | | | | | | | | | | | | | | | | | | | | |
Federal funds sold and securities purchased under agreements to resell | | | 632,019 | | | | 632,972 | | | | 641,464 | | | | 660,048 | | | | 653,984 | | | | | * | | | (3 | )% |
Interest-bearing cash (c) | | | 518,124 | | | | 821,113 | | | | 479,621 | | | | 403,482 | | | | 381,586 | | | | (37 | )% | | | 36 | % |
| | | | | | | | | | | | | | | | | | | | | | | | | | | | |
Total other earning assets | | | 1,150,143 | | | | 1,454,085 | | | | 1,121,085 | | | | 1,063,530 | | | | 1,035,570 | | | | (21 | )% | | | 11 | % |
| | | | | | | | | | | | | | | | | | | | | | | | | | | | |
Total earning assets (Restricted—$ .1 billion) (a) | | | 22,151,467 | | | | 22,307,441 | | | | 22,237,643 | | | | 21,968,110 | | | | 21,805,039 | | | | (1 | )% | | | 2 | % |
| | | | | | | | | | | | | | | | | | | | | | | | | | | | |
Allowance for loan losses (Restricted—$ 8.2 million) (a) | | | (336,642 | ) | | | (372,264 | ) | | | (424,774 | ) | | | (507,478 | ) | | | (567,923 | ) | | | (10 | )% | | | (41 | )% |
Cash and due from banks (Restricted—$ 1.5 million) (a) | | | 337,366 | | | | 351,760 | | | | 337,755 | | | | 346,100 | | | | 343,162 | | | | (4 | )% | | | (2 | )% |
Capital markets receivables | | | 100,408 | | | | 91,430 | | | | 108,815 | | | | 124,192 | | | | 112,289 | | | | 10 | % | | | (11 | )% |
Premises and equipment, net | | | 312,313 | | | | 317,621 | | | | 323,569 | | | | 328,172 | | | | 324,584 | | | | (2 | )% | | | (4 | )% |
Other assets (Restricted—$ 3.5 million) (a) | | | 2,449,723 | | | | 2,504,385 | | | | 2,479,298 | | | | 2,519,020 | | | | 2,500,864 | | | | (2 | )% | | | (2 | )% |
| | | | | | | | | | | | | | | | | | | | | | | | | | | | |
Total assets (Restricted—$ .1 billion) (a) | | $ | 25,014,635 | | | $ | 25,200,373 | | | $ | 25,062,306 | | | $ | 24,778,116 | | | $ | 24,518,015 | | | | (1 | )% | | | 2 | % |
| | | | | | | | | | | | | | | | | | | | | | | | | | | | |
Liabilities and equity: | | | | | | | | | | | | | | | | | | | | | | | | | | | | |
Interest-bearing liabilities: | | | | | | | | | | | | | | | | | | | | | | | | | | | | |
Interest-bearing deposits: | | | | | | | | | | | | | | | | | | | | | | | | | | | | |
Other interest-bearing deposits | | $ | 3,512,390 | | | $ | 3,246,658 | | | $ | 2,991,676 | | | $ | 2,900,808 | | | $ | 2,673,090 | | | | 8 | % | | | 31 | % |
Savings | | | 6,290,143 | | | | 6,690,470 | | | | 6,559,779 | | | | 6,479,880 | | | | 6,320,779 | | | | (6 | )% | | | | * |
Time deposits | | | 1,125,738 | | | | 1,155,716 | | | | 1,190,464 | | | | 1,244,602 | | | | 1,315,764 | | | | (3 | )% | | | (14 | )% |
| | | | | | | | | | | | | | | | | | | | | | | | | | | | |
Total interest-bearing core deposits | | | 10,928,271 | | | | 11,092,844 | | | | 10,741,919 | | | | 10,625,290 | | | | 10,309,633 | | | | (1 | )% | | | 6 | % |
Certificates of deposit $100,000 and more | | | 675,688 | | | | 660,256 | | | | 544,394 | | | | 507,086 | | | | 547,262 | | | | 2 | % | | | 23 | % |
Federal funds purchased and securities sold under agreements to repurchase | | | 1,879,252 | | | | 2,003,566 | | | | 2,170,222 | | | | 2,081,379 | | | | 2,130,832 | | | | (6 | )% | | | (12 | )% |
Capital markets trading liabilities | | | 602,344 | | | | 614,084 | | | | 629,019 | | | | 626,982 | | | | 620,726 | | | | (2 | )% | | | (3 | )% |
Other short-term borrowings | | | 377,075 | | | | 182,083 | | | | 362,579 | | | | 284,163 | | | | 340,015 | | | | NM | | | | 11 | % |
Term borrowings (Restricted—$ .1 billion) (a) | | | 2,317,247 | | | | 2,457,291 | | | | 2,506,088 | | | | 2,491,227 | | | | 2,499,794 | | | | (6 | )% | | | (7 | )% |
| | | | | | | | | | | | | | | | | | | | | | | | | | | | |
Total interest-bearing liabilities | | | 16,779,877 | | | | 17,010,124 | | | | 16,954,221 | | | | 16,616,127 | | | | 16,448,262 | | | | (1 | )% | | | 2 | % |
| | | | | | | | | | | | | | | | | | | | | | | | | | | | |
Noninterest-bearing deposits | | | 4,696,844 | | | | 4,623,457 | | | | 4,519,590 | | | | 4,546,876 | | | | 4,574,342 | | | | 2 | % | | | 3 | % |
Capital markets payables | | | 73,312 | | | | 71,180 | | | | 68,662 | | | | 102,831 | | | | 79,463 | | | | 3 | % | | | (8 | )% |
Other liabilities | | | 786,886 | | | | 814,417 | | | | 785,356 | | | | 789,190 | | | | 735,786 | | | | (3 | )% | | | 7 | % |
Equity | | | 2,677,716 | | | | 2,681,195 | | | | 2,734,477 | | | | 2,723,092 | | | | 2,680,162 | | | | | * | | | | * |
| | | | | | | | | | | | | | | | | | | | | | | | | | | | |
Total liabilities and equity (Restricted—$ .1 billion) (a) | | $ | 25,014,635 | | | $ | 25,200,373 | | | $ | 25,062,306 | | | $ | 24,778,116 | | | $ | 24,518,015 | | | | (1 | )% | | | 2 | % |
| | | | | | | | | | | | | | | | | | | | | | | | | | | | |
NM - Not meaningful
* Amount is less than one percent.
| (a) | Restricted balances parenthetically presented are quarterly averages as of June 30, 2012. |
| (b) | Includes loans on nonaccrual status. |
| (c) | Includes excess balances held at Fed. |
11
CONSOLIDATED NET INTEREST INCOME (a)
Quarterly, Unaudited
| | | | | | | | | | | | | | | | | | | | | | | | | | | | |
| | | | | | | | | | | | | | | | | | 2Q12 Changes vs. | |
| (Thousands) | | 2Q12 | | | 1Q12 | | | 4Q11 | | | 3Q11 | | | 2Q11 | | | 1Q12 | | | 2Q11 | |
Interest Income: | | | | | | | | | | | | | | | | | | | | | | | | | | | | |
Loans, net of unearned income (b) | | $ | 162,698 | | | $ | 163,070 | | | $ | 169,169 | | | $ | 163,774 | | | $ | 162,281 | | | | | * | | | | * |
Loans held-for-sale | | | 3,628 | | | | 3,738 | | | | 3,859 | | | | 5,126 | | | | 3,267 | | | | (3 | )% | | | 11 | % |
Investment securities: | | | | | | | | | | | | | | | | | | | | | | | | | | | | |
U.S. treasuries | | | 39 | | | | 66 | | | | 67 | | | | 66 | | | | 88 | | | | (41 | )% | | | (56 | )% |
U.S. government agencies | | | 23,562 | | | | 23,768 | | | | 25,262 | | | | 27,615 | | | | 28,643 | | | | (1 | )% | | | (18 | )% |
States and municipalities | | | 63 | | | | 76 | | | | 99 | | | | 116 | | | | 197 | | | | (17 | )% | | | (68 | )% |
Other | | | 2,324 | | | | 2,422 | | | | 2,264 | | | | 2,249 | | | | 2,390 | | | | (4 | )% | | | (3 | )% |
| | | | | | | | | | | | | | | | | | | | | | | | | | | | |
Total investment securities | | | 25,988 | | | | 26,332 | | | | 27,692 | | | | 30,046 | | | | 31,318 | | | | (1 | )% | | | (17 | )% |
| | | | | | | | | | | | | | | | | | | | | | | | | | | | |
Capital markets securities inventory | | | 9,204 | | | | 8,934 | | | | 9,789 | | | | 10,141 | | | | 10,479 | | | | 3 | % | | | (12 | )% |
Mortgage banking trading securities | | | 578 | | | | 642 | | | | 675 | | | | 706 | | | | 821 | | | | (10 | )% | | | (30 | )% |
Other earning assets: | | | | | | | | | | | | | | | | | | | | | | | | | | | | |
Federal funds sold and securities purchased under agreements to resell (c) | | | 115 | | | | — | | | | (32 | ) | | | (58 | ) | | | (93 | ) | | | NM | | | | NM | |
Interest-bearing cash | | | 280 | | | | 446 | | | | 213 | | | | 180 | | | | 181 | | | | (37 | )% | | | 55 | % |
| | | | | | | | | | | | | | | | | | | | | | | | | | | | |
Total other earning assets | | | 395 | | | | 446 | | | | 181 | | | | 122 | | | | 88 | | | | (11 | )% | | | NM | |
| | | | | | | | | | | | | | | | | | | | | | | | | | | | |
Interest income | | $ | 202,491 | | | $ | 203,162 | | | $ | 211,365 | | | $ | 209,915 | | | $ | 208,254 | | | | | * | | | (3 | )% |
| | | | | | | | | | | | | | | | | | | | | | | | | | | | |
| | | | | | | |
Interest Expense: | | | | | | | | | | | | | | | | | | | | | | | | | | | | |
Interest-bearing deposits: | | | | | | | | | | | | | | | | | | | | | | | | | | | | |
Other interest-bearing deposits | | $ | 1,655 | | | $ | 1,518 | | | $ | 1,407 | | | $ | 1,650 | | | $ | 1,638 | | | | 9 | % | | | 1 | % |
Savings | | | 4,744 | | | | 5,619 | | | | 5,921 | | | | 6,773 | | | | 7,018 | | | | (16 | )% | | | (32 | )% |
Time deposits | | | 5,541 | | | | 5,916 | | | | 6,363 | | | | 7,096 | | | | 7,783 | | | | (6 | )% | | | (29 | )% |
| | | | | | | | | | | | | | | | | | | | | | | | | | | | |
Total interest-bearing core deposits | | | 11,940 | | | | 13,053 | | | | 13,691 | | | | 15,519 | | | | 16,439 | | | | (9 | )% | | | (27 | )% |
Certificates of deposit $100,000 and more | | | 2,305 | | | | 2,306 | | | | 2,166 | | | | 2,328 | | | | 2,612 | | | | | * | | | (12 | )% |
Federal funds purchased and securities sold under agreements to repurchase | | | 1,114 | | | | 1,223 | | | | 1,269 | | | | 1,159 | | | | 1,237 | | | | (9 | )% | | | (10 | )% |
Capital markets trading liabilities | | | 2,843 | | | | 2,515 | | | | 3,363 | | | | 3,703 | | | | 4,102 | | | | 13 | % | | | (31 | )% |
Other short-term borrowings | | | 36 | | | | 142 | | | | 171 | | | | 230 | | | | 233 | | | | (75 | )% | | | (85 | )% |
Term borrowings | | | 9,822 | | | | 10,335 | | | | 10,178 | | | | 9,081 | | | | 9,274 | | | | (5 | )% | | | 6 | % |
| | | | | | | | | | | | | | | | | | | | | | | | | | | | |
Interest expense | | | 28,060 | | | | 29,574 | | | | 30,838 | | | | 32,020 | | | | 33,897 | | | | (5 | )% | | | (17 | )% |
| | | | | | | | | | | | | | | | | | | | | | | | | | | | |
Net interest income—tax equivalent basis | | | 174,431 | | | | 173,588 | | | | 180,527 | | | | 177,895 | | | | 174,357 | | | | | * | | | | * |
Fully taxable equivalent adjustment | | | (1,756 | ) | | | (1,659 | ) | | | (1,650 | ) | | | (1,555 | ) | | | (1,497 | ) | | | 6 | % | | | 17 | % |
| | | | | | | | | | | | | | | | | | | | | | | | | | | | |
Net interest income | | $ | 172,675 | | | $ | 171,929 | | | $ | 178,877 | | | $ | 176,340 | | | $ | 172,860 | | | | | * | | | | * |
| | | | | | | | | | | | | | | | | | | | | | | | | | | | |
NM - Not meaningful
* Amount is less than one percent.
Certain previously reported amounts have been reclassified to agree with current presentation.
| (a) | Net interest income adjusted to a fully taxable equivalent (“FTE”) basis. |
| (b) | Includes loans on nonaccrual status. |
| (c) | 4Q11, 3Q11 and 2Q11 driven by negative market rates on reverse repurchase agreements. |
12
CONSOLIDATED AVERAGE BALANCE SHEET: YIELDS AND RATES
Quarterly, Unaudited
| | | | | | | | | | | | | | | | | | | | |
| (Thousands) | | 2Q12 | | | 1Q12 | | | 4Q11 | | | 3Q11 | | | 2Q11 | |
Assets: | | | | | | | | | | | | | | | | | | | | |
Earning assets (a): | | | | | | | | | | | | | | | | | | | | |
Loans, net of unearned income: | | | | | | | | | | | | | | | | | | | | |
Commercial loans | | | 3.92 | % | | | 3.90 | % | | | 3.95 | % | | | 3.84 | % | | | 3.90 | % |
Retail loans | | | 4.33 | | | | 4.32 | | | | 4.42 | | | | 4.37 | | | | 4.31 | |
| | | | | | | | | | | | | | | | | | | | |
Total loans, net of unearned income (b) | | | 4.09 | | | | 4.08 | | | | 4.15 | | | | 4.08 | | | | 4.09 | |
| | | | | | | | | | | | | | | | | | | | |
Loans held-for-sale | | | 3.41 | | | | 3.53 | | | | 3.87 | | | | 5.34 | | | | 3.57 | |
Investment securities: | | | | | | | | | | | | | | | | | | | | |
U.S. treasuries | | | 0.37 | | | | 0.66 | | | | 0.62 | | | | 0.60 | | | | 0.56 | |
U.S. government agencies | | | 3.16 | | | | 3.39 | | | | 3.46 | | | | 3.69 | | | | 3.90 | |
States and municipalities | | | 1.39 | | | | 1.68 | | | | 2.23 | | | | 2.39 | | | | 3.29 | |
Other | | | 4.15 | | | | 4.33 | | | | 4.03 | | | | 4.06 | | | | 4.34 | |
| | | | | | | | | | | | | | | | | | | | |
Total investment securities | | | 3.18 | | | | 3.41 | | | | 3.46 | | | | 3.67 | | | | 3.86 | |
| | | | | | | | | | | | | | | | | | | | |
Capital markets securities inventory | | | 2.77 | | | | 2.80 | | | | 3.10 | | | | 3.24 | | | | 3.39 | |
Mortgage banking trading securities | | | 10.12 | | | | 9.96 | | | | 10.03 | | | | 9.31 | | | | 10.17 | |
Other earning assets: | | | | | | | | | | | | | | | | | | | | |
Federal funds sold and securities purchased under agreements to resell (c) | | | .07 | | | | — | | | | (0.02 | ) | | | (0.03 | ) | | | (0.06 | ) |
Interest-bearing cash | | | 0.22 | | | | 0.22 | | | | 0.18 | | | | 0.18 | | | | 0.19 | |
| | | | | | | | | | | | | | | | | | | | |
Total other earning assets | | | 0.14 | | | | 0.12 | | | | 0.06 | | | | 0.05 | | | | 0.03 | |
| | | | | | | | | | | | | | | | | | | | |
Interest income/total earning assets | | | 3.67 | % | | | 3.65 | % | | | 3.78 | % | | | 3.80 | % | | | 3.83 | % |
| | | | | | | | | | | | | | | | | | | | |
Liabilities: | | | | | | | | | | | | | | | | | | | | |
Interest-bearing liabilities: | | | | | | | | | | | | | | | | | | | | |
Interest-bearing deposits: | | | | | | | | | | | | | | | | | | | | |
Other interest-bearing deposits | | | 0.19 | % | | | 0.19 | % | | | 0.19 | % | | | 0.23 | % | | | 0.25 | % |
Savings | | | 0.30 | | | | 0.34 | | | | 0.36 | | | | 0.41 | | | | 0.45 | |
Time deposits | | | 1.98 | | | | 2.06 | | | | 2.12 | | | | 2.26 | | | | 2.37 | |
| | | | | | | | | | | | | | | | | | | | |
Total interest-bearing core deposits | | | 0.44 | | | | 0.47 | | | | 0.51 | | | | 0.58 | | | | 0.64 | |
Certificates of deposit $100,000 and more | | | 1.37 | | | | 1.40 | | | | 1.58 | | | | 1.82 | | | | 1.91 | |
Federal funds purchased and securities sold under agreements to repurchase | | | 0.24 | | | | 0.25 | | | | 0.23 | | | | 0.22 | | | | 0.23 | |
Capital markets trading liabilities | | | 1.90 | | | | 1.65 | | | | 2.12 | | | | 2.34 | | | | 2.65 | |
Other short-term borrowings | | | 0.04 | | | | 0.31 | | | | 0.19 | | | | 0.32 | | | | 0.27 | |
Term borrowings (d) | | | 1.70 | | | | 1.68 | | | | 1.63 | | | | 1.46 | | | | 1.49 | |
| | | | | | | | | | | | | | | | | | | | |
Interest expense / total interest-bearing liabilities | | | 0.67 | | | | 0.70 | | | | 0.72 | | | | 0.77 | | | | 0.83 | |
| | | | | | | | | | | | | | | | | | | | |
Net interest spread | | | 3.00 | % | | | 2.95 | % | | | 3.06 | % | | | 3.03 | % | | | 3.00 | % |
Effect of interest-free sources used to fund earning assets | | | 0.16 | | | | 0.17 | | | | 0.17 | | | | 0.20 | | | | 0.20 | |
| | | | | | | | | | | | | | | | | | | | |
Net interest margin | | | 3.16 | % | | | 3.12 | % | | | 3.23 | % | | | 3.23 | % | | | 3.20 | % |
| | | | | | | | | | | | | | | | | | | | |
Yields are adjusted to a fully taxable equivalent (“FTE”) basis. Refer to the Non-GAAP to GAAP Reconciliation on page 27 for reconciliation of net interest income (GAAP) to net interest income adjusted for impact of FTE—(non-GAAP).
| (a) | Earning assets yields are expressed net of unearned income. |
| (b) | Includes loans on nonaccrual status. |
| (c) | 4Q11, 3Q11 and 2Q11 driven by negative market rates on reverse repurchase agreements. |
| (d) | Rates are expressed net of unamortized debenture cost for term borrowings. |
13
MORTGAGE SERVICING RIGHTS
Quarterly, Unaudited
| | | | | | | | | | | | | | | | | | | | | | | | | | | | |
| | | | | | | | | | | | | | | | | | 2Q12 Changes vs. | |
| (Thousands) | | 2Q12 | | | 1Q12 | | | 4Q11 | | | 3Q11 | | | 2Q11 | | | 1Q12 | | | 2Q11 | |
First Liens | | | | | | | | | | | | | | | | | | | | | | | | | | | | |
Fair value beginning balance | | $ | 139,676 | | | $ | 140,724 | | | $ | 147,431 | | | $ | 183,530 | | | $ | 204,257 | | | | | | | | | |
Reductions due to loan payments | | | (6,665 | ) | | | (5,499 | ) | | | (3,567 | ) | | | (5,286 | ) | | | (5,522 | ) | | | | | | | | |
Reductions due to exercise of cleanup calls | | | — | | | | — | | | | — | | | | — | | | | (195 | ) | | | | | | | | |
Changes in fair value due to: | | | | | | | | | | | | | | | | | | | | | | | | | | | | |
Changes in valuation model inputs or assumptions (a) | | | (6,855 | ) | | | 4,459 | | | | (3,140 | ) | | | (30,813 | ) | | | (15,010 | ) | | | | | | | | |
Other changes in fair value | | | (71 | ) | | | (8 | ) | | | — | | | | — | | | | — | | | | | | | | | |
| | | | | | | | | | | | | | | | | | | | | | | | | | | | |
Fair value ending balance | | $ | 126,085 | | | $ | 139,676 | | | $ | 140,724 | | | $ | 147,431 | | | $ | 183,530 | | | | (10 | )% | | | (31 | )% |
| | | | | | | | | | | | | | | | | | | | | | | | | | | | |
Second Liens | | | | | | | | | | | | | | | | | | | | | | | | | | | | |
Fair value beginning balance | | $ | 222 | | | $ | 231 | | | $ | 241 | | | $ | 251 | | | $ | 259 | | | | | | | | | |
Reductions due to loan payments | | | (7 | ) | | | (9 | ) | | | (10 | ) | | | (10 | ) | | | (8 | ) | | | | | | | | |
| | | | | | | | | | | | | | | | | | | | | | | | | | | | |
Fair value ending balance | | $ | 215 | | | $ | 222 | | | $ | 231 | | | $ | 241 | | | $ | 251 | | | | (3 | )% | | | (14 | )% |
| | | | | | | | | | | | | | | | | | | | | | | | | | | | |
HELOC | | | | | | | | | | | | | | | | | | | | | | | | | | | | |
Fair value beginning balance | | $ | 3,058 | | | $ | 3,114 | | | $ | 3,131 | | | $ | 3,177 | | | $ | 3,232 | | | | | | | | | |
Reductions due to loan payments | | | (79 | ) | | | (76 | ) | | | (54 | ) | | | (59 | ) | | | (59 | ) | | | | | | | | |
Changes in fair value due to: | | | | | | | | | | | | | | | | | | | | | | | | | | | | |
Other changes in fair value | | | 12 | | | | 20 | | | | 37 | | | | 13 | | | | 4 | | | | | | | | | |
| | | | | | | | | | | | | | | | | | | | | | | | | | | | |
Fair value ending balance | | $ | 2,991 | | | $ | 3,058 | | | $ | 3,114 | | | $ | 3,131 | | | $ | 3,177 | | | | (2 | )% | | | (6 | )% |
| | | | | | | | | | | | | | | | | | | | | | | | | | | | |
Total Consolidated | | | | | | | | | | | | | | | | | | | | | | | | | | | | |
Fair value beginning balance | | $ | 142,956 | | | $ | 144,069 | | | $ | 150,803 | | | $ | 186,958 | | | $ | 207,748 | | | | | | | | | |
Reductions due to loan payments | | | (6,751 | ) | | | (5,584 | ) | | | (3,631 | ) | | | (5,355 | ) | | | (5,589 | ) | | | | | | | | |
Reductions due to exercise of cleanup calls | | | — | | | | — | | | | — | | | | — | | | | (195 | ) | | | | | | | | |
Changes in fair value due to: | | | | | | | | | | | | | | | | | | | | | | | | | | | | |
Changes in valuation model inputs or assumptions (a) | | | (6,855 | ) | | | 4,459 | | | | (3,140 | ) | | | (30,813 | ) | | | (15,010 | ) | | | | | | | | |
Other changes in fair value | | | (59 | ) | | | 12 | | | | 37 | | | | 13 | | | | 4 | | | | | | | | | |
| | | | | | | | | | | | | | | | | | | | | | | | | | | | |
Fair value ending balance | | $ | 129,291 | | | $ | 142,956 | | | $ | 144,069 | | | $ | 150,803 | | | $ | 186,958 | | | | (10 | )% | | | (31 | )% |
| | | | | | | | | | | | | | | | | | | | | | | | | | | | |
| (a) | Principally reflects changes in discount rates and prepayment speed assumptions, mostly due to changes in interest rates. |
14
BUSINESS SEGMENT HIGHLIGHTS
Quarterly, Unaudited
| | | | | | | | | | | | | | | | | | | | | | | | | | | | |
| | | | | | | | | | | | | | | | | | 2Q12 change vs. | |
| (Thousands) | | 2Q12 | | | 1Q12 | | | 4Q11 | | | 3Q11 | | | 2Q11 | | | 1Q12 | | | 2Q11 | |
Regional Banking | | | | | | | | | | | | | | | | | | | | | | | | | | | | |
Net interest income | | $ | 147,204 | | | $ | 146,073 | | | $ | 149,597 | | | $ | 140,072 | | | $ | 135,583 | | | | 1 | % | | | 9 | % |
Noninterest income | | | 64,838 | | | | 59,901 | | | | 64,559 | | | | 68,096 | | | | 67,853 | | | | 8 | % | | | (4 | )% |
| | | | | | | | | | | | | | | | | | | | | | | | | | | | |
Total revenues | | | 212,042 | | | | 205,974 | | | | 214,156 | | | | 208,168 | | | | 203,436 | | | | 3 | % | | | 4 | % |
Provision/(provision credit) for loan losses | | | 4,828 | | | | (7,426 | ) | | | (12,654 | ) | | | (22,698 | ) | | | (13,748 | ) | | | NM | | | | NM | |
Noninterest expense | | | 142,428 | | | | 139,359 | | | | 136,428 | | | | 137,294 | | | | 143,346 | | | | 2 | % | | | (1 | )% |
| | | | | | | | | | | | | | | | | | | | | | | | | | | | |
Income before income taxes | | | 64,786 | | | | 74,041 | | | | 90,382 | | | | 93,572 | | | | 73,838 | | | | (12 | )% | | | (12 | )% |
Provision for income taxes | | | 23,362 | | | | 27,013 | | | | 33,287 | | | | 34,592 | | | | 27,075 | | | | (14 | )% | | | (14 | )% |
| | | | | | | | | | | | | | | | | | | | | | | | | | | | |
Net income | | $ | 41,424 | | | $ | 47,028 | | | $ | 57,095 | | | $ | 58,980 | | | $ | 46,763 | | | | (12 | )% | | | (11 | )% |
| | | | | | | | | | | | | | | | | | | | | | | | | | | | |
Capital Markets | | | | | | | | | | | | | | | | | | | | | | | | | | | | |
Net interest income | | $ | 5,613 | | | $ | 5,684 | | | $ | 5,527 | | | $ | 5,552 | | | $ | 5,509 | | | | (1 | )% | | | 2 | % |
Noninterest income | | | 74,964 | | | | 106,775 | | | | 88,230 | | | | 99,505 | | | | 77,925 | | | | (30 | )% | | | (4 | )% |
| | | | | | | | | | | | | | | | | | | | | | | | | | | | |
Total revenues | | | 80,577 | | | | 112,459 | | | | 93,757 | | | | 105,057 | | | | 83,434 | | | | (28 | )% | | | (3 | )% |
Noninterest expense (a) | | | 60,886 | | | | 80,302 | | | | 66,721 | | | | 77,168 | | | | 103,383 | | | | (24 | )% | | | (41 | )% |
| | | | | | | | | | | | | | | | | | | | | | | | | | | | |
Income/(loss) before income taxes | | | 19,691 | | | | 32,157 | | | | 27,036 | | | | 27,889 | | | | (19,949 | ) | | | (39 | )% | | | NM | |
Provision/(benefit) for income taxes | | | 7,421 | | | | 12,240 | | | | 10,302 | | | | 10,656 | | | | (7,756 | ) | | | (39 | )% | | | NM | |
| | | | | | | | | | | | | | | | | | | | | | | | | | | | |
Net income/(loss) | | $ | 12,270 | | | $ | 19,917 | | | $ | 16,734 | | | $ | 17,233 | | | $ | (12,193 | ) | | | (38 | )% | | | NM | |
| | | | | | | | | | | | | | | | | | | | | | | | | | | | |
Corporate | | | | | | | | | | | | | | | | | | | | | | | | | | | | |
Net interest income/(expense) | | $ | (4,110 | ) | | $ | (4,727 | ) | | $ | (3,764 | ) | | $ | (494 | ) | | $ | 412 | | | | 13 | % | | | NM | |
Noninterest income | | | 3,838 | | | | 9,266 | | | | 9,865 | | | | 37,914 | | | | 8,850 | | | | (59 | )% | | | (57 | )% |
| | | | | | | | | | | | | | | | | | | | | | | | | | | | |
Total revenues | | | (272 | ) | | | 4,539 | | | | 6,101 | | | | 37,420 | | | | 9,262 | | | | NM | | | | NM | |
Noninterest expense | | | 19,374 | | | | 22,521 | | | | 29,244 | | | | 19,013 | | | | 36,287 | | | | (14 | )% | | | (47 | )% |
| | | | | | | | | | | | | | | | | | | | | | | | | | | | |
Income/(loss) before income taxes | | | (19,646 | ) | | | (17,982 | ) | | | (23,143 | ) | | | 18,407 | | | | (27,025 | ) | | | (9 | )% | | | 27 | % |
Provision/(benefit) for income taxes | | | (12,922 | ) | | | (11,805 | ) | | | (22,464 | ) | | | 599 | | | | (18,917 | ) | | | (9 | )% | | | 32 | % |
| | | | | | | | | | | | | | | | | | | | | | | | | | | | |
Net income/(loss) | | $ | (6,724 | ) | | $ | (6,177 | ) | | $ | (679 | ) | | $ | 17,808 | | | $ | (8,108 | ) | | | (9 | )% | | | 17 | % |
| | | | | | | | | | | | | | | | | | | | | | | | | | | | |
Non-Strategic | | | | | | | | | | | | | | | | | | | | | | | | | | | | |
Net interest income | | $ | 23,968 | | | $ | 24,899 | | | $ | 27,517 | | | $ | 31,210 | | | $ | 31,356 | | | | (4 | )% | | | (24 | )% |
Noninterest income | | | 15,267 | | | | 26,499 | | | | 18,542 | | | | 15,372 | | | | 32,965 | | | | (42 | )% | | | (54 | )% |
| | | | | | | | | | | | | | | | | | | | | | | | | | | | |
Total revenues | | | 39,235 | | | | 51,398 | | | | 46,059 | | | | 46,582 | | | | 64,321 | | | | (24 | )% | | | (39 | )% |
Provision for loan losses | | | 10,172 | | | | 15,426 | | | | 22,654 | | | | 54,698 | | | | 14,748 | | | | (34 | )% | | | (31 | )% |
Noninterest expense (b) (c) | | | 304,489 | | | | 79,812 | | | | 79,643 | | | | 89,233 | | | | 61,439 | | | | NM | | | | NM | |
| | | | | | | | | | | | | | | | | | | | | | | | | | | | |
Loss before income taxes | | | (275,426 | ) | | | (43,840 | ) | | | (56,238 | ) | | | (97,349 | ) | | | (11,866 | ) | | | NM | | | | NM | |
Benefit for income taxes | | | (106,039 | ) | | | (16,878 | ) | | | (21,651 | ) | | | (37,480 | ) | | | (4,569 | ) | | | NM | | | | NM | |
| | | | | | | | | | | | | | | | | | | | | | | | | | | | |
Loss from continuing operations | | | (169,387 | ) | | | (26,962 | ) | | | (34,587 | ) | | | (59,869 | ) | | | (7,297 | ) | | | NM | | | | NM | |
Income/(loss) from discontinued operations, net of tax | | | 487 | | | | (435 | ) | | | (752 | ) | | | 4,828 | | | | 3,671 | | | | NM | | | | (87 | )% |
| | | | | | | | | | | | | | | | | | | | | | | | | | | | |
Net loss | | $ | (168,900 | ) | | $ | (27,397 | ) | | $ | (35,339 | ) | | $ | (55,041 | ) | | $ | (3,626 | ) | | | NM | | | | NM | |
| | | | | | | | | | | | | | | | | | | | | | | | | | | | |
Total Consolidated | | | | | | | | | | | | | | | | | | | | | | | | | | | | |
Net interest income | | $ | 172,675 | | | $ | 171,929 | | | $ | 178,877 | | | $ | 176,340 | | | $ | 172,860 | | | | | * | | | | * |
Noninterest income | | | 158,907 | | | | 202,441 | | | | 181,196 | | | | 220,887 | | | | 187,593 | | | | (22 | )% | | | (15 | )% |
| | | | | | | | | | | | | | | | | | | | | | | | | | | | |
Total revenues | | | 331,582 | | | | 374,370 | | | | 360,073 | | | | 397,227 | | | | 360,453 | | | | (11 | )% | | | (8 | )% |
Provision for loan losses | | | 15,000 | | | | 8,000 | | | | 10,000 | | | | 32,000 | | | | 1,000 | | | | 88 | % | | | NM | |
Noninterest expense | | | 527,177 | | | | 321,994 | | | | 312,036 | | | | 322,708 | | | | 344,455 | | | | 64 | % | | | 53 | % |
| | | | | | | | | | | | | | | | | | | | | | | | | | | | |
Income/(loss) before income taxes | | | (210,595 | ) | | | 44,376 | | | | 38,037 | | | | 42,519 | | | | 14,998 | | | | NM | | | | NM | |
Provision/(benefit) for income taxes | | | (88,178 | ) | | | 10,570 | | | | (526 | ) | | | 8,367 | | | | (4,167 | ) | | | NM | | | | NM | |
| | | | | | | | | | | | | | | | | | | | | | | | | | | | |
Income/(loss) from continuing operations | | | (122,417 | ) | | | 33,806 | | | | 38,563 | | | | 34,152 | | | | 19,165 | | | | NM | | | | NM | |
Income/(loss) from discontinued operations, net of tax | | | 487 | | | | (435 | ) | | | (752 | ) | | | 4,828 | | | | 3,671 | | | | NM | | | | (87 | )% |
| | | | | | | | | | | | | | | | | | | | | | | | | | | | |
Net income | | $ | (121,930 | ) | | $ | 33,371 | | | $ | 37,811 | | | $ | 38,980 | | | $ | 22,836 | | | | NM | | | | NM | |
| | | | | | | | | | | | | | | | | | | | | | | | | | | | |
NM - Not meaningful
* Amount is less than one percent.
Certain previously reported amounts have been reclassified to agree with current presentation.
| (a) | 2Q11 includes $36.7 million associated with a litigation settlement. |
| (b) | 2Q12 includes $250.0 million charge to the repurchase and foreclosure provision primarily related to a revision in estimate based on new information received from Fannie Mae. |
| (c) | 2Q12 includes $22.0 million loss accrual related to pending legal matters. |
15
REGIONAL BANKING
Quarterly, Unaudited
| | | | | | | | | | | | | | | | | | | | | | | | | | | | |
| | | | | | | | | | | | | | | | | | 2Q12 Changes vs. | |
| | | 2Q12 | | | 1Q12 | | | 4Q11 | | | 3Q11 | | | 2Q11 | | | 1Q12 | | | 2Q11 | |
Income Statement (thousands) | | | | | | | | | | | | | | | | | | | | | | | | | | | | |
Net interest income | | $ | 147,204 | | | $ | 146,073 | | | $ | 149,597 | | | $ | 140,072 | | | $ | 135,583 | | | | 1 | % | | | 9 | % |
Provision for loan losses | | | 4,828 | | | | (7,426 | ) | | | (12,654 | ) | | | (22,698 | ) | | | (13,748 | ) | | | NM | | | | NM | |
Noninterest income | | | 64,838 | | | | 59,901 | | | | 64,559 | | | | 68,096 | | | | 67,853 | | | | 8 | % | | | (4 | )% |
Noninterest expense: | | | | | | | | | | | | | | | | | | | | | | | | | | | | |
Employee compensation, incentives, and benefits | | | 57,020 | | | | 57,116 | | | | 54,212 | | | | 55,892 | | | | 58,170 | | | | | * | | | (2 | )% |
Other (a) | | | 85,408 | | | | 82,243 | | | | 82,216 | | | | 81,402 | | | | 85,176 | | | | 4 | % | | | | * |
| | | | | | | | | | | | | | | | | | | | | | | | | | | | |
Total noninterest expense | | | 142,428 | | | | 139,359 | | | | 136,428 | | | | 137,294 | | | | 143,346 | | | | 2 | % | | | (1 | )% |
| | | | | | | | | | | | | | | | | | | | | | | | | | | | |
Income before income taxes | | $ | 64,786 | | | $ | 74,041 | | | $ | 90,382 | | | $ | 93,572 | | | $ | 73,838 | | | | (12 | )% | | | (12 | )% |
| | | | | | | | | | | | | | | | | | | | | | | | | | | | |
Efficiency ratio (b) | | | 67.17 | % | | | 67.66 | % | | | 63.70 | % | | | 65.95 | % | | | 70.46 | % | | | | | | | | |
| | | | | | | | | | | | | | | | | | | | | | | | | | | | |
| | | | | | | |
Balance Sheet (millions) | | | | | | | | | | | | | | | | | | | | | | | | | | | | |
Average loans | | $ | 11,650 | | | $ | 11,533 | | | $ | 11,509 | | | $ | 10,891 | | | $ | 10,572 | | | | 1 | % | | | 10 | % |
Average other earning assets | | | 63 | | | | 51 | | | | 56 | | | | 57 | | | | 57 | | | | 24 | % | | | 11 | % |
Total average earning assets | | | 11,713 | | | | 11,584 | | | | 11,565 | | | | 10,948 | | | | 10,629 | | | | 1 | % | | | 10 | % |
Average core deposits | | | 14,413 | | | | 13,991 | | | | 13,402 | | | | 13,078 | | | | 12,736 | | | | 3 | % | | | 13 | % |
Average other deposits | | | 676 | | | | 660 | | | | 544 | | | | 507 | | | | 547 | | | | 2 | % | | | 24 | % |
Total average deposits | | | 15,089 | | | | 14,651 | | | | 13,946 | | | | 13,585 | | | | 13,283 | | | | 3 | % | | | 14 | % |
Total period-end deposits | | | 15,192 | | | | 15,344 | | | | 14,470 | | | | 13,729 | | | | 13,664 | | | | (1 | )% | | | 11 | % |
Total period-end assets | | | 12,757 | | | | 12,334 | | | | 12,586 | | | | 12,116 | | | | 11,461 | | | | 3 | % | | | 11 | % |
| | | | | | | | | | | | | | | | | | | | | | | | | | | | |
Net interest margin (c) | | | 5.11 | % | | | 5.12 | % | | | 5.19 | % | | | 5.13 | % | | | 5.17 | % | | | | | | | | |
Loan yield | | | 3.91 | | | | 3.95 | | | | 3.97 | | | | 3.98 | | | | 3.98 | | | | | | | | | |
Deposit average yield | | | 0.36 | | | | 0.39 | | | | 0.41 | | | | 0.48 | | | | 0.54 | | | | | | | | | |
| | | | | | | | | | | | | | | | | | | | | | | | | | | | |
| | | | | | | |
Noninterest Income Detail (thousands) | | | | | | | | | | | | | | | | | | | | | | | | | | | | |
NSF / Overdraft fees (d) | | $ | 12,263 | | | $ | 11,282 | | | $ | 13,466 | | | $ | 14,239 | | | $ | 13,316 | | | | 9 | % | | | (8 | )% |
Cash management fees | | | 9,179 | | | | 8,856 | | | | 9,339 | | | | 9,206 | | | | 9,536 | | | | 4 | % | | | (4 | )% |
Debit card income | | | 2,780 | | | | 2,552 | | | | 2,523 | | | | 6,826 | | | | 6,941 | | | | 9 | % | | | (60 | )% |
Other | | | 5,799 | | | | 5,952 | | | | 5,906 | | | | 5,256 | | | | 4,738 | | | | (3 | )% | | | 22 | % |
| | | | | | | | | | | | | | | | | | | | | | | | | | | | |
Total deposit transactions and cash management | | | 30,021 | | | | 28,642 | | | | 31,234 | | | | 35,527 | | | | 34,531 | | | | 5 | % | | | (13 | )% |
Insurance commissions | | | 824 | | | | 562 | | | | 1,392 | | | | 732 | | | | 756 | | | | 47 | % | | | 9 | % |
Trust services and investment management | | | 6,493 | | | | 5,824 | | | | 5,837 | | | | 6,098 | | | | 6,714 | | | | 11 | % | | | (3 | )% |
Bankcard income (e) | | | 5,504 | | | | 5,457 | | | | 7,025 | | | | 5,025 | | | | 4,912 | | | | 1 | % | | | 12 | % |
Mortgage banking | | | 1,092 | | | | 859 | | | | 1,389 | | | | 1,121 | | | | 947 | | | | 27 | % | | | 15 | % |
Other service charges | | | 2,643 | | | | 2,770 | | | | 2,662 | | | | 2,605 | | | | 2,513 | | | | (5 | )% | | | 5 | % |
Miscellaneous revenue (f) | | | 18,261 | | | | 15,787 | | | | 15,020 | | | | 16,988 | | | | 17,480 | | | | 16 | % | | | 4 | % |
| | | | | | | | | | | | | | | | | | | | | | | | | | | | |
Total noninterest income | | $ | 64,838 | | | $ | 59,901 | | | $ | 64,559 | | | $ | 68,096 | | | $ | 67,853 | | | | 8 | % | | | (4 | )% |
| | | | | | | | | | | | | | | | | | | | | | | | | | | | |
| | | | | | | |
Key Statistics | | | | | | | | | | | | | | | | | | | | | | | | | | | | |
Financial center locations | | | 173 | | | | 174 | | | | 176 | | | | 176 | | | | 178 | | | | (1 | )% | | | (3 | )% |
Trust assets—total managed assets (millions) | | $ | 3,837 | | | $ | 3,472 | | | $ | 3,345 | | | $ | 3,296 | | | $ | 3,421 | | | | 11 | % | | | 12 | % |
First lien mortgage production (millions) | | $ | 46 | | | $ | 51 | | | $ | 68 | | | $ | 54 | | | $ | 51 | | | | (10 | )% | | | (10 | )% |
| | | | | | | | | | | | | | | | | | | | | | | | | | | | |
NM - Not meaningful
* Amount is less than one percent.
Certain previously reported amounts have been reclassified to agree with current presentation.
| (a) | Includes allocated expenses, primarily company related benefits, technology and credit risk management. |
| (b) | Noninterest expense divided by total revenue. |
| (c) | Net interest margin is computed using total net interest income adjusted for FTE. Refer to the Non-GAAP to GAAP Reconciliation on page 27 of this supplement. |
| (d) | 1Q12 decline primarily attributable to seasonality in NSF fee structure. |
| (e) | 4Q11 includes $2.0 million related to Visa volume incentives. |
| (f) | 2Q12 includes $1.8 million gain related to the sale of a branch. |
16
CAPITAL MARKETS
Quarterly, Unaudited
| | | | | | | | | | | | | | | | | | | | | | | | | | | | |
| | | | | | | | | | | | | | | | | | 2Q12 Change vs. | |
| | | 2Q12 | | | 1Q12 | | | 4Q11 | | | 3Q11 | | | 2Q11 | | | 1Q12 | | | 2Q11 | |
Income Statement (thousands) | | | | | | | | | | | | | | | | | | | | | | | | | | | | |
Net interest income | | $ | 5,613 | | | $ | 5,684 | | | $ | 5,527 | | | $ | 5,552 | | | $ | 5,509 | | | | (1 | )% | | | 2 | % |
Noninterest income: | | | | | | | | | | | | | | | | | | | | | | | | | | | | |
Fixed income | | | 68,168 | | | | 98,553 | | | | 80,741 | | | | 92,624 | | | | 71,164 | | | | (31 | )% | | | (4 | )% |
Other | | | 6,796 | | | | 8,222 | | | | 7,489 | | | | 6,881 | | | | 6,761 | | | | (17 | )% | | | 1 | % |
| | | | | | | | | | | | | | | | | | | | | | | | | | | | |
Total noninterest income | | | 74,964 | | | | 106,775 | | | | 88,230 | | | | 99,505 | | | | 77,925 | | | | (30 | )% | | | (4 | )% |
Noninterest expense (a) | | | 60,886 | | | | 80,302 | | | | 66,721 | | | | 77,168 | | | | 103,383 | | | | (24 | )% | | | (41 | )% |
| | | | | | | | | | | | | | | | | | | | | | | | | | | | |
Income/(loss) before income taxes | | $ | 19,691 | | | $ | 32,157 | | | $ | 27,036 | | | $ | 27,889 | | | $ | (19,949 | ) | | | (39 | )% | | | NM | |
| | | | | | | | | | | | | | | | | | | | | | | | | | | | |
Efficiency ratio (b) | | | 75.56 | % | | | 71.41 | % | | | 71.16 | % | | | 73.45 | % | | | NM | | | | | | | | | |
Fixed income average daily revenue | | $ | 1,082 | | | $ | 1,590 | | | $ | 1,324 | | | $ | 1,447 | | | $ | 1,130 | | | | (32 | )% | | | (4 | )% |
| | | | | | | | | | | | | | | | | | | | | | | | | | | | |
| | | | | | | |
Balance Sheet (millions) | | | | | | | | | | | | | | | | | | | | | | | | | | | | |
Average trading inventory | | $ | 1,328 | | | $ | 1,277 | | | $ | 1,263 | | | $ | 1,250 | | | $ | 1,236 | | | | 4 | % | | | 7 | % |
Average other earning assets | | | 669 | | | | 695 | | | | 686 | | | | 689 | | | | 664 | | | | (4 | )% | | | 1 | % |
Total average earning assets | | | 1,997 | | | | 1,972 | | | | 1,949 | | | | 1,939 | | | | 1,900 | | | | 1 | % | | | 5 | % |
Total period-end assets | | | 2,553 | | | | 2,692 | | | | 1,905 | | | | 2,782 | | | | 2,693 | | | | (5 | )% | | | (5 | )% |
| | | | | | | | | | | | | | | | | | | | | | | | | | | | |
Net interest margin (c) | | | 1.15 | % | | | 1.18 | % | | | 1.16 | % | | | 1.17 | % | | | 1.17 | % | | | | | | | | |
| | | | | | | | | | | | | | | | | | | | | | | | | | | | |
NM - Not meaningful
Certain previously reported amounts have been reclassified to agree with current presentation.
| (a) | 2Q11 includes $36.7 million associated with a litigation settlement. |
| (b) | Noninterest expense divided by total revenue. |
| (c) | Net interest margin is computed using total net interest income adjusted for FTE. Refer to the Non-GAAP to GAAP Reconciliation on page 27 of this supplement. |
17
CORPORATE
Quarterly, Unaudited
| | | | | | | | | | | | | | | | | | | | | | | | | | | | |
| | | | | | | | | | | | | | | | | | 2Q12 Change vs. | |
| | | 2Q12 | | | 1Q12 | | | 4Q11 | | | 3Q11 | | | 2Q11 | | | 1Q12 | | | 2Q11 | |
Income Statement (thousands) | | | | | | | | | | | | | | | | | | | | | | | | | | | | |
Net interest income/(expense) | | $ | (4,110 | ) | | $ | (4,727 | ) | | $ | (3,764 | ) | | $ | (494 | ) | | $ | 412 | | | | 13 | % | | | NM | |
Noninterest income | | | 3,838 | | | | 8,938 | | | | 9,662 | | | | 2,767 | | | | 8,848 | | | | (57 | )% | | | (57 | )% |
Securities gains, net (a) | | | — | | | | 328 | | | | 203 | | | | 35,147 | | | | 2 | | | | NM | | | | NM | |
Noninterest expense (b) | | | 19,374 | | | | 22,521 | | | | 29,244 | | | | 19,013 | | | | 36,287 | | | | (14 | )% | | | (47 | )% |
| | | | | | | | | | | | | | | | | | | | | | | | | | | | |
Income/(loss) before income taxes | | $ | (19,646 | ) | | $ | (17,982 | ) | | $ | (23,143 | ) | | $ | 18,407 | | | $ | (27,025 | ) | | | (9 | )% | | | 27 | % |
| | | | | | | | | | | | | | | | | | | | | | | | | | | | |
| | | | | | | |
Average Balance Sheet (millions) | | | | | | | | | | | | | | | | | | | | | | | | | | | | |
Average loans | | $ | 124 | | | $ | 137 | | | $ | 152 | | | $ | 170 | | | $ | 154 | | | | (9 | )% | | | (19 | )% |
Total earning assets | | $ | 3,884 | | | $ | 4,022 | | | $ | 3,815 | | | $ | 3,812 | | | $ | 3,747 | | | | (3 | )% | | | 4 | % |
Net interest margin (c) | | | (.44 | )% | | | (.49 | )% | | | (.36 | )% | | | (.01 | )% | | | .04 | % | | | | | | | | |
| | | | | | | | | | | | | | | | | | | | | | | | | | | | |
NM - Not meaningful
Certain previously reported amounts have been reclassified to agree with current presentation.
| (a) | 3Q11 includes a $35.1 million gain associated with the sale of a portion of Visa Class B Shares. |
| (b) | 4Q11 includes an $8.3 million increase in derivative liabilities associated with prior sales of Visa shares related to the decline in the conversion ratio for Visa Class B shares. |
| (c) | Net interest margin is computed using total net interest income adjusted for FTE. Refer to the Non-GAAP to GAAP Reconciliation on page 27 of this supplement. |
18
NON-STRATEGIC
Quarterly, Unaudited
| | | | | | | | | | | | | | | | | | | | | | | | | | | | |
| | | | | | | | | | | | | | | | | | 2Q12 Change vs. | |
| | | 2Q12 | | | 1Q12 | | | 4Q11 | | | 3Q11 | | | 2Q11 | | | 1Q12 | | | 2Q11 | |
Income Statement (thousands) | | | | | | | | | | | | | | | | | | | | | | | | | | | | |
Net interest income | | $ | 23,968 | | | $ | 24,899 | | | $ | 27,517 | | | $ | 31,210 | | | $ | 31,356 | | | | (4 | )% | | | (24 | )% |
Noninterest income: | | | | | | | | | | | | | | | | | | | | | | | | | | | | |
Mortgage warehouse valuation | | | 626 | | | | 1,640 | | | | 265 | | | | (7,084 | ) | | | 1,820 | | | | (62 | )% | | | (66 | )% |
Service fees | | | 14,984 | | | | 17,202 | | | | 13,368 | | | | 16,731 | | | | 19,248 | | | | (13 | )% | | | (22 | )% |
Change in MSR value - runoff | | | (6,665 | ) | | | (5,498 | ) | | | (3,567 | ) | | | (5,286 | ) | | | (5,526 | ) | | | (21 | )% | | | (21 | )% |
Net hedging results | | | 1,833 | | | | 9,065 | | | | 5,887 | | | | 7,033 | | | | 15,416 | | | | (80 | )% | | | (88 | )% |
Other income (a) | | | (576 | ) | | | 4,090 | | | | 2,589 | | | | 3,963 | | | | 2,007 | | | | NM | | | | NM | |
| | | | | | | | | | | | | | | | | | | | | | | | | | | | |
Total noninterest income | | | 10,202 | | | | 26,499 | | | | 18,542 | | | | 15,357 | | | | 32,965 | | | | (62 | )% | | | (69 | )% |
Securities gains/(losses), net (b) | | | 5,065 | | | | — | | | | — | | | | 15 | | | | — | | | | NM | | | | NM | |
Noninterest expense: | | | | | | | | | | | | | | | | | | | | | | | | | | | | |
Repurchase and foreclosure provision (c) | | | 250,000 | | | | 49,256 | | | | 45,032 | | | | 52,790 | | | | 24,563 | | | | NM | | | | NM | |
Other expenses (d) | | | 54,489 | | | | 30,556 | | | | 34,611 | | | | 36,443 | | | | 36,876 | | | | 78 | % | | | 48 | % |
| | | | | | | | | | | | | | | | | | | | | | | | | | | | |
Total noninterest expense | | | 304,489 | | | | 79,812 | | | | 79,643 | | | | 89,233 | | | | 61,439 | | | | NM | | | | NM | |
Provision for loan losses | | | 10,172 | | | | 15,426 | | | | 22,654 | | | | 54,698 | | | | 14,748 | | | | (34 | )% | | | (31 | )% |
| | | | | | | | | | | | | | | | | | | | | | | | | | | | |
Loss before income taxes | | $ | (275,426 | ) | | $ | (43,840 | ) | | $ | (56,238 | ) | | $ | (97,349 | ) | | $ | (11,866 | ) | | | NM | | | | NM | |
| | | | | | | | | | | | | | | | | | | | | | | | | | | | |
| | | | | | | |
Average Balance Sheet (millions) | | | | | | | | | | | | | | | | | | | | | | | | | | | | |
Loans | | $ | 4,186 | | | $ | 4,371 | | | $ | 4,562 | | | $ | 4,904 | | | $ | 5,163 | | | | (4 | )% | | | (19 | )% |
Loans held-for-sale | | | 330 | | | | 316 | | | | 304 | | | | 302 | | | | 303 | | | | 4 | % | | | 9 | % |
Trading securities | | | 23 | | | | 26 | | | | 27 | | | | 30 | | | | 32 | | | | (12 | )% | | | (28 | )% |
Mortgage servicing rights | | | 137 | | | | 141 | | | | 149 | | | | 174 | | | | 194 | | | | (3 | )% | | | (29 | )% |
Other assets | | | 304 | | | | 336 | | | | 313 | | | | 422 | | | | 364 | | | | (10 | )% | | | (16 | )% |
Total assets | | | 4,980 | | | | 5,190 | | | | 5,355 | | | | 5,832 | | | | 6,056 | | | | (4 | )% | | | (18 | )% |
Net interest margin (e) | | | 2.11 | % | | | 2.11 | % | | | 2.24 | % | | | 2.36 | % | | | 2.27 | % | | | | | | | | |
Efficiency ratio (f) | | | NM | | | | 155.28 | % | | | 172.92 | % | | | 191.62 | % | | | 95.52 | % | | | | | | | | |
| | | | | | | | | | | | | | | | | | | | | | | | | | | | |
| | | | | | | |
Mortgage Warehouse—Period-end (millions) | | | | | | | | | | | | | | | | | | | | | | | | | | | | |
Ending warehouse balance (loans held-for-sale) | | $ | 336 | | | $ | 323 | | | $ | 310 | | | $ | 299 | | | $ | 307 | | | | 4 | % | | | 9 | % |
| | | | | | | | | | | | | | | | | | | | | | | | | | | | |
| | | | | | | |
Key Servicing Metrics (g) | | | | | | | | | | | | | | | | | | | | | | | | | | | | |
Ending servicing portfolio (millions) (h) | | $ | 20,331 | | | $ | 21,610 | | | $ | 22,749 | | | $ | 24,101 | | | $ | 25,223 | | | | (6 | )% | | | (19 | )% |
Average servicing portfolio (millions) (h) | | | 20,978 | | | | 22,184 | | | | 23,466 | | | | 24,562 | | | | 25,666 | | | | (5 | )% | | | (18 | )% |
Average number of loans serviced (h) | | | 121,818 | | | | 128,068 | | | | 134,490 | | | | 140,270 | | | | 146,520 | | | | (5 | )% | | | (17 | )% |
| | | | | | | | | | | | | | | | | | | | | | | | | | | | |
| | | | | | | |
Portfolio Product Mix (average) (g) | | | | | | | | | | | | | | | | | | | | | | | | | | | | |
GNMA (Ginnie) | | | 3 | % | | | 3 | % | | | 3 | % | | | 3 | % | | | 3 | % | | | | | | | | |
FNMA/FHLMC (Fannie/Freddie) | | | 35 | | | | 35 | | | | 35 | | | | 36 | | | | 36 | | | | | | | | | |
Private | | | 57 | | | | 57 | | | | 57 | | | | 57 | | | | 57 | | | | | | | | | |
| | | | | | | | | | | | | | | | | | | | | | | | | | | | |
Sub-total | | | 95 | | | | 95 | | | | 95 | | | | 96 | | | | 96 | | | | | | | | | |
FHN permanent mortgage portfolio and warehouse | | | 5 | | | | 5 | | | | 5 | | | | 4 | | | | 4 | | | | | | | | | |
| | | | | | | | | | | | | | | | | | | | | | | | | | | | |
Total | | | 100 | % | | | 100 | % | | | 100 | % | | | 100 | % | | | 100 | % | | | | | | | | |
| | | | | | | | | | | | | | | | | | | | | | | | | | | | |
| | | | | | | |
Other Portfolio Statistics | | | | | | | | | | | | | | | | | | | | | | | | | | | | |
Weighted average base servicing fee—legacy mortgage banking (i) | | | 34 | | | | 34 | | | | 34 | | | | 34 | | | | 34 | | | | | | | | | |
Weighted average base servicing fee—legacy equity lending (HELOCs and ILs) | | | 50 | | | | 50 | | | | 50 | | | | 50 | | | | 50 | | | | | | | | | |
Servicing cost per loan (annualized) (j) | | $ | 279.17 | | | $ | 293.33 | | | $ | 295.20 | | | $ | 223.03 | | | $ | 135.34 | | | | | | | | | |
Servicing book value (bps) (k) (l) | | | 71 | | | | 68 | | | | 68 | | | | 75 | | | | 79 | | | | | | | | | |
90+ delinquency rate, excluding foreclosures (m) | | | 10.94 | % | | | 11.54 | % | | | 12.11 | % | | | 12.47 | % | | | 11.35 | % | | | | | | | | |
| | | | | | | | | | | | | | | | | | | | | | | | | | | | |
NM - Not meaningful
* Amount is less than one percent.
Certain previously reported amounts have been reclassified to agree with current presentation.
| (a) | 2Q12 includes a $2.3 million adjustment as a result of contingencies related to prior mortgage servicing sales. |
| (b) | 2Q12 includes a $5.1 million gain on sale of venture capital investment. |
| (c) | 2Q12 represents $250.0 million charge to the repurchase and foreclosure provision primarily related to a revision in estimate based on new information received from a GSE. |
| (d) | 2Q12 includes $22.0 million loss accrual related to pending legal matters, $3.4 million in ancillary expenses associated with legacy mortgage wind-down activities, and $2.8 million related to the write-off of unrecoverable servicing advances. |
| (e) | Net interest margin is computed using total net interest income adjusted for FTE. Refer to the Non-GAAP to GAAP Reconciliation on page 27 of this supplement. |
| (f) | Noninterest expense divided by total revenue excluding securities gains/(losses). |
| (g) | Includes servicing of first liens, second liens, and HELOCs. |
| (h) | Includes mortgage loans serviced from FHN’s legacy mortgage banking business, legacy equity lending serviced for others, and mortgage loans in portfolio and warehouse. Excludes UPB of loans transferred that did not qualify for sales treatment. |
| (i) | Includes weighted average fee of servicing assets and excess interest. |
| (j) | Calculated based on fees charged by subservicer divided by average number of loans serviced during the quarter. |
| (k) | Includes average MSR and mortgage trading securities divided by total average servicing portfolio. |
| (l) | For purposes of this calculation, average MSR excludes servicing transferred that did not qualify for sales treatment due to certain recourse provisions. |
| (m) | Excludes delinquent second liens and HELOCs. |
19
CAPITAL HIGHLIGHTS
Quarterly, Unaudited
| | | | | | | | | | | | | | | | | | | | | | | | | | | | |
| | | | | | | | | | | | | | | | | | 2Q12 Changes vs. | |
| (Dollars in thousands, except per share amounts) | | 2Q12 | | | 1Q12 | | | 4Q11 | | | 3Q11 | | | 2Q11 | | | 1Q12 | | | 2Q11 | |
Tier 1 capital (a) (b) | | $ | 2,626,268 | | | $ | 2,841,064 | | | $ | 2,850,452 | | | $ | 2,875,113 | | | $ | 2,818,535 | | | | (8 | )% | | | (7 | )% |
Tier 2 capital (a) (b) | | $ | 570,560 | | | $ | 687,530 | | | $ | 751,819 | | | $ | 751,227 | | | $ | 748,225 | | | | (17 | )% | | | (24 | )% |
| | | | | | | | | | | | | | | | | | | | | | | | | | | | |
Total capital (a) (b) | | $ | 3,196,828 | | | $ | 3,528,594 | | | $ | 3,602,271 | | | $ | 3,626,340 | | | $ | 3,566,760 | | | | (9 | )% | | | (10 | )% |
| | | | | | | | | | | | | | | | | | | | | | | | | | | | |
Risk weighted assets (“RWA”) (a) | | $ | 20,055,000 | | | $ | 19,783,405 | | | $ | 20,026,412 | | | $ | 19,910,843 | | | $ | 19,589,310 | | | | 1 | % | | | 2 | % |
Tier 1 ratio (a) | | | 13.10 | % | | | 14.36 | % | | | 14.23 | % | | | 14.44 | % | | | 14.39 | % | | | | | | | | |
Tier 2 ratio (a) | | | 2.84 | % | | | 3.48 | % | | | 3.76 | % | | | 3.77 | % | | | 3.82 | % | | | | | | | | |
| | | | | | | | | | | | | | | | | | | | | | | | | | | | |
Total capital ratio (a) | | | 15.94 | % | | | 17.84 | % | | | 17.99 | % | | | 18.21 | % | | | 18.21 | % | | | | | | | | |
| | | | | | | | | | | | | | | | | | | | | | | | | | | | |
Tier 1 common ratio (a) (c) | | | 10.63 | % | | | 11.86 | % | | | 11.76 | % | | | 11.95 | % | | | 11.86 | % | | | | | | | | |
Leverage ratio (a) | | | 10.56 | | | | 11.31 | | | | 11.41 | | | | 11.65 | | | | 11.54 | | | | | | | | | |
Total equity to total assets | | | 9.86 | | | | 10.41 | | | | 10.83 | | | | 10.73 | | | | 10.70 | | | | | | | | | |
Adjusted tangible common equity to risk weighted assets (“TCE/RWA”) (a) (c) (e) | | | 9.96 | | | | 10.88 | | | | 10.80 | | | | 11.09 | | | | 11.05 | | | | | | | | | |
Tangible common equity/tangible assets (“TCE/TA”) (c) (d) | | | 8.13 | | | | 8.70 | | | | 9.05 | | | | 9.00 | | | | 8.93 | | | | | | | | | |
| | | | | | | | | | | | | | | | | | | | | | | | | | | | |
* Amount is less than one percent.
Certain previously reported amounts have been reclassified to agree with current presentation.
| (a) | Current quarter is an estimate. |
| (b) | All quarters presented include $200 million of tier 1 qualifying trust preferred securities. |
| (c) | Refer to the Non-GAAP to GAAP Reconciliation on page 27 of this financial supplement. |
| (d) | Calculated using period-end balances. |
| (e) | See Glossary of Terms for definition of ratios. |
20
ASSET QUALITY: CONSOLIDATED
Quarterly, Unaudited
| | | | | | | | | | | | | | | | | | | | | | | | | | | | |
| | | | | | | | | | | | | | | | | | 2Q12 Changes vs. | |
| (Thousands) | | 2Q12 | | | 1Q12 | | | 4Q11 | | | 3Q11 | | | 2Q11 | | | 1Q12 | | | 2Q11 | |
Allowance for Loan Losses Walk-Forward | | | | | | | | | | | | | | | | | | | | | | | | | | | | |
Beginning reserve | | $ | 346,016 | | | $ | 384,351 | | | $ | 449,645 | | | $ | 524,091 | | | $ | 589,128 | | | | (10 | )% | | | (41 | )% |
Provision | | | 15,000 | | | | 8,000 | | | | 10,000 | | | | 32,000 | | | | 1,000 | | | | 88 | % | | | NM | |
Charge-offs | | | (49,728 | ) | | | (57,083 | ) | | | (85,918 | ) | | | (120,655 | ) | | | (83,344 | ) | | | (13 | )% | | | (40 | )% |
Recoveries | | | 9,763 | | | | 10,748 | | | | 10,624 | | | | 14,209 | | | | 17,307 | | | | (9 | )% | | | (44 | )% |
| | | | | | | | | | | | | | | | | | | | | | | | | | | | |
Ending balance (Restricted - $6.0 million) (a) | | $ | 321,051 | | | $ | 346,016 | | | $ | 384,351 | | | $ | 449,645 | | | $ | 524,091 | | | | (7 | )% | | | (39 | )% |
| | | | | | | | | | | | | | | | | | | | | | | | | | | | |
Reserve for unfunded commitments | | | 4,434 | | | | 5,358 | | | | 6,945 | | | | 9,220 | | | | 12,522 | | | | (17 | )% | | | (65 | )% |
Total allowance for loan losses plus reserve for unfunded commitments | | $ | 325,485 | | | $ | 351,374 | | | $ | 391,296 | | | $ | 458,865 | | | $ | 536,613 | | | | (7 | )% | | | (39 | )% |
| | | | | | | | | | | | | | | | | | | | | | | | | | | | |
| | | | | | | |
Allowance for Loan Losses | | | | | | | | | | | | | | | | | | | | | | | | | | | | |
Regional Banking | | $ | 156,060 | | | $ | 166,115 | | | $ | 187,791 | | | $ | 232,269 | | | $ | 278,693 | | | | (6 | )% | | | (44 | )% |
Non-Strategic | | | 164,991 | | | | 179,901 | | | | 196,560 | | | | 217,376 | | | | 245,398 | | | | (8 | )% | | | (33 | )% |
Corporate (b) | | | NM | | | | NM | | | | NM | | | | NM | | | | NM | | | | NM | | | | NM | |
| | | | | | | | | | | | | | | | | | | | | | | | | | | | |
Total allowance for loan losses | | $ | 321,051 | | | $ | 346,016 | | | $ | 384,351 | | | $ | 449,645 | | | $ | 524,091 | | | | (7 | )% | | | (39 | )% |
| | | | | | | | | | | | | | | | | | | | | | | | | | | | |
| | | | | | | |
Nonperforming Assets | | | | | | | | | | | | | | | | | | | | | | | | | | | | |
Regional Banking | | | | | | | | | | | | | | | | | | | | | | | | | | | | |
Nonperforming loans (c) | | $ | 178,650 | | | $ | 192,560 | | | $ | 199,000 | | | $ | 239,666 | | | $ | 283,754 | | | | (7 | )% | | | (37 | )% |
Foreclosed real estate (g) | | | 17,334 | | | | 18,047 | | | | 16,563 | | | | 24,943 | | | | 28,121 | | | | (4 | )% | | | (38 | )% |
| | | | | | | | | | | | | | | | | | | | | | | | | | | | |
Total Regional Banking | | $ | 195,984 | | | $ | 210,607 | | | $ | 215,563 | | | $ | 264,609 | | | $ | 311,875 | | | | (7 | )% | | | (37 | )% |
| | | | | | | | | | | | | | | | | | | | | | | | | | | | |
Non-Strategic | | | | | | | | | | | | | | | | | | | | | | | | | | | | |
Nonperforming loans - including held for sale (c) (d) | | $ | 239,099 | | | $ | 259,421 | | | $ | 253,069 | | | $ | 262,645 | | | $ | 384,174 | | | | (8 | )% | | | (38 | )% |
Foreclosed real estate (g) | | | 31,583 | | | | 41,085 | | | | 52,322 | | | | 55,111 | | | | 50,671 | | | | (23 | )% | | | (38 | )% |
| | | | | | | | | | | | | | | | | | | | | | | | | | | | |
Total Non-Strategic | | $ | 270,682 | | | $ | 300,506 | | | $ | 305,391 | | | $ | 317,756 | | | $ | 434,845 | | | | (10 | )% | | | (38 | )% |
| | | | | | | | | | | | | | | | | | | | | | | | | | | | |
Corporate | | | | | | | | | | | | | | | | | | | | | | | | | | | | |
Nonperforming loans | | $ | 207 | | | $ | 207 | | | $ | 207 | | | $ | 207 | | | $ | 1,140 | | | | | * | | | (82 | )% |
| | | | | | | | | | | | | | | | | | | | | | | | | | | | |
Total nonperforming assets | | $ | 466,873 | | | $ | 511,320 | | | $ | 521,161 | | | $ | 582,572 | | | $ | 747,860 | | | | (9 | )% | | | (38 | )% |
| | | | | | | | | | | | | | | | | | | | | | | | | | | | |
| | | | | | | |
Net Charge-Offs | | | | | | | | | | | | | | | | | | | | | | | | | | | | |
Regional Banking | | $ | 14,883 | | | $ | 14,251 | | | $ | 31,823 | | | $ | 23,727 | | | $ | 18,033 | | �� | | 4 | % | | | (17 | )% |
Non-Strategic | | | 25,082 | | | | 32,084 | | | | 43,471 | | | | 82,719 | | | | 48,004 | | | | (22 | )% | | | (48 | )% |
| | | | | | | | | | | | | | | | | | | | | | | | | | | | |
Total net charge-offs | | $ | 39,965 | | | $ | 46,335 | | | $ | 75,294 | | | $ | 106,446 | | | $ | 66,037 | | | | (14 | )% | | | (39 | )% |
| | | | | | | | | | | | | | | | | | | | | | | | | | | | |
| | | | | | | |
Consolidated Key Ratios (e) | | | | | | | | | | | | | | | | | | | | | | | | | | | | |
NPL % | | | 2.03 | % | | | 2.20 | % | | | 2.16 | % | | | 2.55 | % | | | 3.62 | % | | | | | | | | |
NPA % | | | 2.32 | | | | 2.56 | | | | 2.57 | | | | 3.02 | | | | 4.09 | | | | | | | | | |
Net charge-offs % | | | 1.01 | | | | 1.16 | | | | 1.84 | | | | 2.65 | | | | 1.67 | | | | | | | | | |
Allowance / loans | | | 1.98 | | | | 2.17 | | | | 2.34 | | | | 2.77 | | | | 3.26 | | | | | | | | | |
Allowance / NPL | | | 0.98 | x | | | 0.98 | x | | | 1.09 | x | | | 1.09 | x | | | 0.90 | x | | | | | | | | |
Allowance / NPA | | | 0.85 | x | | | 0.84 | x | | | 0.91 | x | | | 0.91 | x | | | 0.79 | x | | | | | | | | |
Allowance / charge-offs | | | 2.00 | x | | | 1.86 | x | | | 1.29 | x | | | 1.06 | x | | | 1.98 | x | | | | | | | | |
| | | | | | | | | | | | | | | | | | | | | | | | | | | | |
| | | | | | | |
Other | | | | | | | | | | | | | | | | | | | | | | | | | | | | |
Loans past due 90 days or more (f) | | $ | 89,214 | | | $ | 97,672 | | | $ | 106,425 | | | $ | 102,420 | | | $ | 108,923 | | | | (9 | )% | | | (18 | )% |
Guaranteed portion (f) | | | 38,758 | | | | 40,007 | | | | 42,249 | | | | 39,572 | | | | 39,613 | | | | (3 | )% | | | (2 | )% |
Foreclosed real estate from government insured loans | | | 20,687 | | | | 19,815 | | | | 16,360 | | | | 11,438 | | | | 13,870 | | | | 4 | % | | | 49 | % |
Period-end loans, net of unearned income (millions) | | | 16,186 | | | | 15,971 | | | | 16,397 | | | | 16,241 | | | | 16,062 | | | | 1 | % | | | 1 | % |
Remaining unfunded commitments (millions) | | | 8,594 | | | | 7,717 | | | | 7,435 | | | | 7,418 | | | | 7,938 | | | | 11 | % | | | 8 | % |
| | | | | | | | | | | | | | | | | | | | | | | | | | | | |
NM - Not meaningful
* Amount is less than one percent
Certain previously reported amounts have been reclassified to agree with current presentation.
| (a) | Restricted balances parenthetically presented are as of June 30, 2012. See Glossary of Terms for definition of restricted balances. |
| (b) | The valuation adjustment taken upon exercise of clean-up calls includes expected losses. |
| (c) | In 2Q12, the process for identifying current junior liens behind delinquent or modified first liens for nonaccrual status was refined. Q1 consumer NPLs have been represented to agree with Q2 presentation. |
| (d) | 2Q12 includes $89.5 million of loans held for sale before $46.9 million of negative fair value adjustments. |
| (e) | See Glossary of Terms for definitions of Consolidated Key Ratios. |
| (f) | Includes loans held for sale. |
| (g) | Excludes foreclosed real estate from government-insured mortgages. |
21
ASSET QUALITY: CONSOLIDATED
Quarterly, Unaudited
| | | | | | | | | | | | | | | | | | | | | | | | | | | | |
| | | | | | | | | | | | | | | | | | 2Q12 Changes vs. | |
| | | 2Q12 | | | 1Q12 | | | 4Q11 | | | 3Q11 | | | 2Q11 | | | 1Q12 | | | 2Q11 | |
Key Portfolio Details | | | | | | | | | | | | | | | | | | | | | | | | | | | | |
C&I | | | | | | | | | | | | | | | | | | | | | | | | | | | | |
Period-end loans ($ millions) | | $ | 7,982 | | | $ | 7,705 | | | $ | 8,015 | | | $ | 7,706 | | | $ | 7,180 | | | | 4 | % | | | 11 | % |
| | | | | | | | | | | | | | | | | | | | | | | | | | | | |
30+ Delinq. % (a) | | | 0.29 | % | | | 0.39 | % | | | 0.15 | % | | | 0.43 | % | | | 0.52 | % | | | | | | | | |
NPL % | | | 1.97 | | | | 2.00 | | | | 2.02 | | | | 2.60 | | | | 2.96 | | | | | | | | | |
Charge-offs % (qtr. annualized) (b) | | | 0.42 | | | | 0.08 | | | | 1.62 | | | | 0.70 | | | | 0.35 | | | | | | | | | |
| | | | | | | | | | | | | | | | | | | | | | | | | | | | |
Allowance / loans % | | | 1.39 | % | | | 1.55 | % | | | 1.63 | % | | | 2.37 | % | | | 2.87 | % | | | | | | | | |
Allowance / charge-offs (b) | | | 3.44 | x | | | 19.06 | x | | | 1.04 | x | | | 3.64 | x | | | 8.70 | x | | | | | | | | |
| | | | | | | | | | | | | | | | | | | | | | | | | | | | |
| | | | | | | |
Income CRE | | | | | | | | | | | | | | | | | | | | | | | | | | | | |
Period-end loans ($ millions) | | $ | 1,225 | | | $ | 1,247 | | | $ | 1,257 | | | $ | 1,287 | | | $ | 1,311 | | | | (2 | )% | | | (7 | )% |
| | | | | | | | | | | | | | | | | | | | | | | | | | | | |
30+ Delinq. % (a) | | | 0.53 | % | | | 0.73 | % | | | 0.76 | % | | | 1.47 | % | | | 1.11 | % | | | | | | | | |
NPL % | | | 4.67 | | | | 5.59 | | | | 5.50 | | | | 6.27 | | | | 8.54 | | | | | | | | | |
Charge-offs % (qtr. annualized) | | | 0.52 | | | | 2.41 | | | | 0.44 | | | | 1.40 | | | | 1.03 | | | | | | | | | |
| | | | | | | | | | | | | | | | | | | | | | | | | | | | |
Allowance / loans % | | | 2.39 | % | | | 2.64 | % | | | 3.15 | % | | | 3.67 | % | | | 6.04 | % | | | | | | | | |
Allowance / charge-offs | | | 4.53 | x | | | 1.09 | x | | | 6.97 | x | | | 2.58 | x | | | 5.62 | x | | | | | | | | |
| | | | | | | | | | | | | | | | | | | | | | | | | | | | |
| | | | | | | |
Residential CRE | | | | | | | | | | | | | | | | | | | | | | | | | | | | |
Period-end loans ($ millions) | | $ | 89 | | | $ | 100 | | | $ | 121 | | | $ | 142 | | | $ | 183 | | | | (11 | )% | | | (51 | )% |
| | | | | | | | | | | | | | | | | | | | | | | | | | | | |
30+ Delinq. % (a) | | | 6.69 | % | | | 1.06 | % | | | 0.72 | % | | | 0.61 | % | | | 5.14 | % | | | | | | | | |
NPL % | | | 43.53 | | | | 43.77 | | | | 37.87 | | | | 38.80 | | | | 38.40 | | | | | | | | | |
Charge-offs % (qtr. annualized) | | | 5.74 | | | | 5.70 | | | | 5.96 | | | | 8.01 | | | | 8.19 | | | | | | | | | |
| | | | | | | | | | | | | | | | | | | | | | | | | | | | |
Allowance / loans % | | | 13.69 | % | | | 13.11 | % | | | 13.20 | % | | | 12.67 | % | | | 11.10 | % | | | | | | | | |
Allowance / charge-offs | | | 2.25 | x | | | 2.06 | x | | | 2.02 | x | | | 1.33 | x | | | 1.22 | x | | | | | | | | |
| | | | | | | | | | | | | | | | | | | | | | | | | | | | |
| | | | | | | |
Consumer Real Estate | | | | | | | | | | | | | | | | | | | | | | | | | | | | |
Period-end loans ($ millions) | | $ | 5,408 | | | $ | 5,392 | | | $ | 5,291 | | | $ | 5,305 | | | $ | 5,383 | | | | | * | | | | * |
| | | | | | | | | | | | | | | | | | | | | | | | | | | | |
30+ Delinq. % (a) | | | 1.29 | % | | | 1.42 | % | | | 1.70 | % | | | 1.61 | % | | | 1.52 | % | | | | | | | | |
NPL % (f) | | | 0.65 | | | | 0.72 | | | | 0.67 | | | | 0.80 | | | | 0.64 | | | | | | | | | |
Charge-offs % (qtr. annualized) | | | 1.49 | | | | 1.99 | | | | 1.85 | | | | 2.04 | | | | 2.34 | | | | | | | | | |
| | | | | | | | | | | | | | | | | | | | | | | | | | | | |
Allowance / loans % | | | 2.12 | % | | | 2.26 | % | | | 2.63 | % | | | 2.55 | % | | | 2.47 | % | | | | | | | | |
Allowance / charge-offs | | | 1.42 | x | | | 1.15 | x | | | 1.42 | x | | | 1.24 | x | | | 1.04 | x | | | | | | | | |
| | | | | | | | | | | | | | | | | | | | | | | | | | | | |
| | | | | | | |
Permanent Mortgage | | | | | | | | | | | | | | | | | | | | | | | | | | | | |
Period-end loans ($ millions) (c) | | $ | 739 | | | $ | 751 | | | $ | 788 | | | $ | 838 | | | $ | 1,015 | | | | (2 | )% | | | (27 | )% |
| | | | | | | | | | | | | | | | | | | | | | | | | | | | |
30+ Delinq. % (a) | | | 1.49 | % | | | 2.16 | % | | | 3.33 | % | | | 5.21 | % | | | 4.00 | % | | | | | | | | |
NPL % (c) | | | 4.35 | | | | 4.47 | | | | 4.15 | | | | 2.87 | | | | 13.53 | | | | | | | | | |
Charge-offs % (qtr. annualized) (d) | | | 1.36 | | | | 2.08 | | | | 2.74 | | | | 18.83 | | | | 3.21 | | | | | | | | | |
| | | | | | | | | | | | | | | | | | | | | | | | | | | | |
Allowance / loans % | | | 3.77 | % | | | 3.62 | % | | | 2.55 | % | | | 3.12 | % | | | 4.28 | % | | | | | | | | |
Allowance / charge-offs | | | 2.71 | x | | | 1.70 | x | | | 0.90 | x | | | 0.14 | x | | | 1.34 | x | | | | | | | | |
| | | | | | | | | | | | | | | | | | | | | | | | | | | | |
| | | | | | | |
Credit Card and Other | | | | | | | | | | | | | | | | | | | | | | | | | | | | |
Period-end loans ($ millions) | | $ | 279 | | | $ | 271 | | | $ | 284 | | | $ | 299 | | | $ | 295 | | | | 3 | % | | | (5 | )% |
| | | | | | | | | | | | | | | | | | | | | | | | | | | | |
30+ Delinq. % (a) | | | 1.28 | % | | | 1.26 | % | | | 1.33 | % | | | 1.29 | % | | | 1.20 | % | | | | | | | | |
NPL % | | | 0.74 | | | | 0.79 | | | | 0.75 | | | | 1.69 | | | | 3.21 | | | | | | | | | |
Charge-offs % (qtr. annualized) | | | 3.82 | | | | 2.22 | | | | 5.60 | | | | 5.27 | | | | 5.61 | | | | | | | | | |
| | | | | | | | | | | | | | | | | | | | | | | | | | | | |
Allowance / loans % | | | 2.27 | % | | | 2.27 | % | | | 2.49 | % | | | 2.84 | % | | | 3.08 | % | | | | | | | | |
Allowance / charge-offs | | | 0.60 | x | | | 0.99 | x | | | 0.44 | x | | | 0.55 | x | | | 0.54 | x | | | | | | | | |
| | | | | | | | | | | | | | | | | | | | | | | | | | | | |
| | | | | | | |
Restricted Real Estate Loans and Secured Borrowings | | | | | | | | | | | | | | | | | | | | | | | | | | | | |
Period-end loans ($ millions) (e) | | $ | 464 | | | $ | 505 | | | $ | 641 | | | $ | 666 | | | $ | 694 | | | | (8 | )% | | | (33 | )% |
| | | | | | | | | | | | | | | | | | | | | | | | | | | | |
30+ Delinq. % (a) | | | 2.74 | % | | | 2.71 | % | | | 3.15 | % | | | 2.98 | % | | | 2.85 | % | | | | | | | | |
NPL % (f) | | | 1.27 | | | | 1.80 | | | | 1.04 | | | | 0.87 | | | | 0.80 | | | | | | | | | |
Charge-offs % (qtr. annualized) | | | 3.15 | | | | 2.52 | | | | 3.63 | | | | 4.46 | | | | 4.76 | | | | | | | | | |
| | | | | | | | | | | | | | | | | | | | | | | | | | | | |
Allowance / loans % | | | 4.37 | % | | | 5.04 | % | | | 4.97 | % | | | 4.86 | % | | | 4.76 | % | | | | | | | | |
Allowance / charge-offs | | | 1.34 | x | | | 1.62 | x | | | 1.34 | x | | | 1.07 | x | | | 0.98 | x | | | | | | | | |
| | | | | | | | | | | | | | | | | | | | | | | | | | | | |
Certain previously reported amounts have been reclassified to agree with current presentation.
| (a) | 30+ Delinquency % includes all accounts delinquent more than one month and still accruing interest. |
| (b) | 1Q12 includes recoveries of $4.8 million; 4Q11 includes a $20.6 million charge-off associated with one bank-related relationship (TRUP and bank holding company loan). |
| (c) | 3Q11 includes the impact of the sale of $126 million in book value of nonperforming permanent mortgages. |
| (d) | 3Q11 includes $40.2 million of net charge-offs (“NCO”) recognized due to sale of nonperforming mortgages. |
| (e) | 2Q12 includes $447.5 million of consumer real estate loans and $16.9 million of permanent mortgage loans. |
| (f) | In 2Q12, the process for identifying current junior liens behind delinquent or modified first liens for nonaccrual status was refined. Q1 consumer NPLs have been represented to agree with Q2 presentation. |
22
ASSET QUALITY: REGIONAL BANKING
Quarterly, Unaudited
| | | | | | | | | | | | | | | | | | | | | | | | | | | | |
| | | | | | | | | | | | | | | | | | 2Q12 Changes vs. | |
| | | 2Q12 | | | 1Q12 | | | 4Q11 | | | 3Q11 | | | 2Q11 | | | 1Q12 | | | 2Q11 | |
Total Regional Banking | | | | | | | | | | | | | | | | | | | | | | | | |
Period-end loans ($ millions) | | $ | 11,962 | | | $ | 11,582 | | | $ | 11,804 | | | $ | 11,424 | | | $ | 10,875 | | | | 3 | % | | | 10 | % |
| | | | | | | | | | | | | | | | | | | | | | | | | | | | |
30+ Delinq. % (a) | | | 0.51 | % | | | 0.59 | % | | | 0.41 | % | | | 0.61 | % | | | 0.81 | % | | | | | | | | |
NPL % | | | 1.49 | | | | 1.66 | | | | 1.69 | | | | 2.10 | | | | 2.61 | | | | | | | | | |
Charge-offs % (qtr. annualized) | | | 0.51 | | | | 0.50 | | | | 1.10 | | | | 0.86 | | | | 0.68 | | | | | | | | | |
| | | | | | | | | | | | | | | | | | | | | | | | | | | | |
Allowance / loans % | | | 1.30 | % | | | 1.43 | % | | | 1.59 | % | | | 2.03 | % | | | 2.56 | % | | | | | | | | |
Allowance / charge-offs | | | 2.61 | x | | | 2.90 | x | | | 1.49 | x | | | 2.47 | x | | | 3.85 | x | | | | | | | | |
| | | | | | | | | | | | | | | | | | | | | | | | | | | | |
| | | | | | | |
Key Portfolio Details | | | | | | | | | | | | | | | | | | | | | | | | | | | | |
C&I | | | | | | | | | | | | | | | | | | | | | | | | | | | | |
Period-end loans ($ millions) | | $ | 7,441 | | | $ | 7,160 | | | $ | 7,465 | | | $ | 7,139 | | | $ | 6,600 | | | | 4 | % | | | 13 | % |
| | | | | | | | | | | | | | | | | | | | | | | | | | | | |
30+ Delinq. % (a) | | | 0.31 | % | | | 0.41 | % | | | 0.16 | % | | | 0.45 | % | | | 0.56 | % | | | | | | | | |
NPL % | | | 1.11 | | | | 1.12 | | | | 1.18 | | | | 1.62 | | | | 1.99 | | | | | | | | | |
Charge-offs % (qtr. annualized) (b) | | | 0.45 | | | | 0.09 | | | | 1.26 | | | | 0.73 | | | | 0.39 | | | | | | | | | |
| | | | | | | | | | | | | | | | | | | | | | | | | | | | |
Allowance / loans % | | | 1.14 | % | | | 1.29 | % | | | 1.36 | % | | | 1.95 | % | | | 2.43 | % | | | | | | | | |
Allowance / charge-offs (b) | | | 2.64 | x | | | 14.78 | x | | | 1.12 | x | | | 2.89 | x | | | 6.59 | x | | | | | | | | |
| | | | | | | | | | | | | | | | | | | | | | | | | | | | |
| | | | | | |
Income CRE | | | | | | | | | | | | | | | | | | | | | | | | |
Period-end loans ($ millions) | | $ | 1,183 | | | $ | 1,204 | | | $ | 1,208 | | | $ | 1,235 | | | $ | 1,245 | | | | (2 | )% | | | (5 | )% |
| | | | | | | | | | | | | | | | | | | | | | | | | | | | |
30+ Delinq. % (a) | | | 0.55 | % | | | 0.76 | % | | | 0.43 | % | | | 0.63 | % | | | 1.17 | % | | | | | | | | |
NPL % | | | 4.34 | | | | 5.28 | | | | 5.08 | | | | 5.75 | | | | 7.76 | | | | | | | | | |
Charge-offs % (qtr. annualized) | | | 0.53 | | | | 1.88 | | | | 0.40 | | | | 1.17 | | | | 0.91 | | | | | | | | | |
| | | | | | | | | | | | | | | | | | | | | | | | | | | | |
Allowance / loans % | | | 2.14 | % | | | 2.42 | % | | | 2.95 | % | | | 3.49 | % | | | 5.88 | % | | | | | | | | |
Allowance / charge-offs | | | 3.99 | x | | | 1.28 | x | | | 7.08 | x | | | 2.96 | x | | | 6.37 | x | | | | | | | | |
| | | | | | | | | | | | | | | | | | | | | | | | | | | | |
| | | | | | |
Residential CRE | | | | | | | | | | | | | | | | | | | | | | | | |
Period-end loans ($ millions) | | $ | 79 | | | $ | 86 | | | $ | 93 | | | $ | 103 | | | $ | 124 | | | | (8 | )% | | | (36 | )% |
| | | | | | | | | | | | | | | | | | | | | | | | | | | | |
30+ Delinq. % (a) | | | 7.53 | % | | | 1.22 | % | | | 0.40 | % | | | 0.56 | % | | | 6.87 | % | | | | | | | | |
NPL % | | | 40.77 | | | | 41.83 | | | | 40.28 | | | | 36.74 | | | | 35.22 | | | | | | | | | |
Charge-offs % (qtr. annualized) | | | 2.26 | | | | 6.64 | | | | 7.38 | | | | 4.91 | | | | 7.64 | | | | | | | | | |
| | | | | | | | | | | | | | | | | | | | | | | | | | | | |
Allowance / loans % | | | 14.72 | % | | | 14.07 | % | | | 14.33 | % | | | 14.27 | % | | | 12.62 | % | | | | | | | | |
Allowance / charge-offs | | | 6.24 | x | | | 2.01 | x | | | 1.82 | x | | | 2.56 | x | | | 1.54 | x | | | | | | | | |
| | | | | | | | | | | | | | | | | | | | | | | | | | | | |
| | | | | | |
Consumer Real Estate | | | | | | | | | | | | | | | | | | | | | | | | |
Period-end loans ($ millions) | | $ | 2,981 | | | $ | 2,861 | | | $ | 2,757 | | | $ | 2,654 | | | $ | 2,618 | | | | 4 | % | | | 14 | % |
| | | | | | | | | | | | | | | | | | | | | | | | | | | | |
30+ Delinq. % (a) | | | 0.76 | % | | | 0.86 | % | | | 1.00 | % | | | 0.97 | % | | | 0.94 | % | | | | | | | | |
NPL % (c) | | | 0.39 | | | | 0.45 | | | | 0.44 | | | | 0.56 | | | | 0.47 | | | | | | | | | |
Charge-offs % (qtr. annualized) | | | 0.38 | | | | 0.56 | | | | 0.54 | | | | 0.60 | | | | 0.62 | | | | | | | | | |
| | | | | | | | | | | | | | | | | | | | | | | | | | | | |
Allowance / loans % | | | 0.94 | % | | | 0.92 | % | | | 1.13 | % | | | 1.07 | % | | | 0.87 | % | | | | | | | | |
Allowance / charge-offs | | | 2.48 | x | | | 1.66 | x | | | 2.13 | x | | | 1.81 | x | | | 1.40 | x | | | | | | | | |
| | | | | | | | | | | | | | | | | | | | | | | | | | | | |
| | | | | | |
Credit Card, Permanent Mortgage, and Other | | | | | | | | | | | | | | | | | | | | | | | | |
Period-end loans ($ millions) | | $ | 278 | | | $ | 271 | | | $ | 281 | | | $ | 293 | | | $ | 288 | | | | 3 | % | | | (3 | )% |
| | | | | | | | | | | | | | | | | | | | | | | | | | | | |
30+ Delinq. % (a) | | | 1.32 | % | | | 1.40 | % | | | 1.30 | % | | | 1.19 | % | | | 1.23 | % | | | | | | | | |
NPL % | | | 0.15 | | | | 0.03 | | | | 0.02 | | | | 0.03 | | | | 0.12 | | | | | | | | | |
Charge-offs % (qtr. annualized) | | | 2.99 | | | | 2.38 | | | | 3.08 | | | | 3.52 | | | | 3.52 | | | | | | | | | |
| | | | | | | | | | | | | | | | | | | | | | | | | | | | |
Allowance / loans % | | | 2.26 | % | | | 2.20 | % | | | 2.27 | % | | | 2.40 | % | | | 2.41 | % | | | | | | | | |
Allowance / charge-offs | | | 0.76 | x | | | 0.91 | x | | | 0.73 | x | | | 0.70 | x | | | 0.68 | x | | | | | | | | |
| | | | | | | | | | | | | | | | | | | | | | | | | | | | |
ASSET QUALITY: CORPORATE | | | | | | | | | | | | | | | | | | | | | | | | | | | | |
| | | | | | | |
Permanent Mortgage | | | | | | | | | | | | | | | | | | | | | | | | | | | | |
Period-end loans ($ millions) | | $ | 119 | | | $ | 127 | | | $ | 141 | | | $ | 161 | | | $ | 175 | | | | (6 | )% | | | (32 | )% |
| | | | | | | | | | | | | | | | | | | | | | | | | | | | |
30+ Delinq. % (a) | | | 0.49 | % | | | 1.33 | % | | | 0.67 | % | | | 0.73 | % | | | 2.03 | % | | | | | | | | |
NPL % | | | 0.17 | | | | 0.16 | | | | 0.15 | | | | 0.13 | | | | 0.65 | | | | | | | | | |
Charge-offs % (qtr. annualized) | | | NM | | | | NM | | | | NM | | | | NM | | | | NM | | | | | | | | | |
| | | | | | | | | | | | | | | | | | | | | | | | | | | | |
Allowance / loans % | | | NM | | | | NM | | | | NM | | | | NM | | | | NM | | | | | | | | | |
Allowance / charge-offs | | | NM | | | | NM | | | | NM | | | | NM | | | | NM | | | | | | | | | |
| | | | | | | | | | | | | | | | | | | | | | | | | | | | |
NM - Not meaningful
* Amount is less than one percent
Certain previously reported amounts have been reclassified to agree with current presentation.
| (a) | 30+ Delinquency % includes all accounts delinquent more than one month and still accruing interest. |
| (b) | 1Q12 includes recoveries of $4.6 million; 4Q11 includes an $11.7 million charge-off associated with one bank holding company loan. |
| (c) | In 2Q12, the process for identifying current junior liens behind delinquent or modified first liens for nonaccrual status was refined. Q1 consumer NPLs have been represented to agree with Q2 presentation. |
23
ASSET QUALITY: NON-STRATEGIC
Quarterly, Unaudited
| | | | | | | | | | | | | | | | | | | | | | | | | | | | |
| | | | | | | | | | | | | | | | | | 2Q12 Changes vs. | |
| | | 2Q12 | | | 1Q12 | | | 4Q11 | | | 3Q11 | | | 2Q11 | | | 1Q12 | | | 2Q11 | |
Total Non-Strategic | | | | | | | | | | | | | | | | | | | | | | | | |
Period-end loans ($ millions) | | $ | 4,105 | | | $ | 4,262 | | | $ | 4,452 | | | $ | 4,656 | | | $ | 5,012 | | | | (4 | )% | | | (18 | )% |
| | | | | | | | | | | | | | | | | | | | | | | | | | | | |
30+ Delinq. % (a) | | | 1.72 | % | | | 1.89 | % | | | 2.53 | % | | | 2.90 | % | | | 2.29 | % | | | | | | | | |
NPL % | | | 3.64 | | | | 3.72 | | | | 3.48 | | | | 3.73 | | | | 5.92 | | | | | | | | | |
Charge-offs % (qtr. annualized) | | | 2.41 | | | | 2.95 | | | | 3.78 | | | | 6.69 | | | | 3.73 | | | | | | | | | |
| | | | | | | | | | | | | | | | | | | | | | | | | | | | |
Allowance / loans % | | | 4.02 | % | | | 4.22 | % | | | 4.41 | % | | | 4.67 | % | | | 4.90 | % | | | | | | | | |
Allowance / charge-offs | | | 1.64 | x | | | 1.39 | x | | | 1.14 | x | | | 0.66 | x | | | 1.27 | x | | | | | | | | |
| | | | | | | | | | | | | | | | | | | | | | | | | | | | |
| | | | | | |
Key Portfolio Details | | | | | | | | | | | | | | | | | | | | | | | | |
C&I (b) | | | | | | | | | | | | | | | | | | | | | | | | |
Period-end loans ($ millions) | | $ | 541 | | | $ | 546 | | | $ | 549 | | | $ | 567 | | | $ | 580 | | | | (1 | )% | | | (7 | )% |
| | | | | | | | | | | | | | | | | | | | | | | | | | | | |
30+ Delinq. % (a) | | | — | % | | | 0.12 | % | | | — | % | | | 0.18 | % | | | — | % | | | | | | | | |
NPL % | | | 13.77 | | | | 13.58 | | | | 13.50 | | | | 14.93 | | | | 13.99 | | | | | | | | | |
Charge-offs % (qtr. annualized) (c) | | | — | | | | NM | | | | 6.15 | | | | 0.37 | | | | NM | | | | | | | | | |
| | | | | | | | | | | | | | | | | | | | | | | | | | | | |
Allowance / loans % | | | 4.78 | % | | | 4.94 | % | | | 5.29 | % | | | 7.66 | % | | | 7.95 | % | | | | | | | | |
Allowance / charge-offs | | | NM | | | | NM | | | | 0.84 | x | | | 20.42 | x | | | NM | | | | | | | | | |
| | | | | | | | | | | | | | | | | | | | | | | | | | | | |
| | | | | | |
Income CRE | | | | | | | | | | | | | | | | | | | | | | | | |
Period-end loans ($ millions) | | $ | 42 | | | $ | 43 | | | $ | 49 | | | $ | 52 | | | $ | 66 | | | | (2 | )% | | | (36 | )% |
| | | | | | | | | | | | | | | | | | | | | | | | | | | | |
30+ Delinq. % (a) | | | — | % | | | — | % | | | 8.84 | % | | | 21.51 | % | | | — | % | | | | | | | | |
NPL % | | | 14.07 | | | | 14.45 | | | | 15.93 | | | | 18.80 | | | | 23.20 | | | | | | | | | |
Charge-offs % (qtr. annualized) | | | 0.30 | | | | 15.96 | | | | 1.29 | | | | 6.29 | | | | 2.64 | | | | | | | | | |
| | | | | | | | | | | | | | | | | | | | | | | | | | | | |
Allowance / loans % | | | 9.51 | % | | | 9.00 | % | | | 8.08 | % | | | 7.82 | % | | | 9.01 | % | | | | | | | | |
Allowance / charge-offs | | | 31.70 | x | | | 0.50 | x | | | 6.09 | x | | | 1.09 | x | | | 2.29 | x | | | | | | | | |
| | | | | | | | | | | | | | | | | | | | | | | | | | | | |
| | | | | | |
Residential CRE | | | | | | | | | | | | | | | | | | | | | | | | |
Period-end loans ($ millions) | | $ | 10 | | | $ | 13 | | | $ | 28 | | | $ | 38 | | | $ | 59 | | | | (23 | )% | | | (83 | )% |
| | | | | | | | | | | | | | | | | | | | | | | | | | | | |
30+ Delinq. % (a) | | | — | % | | | — | % | | | 1.79 | % | | | 0.76 | % | | | 1.49 | % | | | | | | | | |
NPL % | | | 65.64 | | | | 56.20 | | | | 29.77 | | | | 44.39 | | | | 45.06 | | | | | | | | | |
Charge-offs % (qtr. annualized) | | | 30.43 | | | | 1.59 | | | | 1.70 | | | | 15.10 | | | | 9.22 | | | | | | | | | |
| | | | | | | | | | | | | | | | | | | | | | | | | | | | |
Allowance / loans % | | | 5.40 | % | | | 6.96 | % | | | 9.40 | % | | | 8.33 | % | | | 7.90 | % | | | | | | | | |
Allowance / charge-offs | | | 0.15 | x | | | 2.82 | x | | | 4.65 | x | | | 0.41 | x | | | 0.71 | x | | | | | | | | |
| | | | | | | | | | | | | | | | | | | | | | | | | | | | |
| | | | | | |
Consumer Real Estate | | | | | | | | | | | | | | | | | | | | | | | | |
Period-end loans ($ millions) | | $ | 2,427 | | | $ | 2,531 | | | $ | 2,535 | | | $ | 2,651 | | | $ | 2,765 | | | | (4 | )% | | | (12 | )% |
| | | | | | | | | | | | | | | | | | | | | | | | | | | | |
30+ Delinq. % (a) | | | 1.95 | % | | | 2.06 | % | | | 2.46 | % | | | 2.26 | % | | | 2.07 | % | | | | | | | | |
NPL % (d) | | | 0.96 | | | | 1.04 | | | | 0.92 | | | | 1.05 | | | | 0.81 | | | | | | | | | |
Charge-offs % (qtr. annualized) | | | 2.81 | | | | 3.60 | | | | 3.21 | | | | 3.44 | | | | 3.93 | | | | | | | | | |
| | | | | | | | | | | | | | | | | | | | | | | | | | | | |
Allowance / loans % | | | 3.56 | % | | | 3.77 | % | | | 4.27 | % | | | 4.02 | % | | | 3.98 | % | | | | | | | | |
Allowance / charge-offs | | | 1.24 | x | | | 1.06 | x | | | 1.30 | x | | | 1.14 | x | | | 0.99 | x | | | | | | | | |
| | | | | | | | | | | | | | | | | | | | | | | | | | | | |
| | | | | | |
Permanent Mortgage | | | | | | | | | | | | | | | | | | | | | | | | |
Period-end loans ($ millions) (e) | | $ | 602 | | | $ | 604 | | | $ | 628 | | | $ | 657 | | | $ | 818 | | | | | * | | | (26 | )% |
| | | | | | | | | | | | | | | | | | | | | | | | | | | | |
30+ Delinq. % (a) | | | 1.61 | % | | | 2.25 | % | | | 3.95 | % | | | 6.35 | % | | | 4.46 | % | | | | | | | | |
NPL % | | | 5.28 | | | | 5.51 | | | | 5.17 | | | | 3.61 | | | | 16.64 | | | | | | | | | |
Charge-offs % (qtr. annualized) (f) | | | 1.67 | | | | 2.59 | | | | 3.46 | | | | 23.31 | | | | 3.88 | | | | | | | | | |
| | | | | | | | | | | | | | | | | | | | | | | | | | | | |
Allowance / loans % | | | 4.56 | % | | | 4.45 | % | | | 3.17 | % | | | 3.94 | % | | | 5.24 | % | | | | | | | | |
Allowance / charge-offs | | | 2.68 | x | | | 1.67 | x | | | 0.90 | x | | | 0.14 | x | | | 1.32 | x | | | | | | | | |
| | | | | | | | | | | | | | | | | | | | | | | | | | | | |
| | | | | | |
Other Consumer | | | | | | | | | | | | | | | | | | | | | | | | |
Period-end loans ($ millions) | | $ | 19 | | | $ | 20 | | | $ | 22 | | | $ | 25 | | | $ | 30 | | | | (5 | )% | | | (37 | )% |
| | | | | | | | | | | | | | | | | | | | | | | | | | | | |
30+ Delinq. % (a) | | | 3.52 | % | | | 3.04 | % | | | 2.85 | % | | | 4.32 | % | | | 2.07 | % | | | | | | | | |
NPL % | | | 9.32 | | | | 10.39 | | | | 9.83 | | | | 20.12 | | | | 31.24 | | | | | | | | | |
Charge-offs % (qtr. annualized) | | | 11.66 | | | | NM | | | | 30.70 | | | | 19.63 | | | | 19.98 | | | | | | | | | |
| | | | | | | | | | | | | | | | | | | | | | | | | | | | |
Allowance / loans % | | | 2.13 | % | | | 2.68 | % | | | 3.98 | % | | | 6.98 | % | | | 9.27 | % | | | | | | | | |
Allowance / charge-offs | | | 0.18 | x | | | NM | | | | 0.12 | x | | | 0.33 | x | | | 0.41 | x | | | | | | | | |
| | | | | | | | | | | | | | | | | | | | | | | | | | | | |
| | | | | | |
Restricted Real Estate Loans and Secured Borrowings | | | | | | | | | | | | | | | | | | | | | | | | |
Period-end loans ($ millions) (g) | | $ | 464 | | | $ | 505 | | | $ | 641 | | | $ | 666 | | | $ | 694 | | | | (8 | )% | | | (33 | )% |
| | | | | | | | | | | | | | | | | | | | | | | | | | | | |
30+ Delinq. % (a) | | | 2.74 | % | | | 2.71 | % | | | 3.15 | % | | | 2.98 | % | | | 2.85 | % | | | | | | | | |
NPL % (d) | | | 1.27 | | | | 1.80 | | | | 1.04 | | | | 0.87 | | | | 0.80 | | | | | | | | | |
Charge-offs % (qtr. annualized) | | | 3.15 | | | | 2.52 | | | | 3.63 | | | | 4.46 | | | | 4.76 | | | | | | | | | |
| | | | | | | | | | | | | | | | | | | | | | | | | | | | |
Allowance / loans % | | | 4.37 | % | | | 5.04 | % | | | 4.97 | % | | | 4.86 | % | | | 4.76 | % | | | | | | | | |
Allowance / charge-offs | | | 1.34 | x | | | 1.62 | x | | | 1.34 | x | | | 1.07 | x | | | 0.98 | x | | | | | | | | |
| | | | | | | | | | | | | | | | | | | | | | | | | | | | |
NM - Not meaningful
* Amount is less than one percent
Certain previously reported amounts have been reclassified to agree with current presentation.
| (a) | 30+ Delinquency % includes all accounts delinquent more than one month and still accruing interest. |
| (b) | Includes trust preferred loan portfolio and other exited businesses. |
| (c) | 4Q11 includes an $8.9 million charge-off associated with one TRUP loan. |
| (d) | In 2Q12, the process for identifying current junior liens behind delinquent or modified first liens for nonaccrual status was refined. Q1 consumer NPLs have been represented to agree with Q2 presentation. |
| (e) | 3Q11 includes the impact of the sale of $126 million in book value of nonperforming permanent mortgages. |
| (f) | 3Q11 includes $40.2 million of net charge-offs (“NCO”) recognized due to sale of nonperforming mortgages. |
| (g) | 2Q12 includes $447.5 million of consumer real estate loans and $16.9 million of permanent mortgage loans. |
24
ROLLFORWARDS OF NONPERFORMING LOANS AND ORE INVENTORY
Unaudited
| | | | | | | | | | | | | | | | | | | | |
| (Millions) | | 2Q12 | | | 1Q12 | | | 4Q11 | | | 3Q11 | | | 2Q11 | |
NPL Rollforward (a) | | | | | | | | | | | | | | | | | | | | |
Beginning NPLs | | $ | 270 | | | $ | 279 | | | $ | 341 | | | $ | 404 | | | $ | 462 | |
+ Additions | | | 21 | | | | 22 | | | | 17 | | | | 36 | | | | 31 | |
+ Principal increase | | | 1 | | | | 1 | | | | 1 | | | | 2 | | | | 2 | |
- Resolutions and payments | | | (20 | ) | | | (19 | ) | | | (39 | ) | | | (54 | ) | | | (66 | ) |
- Net charge-offs | | | (12 | ) | | | (10 | ) | | | (37 | ) | | | (22 | ) | | | (15 | ) |
- Transfer to ORE | | | (1 | ) | | | (3 | ) | | | (3 | ) | | | (10 | ) | | | (5 | ) |
- Upgrade to accrual | | | (4 | ) | | | — | | | | (1 | ) | | | (15 | ) | | | (5 | ) |
| | | | | | | | | | | | | | | | | | | | |
Ending NPLs | | $ | 255 | | | $ | 270 | | | $ | 279 | | | $ | 341 | | | $ | 404 | |
| | | | | | | | | | | | | | | | | | | | |
| (a) | Includes Commercial and One-Time Close Portfolios only. |
| | | | | | | | | | | | | | | | | | | | |
| (Millions) | | 2Q12 | | | 1Q12 | | | 4Q11 | | | 3Q11 | | | 2Q11 | |
ORE Inventory Rollforward (a) | | | | | | | | | | | | | | | | | | | | |
Beginning balance | | $ | 59.1 | | | $ | 68.9 | | | $ | 80.1 | | | $ | 78.8 | | | $ | 94.4 | |
Valuation adjustments | | | (4.2 | ) | | | (5.2 | ) | | | (4.4 | ) | | | (4.3 | ) | | | (4.6 | ) |
| | | | | | | | | | | | | | | | | | | | |
Adjusted balance | | | 54.9 | | | | 63.7 | | | | 75.7 | | | | 74.5 | | | | 89.8 | |
+ New ORE | | | 8.1 | | | | 10.2 | | | | 13.9 | | | | 17.0 | | | | 17.0 | |
+ Capitalized expenses | | | 0.2 | | | | 0.2 | | | | 0.2 | | | | 0.5 | | | | 1.0 | |
Disposals: | | | | | | | | | | | | | | | | | | | | |
- Single transactions | | | (12.6 | ) | | | (13.7 | ) | | | (20.7 | ) | | | (10.2 | ) | | | (24.7 | ) |
- Bulk sales | | | (1.7 | ) | | | (1.3 | ) | | | (0.2 | ) | | | (1.7 | ) | | | (4.3 | ) |
| | | | | | | | | | | | | | | | | | | | |
Ending balance | | $ | 48.9 | | | $ | 59.1 | | | $ | 68.9 | | | $ | 80.1 | | | $ | 78.8 | |
| | | | | | | | | | | | | | | | | | | | |
| (a) | ORE excludes foreclosed assets related to government insured mortgages. |
COMMERCIAL LOANS: PORTFOLIO METRICS
Unaudited
C&I Portfolio: $8.0 Billion (49.3% of Total Loans)
| | | | |
| | | % OS | |
General Corporate, Commercial, and Business Banking Loans | | | 77 | % |
Loans to Mortgage Companies | | | 16 | % |
Trust Preferred Loans | | | 5 | % |
Bank Holding Company Loans | | | 2 | % |
Income CRE Portfolio: $1.2 Billion (7.6% of Total Loans)
| | | | | | | | |
| Top 10 States as of June 30, 2012 | | % NPL | | | % OS | |
Tennessee | | | 3.18 | % | | | 60 | % |
North Carolina | | | 11.67 | % | | | 6 | % |
Georgia | | | 8.20 | % | | | 6 | % |
Florida | | | 14.16 | % | | | 5 | % |
Mississippi | | | 11.95 | % | | | 5 | % |
South Carolina | | | — | % | | | 4 | % |
Texas | | | 2.76 | % | | | 3 | % |
West Virginia | | | — | % | | | 3 | % |
Alabama | | | — | % | | | 2 | % |
Virginia | | | 0.80 | % | | | 1 | % |
25
CONSUMER LOANS: PORTFOLIO METRICS
Unaudited
Consumer Real Estate (primarily Home Equity) Portfolio: $5.9 Billion (36.2% of Total Loans) (a)
| | | | | | | | |
| Origination LTV and FICO for Portfolio as of June 30, 2012 | | Loan-to-Value |
(excludes whole loan insurance) | | <=60% | | 60% - <=80% | | 80% - 90% | | >90% |
FICO score greater than or equal to 740 | | 12 % | | 22 % | | 16 % | | 8 % |
FICO score 720-739 | | 2 % | | 4 % | | 4 % | | 2 % |
FICO score 700-719 | | 1 % | | 4 % | | 3 % | | 2 % |
FICO score 660-699 | | 2 % | | 5 % | | 2 % | | 3 % |
FICO score 620-659 | | 1 % | | 2 % | | 1 % | | 1 % |
FICO score less than 620 | | — % | | 1 % | | 1 % | | 1 % |
| |
| Origination LTV and FICO for Portfolio - Regional Bank as of June 30, 2012 | | Loan-to-Value |
(excludes whole loan insurance) | | <=60% | | 60% -<=80% | | 80% -90% | | >90% |
FICO score greater than or equal to 740 | | 13 % | | 22 % | | 17 % | | 9 % |
FICO score 720-739 | | 1 % | | 4 % | | 3 % | | 2 % |
FICO score 700-719 | | 1 % | | 3 % | | 2 % | | 2 % |
FICO score 660-699 | | 2 % | | 4 % | | 3 % | | 3 % |
FICO score 620-659 | | 1 % | | 2 % | | 1 % | | 1 % |
FICO score less than 620 | | 1 % | | 1 % | | 1 % | | 1 % |
| |
| Origination LTV and FICO for Portfolio - Non-Strategic as of June 30, 2012 | | Loan-to-Value |
(excludes whole loan insurance) | | <=60% | | 60% - <=80% | | 80% - 90% | | >90% |
FICO score greater than or equal to 740 | | 11 % | | 23 % | | 16 % | | 7 % |
FICO score 720-739 | | 2 % | | 5 % | | 4 % | | 2 % |
FICO score 700-719 | | 2 % | | 4 % | | 4 % | | 2 % |
FICO score 660-699 | | 2 % | | 5 % | | 1 % | | 3 % |
FICO score 620-659 | | 1 % | | 1 % | | 1 % | | 1 % |
FICO score less than 620 | | — % | | 1 % | | 1 % | | 1 % |
| | | | | | | | | | | | | | | | | | |
| Consumer Real Estate Portfolio Detail: | | |
| | | | | Origination Characteristics | | NCO’s % |
Vintage | | Balance ($ B) | | W/A Age (mo.) | | CLTV | | FICO | | | % Broker (b) | | % TN | | % 1st lien | | QTD |
| pre-2003 | | $0.2 | | 127 | | 76 % | | | 714 | | | 17 % | | 44 % | | 32 % | | 0.59 % |
| 2003 | | $0.4 | | 108 | | 75 % | | | 729 | | | 16 % | | 32 % | | 38 % | | 0.69 % |
| 2004 | | $0.6 | | 95 | | 79 % | | | 725 | | | 29 % | | 21 % | | 27 % | | 1.42 % |
| 2005 | | $0.9 | | 83 | | 81 % | | | 730 | | | 19 % | | 17 % | | 16 % | | 2.81 % |
| 2006 | | $0.8 | | 72 | | 78 % | | | 734 | | | 6 % | | 23 % | | 17 % | | 4.10 % |
| 2007 | | $0.9 | | 60 | | 80 % | | | 738 | | | 15 % | | 26 % | | 18 % | | 2.77 % |
| 2008 | | $0.4 | | 49 | | 75 % | | | 747 | | | 8 % | | 72 % | | 51 % | | (0.28) % |
| 2009 | | $0.3 | | 37 | | 72 % | | | 752 | | | — % | | 87 % | | 58 % | | 0.20 % |
| 2010 | | $0.3 | | 37 | | 80 % | | | 750 | | | — % | | 92 % | | 73 % | | — % |
| 2011 | | $0.6 | | 11 | | 77 % | | | 760 | | | — % | | 90 % | | 85 % | | — % |
| 2012 | | $0.5 | | 3 | | 76 % | | | 764 | | | — % | | 89 % | | 92 % | | — % |
| Total | | $5.9 | | 61 | | 78 % | | | 740 | (c) | | 11 % | | 46 % | | 41 % | | 1.64 % |
| (a) | For purposes of this disclosure, consumer real estate portfolio includes $447.5 million of restricted real estate loans and secured borrowings. |
| (b) | Correspondent and Wholesale. |
| (c) | 740 average portfolio origination FICO; 731 weighted average portfolio FICO (refreshed). |
Permanent Mortgage Portfolio: $0.8 Billion (4.7% of Total Loans) (a) (b) (c)
| | | | | | | | | | | | | | | | |
| | | Loan-to-Value | |
| | | <= 60% | | | 60% - <=80% | | | 80% - 90% | | | >90% | |
Origination LTV for Portfolio as of June 30, 2012 | | | 18 | % | | | 71 | % | | | 5 | % | | | 6 | % |
| | | | | | | | |
Top 10 States as of June 30, 2012 | | Del. % | | | % OS | |
California | | | 3.57 | % | | | 24 | % |
Texas | | | 4.58 | % | | | 10 | % |
Washington | | | 1.90 | % | | | 8 | % |
Virginia | | | 0.32 | % | | | 6 | % |
Maryland | | | 0.36 | % | | | 4 | % |
Arizona | | | 2.63 | % | | | 4 | % |
Oregon | | | 8.70 | % | | | 4 | % |
North Carolina | | | 5.71 | % | | | 3 | % |
Florida | | | 9.52 | % | | | 3 | % |
Tennessee | | | 4.77 | % | | | 3 | % |
| (a) | For purposes of this disclosure, permanent mortgage portfolio includes $17.0 million of restricted real estate loans. |
| (b) | Documentation type: 69% full doc; 26% stated; 5% other. |
| (c) | Product type: 68% jumbo; 13% Alt A; 19% other. |
26
NON-GAAP TO GAAP RECONCILIATION
Quarterly, Unaudited
| | | | | | | | | | | | | | | | | | | | |
| (Thousands) | | 2Q12 | | | 1Q12 | | | 4Q11 | | | 3Q11 | | | 2Q11 | |
Tangible Common Equity (Non-GAAP) | | | | | | | | | | | | | | | | | | | | |
(A) Total equity (GAAP) | | $ | 2,514,406 | | | $ | 2,674,173 | | | $ | 2,684,637 | | | $ | 2,743,230 | | | $ | 2,681,382 | |
Less: Noncontrolling interest (a) | | | 295,165 | | | | 295,165 | | | | 295,165 | | | | 295,165 | | | | 295,165 | |
| | | | | | | | | | | | | | | | | | | | |
(B) Total common equity | | $ | 2,219,241 | | | $ | 2,379,008 | | | $ | 2,389,472 | | | $ | 2,448,065 | | | $ | 2,386,217 | |
Less: Intangible assets (GAAP) (b) | | | 158,901 | | | | 159,880 | | | | 159,902 | | | | 160,902 | | | | 164,067 | |
| | | | | | | | | | | | | | | | | | | | |
(C) Tangible common equity (Non-GAAP) | | $ | 2,060,340 | | | $ | 2,219,128 | | | $ | 2,229,570 | | | $ | 2,287,163 | | | $ | 2,222,150 | |
Less: Unrealized gains on AFS securities, net of tax | | | 63,679 | | | | 67,077 | | | | 67,069 | | | | 79,358 | | | | 58,068 | |
| | | | | | | | | | | | | | | | | | | | |
(D) Adjusted tangible common equity (Non-GAAP) (c) | | $ | 1,996,661 | | | $ | 2,152,051 | | | $ | 2,162,501 | | | $ | 2,207,805 | | | $ | 2,164,082 | |
| | | | | | | | | | | | | | | | | | | | |
| | | | | |
Tangible Assets (Non-GAAP) | | | | | | | | | | | | | | | | | | | | |
(E) Total assets (GAAP) | | $ | 25,492,955 | | | $ | 25,678,969 | | | $ | 24,789,384 | | | $ | 25,571,469 | | | $ | 25,054,066 | |
Less: Intangible assets (GAAP) (b) | | | 158,901 | | | | 159,880 | | | | 159,902 | | | | 160,902 | | | | 164,067 | |
| | | | | | | | | | | | | | | | | | | | |
(F) Tangible assets (Non-GAAP) | | $ | 25,334,054 | | | $ | 25,519,089 | | | $ | 24,629,482 | | | $ | 25,410,567 | | | $ | 24,889,999 | |
| | | | | | | | | | | | | | | | | | | | |
| | | | | |
Period-end Shares Outstanding | | | | | | | | | | | | | | | | | | | | |
(G) Period-end shares outstanding | | | 248,810 | | | | 252,667 | | | | 257,468 | | | | 263,619 | | | | 263,699 | |
| | | | | | | | | | | | | | | | | | | | |
| | | | | |
Tier 1 Common (Non-GAAP) | | | | | | | | | | | | | | | | | | | | |
(H) Tier 1 capital (d) (e) | | $ | 2,626,268 | | | $ | 2,841,064 | | | $ | 2,850,452 | | | $ | 2,875,113 | | | $ | 2,818,535 | |
Less: Noncontrolling interest—FTBNA preferred stock (a) (f) | | | 294,816 | | | | 294,816 | | | | 294,816 | | | | 294,816 | | | | 294,816 | |
Less: Trust preferred (g) | | | 200,000 | | | | 200,000 | | | | 200,000 | | | | 200,000 | | | | 200,000 | |
| | | | | | | | | | | | | | | | | | | | |
(I) Tier 1 common (Non-GAAP) | | $ | 2,131,452 | | | $ | 2,346,248 | | | $ | 2,355,636 | | | $ | 2,380,297 | | | $ | 2,323,719 | |
| | | | | | | | | | | | | | | | | | | | |
| | | | | |
Risk Weighted Assets | | | | | | | | | | | | | | | | | | | | |
(J) Risk weighted assets (d) (e) | | $ | 20,055,000 | | | $ | 19,783,405 | | | $ | 20,026,412 | | | $ | 19,910,843 | | | $ | 19,589,310 | |
| | | | | | | | | | | | | | | | | | | | |
| | | | | |
Ratios | | | | | | | | | | | | | | | | | | | | |
(C)/(F) Tangible common equity to tangible assets (“TCE/TA”) (Non-GAAP) | | | 8.13 | % | | | 8.70 | % | | | 9.05 | % | | | 9.00 | % | | | 8.93 | % |
(A)/(E) Total equity to total assets (GAAP) | | | 9.86 | % | | | 10.41 | % | | | 10.83 | % | | | 10.73 | % | | | 10.70 | % |
(C)/(G) Tangible book value per common share (Non-GAAP) | | $ | 8.28 | | | $ | 8.78 | | | $ | 8.66 | | | $ | 8.68 | | | $ | 8.43 | |
(B)/(G) Book value per common share (GAAP) | | $ | 8.92 | | | $ | 9.42 | | | $ | 9.28 | | | $ | 9.29 | | | $ | 9.05 | |
(I)/(J) Tier 1 common ratio (Non-GAAP) (d) | | | 10.63 | % | | | 11.86 | % | | | 11.76 | % | | | 11.95 | % | | | 11.86 | % |
(H)/(E) Tier 1 capital to total assets (GAAP) (d) | | | 10.30 | % | | | 11.06 | % | | | 11.50 | % | | | 11.24 | % | | | 11.25 | % |
(D)/(J) Adjusted tangible common equity to risk weighted assets (Non-GAAP) | | | | | | | | | | | | | | | | | | | | |
(“TCE/RWA”) (c) (d) | | | 9.96 | % | | | 10.88 | % | | | 10.80 | % | | | 11.09 | % | | | 11.05 | % |
| | | | | | | | | | | | | | | | | | | | |
| | | | | |
Net interest income adjusted for impact of fully taxable equivalent (“FTE”) (Non-GAAP) | | | | | | | | | | | | | | | | | | | | |
Regional Banking | | | | | | | | | | | | | | | | | | | | |
Net interest income (GAAP) | | $ | 147,204 | | | $ | 146,073 | | | $ | 149,597 | | | $ | 140,072 | | | $ | 135,583 | |
FTE adjustment | | | 1,580 | | | | 1,493 | | | | 1,510 | | | | 1,434 | | | | 1,353 | |
| | | | | | | | | | | | | | | | | | | | |
Net interest income adjusted for impact of FTE (Non-GAAP) | | $ | 148,784 | | | $ | 147,566 | | | $ | 151,107 | | | $ | 141,506 | | | $ | 136,936 | |
| | | | | | | | | | | | | | | | | | | | |
| | | | | |
Capital Markets | | | | | | | | | | | | | | | | | | | | |
Net interest income (GAAP) | | $ | 5,613 | | | $ | 5,684 | | | $ | 5,527 | | | $ | 5,552 | | | $ | 5,509 | |
FTE adjustment | | | 160 | | | | 140 | | | | 106 | | | | 81 | | | | 76 | |
| | | | | | | | | | | | | | | | | | | | |
Net interest income adjusted for impact of FTE (Non-GAAP) | | $ | 5,773 | | | $ | 5,824 | | | $ | 5,633 | | | $ | 5,633 | | | $ | 5,585 | |
| | | | | | | | | | | | | | | | | | | | |
| | | | | |
Corporate | | | | | | | | | | | | | | | | | | | | |
Net interest income (GAAP) | | $ | (4,110 | ) | | $ | (4,727 | ) | | $ | (3,764 | ) | | $ | (494 | ) | | $ | 412 | |
FTE adjustment | | | 16 | | | | 26 | | | | 34 | | | | 40 | | | | 68 | |
| | | | | | | | | | | | | | | | | | | | |
Net interest income adjusted for impact of FTE (Non-GAAP) | | $ | (4,094 | ) | | $ | (4,701 | ) | | $ | (3,730 | ) | | $ | (454 | ) | | $ | 480 | |
| | | | | | | | | | | | | | | | | | | | |
| | | | | |
Non-Strategic | | | | | | | | | | | | | | | | | | | | |
Net interest income (GAAP) | | $ | 23,968 | | | $ | 24,899 | | | $ | 27,517 | | | $ | 31,210 | | | $ | 31,356 | |
FTE adjustment | | | — | | | | — | | | | — | | | | — | | | | — | |
| | | | | | | | | | | | | | | | | | | | |
Net interest income adjusted for impact of FTE (Non-GAAP) | | $ | 23,968 | | | $ | 24,899 | | | $ | 27,517 | | | $ | 31,210 | | | $ | 31,356 | |
| | | | | | | | | | | | | | | | | | | | |
| | | | | |
Total Consolidated | | | | | | | | | | | | | | | | | | | | |
Net interest income (GAAP) | | $ | 172,675 | | | $ | 171,929 | | | $ | 178,877 | | | $ | 176,340 | | | $ | 172,860 | |
FTE adjustment | | | 1,756 | | | | 1,659 | | | | 1,650 | | | | 1,555 | | | | 1,497 | |
| | | | | | | | | | | | | | | | | | | | |
Net interest income adjusted for impact of FTE (Non-GAAP) | | $ | 174,431 | | | $ | 173,588 | | | $ | 180,527 | | | $ | 177,895 | | | $ | 174,357 | |
| | | | | | | | | | | | | | | | | | | | |
Certain previously reported amounts have been reclassified to agree with current presentation.
| (a) | Included in Total equity on the Consolidated Balance Sheet. |
| (b) | Includes goodwill and other intangible assets, net of amortization. |
| (c) | See Glossary of Terms for definition of ratio. |
| (d) | Current quarter is an estimate. |
| (e) | Defined by and calculated in conformity with bank regulations. |
| (f) | Represents FTBNA preferred stock included in noncontrolling interest. |
| (g) | Included in Term borrowings on the Consolidated Balance Sheet. |
27
GLOSSARY OF TERMS
Adjusted Tangible Equity/RWA:Common shareholders’ equity excluding intangible assets and unrealized gains/losses on available-for-sale securities divided by risk weighted assets.
Core Business Segments:Management treats regional banking, capital markets, and corporate as FHN’s core businesses. Non-strategic has significant legacy assets and operations that are being wound down.
Lower of Cost or Market (“LOCOM”): A method of accounting for certain assets by recording them at the lower of their historical cost or their current market value.
Restricted Real Estate Loans and Secured Borrowings:Restricted loans are assets of a consolidated variable interest entity that can be used only to settle obligations of the consolidated variable interest entity and liabilities of a consolidated variable interest entity for which creditors (or beneficial interest holders) do not have recourse to the general credit of the primary beneficiary. Line item also includes loans from nonconsolidated variable interest entities that did not qualify for sale treatment. Such loans secure borrowings that are classified as term borrowings.
Troubled Debt Restructuring (“TDR”):A restructuring of debt whereby a creditor for economic or legal reasons related to the borrower’s financial difficulties grants a concession to the borrower that it would not otherwise consider. Such concession is granted in an attempt to protect as much of the creditor’s investment as possible by increasing the probability of repayment.
Asset Quality - Consolidated Key Ratios
NPL %:Ratio is nonperforming loans in the loan portfolio to total period-end loans.
NPA %: Ratio is nonperforming assets related to the loan portfolio to total period-end loans plus foreclosed real estate and other assets.
Net charge-offs %:Ratio is annualized net charge-offs to total average loans.
Allowance / loans:Ratio is allowance for loan losses to total period-end loans.
Allowance / NPL:Ratio is allowance for loan losses to nonperforming loans in the loan portfolio.
Allowance / NPA: Ratio is allowance for loan losses to nonperforming assets related to the loan portfolio.
Allowance / charge-offs: Ratio is allowance for loan losses to annualized net charge-offs.
28
|
First Horizon National Corporation Second Quarter 2012 Earnings July 20, 2012 |
|
2 Portions of this presentation use non-GAAP financial information. Each of those portions is so noted, and a reconciliation of that non-GAAP information to comparable GAAP information is provided in a footnote or in the appendix at the end of this presentation. This presentation contains forward-looking statements, which may include guidance, involving significant risks and uncertainties which will be identified by words such as “believe”,“expect”,“anticipate”,“intend”,“estimate”, “should”,“is likely”,“will”,“going forward” and other expressions that indicate future events and trends and may be followed by or reference cautionary statements. A number of factors could cause actual results to differ materially from those in the forward-looking information. These factors are outlined in our recent earnings and other press releases and in more detail in the most current 10-Q and 10-K. FHN disclaims any obligation to update any such factors or to publicly announce the result of any revisions to any of the forward-looking statements included herein or therein to reflect future events or developments. |
|
3 Successful Execution: 2Q12 Accomplishments Optimize Business Mix for Profitability & Returns Improve Productivity & Efficiency Pre-tax charge of $272mm, after-tax impact of $168mm, EPS impact of ~$0.67 $250mm addition to mortgage repurchase reserve expected to cover losses resulting from current pending and projected repurchase requests from Fannie and Freddie $22mm of expense for addition to litigation reserve Executing $139mm of cost saves in Core Businesses Regional Banking expenses down 1% Regional Banking revenue per FTE of $66k, up 12% from $59k Tier 1 ratio at 13.1% Tier 1 Common at 10.6% TCE/TA at 8.1% Repurchased $126mm of common stock since October 2011 15.1 million shares at a volume weighted average price of $8.28 per share Regional Banking pre-tax pre-provision net revenue at $70mm, up $10mm Regional Banking pre-tax income at $65mm, down $9mm Regional Banking average loans up 10% Regional Banking average core deposits up 13% Capital Markets fixed income average daily revenues at $1.1mm Non-Strategic average loans decreased 19% Net charge-offs declined 39% Nonperforming assets down 38% Deploy Capital In Disciplined Manner All data is 2Q12 compared to 2Q11 unless otherwise noted. Pre-tax pre-provision net revenue and EPS impact are non-GAAP numbers, and a reconciliation is provided on slide 6 and in the appendix, respectively. Core Businesses include Regional Banking, Capital Markets, and Corporate segments. 3 Tier 1 and Tier 1 Common: current quarter is estimate; Tier 1 Common and TCE, & TA are non-GAAP numbers, and a reconciliation is provided in the appendix. 4 Does not include $0.03 broker commission paid. 1 1 2 4 1 2 3 |
|
Consolidated Financial Results Core Businesses pre-tax income at $65mm Net loss available to common shareholders of $125mm, with diluted EPS of $(0.50) Total revenues at $332mm, down 11% Regional Banking revenues up 3% due to higher NII and improved fee income Capital Markets revenues down 28% from lower fixed income activity Total average loans at $16B, down 1% Regional Banking total average loans up 1% Non-Strategic total average loans down 4% Average core deposits at $16B, down 1% Regional Banking average core deposits up 3% Net interest margin at 3.16%, up 4bps due to lower cash balances, higher loan fees and lower deposit costs Total provision at $15mm Net charge-offs at $40mm, down 14% Significant Items: $272mm expense related to GSE mortgage repurchase and litigation reserves $5mm of securities gain 5 Numbers and percentages may not add to total due to rounding. All data is 2Q12 compared to 1Q12 unless otherwise noted. Linked Quarter Comparison 1 Income Statement Net interest income $173 $172 $173 Noninterest income $154 $202 $188 Securities gains / (losses), net $5 $0 $0 Total revenue $332 $374 $360 Noninterest expense $527 $322 $344 Pre-tax, pre-provision net revenue ($196) $52 $16 Provision $15 $8 $1 Pre-tax income / (loss) ($211) $44 $15 Taxes ($88) $11 ($4) Continuing operations ($122) $34 $19 Net income / (loss) ($122) $33 $23 Net income / (loss) available to common shareholders ($125) $31 $20 Common Stock Data Diluted shares (in millions) 249 255 263 Diluted EPS from continuing ops ($0.50) $0.12 $0.06 Diluted EPS ($0.50) $0.12 $0.08 Balance Sheet ($ in billions) Total average loans $16.0 $16.0 $15.9 Total average deposits $16.3 $16.4 $15.4 Loan yield 4.09% 4.08% 4.09% Interest-bearing core deposit rate 0.44% 0.47% 0.64% 1Q12 2Q11 2Q12 1 Core Businesses include Regional Banking, Capital Markets, and Corporate segments. Core Businesses’ pre-tax income is a non-GAAP number and reconciliation is provided in the appendix ($ in millions) |
|
6 Strength in Core Businesses: Regional Banking Pre-tax pre-provision net revenue up 5% to $70mm Net interest income up 1%, driven by higher loan fees Fee income up 8% Deposit transaction fees up 5% due to increase in NSF fees, debit card income, and cash management fees Expenses up 2% primarily from technology investments Period end loans up 3% Total average loans up 1% Commercial loans flat Consumer loans up 4% Linked Quarter Comparison Numbers may not add to total due to rounding. All data is 2Q12 compared to 1Q12 unless otherwise noted. 1 ROA, NIM, and NCO / Average Loans are annualized. 1Q12 2Q11 Income Statement Net interest income $147 $146 $136 1% 9% NSF/overdraft fees $12 $11 $13 9% (8)% Cash mgmt fees $9 $9 $10 4% (4)% Debit card income $3 $3 $7 9% (60)% Other $41 $37 $38 9% 7% Noninterest income $65 $60 $68 8% (4)% Total revenues $212 $206 $203 3% 4% Noninterest expense $142 $139 $143 2% (1)% Pre-tax pre-provision net revenue $70 $67 $60 5% 16% Loan loss provision $5 ($7) ($14) NM NM Pre-tax income $65 $74 $74 (12)% (12)% Taxes $23 $27 $27 (14)% (14)% Net income $41 $47 $47 (12)% (11)% Balance Sheet Total average loans $11.7 $11.5 $10.6 1% 10% Total average deposits $15.1 $14.7 $13.3 3% 14% Loan yield 3.91% 3.95% 3.98% Deposit rate 0.36% 0.39% 0.54% Bonefish Ratios ROA 1 1.3% 1.5% 1.7% NIM 5.11% 5.12% 5.17% NCOs / average loans 1 0.51% 0.50% 0.68% Fee income / revenue 31% 29% 33% Efficiency ratio 67% 68% 70% Regional Banking 2Q12 1Q12 2Q11 2Q12 vs ($ in millions) ($ in billions) |
|
Regional Banking Commercial Loan Pipeline & Fundings Regional Banking Total Average Loans & Deposits 7 $1.0B Significant focus to enhance profitability of balance sheet, with spread up 11bps year-over-year and relatively stable linked quarter Loan pipeline remains solid Areas of demand include C&I and Consumer Growth in loans to mortgage companies and consumer lending Competitive conditions on pricing and structure are challenging Pricing credit for attractive returns on capital Strength in Core Businesses: Regional Banking Balance Sheet Regional Banking Yields and Rates 400bps Numbers/percentages may not add due to rounding. 1 Spread is loan yield minus deposit rate. $1.0B $0.0 $0.2 $0.4 $0.6 $0.8 2Q11 1Q12 2Q12 Pipeline Funded $8 $9 $10 $11 $12 $13 $14 $15 $16B 2Q11 3Q11 4Q11 1Q12 2Q12 Total Average Deposits Total Average Loans 0 100 200 300 2Q11 3Q11 4Q11 1Q12 2Q12 Spread Deposit Rate Loan Yield 344 350 356 356 355 ¹ |
|
Strength in Core Businesses: Capital Markets 8 Pre-tax income of $19.7mm vs $32.2mm Total revenue of $81mm vs $112mm Fixed income ADR of $1.1mm vs $1.6mm, decrease driven by slower customer activity due to uncertain interest rate outlook Expenses decreased 24% linked quarter and 9% from 2Q11, excluding the 2Q11 litigation settlement charge of $36.7mm Linked Quarter Comparison Numbers may not add to total due to rounding. All data is 2Q12 compared to 1Q12 unless otherwise noted. 1 ROA, NIM, and NCO / Average Loans are annualized. 1Q12 2Q11 Income Statement ($ in millions) Net interest income $6 $6 $6 (1)% 2% Noninterest income $75 $107 $78 (30)% (4)% Total revenues $81 $112 $83 (28)% (3)% Noninterest expense $61 $80 $103 (24)% (41)% Pre-tax income / (loss) $20 $32 ($20) (39)% NM Taxes $7 $12 ($8) (39)% NM Net income / (loss) $12 $20 ($12) (38)% NM Fixed income average daily revenue $1.1 $1.6 $1.1 (32)% (4)% Bonefish Ratios ROA 1 2.1% 3.4% (2.2)% Efficiency ratio 76% 71% NM Capital Markets 2Q12 1Q12 2Q11 2Q12 vs |
|
Improving Productivity and Efficiency, Expect Lower Environmental Costs 9 $139mm identified in cost savings, in addition to expected reduction in future Non-Strategic expenses over the long- term $123mm annualized impact in 2Q12 run rate Executing ongoing efficiency initiatives, targeted to be largely completed by the end of 2012 $250mm of GSE-related mortgage repurchase expense in 2Q12 is expected to result in lower Non-Strategic expenses Near-term offsets from technology investments and pension related expenses Targeting ~$1B annualized level of consolidated expenses by the end of 2012, a 25-30% or ~$350mm reduction from the 2010 level Core Businesses’ Expenses¹ $250mm 10% $246² $223 $150 $175 $200 $225 2Q11 2Q12 Numbers/percentages may not add due to rounding. 1 Core Businesses include Regional Banking, Capital Markets, and Corporate segments. Core Businesses’ expense is a non-GAAP number and reconciliation is provided in the appendix 2 Excludes the 2Q11 Capital Markets’ litigation settlement charge of $36.7mm. |
|
Fannie Freddie Total GSE Loans Sold Ginnie Loans Sold Total Agency Loans Sold Total Demands (Request Rate) Resolved Cumulative Average Rescission Rate Average Loss Severity 10 Agency Mortgage Repurchase-Related Expenses Mortgage Repurchase Reserve Numbers may not add due to rounding. As of 2Q12. ($ in millions) Beginning Balance Net Realized Losses Provision Ending Balance 2Q12 $161 $(51) $250 $360 2Q11 $183 $(39) $25 $169 3Q11 $169 $(53) $53 $169 4Q11 $169 $(49) $45 $165 1Q12 $165 $(53) $49 $161 Originations: 2005-2008 Amount $39.6B $18.0B $57.6B $11.9B $69.5B $1.8B / 2.6% $1.4B 45 - 55% 50 - 60% Realized Losses plus Reserve through 1Q12 2Q12 Provision Cumulative Total Losses plus Reserve Total GSE Loans Sold 2005-08 Aggregate Expected Loss Ratio % of Originations % of Requests % of Realized Losses Repurchase % 31% 29% 25% 48% 69% 71% 75% 58% ~$500mm ~$250mm ~$750mm $57.6B 1.3% GSE Loans Sold Fannie Freddie GSE Loans Sold |
|
11 Pipeline of requests increased to $431mm from $380mm in 1Q12 Agency requests increased by $85mm linked quarter, reflecting a backlog of requests Mortgage insurer-related cancellations down $25mm from 2Q11 and down $2mm linked quarter Resolutions up 6% linked quarter 2Q12 cumulative rescission rates continue to average in the 45-55% range Average loss severity remains in the 50-60% range No repurchase requests related to first lien FHN securitizations Sold origination and servicing platform in August 2008 New Agency Repurchase Requests by Vintage Total Pipeline by Vintage Total Pipeline of Repurchase Requests Mortgage Repurchase-Related Expenses $300mm $500mm $500mm $0 $50 $100 $150 $200 $250 2Q11 3Q11 4Q11 1Q12 2Q12 2006 & Prior 2007 2008 $0 $100 $200 $300 $400 2Q11 3Q11 4Q11 1Q12 2Q12 New Requests Resolved Pipeline $0 $100 $200 $300 $400 2Q11 3Q11 4Q11 1Q12 2Q12 2006 & Prior 2007 2008 1 Numbers may not add due to rounding. Data as of 2Q12. 1 Based on UPB. The pipeline represents active investor claims and mortgage insurance (MI) cancellations under review, both of which could occur on the same loan. Excludes MI cancellation notices that have been reviewed and coverage has been lost. MI cancellations that have resulted in lost coverage are included in management’s assessment of the adequacy of repurchase reserves. ²Requests reflect pipeline as of each respective quarter end. 2 |
|
12 Successful Execution: Asset Quality Trends Continue to Improve 2Q12 net charge-offs of $40mm NCOs down 14% linked quarter and 39% vs 2Q11 Regional Banking NCOs down $3mm or 17% from 2Q11 Non-Strategic NCOs down $23mm or 48% vs 2Q11 Reserves for loan losses decreased $25mm linked quarter to $321mm or 1.98% of period end loans Reserves and Net Charge-Offs Numbers may not add due to rounding. Data as of 2Q12, unless otherwise noted. |
|
($ in millions) 4Q11 1Q12 2Q12 Beginning ORE $80 $69 $59 Valuation Adjustments ($4) ($5) ($4) Adjusted Balance $76 $64 $55 + New ORE $14 $10 $8 + Capitalized Expenses $0 $0 $0 - Dispositions: ($21) ($15) ($14) Single Transactions ($21) ($14) ($13) Auctions - - - Bulk Sales (0) (1) (1) Ending ORE $69 $59 $49 13 ($ in millions) 4Q11 1Q12 2Q12 Beginning NPLs $341 $279 $270 + Additions $17 $22 $21 + Principal Increase $1 $1 $1 - Resolutions/Payments ($39) ($19) ($20) - Net Charge-Offs ($37) ($10) ($12) - Transfer to ORE ($3) ($3) ($1) - Upgrade to Accrual ($1) - ($4) Ending NPLs $279 $270 $255 Successful Execution: Non-Performing Assets Decline Non-Performing Assets 1 NPAs down $44mm or 9% linked quarter and down 38% or $281mm year over year NPA % at 2.32% in 2Q12 vs 4.09% in 2Q11 NPL levels down 8% linked quarter and down 38% year over year NPL % at 2.03% vs 3.62% in 2Q11 ORE balances declined from continued disposition activity NPL Activity from Commercial and OTC 2 ORE Activity 3 $1.2B (1)% (14)% (9)% (2)% (11)% (9)% 2% (9)% (22)% (2)% $0.0 $0.2 $0.4 $0.6 $0.8 $1.0 ORE NPLs Numbers may not add due to rounding. 1 In 2Q12, the process for identifying currentjunior liens behind delinquent or modified first liens for nonaccrual status was refined. 1Q12 consumer NPLs have been representedto agree with 2Q12 presentation. 2 4Q11 net charge-offs include a $21mm loss from one bank-related relationship of a TRUP and bank holding company loan. 3 ORE excludes foreclosed real estate from government insured loans. |
|
14 Building Long-Term Earnings Power: FHNC Bonefish – Long-Term Targets 2Q12 Consolidated 2Q12 Core 1 Long-Term Targets ROTCE 2 (22.6)% 15 - 20% ROA 2 (1.96)% 0.94% 1.25 - 1.45% NIM 2 3.16% 3.43% 3.50 - 4.00% Tier 1 Common 3 10.6% 8.0 – 9.0% NCO / Average Loans 2 1.01% 0.51% 0.30 - 0.70% Fee Income / Revenue 47% 49% 40 - 50% Efficiency Ratio 161% 76% 60 - 65% Equity / Assets Return on Assets 1.25% - 1.45% Risk Adjusted Margin Return on Tangible Common Equity 15% - 20% Total Assets Earning Assets Pre-tax Income Tax Rate Efficiency Ratio 60% - 65% Annualized Net Charge-Offs 0.30% - 0.70% Net Interest Margin 3.50% - 4.00% Tier 1 Common 8% - 9% % Fee Income 40% - 50% 1 Core Businesses include Regional Banking, Capital Markets, and Corporate segment. Certain core data is non-GAAP and a reconciliation is provided in the appendix. 2 ROTCE, ROA, NIM, and NCO / Average Loans are annualized. ROTCE is a non-GAAP number, and a reconciliation is provided in the appendix. 3 Tier 1 Common: current quarter is estimate and a non-GAAP number, and a reconciliation is provided in the appendix. |
|
15 Potential Impact of Recent NPR Tier 1 Common Ratio Current Proforma Estimated NPR Impact Expected Improvements & Run-Off 2Q12 Tier 1 Common of 10.6% currently under Basel I NPR Impact: ~(240)bps Estimated 2Q12 Tier 1 Common of 8.2% under Basel III Improvements and Run-Off Impact of ~+230bps Theoretical Tier 1 Common of 10.5% under Basel III Basel III Impacts 1 3 3 1 11.8% 11.9% 10.6% 10.6% 8% 9% 10% 11% 12% 4Q11 1Q12 2Q12 1Q12 Peer Median² 1 2Q12 Tier 1 Common ratio is an estimate. Tier 1 Common is a non-GAAP number, and a reconciliation is provided in the appendix. 2 Source: SNL. Peer median includes top 50 publicly traded U.S. banks by total asset size at 1Q12. 3 The estimate of Tier 1 Common ratio reflects FHN’s current understanding of proposed Basel III rules and application of rules to its businesses including expected improvements (for theoretical Tier 1 Common) such as assumptions on retained earnings, run-off of non-strategic portfolios, balance sheet positioning, and credit quality. |
|
FHN Is Well Positioned For Long-Term Earnings Power 16 Building a Foundation for Long-Term Earnings Power FHN is successfully executing on key priorities: 1) Controlling what we can control 2) Differentiated core businesses 3) Expense leverage from efficiency initiatives 4) Managing mortgage repurchase risk 5) Improving asset quality 6) Capital flexibility |
|
18 2Q12 Credit Quality Summary by Portfolio Net Charge-offs³ ($ in millions) Commercial (C&I & Other) Income CRE Residential CRE HE & HELOC Other ¹ Permanent Mortgage Commercial (C&I & Other) Income CRE Residential CRE HE & HELOC Permanent Mortgage Other Total Period End Loans $7,441 $1,183 $79 $2,981 $278 $119 $541 $42 $10 $2,427 $602 $484 $16,186 30+ Delinquency 0.31% 0.55% 7.53% 0.76% 1.32% 0.49% 0.00% 0.00% 0.00% 1.95% 1.61% 2.78% 0.82% Dollars $23 $7 $6 $23 $4 $1 $0 $0 $0 $47 $10 $13 $133 NPL % 1.11% 4.34% 40.77% 0.39% 0.15% 0.17% 13.77% 14.07% 65.64% 0.96% 5.28% 1.59% 2.03% Dollars $83 $51 $32 $12 $0 $0 $74 $6 $6 $23 $32 $8 $328 0.45% 0.53% 2.26% 0.38% 2.99% NM 0.00% 0.30% 30.43% 2.81% 1.67% 3.50% 1.01% Dollars $8 $2 $0 $3 $2 NM $0 $0 $1 $17 $3 $4 $40 Allowance $85 $25 $12 $28 $6 NM $26 $4 $1 $86 $27 $21 $321 Allowance / Loans % 1.14% 2.14% 14.72% 0.94% 2.26% NM 4.78% 9.51% 5.40% 3.56% 4.56% 4.28% 1.98% Allowance / Charge-offs 2.64x 3.99x 6.24x 2.48x 0.76x NM NM 31.70x 0.15x 1.24x 2.68x 1.19x 2.00x (1) Credit Card, Permanent Mortgage, and Other (2) Restricted and Secured Consumer Real Estate Loans, OTC and Other Consumer. (3) Net Charge-Offs are annualized (NM) Not meaningful (4) Exercised clean-up calls on jumbo securitizations in 2Q11 and 4Q10, which are now on balance sheet in the Corporate segment Regional Banking Non-Strategic Corporate 4 Numbers may not add to total due to rounding. Data as of 2Q12. 2 % |
|
Data as of 2Q12. 1 TRUPs loan balance net of LOCOM of $34.2mm. 19 C&I Portfolio Consolidated C&I Portfolio C&I Loan Composition 4Q11 charge-offs included $21mm charge-off from one bank-related relationship C&I: Period End Loans to Mortgage Companies Numbers may not add to total due to rounding. $1.6B $8.0B portfolio, diversified by industry, managed primarily in Regional Banking Includes loans to mortgage companies (included within correspondent banking) of $1.3B in 2Q12 vs $1.1B in 1Q12 Net charge-offs up $6mm linked quarter C&I consolidated reserves of 1.39% at 6/30/12 All Other C&I 75% TRUPs¹ 5% Bank- Related 2% Correspondent Banking 18% 0% 1% 2% 3% 4% 2Q11 3Q11 4Q11 1Q12 2Q12 $0.0 $0.4 $0.8 $1.2 2Q11 3Q11 4Q11 1Q12 2Q12 $0.6 $1.1 $1.4 $1.1 $1.3 30+ Delq. NPLs/Total Loans Offs (Ann.) Net Charge |
|
C&I Portfolio: TRUPs and Bank-Related Loans 2Q12 ($ in millions) TRUPs & Bank-Related Loans Total C&I Portfolio Period End Balances $591 $7,982 Reserves $63 $111 Reserve Coverage 10.60% 1.39% NPL % 15.36% 1.97% NCO % 0.04% 0.42% TRUPS and Bank-Related Loan Coverage $591mm balances in TRUPs and bank-related loans $291mm whole-loan TRUPs to banks $156mm whole-loan TRUPs to insurance companies $144mm loans to bank holding companies and loans secured by bank stock Significant focus is directed at this portfolio TRUPs and bank holding company loans are re-graded quarterly Average TRUP size of $9mm Ten TRUPs on deferral at 6/30/12 20 2 1 1 Numbers may not add to total due to rounding. Data as of 2Q12. 1 Reserve coverage includes $34.2mm of LOCOM on TRUPs. 2 NCO % is annualized. |
|
21 Income CRE Portfolio Performance Period end balances of $1.2B 97% managed in Regional Banking with relationship- oriented customers Proactively managing problem projects and maturities to regulatory standards Do not capitalize interest and do not fund interest on distressed properties Net charge-offs down $6mm linked quarter to $2mm Reserves of 2.39% at 6/30/12 Continued improvement and stabilization Loan Type NPLs By Product Type Collateral Type Land Other 3 Office Retail Multi-Family Industrial Hospitality 29.5% 12.3% 5.5% 1.3% 1.2% 1.0% 0.0% Numbers may not add to total due to rounding. Data as of 2Q12. 1 Net charge-offs are annualized. 2 NPLs as a percentage of each portfolio. 3“Other” includes Non-Owner Occupied Single Family Residential and Multi-Use Projects. 2 |
|
22 Home Equity: Performance and Characteristics Portfolio Characteristics Geographic Distribution 30+ Delinquency: Key Drivers FICO Score-Origination Lien Position Channel 55% % of portfolio 13% 12% 14% 6% 89% 11% % of portfolio 41% 59% % of portfolio First Second Total Balance $2.4B $3.5B $5.9B Original FICO 746 736 740 Refreshed FICO 744 723 731 Original CLTV 74% 81% 78% Full Doc 86% 71% 77% Owner Occupied 90% 96% 94% HELOCs $0.8B $2.7B $3.5B Weighted Average HELOC Utilization 50% 61% 59% Core Banking Customers TN 46% CA 12% GA 3% FL 3% Other 36% 0.78% 1.86% 2.43% 2.84% 5.35% 0% 2% 4% 6% >=740 720 - 739 700 - 719 660 - 699 <660 1.57% 2.80% 0% 1% 2% 3% Retail Wholesale 1.15% 2.09% 0% 1% 2% 3% 1st Lien 2nd Lien Numbers and percentages may not add due to rounding. Data as of 2Q12. All charts and graphs include $447.5mm of restricted and secured consumer real estate loans. |
|
23 Consumer Real Estate Portfolio 30+ Delinquency Net Charge-Offs Non-Strategic Portfolio Run-Off Industry = 6.75% $50mm $24 $40 $35 $31 $30 0.76% 2.04% 0% 1% 2% 3% 2Q11 3Q11 4Q11 1Q12 2Q12 $0 $10 $20 $30 $40 2Q11 3Q11 4Q11 1Q12 2Q12 $4B 16% 14% 15% 18% 15% 0% 5% 10% 15% 20% $2 $3 2Q11 3Q11 4Q11 1Q12 2Q12 PE Balance Restricted and Secured Balances Constant Pre-Payment Rate (Right Axis) 1 All charts and graphs include $447.5mm of restricted and secured consumer real estate loans. 1 Source: McDash industry data as of April 2012. Regional Banking Non-Strategic Restricted Regional Banking Non-Strategic |
|
24 Mortgage Repurchases: Origination and Loan Characteristics Agency and Pipeline Agency Originations ~$70B of Agency originations from 2005 to 2008 Received ~$1.8B 1 of Agency-related repurchase requests to date or 2.6% of originations Represent 99.5% of all active repurchase/make whole requests in pipeline at 6/30/12 2 Pipeline of requests at $431mm in 2Q12, down 4% from 2Q11, but up from $380mm in 1Q12 $362mm of Agency-related repurchase claims $46mm of mortgage insurer-related cancellations $2mm of non-Agency whole loan-related claims $21mm of other non-repurchase requests Other Whole Loan Sales/Non-Agency Represent 0.5% of all active repurchase/make whole requests in 2Q12 pipeline Repurchase requests in the pipeline largely driven by MI cancellations Loans were bundled with other companies’ loans and securitized by the purchasers A trustee has commenced a legal action seeking repurchase of FHN loans Certain purchasers of FHN loans have requested indemnity related to securitizations |
|
25 Mortgage Repurchases: First Horizon Branded Private Securitizations FHN Alt-A Securitizations 1 $10B $5B 2004-2007 FHN Private Mortgage Securitizations FHN Jumbo Securitizations 1 1 2 $0 $1 $2 $3 $4 2004 2005 2006 2007 Jumbo Original Balance (~$13B) Jumbo Remaining Balance (~$4B) $0 $2 $4 $6 $8 2004 2005 2006 2007 Alt-A Original Balance (~$20B) Alt-A Remaining Balance (~$7B) ~$47B of FHN securitizations from 2000 to 2007 ~$33B of FHN securitizations from 2004 to 2007 9 FHN securitizations of Jumbo loans called in 2Q11 and 4Q10 102 active first lien FHN mortgage securitizations, comprised of 46 Jumbo and 56 Alt-A deals Outstanding UPB of ~$11B 64% Alt-A 36% Jumbo FHN private securitizations consisted of 60% Alt-A, 40% Jumbo, and no Subprime Average FHN securitization size at origination of $325mm was much smaller than the industry average of $858mm 1 Data source: LoanPerformance, CPRCDR, Intex, PolyPaths, Bloomberg with company analysis. FHN has not verified data accuracy. Excludes inactive deals. Data as of May 2012 with June remits. Supplemental private securitization data provided on FHN’s website at ir.fhnc.com. 2 Aggregate original UPB of $3.8B. Upon recognition by FHN called loans are no longer subject to repurchase risk. |
|
26 First Horizon Branded Private Mortgage Securitizations: Risk Remains Manageable FHN Private Securitization Repurchase Risk Different than GSE Risk FHN Private Mortgage Securitization Facts ¹ FHN private securitizations consisted of 60% Alt-A, 40% Jumbo, and no Subprime Average FHN securitization size at origination of $325mm was much smaller than the industry average of $858mm Six FHN securitization-related lawsuits outstanding No repurchase requests related to first lien FHN securitizations 67% of current UPB dollar-weighted 2004-2007 FHN private securitizations are outperforming industry cohort on cumulative loss 89% of current UPB dollar-weighted 2004-2007 FHN private securitizations are outperforming industry cohort on 60D+ delinquencies 100% of active FHN securitization deals are older than 4 years 95% are older than 5 years All deals will reach 5 years in age by year end 2012 1 Data source: LoanPerformance, CPRCDR, Intex, PolyPaths, Bloomberg with company analysis. FHN has not verified data accuracy. Excludes inactive deals. Data as of May 2012 with June remits. 2 Two suits are from 2H10 and the other 2, including a suit by FHFA, are from 3Q11. In 2 other suits, FHN is not a defendant but has received contractual indemnity claims from underwriter defendants. Resolution Representations Access Voting Rights Generally, reps and warranties are not as comprehensive as GSE whole-loan reps and warranties No specific representation and warranty on third-party fraud in the origination Difficult for most non-agency investors to access loan files Investors can compel trustee loan review and other action only if they indemnify the trustee Trustees can review loans and seek repurchase on their own Generally requires a coordinated investor effort to compel trustees to investigate and pursue repurchase claims Investor interests are not necessarily aligned Longer resolution process expected Longer timeline may decrease probability of successful claims 2 |
|
27 First Horizon Branded Private Mortgage Securitizations: Delinquencies and Cumulative Losses 6% 12% 8% 11% Vintage Remaining Balance / Total 2004-2007 Current Jumbo and Alt-A Balances 6% 29% 19% 9% 11% 12% 8% 9% Vintage Original Balance / Total 2004-2007 Original Jumbo and Alt-A Balances 8% 27% 18% 7% FHN Industry ¹ 0% 1% 2% 3% 4% 5% 6% 2004 2005 2006 2007 0% 6% 12% 18% 24% 2004 2005 2006 2007 0% 7% 14% 21% 28% 35% 2004 2005 2006 2007 0% 4% 8% 12% 16% 2004 2005 2006 2007 Jumbo 60+ Day Delinquencies Jumbo Cumulative Losses Alt-A 60+ Day Delinquencies Alt-A Cumulative Losses Numbers and percentages may not add to total due to rounding. Data as of May 2012 with June Remits. Data source: LoanPerformance, CPRCDR, Intex, PolyPaths, Bloomberg with company analysis. FHN has not verified the data accuracy. 1 Cohort (Industry) = Loans of similar type/vintage relevant reference group. Supplemental private securitization data provided on FHN’s website at ir.fhnc.com. |
|
FHFA Litigation Securitizations $1.0B $874mm* 28 *The original balance related to the FHFA lawsuit is $874mm, plus an additional $9mm of cost over par, totaling $883mm Paid Off 54% Performing UPB 34% 60D+ Delinquent² 7% Cumulative Loss 5% $0.0 $0.2 $0.4 $0.6 $0.8 1 ($ in millions) Alt-A Deal FHFA-Related Tranche Original UPB Paid Off Current UPB Performing UPB 60D+ Delinquent Cumulative Loss FHAMS 2005-AA9 IIA1 $214 $118 $88 $74 $14 $8 FHAMS 2005-AA10 IA1 $140 $80 $55 $47 $8 $5 FHAMS 2005-AA11 IA1 $129 $68 $51 $45 $7 $10 FHAMS 2005-AA12 IIA1 $161 $70 $80 $66 $14 $11 FHAMS 2006-AA1 IA1 $230 $134 $81 $66 $16 $15 FHFA Total $874 $471 $355 $297 $59 $48 Numbers and percentages may not add to total due to rounding. Data source: June 2012 Trustee Reports and the FHFA lawsuit filed on 9/2/11. 1 In April 2007, the GSEs purchased the remaining $161mm of UPB in the FHAMS 2005-AA12 IIA1 tranche, as reported in the FHFA lawsuit. This tranche had an origination balance of $213mm. 2 60D+ Delinquent defined as a delinquency status of 60 days or more and also bankruptcies, foreclosures and REO in such status for 60 days or more. FHFA Litigation Certificate Breakdown |
|
Reconciliation to GAAP Financials Slides in this presentation use non-GAAP information of net interest income adjusted for impact of FTE. That information is not presented according to generally accepted accounting principles (GAAP) and is reconciled to GAAP information below. 29 Numbers may not add to total due to rounding. ($ in millions) 2Q12 1Q12 4Q11 3Q11 2Q11 Regional Banking Net interest income (GAAP) $147.2 $146.1 $149.6 $140.1 $135.6 FTE adjustment $1.6 $1.5 $1.5 $1.4 $1.4 Net interest income adjusted for impact of FTE (Non-GAAP) $148.8 $147.6 $151.1 $141.5 $136.9 Capital Markets Net interest income (GAAP) $5.6 $5.7 $5.5 $5.6 $5.5 FTE adjustment $0.2 $0.1 $0.1 $0.1 $0.1 Net interest income adjusted for impact of FTE (Non-GAAP) $5.8 $5.8 $5.6 $5.6 $5.6 Corporate Net interest income (GAAP) ($4.1) ($4.7) ($3.8) ($0.5) $0.4 FTE adjustment $0.0 $0.0 $0.0 $0.0 $0.1 Net interest income adjusted for impact of FTE (Non-GAAP) ($4.1) ($4.7) ($3.7) ($0.5) $0.5 Non-Strategic Net interest income (GAAP) $24.0 $24.9 $27.5 $31.2 $31.4 FTE adjustment $0.0 $0.0 $0.0 $0.0 $0.0 Net interest income adjusted for impact of FTE (Non-GAAP) $24.0 $24.9 $27.5 $31.2 $31.4 Total Consolidated Net interest income (GAAP) $172.7 $171.9 $178.9 $176.3 $172.9 FTE adjustment $1.8 $1.7 $1.7 $1.6 $1.5 Net interest income adjusted for impact of FTE (Non-GAAP) $174.4 $173.6 $180.5 $177.9 $174.4 |
|
Reconciliation to GAAP Financials Slides in this presentation use non-GAAP information of tangible assets, tangible common equity, tier 1 common capital, and various ratios using one or more of those measures. That information is not presented according to generally accepted accounting principles (GAAP) and is reconciled to GAAP information below. 30 Numbers may not add to total due to rounding. 1 Includes goodwill and other intangible assets, net of amortization. 2 Current quarter is an estimate. ($ in millions) 2Q12 1Q12 4Q11 3Q11 2Q11 Tangible Common Equity (Non-GAAP) Total equity (GAAP) $2,514.4 $2,674.2 $2,684.6 $2,743.2 $2,681.4 Less: noncontrolling interest 295.2 295.2 295.2 295.2 295.2 Total common equity 2,219.2 2,379.0 2,389.5 2,448.1 2,386.2 Less: intangible assets (GAAP) 1 158.9 159.9 159.9 160.9 164.1 Tangible common equity (Non-GAAP) 2,060.3 2,219.1 2,229.6 2,287.2 2,222.2 Less: unrealized gains on AFS securities, net of tax 63.7 67.1 67.1 79.4 58.1 Adjusted tangible common equity (Non-GAAP) 1,996.7 2,152.1 2,162.5 2,207.8 2,164.1 Tangible Assets (Non-GAAP) Total assets (GAAP) $25,493.0 $25,679.0 $24,789.4 $25,571.5 $25,054.1 Less: intangible assets (GAAP) 1 158.9 159.9 159.9 160.9 164.1 Tangible assets (Non-GAAP) 25,334.1 25,519.1 24,629.5 25,410.6 24,890.0 Tier 1 Common (Non-GAAP) Tier 1 capital 2 $2,626.3 $2,841.1 $2,850.5 $2,875.1 $2,818.5 Less: noncontrolling interest - FTBNA preferred stock 294.8 294.8 294.8 294.8 294.8 Less: trust preferred 200.0 200.0 200.0 200.0 200.0 Tier 1 common (Non-GAAP) 2 2,131.5 2,346.2 2,355.6 2,380.3 2,323.7 Risk Weighted Assets Risk weighted assets 2 $20,055.0 $19,783.4 $20,026.4 $19,910.8 $19,589.3 Ratios Tangible common equity to tangible assets (TCE/TA) (Non-GAAP) 8.13% 8.70% 9.05% 9.00% 8.93% Total equity to total assets (GAAP) 9.86% 10.41% 10.83% 10.73% 10.70% Tier 1 common ratio (Non-GAAP) 2 10.63% 11.86% 11.76% 11.95% 11.86% Tier 1 capital to total assets (GAAP) 2 10.30% 11.06% 11.50% 11.24% 11.25% Tangible common equity to risk weighted assets (TCE/RWA) (Non-GAAP) 2 10.27% 11.22% 11.13% 11.49% 11.34% Tangible common equity plus reserves to risk weighted assets (Non-GAAP) 2 11.87% 12.97% 13.05% 13.75% 14.02% Total equity plus reserves to total assets (GAAP) 11.12% 11.76% 12.38% 12.49% 12.79% |
|
Reconciliation to GAAP Financials Slides in this presentation use non-GAAP information of net interest income, assets, net interest margin, net charge- offs, fee income, revenue, expense and various ratios using one or more of those measures. That information is not presented according to generally accepted accounting principles (GAAP) and is reconciled to GAAP information below. 31 Numbers may not add to total due to rounding. 1 ROA and Net Charge-offs / Average loans are annualized. 2Q12 Return on Assets 1 Net Interest Margin Net Charge-Offs/ Average Loans 1 Fee Income / Total Revenue Efficiency Ratio Regional Banking (GAAP) 1.35% 5.11% 0.51% 31% 67% Capital Markets (GAAP) 2.07% 1.15% 0.0% 93% 76% Corporate (GAAP) -0.51% -0.44% NM NM NM Core Businesses (Non-GAAP) 0.94% 3.43% 0.51% 49% 76% Non-Strategic (GAAP) -13.64% 2.11% 2.41% 30% 891% Consolidated (GAAP) -1.96% 3.16% 1.01% 47% 161% Regional Banking Revenue Per FTE ($ in 000s) 2Q12 1Q12 2Q11 Total Revenue $212,042 $205,974 $203,436 FTEs 3,189 3,160 3,428 Revenue Per FTE $66 $65 $59 2Q12 1Q12 2Q11 Regional Banking Pre-Tax Income (GAAP) $65 $74 $74 Capital Markets Pre-Tax Income (GAAP) $20 $32 -$20 Corporate Pre-Tax Income (GAAP) -$20 -$18 -$27 Core Businesses Pre-Tax Income (Non-GAAP) $65 $88 $27 Non-Strategic Pre-Tax Income (GAAP) -$275 -$44 -$12 Consolidated (GAAP) -$211 $44 $15 2Q12 1Q12 2Q11 Regional Banking Noninterest Expense (GAAP) $142 $139 $143 Capital Markets Noninterest Expense (GAAP) $61 $80 $103 Less: Capital Markets Litigation Expense (Non-GAAP) $0 $0 $37 Corporate Noninterest Expense (GAAP) $19 $23 $36 Core Businesses Noninterest Expense (Non-GAAP) $223 $242 $246 Non-Strategic Noninterest Expense (GAAP) $304 $80 $61 Consolidated Noninterest Expense (GAAP) $527 $322 $308 Pre-Tax Income ($ in millions) Noninterest Expense ($ in millions) |
|
Reconciliation to GAAP Financials 32 Numbers may not add to total due to rounding. 1 Because FHN recognized a net loss available to common shareholders in 2Q12, potentially issuable shares are excluded from diluted shares as they are anti-dilutive. Excluding the previously announced repurchase and litigation charges, FHN would have recognized net income available to common shareholders. As a result, pro-forma diluted shares are presented in order to include the dilutive impact of potentially issuable shares Slides in this presentation use non-GAAP information of tangible common equity and per share impact to EPS data and various ratios using one or more of those measures. That information is not presented according to generally accepted accounting principles (GAAP) and is reconciled to GAAP information below. Per Share Impact (Non-GAAP) (in millions, except per share) 2Q12 Previously announced pre-tax repurchase & litigation charges ($272) Tax benefit (tax rate of 38.40%) $104 After-tax impact of repurchase & litigation charges ($168) Diluted shares (GAAP) 249 Add: Effect of dilutive securities (pro-forma) 1 Pro-forma diluted shares 251 Per share impact for charges (Non-GAAP) ($0.67) Diluted EPS (GAAP) (in millions, except per share) 2Q12 Net income available to common shareholders ($125) Diluted shares 249 Diluted earnings per share ($0.50) Return on Tangible Common Equity ($ in millions) 2Q12 Average Common Equity (GAAP) $2,383 Intangibles (GAAP) ($159) Tangible Common Equity (Non-GAAP) $2,223 Net Income Available to Common Shareholders (GAAP) ($125) Annualized Return on Tangible Common Equity (Non-GAAP) -22.6% 1 |