Table of Contents
Exhibit 99.1

FOURTH QUARTER 2013
FINANCIAL SUPPLEMENT
If you need further information, please contact:
Aarti Bowman, Investor Relations
901-523-4017
aagoorha@firsthorizon.com
Table of Contents
| Page | ||||
| 3 | ||||
| 4 | ||||
Income Statement | ||||
| 6 | ||||
| 7 | ||||
| 8 | ||||
Balance Sheet | ||||
| 9 | ||||
| 10 | ||||
| 11 | ||||
| 12 | ||||
Charges for Restructuring, Repositioning, & Efficiency Initiatives | 13 | |||
| 14 | ||||
Business Segment Detail | ||||
| 15 | ||||
| 16 | ||||
| 17 | ||||
| 18 | ||||
| 19 | ||||
Asset Quality | ||||
| 20 | ||||
| 22 | ||||
| 23 | ||||
| 24 | ||||
| 25 | ||||
| 26 | ||||
| 27 | ||||
Other Information
This financial supplement contains forward-looking statements involving significant risks and uncertainties. A number of important factors could cause actual results to differ materially from those in the forward-looking information. Those factors include general economic and financial market conditions, including expectations of and actual timing and amount of interest rate movements including the slope of the yield curve, competition, customer and investor responses to these conditions, ability to execute business plans, geopolitical developments, recent and future legislative and regulatory developments, natural disasters, and items mentioned in this financial supplement and in First Horizon National Corporation’s (“FHN”) most recent press release, as well as critical accounting estimates and other factors described in FHN’s recent filings with the SEC. FHN disclaims any obligation to update any such factors or to publicly announce the result of any revisions to any of the forward-looking statements included herein or therein to reflect future events or developments.
Use of Non-GAAP Measures
Certain ratios are included in this financial supplement that are non-GAAP, meaning they are not presented in accordance with generally accepted accounting principles (“GAAP”) in the U.S. FHN’s management believes such ratios are relevant to understanding the capital position and results of the Company. The non-GAAP ratios presented in this financial supplement are tangible common equity to tangible assets, tangible book value per common share, tier 1 common to risk weighted assets, adjusted tangible common equity to risk weighted assets, and net interest margin using net interest income adjusted for fully taxable equivalent (“FTE”). These ratios are reported to FHN’s management and Board of Directors through various internal reports. Additionally, disclosure of non-GAAP capital ratios provides a meaningful base for comparability to other financial institutions as demonstrated by their use by the various banking regulators in reviewing the capital adequacy of financial institutions. Non-GAAP measures are not formally defined by GAAP or codified in currently effective federal banking regulations, and other entities may use calculation methods that differ from those used by FHN. Tier 1 capital is a regulatory term and is generally defined as the sum of core capital (including common equity and instruments that can not be redeemed at the option of the holder) adjusted for certain items under risk based capital regulations. Also a regulatory term, risk weighted assets includes total assets adjusted for credit risk and is used to determine regulatory capital ratios. Refer to the tabular reconciliation of non-GAAP to GAAP measures and presentation of the most comparable GAAP items on page 26 of this financial supplement.
Table of Contents
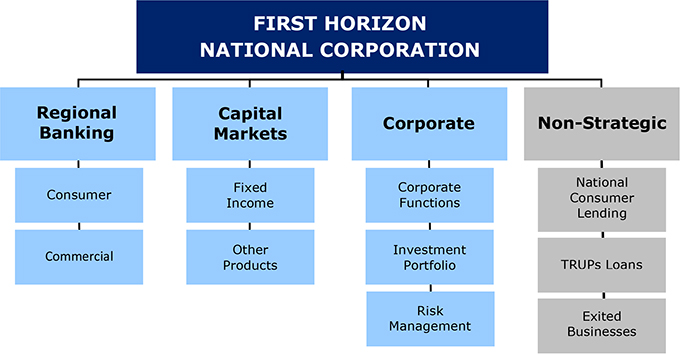
| FIRST HORIZON NATIONAL CORPORATION SEGMENT STRUCTURE |  |
3
Table of Contents
Consolidated Results for Fiscal Year 2013 vs. 2012
| • | Net income available to common shareholders was $23.5 million, or $.10 per diluted share in 2013, compared to a net loss of $27.8 million, or $.11 loss per diluted share in 2012 |
| • | Acquired substantially all of the assets and liabilities of Mountain National Bank (“MNB”) from the FDIC |
| • | Reached an agreement with Fannie Mae resolving certain legacy representation and warranty repurchase obligations associated with loans originated from 2000 to 2008 excluding certain loans FHN no longer services |
| • | Signed a definitive agreement to sell substantially all remaining legacy mortgage servicing; transfers of servicing began in fourth quarter |
| • | Net interest income (“NII”) decreased 7 percent in 2013 to $637.4 million from $688.7 million; Net interest margin (“NIM”) decreased to 2.96 percent from 3.13 percent |
| • | The decrease in NII is primarily attributable to run-off of the non-strategic loan portfolios, lower yielding fixed rate loans, and a lower yielding securities portfolio, somewhat mitigated by improved deposit pricing |
| • | The decrease in NIM is driven by declining yields on the investment portfolio, lower yielding fixed rate loans, run-off of the non-strategic loan portfolios, and a decline in loans to mortgage companies, partially offset by lower rates on deposits |
| • | Noninterest income (including securities gains) declined to $584.6 million in 2013 compared to $671.3 million in 2012 primarily due to lower fixed income sales revenue within capital markets and a decline in mortgage banking income |
| • | Provision expense was $55.0 million in 2013 compared to $78.0 million in 2012; 2012 included approximately $30 million of provision associated with the implementation of regulatory guidance related to discharged bankruptcies |
| • | Noninterest expense was $1.2 billion in 2013 compared to $1.4 billion in 2012 |
| • | Decrease primarily driven by declines in the mortgage repurchase provision, pension-related costs, capital markets variable compensation, and severance costs related to restructuring, repositioning, and efficiency initiatives |
| • | These decreases were partially offset by an increase in legal and professional fees driven by litigation matters in 2013 |
| • | Average loans were $15.7 billion in 2013 compared to $16.2 billion in 2012; period-end loans decreased 8 percent to $15.4 billion |
| • | Decline in the period-end loan portfolio driven by continued run-off within the non-strategic portfolios and declines in the regional bank |
| • | Average core deposits were $15.8 billion in 2013 compared to $15.6 billion in 2012; period-end relatively flat at $16.2 billion |
Fourth Quarter 2013 vs. Third Quarter 2013
Consolidated
| • | Net income available to common shareholders was $49.1 million, or $.21 per diluted share in fourth quarter, compared to a net loss of $107.5 million, or $.45 loss per diluted share in prior quarter |
| • | NII decreased slightly in fourth quarter to $157.1 million from $158.8 million; NIM increased slightly to 2.98 percent from 2.97 percent in the prior quarter |
| • | The decrease in NII is primarily attributable to a decline in average loans to mortgage companies and run-off of the non-strategic loan portfolios, partially offset by the effect of amortizing the valuation adjustment for acquired time deposits and declining rates on deposits |
| • | The slight increase in NIM is driven by the effect of amortizing the valuation adjustment for acquired time deposits, lower rates on deposits, and higher yields on trading assets, which more than offset the negative impact of a decline in average loans to mortgage companies and an increase in average excess cash held at the Fed |
| • | Noninterest income (including securities gains) was $135.0 million in fourth quarter compared to $150.5 million in third quarter |
| • | The decrease was largely driven by decreases in fee income in fourth quarter within the non-strategic and capital markets segments |
| • | Noninterest expense was $260.1 million in fourth quarter compared to $433.6 million in third quarter |
| • | Decrease primarily driven by a decrease within the non-strategic segment to the mortgage repurchase provision partially offset by an increase in litigation expense |
| • | Average loans were $15.3 billion in fourth quarter compared to $15.7 billion in third quarter; period-end loans were flat at $15.4 billion |
| • | Decline in average loans primarily driven by a decrease in loans to mortgage companies and continued run-off within the non-strategic portfolios |
| • | Average core deposits were $15.7 billion in fourth quarter compared to $16.0 billion in third quarter; period-end increased 3 percent to $16.2 billion |
Regional Banking
| • | NII was $146.4 million in fourth quarter compared to $149.5 million in third quarter |
| • | The decrease in NII is primarily attributable to lower average loan balances (primarily loans to mortgage companies) |
| • | NIM decreased 1 basis point largely due to the continuing impact of low rates |
| • | Period-end loans increased 1 percent, or $133.0 million to $12.2 billion in fourth quarter primarily driven by increases in specialty lending, somewhat mitigated by declines in retail loans |
| • | Loan loss provision was $2.6 million in fourth quarter compared to $5.2 million in prior quarter |
| • | Decline in provision was driven by the commercial portfolio due to aggregate improvement |
| • | Noninterest income was $62.8 million in fourth quarter compared to $63.9 million in third quarter |
| • | Noninterest expense increased to $139.1 million in fourth quarter from $131.9 million in the prior quarter |
| • | Fourth quarter includes an increase in charges associated with branch closings and higher professional fees |
Capital Markets
| • | Fixed income revenue decreased to $50.9 million in fourth quarter from $54.4 million in third quarter |
| • | Fixed income average daily revenue (“ADR”) was $822 thousand in fourth quarter down 3 percent from third quarter |
| • | Noninterest expense decreased to $53.2 million in fourth quarter from $58.0 million in third quarter |
| • | The expense decrease was primarily due to a decline in variable compensation costs |
4
Table of Contents
FHN PERFORMANCE HIGHLIGHTS (continued)
Fourth Quarter 2013 vs. Third Quarter 2013
Corporate
| • | NII was negative $10.4 million in fourth quarter compared to negative $11.7 million in the prior quarter |
| • | Estimated effective duration of the securities portfolio was 3.8 years in fourth and third quarters |
| • | Estimated modified duration of the securities portfolio was 4.0 years in fourth quarter compared to 4.4 years in prior quarter |
| • | Noninterest income increased to $7.8 million in fourth quarter from $6.6 million in third quarter |
| • | Fourth quarter includes a net $2.2 million gain associated with cost method investments |
| • | Increase partially offset by lower deferred compensation driven by market conditions; changes in deferred compensation income are mirrored by changes in deferred compensation expense |
| • | Noninterest expense was $18.7 million in fourth quarter compared to $21.7 million in the prior quarter |
| • | Reduction driven by a decrease in deferred compensation expense and lower restructuring charges in fourth quarter relative to the prior quarter |
Non-Strategic
| • | NII decreased to $16.8 million in fourth quarter from $17.1 million in third quarter due to continued run-off of the loan portfolio |
| • | Provision expense increased to $12.4 million in fourth quarter from $4.8 million in prior quarter |
| • | The increase in fourth quarter provision was affected by reserve build in the home equity portfolio combined with a slower pace of reserve release in other portfolio segments |
| • | Noninterest income was $4.9 million in fourth quarter compared to $15.9 million in third quarter |
| • | Decrease primarily due to higher servicing income in third quarter reflecting the terms of the servicing sale agreement and decline in fourth quarter as servicing transfers began |
| • | Noninterest expense was $49.1 million in fourth quarter compared to $222.0 million in the prior quarter |
| • | Decrease primarily driven by a $200.0 million addition to the repurchase and foreclosure reserve in third quarter |
| • | Fourth quarter includes $30.0 million of net loss accruals related to legal matters |
Asset Quality
| • | Allowance as a percentage of loans ratio was relatively flat at 165 basis points in fourth quarter compared to166 basis points in prior quarter |
| • | Total reserves decreased to $253.8 million from $255.7 million in third quarter |
| • | The net decline in reserves was driven by a $5.3 million commercial reserve release, somewhat offset by $3.4 net million reserve increase in the consumer portfolio |
| • | The commercial allowance reflects continued improvement in loss rates, grade migration, and asset quality metrics |
| • | The consumer allowance increase was driven by a reserve build in the non-strategic consumer real estate portfolio |
| • | Provision expense was $15.0 million in fourth quarter compared to $10.0 million in third quarter |
| • | Net charge-offs (“NCOs”) were $16.9 million in fourth quarter compared to $16.2 million in prior quarter |
| • | Annualized net charge-offs increased to 44 basis points of average loans from 41 basis points in prior quarter |
| • | Nonperforming loans (“NPLs”) in the portfolio declined $33.0 million to $255.0 million driven by the C&I portfolio within the regional bank |
| • | Nonperforming assets (“NPAs”), including loans held-for-sale, decreased to $435.0 million in fourth quarter from $482.0 million in prior quarter |
| • | The decline in NPAs was largely driven by a drop in nonperforming portfolio loans in addition to a decline in nonperforming loans in held for sale and foreclosed assets |
| • | Total 30+ delinquencies were $101.4 million in fourth quarter compared to $94.2 million in prior quarter |
| • | The increase in 30+ delinquencies was largely driven by consumer real estate loans within the non-strategic segment |
| • | Troubled debt restructurings (“TDRs”) were $562.1 million at the end of fourth quarter compared with $578.4 million in prior quarter |
Taxes
| • | The effective tax rates for the quarter and year are negative reflecting permanent benefits from tax credit investments, life insurance, and tax exempt interest |
| • | Fourth quarter tax expense was favorably affected by the pattern of quarterly earnings in 2013 and $8.2 million in discrete items |
Capital and Liquidity
| • | Paid $0.05 per common share dividend on January 1, 2014 |
| • | No shares repurchased in fourth quarter under the $300 million share repurchase program |
| • | Repurchased shares costing $262.7 million since the program’s inception in fourth quarter 2011 |
| • | Volume weighted average price for all share repurchases under the stock repurchase program of $9.24 per share (before $.02 per share broker commission) |
| • | Paid preferred quarterly dividend of $1.6 million on January 10, 2014 |
| • | Capital ratios (regulatory capital ratios estimated based on period-end balances) |
| • | 8.23 percent for tangible common equity to tangible assets |
| • | 13.76 percent for Tier 1 |
| • | 16.11 percent for Total Capital |
| • | 10.65 percent for Tier 1 Common |
| • | 11.01 percent for Leverage |
5
Table of Contents
FHN CONSOLIDATED SUMMARY RESULTS
Quarterly, Unaudited
| 4Q13 Changes vs. | Twelve months ended | 2013 vs. | ||||||||||||||||||||||||||||||||||||||
(Dollars in thousands, except per share data) | 4Q13 | 3Q13 | 2Q13 | 1Q13 | 4Q12 | 3Q13 | 4Q12 | 2013 | 2012 | 2012 | ||||||||||||||||||||||||||||||
Income Statement Highlights | ||||||||||||||||||||||||||||||||||||||||
Net interest income | $ | 157,135 | $ | 158,838 | $ | 160,019 | $ | 161,382 | $ | 170,598 | (1 | )% | (8 | )% | $ | 637,374 | $ | 688,667 | (7 | )% | ||||||||||||||||||||
Noninterest income | 132,860 | 150,571 | 142,983 | 156,403 | 151,143 | (12 | )% | (12 | )% | 582,817 | 670,636 | (13 | )% | |||||||||||||||||||||||||||
Securities gains/(losses), net | 2,183 | (96 | ) | (351 | ) | 24 | (4,700 | ) | NM | NM | 1,760 | 693 | NM | |||||||||||||||||||||||||||
|
|
|
|
|
|
|
|
|
|
|
|
|
|
|
|
|
|
|
| |||||||||||||||||||||
Total revenue | 292,178 | 309,313 | 302,651 | 317,809 | 317,041 | (6 | )% | (8 | )% | 1,221,951 | 1,359,996 | (10 | )% | |||||||||||||||||||||||||||
|
|
|
|
|
|
|
|
|
|
|
|
|
|
|
|
|
|
|
| |||||||||||||||||||||
Noninterest expense | 260,097 | 433,556 | 227,408 | 240,540 | 271,361 | (40 | )% | (4 | )% | 1,161,601 | 1,383,701 | (16 | )% | |||||||||||||||||||||||||||
Provision for loan losses | 15,000 | 10,000 | 15,000 | 15,000 | 15,000 | 50 | % | * | 55,000 | 78,000 | (29 | )% | ||||||||||||||||||||||||||||
|
|
|
|
|
|
|
|
|
|
|
|
|
|
|
|
|
|
|
| |||||||||||||||||||||
Income/(loss) before income taxes | 17,081 | (134,243 | ) | 60,243 | 62,269 | 30,680 | NM | (44 | )% | 5,350 | (101,705 | ) | NM | |||||||||||||||||||||||||||
Provision/(benefit) for income taxes | (36,555 | ) | (31,094 | ) | 15,008 | 17,730 | (12,914 | ) | (18 | )% | NM | (34,911 | ) | (85,262 | ) | 59 | % | |||||||||||||||||||||||
|
|
|
|
|
|
|
|
|
|
|
|
|
|
|
|
|
|
|
| |||||||||||||||||||||
Income/(loss) from continuing operations | 53,636 | (103,149 | ) | 45,235 | 44,539 | 43,594 | NM | 23 | % | 40,261 | (16,443 | ) | NM | |||||||||||||||||||||||||||
Income/(loss) from discontinued operations, net of tax | (6 | ) | 123 | 1 | 430 | (12 | ) | NM | 50 | % | 548 | 148 | NM | |||||||||||||||||||||||||||
|
|
|
|
|
|
|
|
|
|
|
|
|
|
|
|
|
|
|
| |||||||||||||||||||||
Net income/(loss) | 53,630 | (103,026 | ) | 45,236 | 44,969 | 43,582 | NM | 23 | % | 40,809 | (16,295 | ) | NM | |||||||||||||||||||||||||||
Net income attributable to noncontrolling interest | 2,934 | 2,875 | 2,843 | 2,813 | 2,901 | 2 | % | 1 | % | 11,465 | 11,464 | * | ||||||||||||||||||||||||||||
|
|
|
|
|
|
|
|
|
|
|
|
|
|
|
|
|
|
|
| |||||||||||||||||||||
Net income/(loss) attributable to controlling interest | 50,696 | (105,901 | ) | 42,393 | 42,156 | 40,681 | NM | 25 | % | 29,344 | (27,759 | ) | NM | |||||||||||||||||||||||||||
Preferred stock dividends | 1,550 | 1,550 | 1,550 | 1,188 | — | * | NM | 5,838 | — | NM | ||||||||||||||||||||||||||||||
|
|
|
|
|
|
|
|
|
|
|
|
|
|
|
|
|
|
|
| |||||||||||||||||||||
Net income/(loss) available to common shareholders | $ | 49,146 | $ | (107,451 | ) | $ | 40,843 | $ | 40,968 | $ | 40,681 | NM | 21 | % | $ | 23,506 | $ | (27,759 | ) | NM | ||||||||||||||||||||
|
|
|
|
|
|
|
|
|
|
|
|
|
|
|
|
|
|
|
| |||||||||||||||||||||
Common Stock Data | ||||||||||||||||||||||||||||||||||||||||
Diluted EPS from continuing operations | $ | 0.21 | $ | (0.45 | ) | $ | 0.17 | $ | 0.17 | $ | 0.17 | NM | 24 | % | $ | 0.10 | $ | (0.11 | ) | NM | ||||||||||||||||||||
Diluted EPS | $ | 0.21 | $ | (0.45 | ) | $ | 0.17 | $ | 0.17 | $ | 0.17 | NM | 24 | % | $ | 0.10 | $ | (0.11 | ) | NM | ||||||||||||||||||||
Diluted shares (thousands) | 236,753 | 236,895 | 240,891 | 242,799 | 246,132 | * | (4 | )% | 239,794 | 248,349 | (3 | )% | ||||||||||||||||||||||||||||
Period-end shares outstanding (thousands) | 236,370 | 236,328 | 240,555 | 241,225 | 243,598 | * | (3 | )% | 236,370 | 243,598 | (3 | )% | ||||||||||||||||||||||||||||
Cash dividends declared per share | $ | 0.05 | $ | 0.05 | $ | 0.05 | $ | 0.05 | $ | 0.01 | * | NM | $ | 0.20 | $ | 0.04 | NM | |||||||||||||||||||||||
|
|
|
|
|
|
|
|
|
|
|
|
|
|
|
|
|
|
|
| |||||||||||||||||||||
Balance Sheet Highlights (Period-End) | ||||||||||||||||||||||||||||||||||||||||
Total loans, net of unearned income (Restricted - $.1 billion) (a) | $ | 15,389,074 | $ | 15,408,556 | $ | 16,197,952 | $ | 15,889,670 | $ | 16,708,582 | * | (8 | )% | |||||||||||||||||||||||||||
Total deposits | 16,734,956 | 16,283,909 | 17,011,884 | 16,204,467 | 16,629,709 | 3 | % | 1 | % | |||||||||||||||||||||||||||||||
Total assets (Restricted - $.1 billion) (a) (b) | 23,792,576 | 23,858,753 | 24,852,800 | 24,803,048 | 25,334,019 | * | (6 | )% | ||||||||||||||||||||||||||||||||
Total liabilities (Restricted - $.1 billion) (a) (b) | 21,292,083 | 21,425,460 | 22,306,392 | 22,203,321 | 22,824,813 | (1 | )% | (7 | )% | |||||||||||||||||||||||||||||||
Total equity | 2,500,493 | 2,433,293 | 2,546,408 | 2,599,727 | 2,509,206 | 3 | % | * | ||||||||||||||||||||||||||||||||
|
|
|
|
|
|
|
|
|
|
|
|
|
| |||||||||||||||||||||||||||
Asset Quality Highlights | ||||||||||||||||||||||||||||||||||||||||
Allowance for loan losses (Restricted - $4.4 million) (a) | $ | 253,809 | $ | 255,710 | $ | 261,934 | $ | 265,218 | $ | 276,963 | (1 | )% | (8 | )% | ||||||||||||||||||||||||||
Allowance / period-end loans | 1.65 | % | 1.66 | % | 1.62 | % | 1.67 | % | 1.66 | % | ||||||||||||||||||||||||||||||
Net charge-offs | $ | 16,901 | $ | 16,224 | $ | 18,284 | $ | 26,745 | $ | 19,781 | 4 | % | (15 | )% | ||||||||||||||||||||||||||
Net charge-offs (annualized) / average loans | 0.44 | % | 0.41 | % | 0.46 | % | 0.67 | % | 0.48 | % | ||||||||||||||||||||||||||||||
Non-performing assets (NPA) (c) | $ | 434,988 | $ | 482,045 | $ | 506,265 | $ | 418,385 | $ | 419,369 | (10 | )% | 4 | % | ||||||||||||||||||||||||||
NPA % (c) (d) | 1.95 | % | 2.19 | % | 2.25 | % | 1.81 | % | 1.84 | % | ||||||||||||||||||||||||||||||
|
|
|
|
|
|
|
|
|
| |||||||||||||||||||||||||||||||
Key Ratios & Other | ||||||||||||||||||||||||||||||||||||||||
Return on average assets (annualized) (e) | 0.89 | % | (1.69 | )% | 0.74 | % | 0.73 | % | 0.69 | % | ||||||||||||||||||||||||||||||
Return on average common equity (annualized) (f) | 9.37 | % | (20.39 | )% | 7.46 | % | 7.48 | % | 7.20 | % | ||||||||||||||||||||||||||||||
Net interest margin (g) (h) | 2.98 | % | 2.97 | % | 2.96 | % | 2.95 | % | 3.09 | % | ||||||||||||||||||||||||||||||
Fee income to total | 45.81 | % | 48.66 | % | 47.19 | % | 49.22 | % | 46.98 | % | ||||||||||||||||||||||||||||||
Efficiency ratio (j) | 89.69 | % | NM | 75.05 | % | 75.69 | % | 84.34 | % | |||||||||||||||||||||||||||||||
Book value per common share (k) | $ | 8.92 | $ | 8.64 | $ | 8.96 | $ | 9.16 | $ | 9.09 | ||||||||||||||||||||||||||||||
Tangible book value per common share (h) (k) | $ | 8.23 | $ | 7.95 | $ | 8.28 | $ | 8.51 | $ | 8.44 | ||||||||||||||||||||||||||||||
Adjusted tangible common equity to risk weighted assets (h) (l) | 10.31 | % | 9.69 | % | 9.69 | % | 9.91 | % | 9.93 | % | ||||||||||||||||||||||||||||||
Market capitalization (millions) | $ | 2,753.7 | $ | 2,597.2 | $ | 2,694.2 | $ | 2,576.3 | $ | 2,414.1 | ||||||||||||||||||||||||||||||
Full time equivalent employees | 4,309 | 4,338 | 4,296 | 4,381 | 4,507 | |||||||||||||||||||||||||||||||||||
|
|
|
|
|
|
|
|
|
| |||||||||||||||||||||||||||||||
NM - Not meaningful
| * | Amount is less than one percent. |
Certain previously reported amounts have been reclassified to agree with current presentation.
| (a) | Restricted balances parenthetically presented are as of December 31, 2013. |
| (b) | Balances reflect the net presentation of certain capital markets receivables and payables. Prior periods have been revised for comparability. |
| (c) | 2013 increase primarily relates to second liens placed on nonaccrual based on information received from a third party on the performance status of non-FHN serviced first liens and acquired foreclosed real estate from the MNB acquisition. |
| (d) | NPAs related to the loan portfolio over period-end loans plus foreclosed real estate and other assets. |
| (e) | Calculated using net income. |
| (f) | Calculated using net income available to common shareholders. |
| (g) | Net interest margin is computed using net interest income adjusted to a fully taxable equivalent (“FTE”) basis. |
| (h) | Refer to the Non-GAAP to GAAP Reconciliation on page 26 of this financial supplement. |
| (i) | Ratio excludes securities gains/(losses). |
| (j) | Noninterest expense divided by total revenue excluding securities gains/(losses). |
| (k) | 2Q13 decrease due to $40 million prepaid share repurchase agreement, shares were delivered in 3Q13. |
| (l) | Current quarter is an estimate. |
6
Table of Contents
FHN CONSOLIDATED INCOME STATEMENT
Quarterly, Unaudited
| 4Q13 Changes vs. | Twelve months ended | 2013 vs. | ||||||||||||||||||||||||||||||||||||||
(Thousands) | 4Q13 | 3Q13 | 2Q13 | 1Q13 | 4Q12 | 3Q13 | 4Q12 | 2013 | 2012 | 2012 | ||||||||||||||||||||||||||||||
Interest income | $ | 179,053 | $ | 182,610 | $ | 183,991 | $ | 186,399 | $ | 196,199 | (2 | )% | (9 | )% | $ | 732,053 | $ | 798,953 | (8 | )% | ||||||||||||||||||||
Less: interest expense | 21,918 | 23,772 | 23,972 | 25,017 | 25,601 | (8 | )% | (14 | )% | 94,679 | 110,286 | (14 | )% | |||||||||||||||||||||||||||
|
|
|
|
|
|
|
|
|
|
|
|
|
|
|
|
|
|
|
| |||||||||||||||||||||
Net interest income | 157,135 | 158,838 | 160,019 | 161,382 | 170,598 | (1 | )% | (8 | )% | 637,374 | 688,667 | (7 | )% | |||||||||||||||||||||||||||
Provision for loan losses | 15,000 | 10,000 | 15,000 | 15,000 | 15,000 | 50 | % | * | 55,000 | 78,000 | (29 | )% | ||||||||||||||||||||||||||||
|
|
|
|
|
|
|
|
|
|
|
|
|
|
|
|
|
|
|
| |||||||||||||||||||||
Net interest income after provision for loan losses | 142,135 | 148,838 | 145,019 | 146,382 | 155,598 | (5 | )% | (9 | )% | 582,374 | 610,667 | (5 | )% | |||||||||||||||||||||||||||
|
|
|
|
|
|
|
|
|
|
|
|
|
|
|
|
|
|
|
| |||||||||||||||||||||
Noninterest income: | ||||||||||||||||||||||||||||||||||||||||
Capital markets (a) (b) | 59,653 | 64,283 | 69,265 | 79,163 | 72,483 | (7 | )% | (18 | )% | 272,364 | 334,912 | (19 | )% | |||||||||||||||||||||||||||
Deposit transactions and cash management | 29,194 | 29,279 | 28,254 | 27,656 | 30,952 | * | (6 | )% | 114,383 | 120,168 | (5 | )% | ||||||||||||||||||||||||||||
Brokerage, management fees and commissions | 11,505 | 10,868 | 10,540 | 9,348 | 8,980 | 6 | % | 28 | % | 42,261 | 34,934 | 21 | % | |||||||||||||||||||||||||||
Mortgage banking (c) | 3,853 | 14,460 | 5,589 | 9,373 | 8,287 | (73 | )% | (54 | )% | 33,275 | 51,890 | (36 | )% | |||||||||||||||||||||||||||
Trust services and investment management | 6,596 | 6,649 | 6,950 | 6,328 | 5,979 | (1 | )% | 10 | % | 26,523 | 24,319 | 9 | % | |||||||||||||||||||||||||||
Bankcard income | 4,998 | 5,303 | 5,299 | 4,882 | 5,766 | (6 | )% | (13 | )% | 20,482 | 22,384 | (8 | )% | |||||||||||||||||||||||||||
Bank owned life insurance | 3,636 | 3,560 | 3,946 | 5,472 | 5,081 | 2 | % | (28 | )% | 16,614 | 18,805 | (12 | )% | |||||||||||||||||||||||||||
Other service charges | 3,144 | 3,707 | 3,503 | 3,086 | 3,167 | (15 | )% | (1 | )% | 13,440 | 12,935 | 4 | % | |||||||||||||||||||||||||||
Insurance commissions | 960 | 733 | 730 | 600 | 804 | 31 | % | 19 | % | 3,023 | 3,148 | (4 | )% | |||||||||||||||||||||||||||
Securities gains/(losses), net (d) | 2,183 | (96 | ) | (351 | ) | 24 | (4,700 | ) | NM | NM | 1,760 | 693 | NM | |||||||||||||||||||||||||||
Gain/(loss) on divestiture | (4 | ) | 115 | — | — | — | NM | NM | 111 | 200 | (45 | )% | ||||||||||||||||||||||||||||
Other (e) | 9,325 | 11,614 | 8,907 | 10,495 | 9,644 | (20 | )% | (3 | )% | 40,341 | 46,941 | (14 | )% | |||||||||||||||||||||||||||
|
|
|
|
|
|
|
|
|
|
|
|
|
|
|
|
|
|
|
| |||||||||||||||||||||
Total noninterest income | 135,043 | 150,475 | 142,632 | 156,427 | 146,443 | (10 | )% | (8 | )% | 584,577 | 671,329 | (13 | )% | |||||||||||||||||||||||||||
|
|
|
|
|
|
|
|
|
|
|
|
|
|
|
|
|
|
|
| |||||||||||||||||||||
Adjusted gross income after provision for loan losses | 277,178 | 299,313 | 287,651 | 302,809 | 302,041 | (7 | )% | (8 | )% | 1,166,951 | 1,281,996 | (9 | )% | |||||||||||||||||||||||||||
|
|
|
|
|
|
|
|
|
|
|
|
|
|
|
|
|
|
|
| |||||||||||||||||||||
Noninterest expense: | ||||||||||||||||||||||||||||||||||||||||
Employee compensation, incentives, and benefits (f) | 127,144 | 132,213 | 130,500 | 139,184 | 161,813 | (4 | )% | (21 | )% | 529,041 | 640,857 | (17 | )% | |||||||||||||||||||||||||||
Repurchase and foreclosure provision | — | 200,000 | — | — | — | NM | NM | 200,000 | 299,256 | (33 | )% | |||||||||||||||||||||||||||||
Legal and professional fees | 15,419 | 12,704 | 14,065 | 11,171 | 11,971 | 21 | % | 29 | % | 53,359 | 38,750 | 38 | % | |||||||||||||||||||||||||||
Occupancy | 12,811 | 13,147 | 11,785 | 12,822 | 12,363 | (3 | )% | 4 | % | 50,565 | 49,027 | 3 | % | |||||||||||||||||||||||||||
Computer software | 10,197 | 10,446 | 9,608 | 10,076 | 10,333 | (2 | )% | (1 | )% | 40,327 | 40,018 | 1 | % | |||||||||||||||||||||||||||
Contract employment and outsourcing | 9,059 | 9,241 | 8,581 | 9,039 | 9,052 | (2 | )% | * | 35,920 | 41,198 | (13 | )% | ||||||||||||||||||||||||||||
Operations services | 9,104 | 9,199 | 8,842 | 8,070 | 8,123 | (1 | )% | 12 | % | 35,215 | 35,429 | (1 | )% | |||||||||||||||||||||||||||
Equipment rentals, depreciation, and maintenance | 8,431 | 7,890 | 7,597 | 7,820 | 7,910 | 7 | % | 7 | % | 31,738 | 31,246 | 2 | % | |||||||||||||||||||||||||||
FDIC premium expense | 4,477 | 4,631 | 5,037 | 6,011 | 7,299 | (3 | )% | (39 | )% | 20,156 | 27,968 | (28 | )% | |||||||||||||||||||||||||||
Advertising and public relations | 4,685 | 5,486 | 4,121 | 3,947 | 5,915 | (15 | )% | (21 | )% | 18,239 | 17,439 | 5 | % | |||||||||||||||||||||||||||
Communications and courier | 4,473 | 4,517 | 4,531 | 4,437 | 4,613 | (1 | )% | (3 | )% | 17,958 | 18,318 | (2 | )% | |||||||||||||||||||||||||||
Foreclosed real estate | 1,050 | 523 | 1,287 | 1,439 | 1,995 | NM | (47 | )% | 4,299 | 11,041 | (61 | )% | ||||||||||||||||||||||||||||
Amortization of intangible assets | 1,128 | 928 | 928 | 928 | 979 | 22 | % | 15 | % | 3,912 | 3,910 | * | ||||||||||||||||||||||||||||
Other (e) | 52,119 | 22,631 | 20,526 | 25,596 | 28,995 | NM | 80 | % | 120,872 | 129,244 | (6 | )% | ||||||||||||||||||||||||||||
|
|
|
|
|
|
|
|
|
|
|
|
|
|
|
|
|
|
|
| |||||||||||||||||||||
Total noninterest expense | 260,097 | 433,556 | 227,408 | 240,540 | 271,361 | (40 | )% | (4 | )% | 1,161,601 | 1,383,701 | (16 | )% | |||||||||||||||||||||||||||
|
|
|
|
|
|
|
|
|
|
|
|
|
|
|
|
|
|
|
| |||||||||||||||||||||
Income/(loss) before income taxes | 17,081 | (134,243 | ) | 60,243 | 62,269 | 30,680 | NM | (44 | )% | 5,350 | (101,705 | ) | NM | |||||||||||||||||||||||||||
Provision/(benefit) for income taxes (g) | (36,555 | ) | (31,094 | ) | 15,008 | 17,730 | (12,914 | ) | (18 | )% | NM | (34,911 | ) | (85,262 | ) | 59 | % | |||||||||||||||||||||||
|
|
|
|
|
|
|
|
|
|
|
|
|
|
|
|
|
|
|
| |||||||||||||||||||||
Income/(loss) from continuing operations | 53,636 | (103,149 | ) | 45,235 | 44,539 | 43,594 | NM | 23 | % | 40,261 | (16,443 | ) | NM | |||||||||||||||||||||||||||
Income/(loss) from discontinued operations, net of tax | (6 | ) | 123 | 1 | 430 | (12 | ) | NM | 50 | % | 548 | 148 | NM | |||||||||||||||||||||||||||
|
|
|
|
|
|
|
|
|
|
|
|
|
|
|
|
|
|
|
| |||||||||||||||||||||
Net income/(loss) | 53,630 | (103,026 | ) | 45,236 | 44,969 | 43,582 | NM | 23 | % | 40,809 | (16,295 | ) | NM | |||||||||||||||||||||||||||
Net income attributable to noncontrolling interest | 2,934 | 2,875 | 2,843 | 2,813 | 2,901 | 2 | % | 1 | % | 11,465 | 11,464 | * | ||||||||||||||||||||||||||||
|
|
|
|
|
|
|
|
|
|
|
|
|
|
|
|
|
|
|
| |||||||||||||||||||||
Net income/(loss) attributable to controlling interest | 50,696 | (105,901 | ) | 42,393 | 42,156 | 40,681 | NM | 25 | % | 29,344 | (27,759 | ) | NM | |||||||||||||||||||||||||||
Preferred stock dividends | 1,550 | 1,550 | 1,550 | 1,188 | — | * | NM | 5,838 | — | NM | ||||||||||||||||||||||||||||||
|
|
|
|
|
|
|
|
|
|
|
|
|
|
|
|
|
|
|
| |||||||||||||||||||||
Net income/(loss) available to common shareholders | $ | 49,146 | $ | (107,451 | ) | $ | 40,843 | $ | 40,968 | $ | 40,681 | NM | 21 | % | $ | 23,506 | $ | (27,759 | ) | NM | ||||||||||||||||||||
|
|
|
|
|
|
|
|
|
|
|
|
|
|
|
|
|
|
|
| |||||||||||||||||||||
NM - Not meaningful
| * | Amount is less than one percent. |
Certain previously reported amounts have been reclassified to agree with current presentation.
| (a) | 4Q13 average daily revenue (“ADR”) was $822 thousand. |
| (b) | 2Q13 and 1Q13 include a gain of $1.0 million and $2.4 million, respectively, from a LOCOM reversal associated with a TRUP loan payoff within the non-strategic segment. |
| (c) | 3Q13 includes an increase in servicing income reflecting the terms of the agreement to sell servicing; 3Q13 also includes a $2.2 million negative adjustment made as a result of estimated costs for obligations associated with the agreement to sell servicing. 4Q13 down as servicing transfers began. |
| (d) | 4Q13 includes a net $2.2 million gain on cost method investments; 4Q12 includes a $4.7 million negative valuation adjustment related to an equity investment. |
| (e) | Refer to the Other Income and Other Expense table on page 8 for additional information. |
| (f) | 3Q13 includes a positive $3.5 million adjustment resulting from revisions to an employee benefit plan. |
| (g) | 4Q13 and 4Q12 include $8.3 million and $17.0 million, respectively, in tax benefits related to discrete period tax items. |
7
Table of Contents
FHN OTHER INCOME AND OTHER EXPENSE
Quarterly, Unaudited
| 4Q13 Changes vs. | Twelve months ended | 2013 vs. | ||||||||||||||||||||||||||||||||||||||
(Thousands) | 4Q13 | 3Q13 | 2Q13 | 1Q13 | 4Q12 | 3Q13 | 4Q12 | 2013 | 2012 | 2012 | ||||||||||||||||||||||||||||||
Other Income | ||||||||||||||||||||||||||||||||||||||||
ATM and interchange fees | $ | 2,721 | $ | 2,680 | $ | 2,627 | $ | 2,384 | $ | 2,724 | 2 | % | * | $ | 10,412 | $ | 10,528 | (1 | )% | |||||||||||||||||||||
Electronic banking fees | 1,535 | 1,607 | 1,585 | 1,562 | 1,610 | (4 | )% | (5 | )% | 6,289 | 6,537 | (4 | )% | |||||||||||||||||||||||||||
Letter of credit fees | 1,215 | 1,171 | 1,196 | 1,499 | 1,192 | 4 | % | 2 | % | 5,081 | 5,158 | (1 | )% | |||||||||||||||||||||||||||
Deferred compensation (a) | 1,210 | 2,160 | (278 | ) | 1,593 | 396 | (44 | )% | NM | 4,685 | 4,461 | 5 | % | |||||||||||||||||||||||||||
Other | 2,644 | 3,996 | 3,777 | 3,457 | 3,722 | (34 | )% | (29 | )% | 13,874 | 20,257 | (32 | )% | |||||||||||||||||||||||||||
|
|
|
|
|
|
|
|
|
|
|
|
|
|
|
|
|
|
|
| |||||||||||||||||||||
Total | $ | 9,325 | $ | 11,614 | $ | 8,907 | $ | 10,495 | $ | 9,644 | (20 | )% | (3 | )% | $ | 40,341 | $ | 46,941 | (14 | )% | ||||||||||||||||||||
|
|
|
|
|
|
|
|
|
|
|
|
|
|
|
|
|
|
|
| |||||||||||||||||||||
Other Expense | ||||||||||||||||||||||||||||||||||||||||
Litigation and regulatory matters | $ | 30,355 | $ | 229 | $ | 900 | $ | 5,170 | $ | 4,300 | NM | NM | $ | 36,654 | $ | 33,313 | 10 | % | ||||||||||||||||||||||
Other insurance and taxes | 3,261 | 3,215 | 3,076 | 3,046 | 3,078 | 1 | % | 6 | % | 12,598 | 10,734 | 17 | % | |||||||||||||||||||||||||||
Tax credit investments | 3,063 | 3,079 | 2,989 | 2,972 | 4,198 | (1 | )% | (27 | )% | 12,103 | 18,655 | (35 | )% | |||||||||||||||||||||||||||
Travel and entertainment | 2,339 | 2,400 | 2,372 | 1,848 | 2,058 | (3 | )% | 14 | % | 8,959 | 8,366 | 7 | % | |||||||||||||||||||||||||||
Employee training and dues | 1,327 | 1,244 | 1,229 | 1,254 | 1,171 | 7 | % | 13 | % | 5,054 | 4,525 | 12 | % | |||||||||||||||||||||||||||
Customer relations | 1,179 | 1,204 | 1,255 | 1,278 | 1,348 | (2 | )% | (13 | )% | 4,916 | 4,578 | 7 | % | |||||||||||||||||||||||||||
Miscellaneous loan costs | 701 | 1,349 | 1,163 | 996 | 924 | (48 | )% | (24 | )% | 4,209 | 4,126 | 2 | % | |||||||||||||||||||||||||||
Supplies | 1,090 | 950 | 705 | 1,055 | 1,021 | 15 | % | 7 | % | 3,800 | 3,752 | 1 | % | |||||||||||||||||||||||||||
Other | 8,804 | 8,961 | 6,837 | 7,977 | 10,897 | (2 | )% | (19 | )% | 32,579 | 41,195 | (21 | )% | |||||||||||||||||||||||||||
|
|
|
|
|
|
|
|
|
|
|
|
|
|
|
|
|
|
|
| |||||||||||||||||||||
Total | $ | 52,119 | $ | 22,631 | $ | 20,526 | $ | 25,596 | $ | 28,995 | NM | 80 | % | $ | 120,872 | $ | 129,244 | (6 | )% | |||||||||||||||||||||
|
|
|
|
|
|
|
|
|
|
|
|
|
|
|
|
|
|
|
| |||||||||||||||||||||
NM - Not meaningful
| * | Amount is less than one percent. |
Certain previously reported amounts have been reclassified to agree with current presentation.
| (a) | Amounts driven by market conditions and are mirrored by changes in deferred compensation expense which is included in employee compensation expense. |
8
Table of Contents
FHN CONSOLIDATED PERIOD-END BALANCE SHEET
Quarterly, Unaudited
| 4Q13 Changes vs. | ||||||||||||||||||||||||||||
(Thousands) | 4Q13 | 3Q13 | 2Q13 | 1Q13 | 4Q12 | 3Q13 | 4Q12 | |||||||||||||||||||||
Assets: | ||||||||||||||||||||||||||||
Investment securities | $ | 3,398,457 | $ | 3,186,943 | $ | 3,228,379 | $ | 3,190,219 | $ | 3,061,808 | 7 | % | 11 | % | ||||||||||||||
Loans held-for-sale | 370,152 | 371,640 | 385,105 | 390,874 | 401,937 | * | (8 | )% | ||||||||||||||||||||
Loans, net of unearned income (Restricted - $.1 billion) (a) | 15,389,074 | 15,408,556 | 16,197,952 | 15,889,670 | 16,708,582 | * | (8 | )% | ||||||||||||||||||||
Federal funds sold | 66,079 | 52,830 | 52,169 | 33,738 | 34,492 | 25 | % | 92 | % | |||||||||||||||||||
Securities purchased under agreements to resell | 412,614 | 576,355 | 602,126 | 732,696 | 601,891 | (28 | )% | (31 | )% | |||||||||||||||||||
Interest-bearing cash (b) | 730,297 | 184,179 | 344,150 | 431,182 | 353,373 | NM | NM | |||||||||||||||||||||
Trading securities | 801,718 | 1,343,134 | 1,267,348 | 1,397,746 | 1,262,720 | (40 | )% | (37 | )% | |||||||||||||||||||
|
|
|
|
|
|
|
|
|
|
|
|
|
| |||||||||||||||
Total earning assets | 21,168,391 | 21,123,637 | 22,077,229 | 22,066,125 | 22,424,803 | * | (6 | )% | ||||||||||||||||||||
|
|
|
|
|
|
|
|
|
|
|
|
|
| |||||||||||||||
Cash and due from banks (Restricted - $1.2 million) (a) | 349,216 | 395,631 | 382,601 | 275,262 | 469,879 | (12 | )% | (26 | )% | |||||||||||||||||||
Capital markets receivables (c) | 45,255 | 83,154 | 151,660 | 169,927 | 117,772 | (46 | )% | (62 | )% | |||||||||||||||||||
Mortgage servicing rights, net (d) | 72,793 | 116,686 | 113,853 | 109,102 | 114,311 | (38 | )% | (36 | )% | |||||||||||||||||||
Goodwill (e) | 141,943 | 140,479 | 140,479 | 134,242 | 134,242 | 1 | % | 6 | % | |||||||||||||||||||
Other intangible assets, net | 21,988 | 22,216 | 23,144 | 21,772 | 22,700 | (1 | )% | (3 | )% | |||||||||||||||||||
Premises and equipment, net | 305,244 | 308,779 | 314,764 | 299,740 | 303,273 | (1 | )% | 1 | % | |||||||||||||||||||
Real estate acquired by foreclosure (f) | 71,562 | 71,626 | 69,901 | 54,672 | 60,690 | * | 18 | % | ||||||||||||||||||||
Allowance for loan losses (Restricted - $4.4 million) (a) | (253,809 | ) | (255,710 | ) | (261,934 | ) | (265,218 | ) | (276,963 | ) | (1 | )% | (8 | )% | ||||||||||||||
Derivative assets | 181,866 | 215,116 | 235,759 | 274,332 | 292,472 | (15 | )% | (38 | )% | |||||||||||||||||||
Other assets (Restricted - $1.9 million) (a) | 1,688,127 | 1,637,139 | 1,605,344 | 1,663,092 | 1,670,840 | 3 | % | 1 | % | |||||||||||||||||||
|
|
|
|
|
|
|
|
|
|
|
|
|
| |||||||||||||||
Total assets (Restricted - $.1 billion) (a) | $ | 23,792,576 | $ | 23,858,753 | $ | 24,852,800 | $ | 24,803,048 | $ | 25,334,019 | * | (6 | )% | |||||||||||||||
|
|
|
|
|
|
|
|
|
|
|
|
|
| |||||||||||||||
Liabilities and Equity: | ||||||||||||||||||||||||||||
Deposits: | ||||||||||||||||||||||||||||
Savings | $ | 6,732,326 | $ | 6,781,522 | $ | 6,928,447 | $ | 6,498,832 | $ | 6,705,496 | (1 | )% | * | |||||||||||||||
Other interest-bearing deposits | 3,859,079 | 3,494,236 | 3,825,235 | 3,740,257 | 3,798,313 | 10 | % | 2 | % | |||||||||||||||||||
Time deposits | 951,755 | 997,726 | 1,051,327 | 988,375 | 1,019,938 | (5 | )% | (7 | )% | |||||||||||||||||||
|
|
|
|
|
|
|
|
|
|
|
|
|
| |||||||||||||||
Total interest-bearing core deposits | 11,543,160 | 11,273,484 | 11,805,009 | 11,227,464 | 11,523,747 | 2 | % | * | ||||||||||||||||||||
Noninterest-bearing deposits | 4,637,839 | 4,434,746 | 4,603,954 | 4,454,045 | 4,602,472 | 5 | % | 1 | % | |||||||||||||||||||
|
|
|
|
|
|
|
|
|
|
|
|
|
| |||||||||||||||
Total core deposits (g) | 16,180,999 | 15,708,230 | 16,408,963 | 15,681,509 | 16,126,219 | 3 | % | * | ||||||||||||||||||||
|
|
|
|
|
|
|
|
|
|
|
|
|
| |||||||||||||||
Certificates of deposit $100,000 and more | 553,957 | 575,679 | 602,921 | 522,958 | 503,490 | (4 | )% | 10 | % | |||||||||||||||||||
|
|
|
|
|
|
|
|
|
|
|
|
|
| |||||||||||||||
Total deposits | 16,734,956 | 16,283,909 | 17,011,884 | 16,204,467 | 16,629,709 | 3 | % | 1 | % | |||||||||||||||||||
|
|
|
|
|
|
|
|
|
|
|
|
|
| |||||||||||||||
Federal funds purchased | 1,042,633 | 1,062,901 | 1,142,749 | 1,361,670 | 1,351,023 | (2 | )% | (23 | )% | |||||||||||||||||||
Securities sold under agreements to repurchase | 442,789 | 427,232 | 433,761 | 488,010 | 555,438 | 4 | % | (20 | )% | |||||||||||||||||||
Trading liabilities | 368,348 | 585,969 | 596,869 | 781,306 | 564,429 | (37 | )% | (35 | )% | |||||||||||||||||||
Other short-term borrowings | 181,146 | 303,686 | 446,909 | 186,898 | 441,201 | (40 | )% | (59 | )% | |||||||||||||||||||
Term borrowings (Restricted - $.1 billion) (a) (h) | 1,739,859 | 1,771,288 | 1,800,255 | 2,197,864 | 2,226,482 | (2 | )% | (22 | )% | |||||||||||||||||||
Capital markets payables (c) | 21,173 | 53,784 | 90,231 | 97,954 | 110,329 | (61 | )% | (81 | )% | |||||||||||||||||||
Derivative liabilities | 154,280 | 165,918 | 198,489 | 199,999 | 202,269 | (7 | )% | (24 | )% | |||||||||||||||||||
Other liabilities | 606,899 | 770,773 | 585,245 | 685,153 | 743,933 | (21 | )% | (18 | )% | |||||||||||||||||||
|
|
|
|
|
|
|
|
|
|
|
|
|
| |||||||||||||||
Total liabilities (Restricted - $.1 billion) (a) | 21,292,083 | 21,425,460 | 22,306,392 | 22,203,321 | 22,824,813 | (1 | )% | (7 | )% | |||||||||||||||||||
|
|
|
|
|
|
|
|
|
|
|
|
|
| |||||||||||||||
Equity: | ||||||||||||||||||||||||||||
Common stock (i) | 147,731 | 147,705 | 150,347 | 150,766 | 152,249 | * | (3 | )% | ||||||||||||||||||||
Capital surplus (i) (j) | 1,416,767 | 1,413,248 | 1,416,563 | 1,461,292 | 1,488,463 | * | (5 | )% | ||||||||||||||||||||
Undivided profits | 694,949 | 657,676 | 777,108 | 748,427 | 719,672 | 6 | % | (3 | )% | |||||||||||||||||||
Accumulated other comprehensive loss, net | (150,009 | ) | (176,391 | ) | (188,665 | ) | (151,639 | ) | (146,343 | ) | (15 | )% | 3 | % | ||||||||||||||
Preferred stock | 95,624 | 95,624 | 95,624 | 95,624 | — | * | NM | |||||||||||||||||||||
Noncontrolling interest (k) | 295,431 | 295,431 | 295,431 | 295,257 | 295,165 | * | * | |||||||||||||||||||||
|
|
|
|
|
|
|
|
|
|
|
|
|
| |||||||||||||||
Total equity | 2,500,493 | 2,433,293 | 2,546,408 | 2,599,727 | 2,509,206 | 3 | % | * | ||||||||||||||||||||
|
|
|
|
|
|
|
|
|
|
|
|
|
| |||||||||||||||
Total liabilities and equity | $ | 23,792,576 | $ | 23,858,753 | $ | 24,852,800 | $ | 24,803,048 | $ | 25,334,019 | * | (6 | )% | |||||||||||||||
|
|
|
|
|
|
|
|
|
|
|
|
|
| |||||||||||||||
NM - Not meaningful
| * | Amount is less than one percent. |
Certain previously reported amounts have been reclassified to agree with current presentation.
| (a) | Restricted balances parenthetically presented are as of December 31, 2013. |
| (b) | Includes excess balances held at Fed. |
| (c) | Balances reflect the net presentation of certain capital markets receivables and payables. Prior periods have been revised for comparability. |
| (d) | Decrease in 4Q13 reflects transfers associated with an agreement to sell mortgage servicing rights entered into in 3Q13. Transfers will continue into 2014. |
| (e) | 2Q13 increase driven by the MNB acquisition. |
| (f) | 4Q13 includes $25.8 million of foreclosed assets related to government insured mortgages. |
| (g) | 4Q13 average core deposits were $15.7 billion. |
| (h) | In 2Q13 $350.0 million of subordinated notes matured. |
| (i) | Decreases relate to shares purchased under the share repurchase program. |
| (j) | 2Q13 decrease related to $40.0 million prepaid share repurchase agreement. The shares were delivered to FHN in 3Q13. |
| (k) | Consists of preferred stock of subsidiary. |
9
Table of Contents
FHN CONSOLIDATED AVERAGE BALANCE SHEET
Quarterly, Unaudited
| 4Q13 Changes vs. | Twelve months ended | 2013 vs. | ||||||||||||||||||||||||||||||||||||||
(Thousands) | 4Q13 | 3Q13 | 2Q13 | 1Q13 | 4Q12 | 3Q13 | 4Q12 | 2013 | 2012 | 2012 | ||||||||||||||||||||||||||||||
Assets: | ||||||||||||||||||||||||||||||||||||||||
Earning assets: | ||||||||||||||||||||||||||||||||||||||||
Loans, net of unearned income: | ||||||||||||||||||||||||||||||||||||||||
Commercial, financial, and industrial (C&I) | $ | 7,694,029 | $ | 7,888,297 | $ | 8,121,219 | $ | 8,199,249 | $ | 8,330,961 | (2 | )% | (8 | )% | $ | 7,972,875 | $ | 7,994,102 | * | |||||||||||||||||||||
Commercial real estate | 1,164,748 | 1,215,586 | 1,134,268 | 1,161,467 | 1,237,774 | (4 | )% | (6 | )% | 1,170,618 | 1,307,001 | (10 | )% | |||||||||||||||||||||||||||
Consumer real estate | 5,400,751 | 5,502,825 | 5,561,689 | 5,644,275 | 5,757,724 | (2 | )% | (6 | )% | 5,526,386 | 5,829,089 | (5 | )% | |||||||||||||||||||||||||||
Permanent mortgage | 678,938 | 721,554 | 771,253 | 801,000 | 788,428 | (6 | )% | (14 | )% | 742,793 | 795,014 | (7 | )% | |||||||||||||||||||||||||||
Credit card and other | 334,887 | 323,551 | 304,561 | 291,221 | 288,412 | 4 | % | 16 | % | 313,702 | 280,197 | 12 | % | |||||||||||||||||||||||||||
|
|
|
|
|
|
|
|
|
|
|
|
|
|
|
|
|
|
|
| |||||||||||||||||||||
Total loans, net of unearned income (Restricted - $.1 billion) (a) (b) | 15,273,353 | 15,651,813 | 15,892,990 | 16,097,212 | 16,403,299 | (2 | )% | (7 | )% | 15,726,374 | 16,205,403 | (3 | )% | |||||||||||||||||||||||||||
|
|
|
|
|
|
|
|
|
|
|
|
|
|
|
|
|
|
|
| |||||||||||||||||||||
Loans held-for-sale | 368,373 | 378,263 | 389,273 | 392,272 | 403,750 | (3 | )% | (9 | )% | 381,969 | 416,616 | (8 | )% | |||||||||||||||||||||||||||
Investment securities: | ||||||||||||||||||||||||||||||||||||||||
U.S. treasuries | 39,994 | 41,303 | 40,815 | 44,107 | 43,909 | (3 | )% | (9 | )% | 41,543 | 42,248 | (2 | )% | |||||||||||||||||||||||||||
U.S. government agencies | 2,959,355 | 2,900,838 | 2,924,012 | 2,818,958 | 2,774,175 | 2 | % | 7 | % | 2,901,175 | 2,862,848 | 1 | % | |||||||||||||||||||||||||||
States and municipalities | 15,155 | 15,246 | 15,390 | 15,255 | 17,169 | (1 | )% | (12 | )% | 15,261 | 17,802 | (14 | )% | |||||||||||||||||||||||||||
Other | 229,728 | 224,213 | 218,701 | 216,860 | 222,058 | 2 | % | 3 | % | 222,416 | 222,569 | * | ||||||||||||||||||||||||||||
|
|
|
|
|
|
|
|
|
|
|
|
|
|
|
|
|
|
|
| |||||||||||||||||||||
Total investment securities | 3,244,232 | 3,181,600 | 3,198,918 | 3,095,180 | 3,057,311 | 2 | % | 6 | % | 3,180,395 | 3,145,467 | 1 | % | |||||||||||||||||||||||||||
|
|
|
|
|
|
|
|
|
|
|
|
|
|
|
|
|
|
|
| |||||||||||||||||||||
Capital markets securities inventory | 1,159,570 | 1,156,262 | 1,310,044 | 1,308,969 | 1,250,423 | * | (7 | )% | 1,233,090 | 1,261,086 | (2 | )% | ||||||||||||||||||||||||||||
Mortgage banking trading securities | 12,712 | 15,558 | 16,398 | 17,486 | 18,844 | (18 | )% | (33 | )% | 15,526 | 21,885 | (29 | )% | |||||||||||||||||||||||||||
Other earning assets: | ||||||||||||||||||||||||||||||||||||||||
Federal funds sold | 19,471 | 28,498 | 26,698 | 24,173 | 24,701 | (32 | )% | (21 | )% | 24,708 | 22,704 | 9 | % | |||||||||||||||||||||||||||
Securities purchased under agreements to resell | 581,798 | 593,978 | 705,129 | 754,630 | 586,258 | (2 | )% | (1 | )% | 658,232 | 586,191 | 12 | % | |||||||||||||||||||||||||||
Interest-bearing cash (c) | 614,628 | 537,631 | 401,236 | 653,712 | 522,529 | 14 | % | 18 | % | 551,656 | 565,470 | (2 | )% | |||||||||||||||||||||||||||
|
|
|
|
|
|
|
|
|
|
|
|
|
|
|
|
|
|
|
| |||||||||||||||||||||
Total other earning assets | 1,215,897 | 1,160,107 | 1,133,063 | 1,432,515 | 1,133,488 | 5 | % | 7 | % | 1,234,596 | 1,174,365 | 5 | % | |||||||||||||||||||||||||||
|
|
|
|
|
|
|
|
|
|
|
|
|
|
|
|
|
|
|
| |||||||||||||||||||||
Total earnings assets (Restricted - $.1 billion) (a) | 21,274,137 | 21,543,603 | 21,940,686 | 22,343,634 | 22,267,115 | (1 | )% | (4 | )% | 21,771,950 | 22,224,822 | (2 | )% | |||||||||||||||||||||||||||
|
|
|
|
|
|
|
|
|
|
|
|
|
|
|
|
|
|
|
| |||||||||||||||||||||
Allowance for loan losses (Restricted - $3.8 million) (a) | (250,074 | ) | (256,789 | ) | (260,944 | ) | (270,385 | ) | (306,583 | ) | (3 | )% | (18 | )% | (259,485 | ) | (331,198 | ) | (22 | )% | ||||||||||||||||||||
Cash and due from banks (Restricted - $1.6 million) (a) | 341,066 | 351,972 | 342,053 | 348,581 | 349,002 | (3 | )% | (2 | )% | 345,914 | 344,305 | * | ||||||||||||||||||||||||||||
Capital markets receivables (d) | 45,179 | 82,289 | 97,851 | 88,211 | 101,233 | (45 | )% | (55 | )% | 78,275 | 103,562 | (24 | )% | |||||||||||||||||||||||||||
Premises and equipment, net | 307,285 | 308,199 | 302,263 | 299,846 | 303,921 | * | 1 | % | 304,429 | 310,115 | (2 | )% | ||||||||||||||||||||||||||||
Derivative assets | 201,609 | 209,878 | 257,181 | 286,243 | 317,076 | (4 | )% | (36 | )% | 238,417 | 335,268 | (29 | )% | |||||||||||||||||||||||||||
Other assets (Restricted - $1.7 million) (a) | 1,926,109 | 1,942,481 | 1,903,728 | 1,948,417 | 1,925,664 | (1 | )% | * | 1,930,156 | 2,066,430 | (7 | )% | ||||||||||||||||||||||||||||
|
|
|
|
|
|
|
|
|
|
|
|
|
|
|
|
|
|
|
| |||||||||||||||||||||
Total assets (Restricted - $.1 billion) (a) | $ | 23,845,311 | $ | 24,181,633 | $ | 24,582,818 | $ | 25,044,547 | $ | 24,957,428 | (1 | )% | (4 | )% | $ | 24,409,656 | $ | 25,053,304 | (3 | )% | ||||||||||||||||||||
|
|
|
|
|
|
|
|
|
|
|
|
|
|
|
|
|
|
|
| |||||||||||||||||||||
Liabilities and equity: | ||||||||||||||||||||||||||||||||||||||||
Interest-bearing liabilities: | ||||||||||||||||||||||||||||||||||||||||
Interest-bearing deposits: | ||||||||||||||||||||||||||||||||||||||||
Savings | $ | 6,642,159 | $ | 6,957,875 | $ | 6,516,889 | $ | 6,593,590 | $ | 6,529,453 | (5 | )% | 2 | % | $ | 6,678,529 | $ | 6,403,738 | 4 | % | ||||||||||||||||||||
Other interest-bearing deposits | 3,520,348 | 3,494,211 | 3,645,674 | 3,709,988 | 3,469,711 | 1 | % | 1 | % | 3,591,766 | 3,414,094 | 5 | % | |||||||||||||||||||||||||||
Time deposits | 977,107 | 1,025,788 | 998,762 | 1,004,887 | 1,038,672 | (5 | )% | (6 | )% | 1,001,626 | 1,101,158 | (9 | )% | |||||||||||||||||||||||||||
|
|
|
|
|
|
|
|
|
|
|
|
|
|
|
|
|
|
|
| |||||||||||||||||||||
Total interest-bearing core deposits | 11,139,614 | 11,477,874 | 11,161,325 | 11,308,465 | 11,037,836 | (3 | )% | 1 | % | 11,271,921 | 10,918,990 | 3 | % | |||||||||||||||||||||||||||
Certificates of deposit $100,000 and more | 580,760 | 594,536 | 542,244 | 516,785 | 514,543 | (2 | )% | 13 | % | 558,855 | 604,883 | (8 | )% | |||||||||||||||||||||||||||
Federal funds purchased | 1,236,763 | 1,119,273 | 1,224,070 | 1,479,316 | 1,538,970 | 10 | % | (20 | )% | 1,263,792 | 1,548,020 | (18 | )% | |||||||||||||||||||||||||||
Securities sold under agreements to repurchase | 446,894 | 452,940 | 480,960 | 572,666 | 457,493 | (1 | )% | (2 | )% | 487,923 | 380,871 | 28 | % | |||||||||||||||||||||||||||
Capital markets trading liabilities | 567,531 | 598,195 | 718,309 | 779,409 | 597,402 | (5 | )% | (5 | )% | 665,095 | 589,461 | 13 | % | |||||||||||||||||||||||||||
Other short-term borrowings | 219,593 | 243,195 | 525,493 | 209,376 | 272,578 | (10 | )% | (19 | )% | 299,288 | 450,690 | (34 | )% | |||||||||||||||||||||||||||
Term borrowings (Restricted - $.1 billion) (a) (e) | 1,764,476 | 1,792,250 | 2,007,372 | 2,221,297 | 2,254,445 | (2 | )% | (22 | )% | 1,944,675 | 2,326,753 | (16 | )% | |||||||||||||||||||||||||||
|
|
|
|
|
|
|
|
|
|
|
|
|
|
|
|
|
|
|
| |||||||||||||||||||||
Total interest-bearing liabilities | 15,955,631 | 16,278,263 | 16,659,773 | 17,087,314 | 16,673,267 | (2 | )% | (4 | )% | 16,491,549 | 16,819,668 | (2 | )% | |||||||||||||||||||||||||||
|
|
|
|
|
|
|
|
|
|
|
|
|
|
|
|
|
|
|
| |||||||||||||||||||||
Noninterest-bearing deposits | 4,559,023 | 4,542,127 | 4,493,440 | 4,441,411 | 4,770,935 | * | (4 | )% | 4,509,413 | 4,688,093 | (4 | )% | ||||||||||||||||||||||||||||
Capital markets payables (d) | 32,896 | 57,275 | 58,435 | 57,859 | 68,403 | (43 | )% | (52 | )% | 51,563 | 70,435 | (27 | )% | |||||||||||||||||||||||||||
Derivative liabilities | 159,575 | 161,611 | 184,192 | 194,892 | 211,598 | (1 | )% | (25 | )% | 174,934 | 227,765 | (23 | )% | |||||||||||||||||||||||||||
Other liabilities | 666,312 | 660,458 | 598,854 | 683,596 | 689,782 | 1 | % | (3 | )% | 652,281 | 639,562 | 2 | % | |||||||||||||||||||||||||||
|
|
|
|
|
|
|
|
|
|
|
|
|
|
|
|
|
|
|
| |||||||||||||||||||||
Total liabilities (Restricted - $.1 billion) (a) | 21,373,437 | 21,699,734 | 21,994,694 | 22,465,072 | 22,413,985 | (2 | )% | (5 | )% | 21,879,740 | 22,445,523 | (3 | )% | |||||||||||||||||||||||||||
|
|
|
|
|
|
|
|
|
|
|
|
|
|
|
|
|
|
|
| |||||||||||||||||||||
Equity: | ||||||||||||||||||||||||||||||||||||||||
Common stock | 147,724 | 149,000 | 150,468 | 151,613 | 153,691 | (1 | )% | (4 | )% | 149,688 | 156,298 | (4 | )% | |||||||||||||||||||||||||||
Capital surplus | 1,414,810 | 1,418,259 | 1,430,998 | 1,476,797 | 1,507,087 | * | (6 | )% | 1,435,000 | 1,540,513 | (7 | )% | ||||||||||||||||||||||||||||
Undivided profits | 691,958 | 715,451 | 771,953 | 742,070 | 705,835 | (3 | )% | (2 | )% | 730,181 | 736,826 | (1 | )% | |||||||||||||||||||||||||||
Accumulated other comprehensive loss, net | (173,673 | ) | (191,866 | ) | (156,178 | ) | (150,093 | ) | (118,335 | ) | (9 | )% | 47 | % | (168,083 | ) | (121,021 | ) | 39 | % | ||||||||||||||||||||
Preferred stock | 95,624 | 95,624 | 95,624 | 63,831 | — | * | NM | 87,785 | — | NM | ||||||||||||||||||||||||||||||
Noncontrolling interest | 295,431 | 295,431 | 295,259 | 295,257 | 295,165 | * | * | 295,345 | 295,165 | * | ||||||||||||||||||||||||||||||
|
|
|
|
|
|
|
|
|
|
|
|
|
|
|
|
|
|
|
| |||||||||||||||||||||
Total equity | 2,471,874 | 2,481,899 | 2,588,124 | 2,579,475 | 2,543,443 | * | (3 | )% | 2,529,916 | 2,607,781 | (3 | )% | ||||||||||||||||||||||||||||
|
|
|
|
|
|
|
|
|
|
|
|
|
|
|
|
|
|
|
| |||||||||||||||||||||
Total liabilities and equity | $ | 23,845,311 | $ | 24,181,633 | $ | 24,582,818 | $ | 25,044,547 | $ | 24,957,428 | (1 | )% | (4 | )% | $ | 24,409,656 | $ | 25,053,304 | (3 | )% | ||||||||||||||||||||
|
|
|
|
|
|
|
|
|
|
|
|
|
|
|
|
|
|
|
| |||||||||||||||||||||
NM - Not meaningful
| * | Amount is less than one percent. |
Certain previously reported amounts have been reclassified to agree with current presentation.
| (a) | Restricted balances parenthetically presented are quarterly averages as of December 31, 2013. |
| (b) | Includes loans on nonaccrual status. |
| (c) | Includes excess balances held at Fed. |
| (d) | Balances reflect the net presentation of certain capital markets receivables and payables. Prior periods have been revised for comparability. |
| (e) | In 2Q13 $350.0 million of subordinated notes matured. |
10
Table of Contents
FHN CONSOLIDATED NET INTEREST INCOME (a)
Quarterly, Unaudited
| 4Q13 Changes vs. | ||||||||||||||||||||||||||||
(Thousands) | 4Q13 | 3Q13 | 2Q13 | 1Q13 | 4Q12 | 3Q13 | 4Q12 | |||||||||||||||||||||
Interest Income: | ||||||||||||||||||||||||||||
Loans, net of unearned income (b) | $ | 147,322 | $ | 151,504 | $ | 153,070 | $ | 154,955 | $ | 163,693 | (3 | )% | (10 | )% | ||||||||||||||
Loans held-for-sale | 3,253 | 3,058 | 3,169 | 3,502 | 3,732 | 6 | % | (13 | )% | |||||||||||||||||||
Investment securities: | ||||||||||||||||||||||||||||
U.S. treasuries | 4 | 10 | 11 | 8 | 11 | (60 | )% | (64 | )% | |||||||||||||||||||
U.S. government agencies | 19,020 | 18,537 | 18,321 | 18,507 | 19,536 | 3 | % | (3 | )% | |||||||||||||||||||
States and municipalities | 21 | 21 | 25 | 23 | 6 | * | NM | |||||||||||||||||||||
Other | 2,307 | 2,355 | 2,315 | 2,332 | 2,495 | (2 | )% | (8 | )% | |||||||||||||||||||
|
|
|
|
|
|
|
|
|
|
|
|
|
| |||||||||||||||
Total investment securities | 21,352 | 20,923 | 20,672 | 20,870 | 22,048 | 2 | % | (3 | )% | |||||||||||||||||||
|
|
|
|
|
|
|
|
|
|
|
|
|
| |||||||||||||||
Capital markets securities inventory | 8,631 | 8,425 | 8,467 | 7,901 | 7,565 | 2 | % | 14 | % | |||||||||||||||||||
Mortgage banking trading securities | 247 | 403 | 452 | 489 | 534 | (39 | )% | (54 | )% | |||||||||||||||||||
Other earning assets: | ||||||||||||||||||||||||||||
Federal funds sold | 48 | 73 | 66 | 61 | 64 | (34 | )% | (25 | )% | |||||||||||||||||||
Securities purchased under agreements to resell (c) | (99 | ) | (171 | ) | (189 | ) | 44 | 118 | 42 | % | NM | |||||||||||||||||
Interest-bearing cash | 343 | 289 | 197 | 364 | 287 | 19 | % | 20 | % | |||||||||||||||||||
|
|
|
|
|
|
|
|
|
|
|
|
|
| |||||||||||||||
Total other earning assets | 292 | 191 | 74 | 469 | 469 | 53 | % | (38 | )% | |||||||||||||||||||
|
|
|
|
|
|
|
|
|
|
|
|
|
| |||||||||||||||
Interest income | $ | 181,097 | $ | 184,504 | $ | 185,904 | $ | 188,186 | $ | 198,041 | (2 | )% | (9 | )% | ||||||||||||||
|
|
|
|
|
|
|
|
|
|
|
|
|
| |||||||||||||||
Interest Expense: | ||||||||||||||||||||||||||||
Interest-bearing deposits: | ||||||||||||||||||||||||||||
Savings | $ | 3,205 | $ | 3,471 | $ | 3,689 | $ | 4,397 | $ | 4,617 | (8 | )% | (31 | )% | ||||||||||||||
Other interest-bearing deposits | 772 | 817 | 1,013 | 1,145 | 1,268 | (6 | )% | (39 | )% | |||||||||||||||||||
Time deposits | 3,585 | 4,013 | 4,064 | 4,217 | 4,639 | (11 | )% | (23 | )% | |||||||||||||||||||
|
|
|
|
|
|
|
|
|
|
|
|
|
| |||||||||||||||
Total interest-bearing core deposits | 7,562 | 8,301 | 8,766 | 9,759 | 10,524 | (9 | )% | (28 | )% | |||||||||||||||||||
Certificates of deposit $100,000 and more (d) | 873 | 1,658 | 1,550 | 1,561 | 1,725 | (47 | )% | (49 | )% | |||||||||||||||||||
Federal funds purchased | 791 | 716 | 777 | 932 | 985 | 10 | % | (20 | )% | |||||||||||||||||||
Securities sold under agreements to repurchase | 126 | 148 | 134 | 268 | 211 | (15 | )% | (40 | )% | |||||||||||||||||||
Capital markets trading liabilities | 3,442 | 3,632 | 3,354 | 3,196 | 2,536 | (5 | )% | 36 | % | |||||||||||||||||||
Other short-term borrowings | 222 | 239 | 245 | 106 | 132 | (7 | )% | 68 | % | |||||||||||||||||||
Term borrowings | 8,902 | 9,078 | 9,146 | 9,195 | 9,488 | (2 | )% | (6 | )% | |||||||||||||||||||
|
|
|
|
|
|
|
|
|
|
|
|
|
| |||||||||||||||
Interest expense | 21,918 | 23,772 | 23,972 | 25,017 | 25,601 | (8 | )% | (14 | )% | |||||||||||||||||||
|
|
|
|
|
|
|
|
|
|
|
|
|
| |||||||||||||||
Net interest income - tax equivalent basis | 159,179 | 160,732 | 161,932 | 163,169 | 172,440 | (1 | )% | (8 | )% | |||||||||||||||||||
Fully taxable equivalent adjustment | (2,044 | ) | (1,894 | ) | (1,913 | ) | (1,787 | ) | (1,842 | ) | (8 | )% | (11 | )% | ||||||||||||||
|
|
|
|
|
|
|
|
|
|
|
|
|
| |||||||||||||||
Net interest income | $ | 157,135 | $ | 158,838 | $ | 160,019 | $ | 161,382 | $ | 170,598 | (1 | )% | (8 | )% | ||||||||||||||
|
|
|
|
|
|
|
|
|
|
|
|
|
| |||||||||||||||
NM - Not meaningful
| * | Amount is less than one percent. |
| (a) | Net interest income adjusted to a FTE basis. |
| (b) | Includes loans on nonaccrual status. |
| (c) | 4Q13, 3Q13 and 2Q13 driven by negative market rates on reverse repurchase agreements. |
| (d) | 4Q13 includes the effect of amortizing the valuation adjustment for acquired time deposits related to the MNB acquisition. |
11
Table of Contents
FHN CONSOLIDATED AVERAGE BALANCE SHEET: YIELDS AND RATES
Quarterly, Unaudited
| 4Q13 | 3Q13 | 2Q13 | 1Q13 | 4Q12 | ||||||||||||||||
Assets: | ||||||||||||||||||||
Earning assets (a): | ||||||||||||||||||||
Loans, net of unearned income: | ||||||||||||||||||||
Commercial loans | 3.66 | % | 3.69 | % | 3.68 | % | 3.70 | % | 3.83 | % | ||||||||||
Retail loans | 4.07 | 4.06 | 4.12 | 4.16 | 4.18 | |||||||||||||||
|
|
|
|
|
|
|
|
|
| |||||||||||
Total loans, net of unearned income (b) | 3.83 | 3.85 | 3.86 | 3.89 | 3.98 | |||||||||||||||
|
|
|
|
|
|
|
|
|
| |||||||||||
Loans held-for-sale | 3.53 | 3.23 | 3.26 | 3.57 | 3.70 | |||||||||||||||
Investment securities: | ||||||||||||||||||||
U.S. treasuries | 0.04 | 0.09 | 0.11 | 0.07 | 0.10 | |||||||||||||||
U.S. government agencies | 2.57 | 2.56 | 2.51 | 2.63 | 2.82 | |||||||||||||||
States and municipalities | 0.56 | 0.55 | 0.65 | 0.59 | 0.13 | |||||||||||||||
Other | 4.02 | 4.20 | 4.23 | 4.30 | 4.49 | |||||||||||||||
|
|
|
|
|
|
|
|
|
| |||||||||||
Total investment securities | 2.63 | 2.63 | 2.58 | 2.70 | 2.88 | |||||||||||||||
|
|
|
|
|
|
|
|
|
| |||||||||||
Capital markets securities inventory | 2.98 | 2.91 | 2.59 | 2.41 | 2.42 | |||||||||||||||
Mortgage banking trading securities | 7.79 | 10.36 | 11.02 | 11.19 | 11.34 | |||||||||||||||
Other earning assets: | ||||||||||||||||||||
Federal funds sold | 0.98 | 1.01 | 0.99 | 1.02 | 1.02 | |||||||||||||||
Securities purchased under agreements to resell (c) | (0.07 | ) | (0.11 | ) | (0.11 | ) | 0.02 | 0.08 | ||||||||||||
Interest-bearing cash | 0.22 | 0.21 | 0.20 | 0.23 | 0.22 | |||||||||||||||
|
|
|
|
|
|
|
|
|
| |||||||||||
Total other earning assets | 0.10 | 0.07 | 0.03 | 0.13 | 0.16 | |||||||||||||||
|
|
|
|
|
|
|
|
|
| |||||||||||
Interest income/total earning assets | 3.39 | % | 3.41 | % | 3.40 | % | 3.40 | % | 3.55 | % | ||||||||||
|
|
|
|
|
|
|
|
|
| |||||||||||
Liabilities: | ||||||||||||||||||||
Interest-bearing liabilities: | ||||||||||||||||||||
Interest-bearing deposits: | ||||||||||||||||||||
Savings | 0.19 | % | 0.20 | % | 0.23 | % | 0.27 | % | 0.28 | % | ||||||||||
Other interest-bearing deposits | 0.09 | 0.09 | 0.11 | 0.13 | 0.15 | |||||||||||||||
Time deposits | 1.46 | 1.55 | 1.63 | 1.70 | 1.78 | |||||||||||||||
|
|
|
|
|
|
|
|
|
| |||||||||||
Total interest-bearing core deposits | 0.27 | 0.29 | 0.32 | 0.35 | 0.38 | |||||||||||||||
Certificates of deposit $100,000 and more (d) | 0.60 | 1.11 | 1.15 | 1.23 | 1.33 | |||||||||||||||
Federal funds purchased | 0.25 | 0.25 | 0.25 | 0.26 | 0.25 | |||||||||||||||
Securities sold under agreements to repurchase | 0.11 | 0.13 | 0.11 | 0.19 | 0.18 | |||||||||||||||
Capital markets trading liabilities | 2.41 | 2.41 | 1.87 | 1.66 | 1.69 | |||||||||||||||
Other short-term borrowings | 0.40 | 0.39 | 0.19 | 0.21 | 0.19 | |||||||||||||||
Term borrowings (e) | 2.02 | 2.03 | 1.82 | 1.66 | 1.69 | |||||||||||||||
|
|
|
|
|
|
|
|
|
| |||||||||||
Interest expense/total interest-bearing liabilities | 0.55 | 0.58 | 0.58 | 0.59 | 0.61 | |||||||||||||||
|
|
|
|
|
|
|
|
|
| |||||||||||
Net interest spread | 2.84 | % | 2.83 | % | 2.82 | % | 2.81 | % | 2.94 | % | ||||||||||
Effect of interest-free sources used to fund earning assets | 0.14 | 0.14 | 0.14 | 0.14 | 0.15 | |||||||||||||||
|
|
|
|
|
|
|
|
|
| |||||||||||
Net interest margin | 2.98 | % | 2.97 | % | 2.96 | % | 2.95 | % | 3.09 | % | ||||||||||
|
|
|
|
|
|
|
|
|
| |||||||||||
Yields are adjusted to a FTE basis. Refer to the Non-GAAP to GAAP Reconciliation on page 26 for reconciliation of net interest income (GAAP) to net interest income adjusted for impact of FTE (non-GAAP).
| (a) | Earning assets yields are expressed net of unearned income. |
| (b) | Includes loans on nonaccrual status. |
| (c) | 4Q13, 3Q13 and 2Q13 driven by negative market rates on reverse repurchase agreements. |
| (d) | 4Q13 rate includes the effect of amortizing the valuation adjustment for acquired time deposits related to the MNB acquisition. |
| (e) | Rates are expressed net of unamortized debenture cost for term borrowings. |
12
Table of Contents
FHN CHARGES FOR RESTRUCTURING, REPOSITIONING, & EFFICIENCY INITIATIVES
Quarterly, Unaudited
(Thousands) | 4Q13 | 3Q13 | 2Q13 | 1Q13 | 4Q12 | |||||||||||||||
By Income Statement Impact | ||||||||||||||||||||
Noninterest income | ||||||||||||||||||||
Mortgage banking (a) | $ | — | $ | (2,192 | ) | $ | — | $ | — | $ | (348 | ) | ||||||||
Gain/(loss) on divestiture | (4 | ) | 115 | — | — | — | ||||||||||||||
Noninterest expense | ||||||||||||||||||||
Employee compensation, incentives, and benefits (b) | 1,071 | 1,160 | 641 | 819 | 18,128 | |||||||||||||||
Occupancy | (285 | ) | 38 | (60 | ) | 438 | 180 | |||||||||||||
All other expense | 16 | 369 | — | — | 17 | |||||||||||||||
|
|
|
|
|
|
|
|
|
| |||||||||||
Total loss before income taxes | (806 | ) | (3,644 | ) | (581 | ) | (1,257 | ) | (18,673 | ) | ||||||||||
Income from discontinued operations (c) | — | 250 | — | 735 | — | |||||||||||||||
|
|
|
|
|
|
|
|
|
| |||||||||||
Net impact resulting from restructuring, repositioning, and efficiency initiatives | $ | (806 | ) | $ | (3,394 | ) | $ | (581 | ) | $ | (522 | ) | $ | (18,673 | ) | |||||
|
|
|
|
|
|
|
|
|
| |||||||||||
| (a) | 3Q13 reflects estimated costs for obligations associated with the agreement to sell servicing; 4Q12 reflects adjustment due to contingencies associated with prior mortgage servicing sales. |
| (b) | 1Q13 and 4Q12 includes severance associated with an employee separation program. |
| (c) | Includes amounts related to Msaver, First Horizon Insurance, and Highland Capital. |
13
Table of Contents
Quarterly, Unaudited
| 4Q13 Changes vs. | ||||||||||||||||||||||||||||
(Thousands) | 4Q13 | 3Q13 | 2Q13 | 1Q13 | 4Q12 | 3Q13 | 4Q12 | |||||||||||||||||||||
First Liens | ||||||||||||||||||||||||||||
Fair value beginning balance | $ | 114,017 | $ | 111,076 | $ | 106,191 | $ | 111,314 | $ | 117,440 | ||||||||||||||||||
Reductions due to sale of MSRs | (39,633 | ) | — | — | — | — | ||||||||||||||||||||||
Reductions due to loan payments | (3,958 | ) | (5,989 | ) | (5,617 | ) | (5,374 | ) | (5,592 | ) | ||||||||||||||||||
Reductions due to exercise of cleanup calls | — | — | — | (495 | ) | — | ||||||||||||||||||||||
Changes in fair value due to: | ||||||||||||||||||||||||||||
Changes in valuation model inputs or assumptions (a) (b) | (83 | ) | 8,937 | 10,496 | 834 | (569 | ) | |||||||||||||||||||||
Other changes in fair value | (2 | ) | (7 | ) | 6 | (88 | ) | 35 | ||||||||||||||||||||
|
|
|
|
|
|
|
|
|
|
|
|
|
| |||||||||||||||
Fair value ending balance | $ | 70,341 | $ | 114,017 | $ | 111,076 | $ | 106,191 | $ | 111,314 | (38 | )% | (37 | )% | ||||||||||||||
|
|
|
|
|
|
|
|
|
|
|
|
|
| |||||||||||||||
Second Liens | ||||||||||||||||||||||||||||
Fair value beginning balance | $ | 166 | $ | 172 | $ | 193 | $ | 196 | $ | 205 | ||||||||||||||||||
Reductions due to loan payments | (5 | ) | (6 | ) | (21 | ) | (48 | ) | (9 | ) | ||||||||||||||||||
Changes in fair value due to: | ||||||||||||||||||||||||||||
Other changes in fair value | — | — | — | 45 | — | |||||||||||||||||||||||
|
|
|
|
|
|
|
|
|
|
|
|
|
| |||||||||||||||
Fair value ending balance | $ | 161 | $ | 166 | $ | 172 | $ | 193 | $ | 196 | (3 | )% | (18 | )% | ||||||||||||||
|
|
|
|
|
|
|
|
|
|
|
|
|
| |||||||||||||||
HELOC | ||||||||||||||||||||||||||||
Fair value beginning balance | $ | 2,503 | $ | 2,605 | $ | 2,718 | $ | 2,801 | $ | 2,892 | ||||||||||||||||||
Reductions due to loan payments | (212 | ) | (104 | ) | (113 | ) | (125 | ) | (91 | ) | ||||||||||||||||||
Changes in fair value due to: | ||||||||||||||||||||||||||||
Other changes in fair value | — | 2 | — | 42 | — | |||||||||||||||||||||||
|
|
|
|
|
|
|
|
|
|
|
|
|
| |||||||||||||||
Fair value ending balance | $ | 2,291 | $ | 2,503 | $ | 2,605 | $ | 2,718 | $ | 2,801 | (8 | )% | (18 | )% | ||||||||||||||
|
|
|
|
|
|
|
|
|
|
|
|
|
| |||||||||||||||
Total Consolidated | ||||||||||||||||||||||||||||
Fair value beginning balance | $ | 116,686 | $ | 113,853 | $ | 109,102 | $ | 114,311 | $ | 120,537 | ||||||||||||||||||
Reductions due to sale of MSRs | (39,633 | ) | — | — | — | — | ||||||||||||||||||||||
Reductions due to loan payments | (4,175 | ) | (6,099 | ) | (5,751 | ) | (5,547 | ) | (5,692 | ) | ||||||||||||||||||
Reductions due to exercise of cleanup calls | — | — | — | (495 | ) | — | ||||||||||||||||||||||
Changes in fair value due to: | ||||||||||||||||||||||||||||
Changes in valuation model inputs or assumptions (a) (b) | (83 | ) | 8,937 | 10,496 | 834 | (569 | ) | |||||||||||||||||||||
Other changes in fair value | (2 | ) | (5 | ) | 6 | (1 | ) | 35 | ||||||||||||||||||||
|
|
|
|
|
|
|
|
|
|
|
|
|
| |||||||||||||||
Fair value ending balance | $ | 72,793 | $ | 116,686 | $ | 113,853 | $ | 109,102 | $ | 114,311 | (38 | )% | (36 | )% | ||||||||||||||
|
|
|
|
|
|
|
|
|
|
|
|
|
| |||||||||||||||
| (a) | Principally reflects changes in discount rates and prepayment speed assumptions, mostly due to changes in interest rates. |
| (b) | In 3Q13, FHN agreed to sell substantially all its remaining legacy mortgage servicing. FHN used the price in the definitive agreement, as adjusted for the portion of pricing that was not specific to MSR and excess interest, as a third-party pricing source in the valuation of these assets. |
14
Table of Contents
FHN BUSINESS SEGMENT HIGHLIGHTS
Quarterly, Unaudited
| 4Q13 Changes vs. | Twelve Months Ended | 2013 vs. | ||||||||||||||||||||||||||||||||||||||
(Thousands) | 4Q13 | 3Q13 | 2Q13 | 1Q13 | 4Q12 | 3Q13 | 4Q12 | 2013 | 2012 | 2012 | ||||||||||||||||||||||||||||||
Regional Banking | ||||||||||||||||||||||||||||||||||||||||
Net interest income | $ | 146,430 | $ | 149,547 | $ | 148,222 | $ | 147,125 | $ | 154,927 | (2 | )% | (5 | )% | $ | 591,324 | $ | 605,495 | (2 | )% | ||||||||||||||||||||
Noninterest income | 62,807 | 63,883 | 61,885 | 59,144 | 64,097 | (2 | )% | (2 | )% | 247,719 | 253,455 | (2 | )% | |||||||||||||||||||||||||||
|
|
|
|
|
|
|
|
|
|
|
|
|
|
|
|
|
|
|
| |||||||||||||||||||||
Total revenues | 209,237 | 213,430 | 210,107 | 206,269 | 219,024 | (2 | )% | (4 | )% | 839,043 | 858,950 | (2 | )% | |||||||||||||||||||||||||||
Provision/(provision credit) for loan losses | 2,585 | 5,159 | 13,201 | (2,485 | ) | (1,231 | ) | (50 | )% | NM | 18,460 | (918 | ) | NM | ||||||||||||||||||||||||||
Noninterest expense | 139,084 | 131,851 | 129,515 | 130,937 | 144,031 | 5 | % | (3 | )% | 531,387 | 569,511 | (7 | )% | |||||||||||||||||||||||||||
|
|
|
|
|
|
|
|
|
|
|
|
|
|
|
|
|
|
|
| |||||||||||||||||||||
Income before income taxes | 67,568 | 76,420 | 67,391 | 77,817 | 76,224 | (12 | )% | (11 | )% | 289,196 | 290,357 | * | ||||||||||||||||||||||||||||
Provision for income taxes | 24,088 | 27,598 | 24,173 | 28,276 | 27,700 | (13 | )% | (13 | )% | 104,135 | 105,514 | (1 | )% | |||||||||||||||||||||||||||
|
|
|
|
|
|
|
|
|
|
|
|
|
|
|
|
|
|
|
| |||||||||||||||||||||
Net income | $ | 43,480 | $ | 48,822 | $ | 43,218 | $ | 49,541 | $ | 48,524 | (11 | )% | (10 | )% | $ | 185,061 | $ | 184,843 | * | |||||||||||||||||||||
|
|
|
|
|
|
|
|
|
|
|
|
|
|
|
|
|
|
|
| |||||||||||||||||||||
Capital Markets | ||||||||||||||||||||||||||||||||||||||||
Net interest income | $ | 4,299 | $ | 3,807 | $ | 4,094 | $ | 3,965 | $ | 4,348 | 13 | % | (1 | )% | $ | 16,165 | $ | 20,735 | (22 | )% | ||||||||||||||||||||
Noninterest income | 59,509 | 64,115 | 68,199 | 76,612 | 72,432 | (7 | )% | (18 | )% | 268,435 | 334,992 | (20 | )% | |||||||||||||||||||||||||||
|
|
|
|
|
|
|
|
|
|
|
|
|
|
|
|
|
|
|
| |||||||||||||||||||||
Total revenues | 63,808 | 67,922 | 72,293 | 80,577 | 76,780 | (6 | )% | (17 | )% | 284,600 | 355,727 | (20 | )% | |||||||||||||||||||||||||||
Noninterest expense | 53,213 | 58,034 | 59,926 | 61,666 | 57,541 | (8 | )% | (8 | )% | 232,839 | 263,385 | (12 | )% | |||||||||||||||||||||||||||
|
|
|
|
|
|
|
|
|
|
|
|
|
|
|
|
|
|
|
| |||||||||||||||||||||
Income before income taxes | 10,595 | 9,888 | 12,367 | 18,911 | 19,239 | 7 | % | (45 | )% | 51,761 | 92,342 | (44 | )% | |||||||||||||||||||||||||||
Provision for income taxes | 3,949 | 3,723 | 4,610 | 7,169 | 7,221 | 6 | % | (45 | )% | 19,451 | 34,890 | (44 | )% | |||||||||||||||||||||||||||
|
|
|
|
|
|
|
|
|
|
|
|
|
|
|
|
|
|
|
| |||||||||||||||||||||
Net income | $ | 6,646 | $ | 6,165 | $ | 7,757 | $ | 11,742 | $ | 12,018 | 8 | % | (45 | )% | $ | 32,310 | $ | 57,452 | (44 | )% | ||||||||||||||||||||
|
|
|
|
|
|
|
|
|
|
|
|
|
|
|
|
|
|
|
| |||||||||||||||||||||
Corporate | ||||||||||||||||||||||||||||||||||||||||
Net interest income/(expense) | $ | (10,411 | ) | $ | (11,653 | ) | $ | (11,180 | ) | $ | (10,058 | ) | $ | (10,128 | ) | 11 | % | (3 | )% | $ | (43,302 | ) | $ | (31,556 | ) | (37 | )% | |||||||||||||
Noninterest income | 7,830 | 6,558 | 3,811 | 7,855 | 5,992 | 19 | % | 31 | % | 26,054 | 26,949 | (3 | )% | |||||||||||||||||||||||||||
|
|
|
|
|
|
|
|
|
|
|
|
|
|
|
|
|
|
|
| |||||||||||||||||||||
Total revenues | (2,581 | ) | (5,095 | ) | (7,369 | ) | (2,203 | ) | (4,136 | ) | 49 | % | 38 | % | (17,248 | ) | (4,607 | ) | NM | |||||||||||||||||||||
Provision/(provision credit) for loan losses | — | — | — | — | 4 | NM | NM | — | 20 | NM | ||||||||||||||||||||||||||||||
Noninterest expense (a) | 18,721 | 21,685 | 17,095 | 17,570 | 36,109 | (14 | )% | (48 | )% | 75,071 | 99,167 | (24 | )% | |||||||||||||||||||||||||||
|
|
|
|
|
|
|
|
|
|
|
|
|
|
|
|
|
|
|
| |||||||||||||||||||||
Loss before income taxes | (21,302 | ) | (26,780 | ) | (24,464 | ) | (19,773 | ) | (40,249 | ) | 20 | % | 47 | % | (92,319 | ) | (103,794 | ) | 11 | % | ||||||||||||||||||||
Benefit for income taxes | (20,572 | ) | (16,571 | ) | (15,679 | ) | (12,065 | ) | (38,389 | ) | (24 | )% | 46 | % | (64,887 | ) | (79,131 | ) | 18 | % | ||||||||||||||||||||
|
|
|
|
|
|
|
|
|
|
|
|
|
|
|
|
|
|
|
| |||||||||||||||||||||
Net loss | $ | (730 | ) | $ | (10,209 | ) | $ | (8,785 | ) | $ | (7,708 | ) | $ | (1,860 | ) | 93 | % | 61 | % | $ | (27,432 | ) | $ | (24,663 | ) | (11 | )% | |||||||||||||
|
|
|
|
|
|
|
|
|
|
|
|
|
|
|
|
|
|
|
| |||||||||||||||||||||
Non-Strategic | ||||||||||||||||||||||||||||||||||||||||
Net interest income | $ | 16,817 | $ | 17,137 | $ | 18,883 | $ | 20,350 | $ | 21,451 | (2 | )% | (22 | )% | $ | 73,187 | $ | 93,993 | (22 | )% | ||||||||||||||||||||
Noninterest income | 4,897 | 15,919 | 8,737 | 12,816 | 3,922 | (69 | )% | 25 | % | 42,369 | 55,933 | (24 | )% | |||||||||||||||||||||||||||
|
|
|
|
|
|
|
|
|
|
|
|
|
|
|
|
|
|
|
| |||||||||||||||||||||
Total revenues | 21,714 | 33,056 | 27,620 | 33,166 | 25,373 | (34 | )% | (14 | )% | 115,556 | 149,926 | (23 | )% | |||||||||||||||||||||||||||
Provision for loan losses | 12,415 | 4,841 | 1,799 | 17,485 | 16,227 | NM | (23 | )% | 36,540 | 78,898 | (54 | )% | ||||||||||||||||||||||||||||
Noninterest expense | 49,079 | 221,986 | 20,872 | 30,367 | 33,680 | (78 | )% | 46 | % | 322,304 | 451,638 | (29 | )% | |||||||||||||||||||||||||||
|
|
|
|
|
|
|
|
|
|
|
|
|
|
|
|
|
|
|
| |||||||||||||||||||||
Income/(loss) before income taxes | (39,780 | ) | (193,771 | ) | 4,949 | (14,686 | ) | (24,534 | ) | 79 | % | (62 | )% | (243,288 | ) | (380,610 | ) | 36 | % | |||||||||||||||||||||
Provision/(benefit) for income taxes | (44,020 | ) | (45,844 | ) | 1,904 | (5,650 | ) | (9,446 | ) | 4 | % | NM | (93,610 | ) | (146,535 | ) | 36 | % | ||||||||||||||||||||||
|
|
|
|
|
|
|
|
|
|
|
|
|
|
|
|
|
|
|
| |||||||||||||||||||||
Income/(loss) from continuing operations | 4,240 | (147,927 | ) | 3,045 | (9,036 | ) | (15,088 | ) | NM | NM | (149,678 | ) | (234,075 | ) | 36 | % | ||||||||||||||||||||||||
Income/(loss) from discontinued operations, net of tax | (6 | ) | 123 | 1 | 430 | (12 | ) | NM | 50 | % | 548 | 148 | NM | |||||||||||||||||||||||||||
|
|
|
|
|
|
|
|
|
|
|
|
|
|
|
|
|
|
|
| |||||||||||||||||||||
Net income/(loss) | $ | 4,234 | $ | (147,804 | ) | $ | 3,046 | $ | (8,606 | ) | $ | (15,100 | ) | NM | NM | % | $ | (149,130 | ) | $ | (233,927 | ) | 36 | % | ||||||||||||||||
|
|
|
|
|
|
|
|
|
|
|
|
|
|
|
|
|
|
|
| |||||||||||||||||||||
Total Consolidated | ||||||||||||||||||||||||||||||||||||||||
Net interest income | $ | 157,135 | $ | 158,838 | $ | 160,019 | $ | 161,382 | $ | 170,598 | (1 | )% | (8 | )% | $ | 637,374 | $ | 688,667 | (7 | )% | ||||||||||||||||||||
Noninterest income | 135,043 | 150,475 | 142,632 | 156,427 | 146,443 | (10 | )% | (8 | )% | 584,577 | 671,329 | (13 | )% | |||||||||||||||||||||||||||
|
|
|
|
|
|
|
|
|
|
|
|
|
|
|
|
|
|
|
| |||||||||||||||||||||
Total revenues | 292,178 | 309,313 | 302,651 | 317,809 | 317,041 | (6 | )% | (8 | )% | 1,221,951 | 1,359,996 | (10 | )% | |||||||||||||||||||||||||||
Provision for loan losses | 15,000 | 10,000 | 15,000 | 15,000 | 15,000 | 50 | % | * | 55,000 | 78,000 | (29 | )% | ||||||||||||||||||||||||||||
Noninterest expense | 260,097 | 433,556 | 227,408 | 240,540 | 271,361 | (40 | )% | (4 | )% | 1,161,601 | 1,383,701 | (16 | )% | |||||||||||||||||||||||||||
|
|
|
|
|
|
|
|
|
|
|
|
|
|
|
|
|
|
|
| |||||||||||||||||||||
Income/(loss) before income taxes | 17,081 | (134,243 | ) | 60,243 | 62,269 | 30,680 | NM | (44 | )% | 5,350 | (101,705 | ) | NM | |||||||||||||||||||||||||||
Provision/(benefit) for income taxes | (36,555 | ) | (31,094 | ) | 15,008 | 17,730 | (12,914 | ) | (18 | )% | NM | (34,911 | ) | (85,262 | ) | 59 | % | |||||||||||||||||||||||
|
|
|
|
|
|
|
|
|
|
|
|
|
|
|
|
|
|
|
| |||||||||||||||||||||
Income/(loss) from continuing operations | 53,636 | (103,149 | ) | 45,235 | 44,539 | 43,594 | NM | 23 | % | 40,261 | (16,443 | ) | NM | |||||||||||||||||||||||||||
Income/(loss) from discontinued operations, net of tax | (6 | ) | 123 | 1 | 430 | (12 | ) | NM | 50 | % | 548 | 148 | NM | |||||||||||||||||||||||||||
|
|
|
|
|
|
|
|
|
|
|
|
|
|
|
|
|
|
|
| |||||||||||||||||||||
Net income/(loss) | $ | 53,630 | $ | (103,026 | ) | $ | 45,236 | $ | 44,969 | $ | 43,582 | NM | 23 | % | $ | 40,809 | $ | (16,295 | ) | NM | ||||||||||||||||||||
|
|
|
|
|
|
|
|
|
|
|
|
|
|
|
|
|
|
|
| |||||||||||||||||||||
NM - Not meaningful
| * | Amount is less than one percent. |
Certain previously reported amounts have been reclassified to agree with current presentation.
| (a) | 4Q12 includes $18.3 million related to Restructuring, Repositioning, and Efficiency initiatives, primarily severance related costs associated with an employee separation program. |
15
Table of Contents
Quarterly, Unaudited
| 4Q13 Changes vs. | ||||||||||||||||||||||||||||
| 4Q13 | 3Q13 | 2Q13 | 1Q13 | 4Q12 | 3Q13 | 4Q12 | ||||||||||||||||||||||
Income Statement (thousands) | ||||||||||||||||||||||||||||
Net interest income | $ | 146,430 | $ | 149,547 | $ | 148,222 | $ | 147,125 | $ | 154,927 | (2 | )% | (5 | )% | ||||||||||||||
Provision/(provision credit) for loan losses | 2,585 | 5,159 | 13,201 | (2,485 | ) | (1,231 | ) | (50 | )% | NM | ||||||||||||||||||
Noninterest income: | ||||||||||||||||||||||||||||
NSF / Overdraft fees (a) | 11,411 | 11,660 | 10,250 | 10,031 | 13,586 | (2 | )% | (16 | )% | |||||||||||||||||||
Cash management fees | 9,063 | 8,760 | 9,133 | 9,330 | 9,092 | 3 | % | * | ||||||||||||||||||||
Debit card income | 2,739 | 2,782 | 2,695 | 2,534 | 2,437 | (2 | )% | 12 | % | |||||||||||||||||||
Other | 5,112 | 5,126 | 5,183 | 4,909 | 4,912 | * | 4 | % | ||||||||||||||||||||
|
|
|
|
|
|
|
|
|
|
|
|
|
| |||||||||||||||
Total deposit transactions and cash management | 28,325 | 28,328 | 27,261 | 26,804 | 30,027 | * | (6 | )% | ||||||||||||||||||||
Brokerage, management fees and commissions | 11,505 | 10,868 | 10,540 | 9,348 | 8,979 | 6 | % | 28 | % | |||||||||||||||||||
Trust services and investment management | 6,612 | 6,665 | 6,966 | 6,343 | 5,995 | (1 | )% | 10 | % | |||||||||||||||||||
Bankcard income | 4,815 | 5,089 | 5,054 | 4,691 | 5,578 | (5 | )% | (14 | )% | |||||||||||||||||||
Other service charges | 2,873 | 3,451 | 3,255 | 2,873 | 2,951 | (17 | )% | (3 | )% | |||||||||||||||||||
Miscellaneous revenue | 8,677 | 9,482 | 8,809 | 9,085 | 10,567 | (8 | )% | (18 | )% | |||||||||||||||||||
|
|
|
|
|
|
|
|
|
|
|
|
|
| |||||||||||||||
Total noninterest income | 62,807 | 63,883 | 61,885 | 59,144 | 64,097 | (2 | )% | (2 | )% | |||||||||||||||||||
|
|
|
|
|
|
|
|
|
|
|
|
|
| |||||||||||||||
Noninterest expense: | ||||||||||||||||||||||||||||
Employee compensation, incentives, and benefits | 50,921 | 51,656 | 50,438 | 50,386 | 50,792 | (1 | )% | * | ||||||||||||||||||||
Other (b) | 88,163 | 80,195 | 79,077 | 80,551 | 93,239 | 10 | % | (5 | )% | |||||||||||||||||||
|
|
|
|
|
|
|
|
|
|
|
|
|
| |||||||||||||||
Total noninterest expense | 139,084 | 131,851 | 129,515 | 130,937 | 144,031 | 5 | % | (3 | )% | |||||||||||||||||||
|
|
|
|
|
|
|
|
|
|
|
|
|
| |||||||||||||||
Income before income taxes | $ | 67,568 | $ | 76,420 | $ | 67,391 | $ | 77,817 | $ | 76,224 | (12 | )% | (11 | )% | ||||||||||||||
|
|
|
|
|
|
|
|
|
|
|
|
|
| |||||||||||||||
Efficiency ratio (c) | 66.47 | % | 61.78 | % | 61.64 | % | 63.48 | % | 65.76 | % | ||||||||||||||||||
|
|
|
|
|
|
|
|
|
|
|
|
|
| |||||||||||||||
Balance Sheet (millions) | ||||||||||||||||||||||||||||
Average loans | $ | 11,972 | $ | 12,184 | $ | 12,225 | $ | 12,237 | $ | 12,397 | (2 | )% | (3 | )% | ||||||||||||||
Average other earning assets | 43 | 54 | 53 | 53 | 58 | (20 | )% | (26 | )% | |||||||||||||||||||
Total average earning assets | 12,015 | 12,238 | 12,278 | 12,290 | 12,455 | (2 | )% | (4 | )% | |||||||||||||||||||
Average core deposits | 14,466 | 14,484 | 14,624 | 14,560 | 14,445 | * | * | |||||||||||||||||||||
Average other deposits | 581 | 595 | 542 | 517 | 515 | (2 | )% | 13 | % | |||||||||||||||||||
Total average deposits | 15,047 | 15,079 | 15,166 | 15,077 | 14,960 | * | 1 | % | ||||||||||||||||||||
Total period-end deposits | 15,480 | 14,862 | 15,562 | 15,225 | 15,142 | 4 | % | 2 | % | |||||||||||||||||||
Total period-end assets | 13,019 | 12,908 | 13,495 | 12,844 | 13,754 | 1 | % | (5 | )% | |||||||||||||||||||
|
|
|
|
|
|
|
|
|
|
|
|
|
| |||||||||||||||
Net interest margin (d) | 4.90 | % | 4.91 | % | 4.90 | % | 4.90 | % | 5.00 | % | ||||||||||||||||||
Net interest spread | 3.50 | 3.49 | 3.46 | 3.46 | 3.53 | |||||||||||||||||||||||
Loan yield | 3.71 | 3.74 | 3.72 | 3.75 | 3.83 | |||||||||||||||||||||||
Deposit average yield | 0.21 | 0.25 | 0.26 | 0.29 | 0.30 | |||||||||||||||||||||||
|
|
|
|
|
|
|
|
|
|
|
|
|
| |||||||||||||||
Key Statistics | ||||||||||||||||||||||||||||
Financial center locations | 172 | 182 | 183 | 171 | 171 | (5 | )% | 1 | % | |||||||||||||||||||
|
|
|
|
|
|
|
|
|
|
|
|
|
| |||||||||||||||
| * | Amount is less than one percent. |
Certain previously reported amounts have been reclassified to agree with current presentation.
| (a) | 1Q13 decline primarily attributable to seasonality in NSF fees. |
| (b) | 1Q13 decrease largely attributable to a decline in allocated Pension expense resulting from the freeze of the pension plans on December 31, 2012. |
| (c) | Noninterest expense divided by total revenue. |
| (d) | Net interest margin is computed using total net interest income adjusted for FTE. Refer to the Non-GAAP to GAAP Reconciliation on page 26 of this supplement. |
16
Table of Contents
Quarterly, Unaudited
| 4Q13 Changes vs. | ||||||||||||||||||||||||||||
| 4Q13 | 3Q13 | 2Q13 | 1Q13 | 4Q12 | 3Q13 | 4Q12 | ||||||||||||||||||||||
Income Statement (thousands) | ||||||||||||||||||||||||||||
Net interest income | $ | 4,299 | $ | 3,807 | $ | 4,094 | $ | 3,965 | $ | 4,348 | 13 | % | (1 | )% | ||||||||||||||
Noninterest income: | ||||||||||||||||||||||||||||
Fixed income | 50,937 | 54,428 | 58,535 | 67,953 | 65,560 | (6 | )% | (22 | )% | |||||||||||||||||||
Other | 8,572 | 9,687 | 9,664 | 8,659 | 6,872 | (12 | )% | 25 | % | |||||||||||||||||||
|
|
|
|
|
|
|
|
|
|
|
|
|
| |||||||||||||||
Total noninterest income | 59,509 | 64,115 | 68,199 | 76,612 | 72,432 | (7 | )% | (18 | )% | |||||||||||||||||||
Noninterest expense | 53,213 | 58,034 | 59,926 | 61,666 | 57,541 | (8 | )% | (8 | )% | |||||||||||||||||||
|
|
|
|
|
|
|
|
|
|
|
|
|
| |||||||||||||||
Income before income taxes | $ | 10,595 | $ | 9,888 | $ | 12,367 | $ | 18,911 | $ | 19,239 | 7 | % | (45 | )% | ||||||||||||||
|
|
|
|
|
|
|
|
|
|
|
|
|
| |||||||||||||||
Efficiency ratio (a) | 83.40 | % | 85.44 | % | 82.89 | % | 76.53 | % | 74.94 | % | ||||||||||||||||||
Fixed income average daily revenue | $ | 822 | $ | 850 | $ | 915 | $ | 1,133 | $ | 1,093 | (3 | )% | (25 | )% | ||||||||||||||
|
|
|
|
|
|
|
|
|
|
|
|
|
| |||||||||||||||
Balance Sheet (millions) | ||||||||||||||||||||||||||||
Average trading inventory | $ | 1,160 | $ | 1,156 | $ | 1,310 | $ | 1,309 | $ | 1,250 | * | (7 | )% | |||||||||||||||
Average other earning assets | 588 | 604 | 714 | 770 | 618 | (3 | )% | (5 | )% | |||||||||||||||||||
Total average earning assets | 1,748 | 1,760 | 2,024 | 2,079 | 1,868 | (1 | )% | (6 | )% | |||||||||||||||||||
Total period-end assets (b) | 1,511 | 2,275 | 2,299 | 2,593 | 2,280 | (34 | )% | (34 | )% | |||||||||||||||||||
|
|
|
|
|
|
|
|
|
|
|
|
|
| |||||||||||||||
Net interest margin (c) | 1.02 | % | 0.89 | % | 0.84 | % | 0.78 | % | 0.97 | % | ||||||||||||||||||
|
|
|
|
|
|
|
|
|
|
|
|
|
| |||||||||||||||
| * | Amount is less than one percent. |
Certain previously reported amounts have been reclassified to agree with current presentation.
| (a) | Noninterest expense divided by total revenue. |
| (b) | Balances reflect the net presentation of certain capital markets receivables and payables. Prior periods have been revised for comparability. |
| (c) | Net interest margin is computed using total net interest income adjusted for FTE. Refer to the Non-GAAP to GAAP Reconciliation on page 26 of this supplement. |
FHN CORPORATE
Quarterly, Unaudited
| 4Q13 Changes vs. | ||||||||||||||||||||||||||||
| 4Q13 | 3Q13 | 2Q13 | 1Q13 | 4Q12 | 3Q13 | 4Q12 | ||||||||||||||||||||||
Income Statement (thousands) | ||||||||||||||||||||||||||||
Net interest income/ (expense) | $ | (10,411 | ) | $ | (11,653 | ) | $ | (11,180 | ) | $ | (10,058 | ) | $ | (10,128 | ) | 11 | % | (3 | )% | |||||||||
Noninterest income excluding securities gains/ (losses) | 5,648 | 6,690 | 4,174 | 7,825 | 5,992 | (16 | )% | (6 | )% | |||||||||||||||||||
Securities gains/ (losses), net | 2,182 | (132 | ) | (363 | ) | 30 | — | NM | NM | |||||||||||||||||||
Provision/(provision credit) for loan losses | — | — | — | — | 4 | NM | NM | |||||||||||||||||||||
Noninterest expense (a) | 18,721 | 21,685 | 17,095 | 17,570 | 36,109 | (14 | )% | (48 | )% | |||||||||||||||||||
|
|
|
|
|
|
|
|
|
|
|
|
|
| |||||||||||||||
Loss before income taxes | $ | (21,302 | ) | $ | (26,780 | ) | $ | (24,464 | ) | $ | (19,773 | ) | $ | (40,249 | ) | 20 | % | 47 | % | |||||||||
|
|
|
|
|
|
|
|
|
|
|
|
|
| |||||||||||||||
Average Balance Sheet (millions) | ||||||||||||||||||||||||||||
Average loans | $ | 182 | $ | 196 | $ | 217 | $ | 226 | $ | 189 | (7 | )% | (4 | )% | ||||||||||||||
Total earning assets | $ | 4,026 | $ | 3,900 | $ | 3,802 | $ | 3,959 | $ | 3,751 | 3 | % | 7 | % | ||||||||||||||
Net interest margin (b) | (1.00 | )% | (1.16 | )% | (1.19 | )% | (1.07 | )% | (1.06 | )% | ||||||||||||||||||
|
|
|
|
|
|
|
|
|
|
|
|
|
| |||||||||||||||
NM - Not meaningful
Certain previously reported amounts have been reclassified to agree with current presentation.
| (a) | 4Q12 includes $18.3 million related to Restructuring, Repositioning, and Efficiency initiatives, primarily severance related cost associated with an employee separation program. |
| (b) | Net interest margin is computed using total net interest income adjusted for FTE. Refer to the Non-GAAP Reconciliation on page 26 of this supplement. |
17
Table of Contents
Quarterly, Unaudited
| 4Q13 Changes vs. | ||||||||||||||||||||||||||||
| 4Q13 | 3Q13 | 2Q13 | 1Q13 | 4Q12 | 3Q13 | 4Q12 | ||||||||||||||||||||||
Income Statement (thousands) | ||||||||||||||||||||||||||||
Net interest income | $ | 16,817 | $ | 17,137 | $ | 18,883 | $ | 20,350 | $ | 21,451 | (2 | )% | (22 | )% | ||||||||||||||
Noninterest income excluding securities gains/ (losses) (a) | 4,897 | 15,919 | 8,733 | 12,822 | 8,622 | (69 | )% | (43 | )% | |||||||||||||||||||
Securities gains/(losses), net (b) | — | — | 4 | (6 | ) | (4,700 | ) | NM | NM | |||||||||||||||||||
Noninterest expense: | ||||||||||||||||||||||||||||
Repurchase and foreclosure provision | — | 200,000 | — | — | — | NM | NM | |||||||||||||||||||||
Other expenses | 49,079 | 21,986 | 20,872 | 30,367 | 33,680 | NM | 46 | % | ||||||||||||||||||||
|
|
|
|
|
|
|
|
|
|
|
|
|
| |||||||||||||||
Total noninterest expense | 49,079 | 221,986 | 20,872 | 30,367 | 33,680 | (78 | )% | 46 | % | |||||||||||||||||||
Provision for loan losses | 12,415 | 4,841 | 1,799 | 17,485 | 16,227 | NM | (23 | )% | ||||||||||||||||||||
|
|
|
|
|
|
|
|
|
|
|
|
|
| |||||||||||||||
Income/(loss) before income taxes | $ | (39,780 | ) | $ | (193,771 | ) | $ | 4,949 | $ | (14,686 | ) | $ | (24,534 | ) | 79 | % | (62 | )% | ||||||||||
|
|
|
|
|
|
|
|
|
|
|
|
|
| |||||||||||||||
Average Balance Sheet (millions) | ||||||||||||||||||||||||||||
Loans | $ | 3,119 | $ | 3,272 | $ | 3,451 | $ | 3,634 | $ | 3,817 | (5 | )% | (18 | )% | ||||||||||||||
Loans held-for-sale | 343 | 349 | 360 | 354 | 344 | (2 | )% | * | ||||||||||||||||||||
Trading securities | 13 | 16 | 16 | 17 | 19 | (19 | )% | (32 | )% | |||||||||||||||||||
Other assets | 343 | 350 | 340 | 370 | 384 | (2 | )% | (11 | )% | |||||||||||||||||||
Total assets | 3,818 | 3,987 | 4,167 | 4,375 | 4,564 | (4 | )% | (16 | )% | |||||||||||||||||||
Net interest margin (c) | 1.93 | % | 1.88 | % | 1.97 | % | 2.04 | % | 2.04 | % | ||||||||||||||||||
Efficiency ratio (d) | NM | NM | 75.58 | % | 91.54 | % | 111.99 | % | ||||||||||||||||||||
|
|
|
|
|
|
|
|
|
|
|
|
|
| |||||||||||||||
Mortgage Warehouse - Period-end (millions) | ||||||||||||||||||||||||||||
Ending warehouse balance (loans held-for-sale) | $ | 336 | $ | 346 | $ | 358 | $ | 362 | $ | 353 | (3 | )% | (5 | )% | ||||||||||||||
|
|
|
|
|
|
|
|
|
|
|
|
|
| |||||||||||||||
Ending servicing portfolio (millions) (e) (f) | $ | 9,943 | $ | 15,033 | $ | 16,025 | $ | 17,055 | $ | 18,071 | (34 | )% | (45 | )% | ||||||||||||||
|
|
|
|
|
|
|
|
|
|
|
|
|
| |||||||||||||||
NM - Not meaningful
| * | Amount is less than one percent. |
Certain previously reported amounts have been reclassified to agree with current presentation.
| (a) | 3Q13 increase reflects the effect of the terms of the agreement to sell servicing, somewhat offset by a $2.2 million negative adjustment made as a result of estimated costs for obligations associated with the agreement to sell servicing; 2Q13 and 1Q13 include a gain of $1.0 million and $2.4 million, respectively, from a LOCOM reversal associated with a TRUP loan payoff. |
| (b) | 4Q12 includes a $4.7 million negative valuation adjustment related to an equity investment. |
| (c) | Net interest margin is computed using total net interest income adjusted for FTE. Refer to the Non-GAAP to GAAP Reconciliation on page 26 of this supplement. |
| (d) | Noninterest expense divided by total revenue excluding securities gains/(losses). |
| (e) | Includes mortgage loans serviced from FHN’s legacy mortgage banking business, legacy equity lending serviced for others, and mortgage loans in portfolio and warehouse. |
| (f) | In 3Q13 FHN signed a definitive agreement to sell substantially all remaining legacy mortgage servicing; transfers of servicing began in fourth quarter. |
18
Table of Contents
Quarterly, Unaudited
| 4Q13 Changes vs. | ||||||||||||||||||||||||||||
(Thousands) | 4Q13 | 3Q13 | 2Q13 | 1Q13 | 4Q12 | 3Q13 | 4Q12 | |||||||||||||||||||||
Tier 1 capital (a) (b) | $ | 2,611,342 | $ | 2,555,141 | $ | 2,712,399 | $ | 2,738,558 | $ | 2,640,776 | 2 | % | (1 | )% | ||||||||||||||
Tier 2 capital (a) | 445,799 | 449,578 | 464,244 | 511,340 | 571,232 | (1 | )% | (22 | )% | |||||||||||||||||||
|
|
|
|
|
|
|
|
|
|
|
|
|
| |||||||||||||||
Total capital (a) (b) | $ | 3,057,141 | $ | 3,004,719 | $ | 3,176,643 | $ | 3,249,898 | $ | 3,212,008 | 2 | % | (5 | )% | ||||||||||||||
|
|
|
|
|
|
|
|
|
|
|
|
|
| |||||||||||||||
Risk weighted assets (“RWA”) (a) | $ | 18,971,300 | $ | 19,275,526 | $ | 20,460,353 | $ | 20,231,850 | $ | 20,153,430 | (2 | )% | (6 | )% | ||||||||||||||
Tier 1 ratio (a) | 13.76 | % | 13.26 | % | 13.26 | % | 13.54 | % | 13.10 | % | ||||||||||||||||||
Tier 2 ratio (a) | 2.35 | % | 2.33 | % | 2.27 | % | 2.52 | % | 2.84 | % | ||||||||||||||||||
|
|
|
|
|
|
|
|
|
|
|
|
|
| |||||||||||||||
Total capital ratio (a) | 16.11 | % | 15.59 | % | 15.53 | % | 16.06 | % | 15.94 | % | ||||||||||||||||||
|
|
|
|
|
|
|
|
|
|
|
|
|
| |||||||||||||||
Tier 1 common ratio to risk | 10.65 | % | 10.19 | % | 10.37 | % | 10.62 | % | 10.65 | % | ||||||||||||||||||
Leverage ratio (a) | 11.01 | 10.60 | 11.07 | 10.97 | 10.63 | |||||||||||||||||||||||
Total equity to total assets | 10.51 | 10.20 | 10.25 | 10.48 | 9.90 | |||||||||||||||||||||||
Adjusted tangible common | 10.31 | 9.69 | 9.69 | 9.91 | 9.93 | |||||||||||||||||||||||
Tangible common | ||||||||||||||||||||||||||||
(“TCE/TA”) (c) (e) | 8.23 | 7.93 | 8.07 | 8.33 | 8.17 | |||||||||||||||||||||||
Certain previously reported amounts have been reclassified to agree with current presentation.
| (a) | Current quarter is an estimate. |
| (b) | All quarters presented include $200 million of tier 1 qualifying trust preferred securities. |
| (c) | Refer to the Non-GAAP to GAAP Reconciliation on page 26 of this financial supplement. |
| (d) | See Glossary of Terms for definition of ratio. |
| (e) | Calculated using period-end balances. |
19
Table of Contents
FHN ASSET QUALITY: CONSOLIDATED
Quarterly, Unaudited
| 4Q13 Changes vs. | ||||||||||||||||||||||||||||
(Thousands) | 4Q13 | 3Q13 | 2Q13 | 1Q13 | 4Q12 | 3Q13 | 4Q12 | |||||||||||||||||||||
Allowance for Loan Losses Walk-Forward | ||||||||||||||||||||||||||||
Beginning reserve | $ | 255,710 | $ | 261,934 | $ | 265,218 | $ | 276,963 | $ | 281,744 | (2 | )% | (9 | )% | ||||||||||||||
Provision | 15,000 | 10,000 | 15,000 | 15,000 | 15,000 | 50 | % | * | ||||||||||||||||||||
Charge-offs | (29,000 | ) | (26,046 | ) | (30,272 | ) | (36,100 | ) | (31,177 | ) | (11 | )% | 7 | % | ||||||||||||||
Recoveries | 12,099 | 9,822 | 11,988 | 9,355 | 11,396 | 23 | % | 6 | % | |||||||||||||||||||
|
|
|
|
|
|
|
|
|
|
|
|
|
| |||||||||||||||
Ending balance (Restricted - $4.4 million) (a) | $ | 253,809 | $ | 255,710 | $ | 261,934 | $ | 265,218 | $ | 276,963 | (1 | )% | (8 | )% | ||||||||||||||
|
|
|
|
|
|
|
|
|
|
|
|
|
| |||||||||||||||
Reserve for unfunded commitments | 3,017 | 2,956 | 2,976 | 3,439 | 4,145 | 2 | % | (27 | )% | |||||||||||||||||||
Total allowance for loan losses plus reserve for unfunded commitments | $ | 256,826 | $ | 258,666 | $ | 264,910 | $ | 268,657 | $ | 281,108 | (1 | )% | (9 | )% | ||||||||||||||
|
|
|
|
|
|
|
|
|
|
|
|
|
| |||||||||||||||
Allowance for Loan Losses | ||||||||||||||||||||||||||||
Regional Banking | $ | 121,027 | $ | 125,440 | $ | 124,627 | $ | 120,161 | $ | 128,210 | (4 | )% | (6 | )% | ||||||||||||||
Non-Strategic | 132,782 | 130,270 | 137,307 | 145,057 | 148,753 | 2 | % | (11 | )% | |||||||||||||||||||
Corporate (b) | NM | NM | NM | NM | NM | NM | NM | |||||||||||||||||||||
|
|
|
|
|
|
|
|
|
|
|
|
|
| |||||||||||||||
Total allowance for loan losses | $ | 253,809 | $ | 255,710 | $ | 261,934 | $ | 265,218 | $ | 276,963 | (1 | )% | (8 | )% | ||||||||||||||
|
|
|
|
|
|
|
|
|
|
|
|
|
| |||||||||||||||
Nonperforming Assets | ||||||||||||||||||||||||||||
Regional Banking | ||||||||||||||||||||||||||||
Nonperforming loans | $ | 87,324 | $ | 118,507 | $ | 135,902 | $ | 124,824 | $ | 131,834 | (26 | )% | (34 | )% | ||||||||||||||
Foreclosed real estate (c) (d) | 28,806 | 33,594 | 34,561 | 13,142 | 13,726 | (14 | )% | NM | ||||||||||||||||||||
|
|
|
|
|
|
|
|
|
|
|
|
|
| |||||||||||||||
Total Regional Banking | $ | 116,130 | $ | 152,101 | $ | 170,463 | $ | 137,966 | $ | 145,560 | (24 | )% | (20 | )% | ||||||||||||||
|
|
|
|
|
|
|
|
|
|
|
|
|
| |||||||||||||||
Non-Strategic | ||||||||||||||||||||||||||||
Nonperforming loans | $ | 163,104 | $ | 164,534 | $ | 173,705 | $ | 129,240 | $ | 133,286 | (1 | )% | 22 | % | ||||||||||||||
Nonperforming loans held-for-sale before fair value adjustments (e) | 134,209 | 143,972 | 140,790 | 129,730 | 110,567 | (7 | )% | 21 | % | |||||||||||||||||||
Foreclosed real estate (c) | 16,947 | 16,437 | 16,781 | 19,513 | 28,041 | 3 | % | (40 | )% | |||||||||||||||||||
|
|
|
|
|
|
|
|
|
|
|
|
|
| |||||||||||||||
Total Non-Strategic | $ | 314,260 | $ | 324,943 | $ | 331,276 | $ | 278,483 | $ | 271,894 | (3 | )% | 16 | % | ||||||||||||||
|
|
|
|
|
|
|
|
|
|
|
|
|
| |||||||||||||||
Corporate | ||||||||||||||||||||||||||||
Nonperforming loans | $ | 4,598 | $ | 5,001 | $ | 4,526 | $ | 1,936 | $ | 1,915 | (8 | )% | NM | |||||||||||||||
|
|
|
|
|
|
|
|
|
|
|
|
|
| |||||||||||||||
Total nonperforming assets (f) | $ | 434,988 | $ | 482,045 | $ | 506,265 | $ | 418,385 | $ | 419,369 | (10 | )% | 4 | % | ||||||||||||||
|
|
|
|
|
|
|
|
|
|
|
|
|
| |||||||||||||||
Net Charge-Offs | ||||||||||||||||||||||||||||
Regional Banking | $ | 6,997 | $ | 4,347 | $ | 8,735 | $ | 5,564 | $ | 12,623 | 61 | % | (45 | )% | ||||||||||||||
Non-Strategic | 9,904 | 11,877 | 9,549 | 21,181 | 7,158 | (17 | )% | 38 | % | |||||||||||||||||||
|
|
|
|
|
|
|
|
|
|
|
|
|
| |||||||||||||||
Total net charge-offs | $ | 16,901 | $ | 16,224 | $ | 18,284 | $ | 26,745 | $ | 19,781 | 4 | % | (15 | )% | ||||||||||||||
|
|
|
|
|
|
|
|
|
|
|
|
|
| |||||||||||||||
Consolidated Key Ratios (g) | ||||||||||||||||||||||||||||
NPL % (f) | 1.66 | % | 1.87 | % | 1.94 | % | 1.61 | % | 1.60 | % | ||||||||||||||||||
NPA % (d) (f) | 1.95 | 2.19 | 2.25 | 1.81 | 1.84 | |||||||||||||||||||||||
Net charge-offs % | 0.44 | 0.41 | 0.46 | 0.67 | 0.48 | |||||||||||||||||||||||
Allowance / loans | 1.65 | 1.66 | 1.62 | 1.67 | 1.66 | |||||||||||||||||||||||
Allowance / NPL | 1.00 | x | 0.89 | x | 0.83 | x | 1.04 | x | 1.04 | x | ||||||||||||||||||
Allowance / NPA | 0.84 | x | 0.76 | x | 0.72 | x | 0.92 | x | 0.90 | x | ||||||||||||||||||
Allowance / charge-offs | 3.79 | x | 3.97 | x | 3.57 | x | 2.45 | x | 3.52 | x | ||||||||||||||||||
|
|
|
|
|
|
|
|
|
|
|
|
|
| |||||||||||||||
Other | ||||||||||||||||||||||||||||
Loans past due 90 days or more (h) | 76,870 | $ | 80,923 | $ | 73,027 | $ | 87,177 | $ | 86,017 | (5 | )% | (11 | )% | |||||||||||||||
Guaranteed portion (h) | 39,830 | 41,945 | 38,123 | 40,117 | 36,633 | (5 | )% | 9 | % | |||||||||||||||||||
Foreclosed real estate from government insured loans | 25,809 | 21,596 | 18,560 | 22,017 | 18,923 | 20 | % | 36 | % | |||||||||||||||||||
Period-end loans, net of unearned income (millions) | 15,389 | 15,409 | 16,198 | 15,890 | 16,709 | * | (8 | )% | ||||||||||||||||||||
Remaining unfunded commitments (millions) | 8,837 | 9,048 | 8,425 | 8,487 | 7,993 | (2 | )% | 11 | % | |||||||||||||||||||
|
|
|
|
|
|
|
|
|
|
|
|
|
| |||||||||||||||
NM - Not meaningful
| * | Amount is less than one percent. |
Certain previously reported amounts have been reclassified to agree with current presentation.
| (a) | Restricted balances parenthetically presented are as of December 31, 2013. |
| (b) | The valuation adjustment taken upon exercise of clean-up calls includes expected losses. |
| (c) | Excludes foreclosed real estate from government-insured mortgages. |
| (d) | 2013 increase primarily relates to acquired foreclosed real estate from the MNB acquisition. |
| (e) | The average negative fair value mark was approximately 53% of unpaid principal balance as of 4Q13. |
| (f) | 2013 increase primarily relates to second liens placed on nonaccrual based on third party data obtained on the performance status of non-FHN serviced first liens. |
| (g) | See Glossary of Terms for definitions of Consolidated Key Ratios. |
| (h) | Includes loans held-for-sale. |
20
Table of Contents
FHN ASSET QUALITY: CONSOLIDATED
Quarterly, Unaudited
| 4Q13 Changes vs. | ||||||||||||||||||||||||||||
| 4Q13 | 3Q13 | 2Q13 | 1Q13 | 4Q12 | 3Q13 | 4Q12 | ||||||||||||||||||||||
Key Portfolio Details | ||||||||||||||||||||||||||||
C&I | ||||||||||||||||||||||||||||
Period-end loans ($ millions) | $ | 7,924 | $ | 7,747 | $ | 8,368 | $ | 8,091 | $ | 8,797 | 2 | % | (10 | )% | ||||||||||||||
|
|
|
|
|
|
|
|
|
|
|
|
|
| |||||||||||||||
30+ Delinq. % (a) | 0.11 | % | 0.11 | % | 0.13 | % | 0.17 | % | 0.22 | % | ||||||||||||||||||
NPL % | 1.01 | 1.33 | 1.45 | 1.40 | 1.39 | |||||||||||||||||||||||
Charge-offs % (qtr. annualized) | 0.21 | 0.08 | 0.14 | 0.10 | 0.24 | |||||||||||||||||||||||
|
|
|
|
|
|
|
|
|
|
|
|
|
| |||||||||||||||
Allowance / loans % | 1.09 | % | 1.18 | % | 1.12 | % | 1.06 | % | 1.09 | % | ||||||||||||||||||
Allowance / charge-offs | 5.33 | x | 14.16 | x | 8.34 | x | 10.94 | x | 4.84 | x | ||||||||||||||||||
|
|
|
|
|
|
|
|
|
|
|
|
|
| |||||||||||||||
Commercial Real Estate | ||||||||||||||||||||||||||||
Period-end loans ($ millions) (b) | $ | 1,133 | $ | 1,174 | $ | 1,219 | $ | 1,117 | $ | 1,168 | (3 | )% | (3 | )% | ||||||||||||||
|
|
|
|
|
|
|
|
|
|
|
|
|
| |||||||||||||||
30+ Delinq. % (a) | 0.77 | % | 0.60 | % | 0.54 | % | 0.42 | % | 0.39 | % | ||||||||||||||||||
NPL % | 1.60 | 2.13 | 2.74 | 3.46 | 3.90 | |||||||||||||||||||||||
Charge-offs % (qtr. annualized) | NM | NM | NM | 0.26 | 0.07 | |||||||||||||||||||||||
|
|
|
|
|
|
|
|
|
|
|
|
|
| |||||||||||||||
Allowance / loans % (c) | 0.94 | % | 0.94 | % | 1.14 | % | 1.36 | % | 1.71 | % | ||||||||||||||||||
Allowance / charge-offs | NM | NM | NM | 5.08 | x | 23.76 | x | |||||||||||||||||||||
|
|
|
|
|
|
|
|
|
|
|
|
|
| |||||||||||||||
Consumer Real Estate | ||||||||||||||||||||||||||||
Period-end loans ($ millions) | $ | 5,333 | $ | 5,458 | $ | 5,549 | $ | 5,590 | $ | 5,689 | (2 | )% | (6 | )% | ||||||||||||||
|
|
|
|
|
|
|
|
|
|
|
|
|
| |||||||||||||||
30+ Delinq. % (a) | 1.13 | % | 1.05 | % | 1.10 | % | 1.21 | % | 1.36 | % | ||||||||||||||||||
NPL % (d) | 2.20 | 2.23 | 2.15 | 1.21 | 1.13 | |||||||||||||||||||||||
Charge-offs % (qtr. annualized) | 0.62 | 0.87 | 0.96 | 1.33 | 0.68 | |||||||||||||||||||||||
|
|
|
|
|
|
|
|
|
|
|
|
|
| |||||||||||||||
Allowance / loans % | 2.38 | % | 2.21 | % | 2.18 | % | 2.35 | % | 2.27 | % | ||||||||||||||||||
Allowance / charge-offs | 3.79 | x | 2.54 | x | 2.26 | x | 1.75 | x | 3.31 | x | ||||||||||||||||||
|
|
|
|
|
|
|
|
|
|
|
|
|
| |||||||||||||||
Permanent Mortgage | ||||||||||||||||||||||||||||
Period-end loans ($ millions) (e) | $ | 662 | $ | 698 | $ | 746 | $ | 793 | $ | 766 | (5 | )% | (14 | )% | ||||||||||||||
|
|
|
|
|
|
|
|
|
|
|
|
|
| |||||||||||||||
30+ Delinq. % (a) | 2.92 | % | 2.48 | % | 2.51 | % | 2.16 | % | 2.28 | % | ||||||||||||||||||
NPL % | 5.76 | 5.30 | 5.14 | 4.37 | 4.27 | |||||||||||||||||||||||
Charge-offs % (qtr. annualized) | 1.46 | 0.29 | 0.62 | 1.64 | 0.95 | |||||||||||||||||||||||
|
|
|
|
|
|
|
|
|
|
|
|
|
| |||||||||||||||
Allowance / loans % | 3.40 | % | 3.66 | % | 3.63 | % | 3.21 | % | 3.26 | % | ||||||||||||||||||
Allowance / charge-offs | 2.27 | x | 12.26 | x | 5.64 | x | 1.93 | x | 3.32 | x | ||||||||||||||||||
|
|
|
|
|
|
|
|
|
|
|
|
|
| |||||||||||||||
Credit Card and Other | ||||||||||||||||||||||||||||
Period-end loans ($ millions) | $ | 337 | $ | 332 | $ | 316 | $ | 299 | $ | 289 | 2 | % | 17 | % | ||||||||||||||
|
|
|
|
|
|
|
|
|
|
|
|
|
| |||||||||||||||
30+ Delinq. % (a) | 1.35 | % | 1.11 | % | 1.00 | % | 1.25 | % | 1.45 | % | ||||||||||||||||||
NPL % | 0.42 | 0.42 | 0.54 | 0.57 | 0.59 | |||||||||||||||||||||||
Charge-offs % (qtr. annualized) | 3.05 | 2.61 | 2.22 | 3.25 | 4.00 | |||||||||||||||||||||||
|
|
|
|
|
|
|
|
|
|
|
|
|
| |||||||||||||||
Allowance / loans % | 2.22 | % | 2.09 | % | 2.07 | % | 2.38 | % | 2.39 | % | ||||||||||||||||||
Allowance / charge-offs | 0.73 | x | 0.82 | x | 0.97 | x | 0.75 | x | 0.60 | x | ||||||||||||||||||
|
|
|
|
|
|
|
|
|
|
|
|
|
| |||||||||||||||
NM - Not meaningful
| (a) | 30+ Delinquency % includes all accounts delinquent more than one month and still accruing interest. |
| (b) | 2Q13 increase is related to MNB acquisition. |
| (c) | 2Q13 decline is related to MNB loans that were acquired at fair value and that do not carry an allowance. |
| (d) | NPL levels affected by the impact of placing second liens on nonaccrual based on third party data obtained on the performance status of non-FHN serviced first liens beginning in 2Q13. |
| (e) | 1Q13 increase relates to exercise of cleanup calls. |
21
Table of Contents
FHN ASSET QUALITY: REGIONAL BANKING
Quarterly, Unaudited
| 4Q13 Changes vs. | ||||||||||||||||||||||||||||
| 4Q13 | 3Q13 | 2Q13 | 1Q13 | 4Q12 | 3Q13 | 4Q12 | ||||||||||||||||||||||
Total Regional Banking | ||||||||||||||||||||||||||||
Period-end loans ($ millions) | $ | 12,167 | $ | 12,039 | $ | 12,634 | $ | 12,127 | $ | 12,819 | 1 | % | (5 | )% | ||||||||||||||
|
|
|
|
|
|
|
|
|
|
|
|
|
| |||||||||||||||
30+ Delinq. % (a) | 0.36 | % | 0.35 | % | 0.31 | % | 0.36 | % | 0.38 | % | ||||||||||||||||||
NPL % | 0.72 | 0.98 | 1.08 | 1.03 | 1.03 | |||||||||||||||||||||||
Charge-offs % (qtr. annualized) | 0.23 | 0.14 | 0.29 | 0.18 | 0.41 | |||||||||||||||||||||||
|
|
|
|
|
|
|
|
|
|
|
|
|
| |||||||||||||||
Allowance / loans % | 0.99 | % | 1.04 | % | 0.99 | % | 0.99 | % | 1.00 | % | ||||||||||||||||||
Allowance / charge-offs | 4.36 | x | 7.27 | x | 3.56 | x | 5.32 | x | 2.55 | x | ||||||||||||||||||
|
|
|
|
|
|
|
|
|
|
|
|
|
| |||||||||||||||
Key Portfolio Details | ||||||||||||||||||||||||||||
C&I | ||||||||||||||||||||||||||||
Period-end loans ($ millions) | $ | 7,431 | $ | 7,254 | $ | 7,865 | $ | 7,580 | $ | 8,262 | 2 | % | (10 | )% | ||||||||||||||
|
|
|
|
|
|
|
|
|
|
|
|
|
| |||||||||||||||
30+ Delinq. % (a) | 0.12 | % | 0.12 | % | 0.13 | % | 0.17 | % | 0.23 | % | ||||||||||||||||||
NPL % | 0.59 | 0.92 | 0.96 | 0.89 | 0.85 | |||||||||||||||||||||||
Charge-offs % (qtr. annualized) | 0.24 | 0.07 | 0.27 | 0.10 | 0.26 | |||||||||||||||||||||||
|
|
|
|
|
|
|
|
|
|
|
|
|
| |||||||||||||||
Allowance / loans % | 0.97 | % | 1.06 | % | 0.99 | % | 0.92 | % | 0.95 | % | ||||||||||||||||||
Allowance / charge-offs | 4.24 | x | 15.09 | x | 3.81 | x | 8.71 | x | 3.87 | x | ||||||||||||||||||
|
|
|
|
|
|
|
|
|
|
|
|
|
| |||||||||||||||
Commercial Real Estate | ||||||||||||||||||||||||||||
Period-end loans ($ millions) (b) | $ | 1,124 | $ | 1,164 | $ | 1,202 | $ | 1,098 | $ | 1,148 | (3 | )% | (2 | )% | ||||||||||||||
|
|
|
|
|
|
|
|
|
|
|
|
|
| |||||||||||||||
30+ Delinq. % (a) | 0.77 | % | 0.61 | % | 0.55 | % | 0.43 | % | 0.40 | % | ||||||||||||||||||
NPL % | 1.35 | 1.87 | 2.38 | 3.01 | 3.46 | |||||||||||||||||||||||
Charge-offs % (qtr. annualized) | NM | NM | NM | 0.34 | 0.35 | |||||||||||||||||||||||
|
|
|
|
|
|
|
|
|
|
|
|
|
| |||||||||||||||
Allowance / loans % (c) | 0.88 | % | 0.88 | % | 1.03 | % | 1.25 | % | 1.60 | % | ||||||||||||||||||
Allowance / charge-offs | NM | NM | NM | 3.59 | x | 4.29 | x | |||||||||||||||||||||
|
|
|
|
|
|
|
|
|
|
|
|
|
| |||||||||||||||
Consumer Real Estate | ||||||||||||||||||||||||||||
Period-end loans ($ millions) | $ | 3,278 | $ | 3,291 | $ | 3,253 | $ | 3,152 | $ | 3,121 | * | 5 | % | |||||||||||||||
|
|
|
|
|
|
|
|
|
|
|
|
|
| |||||||||||||||
30+ Delinq. % (a) | 0.65 | % | 0.66 | % | 0.58 | % | 0.68 | % | 0.65 | % | ||||||||||||||||||
NPL % (d) | 0.85 | 0.90 | 0.97 | 0.74 | 0.67 | |||||||||||||||||||||||
Charge-offs % (qtr. annualized) | 0.12 | 0.14 | 0.31 | 0.07 | 0.51 | |||||||||||||||||||||||
|
|
|
|
|
|
|
|
|
|
|
|
|
| |||||||||||||||
Allowance / loans % | 0.96 | % | 0.95 | % | 0.87 | % | 0.96 | % | 0.81 | % | ||||||||||||||||||
Allowance / charge-offs | 7.72 | x | 6.84 | x | 2.85 | x | 13.36 | x | 1.59 | x | ||||||||||||||||||
|
|
|
|
|
|
|
|
|
|
|
|
|
| |||||||||||||||
Credit Card, Permanent Mortgage, and Other | ||||||||||||||||||||||||||||
Period-end loans ($ millions) | $ | 334 | $ | 330 | $ | 314 | $ | 297 | $ | 288 | 1 | % | 16 | % | ||||||||||||||
|
|
|
|
|
|
|
|
|
|
|
|
|
| |||||||||||||||
30+ Delinq. % (a) | 1.55 | % | 1.29 | % | 1.14 | % | 1.40 | % | 1.45 | % | ||||||||||||||||||
NPL % | 0.16 | 0.20 | 0.20 | 0.34 | 0.35 | |||||||||||||||||||||||
Charge-offs % (qtr. annualized) | 2.92 | 2.52 | 2.03 | 2.94 | 3.42 | |||||||||||||||||||||||
|
|
|
|
|
|
|
|
|
|
|
|
|
| |||||||||||||||
Allowance / loans % | 2.21 | % | 2.04 | % | 2.02 | % | 2.26 | % | 2.21 | % | ||||||||||||||||||
Allowance / charge-offs | 0.76 | x | 0.83 | x | 1.03 | x | 0.79 | x | 0.65 | x | ||||||||||||||||||
|
|
|
|
|
|
|
|
|
|
|
|
|
| |||||||||||||||
ASSET QUALITY: CORPORATE | ||||||||||||||||||||||||||||
Permanent Mortgage | ||||||||||||||||||||||||||||
Period-end loans ($ millions) (e) | $ | 175 | $ | 185 | $ | 205 | $ | 229 | $ | 180 | (5 | )% | (3 | )% | ||||||||||||||
|
|
|
|
|
|
|
|
|
|
|
|
|
| |||||||||||||||
30+ Delinq. % (a) | 2.34 | % | 2.05 | % | 1.83 | % | 2.55 | % | 1.83 | % | ||||||||||||||||||
NPL % | 2.63 | 2.70 | 2.21 | 0.84 | 1.06 | |||||||||||||||||||||||
Charge-offs % (qtr. annualized) | NM | NM | NM | NM | NM | |||||||||||||||||||||||
|
|
|
|
|
|
|
|
|
|
|
|
|
| |||||||||||||||
Allowance / loans % | NM | NM | NM | NM | NM | |||||||||||||||||||||||
Allowance / charge-offs | NM | NM | NM | NM | NM | |||||||||||||||||||||||
|
|
|
|
|
|
|
|
|
|
|
|
|
| |||||||||||||||
NM - Not meaningful
| * | Amount is less than one percent. |
| (a) | 30+ Delinquency % includes all accounts delinquent more than one month and still accruing interest. |
| (b) | 2Q13 increase is related to MNB acquisition. |
| (c) | 2Q13 decline is related to MNB loans that were acquired at fair value and that do not carry an allowance. |
| (d) | NPL levels affected by the impact of placing second liens on nonaccrual based on third party data obtained on the performance status of non-FHN serviced first liens beginning in 2Q13. |
| (e) | 1Q13 increase relates to exercise of cleanup calls. |
22
Table of Contents
FHN ASSET QUALITY: NON-STRATEGIC
Quarterly, Unaudited
| 4Q13 Changes vs. | ||||||||||||||||||||||||||||
| 4Q13 | 3Q13 | 2Q13 | 1Q13 | 4Q12 | 3Q13 | 4Q12 | ||||||||||||||||||||||
Total Non-Strategic | ||||||||||||||||||||||||||||
Period-end loans ($ millions) | $ | 3,047 | $ | 3,185 | $ | 3,359 | $ | 3,534 | $ | 3,710 | (4 | )% | (18 | )% | ||||||||||||||
|
|
|
|
|
|
|
|
|
|
|
|
|
| |||||||||||||||
30+ Delinq.% (a) | 1.76 | % | 1.53 | % | 1.70 | % | 1.62 | % | 1.92 | % | ||||||||||||||||||
NPL% (b) | 5.35 | 5.17 | 5.17 | 3.66 | 3.59 | |||||||||||||||||||||||
Charge-offs% (qtr. annualized) | 1.26 | 1.44 | 1.11 | 2.36 | 0.75 | |||||||||||||||||||||||
|
|
|
|
|
|
|
|
|
|
|
|
|
| |||||||||||||||
Allowance / loans% | 4.36 | % | 4.09 | % | 4.09 | % | 4.10 | % | 4.01 | % | ||||||||||||||||||
Allowance / charge-offs | 3.38 | x | 2.76 | x | 3.58 | x | 1.69 | x | 5.22 | x | ||||||||||||||||||
|
|
|
|
|
|
|
|
|
|
|
|
|
| |||||||||||||||
Key Portfolio Details | ||||||||||||||||||||||||||||
C&I | ||||||||||||||||||||||||||||
Period-end loans ($ millions) | $ | 492 | $ | 493 | $ | 503 | $ | 512 | $ | 535 | * | (8 | )% | |||||||||||||||
|
|
|
|
|
|
|
|
|
|
|
|
|
| |||||||||||||||
30+ Delinq.% (a) | 0.06 | % | 0.04 | % | 0.04 | % | 0.08 | % | — | % | ||||||||||||||||||
NPL% | 7.33 | 7.36 | 9.13 | 8.95 | 9.82 | |||||||||||||||||||||||
Charge-offs% (qtr. annualized) | NM | 0.27 | NM | NM | NM | |||||||||||||||||||||||
|
|
|
|
|
|
|
|
|
|
|
|
|
| |||||||||||||||
Allowance / loans% | 2.87 | % | 2.89 | % | 3.14 | % | 3.24 | % | 3.37 | % | ||||||||||||||||||
Allowance / charge-offs | NM | 10.61 | x | NM | NM | NM | ||||||||||||||||||||||
|
|
|
|
|
|
|
|
|
|
|
|
|
| |||||||||||||||
Commercial Real Estate | ||||||||||||||||||||||||||||
Period-end loans ($ millions) | $ | 9 | $ | 10 | $ | 16 | $ | 19 | $ | 20 | (10 | )% | (55 | )% | ||||||||||||||
|
|
|
|
|
|
|
|
|
|
|
|
|
| |||||||||||||||
30+ Delinq.% (a) | — | % | — | % | — | % | — | % | — | % | ||||||||||||||||||
NPL% | 32.30 | 32.16 | 29.38 | 29.86 | 29.00 | |||||||||||||||||||||||
Charge-offs% (qtr. annualized) | 3.72 | 1.74 | NM | NM | NM | |||||||||||||||||||||||
|
|
|
|
|
|
|
|
|
|
|
|
|
| |||||||||||||||
Allowance / loans% | 7.98 | % | 7.55 | % | 9.56 | % | 7.58 | % | 8.03 | % | ||||||||||||||||||
Allowance / charge-offs | 2.00 | x | 2.93 | x | NM | NM | NM | |||||||||||||||||||||
|
|
|
|
|
|
|
|
|
|
|
|
|
| |||||||||||||||
Consumer Real Estate | ||||||||||||||||||||||||||||
Period-end loans ($ millions) | $ | 2,055 | $ | 2,167 | $ | 2,297 | $ | 2,438 | $ | 2,568 | (5 | )% | (20 | )% | ||||||||||||||
|
|
|
|
|
|
|
|
|
|
|
|
|
| |||||||||||||||
30+ Delinq.% (a) | 1.89 | % | 1.64 | % | 1.84 | % | 1.89 | % | 2.23 | % | ||||||||||||||||||
NPL% (b) | 4.36 | 4.26 | 3.84 | 1.83 | 1.69 | |||||||||||||||||||||||
Charge-offs% (qtr. annualized) | 1.39 | 1.93 | 1.84 | 2.90 | 0.86 | |||||||||||||||||||||||
|
|
|
|
|
|
|
|
|
|
|
|
|
| |||||||||||||||
Allowance / loans% | 4.64 | % | 4.13 | % | 4.03 | % | 4.15 | % | 4.04 | % | ||||||||||||||||||
Allowance / charge-offs | 3.25 | x | 2.08 | x | 2.12 | x | 1.39 | x | 4.51 | x | ||||||||||||||||||
|
|
|
|
|
|
|
|
|
|
|
|
|
| |||||||||||||||
Permanent Mortgage | ||||||||||||||||||||||||||||
Period-end loans ($ millions) | $ | 475 | $ | 499 | $ | 527 | $ | 548 | $ | 569 | (5 | )% | (17 | )% | ||||||||||||||
|
|
|
|
|
|
|
|
|
|
|
|
|
| |||||||||||||||
30+ Delinq.% (a) | 3.00 | % | 2.55 | % | 2.70 | % | 1.91 | % | 2.40 | % | ||||||||||||||||||
NPL% | 6.96 | 6.28 | 6.31 | 5.78 | 5.23 | |||||||||||||||||||||||
Charge-offs% (qtr. annualized) | 2.04 | 0.41 | 0.89 | 2.35 | 1.29 | |||||||||||||||||||||||
|
|
|
|
|
|
|
|
|
|
|
|
|
| |||||||||||||||
Allowance / loans% | 4.68 | % | 5.07 | % | 5.10 | % | 4.62 | % | 4.36 | % | ||||||||||||||||||
Allowance / charge-offs | 2.25 | x | 12.14 | x | 5.58 | x | 1.93 | x | 3.30 | x | ||||||||||||||||||
|
|
|
|
|
|
|
|
|
|
|
|
|
| |||||||||||||||
Other Consumer | ||||||||||||||||||||||||||||
Period-end loans ($ millions) | $ | 16 | $ | 16 | $ | 16 | $ | 17 | $ | 18 | * | (11 | )% | |||||||||||||||
|
|
|
|
|
|
|
|
|
|
|
|
|
| |||||||||||||||
30+ Delinq.% (a) | 2.33 | % | 1.63 | % | 1.99 | % | 2.26 | % | 2.82 | % | ||||||||||||||||||
NPL% | 8.66 | 8.53 | 10.02 | 9.61 | 9.23 | |||||||||||||||||||||||
Charge-offs% (qtr. annualized) | 3.35 | 2.12 | 3.72 | 5.44 | 9.49 | |||||||||||||||||||||||
|
|
|
|
|
|
|
|
|
|
|
|
|
| |||||||||||||||
Allowance / loans% | 2.25 | % | 3.06 | % | 2.85 | % | 2.78 | % | 3.64 | % | ||||||||||||||||||
Allowance / charge-offs | 0.66 | x | 1.41 | x | 0.75 | x | 0.50 | x | 0.38 | x | ||||||||||||||||||
|
|
|
|
|
|
|
|
|
|
|
|
|
| |||||||||||||||
NM - Not meaningful
| * | Amount is less than one percent. |
| (a) | 30+ Delinquency% includes all accounts delinquent more than one month and still accruing interest. |
| (b) | NPL levels affected by the impact of placing second liens on nonaccrual based on third party data obtained on the performance status of non-FHN serviced first liens beginning in 2Q13. |
23
Table of Contents
FHN ROLLFORWARDS OF NONPERFORMING LOANS AND ORE INVENTORY
Unaudited
(Millions) | 4Q13 | 3Q13 | 2Q13 | 1Q13 | 4Q12 | |||||||||||||||
Commercial NPL Rollforward | ||||||||||||||||||||
Beginning NPLs | $ | 128 | $ | 155 | $ | 152 | $ | 168 | $ | 214 | ||||||||||
+ Additions | 2 | — | 14 | 9 | 10 | |||||||||||||||
- Resolutions and payments | (25 | ) | (25 | ) | (9 | ) | (22 | ) | (29 | ) | ||||||||||
- Net charge-offs | (3 | ) | (2 | ) | (2 | ) | (2 | ) | (5 | ) | ||||||||||
- Transfer to ORE | — | — | — | (1 | ) | — | ||||||||||||||
- Upgrade to accrual | (4 | ) | — | — | — | (22 | ) | |||||||||||||
|
|
|
|
|
|
|
|
|
| |||||||||||
Ending NPLs | $ | 98 | $ | 128 | $ | 155 | $ | 152 | $ | 168 | ||||||||||
|
|
|
|
|
|
|
|
|
| |||||||||||
(Millions) | 4Q13 | 3Q13 | 2Q13 | 1Q13 | 4Q12 | |||||||||||||||
ORE Inventory Rollforward (a) | ||||||||||||||||||||
Beginning balance | $ | 50.0 | $ | 51.3 | $ | 32.7 | $ | 41.8 | $ | 50.6 | ||||||||||
Valuation adjustments | (1.7 | ) | (0.3 | ) | (1.9 | ) | (1.0 | ) | (1.5 | ) | ||||||||||
|
|
|
|
|
|
|
|
|
| |||||||||||
Adjusted balance | 48.3 | 51.0 | 30.8 | 40.8 | 49.1 | |||||||||||||||
+ New ORE | 8.9 | 5.6 | 6.0 | 2.8 | 7.5 | |||||||||||||||
+ Acquired ORE | — | — | 22.3 | — | — | |||||||||||||||
+ Capitalized expenses | — | — | — | — | 0.1 | |||||||||||||||
Disposals: | ||||||||||||||||||||
- Single transactions | (9.2 | ) | (6.6 | ) | (7.8 | ) | (10.9 | ) | (13.6 | ) | ||||||||||
- Bulk sales | (2.2 | ) | — | — | — | (1.3 | ) | |||||||||||||
|
|
|
|
|
|
|
|
|
| |||||||||||
Ending balance | $ | 45.8 | $ | 50.0 | $ | 51.3 | $ | 32.7 | $ | 41.8 | ||||||||||
|
|
|
|
|
|
|
|
|
| |||||||||||
Certain previously reported amounts have been reclassified to agree with current presentation.
| (a) | ORE excludes foreclosed assets related to government insured mortgages. |
24
Table of Contents
Unaudited
C&I Portfolio: $7.9 Billion (51.5% of Total Loans) as of December 31, 2013
| % OS | ||||
General Corporate, Commercial, and Business Banking Loans | 84 | % | ||
Loans to Mortgage Companies | 10 | % | ||
Trust Preferred Loans | 5 | % | ||
Bank Holding Company Loans | 1 | % | ||
Consumer Real Estate (primarily Home Equity) Portfolio: $5.3 Billion (34.7% of Total Loans)
| Origination LTV and FICO for Portfolio as of December 31, 2013 | Loan-to-Value | |||||||||||||||
(excludes whole loan insurance) | <=60% | >60% - <=80% | >80% - 90% | >90% | ||||||||||||
FICO score greater than or equal to 740 | 11 | % | 23 | % | 17 | % | 8 | % | ||||||||
FICO score 720-739 | 2 | % | 4 | % | 4 | % | 2 | % | ||||||||
FICO score 700-719 | 1 | % | 4 | % | 4 | % | 2 | % | ||||||||
FICO score 660-699 | 2 | % | 4 | % | 4 | % | 3 | % | ||||||||
FICO score 620-659 | - | % | 1 | % | 1 | % | 1 | % | ||||||||
FICO score less than 620 | - | % | 1 | % | - | % | 1 | % | ||||||||
| Origination LTV and FICO for Portfolio - Regional Banking as of December 31, 2013 | Loan-to-Value | |||||||||||||||
(excludes whole loan insurance) | <=60% | >60% - <=80% | >80% - 90% | >90% | ||||||||||||
FICO score greater than or equal to 740 | 13 | % | 24 | % | 18 | % | 10 | % | ||||||||
FICO score 720-739 | 1 | % | 4 | % | 3 | % | 2 | % | ||||||||
FICO score 700-719 | 1 | % | 3 | % | 2 | % | 2 | % | ||||||||
FICO score 660-699 | 1 | % | 4 | % | 3 | % | 2 | % | ||||||||
FICO score 620-659 | 1 | % | 1 | % | 1 | % | 1 | % | ||||||||
FICO score less than 620 | - | % | 1 | % | 1 | % | 1 | % | ||||||||
| Origination LTV and FICO for Portfolio - Non-Strategic as of December 31, 2013 | Loan-to-Value | |||||||||||||||
(excludes whole loan insurance) | <=60% | >60% - <=80% | >80% - 90% | >90% | ||||||||||||
FICO score greater than or equal to 740 | 8 | % | 22 | % | 15 | % | 5 | % | ||||||||
FICO score 720-739 | 2 | % | 6 | % | 5 | % | 2 | % | ||||||||
FICO score 700-719 | 2 | % | 6 | % | 6 | % | 2 | % | ||||||||
FICO score 660-699 | 2 | % | 5 | % | 4 | % | 3 | % | ||||||||
FICO score 620-659 | - | % | 1 | % | 1 | % | 1 | % | ||||||||
FICO score less than 620 | - | % | - | % | - | % | 1 | % | ||||||||
Consumer Real Estate Portfolio Detail:
| Origination Characteristics | ||||||||||||||||||||||||
Vintage | Balances ($B) | W/A Age (mo.) | CLTV | FICO | % TN | % 1st lien | ||||||||||||||||||
pre-2003 | $ | 0.1 | 144 | 78 | % | 705 | 43 | % | 32 | % | ||||||||||||||
2003 | $ | 0.2 | 126 | 76 | % | 722 | 31 | % | 38 | % | ||||||||||||||
2004 | $ | 0.5 | 113 | 80 | % | 724 | 21 | % | 27 | % | ||||||||||||||
2005 | $ | 0.7 | 101 | 81 | % | 729 | 17 | % | 16 | % | ||||||||||||||
2006 | $ | 0.6 | 90 | 78 | % | 732 | 21 | % | 17 | % | ||||||||||||||
2007 | $ | 0.7 | 78 | 80 | % | 737 | 25 | % | 18 | % | ||||||||||||||
2008 | $ | 0.3 | 67 | 76 | % | 745 | 71 | % | 50 | % | ||||||||||||||
2009 | $ | 0.2 | 55 | 72 | % | 748 | 86 | % | 57 | % | ||||||||||||||
2010 | $ | 0.2 | 41 | 81 | % | 750 | 92 | % | 73 | % | ||||||||||||||
2011 | $ | 0.4 | 29 | 77 | % | 760 | 88 | % | 86 | % | ||||||||||||||
2012 | $ | 0.8 | 18 | 76 | % | 763 | 89 | % | 91 | % | ||||||||||||||
2013 | $ | 0.6 | 7 | 77 | % | 758 | 85 | % | 85 | % | ||||||||||||||
Total | $ | 5.3 | 63 | 78 | % | 743 | (a) | 54 | % | 50 | % | |||||||||||||
|
|
|
|
|
|
|
|
|
|
|
| |||||||||||||
| (a) | 743 average portfolio origination FICO; 736 weighted average portfolio FICO (refreshed). |
Permanent Mortgage Portfolio: $.7 Billion (4.3% of Total Loans) (a) (b)
| Loan-to-Value | ||||||||||||||||||
| <= 60% | >60% - <=80% | >80% - 90% | >90% | |||||||||||||||
Origination LTV for Portfolio as of December 31, 2013: | 19 | % | 71 | % | 5 | % | 5 | % | ||||||||||
| (a) | Documentation type: 71% full doc; 24% stated; 5% other. |
| (b) | Product type: 71% jumbo; 12% Alt A; 17% other. |
25
Table of Contents
FHN NON-GAAP TO GAAP RECONCILIATION
Quarterly, Unaudited
(Thousands) | 4Q13 | 3Q13 | 2Q13 | 1Q13 | 4Q12 | |||||||||||||||
Tangible Common Equity (Non-GAAP) | ||||||||||||||||||||
(A) Total equity (GAAP) | $ | 2,500,493 | $ | 2,433,293 | $ | 2,546,408 | $ | 2,599,727 | $ | 2,509,206 | ||||||||||
Less: Noncontrolling interest (a) | 295,431 | 295,431 | 295,431 | 295,257 | 295,165 | |||||||||||||||
Less: Preferred stock | 95,624 | 95,624 | 95,624 | 95,624 | — | |||||||||||||||
|
|
|
|
|
|
|
|
|
| |||||||||||
(B) Total common equity | $ | 2,109,438 | $ | 2,042,238 | $ | 2,155,353 | $ | 2,208,846 | $ | 2,214,041 | ||||||||||
Less: Intangible assets (GAAP) (b) | 163,931 | 162,695 | 163,623 | 156,014 | 156,942 | |||||||||||||||
|
|
|
|
|
|
|
|
|
| |||||||||||
(C) Tangible common equity (Non-GAAP) | $ | 1,945,507 | $ | 1,879,543 | $ | 1,991,730 | $ | 2,052,832 | $ | 2,057,099 | ||||||||||
Less: Unrealized gains/(losses) on AFS securities, net of tax | (11,241 | ) | 11,153 | 9,439 | 48,591 | 55,250 | ||||||||||||||
|
|
|
|
|
|
|
|
|
| |||||||||||
(D) Adjusted tangible common equity (Non-GAAP) (c) | $ | 1,956,748 | $ | 1,868,390 | $ | 1,982,291 | $ | 2,004,241 | $ | 2,001,849 | ||||||||||
|
|
|
|
|
|
|
|
|
| |||||||||||
Tangible Assets (Non-GAAP) | ||||||||||||||||||||
(E) Total assets (GAAP) | $ | 23,792,576 | $ | 23,858,753 | $ | 24,852,800 | $ | 24,803,048 | $ | 25,334,019 | ||||||||||
Less: Intangible assets (GAAP) (b) | 163,931 | 162,695 | 163,623 | 156,014 | 156,942 | |||||||||||||||
|
|
|
|
|
|
|
|
|
| |||||||||||
(F) Tangible assets (Non-GAAP) | $ | 23,628,645 | $ | 23,696,058 | $ | 24,689,177 | $ | 24,647,034 | $ | 25,177,077 | ||||||||||
|
|
|
|
|
|
|
|
|
| |||||||||||
Period-end Shares Outstanding | ||||||||||||||||||||
(G) Period-end shares outstanding | 236,370 | 236,328 | 240,555 | 241,225 | 243,598 | |||||||||||||||
|
|
|
|
|
|
|
|
|
| |||||||||||
Tier 1 Common (Non-GAAP) | ||||||||||||||||||||
(H) Tier 1 capital (d) (e) | $ | 2,611,342 | $ | 2,555,141 | $ | 2,712,399 | $ | 2,738,558 | $ | 2,640,776 | ||||||||||
Less: Noncontrolling interest—FTBNA preferred stock (a) (f) | 294,816 | 294,816 | 294,816 | 294,816 | 294,816 | |||||||||||||||
Less: Preferred Stock | 95,624 | 95,624 | 95,624 | 95,624 | — | |||||||||||||||
Less: Trust preferred (g) | 200,000 | 200,000 | 200,000 | 200,000 | 200,000 | |||||||||||||||
|
|
|
|
|
|
|
|
|
| |||||||||||
(I) Tier 1 common (Non-GAAP) | $ | 2,020,902 | $ | 1,964,701 | $ | 2,121,959 | $ | 2,148,118 | $ | 2,145,960 | ||||||||||
|
|
|
|
|
|
|
|
|
| |||||||||||
Risk Weighted Assets | ||||||||||||||||||||
(J) Risk weighted assets (d) (e) | $ | 18,971,300 | $ | 19,275,526 | $ | 20,460,353 | $ | 20,231,850 | $ | 20,153,430 | ||||||||||
|
|
|
|
|
|
|
|
|
| |||||||||||
Ratios | ||||||||||||||||||||
(C)/(F) Tangible common equity to tangible assets (“TCE/TA”) (Non-GAAP) | 8.23 | % | 7.93 | % | 8.07 | % | 8.33 | % | 8.17 | % | ||||||||||
(A)/(E) Total equity to total assets (GAAP) | 10.51 | % | 10.20 | % | 10.25 | % | 10.48 | % | 9.90 | % | ||||||||||
(C)/(G) Tangible book value per common share (Non-GAAP) | $ | 8.23 | $ | 7.95 | $ | 8.28 | $ | 8.51 | $ | 8.44 | ||||||||||
(B)/(G) Book value per common share (GAAP) | $ | 8.92 | $ | 8.64 | $ | 8.96 | $ | 9.16 | $ | 9.09 | ||||||||||
(I)/(J) Tier 1 common to risk weighted assets (Non-GAAP) (d) | 10.65 | % | 10.19 | % | 10.37 | % | 10.62 | % | 10.65 | % | ||||||||||
(H)/(E) Tier 1 capital to total assets (GAAP) (d) | 10.98 | % | 10.71 | % | 10.91 | % | 11.04 | % | 10.42 | % | ||||||||||
(D)/(J) Adjusted tangible common equity to risk weighted assets (“TCE/RWA”) (Non-GAAP) (c) (d) | 10.31 | % | 9.69 | % | 9.69 | % | 9.91 | % | 9.93 | % | ||||||||||
|
|
|
|
|
|
|
|
|
| |||||||||||
Net interest income adjusted for impact of fully taxable equivalent (“FTE”) (Non-GAAP) | ||||||||||||||||||||
Regional Banking | ||||||||||||||||||||
Net interest income (GAAP) | $ | 146,430 | $ | 149,547 | $ | 148,222 | $ | 147,125 | $ | 154,927 | ||||||||||
FTE adjustment | 1,909 | 1,806 | 1,756 | 1,670 | 1,645 | |||||||||||||||
|
|
|
|
|
|
|
|
|
| |||||||||||
Net interest income adjusted for impact of FTE (Non-GAAP) | $ | 148,339 | $ | 151,353 | $ | 149,978 | $ | 148,795 | $ | 156,572 | ||||||||||
|
|
|
|
|
|
|
|
|
| |||||||||||
Capital Markets | ||||||||||||||||||||
Net interest income (GAAP) | $ | 4,299 | $ | 3,807 | $ | 4,094 | $ | 3,965 | $ | 4,348 | ||||||||||
FTE adjustment | 128 | 81 | 149 | 109 | 186 | |||||||||||||||
|
|
|
|
|
|
|
|
|
| |||||||||||
Net interest income adjusted for impact of FTE (Non-GAAP) | $ | 4,427 | $ | 3,888 | $ | 4,243 | $ | 4,074 | $ | 4,534 | ||||||||||
|
|
|
|
|
|
|
|
|
| |||||||||||
Corporate | ||||||||||||||||||||
Net interest income (GAAP) | $ | (10,411 | ) | $ | (11,653 | ) | $ | (11,180 | ) | $ | (10,058 | ) | $ | (10,128 | ) | |||||
FTE adjustment | 7 | 7 | 8 | 8 | 11 | |||||||||||||||
|
|
|
|
|
|
|
|
|
| |||||||||||
Net interest income adjusted for impact of FTE (Non-GAAP) | $ | (10,404 | ) | $ | (11,646 | ) | $ | (11,172 | ) | $ | (10,050 | ) | $ | (10,117 | ) | |||||
|
|
|
|
|
|
|
|
|
| |||||||||||
Non-Strategic | ||||||||||||||||||||
Net interest income (GAAP) | $ | 16,817 | $ | 17,137 | $ | 18,883 | $ | 20,350 | $ | 21,451 | ||||||||||
FTE adjustment | — | — | — | — | — | |||||||||||||||
|
|
|
|
|
|
|
|
|
| |||||||||||
Net interest income adjusted for impact of FTE (Non-GAAP) | $ | 16,817 | $ | 17,137 | $ | 18,883 | $ | 20,350 | $ | 21,451 | ||||||||||
|
|
|
|
|
|
|
|
|
| |||||||||||
Total Consolidated | ||||||||||||||||||||
Net interest income (GAAP) | $ | 157,135 | $ | 158,838 | $ | 160,019 | $ | 161,382 | $ | 170,598 | ||||||||||
FTE adjustment | 2,044 | 1,894 | 1,913 | 1,787 | 1,842 | |||||||||||||||
|
|
|
|
|
|
|
|
|
| |||||||||||
Net interest income adjusted for impact of FTE (Non-GAAP) | $ | 159,179 | $ | 160,732 | $ | 161,932 | $ | 163,169 | $ | 172,440 | ||||||||||
|
|
|
|
|
|
|
|
|
| |||||||||||
Certain previously reported amounts have been reclassified to agree with current presentation.
| (a) | Included in Total equity on the Consolidated Balance Sheet. |
| (b) | Includes goodwill and other intangible assets, net of amortization. |
| (c) | See Glossary of Terms for definition of ratio. |
| (d) | Current quarter is an estimate. |
| (e) | Defined by and calculated in conformity with bank regulations. |
| (f) | Represents FTBNA preferred stock included in noncontrolling interest. |
| (g) | Included in Term borrowings on the Consolidated Balance Sheet. |
26
Table of Contents
Adjusted Tangible Common Equity to Risk Weighted Assets:Common equity excluding intangible assets and unrealized gains/losses on available-for-sale securities divided by risk weighted assets.
Core Businesses:Management treats regional banking, capital markets, and corporate as FHN’s core businesses. Non-strategic has significant legacy assets and operations that are being wound down.
Discharged Bankruptcies:Residential real estate secured loans where the borrower has been discharged from personal liability through bankruptcy proceedings. Such loans that have not been reaffirmed by the borrower are charged down to estimated collateral value less disposition costs (net realizable value) and are reported as nonaccruing TDRs.
Lower of Cost or Market (“LOCOM”): A method of accounting for certain assets by recording them at the lower of their historical cost or their current market value.
Restricted Real Estate Loans:Restricted loans that are assets of a consolidated variable interest entity that can be used only to settle obligations of the consolidated variable interest entity.
Troubled Debt Restructuring (“TDR”):A restructuring of debt whereby a creditor for economic or legal reasons related to the borrower’s financial difficulties grants a concession to the borrower that it would not otherwise consider. Such concession is granted in an attempt to protect as much of the creditor’s investment as possible by increasing the probability of repayment.
Asset Quality - Consolidated Key Ratios
NPL %:Ratio is nonperforming loans in the loan portfolio to total period-end loans.
NPA %: Ratio is nonperforming assets related to the loan portfolio to total period-end loans plus foreclosed real estate and other assets.
Net charge-offs %:Ratio is annualized net charge-offs to total average loans.
Allowance / loans:Ratio is allowance for loan losses to total period-end loans.
Allowance / NPL:Ratio is allowance for loan losses to nonperforming loans in the loan portfolio.
Allowance / NPA: Ratio is allowance for loan losses to nonperforming assets related to the loan portfolio.
Allowance / charge-offs: Ratio is allowance for loan losses to annualized net charge-offs.
27
Table of Contents
|

Exhibit 99.1B
First Horizon National Corporation
Fourth Quarter 2013 Earnings
January 17, 2014
Table of Contents
|
Portions of this presentation use non-GAAP financial information. Each of those portions is so noted, and a reconciliation of that non-GAAP information to comparable GAAP information is provided in a footnote or in the appendix at the end of this presentation.
This presentation contains forward-looking statements, which may include guidance, involving significant risks and uncertainties which will be identified by words such as “believe”,“expect”,“anticipate”,“intend”,“estimate”, “should”,“is likely”,“will”,“going forward” and other expressions that indicate future events and trends and may be followed by or reference cautionary statements. A number of factors could cause actual results to differ materially from those in the forward-looking information. These factors are outlined in our recent earnings and other press releases and in more detail in the most current 10-Q and 10-K. FHN disclaims any obligation to update any such factors or to publicly announce the result of any revisions to any of the forward-looking statements included herein or therein to reflect future events or developments.
2 |
|
Table of Contents
|
Building Franchise Value
“Blue Chip” Priorities
Being easy to do business with
Providing differentiated customer service
Using the bonefish to drive profitability
3 |
|
Table of Contents
|
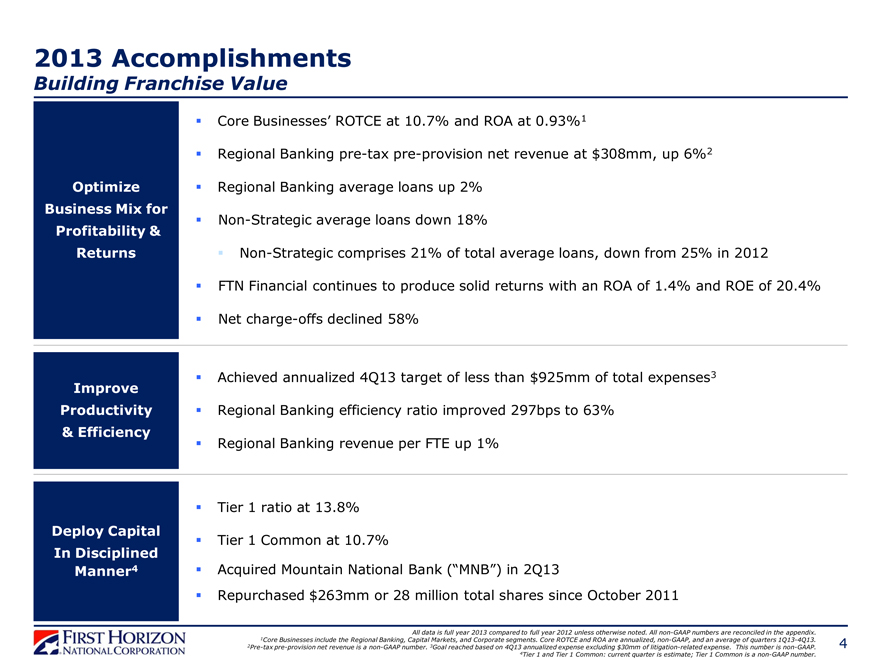
2013 Accomplishments
Building Franchise Value
Optimize Business Mix for Profitability & Returns
Core Businesses’ ROTCE at 10.7% and ROA at 0.93%1
Regional Banking pre-tax pre-provision net revenue at $308mm, up 6%2
Regional Banking average loans up 2%
Non-Strategic average loans down 18%
Non-Strategic comprises 21% of total average loans, down from 25% in 2012
FTN Financial continues to produce solid returns with an ROA of 1.4% and ROE of 20.4%
Net charge-offs declined 58%
Improve Productivity
& Efficiency
Achieved annualized 4Q13 target of less than $925mm of total expenses3
Regional Banking efficiency ratio improved 297bps to 63%
Regional Banking revenue per FTE up 1%
Deploy Capital In Disciplined Manner4
Tier 1 ratio at 13.8%
Tier 1 Common at 10.7%
Acquired Mountain National Bank (“MNB”) in 2Q13
Repurchased $263mm or 28 million total shares since October 2011
All data is full year 2013 compared to full year 2012 unless otherwise noted. All non-GAAP numbers are reconciled in the appendix.
1Core Businesses include the Regional Banking, Capital Markets, and Corporate segments. Core ROTCE and ROA are annualized, non-GAAP, and an average of quarters 1Q13-4Q13.
2Pre-tax pre-provision net revenue is a non-GAAP number. 3Goal reached based on 4Q13 annualized expense excluding $30mm of litigation-related expense. This number is non-GAAP.
4Tier 1 and Tier 1 Common: current quarter is estimate; Tier 1 Common is a non-GAAP number.
4 |
|
Table of Contents
|
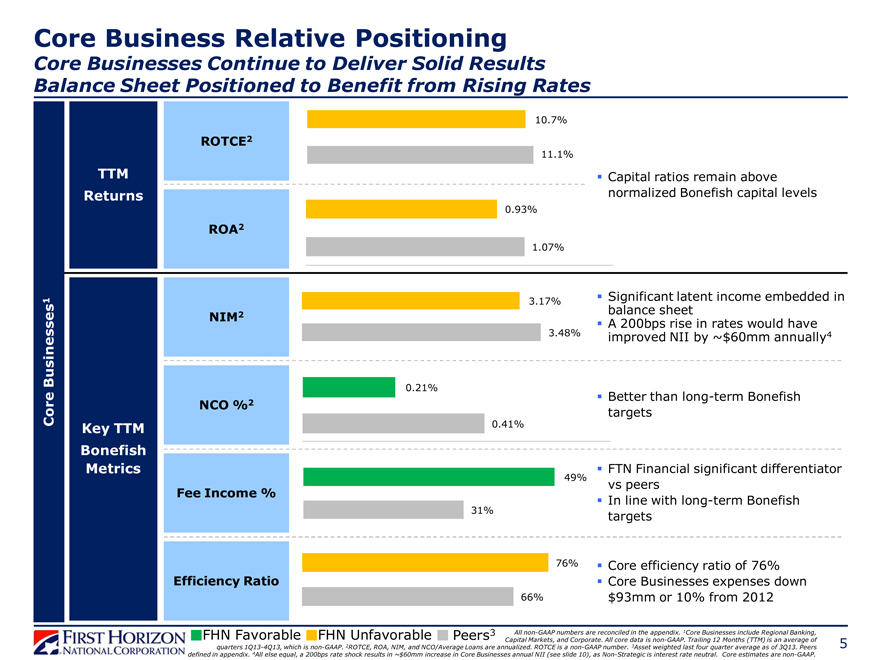
Core Business Relative Positioning
Core Businesses Continue to Deliver Solid Results Balance Sheet Positioned to Benefit from Rising Rates
Core Businesses1
TTM Returns
Key TTM Bonefish Metrics
ROTCE2
10.7%
11.1%
Capital ratios remain above normalized Bonefish capital levels
ROA2
0.93%
1.07%
NIM2
3.17%
3.48%
Significant latent income embedded in balance sheet A 200bps rise in rates would have improved NII by ~$60mm annually4
NCO%2
0.21%
0.41%
Better than long-term Bonefish targets
Fee Income %
49%
31%
FTN Financial significant differentiator vs peers In line with long-term Bonefish targets
Efficiency Ratio
76%
66%
Core efficiency ratio of 76% Core Businesses expenses down $93mm or 10% from 2012
FHN Favorable
FHN Unfavorable
Peers3
All non-GAAP numbers are reconciled in the appendix. 1Core Businesses include Regional Banking,
Capital Markets, and Corporate. All core data is non-GAAP. Trailing 12 Months (TTM) is an average of
quarters 1Q13-4Q13, which is non-GAAP. 2ROTCE, ROA, NIM, and NCO/Average Loans are annualized. ROTCE is a non-GAAP number. 3Asset weighted last four quarter average as of 3Q13. Peers defined in appendix. 4All else equal, a 200bps rate shock results in ~$60mm increase in Core Businesses annual NII (see slide 10), as Non-Strategic is interest rate neutral. Core estimates are non-GAAP.
5 |
|
Table of Contents
|

FINANCIAL RESULTS
6 |
|
Table of Contents
|
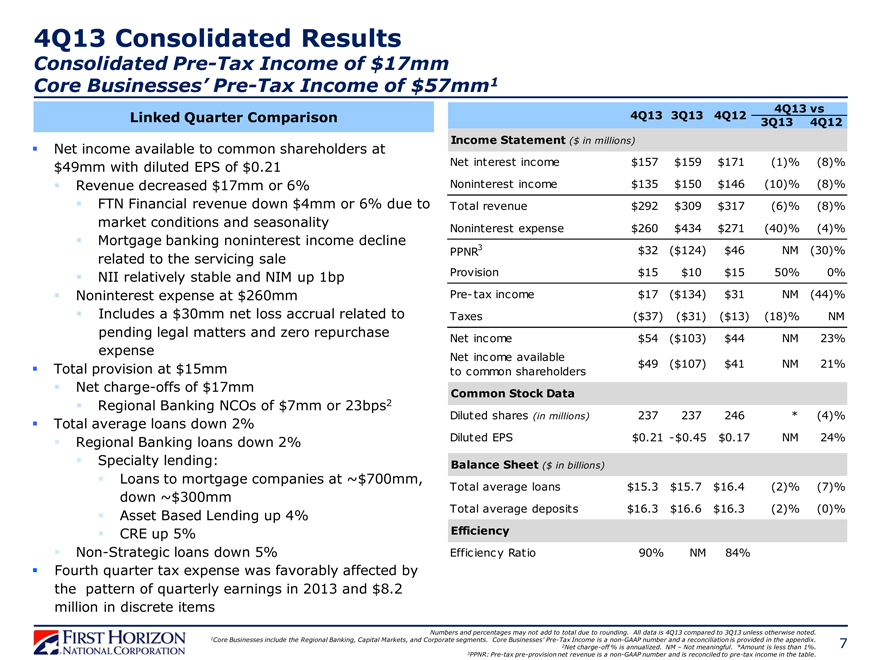
4Q13 Consolidated Results
Consolidated Pre-Tax Income of $17mm Core Businesses’ Pre-Tax Income of $57mm1
Linked Quarter Comparison
Net income available to common shareholders at $49mm with diluted EPS of $0.21
Revenue decreased $17mm or 6%
FTN Financial revenue down $4mm or 6% due to market conditions and seasonality
Mortgage banking noninterest income decline related to the servicing sale
NII relatively stable and NIM up 1bp
Noninterest expense at $260mm
Includes a $30mm net loss accrual related to pending legal matters and zero repurchase expense
Total provision at $15mm
Net charge-offs of $17mm
Regional Banking NCOs of $7mm or 23bps2
Total average loans down 2%
Regional Banking loans down 2%
Specialty lending:
Loans to mortgage companies at ~$700mm, down ~$300mm
Asset Based Lending up 4%
CRE up 5%
Non-Strategic loans down 5%
Fourth quarter tax expense was favorably affected by the pattern of quarterly earnings in 2013 and $8.2 million in discrete items
4Q13 vs
4Q13 3Q13 4Q12
3Q13 4Q12
Income Statement ($ in millions)
Net interest income $157 $159 $171 (1)% (8)%
Noninterest income $135 $150 $146 (10)% (8)%
Total revenue $292 $309 $317 (6)% (8)%
Noninterest expense $260 $434 $271 (40)% (4)%
PPNR3 $32 ($124) $46 NM (30)%
Provision $15 $10 $15 50% 0%
Pre-tax income $17 ($134) $31 NM (44)%
Taxes ($37) ($31) ($13) (18)% NM
Net income $54 ($103) $44 NM 23%
Net income available
$49 ($107) $41 NM 21%
to common shareholders
Common Stock Data
Diluted shares (in millions) 237 237 246 * (4)%
Diluted EPS $0.21 - $0.45 $0.17 NM 24%
Balance Sheet ($ in billions)
Total average loans $15.3 $15.7 $16.4 (2)% (7)%
Total average deposits $16.3 $16.6 $16.3 (2)% (0)%
Efficiency
Efficiency Ratio 90% NM 84%
Numbers and percentages may not add to total due to rounding. All data is 4Q13 compared to 3Q13 unless otherwise noted.
1Core Businesses include the Regional Banking, Capital Markets, and Corporate segments. Core Businesses’ Pre-Tax Income is a non-GAAP number and a reconciliation is provided in the appendix.
2Net charge-off % is annualized. NM – Not meaningful. *Amount is less than 1%.
3PPNR: Pre-tax pre-provision net revenue is a non-GAAP number and is reconciled to pre-tax income in the table.
7 |
|
Table of Contents
|
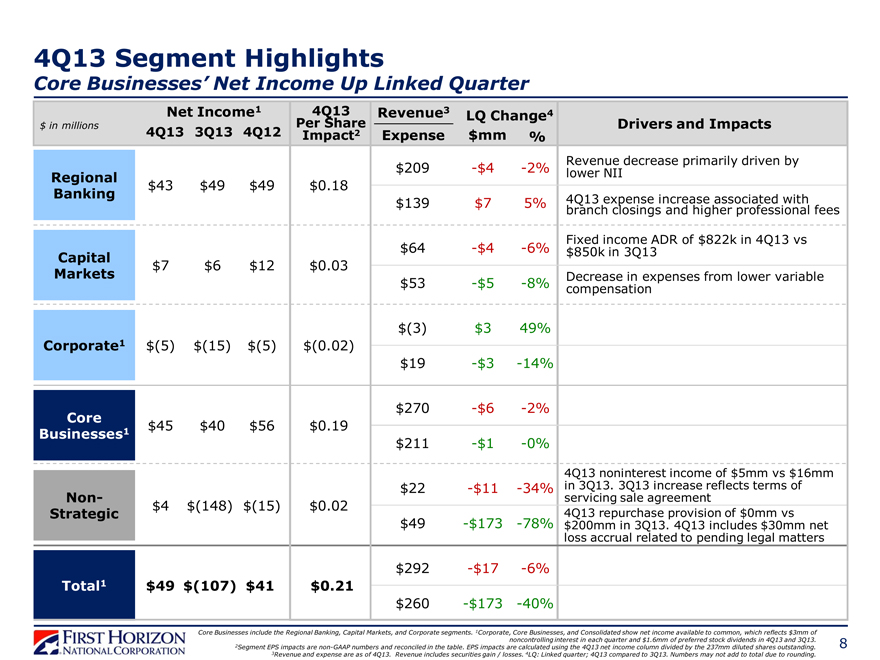
4Q13 Segment Highlights
Core Businesses’ Net Income Up Linked Quarter
Net Income1 4Q13 Revenue3 LQ Change4
$ in millions Per Share Drivers and Impacts
4Q13 3Q13 4Q12 Impact2 Expense $mm %
Revenue decrease primarily driven by
Regional $209 -$4 -2% lower NII
$43 $49 $49 $0.18
Banking
$139 $7 5% 4Q13 expense increase associated with
branch closings and higher professional fees
Fixed income ADR of $822k in 4Q13 vs
$64 -$4 -6% $850k in 3Q13
Capital $7 $6 $12 $0.03
Markets Decrease in expenses from lower variable
$53 -$5 -8% compensation
$(3) $3 49%
Corporate1 $(5) $(15) $(5) $(0.02)
$19 -$3 -14%
$270 -$6 -2%
Core
Businesses1 $45 $40 $56 $0.19
$211 -$1 -0%
4Q13 noninterest income of $5mm vs $16mm
$22 -$11 -34% in 3Q13. 3Q13 increase reflects terms of
Non- servicing sale agreement
$4 $(148) $(15) $0.02
Strategic 4Q13 repurchase provision of $0mm vs
$49 -$173 -78% $200mm in 3Q13. 4Q13 includes $30mm net
loss accrual related to pending legal matters
$292 -$17 -6%
Total1 $49 $(107) $41 $0.21
$260 -$173 -40%
Core Businesses include the Regional Banking, Capital Markets, and Corporate segments. 1Corporate, Core Businesses, and Consolidated show net income available to common, which reflects $3mm of noncontrolling interest in each quarter and $1.6mm of preferred stock dividends in 4Q13 and 3Q13.
2Segment EPS impacts are non-GAAP numbers and reconciled in the table. EPS impacts are calculated using the 4Q13 net income column divided by the 237mm diluted shares outstanding. 3Revenue and expense are as of 4Q13. Revenue includes securities gain / losses. 4LQ: Linked quarter; 4Q13 compared to 3Q13. Numbers may not add to total due to rounding.
8 |
|
Table of Contents
|
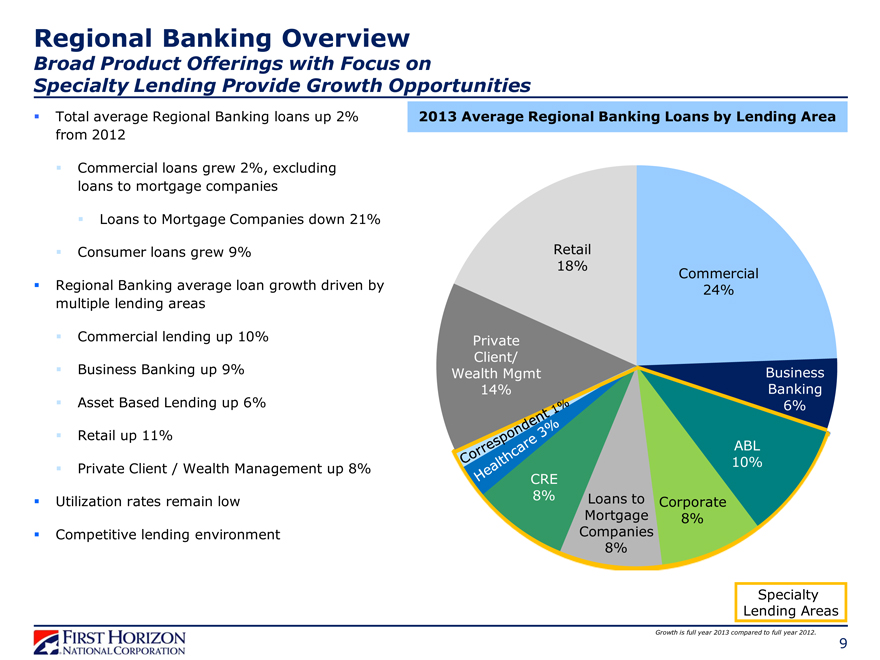
Regional Banking Overview
Broad Product Offerings with Focus on
Specialty Lending Provide Growth Opportunities
Total average Regional Banking loans up 2% from 2012
Commercial loans grew 2%, excluding loans to mortgage companies
Loans to Mortgage Companies down 21%
Consumer loans grew 9%
Regional Banking average loan growth driven by multiple lending areas
Commercial lending up 10%
Business Banking up 9%
Asset Based Lending up 6%
Retail up 11%
Private Client / Wealth Management up 8%
Utilization rates remain low
Competitive lending environment
2013 Average Regional Banking Loans by Lending Area
Retail 18%
Private Client/ Wealth Mgmt 14%
Correspondent 1%
Healthcare 3%
CRE 8%
Loans to Corporate Mortgage 8% Companies 8%
ABL 10%
Business Banking 6%
Commercial 24%
Specialty Lending Areas
Growth is full year 2013 compared to full year 2012.
9
Table of Contents
|
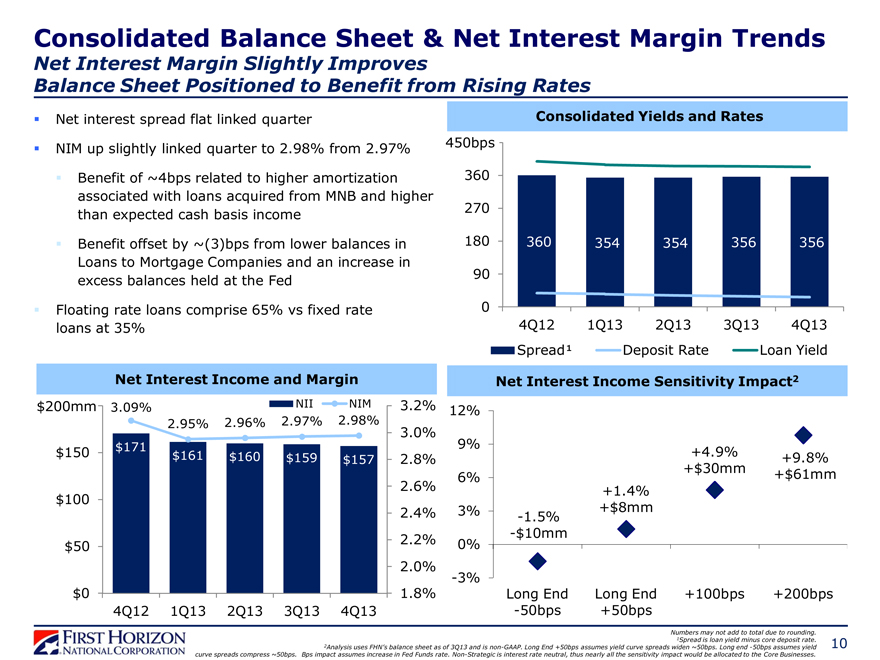
Consolidated Balance Sheet & Net Interest Margin Trends
Net Interest Margin Slightly Improves
Balance Sheet Positioned to Benefit from Rising Rates
Net interest spread flat linked quarter
NIM up slightly linked quarter to 2.98% from 2.97%
Benefit of ~4bps related to higher amortization associated with loans acquired from MNB and higher than expected cash basis income
Benefit offset by ~(3)bps from lower balances in Loans to Mortgage Companies and an increase in excess balances held at the Fed
Floating rate loans comprise 65% vs fixed rate loans at 35%
Consolidated Yields and Rates
450bps
360
270
180
90
0
360 354 354 356 356
4Q12 1Q13 2Q13 3Q13 4Q13
Spread¹ Deposit Rate Loan Yield
Net Interest Income and Margin
$200mm $150 $100 $50 $0
4Q12 1Q13 2Q13 3Q13 4Q13
$171 $161 $160 $159 $157
3.09% NII NIM
2.95% 2.96% 2.97% 2.98%
3.2% 3.0% 2.8% 2.6% 2.4% 2.2% 2.0% 1.8%
Net Interest Income Sensitivity Impact2
12% 9% 6% 3% 0% -3%
Long End Long End +100bps +200bps -50bps +50bps
-1.5%
-$10mm
+1.4%
+$8mm
+4.9%
+$30mm
+9.8%
+$61mm
Numbers may not add to total due to rounding. 1Spread is loan yield minus core deposit rate.
2Analysis uses FHN’s balance sheet as of 3Q13 and is non-GAAP. Long End +50bps assumes yield curve spreads widen ~50bps. Long end -50bps assumes yield curve spreads compress ~50bps. Bps impact assumes increase in Fed Funds rate. Non-Strategic is interest rate neutral, thus nearly all the sensitivity impact would be allocated to the Core Businesses.
10
Table of Contents
|
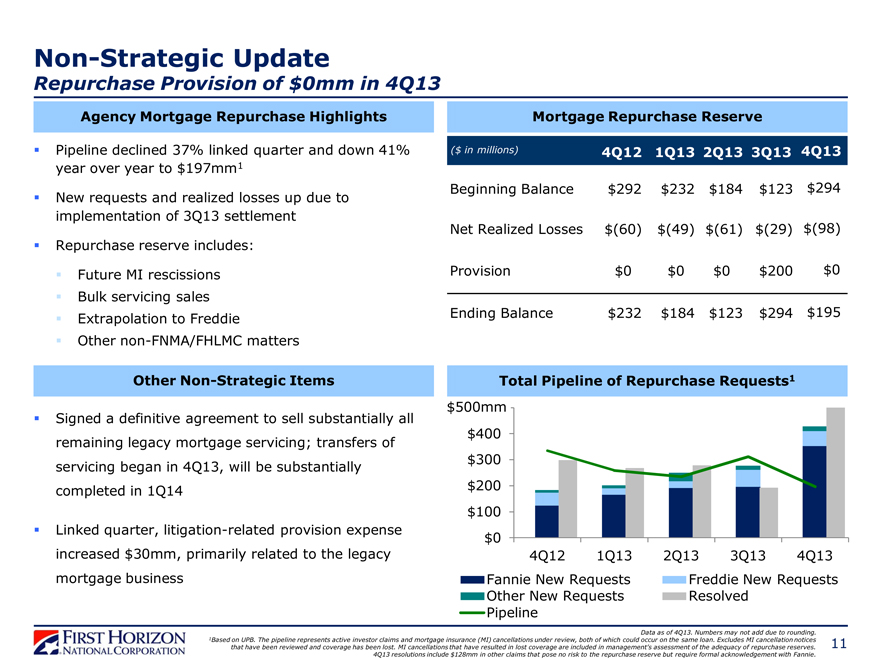
Non-Strategic Update
Repurchase Provision of $0mm in 4Q13
Agency Mortgage Repurchase Highlights
Pipeline declined 37% linked quarter and down 41% year over year to $197mm1
New requests and realized losses up due to implementation of 3Q13 settlement
Repurchase reserve includes:
Future MI rescissions
Bulk servicing sales
Extrapolation to Freddie
Other non-FNMA/FHLMC matters
Mortgage Repurchase Reserve
($ in millions) 4Q12 1Q13 2Q13 3Q13 4Q13
Beginning Balance $292 $232 $184 $123 $294
Net Realized Losses $(60) $(49) $(61) $(29) $(98)
Provision $0 $0 $0 $200 $0
Ending Balance $232 $184 $123 $294 $195
Other Non-Strategic Items
Signed a definitive agreement to sell substantially all remaining legacy mortgage servicing; transfers of servicing began in 4Q13, will be substantially completed in 1Q14
Linked quarter, litigation-related provision expense increased $30mm, primarily related to the legacy mortgage business
Total Pipeline of Repurchase Requests1
$500mm $400 $300 $200 $100 $0
4Q12 1Q13 2Q13 3Q13 4Q13
Fannie New Requests Freddie New Requests
Other New Requests Resolved
Pipeline
Data as of 4Q13. Numbers may not add due to rounding. 1Based on UPB. The pipeline represents active investor claims and mortgage insurance (MI) cancellations under review, both of which could occur on the same loan. Excludes MI cancellation notices that have been reviewed and coverage has been lost. MI cancellations that have resulted in lost coverage are included in management’s assessment of the adequacy of repurchase reserves.
4Q13 resolutions include $128mm in other claims that pose no risk to the repurchase reserve but require formal acknowledgement with Fannie.
11
Table of Contents
|
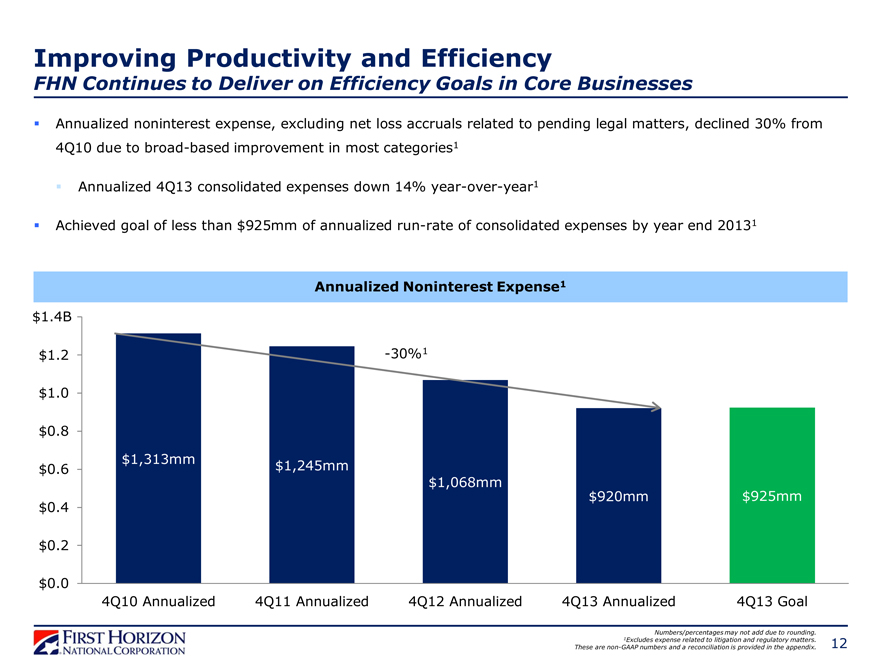
Improving Productivity and Efficiency
FHN Continues to Deliver on Efficiency Goals in Core Businesses
Annualized noninterest expense, excluding net loss accruals related to pending legal matters, declined 30% from 4Q10 due to broad-based improvement in most categories1
Annualized 4Q13 consolidated expenses down 14% year-over-year1
Achieved goal of less than $925mm of annualized run-rate of consolidated expenses by year end 20131
Annualized Noninterest Expense1
$1.4B $1.2 $1.0 $0.8 $0.6 $0.4 $0.2 $0.0
-30%1
$1,313mm $1,245mm $1,068mm $920mm $925mm
4Q10 Annualized 4Q11 Annualized 4Q12 Annualized 4Q13 Annualized 4Q13 Goal
Numbers/percentages may not add due to rounding.
1Excludes expense related to litigation and regulatory matters.
These are non-GAAP numbers and a reconciliation is provided in the appendix.
12
Table of Contents
|
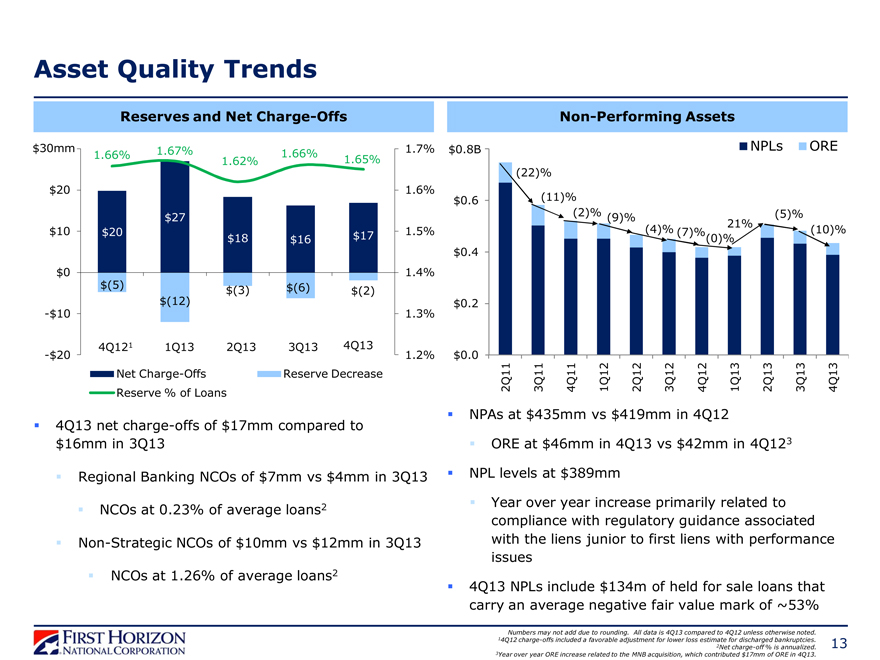
Asset Quality Trends
Reserves and Net Charge-Offs
$30mm $20 $10 $0
-$10
-$20
1.66% 1.67% 1.66% 1.65%
1.62%
$27
$20 $17
$18 $16
$(5) $(6) $(3) $(2) $(12)
4Q121 1Q13 2Q13 3Q13 4Q13
Net Charge-Offs Reserve Decrease Reserve % of Loans
1.7% 1.6% 1.5% 1.4% 1.3% 1.2%
Non-Performing Assets
$ 0. 8B $0.6 $0.4 $0.2 $0.0
NPLs ORE
(22)%
(11)%
(2)% (5)% (9)% 21%
(4)% (7)%(0)% (10)%
2Q11 3Q11 4Q11 1Q12 2Q12 3Q12 4Q12 1Q13 2Q13 3Q13 4Q13
4Q13 net charge-offs of $17mm compared to $16mm in 3Q13
Regional Banking NCOs of $7mm vs $4mm in 3Q13
NCOs at 0.23% of average loans2
Non-Strategic NCOs of $10mm vs $12mm in 3Q13
NCOs at 1.26% of average loans2
NPAs at $435mm vs $419mm in 4Q12
ORE at $46mm in 4Q13 vs $42mm in 4Q123 NPL levels at $389mm
Year over year increase primarily related to compliance with regulatory guidance associated with the liens junior to first liens with performance issues
4Q13 NPLs include $134m of held for sale loans that carry an average negative fair value mark of ~53%
Numbers may not add due to rounding. All data is 4Q13 compared to 4Q12 unless otherwise noted.
14Q12 charge-offs included a favorable adjustment for lower loss estimate for discharged bankruptcies.
2Net charge-off % is annualized.
3Year over year ORE increase related to the MNB acquisition, which contributed $17mm of ORE in 4Q13.
13
Table of Contents
|
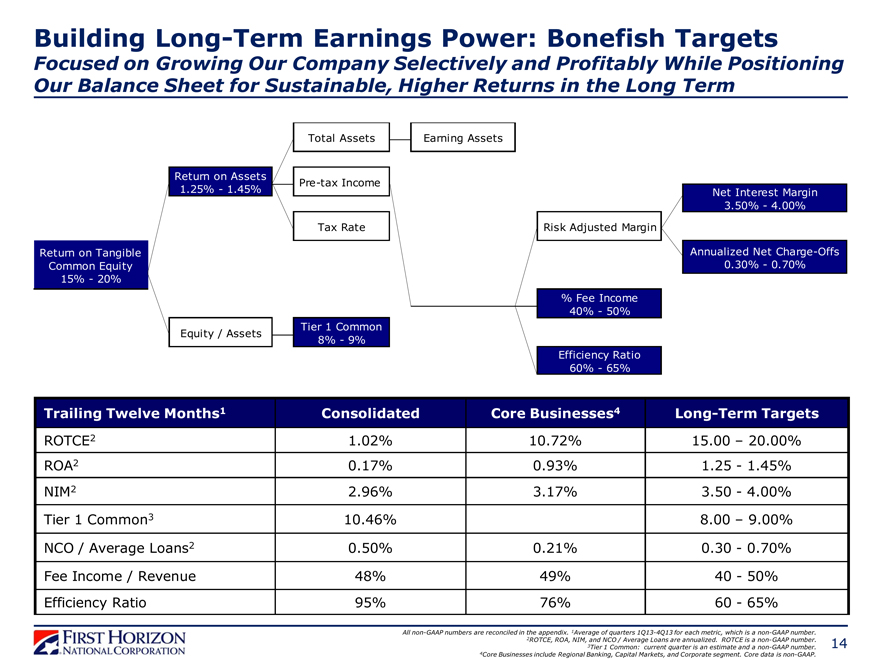
Building Long-Term Earnings Power: Bonefish Targets
Focused on Growing Our Company Selectively and Profitably While Positioning Our Balance Sheet for Sustainable, Higher Returns in the Long Term
Return on Tangible Common Equity 15%—20%
Return on Assets
1.25%—1.45%
Total Assets
Pre-tax Income
Tax Rate
Earning Assets
Equity / Assets
Tier 1 Common
8%—9%
Risk Adjusted Margin
Net Interest Margin 3.50%—4.00%
Annualized Net Charge-Offs 0.30%—0.70%
% Fee Income 40%—50%
Efficiency Ratio 60%—65%
Trailing Twelve Months1 Consolidated Core Businesses4 Long-Term Targets
ROTCE2 1.02% 10.72% 15.00 – 20.00%
ROA2 0.17% 0.93% 1.25 — 1.45%
NIM2 2.96% 3.17% 3.50 — 4.00%
Tier 1 Common3 10.46% 8.00 – 9.00%
NCO / Average Loans2 0.50% 0.21% 0.30 — 0.70%
Fee Income / Revenue 48% 49% 40— 50%
Efficiency Ratio 95% 76% 60— 65%
All non-GAAP numbers are reconciled in the appendix. 1Average of quarters 1Q13-4Q13 for each metric, which is a non-GAAP number.
2ROTCE, ROA, NIM, and NCO / Average Loans are annualized. ROTCE is a non-GAAP number.
3Tier 1 Common: current quarter is an estimate and a non-GAAP number.
4Core Businesses include Regional Banking, Capital Markets, and Corporate segment. Core data is non-GAAP.
14
Table of Contents
|

Successfully Executing on Key Priorities
FHN Is Well Positioned For Long-Term Earnings Power
Proven execution capabilities
Unique size, scope and strengths
Focused on efficiency, productivity, economic profitability and growth opportunities
Organizational alignment on the path to long-term bonefish profitability
Breadth and depth of talent that will be able to profitably run and grow the company
Building a Foundation for Long-Term Earnings Power
15
Table of Contents
|
APPENDIX
16
Table of Contents
|
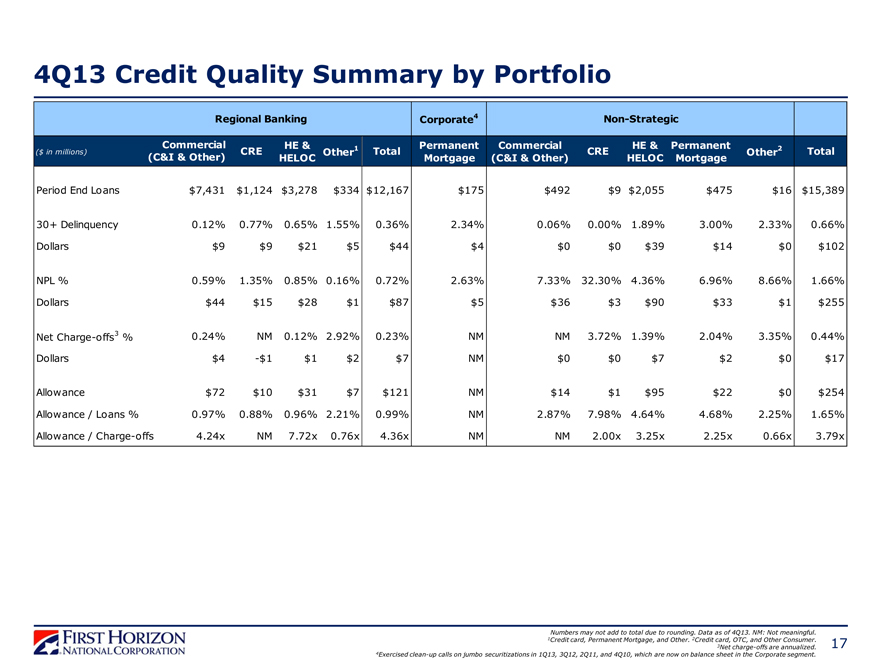
4Q13 Credit Quality Summary by Portfolio
Regional Banking Corporate4 Non-Strategic
Commercial HE & Permanent Commercial HE & Permanent
($ in millions) CRE Other1 Total CRE Other2 Total
(C&I & Other) HELOC Mortgage (C&I & Other) HELOC Mortgage
Period End Loans $7,431 $1,124 $3,278 $334 $12,167 $175 $492 $9 $2,055 $475 $16 $15,389
30+ Delinquency 0.12% 0.77% 0.65% 1.55% 0.36% 2.34% 0.06% 0.00% 1.89% 3.00% 2.33% 0.66%
Dollars $9 $9 $21 $5 $44 $4 $0 $0 $39 $14 $0 $102
NPL % 0.59% 1.35% 0.85% 0.16% 0.72% 2.63% 7.33% 32.30% 4.36% 6.96% 8.66% 1.66%
Dollars $44 $15 $28 $1 $87 $5 $36 $3 $90 $33 $1 $255
Net Charge-offs3 % 0.24% NM 0.12% 2.92% 0.23% NM NM 3.72% 1.39% 2.04% 3.35% 0.44%
Dollars $4 -$1 $1 $2 $7 NM $0 $0 $7 $2 $0 $17
Allowance $72 $10 $31 $7 $121 NM $14 $1 $95 $22 $0 $254
Allowance / Loans % 0.97% 0.88% 0.96% 2.21% 0.99% NM 2.87% 7.98% 4.64% 4.68% 2.25% 1.65%
Allowance / Charge-offs 4.24x NM 7.72x 0.76x 4.36x NM NM 2.00x 3.25x 2.25x 0.66x 3.79x
Numbers may not add to total due to rounding. Data as of 4Q13. NM: Not meaningful. 1Credit card, Permanent Mortgage, and Other. 2Credit card, OTC, and Other Consumer.
3Net charge-offs are annualized. 4Exercised clean-up calls on jumbo securitizations in 1Q13, 3Q12, 2Q11, and 4Q10, which are now on balance sheet in the Corporate segment.
17
Table of Contents
|
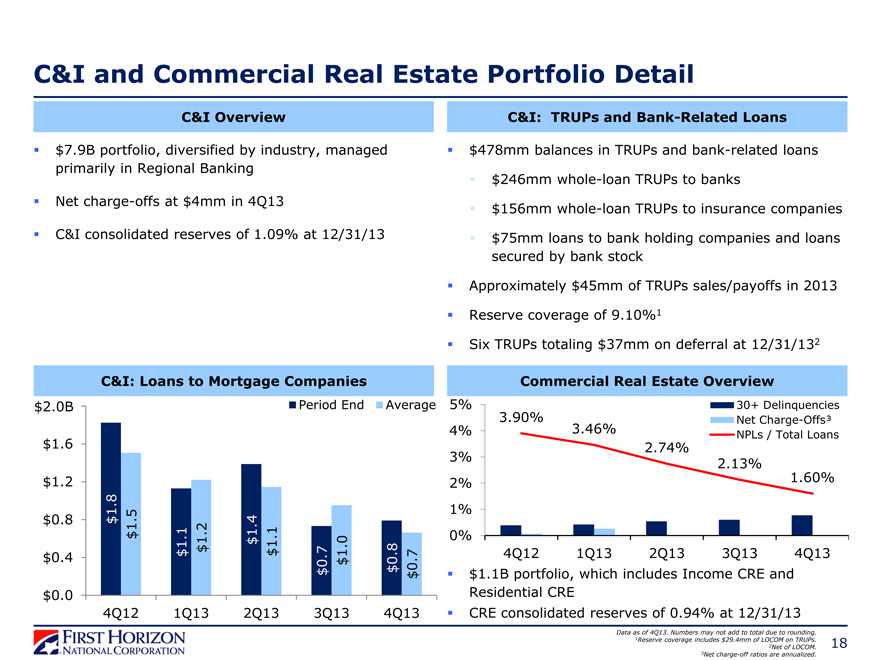
C&I and Commercial Real Estate Portfolio Detail
C&I Overview
$7.9B portfolio, diversified by industry, managed primarily in Regional Banking
Net charge-offs at $4mm in 4Q13
C&I consolidated reserves of 1.09% at 12/31/13
C&I: TRUPs and Bank-Related Loans
$478mm balances in TRUPs and bank-related loans
$246mm whole-loan TRUPs to banks
$156mm whole-loan TRUPs to insurance companies
$75mm loans to bank holding companies and loans secured by bank stock
Approximately $45mm of TRUPs sales/payoffs in 2013 Reserve coverage of 9.10%1 Six TRUPs totaling $37mm on deferral at 12/31/132
C&I: Loans to Mortgage Companies
$2.0B $1.6 $1.2 $0.8 $0.4 $0.0
Period End Average
4Q12 1Q13 2Q13 3Q13 4Q13
$1.8
$1.5
$1.1
$1.2
$1.4
$1.1
$0.7
$1.0
$0.8
$0.7
Commercial Real Estate Overview
5% 4% 3% 2% 1% 0%
30+ Delinquencies Net Charge-Offs³ NPLs / Total Loans
3.90%
3.46%
2.74%
2.13%
1.60%
4Q12 1Q13 2Q13 3Q13 4Q13
$1.1B portfolio, which includes Income CRE and Residential CRE
CRE consolidated reserves of 0.94% at 12/31/13
Data as of 4Q13. Numbers may not add to total due to rounding.
1Reserve coverage includes $29.4mm of LOCOM on TRUPs.
2Net of LOCOM.
3Net charge-off ratios are annualized.
18
Table of Contents
|
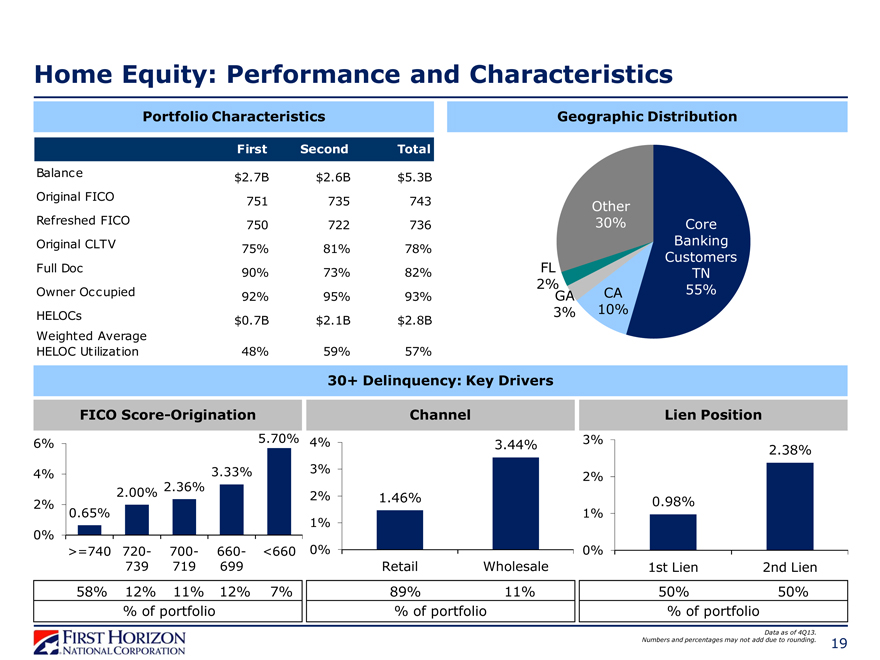
Home Equity: Performance and Characteristics
Portfolio Characteristics
First Second Total
Balance $ 2.7B $ 2.6B $ 5.3B
Original FICO 751 735 743
Refreshed FICO 750 722 736
Original CLTV 75% 81% 78%
Full Doc 90% 73% 82%
Owner Occupied 92% 95% 93%
HELOCs $ 0.7B $ 2.1B $ 2.8B
Weighted Average
HELOC Utilization 48% 59% 57%
Geographic Distribution
FL 2% GA
3%
Other 30%
CA 10%
Core Banking Customers TN
55%
30+ Delinquency: Key Drivers
FICO Score-Origination Channel Lien Position
6% 4% 2% 0%
>=740 720- 700- 660- <660 739 719 699
3.33% 2.36% 2.00% 0.65%
5.70%
4% 3% 2% 1% 0%
1.46%
3.44%
Retail Wholesale
3% 2% 1% 0%
0.98%
2.38%
1st Lien 2nd Lien
58% 12% 11% 12% 7%
% of portfolio
89% 11% % of portfolio
50% 50% % of portfolio
Data as of 4Q13.
Numbers and percentages may not add due to rounding.
19
Table of Contents
|
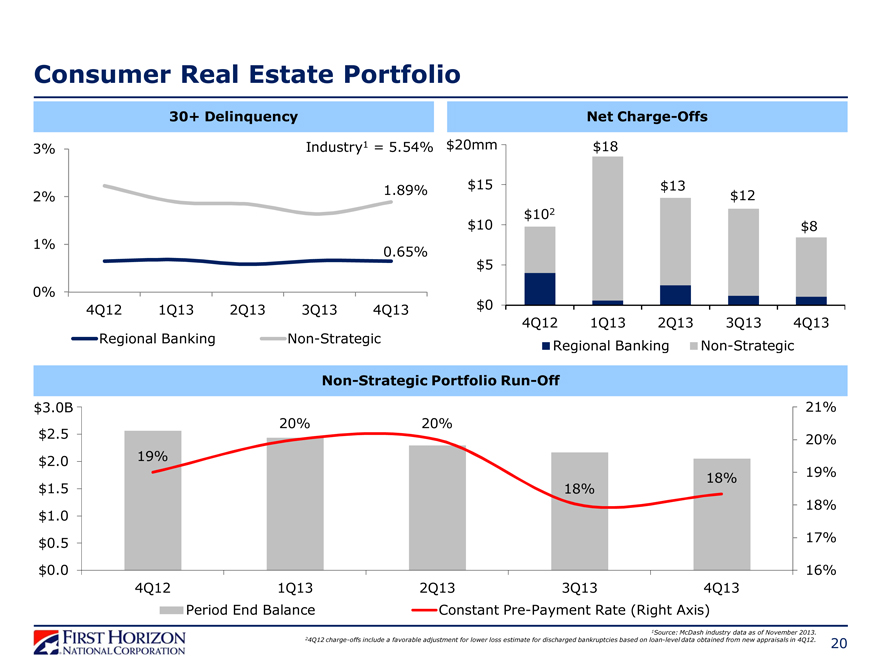
Consumer Real Estate Portfolio
30+ Delinquency
3% 2% 1% 0%
4Q12 1Q13 2Q13 3Q13 4Q13
Regional Banking Non-Strategic
Industry1 = 5.54%
1.89%
0.65%
Net Charge-Offs
$20mm $15 $10 $5 $0
4Q12 1Q13 2Q13 3Q13 4Q13 Regional Banking Non-Strategic
$18
$13 $12
$102 $8
Non-Strategic Portfolio Run-Off
$3.0B $2.5 $2.0 $1.5 $1.0 $0.5 $0.0
20% 20%
19%
18% 18%
21% 20% 19% 18% 17% 16%
4Q12 1Q13 2Q13 3Q13 4Q13
Period End Balance Constant Pre-Payment Rate (Right Axis)
1Source: McDash industry data as of November 2013.
24Q12 charge-offs include a favorable adjustment for lower loss estimate for discharged bankruptcies based on loan-level data obtained from new appraisals in 4Q12.
20
Table of Contents
|
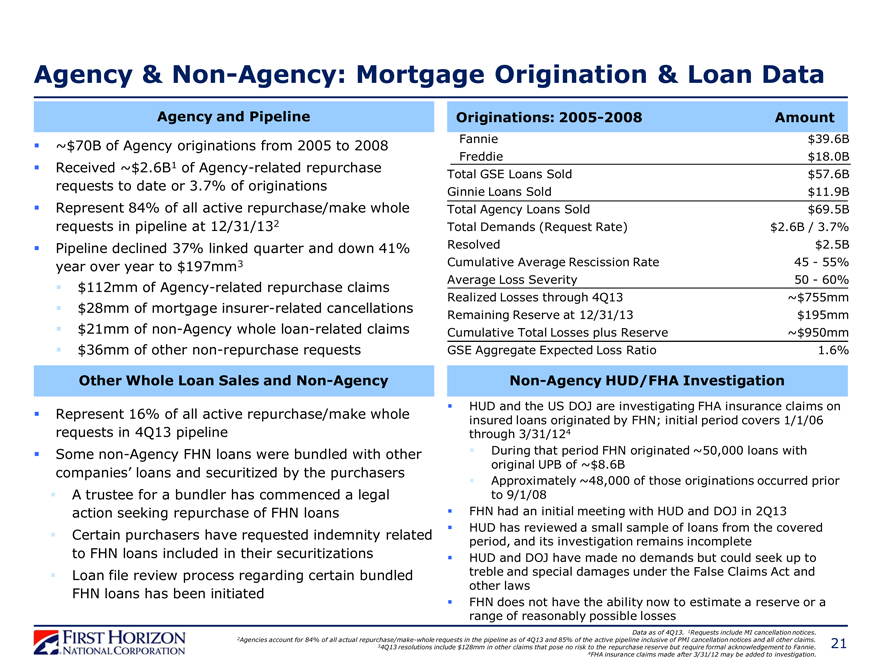
Agency & Non-Agency: Mortgage Origination & Loan Data
Agency and Pipeline
~$70B of Agency originations from 2005 to 2008
Received ~$2.6B1 of Agency-related repurchase requests to date or 3.7% of originations
Represent 84% of all active repurchase/make whole requests in pipeline at 12/31/132
Pipeline declined 37% linked quarter and down 41% year over year to $197mm3
$112mm of Agency-related repurchase claims
$28mm of mortgage insurer-related cancellations
$21mm of non-Agency whole loan-related claims
$36mm of other non-repurchase requests
Originations: 2005-2008 Amount
Fannie $39.6B
Freddie $18.0B
Total GSE Loans Sold $57.6B
Ginnie Loans Sold $11.9B
Total Agency Loans Sold $69.5B
Total Demands (Request Rate) $2.6B / 3.7%
Resolved $2.5B
Cumulative Average Rescission Rate 45—55%
Average Loss Severity 50—60%
Realized Losses through 4Q13 ~$755mm
Remaining Reserve at 12/31/13 $195mm
Cumulative Total Losses plus Reserve ~$950mm
GSE Aggregate Expected Loss Ratio 1.6%
Other Whole Loan Sales and Non-Agency
Represent 16% of all active repurchase/make whole requests in 4Q13 pipeline Some non-Agency FHN loans were bundled with other companies’ loans and securitized by the purchasers
A trustee for a bundler has commenced a legal action seeking repurchase of FHN loans
Certain purchasers have requested indemnity related to FHN loans included in their securitizations
Loan file review process regarding certain bundled FHN loans has been initiated
Non-Agency HUD/FHA Investigation
HUD and the US DOJ are investigating FHA insurance claims on insured loans originated by FHN; initial period covers 1/1/06 through 3/31/124
During that period FHN originated ~50,000 loans with original UPB of ~$8.6B
Approximately ~48,000 of those originations occurred prior to 9/1/08 FHN had an initial meeting with HUD and DOJ in 2Q13 HUD has reviewed a small sample of loans from the covered period, and its investigation remains incomplete HUD and DOJ have made no demands but could seek up to treble and special damages under the False Claims Act and other laws FHN does not have the ability now to estimate a reserve or a range of reasonably possible losses
Data as of 4Q13. 1Requests include MI cancellation notices. 2Agencies account for 84% of all actual repurchase/make-whole requests in the pipeline as of 4Q13 and 85% of the active pipeline inclusive of PMI cancellation notices and all other claims.
34Q13 resolutions include $128mm in other claims that pose no risk to the repurchase reserve but require formal acknowledgement to Fannie. 4FHA insurance claims made after 3/31/12 may be added to investigation.
21
Table of Contents
|
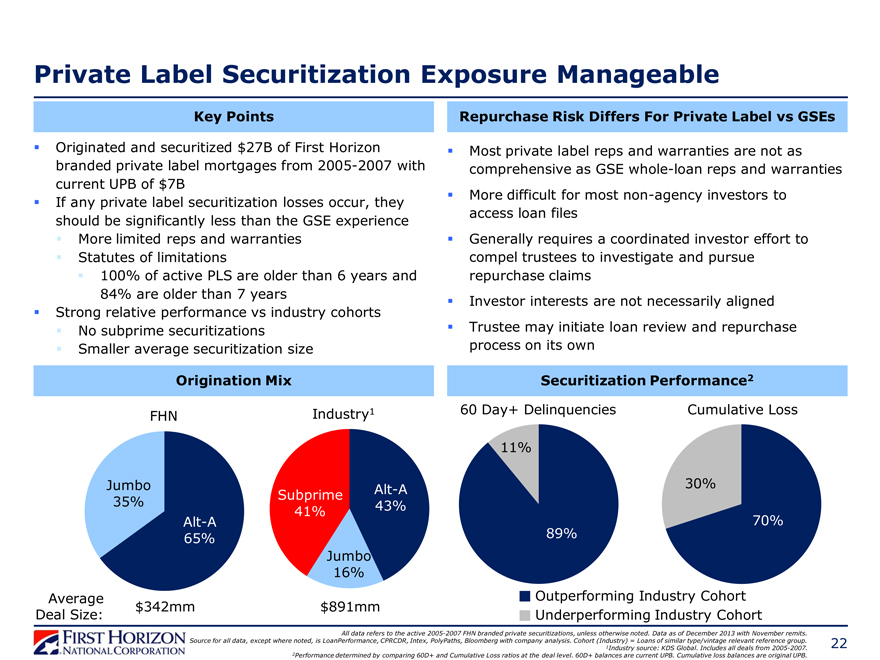
Private Label Securitization Exposure Manageable
Key Points
Originated and securitized $27B of First Horizon branded private label mortgages from 2005-2007 with current UPB of $7B
If any private label securitization losses occur, they should be significantly less than the GSE experience
More limited reps and warranties
Statutes of limitations
100% of active PLS are older than 6 years and 84% are older than 7 years Strong relative performance vs industry cohorts
No subprime securitizations
Smaller average securitization size
Repurchase Risk Differs For Private Label vs GSEs
Most private label reps and warranties are not as comprehensive as GSE whole-loan reps and warranties
More difficult for most non-agency investors to access loan files
Generally requires a coordinated investor effort to compel trustees to investigate and pursue repurchase claims
Investor interests are not necessarily aligned
Trustee may initiate loan review and repurchase process on its own
Origination Mix
FHN
Jumbo 35%
Alt-A 65%
Industry1
Alt-A Subprime 43% 41%
Jumbo 16%
Average $342mm $891mm Deal Size:
Securitization Performance2
60 Day+ Delinquencies Cumulative Loss
11%
30%
70% 89%
Outperforming Industry Cohort Underperforming Industry Cohort
All data refers to the active 2005-2007 FHN branded private securitizations, unless otherwise noted. Data as of December 2013 with November remits.
Source for all data, except where noted, is LoanPerformance, CPRCDR, Intex, PolyPaths, Bloomberg with company analysis. Cohort (Industry) = Loans of similar type/vintage relevant reference group.
1Industry source: KDS Global. Includes all deals from 2005-2007.
2Performance determined by comparing 60D+ and Cumulative Loss ratios at the deal level. 60D+ balances are current UPB. Cumulative loss balances are original UPB.
22
Table of Contents
|
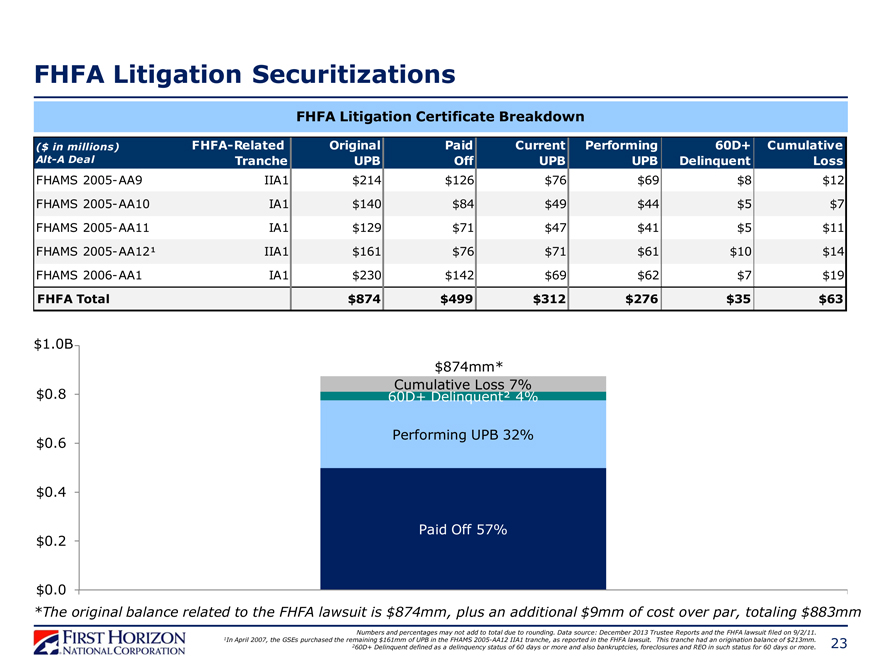
FHFA Litigation Securitizations
FHFA Litigation Certificate Breakdown
($ in millions) FHFA- Related Original Paid Current Performing 60D+ Cumulative
Alt-A Deal Tranche UPB Off UPB UPB Delinquent Loss
FHAMS 2005- AA9 IIA1 $214 $126 $76 $69 $8 $12
FHAMS 2005- AA10 IA1 $140 $84 $49 $44 $5 $7
FHAMS 2005- AA11 IA1 $129 $71 $47 $41 $5 $11
FHAMS 2005- AA12¹ IIA1 $161 $76 $71 $61 $10 $14
FHAMS 2006- AA1 IA1 $230 $142 $69 $62 $7 $19
FHFA Total $874 $499 $312 $276 $35 $63
$1.0B
$0.8
$0.6
$0.4
$0.2
$0.0
$874mm* Cumulative Loss 7% 60D+ Delinquent² 4%
Performing UPB 32%
Paid Off 57%
*The original balance related to the FHFA lawsuit is $874mm, plus an additional $9mm of cost over par, totaling $883mm
Numbers and percentages may not add to total due to rounding. Data source: December 2013 Trustee Reports and the FHFA lawsuit filed on 9/2/11. 1In April 2007, the GSEs purchased the remaining $161mm of UPB in the FHAMS 2005-AA12 IIA1 tranche, as reported in the FHFA lawsuit. This tranche had an origination balance of $213mm.
260D+ Delinquent defined as a delinquency status of 60 days or more and also bankruptcies, foreclosures and REO in such status for 60 days or more. 23
Table of Contents
|
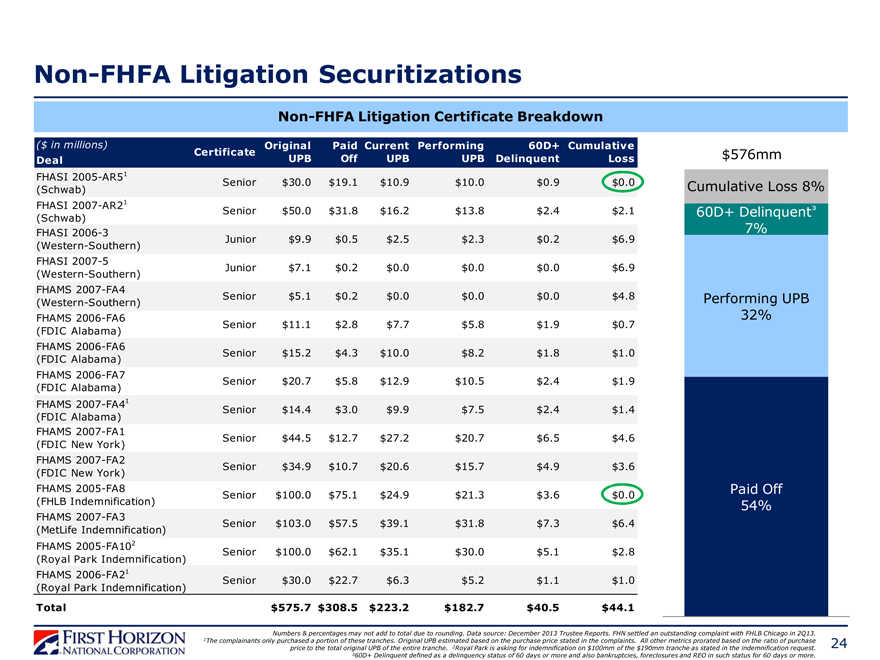
Non-FHFA Litigation Securitizations
Non-FHFA Litigation Certificate Breakdown
($ in millions) Original Paid Current Performing 60D+ Cumulative
Certificate
Deal UPB Off UPB UPB Delinquent Loss
FHASI 2005-AR51 Senior $30.0 $19.1 $10.9 $10.0 $0.9 $0.0
(Schwab)
FHASI 2007-AR21
Senior $50.0 $31.8 $16.2 $13.8 $2.4 $2.1
(Schwab)
FHASI 2006-3
Junior $9.9 $0.5 $2.5 $2.3 $0.2 $6.9
(Western-Southern)
FHASI 2007-5
Junior $7.1 $0.2 $0.0 $0.0 $0.0 $6.9
(Western-Southern)
FHAMS 2007-FA4
Senior $5.1 $0.2 $0.0 $0.0 $0.0 $4.8
(Western-Southern)
FHAMS 2006-FA6
Senior $11.1 $2.8 $7.7 $5.8 $1.9 $0.7
(FDIC Alabama)
FHAMS 2006-FA6
Senior $15.2 $4.3 $10.0 $8.2 $1.8 $1.0
(FDIC Alabama)
FHAMS 2006-FA7
Senior $20.7 $5.8 $12.9 $10.5 $2.4 $1.9
(FDIC Alabama)
FHAMS 2007-FA41
Senior $14.4 $3.0 $9.9 $7.5 $2.4 $1.4
(FDIC Alabama)
FHAMS 2007-FA1
Senior $44.5 $12.7 $27.2 $20.7 $6.5 $4.6
(FDIC New York)
FHAMS 2007-FA2
Senior $34.9 $10.7 $20.6 $15.7 $4.9 $3.6
(FDIC New York)
FHAMS 2005-FA8
Senior $100.0 $75.1 $24.9 $21.3 $3.6 $0.0
(FHLB Indemnification)
FHAMS 2007-FA3
Senior $103.0 $57.5 $39.1 $31.8 $7.3 $6.4
(MetLife Indemnification)
FHAMS 2005-FA102 Senior $100.0 $62.1 $35.1 $30.0 $5.1 $2.8
(Royal Park Indemnification)
FHAMS 2006-FA21 Senior $30.0 $22.7 $6.3 $5.2 $1.1 $1.0
(Royal Park Indemnification)
Total $575.7 $308.5 $223.2 $182.7 $40.5 $44.1
$576mm
Cumulative Loss 8%
60D+ Delinquent³ 7%
Performing UPB 32%
Paid Off 54%
Numbers & percentages may not add to total due to rounding. Data source: December 2013 Trustee Reports. FHN settled an outstanding complaint with FHLB Chicago in 2Q13.
1The complainants only purchased a portion of these tranches. Original UPB estimated based on the purchase price stated in the complaints. All other metrics prorated based on the ratio of purchase price to the total original UPB of the entire tranche. 2Royal Park is asking for indemnification on $100mm of the $190mm tranche as stated in the indemnification request.
360D+ Delinquent defined as a delinquency status of 60 days or more and also bankruptcies, foreclosures and REO in such status for 60 days or more.
24
Table of Contents
|
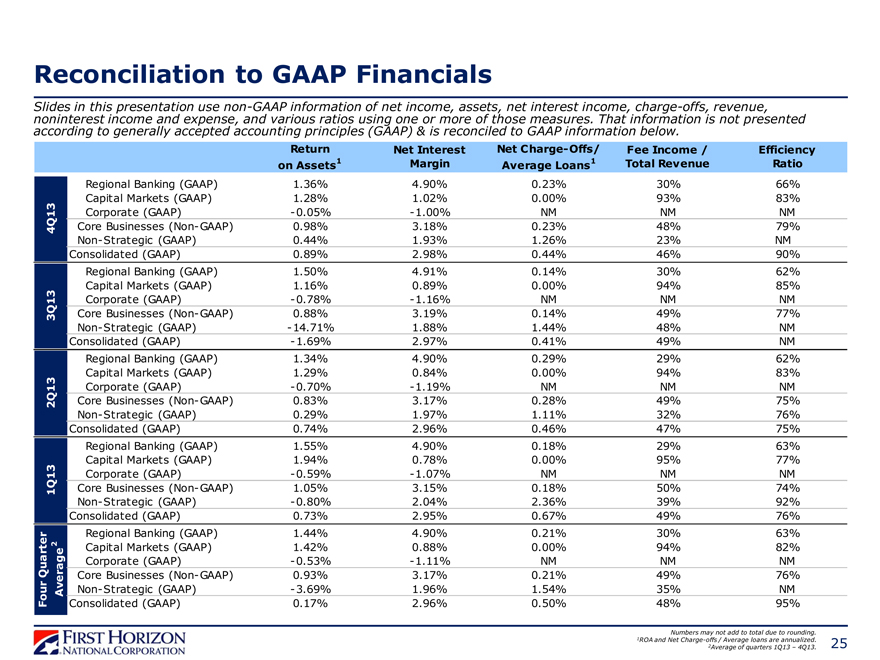
Reconciliation to GAAP Financials
Slides in this presentation use non-GAAP information of net income, assets, net interest income, charge-offs, revenue, noninterest income and expense, and various ratios using one or more of those measures. That information is not presented according to generally accepted accounting principles (GAAP) & is reconciled to GAAP information below.
Four Quarter 1Q13 2Q13 3Q13 4Q13
2 |
|
Average
Return Net Interest Net Charge- Offs/ Fee Income / Efficiency
on Assets1 Margin Average Loans1 Total Revenue Ratio
Regional Banking (GAAP) 1.36% 4.90% 0.23% 30% 66%
Capital Markets (GAAP) 1.28% 1.02% 0.00% 93% 83%
Corporate (GAAP) —0.05% -1.00% NM NM NM
Core Businesses (Non-GAAP) 0.98% 3.18% 0.23% 48% 79%
Non-Strategic (GAAP) 0.44% 1.93% 1.26% 23% NM
Consolidated (GAAP) 0.89% 2.98% 0.44% 46% 90%
Regional Banking (GAAP) 1.50% 4.91% 0.14% 30% 62%
Capital Markets (GAAP) 1.16% 0.89% 0.00% 94% 85%
Corporate (GAAP) —0.78% -1.16% NM NM NM
Core Businesses (Non-GAAP) 0.88% 3.19% 0.14% 49% 77%
Non-Strategic (GAAP) —14.71% 1.88% 1.44% 48% NM
Consolidated (GAAP) —1.69% 2.97% 0.41% 49% NM
Regional Banking (GAAP) 1.34% 4.90% 0.29% 29% 62%
Capital Markets (GAAP) 1.29% 0.84% 0.00% 94% 83%
Corporate (GAAP) —0.70% -1.19% NM NM NM
Core Businesses (Non-GAAP) 0.83% 3.17% 0.28% 49% 75%
Non-Strategic (GAAP) 0.29% 1.97% 1.11% 32% 76%
Consolidated (GAAP) 0.74% 2.96% 0.46% 47% 75%
Regional Banking (GAAP) 1.55% 4.90% 0.18% 29% 63%
Capital Markets (GAAP) 1.94% 0.78% 0.00% 95% 77%
Corporate (GAAP) —0.59% -1.07% NM NM NM
Core Businesses (Non- GAAP) 1.05% 3.15% 0.18% 50% 74%
Non-Strategic (GAAP) —0.80% 2.04% 2.36% 39% 92%
Consolidated (GAAP) 0.73% 2.95% 0.67% 49% 76%
Regional Banking (GAAP) 1.44% 4.90% 0.21% 30% 63%
Capital Markets (GAAP) 1.42% 0.88% 0.00% 94% 82%
Corporate (GAAP) —0.53% -1.11% NM NM NM
Core Businesses (Non- GAAP) 0.93% 3.17% 0.21% 49% 76%
Non-Strategic (GAAP) —3.69% 1.96% 1.54% 35% NM
Consolidated (GAAP) 0.17% 2.96% 0.50% 48% 95%
Numbers may not add to total due to rounding.
1ROA and Net Charge-offs / Average loans are annualized.
2Average of quarters 1Q13 – 4Q13.
25
Table of Contents
|
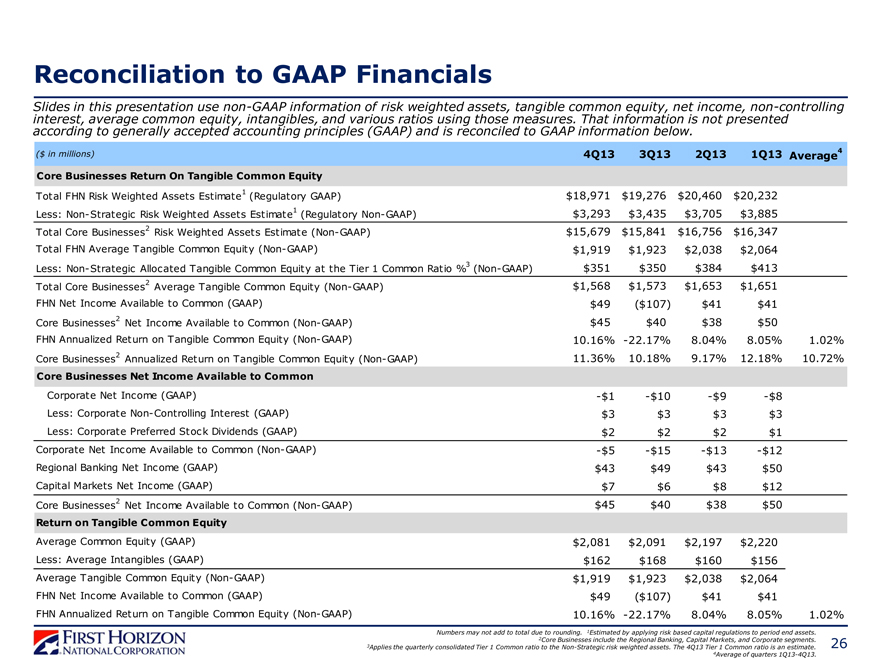
Reconciliation to GAAP Financials
Slides in this presentation use non-GAAP information of risk weighted assets, tangible common equity, net income, non-controlling interest, average common equity, intangibles, and various ratios using those measures. That information is not presented according to generally accepted accounting principles (GAAP) and is reconciled to GAAP information below.
($ in millions) 4Q13 3Q13 2Q13 1Q13 Average4
Core Businesses Return On Tangible Common Equity
Total FHN Risk Weighted Assets Estimate1 (Regulatory GAAP) $18,971 $19,276 $20,460 $20,232
Less: Non- Strategic Risk Weighted Assets Estimate1 (Regulatory Non- GAAP) $3,293 $3,435 $3,705 $3,885
Total Core Businesses2 Risk Weighted Assets Estimate (Non-GAAP) $15,679 $15,841 $16,756 $16,347
Total FHN Average Tangible Common Equity (Non- GAAP) $1,919 $1,923 $2,038 $2,064
Less: Non- Strategic Allocated Tangible Common Equity at the Tier 1 Common Ratio %3 (Non- GAAP) $351 $350 $384 $413
Total Core Businesses2 Average Tangible Common Equity (Non- GAAP) $1,568 $1,573 $1,653 $1,651
FHN Net Income Available to Common (GAAP) $49 ($107) $41 $41
Core Businesses2 Net Income Available to Common (Non- GAAP) $45 $40 $38 $50
FHN Annualized Return on Tangible Common Equity (Non- GAAP) 10.16% -22.17% 8.04% 8.05% 1.02%
Core Businesses2 Annualized Return on Tangible Common Equity (Non- GAAP) 11.36% 10.18% 9.17% 12.18% 10.72%
Core Businesses Net Income Available to Common
Corporate Net Income (GAAP) -$1 -$10 -$9 -$8
Less: Corporate Non- Controlling Interest (GAAP) $3 $3 $3 $3
Less: Corporate Preferred Stock Dividends (GAAP) $2 $2 $2 $1
Corporate Net Income Available to Common (Non- GAAP) -$5 -$15 -$13 -$12
Regional Banking Net Income (GAAP) $43 $49 $43 $50
Capital Markets Net Income (GAAP) $7 $6 $8 $12
Core Businesses2 Net Income Available to Common (Non- GAAP) $45 $40 $38 $50
Return on Tangible Common Equity
Average Common Equity (GAAP) $2,081 $2,091 $2,197 $2,220
Less: Average Intangibles (GAAP) $162 $168 $160 $156
Average Tangible Common Equity (Non- GAAP) $1,919 $1,923 $2,038 $2,064
FHN Net Income Available to Common (GAAP) $49 ($107) $41 $41
FHN Annualized Return on Tangible Common Equity (Non- GAAP) 10.16% -22.17% 8.04% 8.05% 1.02%
Numbers may not add to total due to rounding. 1Estimated by applying risk based capital regulations to period end assets.
2Core Businesses include the Regional Banking, Capital Markets, and Corporate segments.
3Applies the quarterly consolidated Tier 1 Common ratio to the Non-Strategic risk weighted assets. The 4Q13 Tier 1 Common ratio is an estimate.
4Average of quarters 1Q13-4Q13.
26
Table of Contents
|
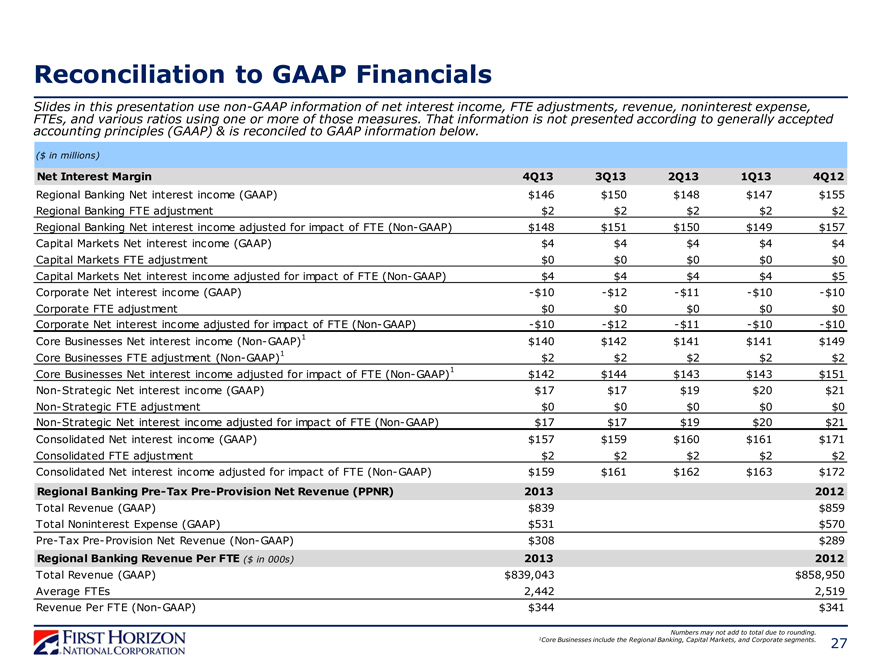
Reconciliation to GAAP Financials
Slides in this presentation use non-GAAP information of net interest income, FTE adjustments, revenue, noninterest expense, FTEs, and various ratios using one or more of those measures. That information is not presented according to generally accepted accounting principles (GAAP) & is reconciled to GAAP information below.
($ in millions)
Net Interest Margin 4Q13 3Q13 2Q13 1Q13 4Q12
Regional Banking Net interest income (GAAP) $146 $150 $148 $147 $155
Regional Banking FTE adjustment $2 $2 $2 $2 $2
Regional Banking Net interest income adjusted for impact of FTE (Non- GAAP) $148 $151 $150 $149 $157
Capital Markets Net interest income (GAAP) $4 $4 $4 $4 $4
Capital Markets FTE adjustment $0 $0 $0 $0 $0
Capital Markets Net interest income adjusted for impact of FTE (Non- GAAP) $4 $4 $4 $4 $5
Corporate Net interest income (GAAP) —$10 —$12 —$11 —$10 —$10
Corporate FTE adjustment $0 $0 $0 $0 $0
Corporate Net interest income adjusted for impact of FTE (Non- GAAP) —$10 —$12 —$11 —$10 —$10
Core Businesses Net interest income (Non- GAAP)1 $140 $142 $141 $141 $149
Core Businesses FTE adjustment (Non- GAAP)1 $2 $2 $2 $2 $2
Core Businesses Net interest income adjusted for impact of FTE (Non- GAAP)1 $142 $144 $143 $143 $151
Non- Strategic Net interest income (GAAP) $17 $17 $19 $20 $21
Non-Strategic FTE adjustment $0 $0 $0 $0 $0
Non- Strategic Net interest income adjusted for impact of FTE (Non- GAAP) $17 $17 $19 $20 $21
Consolidated Net interest income (GAAP) $157 $159 $160 $161 $171
Consolidated FTE adjustment $2 $2 $2 $2 $2
Consolidated Net interest income adjusted for impact of FTE (Non- GAAP) $159 $161 $162 $163 $172
Regional Banking Pre- Tax Pre-Provision Net Revenue (PPNR) 2013 2012
Total Revenue (GAAP) $839 $859
Total Noninterest Expense (GAAP) $531 $570
Pre- Tax Pre- Provision Net Revenue (Non- GAAP) $308 $289
Regional Banking Revenue Per FTE ($ in 000s) 2013 2012
Total Revenue (GAAP) $839,043 $858,950
Average FTEs 2,442 2,519
Revenue Per FTE (Non- GAAP) $344 $341
Numbers may not add to total due to rounding.
1Core Businesses include the Regional Banking, Capital Markets, and Corporate segments.
27
Table of Contents
|
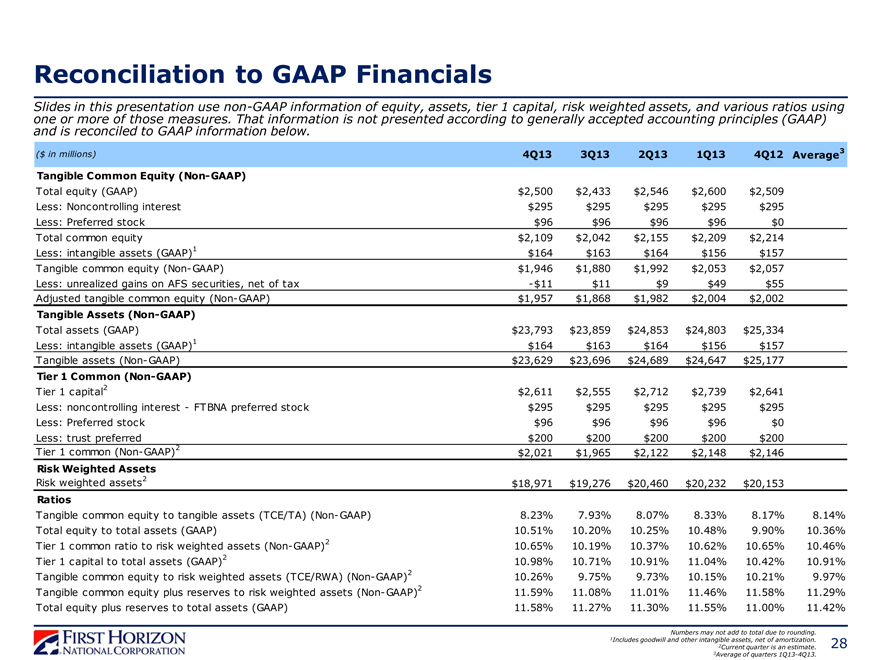
Reconciliation to GAAP Financials
Slides in this presentation use non-GAAP information of equity, assets, tier 1 capital, risk weighted assets, and various ratios using one or more of those measures. That information is not presented according to generally accepted accounting principles (GAAP) and is reconciled to GAAP information below.
($ in millions) 4Q13 3Q13 2Q13 1Q13 4Q12 Average3
Tangible Common Equity (Non- GAAP)
Total equity (GAAP) $2,500 $2,433 $2,546 $2,600 $2,509
Less: Noncontrolling interest $295 $295 $295 $295 $295
Less: Preferred stock $96 $96 $96 $96 $0
Total common equity $2,109 $2,042 $2,155 $2,209 $2,214
Less: intangible assets (GAAP)1 $164 $163 $164 $156 $157
Tangible common equity (Non- GAAP) $1,946 $1,880 $1,992 $2,053 $2,057
Less: unrealized gains on AFS securities, net of tax -$11 $11 $9 $49 $55
Adjusted tangible common equity (Non-GAAP) $1,957 $1,868 $1,982 $2,004 $2,002
Tangible Assets (Non-GAAP)
Total assets (GAAP) $23,793 $23,859 $24,853 $24,803 $25,334
Less: intangible assets (GAAP)1 $164 $163 $164 $156 $157
Tangible assets (Non- GAAP) $23,629 $23,696 $24,689 $24,647 $25,177
Tier 1 Common (Non-GAAP)
Tier 1 capital2 $2,611 $2,555 $2,712 $2,739 $2,641
Less: noncontrolling interest—FTBNA preferred stock $295 $295 $295 $295 $295
Less: Preferred stock $96 $96 $96 $96 $0
Less: trust preferred $200 $200 $200 $200 $200
Tier 1 common (Non-GAAP)2 $2,021 $1,965 $2,122 $2,148 $2,146
Risk Weighted Assets
Risk weighted assets2 $18,971 $19,276 $20,460 $20,232 $20,153
Ratios
Tangible common equity to tangible assets (TCE/TA) (Non- GAAP) 8.23% 7.93% 8.07% 8.33% 8.17% 8.14%
Total equity to total assets (GAAP) 10.51% 10.20% 10.25% 10.48% 9.90% 10.36%
Tier 1 common ratio to risk weighted assets (Non-GAAP)2 10.65% 10.19% 10.37% 10.62% 10.65% 10.46%
Tier 1 capital to total assets (GAAP)2 10.98% 10.71% 10.91% 11.04% 10.42% 10.91%
Tangible common equity to risk weighted assets (TCE/RWA) (Non-GAAP)2 10.26% 9.75% 9.73% 10.15% 10.21% 9.97%
Tangible common equity plus reserves to risk weighted assets (Non- GAAP)2 11.59% 11.08% 11.01% 11.46% 11.58% 11.29%
Total equity plus reserves to total assets (GAAP) 11.58% 11.27% 11.30% 11.55% 11.00% 11.42%
Numbers may not add to total due to rounding.
1Includes goodwill and other intangible assets, net of amortization.
2Current quarter is an estimate.
3Average of quarters 1Q13-4Q13.
28
Table of Contents
|
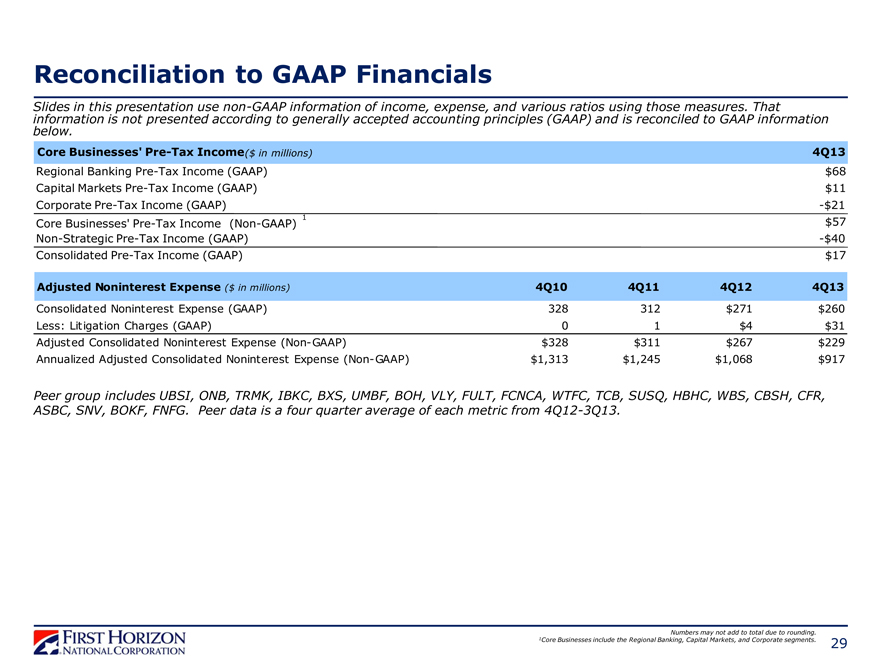
Reconciliation to GAAP Financials
Slides in this presentation use non-GAAP information of income, expense, and various ratios using those measures. That information is not presented according to generally accepted accounting principles (GAAP) and is reconciled to GAAP information below.
Core Businesses’ Pre-Tax Income($ in millions) 4Q13
Regional Banking Pre-Tax Income (GAAP) $68
Capital Markets Pre-Tax Income (GAAP) $11
Corporate Pre-Tax Income (GAAP) -$21
Core Businesses’ Pre-Tax Income (Non-GAAP) 1 $57
Non-Strategic Pre-Tax Income (GAAP) -$40
Consolidated Pre-Tax Income (GAAP) $17
Adjusted Noninterest Expense ($ in millions) 4Q10 4Q11 4Q12 4Q13
Consolidated Noninterest Expense (GAAP) 328 312 $271 $260
Less: Litigation Charges (GAAP) 0 1 $4 $31
Adjusted Consolidated Noninterest Expense (Non- GAAP) $328 $311 $267 $229
Annualized Adjusted Consolidated Noninterest Expense (Non- GAAP) $1,313 $1,245 $1,068 $917
Peer group includes UBSI, ONB, TRMK, IBKC, BXS, UMBF, BOH, VLY, FULT, FCNCA, WTFC, TCB, SUSQ, HBHC, WBS, CBSH, CFR, ASBC, SNV, BOKF, FNFG. Peer data is a four quarter average of each metric from 4Q12-3Q13.
Numbers may not add to total due to rounding.
1Core Businesses include the Regional Banking, Capital Markets, and Corporate segments.
29