Exhibit 99.1

SECOND QUARTER 2014
FINANCIAL SUPPLEMENT
If you need further information, please contact:
Aarti Bowman, Investor Relations
901-523-4017
aagoorha@firsthorizon.com
FHN TABLE OF CONTENTS
| | | | |
| | | Page | |
| |
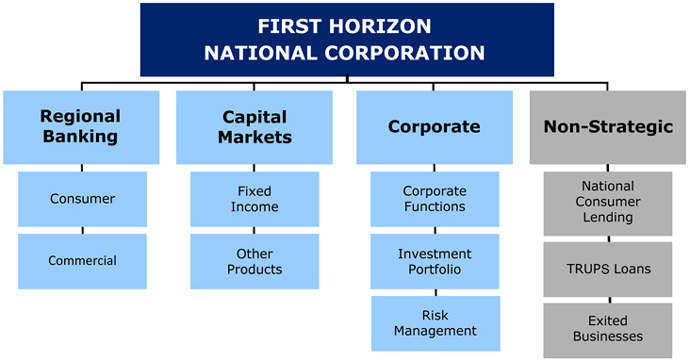
First Horizon National Corporation Segment Structure | | | 3 | |
| |
Performance Highlights | | | 4 | |
| |
Consolidated Results | | | | |
Income Statement | | | | |
Income Statement | | | 6 | |
Other Income and Other Expense | | | 7 | |
Balance Sheet | | | | |
Period End Balance Sheet | | | 8 | |
Average Balance Sheet | | | 9 | |
Net Interest Income | | | 10 | |
Average Balance Sheet: Yields and Rates | | | 11 | |
| |
Capital Highlights | | | 12 | |
| |
Business Segment Detail | | | | |
Segment Highlights | | | 13 | |
Regional Banking | | | 14 | |
Capital Markets and Corporate | | | 15 | |
Non-Strategic | | | 16 | |
| |
Asset Quality | | | | |
Asset Quality: Consolidated | | | 17 | |
Asset Quality: Regional Banking and Corporate | | | 19 | |
Asset Quality: Non-Strategic | | | 20 | |
Portfolio Metrics | | | 21 | |
| |
Non-GAAP to GAAP Reconciliation | | | 22 | |
| |
Glossary of Terms | | | 23 | |
Other Information
This financial supplement contains forward-looking statements involving significant risks and uncertainties. A number of important factors could cause actual results to differ materially from those in the forward-looking information. Those factors include general economic and financial market conditions, including expectations of and actual timing and amount of interest rate movements including the slope of the yield curve, competition, customer and investor responses to these conditions, ability to execute business plans, geopolitical developments, recent and future legislative and regulatory developments, natural disasters, and items mentioned in this financial supplement and in First Horizon National Corporation’s (“FHN”) most recent press release, as well as critical accounting estimates and other factors described in FHN’s recent filings with the SEC. FHN disclaims any obligation to update any such factors or to publicly announce the result of any revisions to any of the forward-looking statements included herein or therein to reflect future events or developments.
Use of Non-GAAP Measures
Certain ratios are included in this financial supplement that are non-GAAP, meaning they are not presented in accordance with generally accepted accounting principles (“GAAP”) in the U.S. FHN’s management believes such ratios are relevant to understanding the capital position and results of the Company. The non-GAAP ratios presented in this financial supplement are tangible common equity (“TCE”) to tangible assets (“TA”), tangible book value per common share, tier 1 common to risk weighted assets (“RWA”), adjusted tangible common equity to risk weighted assets and pre-tax pre-provision net revenue (“PPNR”). These ratios are reported to FHN’s management and Board of Directors through various internal reports. Additionally, disclosure of non-GAAP capital ratios provides a meaningful base for comparability to other financial institutions as demonstrated by their use by the various banking regulators in reviewing the capital adequacy of financial institutions. Non-GAAP measures are not formally defined by GAAP or codified in currently effective federal banking regulations, and other entities may use calculation methods that differ from those used by FHN. Tier 1 capital is a regulatory term and is generally defined as the sum of core capital (including common equity and instruments that can not be redeemed at the option of the holder) adjusted for certain items under risk based capital regulations. Also a regulatory term, risk weighted assets includes total assets adjusted for credit risk and is used to determine regulatory capital ratios. Refer to the tabular reconciliation of non-GAAP to GAAP measures and presentation of the most comparable GAAP items on page 22 of this financial supplement.
| | |
| FIRST HORIZON NATIONAL CORPORATION SEGMENT STRUCTURE | |  |
3
FHN PERFORMANCE HIGHLIGHTS
Summary of Second Quarter 2014 Significant Items
| | | | | | | | |
| Segment | | Item | | Income Statement | | Amount | | Comments |
| | | | | |
| Capital Markets | | Litigation Expense Recoveries | | Litigation and regulatory matters | | $38.6 million | | Pre-tax recoveries related to agreements reached with insurance companies for litigation losses FHN incurred in 2011 associated with the Sentinel lawsuit settlement |
| | | | | |
| | | | | Legal and professional fees | | $8.5 million | | Pre-tax recoveries related to the reimbursement of legal fees incurred associated with the Sentinel lawsuit |
| | | | | |
| | | | | | | $47.1 million | | Total recoveries related to the Sentinel lawsuit |
| | | | | |
| Non-Strategic | | Held-for-Sale portfolio valuation | | Mortgage banking | | $8.2 million | | Positive fair value adjustment primarily related to the non-performing portion of the held-for-sale portfolio which reflects new information on market pricing for similar assets |
Second Quarter 2014 vs. First Quarter 2014
Consolidated
| • | | Net income available to common shareholders was $76.8 million, or $.32 per diluted share in second quarter, compared to $44.9 million, or $.19 per diluted share in prior quarter |
| • | | In second quarter FHN reached agreements with insurance companies for the settlement of ongoing litigation regarding coverage of expenses FHN incurred in connection with the Sentinel litigation matter which was settled in 2011 |
| • | | Net interest income (“NII”) increased to $156.8 million in second quarter from $152.4 million in first quarter; Net interest margin (“NIM”) increased to 2.97 percent from 2.88 percent in the prior quarter |
| | • | | The increase in NII was affected by a number of factors including higher loan balances and more days in second quarter compared to first quarter |
| | • | | A decline in excess cash held at the Fed during the quarter was a significant driver of the second quarter increase in NIM |
| • | | Noninterest income (including securities gains) was $126.9 million in second quarter compared to $145.7 million in first quarter |
| | • | | The decrease in noninterest income was largely driven by additional servicing fees received in conjunction with the servicing sale and securities gains in first quarter, coupled with a decline in capital markets fixed income sales revenue in second quarter |
| | • | | These decreases were partially offset by a larger positive held-for-sale portfolio valuation adjustment in second quarter |
| • | | Noninterest expense decreased $54.9 million to $165.3 million in second quarter |
| | • | | The decline in expense is primarily due to agreements with insurance companies for the recovery of Sentinel litigation losses and related legal expenses |
| • | | Average loans grew to $15.4 billion in second quarter from $15.1 billion in first quarter; period-end loans increased 4 percent to $15.8 billion |
Regional Banking
| • | | Pre-tax income increased to $72.9 million in second quarter from $56.0 million in first quarter; PPNR was $81.3 million and $69.0 million in second and first quarters, respectively |
| • | | Period-end loans increased 7 percent, or $810.8 million to $12.9 billion in second quarter primarily driven by higher balances of loans to mortgage companies and other commercial loans |
| • | | Average core deposits were $14.8 billion in second quarter, down slightly from $14.9 billion in first quarter; period-end core deposits decreased 2 percent to $14.9 billion |
| • | | NII improved to $148.7 million in second quarter from $142.0 million in first quarter |
| | • | | The increase in NII is primarily attributable to higher balances of loans to mortgage companies and other commercial loan balances, declining rates on deposits, and the impact of day variance relative to first quarter, somewhat offset by a decrease in cash basis interest income |
| • | | Provision for loan losses dropped to $8.4 million in second quarter from $13.0 million in first quarter |
| | • | | Overall provision levels reflect continued favorable trends in the commercial portfolio including favorable grade migration, improved delinquencies, and historically low net charge-off levels; consumer asset quality trends remain relatively stable with a slight increase in delinquencies within the consumer real estate and credit card and other portfolios |
| • | | Noninterest income increased to $66.2 million in second quarter from $60.0 million in first quarter |
| | • | | Driven by increases in Bankcard, NSF, Brokerage, management fees and commissions and Trust Services and investment management fee income |
| | • | | Second quarter includes $2.8 million of Visa volume incentives |
| • | | Noninterest expense remained relatively flat at $133.6 million |
Capital Markets
| • | | Fixed income revenue was $40.5 million in second quarter compared to $49.6 million in first quarter |
| | • | | Fixed income average daily revenue (“ADR”) was $642 thousand and $813 thousand in second and first quarters, respectively |
| • | | Noninterest expense decreased to $.1 million in second quarter from $52.6 million in the prior quarter |
| | • | | Second quarter decrease primarily driven by a $47.1 million expense reversal made as a result of agreements with insurance companies for the recovery of expenses incurred in the Sentinel litigation matter which was settled in 2011 |
| | • | | Additionally, a decline in variable compensation costs and a decrease in FICA also contributed to the reduction in noninterest expense in second quarter |
Corporate
| • | | NII was negative $10.5 million in second quarter compared to negative $9.1 million in the prior quarter |
| | • | | Estimated effective duration of the securities portfolio was 3.3 years in second quarter compared to 3.7 years in first quarter |
| | • | | Estimated modified duration of the securities portfolio was 3.9 years in second quarter compared to 4.0 years in first quarter |
| • | | Noninterest income was $5.2 million in second quarter compared to $13.2 million in first quarter |
| | • | | First quarter includes a gain of $5.6 million on the sale of a cost method investment and $2.8 million of BOLI policy benefits received |
| • | | Noninterest expense decreased to $15.8 million in second quarter from $19.6 million in the prior quarter |
| | • | | Decrease primarily driven by lease abandonment expense in first quarter |
4
FHN PERFORMANCE HIGHLIGHTS (continued)
Second Quarter 2014 vs. First Quarter 2014
Non-Strategic
| • | | Pre-tax income was $11.5 million in second quarter compared to $19.7 million in first quarter |
| • | | The provision credit increased slightly to $3.4 million in second quarter from $3.0 million in first quarter |
| | • | | The second quarter provision credit was largely attributable to improvement and run-off within the consumer real estate portfolio while prior quarter’s provision credit was primarily because of a net reserve release related to sales of non-performing trust preferred loans |
| • | | Noninterest income was $7.9 million in second quarter compared to $15.8 million in the prior quarter |
| | • | | First quarter included higher servicing income resulting from the receipt of previously unrecognized servicing fees in conjunction with the servicing sale; second quarter included a larger positive mortgage warehouse valuation adjustment |
| | • | | Second quarter includes a $2.0 million fair value reduction on an investment; First quarter includes a $4.4 million loss on extinguishment of debt associated with the collapse of 2 HELOC trusts and a $2.0 million loss associated with the deconsolidation of a securitization trust |
| • | | Noninterest expense was $15.9 million in second quarter compared to $15.0 million in first quarter |
Asset Quality
| • | | The provision for loan losses declined to $5.0 million in second quarter from $10.0 million in first quarter |
| • | | Allowance for loan losses declined to $243.6 million from $247.2 million in first quarter; the allowance to loans ratio was 154 basis points in second quarter compared to 164 basis points in first quarter |
| | • | | The decline in the level of the allowance was primarily driven by improvement in the C&I portfolio and the non-strategic component of consumer real estate |
| | • | | The change in the allowance to loans ratio from first quarter was largely driven by the quarter-over-quarter increase in loan balances |
| • | | Net charge-offs (“NCOs”) were $8.6 million in second quarter compared to $16.6 million in prior quarter; annualized net charge-offs decreased to 22 basis points of average loans in second quarter from 45 basis points in prior quarter |
| | • | | The decline is mostly related to the consumer portfolio within non-strategic as gross charge-offs declined and recoveries increased from first quarter |
| | • | | Commercial net charge-offs include $2.6 million of charge-offs related to the second quarter sale of a TRUPS loan |
| • | | Nonperforming loans (“NPLs”) in the portfolio declined to $231.6 million from $240.9 million in first quarter |
| | • | | Both commercial and consumer NPLs declined from last quarter with C&I NPLs being favorably affected by the second quarter sale of a TRUPS loan that was on interest deferral |
| • | | Nonperforming assets (“NPAs”), including loans held-for-sale, decreased to $339.6 million in second quarter from $345.5 million in prior quarter |
| • | | Total 30+ delinquencies were $92.8 million in second quarter compared to $106.0 million in prior quarter |
| | • | | Commercial delinquencies declined by $10.4 million as a result of payoffs, cures and the movement of a credit to nonaccrual in second quarter |
| | • | | Overall, consumer delinquencies also improved as lower delinquencies within the non-strategic portfolio more than offset a slight increase within the regional bank |
| • | | Troubled debt restructurings (“TDRs”) were relatively, flat at $490.4 million |
Taxes
| • | | The effective tax rate for second quarter is 28.37 percent which reflects forecasted taxable income for the year and the favorable effect on the tax rate from permanent benefits |
| | • | | Permanent differences primarily consist of: tax credit investments, life insurance, tax-exempt interest, and a decrease in the capital loss deferred tax valuation allowance |
Capital and Liquidity
| • | | Paid $0.05 per common share dividend on July 1, 2014 |
| • | | Paid preferred quarterly dividend of $1.6 million on July 10, 2014 |
| • | | Capital ratios (regulatory capital ratios estimated based on period-end balances) |
| | • | | 8.62 percent for tangible common equity to tangible assets |
| | • | | 14.20 percent for Tier 1 |
| | • | | 15.95 percent for Total Capital |
| | • | | 11.15 percent for Tier 1 Common |
| | • | | 11.67 percent for Leverage |
5
FHN CONSOLIDATED INCOME STATEMENT
Quarterly, Unaudited
| | | | | | | | | | | | | | | | | | | | | | | | | | | | |
| | | | | | | | | | | | | | | | | | 2Q14 Changes vs. | |
(Dollars in thousands, except per share data) | | 2Q14 | | | 1Q14 | | | 4Q13 | | | 3Q13 | | | 2Q13 | | | 1Q14 | | | 2Q13 | |
Interest income | | $ | 177,359 | | | $ | 173,584 | | | $ | 179,053 | | | $ | 182,610 | | | $ | 183,991 | | | | 2 | % | | | (4 | )% |
Less: interest expense | | | 20,591 | | | | 21,225 | | | | 21,918 | | | | 23,772 | | | | 23,972 | | | | (3 | )% | | | (14 | )% |
| | | | | | | | | | | | | | | | | | | | | | | | | | | | |
Net interest income | | | 156,768 | | | | 152,359 | | | | 157,135 | | | | 158,838 | | | | 160,019 | | | | 3 | % | | | (2 | )% |
Provision for loan losses | | | 5,000 | | | | 10,000 | | | | 15,000 | | | | 10,000 | | | | 15,000 | | | | (50 | )% | | | (67 | )% |
| | | | | | | | | | | | | | | | | | | | | | | | | | | | |
Net interest income after provision for loan losses | | | 151,768 | | | | 142,359 | | | | 142,135 | | | | 148,838 | | | | 145,019 | | | | 7 | % | | | 5 | % |
| | | | | | | | | | | | | | | | | | | | | | | | | | | | |
Noninterest income: | | | | | | | | | | | | | | | | | | | | | | | | | | | | |
Capital markets | | | 47,680 | | | | 56,840 | | | | 59,653 | | | | 64,283 | | | | 69,265 | | | | (16 | )% | | | (31 | )% |
Deposit transactions and cash management | | | 27,911 | | | | 26,456 | | | | 29,194 | | | | 29,279 | | | | 28,254 | | | | 5 | % | | | (1 | )% |
Brokerage, management fees and commissions | | | 12,843 | | | | 12,276 | | | | 11,505 | | | | 10,868 | | | | 10,540 | | | | 5 | % | | | 22 | % |
Mortgage banking (a) | | | 8,861 | | | | 19,029 | | | | 3,853 | | | | 14,460 | | | | 5,589 | | | | (53 | )% | | | 59 | % |
Trust services and investment management | | | 7,309 | | | | 6,744 | | | | 6,596 | | | | 6,649 | | | | 6,950 | | | | 8 | % | | | 5 | % |
Bankcard income (b) | | | 7,919 | | | | 4,520 | | | | 4,998 | | | | 5,303 | | | | 5,299 | | | | 75 | % | | | 49 | % |
Bank-owned life insurance (c) | | | 3,312 | | | | 6,032 | | | | 3,636 | | | | 3,560 | | | | 3,946 | | | | (45 | )% | | | (16 | )% |
Other service charges | | | 3,143 | | | | 2,845 | | | | 3,144 | | | | 3,707 | | | | 3,503 | | | | 10 | % | | | (10 | )% |
Insurance commissions | | | 611 | | | | 437 | | | | 960 | | | | 733 | | | | 730 | | | | 40 | % | | | (16 | )% |
Securities gains/(losses), net (d) | | | (1,923 | ) | | | 5,657 | | | | 2,183 | | | | (96 | ) | | | (351 | ) | | | NM | | | | NM | |
Gain/(loss) on divestitures | | | — | | | | — | | | | (4 | ) | | | 115 | | | | — | | | | NM | | | | NM | |
Other (e) | | | 9,235 | | | | 4,894 | | | | 9,325 | | | | 11,614 | | | | 8,907 | | | | 89 | % | | | 4 | % |
| | | | | | | | | | | | | | | | | | | | | | | | | | | | |
Total noninterest income | | | 126,901 | | | | 145,730 | | | | 135,043 | | | | 150,475 | | | | 142,632 | | | | (13 | )% | | | (11 | )% |
| | | | | | | | | | | | | | | | | | | | | | | | | | | | |
Adjusted gross income after provision for loan losses | | | 278,669 | | | | 288,089 | | | | 277,178 | | | | 299,313 | | | | 287,651 | | | | (3 | )% | | | (3 | )% |
| | | | | | | | | | | | | | | | | | | | | | | | | | | | |
Noninterest expense: | | | | | | | | | | | | | | | | | | | | | | | | | | | | |
Employee compensation, incentives, and benefits | | | 119,659 | | | | 119,229 | | | | 127,144 | | | | 132,213 | | | | 130,500 | | | | | * | | | (8 | )% |
Repurchase and foreclosure provision | | | — | | | | — | | | | (30,000 | ) | | | 200,000 | | | | — | | | | NM | | | | NM | |
Legal and professional fees (f) | | | 6,151 | | | | 15,039 | | | | 15,419 | | | | 12,704 | | | | 14,065 | | | | (59 | )% | | | (56 | )% |
Occupancy (g) | | | 11,944 | | | | 17,592 | | | | 12,811 | | | | 13,147 | | | | 11,785 | | | | (32 | )% | | | 1 | % |
Computer software | | | 11,087 | | | | 10,656 | | | | 10,197 | | | | 10,446 | | | | 9,608 | | | | 4 | % | | | 15 | % |
Contract employment and outsourcing (h) | | | 5,318 | | | | 4,325 | | | | 9,059 | | | | 9,241 | | | | 8,581 | | | | 23 | % | | | (38 | )% |
Operations services | | | 8,804 | | | | 8,982 | | | | 9,104 | | | | 9,199 | | | | 8,842 | | | | (2 | )% | | | | * |
Equipment rentals, depreciation, and maintenance | | | 7,442 | | | | 7,849 | | | | 8,431 | | | | 7,890 | | | | 7,597 | | | | (5 | )% | | | (2 | )% |
FDIC premium expense (i) | | | 1,136 | | | | 3,991 | | | | 4,477 | | | | 4,631 | | | | 5,037 | | | | (72 | )% | | | (77 | )% |
Advertising and public relations | | | 4,312 | | | | 5,908 | | | | 4,685 | | | | 5,486 | | | | 4,121 | | | | (27 | )% | | | 5 | % |
Communications and courier | | | 3,948 | | | | 4,224 | | | | 4,473 | | | | 4,517 | | | | 4,531 | | | | (7 | )% | | | (13 | )% |
Foreclosed real estate | | | 439 | | | | 784 | | | | 1,050 | | | | 523 | | | | 1,287 | | | | (44 | )% | | | (66 | )% |
Amortization of intangible assets | | | 981 | | | | 982 | | | | 1,128 | | | | 928 | | | | 928 | | | | | * | | | 6 | % |
Other (e) | | | (15,889 | ) | | | 20,653 | | | | 79,119 | | | | 22,631 | | | | 20,526 | | | | NM | | | | NM | |
| | | | | | | | | | | | | | | | | | | | | | | | | | | | |
Total noninterest expense | | | 165,332 | | | | 220,214 | | | | 257,097 | | | | 433,556 | | | | 227,408 | | | | (25 | )% | | | (27 | )% |
| | | | | | | | | | | | | | | | | | | | | | | | | | | | |
Income/(loss) before income taxes | | | 113,337 | | | | 67,875 | | | | 20,081 | | | | (134,243 | ) | | | 60,243 | | | | 67 | % | | | 88 | % |
Provision/(benefit) for income taxes | | | 32,157 | | | | 18,645 | | | | (33,813 | ) | | | (31,094 | ) | | | 15,008 | | | | 72 | % | | | NM | |
| | | | | | | | | | | | | | | | | | | | | | | | | | | | |
Income/(loss) from continuing operations | | | 81,180 | | | | 49,230 | | | | 53,894 | | | | (103,149 | ) | | | 45,235 | | | | 65 | % | | | 79 | % |
Income/(loss) from discontinued operations, net of tax | | | — | | | | — | | | | (6 | ) | | | 123 | | | | 1 | | | | NM | | | | NM | |
| | | | | | | | | | | | | | | | | | | | | | | | | | | | |
Net income/(loss) | | | 81,180 | | | | 49,230 | | | | 53,888 | | | | (103,026 | ) | | | 45,236 | | | | 65 | % | | | 79 | % |
Net income attributable to noncontrolling interest | | | 2,859 | | | | 2,813 | | | | 2,934 | | | | 2,875 | | | | 2,843 | | | | 2 | % | | | 1 | % |
| | | | | | | | | | | | | | | | | | | | | | | | | | | | |
Net income/(loss) attributable to controlling interest | | | 78,321 | | | | 46,417 | | | | 50,954 | | | | (105,901 | ) | | | 42,393 | | | | 69 | % | | | 85 | % |
Preferred stock dividends | | | 1,550 | | | | 1,550 | | | | 1,550 | | | | 1,550 | | | | 1,550 | | | | | * | | | | * |
| | | | | | | | | | | | | | | | | | | | | | | | | | | | |
Net income/(loss) available to common shareholders | | $ | 76,771 | | | $ | 44,867 | | | $ | 49,404 | | | $ | (107,451 | ) | | $ | 40,843 | | | | 71 | % | | | 88 | % |
| | | | | | | | | | | | | | | | | | | | | | | | | | | | |
Common Stock Data | | | | | | | | | | | | | | | | | | | | | | | | | | | | |
Diluted EPS from continuing operations | | $ | 0.32 | | | $ | 0.19 | | | $ | 0.21 | | | $ | (0.45 | ) | | $ | 0.17 | | | | 68 | % | | | 88 | % |
Diluted EPS | | $ | 0.32 | | | $ | 0.19 | | | $ | 0.21 | | | $ | (0.45 | ) | | $ | 0.17 | | | | 68 | % | | | 88 | % |
Diluted shares (thousands) | | | 237,250 | | | | 237,401 | | | | 236,753 | | | | 236,895 | | | | 240,891 | | | | | * | | | (2 | )% |
| | | | | | | | | | | | | | | | | | | | | | | | | | | | |
Key Ratios & Other | | | | | | | | | | | | | | | | | | | | | | | | | | | | |
Return on average assets (annualized) (j) | | | 1.38 | % | | | 0.83 | % | | | 0.90 | % | | | (1.69 | )% | | | 0.74 | % | | | | | | | | |
Return on average common equity (annualized) (j) | | | 14.14 | % | | | 8.48 | % | | | 9.42 | % | | | (20.39 | )% | | | 7.46 | % | | | | | | | | |
Fee income to total revenue (j) | | | 45.11 | % | | | 47.90 | % | | | 45.81 | % | | | 48.66 | % | | | 47.19 | % | | | | | | | | |
Efficiency ratio (j) | | | 57.89 | % | | | 75.30 | % | | | 88.66 | % | | | NM | | | | 75.05 | % | | | | | | | | |
Full time equivalent employees | | | 4,216 | | | | 4,251 | | | | 4,309 | | | | 4,338 | | | | 4,296 | | | | | | | | | |
| | | | | | | | | | | | | | | | | | | | | | | | | | | | |
NM - Not meaningful
| * | Amount is less than one percent. |
| (a) | 2Q14 includes an $8.2 million positive fair value adjustment to the held-for-sale portfolio; 1Q14 increase reflects the receipt of previously unrecognized servicing fees in conjunction with transfers of servicing in 1Q14; 4Q13 decline due to transfers of servicing; 3Q13 increase in servicing reflects the terms of the agreement to sell servicing. |
| (b) | 2Q14 includes $2.8 million of Visa volume incentives. |
| (c) | 1Q14 increase driven by $2.8 million of policy benefits received. |
| (d) | 2Q14 includes a $2.0 million fair value reduction of an investment; 1Q14 and 4Q13 include gains of $5.6 million and $3.3 million, respectively, on the sale of cost method investments; 4Q13 also includes a $1.1 million other-than-temporary impairment of an investment. |
| (e) | Refer to the Other Income and Other Expense table on page 7 for additional information. |
| (f) | 2Q14 decrease driven by an $8.5 million expense reversal related to agreements with insurance companies for the recovery of Sentinel legal expenses. |
| (g) | 1Q14 includes $4.6 million of lease abandonment expense. |
| (h) | 1Q14 decline due to lower subservicing costs associated with the sales of servicing. |
| (i) | 2Q14 includes the effect of $3.3 million of FDIC premium refunds. |
| (j) | See Glossary of Terms for definitions of Key Ratios. |
6
FHN OTHER INCOME AND OTHER EXPENSE
Quarterly, Unaudited
| | | | | | | | | | | | | | | | | | | | | | | | | | | | |
| | | | | | | | | | | | | | | | | | 2Q14 Changes vs. | |
(Thousands) | | 2Q14 | | | 1Q14 | | | 4Q13 | | | 3Q13 | | | 2Q13 | | | 1Q14 | | | 2Q13 | |
Other Income | | | | | | | | | | | | | | | | | | | | | | | | | | | | |
ATM and interchange fees | | $ | 2,746 | | | $ | 2,497 | | | $ | 2,721 | | | $ | 2,680 | | | $ | 2,627 | | | | 10 | % | | | 5 | % |
Electronic banking fees | | | 1,535 | | | | 1,534 | | | | 1,535 | | | | 1,607 | | | | 1,585 | | | | | * | | | (3 | )% |
Letter of credit fees | | | 1,173 | | | | 1,663 | | | | 1,215 | | | | 1,171 | | | | 1,196 | | | | (29 | )% | | | (2 | )% |
Deferred compensation (a) | | | 1,184 | | | | 657 | | | | 1,210 | | | | 2,160 | | | | (278 | ) | | | 80 | % | | | NM | |
Gain /(loss) on extinguishment of debt (b) | | | — | | | | (4,350 | ) | | | — | | | | — | | | | — | | | | NM | | | | NM | |
Other | | | 2,597 | | | | 2,893 | | | | 2,644 | | | | 3,996 | | | | 3,777 | | | | (10 | )% | | | (31 | )% |
| | | | | | | | | | | | | | | | | | | | | | | | | | | | |
Total | | $ | 9,235 | | | $ | 4,894 | | | $ | 9,325 | | | $ | 11,614 | | | $ | 8,907 | | | | 89 | % | | | 4 | % |
| | | | | | | | | | | | | | | | | | | | | | | | | | | | |
| | | | | | | |
Other Expense | | | | | | | | | | | | | | | | | | | | | | | | | | | | |
Litigation and regulatory matters (c) | | $ | (38,200 | ) | | $ | 90 | | | $ | 57,355 | | | $ | 229 | | | $ | 900 | | | | NM | | | | NM | |
Other insurance and taxes | | | 3,209 | | | | 3,060 | | | | 3,261 | | | | 3,215 | | | | 3,076 | | | | 5 | % | | | 4 | % |
Tax credit investments | | | 3,032 | | | | 2,495 | | | | 3,063 | | | | 3,079 | | | | 2,989 | | | | 22 | % | | | 1 | % |
Travel and entertainment | | | 2,645 | | | | 1,824 | | | | 2,339 | | | | 2,400 | | | | 2,372 | | | | 45 | % | | | 12 | % |
Employee training and dues | | | 1,200 | | | | 866 | | | | 1,327 | | | | 1,244 | | | | 1,229 | | | | 39 | % | | | (2 | )% |
Customer relations | | | 1,680 | | | | 1,243 | | | | 1,179 | | | | 1,204 | | | | 1,255 | | | | 35 | % | | | 34 | % |
Miscellaneous loan costs | | | 839 | | | | 714 | | | | 701 | | | | 1,349 | | | | 1,163 | | | | 18 | % | | | (28 | )% |
Supplies | | | 804 | | | | 1,116 | | | | 1,090 | | | | 950 | | | | 705 | | | | (28 | )% | | | 14 | % |
Other (d) | | | 8,902 | | | | 9,245 | | | | 8,804 | | | | 8,961 | | | | 6,837 | | | | (4 | )% | | | 30 | % |
| | | | | | | | | | | | | | | | | | | | | | | | | | | | |
Total | | $ | (15,889 | ) | | $ | 20,653 | | | $ | 79,119 | | | $ | 22,631 | | | $ | 20,526 | | | | NM | | | | NM | |
| | | | | | | | | | | | | | | | | | | | | | | | | | | | |
NM - Not meaningful
| * | Amount is less than one percent. |
| (a) | Amounts driven by market conditions and are mirrored by changes in deferred compensation expense which is included in employee compensation expense. |
| (b) | 1Q14 loss associated with the collapse of 2 HELOC trusts. |
| (c) | 2Q14 includes a $38.6 million expense reversal related to agreements with insurance companies for the recovery of expenses FHN incurred in connection with the Sentinel litigation matter which was settled in 2011; 4Q13 includes $57.0 million of net loss accruals related to legal matters. |
| (d) | 1Q14 includes a $2.3 million negative valuation adjustment associated with the derivatives related to prior sales of Visa Class B shares. |
7
FHN CONSOLIDATED PERIOD-END BALANCE SHEET
Quarterly, Unaudited
| | | | | | | | | | | | | | | | | | | | | | | | | | | | |
| | | | | | | | | | | | | | | | | | 2Q14 Changes vs. | |
(Thousands) | | 2Q14 | | | 1Q14 | | | 4Q13 | | | 3Q13 | | | 2Q13 | | | 1Q14 | | | 2Q13 | |
| | | | | | | |
Assets: | | | | | | | | | | | | | | | | | | | | | | | | | | | | |
Investment securities | | $ | 3,580,821 | | | $ | 3,575,453 | | | $ | 3,398,457 | | | $ | 3,186,943 | | | $ | 3,228,379 | | | | | * | | | 11 | % |
Loans held-for-sale | | | 358,945 | | | | 361,359 | | | | 370,152 | | | | 371,640 | | | | 385,105 | | | | (1 | )% | | | (7 | )% |
Loans, net of unearned income (Restricted - $.1 billion) (a) | | | 15,795,709 | | | | 15,119,461 | | | | 15,389,074 | | | | 15,408,556 | | | | 16,197,952 | | | | 4 | % | | | (2 | )% |
Federal funds sold | | | 51,537 | | | | 16,555 | | | | 66,079 | | | | 52,830 | | | | 52,169 | | | | NM | | | | (1 | )% |
Securities purchased under agreements to resell | | | 624,477 | | | | 605,276 | | | | 412,614 | | | | 576,355 | | | | 602,126 | | | | 3 | % | | | 4 | % |
Interest-bearing cash (b) | | | 255,920 | | | | 685,540 | | | | 730,297 | | | | 184,179 | | | | 344,150 | | | | (63 | )% | | | (26 | )% |
Trading securities | | | 1,150,280 | | | | 1,194,749 | | | | 801,718 | | | | 1,343,134 | | | | 1,267,348 | | | | (4 | )% | | | (9 | )% |
| | | | | | | | | | | | | | | | | | | | | | | | | | | | |
Total earning assets | | | 21,817,689 | | | | 21,558,393 | | | | 21,168,391 | | | | 21,123,637 | | | | 22,077,229 | | | | 1 | % | | | (1 | )% |
| | | | | | | | | | | | | | | | | | | | | | | | | | | | |
Cash and due from banks | | | 417,108 | | | | 450,270 | | | | 349,216 | | | | 395,631 | | | | 382,601 | | | | (7 | )% | | | 9 | % |
Capital markets receivables | | | 174,224 | | | | 51,082 | | | | 45,255 | | | | 83,154 | | | | 151,660 | | | | NM | | | | 15 | % |
Mortgage servicing rights, net (c) | | | 3,197 | | | | 4,687 | | | | 72,793 | | | | 116,686 | | | | 113,853 | | | | (32 | )% | | | (97 | )% |
Goodwill | | | 141,943 | | | | 141,943 | | | | 141,943 | | | | 140,479 | | | | 140,479 | | | | | * | | | 1 | % |
Other intangible assets, net | | | 20,025 | | | | 21,007 | | | | 21,988 | | | | 22,216 | | | | 23,144 | | | | (5 | )% | | | (13 | )% |
Premises and equipment, net | | | 300,533 | | | | 299,183 | | | | 305,244 | | | | 308,779 | | | | 314,764 | | | | | * | | | (5 | )% |
Real estate acquired by foreclosure (d) | | | 57,552 | | | | 66,035 | | | | 71,562 | | | | 71,626 | | | | 69,901 | | | | (13 | )% | | | (18 | )% |
Allowance for loan losses (Restricted - $.7 million) (a) | | | (243,628 | ) | | | (247,246 | ) | | | (253,809 | ) | | | (255,710 | ) | | | (261,934 | ) | | | (1 | )% | | | (7 | )% |
Derivative assets | | | 162,067 | | | | 166,465 | | | | 181,866 | | | | 215,116 | | | | 235,759 | | | | (3 | )% | | | (31 | )% |
Other assets (Restricted - $.4 million) (a) | | | 1,372,040 | | | | 1,430,170 | | | | 1,685,384 | | | | 1,637,139 | | | | 1,605,344 | | | | (4 | )% | | | (15 | )% |
| | | | | | | | | | | | | | | | | | | | | | | | | | | | |
Total assets (Restricted - $.1 billion) (a) | | $ | 24,222,750 | | | $ | 23,941,989 | | | $ | 23,789,833 | | | $ | 23,858,753 | | | $ | 24,852,800 | | | | 1 | % | | | (3 | )% |
| | | | | | | | | | | | | | | | | | | | | | | | | | | | |
Liabilities and Equity: | | | | | | | | | | | | | | | | | | | | | | | | | | | | |
Deposits: | | | | | | | | | | | | | | | | | | | | | | | | | | | | |
Savings | | $ | 6,317,197 | | | $ | 6,630,142 | | | $ | 6,732,326 | | | $ | 6,781,522 | | | $ | 6,928,447 | | | | (5 | )% | | | (9 | )% |
Other interest-bearing deposits | | | 4,014,071 | | | | 4,071,699 | | | | 3,859,079 | | | | 3,494,236 | | | | 3,825,235 | | | | (1 | )% | | | 5 | % |
Time deposits | | | 808,822 | | | | 898,223 | | | | 951,755 | | | | 997,726 | | | | 1,051,327 | | | | (10 | )% | | | (23 | )% |
| | | | | | | | | | | | | | | | | | | | | | | | | | | | |
Total interest-bearing core deposits | | | 11,140,090 | | | | 11,600,064 | | | | 11,543,160 | | | | 11,273,484 | | | | 11,805,009 | | | | (4 | )% | | | (6 | )% |
Noninterest-bearing deposits | | | 4,513,800 | | | | 4,534,245 | | | | 4,637,839 | | | | 4,434,746 | | | | 4,603,954 | | | | | * | | | (2 | )% |
| | | | | | | | | | | | | | | | | | | | | | | | | | | | |
Total core deposits (e) | | | 15,653,890 | | | | 16,134,309 | | | | 16,180,999 | | | | 15,708,230 | | | | 16,408,963 | | | | (3 | )% | | | (5 | )% |
| | | | | | | | | | | | | | | | | | | | | | | | | | | | |
Certificates of deposit $100,000 and more | | | 503,597 | | | | 538,434 | | | | 553,957 | | | | 575,679 | | | | 602,921 | | | | (6 | )% | | | (16 | )% |
| | | | | | | | | | | | | | | | | | | | | | | | | | | | |
Total deposits | | | 16,157,487 | | | | 16,672,743 | | | | 16,734,956 | | | | 16,283,909 | | | | 17,011,884 | | | | (3 | )% | | | (5 | )% |
| | | | | | | | | | | | | | | | | | | | | | | | | | | | |
Federal funds purchased | | | 947,946 | | | | 1,135,665 | | | | 1,042,633 | | | | 1,062,901 | | | | 1,142,749 | | | | (17 | )% | | | (17 | )% |
Securities sold under agreements to repurchase | | | 475,530 | | | | 411,795 | | | | 442,789 | | | | 427,232 | | | | 433,761 | | | | 15 | % | | | 10 | % |
Trading liabilities | | | 706,119 | | | | 667,257 | | | | 368,348 | | | | 585,969 | | | | 596,869 | | | | 6 | % | | | 18 | % |
Other short-term borrowings (f) | | | 1,073,250 | | | | 204,023 | | | | 181,146 | | | | 303,686 | | | | 446,909 | | | | NM | | | | NM | |
Term borrowings (Restricted - $.1 billion) (a) (g) | | | 1,501,209 | | | | 1,507,048 | | | | 1,739,859 | | | | 1,771,288 | | | | 1,800,255 | | | | | * | | | (17 | )% |
Capital markets payables | | | 95,299 | | | | 39,510 | | | | 21,173 | | | | 53,784 | | | | 90,231 | | | | NM | | | | 6 | % |
Derivative liabilities | | | 138,336 | | | | 137,863 | | | | 154,280 | | | | 165,918 | | | | 198,489 | | | | | * | | | (30 | )% |
Other liabilities | | | 501,423 | | | | 621,948 | | | | 603,898 | | | | 770,773 | | | | 585,245 | | | | (19 | )% | | | (14 | )% |
| | | | | | | | | | | | | | | | | | | | | | | | | | | | |
Total liabilities (Restricted - $.1 billion) (a) | | | 21,596,599 | | | | 21,397,852 | | | | 21,289,082 | | | | 21,425,460 | | | | 22,306,392 | | | | 1 | % | | | (3 | )% |
| | | | | | | | | | | | | | | | | | | | | | | | | | | | |
Equity: | | | | | | | | | | | | | | | | | | | | | | | | | | | | |
Common stock | | | 148,217 | | | | 147,866 | | | | 147,731 | | | | 147,705 | | | | 150,347 | | | | | * | | | (1 | )% |
Capital surplus | | | 1,416,012 | | | | 1,417,170 | | | | 1,416,767 | | | | 1,413,248 | | | | 1,416,563 | | | | | * | | | | * |
Undivided profits | | | 792,978 | | | | 728,165 | | | | 695,207 | | | | 657,676 | | | | 777,108 | | | | 9 | % | | | 2 | % |
Accumulated other comprehensive loss, net | | | (122,111 | ) | | | (140,119 | ) | | | (150,009 | ) | | | (176,391 | ) | | | (188,665 | ) | | | (13 | )% | | | (35 | )% |
Preferred stock | | | 95,624 | | | | 95,624 | | | | 95,624 | | | | 95,624 | | | | 95,624 | | | | | * | | | | * |
Noncontrolling interest (h) | | | 295,431 | | | | 295,431 | | | | 295,431 | | | | 295,431 | | | | 295,431 | | | | | * | | | | * |
| | | | | | | | | | | | | | | | | | | | | | | | | | | | |
Total equity | | | 2,626,151 | | | | 2,544,137 | | | | 2,500,751 | | | | 2,433,293 | | | | 2,546,408 | | | | 3 | % | | | 3 | % |
| | | | | | | | | | | | | | | | | | | | | | | | | | | | |
Total liabilities and equity ( Restricted - $.1 billion) (a) | | $ | 24,222,750 | | | $ | 23,941,989 | | | $ | 23,789,833 | | | $ | 23,858,753 | | | $ | 24,852,800 | | | | 1 | % | | | (3 | )% |
| | | | | | | | | | | | | | | | | | | | | | | | | | | | |
NM - Not meaningful
| * | Amount is less than one percent. |
| (a) | Restricted balances parenthetically presented are as of June 30, 2014. |
| (b) | Includes excess balances held at Fed. |
| (c) | Decreases in 2Q14, 1Q14 and 4Q13 reflect transfers associated with an agreement to sell mortgage servicing rights entered into in 3Q13. |
| (d) | 2Q14 includes $18.8 million of foreclosed assets related to government insured mortgages. |
| (e) | 2Q14 average core deposits were $15.6 billion. |
| (f) | 2Q14 includes increased FHLB borrowings as a result of loan growth and deposit fluctuations. |
| (g) | In 1Q14 FHN resolved the collateralized borrowings for three previously on-balance sheet consumer loan securitizations. |
| (h) | Consists of preferred stock of subsidiaries. |
8
FHN CONSOLIDATED AVERAGE BALANCE SHEET
Quarterly, Unaudited
| | | | | | | | | | | | | | | | | | | | | | | | | | | | |
| | | | | | | | | | | | | | | | | | 2Q14 Changes vs. | |
(Thousands) | | 2Q14 | | | 1Q14 | | | 4Q13 | | | 3Q13 | | | 2Q13 | | | 1Q14 | | | 2Q13 | |
| | | | | | | |
Assets: | | | | | | | | | | | | | | | | | | | | | | | | | | | | |
Earning assets: | | | | | | | | | | | | | | | | | | | | | | | | | | | | |
Loans, net of unearned income: | | | | | | | | | | | | | | | | | | | | | | | | | | | | |
Commercial, financial, and industrial (C&I) | | $ | 7,994,788 | | | $ | 7,639,584 | | | $ | 7,694,029 | | | $ | 7,888,297 | | | $ | 8,121,219 | | | | 5 | % | | | (2 | )% |
Commercial real estate | | | 1,203,631 | | | | 1,139,749 | | | | 1,164,748 | | | | 1,215,586 | | | | 1,134,268 | | | | 6 | % | | | 6 | % |
Consumer real estate | | | 5,230,107 | | | | 5,305,596 | | | | 5,400,751 | | | | 5,502,825 | | | | 5,561,689 | | | | (1 | )% | | | (6 | )% |
Permanent mortgage | | | 607,296 | | | | 637,642 | | | | 678,938 | | | | 721,554 | | | | 771,253 | | | | (5 | )% | | | (21 | )% |
Credit card and other | | | 345,748 | | | | 336,454 | | | | 334,887 | | | | 323,551 | | | | 304,561 | | | | 3 | % | | | 14 | % |
| | | | | | | | | | | | | | | | | | | | | | | | | | | | |
Total loans, net of unearned income (Restricted - $.1 billion) (a) (b) | | | 15,381,570 | | | | 15,059,025 | | | | 15,273,353 | | | | 15,651,813 | | | | 15,892,990 | | | | 2 | % | | | (3 | )% |
| | | | | | | | | | | | | | | | | | | | | | | | | | | | |
Loans held-for-sale | | | 355,822 | | | | 367,899 | | | | 368,373 | | | | 378,263 | | | | 389,273 | | | | (3 | )% | | | (9 | )% |
Investment securities: | | | | | | | | | | | | | | | | | | | | | | | | | | | | |
U.S. treasuries | | | 39,995 | | | | 41,828 | | | | 39,994 | | | | 41,303 | | | | 40,815 | | | | (4 | )% | | | (2 | )% |
U.S. government agencies | | | 3,330,598 | | | | 3,222,642 | | | | 2,959,355 | | | | 2,900,838 | | | | 2,924,012 | | | | 3 | % | | | 14 | % |
States and municipalities | | | 19,430 | | | | 19,425 | | | | 15,155 | | | | 15,246 | | | | 15,390 | | | | | * | | | 26 | % |
Other | | | 189,449 | | | | 211,891 | | | | 229,728 | | | | 224,213 | | | | 218,701 | | | | (11 | )% | | | (13 | )% |
| | | | | | | | | | | | | | | | | | | | | | | | | | | | |
Total investment securities | | | 3,579,472 | | | | 3,495,786 | | | | 3,244,232 | | | | 3,181,600 | | | | 3,198,918 | | | | 2 | % | | | 12 | % |
| | | | | | | | | | | | | | | | | | | | | | | | | | | | |
Capital markets securities inventory | | | 1,111,893 | | | | 1,101,798 | | | | 1,159,570 | | | | 1,156,262 | | | | 1,310,044 | | | | 1 | % | | | (15 | )% |
Mortgage banking trading securities | | | 6,532 | | | | 6,949 | | | | 12,712 | | | | 15,558 | | | | 16,398 | | | | (6 | )% | | | (60 | )% |
Other earning assets: | | | | | | | | | | | | | | | | | | | | | | | | | | | | |
Federal funds sold | | | 29,490 | | | | 21,615 | | | | 19,471 | | | | 28,498 | | | | 26,698 | | | | 36 | % | | | 10 | % |
Securities purchased under agreements to resell | | | 664,194 | | | | 622,466 | | | | 581,798 | | | | 593,978 | | | | 705,129 | | | | 7 | % | | | (6 | )% |
Interest-bearing cash (c) | | | 363,674 | | | | 972,537 | | | | 614,628 | | | | 537,631 | | | | 401,236 | | | | (63 | )% | | | (9 | )% |
| | | | | | | | | | | | | | | | | | | | | | | | | | | | |
Total other earning assets | | | 1,057,358 | | | | 1,616,618 | | | | 1,215,897 | | | | 1,160,107 | | | | 1,133,063 | | | | (35 | )% | | | (7 | )% |
| | | | | | | | | | | | | | | | | | | | | | | | | | | | |
Total earnings assets (Restricted - $.1 billion) (a) | | | 21,492,647 | | | | 21,648,075 | | | | 21,274,137 | | | | 21,543,603 | | | | 21,940,686 | | | | (1 | )% | | | (2 | )% |
| | | | | | | | | | | | | | | | | | | | | | | | | | | | |
Allowance for loan losses (Restricted - $1.3 million) (a) | | | (246,779 | ) | | | (249,733 | ) | | | (250,074 | ) | | | (256,789 | ) | | | (260,944 | ) | | | (1 | )% | | | (5 | )% |
Cash and due from banks (Restricted - $.4 million) (a) | | | 308,890 | | | | 336,543 | | | | 341,066 | | | | 351,972 | | | | 342,053 | | | | (8 | )% | | | (10 | )% |
Capital markets receivables | | | 46,864 | | | | 54,654 | | | | 45,179 | | | | 82,289 | | | | 97,851 | | | | (14 | )% | | | (52 | )% |
Premises and equipment, net | | | 299,899 | | | | 301,065 | | | | 307,285 | | | | 308,199 | | | | 302,263 | | | | | * | | | (1 | )% |
Derivative assets | | | 165,684 | | | | 181,586 | | | | 201,609 | | | | 209,878 | | | | 257,181 | | | | (9 | )% | | | (36 | )% |
Other assets (Restricted - $.6 million) (a) | | | 1,584,747 | | | | 1,643,879 | | | | 1,926,109 | | | | 1,942,481 | | | | 1,903,728 | | | | (4 | )% | | | (17 | )% |
| | | | | | | | | | | | | | | | | | | | | | | | | | | | |
Total assets (Restricted - $.1 billion) (a) | | $ | 23,651,952 | | | $ | 23,916,069 | | | $ | 23,845,311 | | | $ | 24,181,633 | | | $ | 24,582,818 | | | | (1 | )% | | | (4 | )% |
| | | | | | | | | | | | | | | | | | | | | | | | | | | | |
| | | | | | | |
Liabilities and equity: | | | | | | | | | | | | | | | | | | | | | | | | | | | | |
Interest-bearing liabilities: | | | | | | | | | | | | | | | | | | | | | | | | | | | | |
Interest-bearing deposits: | | | | | | | | | | | | | | | | | | | | | | | | | | | | |
Savings | | $ | 6,427,265 | | | $ | 6,683,749 | | | $ | 6,642,159 | | | $ | 6,957,875 | | | $ | 6,516,889 | | | | (4 | )% | | | (1 | )% |
Other interest-bearing deposits | | | 3,779,293 | | | | 3,830,839 | | | | 3,520,348 | | | | 3,494,211 | | | | 3,645,674 | | | | (1 | )% | | | 4 | % |
Time deposits | | | 859,551 | | | | 924,025 | | | | 977,107 | | | | 1,025,788 | | | | 998,762 | | | | (7 | )% | | | (14 | )% |
| | | | | | | | | | | | | | | | | | | | | | | | | | | | |
Total interest-bearing core deposits | | | 11,066,109 | | | | 11,438,613 | | | | 11,139,614 | | | | 11,477,874 | | | | 11,161,325 | | | | (3 | )% | | | (1 | )% |
Certificates of deposit $100,000 and more | | | 512,527 | | | | 545,845 | | | | 580,760 | | | | 594,536 | | | | 542,244 | | | | (6 | )% | | | (5 | )% |
Federal funds purchased | | | 1,080,347 | | | | 1,161,594 | | | | 1,236,763 | | | | 1,119,273 | | | | 1,224,070 | | | | (7 | )% | | | (12 | )% |
Securities sold under agreements to repurchase | | | 458,608 | | | | 454,937 | | | | 446,894 | | | | 452,940 | | | | 480,960 | | | | 1 | % | | | (5 | )% |
Capital markets trading liabilities | | | 671,930 | | | | 607,114 | | | | 567,531 | | | | 598,195 | | | | 718,309 | | | | 11 | % | | | (6 | )% |
Other short-term borrowings (d) | | | 540,389 | | | | 184,721 | | | | 219,593 | | | | 243,195 | | | | 525,493 | | | | NM | | | | 3 | % |
Term borrowings (Restricted - $.1 billion) (a) (e) | | | 1,505,860 | | | | 1,702,107 | | | | 1,764,476 | | | | 1,792,250 | | | | 2,007,372 | | | | (12 | )% | | | (25 | )% |
| | | | | | | | | | | | | | | | | | | | | | | | | | | | |
Total interest-bearing liabilities | | | 15,835,770 | | | | 16,094,931 | | | | 15,955,631 | | | | 16,278,263 | | | | 16,659,773 | | | | (2 | )% | | | (5 | )% |
| | | | | | | | | | | | | | | | | | | | | | | | | | | | |
Noninterest-bearing deposits | | | 4,547,838 | | | | 4,536,080 | | | | 4,559,023 | | | | 4,542,127 | | | | 4,493,440 | | | | * | | | | 1 | % |
Capital markets payables | | | 34,293 | | | | 33,144 | | | | 32,896 | | | | 57,275 | | | | 58,435 | | | | 3 | % | | | (41 | )% |
Derivative liabilities | | | 138,282 | | | | 152,596 | | | | 159,575 | | | | 161,611 | | | | 184,192 | | | | (9 | )% | | | (25 | )% |
Other liabilities | | | 526,581 | | | | 563,045 | | | | 666,312 | | | | 660,458 | | | | 598,854 | | | | (6 | )% | | | (12 | )% |
| | | | | | | | | | | | | | | | | | | | | | | | | | | | |
Total liabilities (Restricted - $.1 billion) (a) | | | 21,082,764 | | | | 21,379,796 | | | | 21,373,437 | | | | 21,699,734 | | | | 21,994,694 | | | | (1 | )% | | | (4 | )% |
| | | | | | | | | | | | | | | | | | | | | | | | | | | | |
Equity: | | | | | | | | | | | | | | | | | | | | | | | | | | | | |
Common stock | | | 148,085 | | | | 147,751 | | | | 147,724 | | | | 149,000 | | | | 150,468 | | | | | * | | | (2 | )% |
Capital surplus | | | 1,416,811 | | | | 1,417,642 | | | | 1,414,810 | | | | 1,418,259 | | | | 1,430,998 | | | | | * | | | (1 | )% |
Undivided profits | | | 744,221 | | | | 714,988 | | | | 691,958 | | | | 715,451 | | | | 771,953 | | | | 4 | % | | | (4 | )% |
Accumulated other comprehensive loss, net | | | (130,984 | ) | | | (135,163 | ) | | | (173,673 | ) | | | (191,866 | ) | | | (156,178 | ) | | | (3 | )% | | | (16 | )% |
Preferred stock | | | 95,624 | | | | 95,624 | | | | 95,624 | | | | 95,624 | | | | 95,624 | | | | | * | | | | * |
Noncontrolling interest | | | 295,431 | | | | 295,431 | | | | 295,431 | | | | 295,431 | | | | 295,259 | | | | | * | | | | * |
| | | | | | | | | | | | | | | | | | | | | | | | | | | | |
Total equity | | | 2,569,188 | | | | 2,536,273 | | | | 2,471,874 | | | | 2,481,899 | | | | 2,588,124 | | | | 1 | % | | | (1 | )% |
| | | | | | | | | | | | | | | | | | | | | | | | | | | | |
Total liabilities and equity ( Restricted - $.1 billion) (a) | | $ | 23,651,952 | | | $ | 23,916,069 | | | $ | 23,845,311 | | | $ | 24,181,633 | | | $ | 24,582,818 | | | | (1 | )% | | | (4 | )% |
| | | | | | | | | | | | | | | | | | | | | | | | | | | | |
NM - Not meaningful
| * | Amount is less than one percent. |
| (a) | Restricted balances parenthetically presented are quarterly averages for second quarter 2014. |
| (b) | Includes loans on nonaccrual status. |
| (c) | Includes excess balances held at Fed. |
| (d) | 2Q14 includes increased FHLB borrowings as a result of loan growth and deposit fluctuations. |
| (e) | In 1Q14 FHN resolved the collateralized borrowings for three previously on-balance sheet consumer loan securitizations; In 2Q13 $350.0 million of subordinated notes matured. |
9
FHN CONSOLIDATED NET INTEREST INCOME (a)
Quarterly, Unaudited
| | | | | | | | | | | | | | | | | | | | | | | | | | | | |
| | | | | | | | | | | | | | | | | | 2Q14 Changes vs. | |
(Thousands) | | 2Q14 | | | 1Q14 | | | 4Q13 | | | 3Q13 | | | 2Q13 | | | 1Q14 | | | 2Q13 | |
| | | | | | | |
Interest Income: | | | | | | | | | | | | | | | | | | | | | | | | | | | | |
Loans, net of unearned income (b) | | $ | 144,975 | | | $ | 140,487 | | | $ | 147,322 | | | $ | 151,504 | | | $ | 153,070 | | | | 3 | % | | | (5 | )% |
Loans held-for-sale | | | 3,209 | | | | 3,215 | | | | 3,253 | | | | 3,058 | | | | 3,169 | | | | | * | | | 1 | % |
Investment securities: | | | | | | | | | | | | | | | | | | | | | | | | | | | | |
U.S. treasuries | | | 7 | | | | 5 | | | | 4 | | | | 10 | | | | 11 | | | | 40 | % | | | (36 | )% |
U.S. government agencies | | | 21,530 | | | | 20,837 | | | | 19,020 | | | | 18,537 | | | | 18,321 | | | | 3 | % | | | 18 | % |
States and municipalities | | | 97 | | | | 117 | | | | 21 | | | | 21 | | | | 25 | | | | (17 | )% | | | NM | |
Other | | | 2,103 | | | | 2,281 | | | | 2,307 | | | | 2,355 | | | | 2,315 | | | | (8 | )% | | | (9 | )% |
| | | | | | | | | | | | | | | | | | | | | | | | | | | | |
Total investment securities | | | 23,737 | | | | 23,240 | | | | 21,352 | | | | 20,923 | | | | 20,672 | | | | 2 | % | | | 15 | % |
| | | | | | | | | | | | | | | | | | | | | | | | | | | | |
Capital markets securities inventory | | | 7,680 | | | | 8,063 | | | | 8,631 | | | | 8,425 | | | | 8,467 | | | | (5 | )% | | | (9 | )% |
Mortgage banking trading securities | | | 159 | | | | 159 | | | | 247 | | | | 403 | | | | 452 | | | | | * | | | (65 | )% |
Other earning assets: | | | | | | | | | | | | | | | | | | | | | | | | | | | | |
Federal funds sold | | | 73 | | | | 53 | | | | 48 | | | | 73 | | | | 66 | | | | 38 | % | | | 11 | % |
Securities purchased under agreements to resell (c) | | | (218 | ) | | | (192 | ) | | | (99 | ) | | | (171 | ) | | | (189 | ) | | | (14 | )% | | | (15 | )% |
Interest-bearing cash | | | 182 | | | | 546 | | | | 343 | | | | 289 | | | | 197 | | | | (67 | )% | | | (8 | )% |
| | | | | | | | | | | | | | | | | | | | | | | | | | | | |
Total other earning assets | | | 37 | | | | 407 | | | | 292 | | | | 191 | | | | 74 | | | | (91 | )% | | | (50 | )% |
| | | | | | | | | | | | | | | | | | | | | | | | | | | | |
Interest income | | $ | 179,797 | | | $ | 175,571 | | | $ | 181,097 | | | $ | 184,504 | | | $ | 185,904 | | | | 2 | % | | | (3 | )% |
| | | | | | | | | | | | | | | | | | | | | | | | | | | | |
| | | | | | | |
Interest Expense: | | | | | | | | | | | | | | | | | | | | | | | | | | | | |
Interest-bearing deposits: | | | | | | | | | | | | | | | | | | | | | | | | | | | | |
Savings | | $ | 2,792 | | | $ | 3,083 | | | $ | 3,205 | | | $ | 3,471 | | | $ | 3,689 | | | | (9 | )% | | | (24 | )% |
Other interest-bearing deposits | | | 746 | | | | 818 | | | | 772 | | | | 817 | | | | 1,013 | | | | (9 | )% | | | (26 | )% |
Time deposits | | | 2,486 | | | | 3,062 | | | | 3,585 | | | | 4,013 | | | | 4,064 | | | | (19 | )% | | | (39 | )% |
| | | | | | | | | | | | | | | | | | | | | | | | | | | | |
Total interest-bearing core deposits | | | 6,024 | | | | 6,963 | | | | 7,562 | | | | 8,301 | | | | 8,766 | | | | (13 | )% | | | (31 | )% |
Certificates of deposit $100,000 and more (d) | | | 869 | | | | 1,023 | | | | 873 | | | | 1,658 | | | | 1,550 | | | | (15 | )% | | | (44 | )% |
Federal funds purchased | | | 683 | | | | 726 | | | | 791 | | | | 716 | | | | 777 | | | | (6 | )% | | | (12 | )% |
Securities sold under agreements to repurchase | | | 109 | | | | 118 | | | | 126 | | | | 148 | | | | 134 | | | | (8 | )% | | | (19 | )% |
Capital markets trading liabilities | | | 4,087 | | | | 3,571 | | | | 3,442 | | | | 3,632 | | | | 3,354 | | | | 14 | % | | | 22 | % |
Other short-term borrowings | | | 403 | | | | 261 | | | | 222 | | | | 239 | | | | 245 | | | | 54 | % | | | 64 | % |
Term borrowings | | | 8,416 | | | | 8,563 | | | | 8,902 | | | | 9,078 | | | | 9,146 | | | | (2 | )% | | | (8 | )% |
| | | | | | | | | | | | | | | | | | | | | | | | | | | | |
Interest expense | | | 20,591 | | | | 21,225 | | | | 21,918 | | | | 23,772 | | | | 23,972 | | | | (3 | )% | | | (14 | )% |
| | | | | | | | | | | | | | | | | | | | | | | | | | | | |
Net interest income - tax equivalent basis | | | 159,206 | | | | 154,346 | | | | 159,179 | | | | 160,732 | | | | 161,932 | | | | 3 | % | | | (2 | )% |
Fully taxable equivalent adjustment | | | (2,438 | ) | | | (1,987 | ) | | | (2,044 | ) | | | (1,894 | ) | | | (1,913 | ) | | | (23 | )% | | | (27 | )% |
| | | | | | | | | | | | | | | | | | | | | | | | | | | | |
Net interest income | | $ | 156,768 | | | $ | 152,359 | | | $ | 157,135 | | | $ | 158,838 | | | $ | 160,019 | | | | 3 | % | | | (2 | )% |
| | | | | | | | | | | | | | | | | | | | | | | | | | | | |
NM - Not meaningful
| * | Amount is less than one percent. |
| (a) | Net interest income adjusted to a fully taxable equivalent (“FTE”) basis assuming a statutory federal income tax of 35 percent and, where applicable, state income taxes. |
| (b) | Includes interest on loans in nonaccrual status. |
| (c) | Driven by negative market rates on reverse repurchase agreements. |
| (d) | 2Q14, 1Q14 and 4Q13 include the effect of amortizing the valuation adjustment for acquired time deposits related to the MNB acquisition. |
10
FHN CONSOLIDATED AVERAGE BALANCE SHEET: YIELDS AND RATES
Quarterly, Unaudited
| | | | | | | | | | | | | | | | | | | | |
| | | 2Q14 | | | 1Q14 | | | 4Q13 | | | 3Q13 | | | 2Q13 | |
| | | | | |
Assets: | | | | | | | | | | | | | | | | | | | | |
Earning assets (a): | | | | | | | | | | | | | | | | | | | | |
Loans, net of unearned income: | | | | | | | | | | | | | | | | | | | | |
Commercial loans | | | 3.59 | % | | | 3.60 | % | | | 3.66 | % | | | 3.69 | % | | | 3.68 | % |
Retail loans | | | 4.06 | | | | 4.01 | | | | 4.07 | | | | 4.06 | | | | 4.12 | |
| | | | | | | | | | | | | | | | | | | | |
Total loans, net of unearned income (b) | | | 3.78 | | | | 3.77 | | | | 3.83 | | | | 3.85 | | | | 3.86 | |
| | | | | | | | | | | | | | | | | | | | |
Loans held-for-sale | | | 3.61 | | | | 3.50 | | | | 3.53 | | | | 3.23 | | | | 3.26 | |
Investment securities: | | | | | | | | | | | | | | | | | | | | |
U.S. treasuries | | | 0.07 | | | | 0.05 | | | | 0.04 | | | | 0.09 | | | | 0.11 | |
U.S. government agencies | | | 2.59 | | | | 2.59 | | | | 2.57 | | | | 2.56 | | | | 2.51 | |
States and municipalities (c) | | | 1.99 | | | | 2.41 | | | | 0.56 | | | | 0.55 | | | | 0.65 | |
Other | | | 4.44 | | | | 4.31 | | | | 4.02 | | | | 4.20 | | | | 4.23 | |
| | | | | | | | | | | | | | | | | | | | |
Total investment securities | | | 2.65 | | | | 2.66 | | | | 2.63 | | | | 2.63 | | | | 2.58 | |
| | | | | | | | | | | | | | | | | | | | |
Capital markets securities inventory | | | 2.76 | | | | 2.93 | | | | 2.98 | | | | 2.91 | | | | 2.59 | |
Mortgage banking trading securities | | | 9.71 | | | | 9.16 | | | | 7.79 | | | | 10.36 | | | | 11.02 | |
Other earning assets: | | | | | | | | | | | | | | | | | | | | |
Federal funds sold | | | 1.00 | | | | 0.99 | | | | 0.98 | | | | 1.01 | | | | 0.99 | |
Securities purchased under agreements to resell (d) | | | (0.13 | ) | | | (0.13 | ) | | | (0.07 | ) | | | (0.11 | ) | | | (0.11 | ) |
Interest-bearing cash | | | 0.20 | | | | 0.23 | | | | 0.22 | | | | 0.21 | | | | 0.20 | |
| | | | | | | | | | | | | | | | | | | | |
Total other earning assets | | | 0.01 | | | | 0.10 | | | | 0.10 | | | | 0.07 | | | | 0.03 | |
| | | | | | | | | | | | | | | | | | | | |
Interest income/total earning assets | | | 3.35 | % | | | 3.27 | % | | | 3.39 | % | | | 3.41 | % | | | 3.40 | % |
| | | | | | | | | | | | | | | | | | | | |
| | | | | |
Liabilities: | | | | | | | | | | | | | | | | | | | | |
Interest-bearing liabilities: | | | | | | | | | | | | | | | | | | | | |
Interest-bearing deposits: | | | | | | | | | | | | | | | | | | | | |
Savings | | | 0.17 | % | | | 0.19 | % | | | 0.19 | % | | | 0.20 | % | | | 0.23 | % |
Other interest-bearing deposits | | | 0.08 | | | | 0.09 | | | | 0.09 | | | | 0.09 | | | | 0.11 | |
Time deposits | | | 1.16 | | | | 1.34 | | | | 1.46 | | | | 1.55 | | | | 1.63 | |
| | | | | | | | | | | | | | | | | | | | |
Total interest-bearing core deposits | | | 0.22 | | | | 0.25 | | | | 0.27 | | | | 0.29 | | | | 0.32 | |
Certificates of deposit $100,000 and more (e) | | | 0.68 | | | | 0.76 | | | | 0.60 | | | | 1.11 | | | | 1.15 | |
Federal funds purchased | | | 0.25 | | | | 0.25 | | | | 0.25 | | | | 0.25 | | | | 0.25 | |
Securities sold under agreements to repurchase | | | 0.10 | | | | 0.11 | | | | 0.11 | | | | 0.13 | | | | 0.11 | |
Capital markets trading liabilities | | | 2.44 | | | | 2.39 | | | | 2.41 | | | | 2.41 | | | | 1.87 | |
Other short-term borrowings | | | 0.30 | | | | 0.57 | | | | 0.40 | | | | 0.39 | | | | 0.19 | |
Term borrowings (f) | | | 2.24 | | | | 2.01 | | | | 2.02 | | | | 2.03 | | | | 1.82 | |
| | | | | | | | | | | | | | | | | | | | |
Interest expense/total interest-bearing liabilities | | | 0.52 | | | | 0.53 | | | | 0.55 | | | | 0.58 | | | | 0.58 | |
| | | | | | | | | | | | | | | | | | | | |
Net interest spread | | | 2.83 | % | | | 2.74 | % | | | 2.84 | % | | | 2.83 | % | | | 2.82 | % |
Effect of interest-free sources used to fund earning assets | | | 0.14 | | | | 0.14 | | | | 0.14 | | | | 0.14 | | | | 0.14 | |
| | | | | | | | | | | | | | | | | | | | |
Net interest margin | | | 2.97 | % | | | 2.88 | % | | | 2.98 | % | | | 2.97 | % | | | 2.96 | % |
| | | | | | | | | | | | | | | | | | | | |
Yields are adjusted to a FTE basis assuming a statutory federal income tax rate of 35 percent and, where applicable, state income taxes.
| (a) | Earning assets yields are expressed net of unearned income. |
| (b) | Includes loans on nonaccrual status. |
| (c) | Increase beginning in 1Q14 driven by the yield on an HTM municipal bond. |
| (d) | Driven by negative market rates on reverse repurchase agreements. |
| (e) | 2Q14, 1Q14 and 4Q13 rate includes the effect of amortizing the valuation adjustment for acquired time deposits related to the MNB acquisition. |
| (f) | Rates are expressed net of unamortized debenture cost for term borrowings. |
11
FHN CAPITAL HIGHLIGHTS
Quarterly, Unaudited
| | | | | | | | | | | | | | | | | | | | | | | | | | | | |
| | | | | | | | | | | | | | | | | | 2Q14 Changes vs. | |
(Dollars and shares in thousands) | | 2Q14 | | | 1Q14 | | | 4Q13 | | | 3Q13 | | | 2Q13 | | | 1Q14 | | | 2Q13 | |
| | | | | | | |
Tier 1 capital (a) (b) | | $ | 2,751,933 | | | $ | 2,666,486 | | | $ | 2,618,976 | | | $ | 2,555,141 | | | $ | 2,712,399 | | | | 3 | % | | | 1 | % |
Tier 2 capital (a) | | | 340,010 | | | | 381,619 | | | | 444,655 | | | | 449,100 | | | | 463,735 | | | | (11 | )% | | | (27 | )% |
| | | | | | | | | | | | | | | | | | | | | | | | | | | | |
Total capital (a) (b) | | $ | 3,091,943 | | | $ | 3,048,105 | | | $ | 3,063,631 | | | $ | 3,004,241 | | | $ | 3,176,134 | | | | 1 | % | | | (3 | )% |
| | | | | | | | | | | | | | | | | | | | | | | | | | | | |
| | | | | | | |
Risk-weighted assets (“RWA”) (a) | | $ | 19,379,300 | | | $ | 18,694,719 | | | $ | 18,878,594 | | | $ | 19,236,794 | | | $ | 20,419,117 | | | | 4 | % | | | (5 | )% |
Tier 1 ratio (a) | | | 14.20 | % | | | 14.26 | % | | | 13.87 | % | | | 13.28 | % | | | 13.28 | % | | | | | | | | |
Tier 2 ratio (a) | | | 1.75 | % | | | 2.04 | % | | | 2.36 | % | | | 2.34 | % | | | 2.27 | % | | | | | | | | |
| | | | | | | | | | | | | | | | | | | | | | | | | | | | |
Total capital ratio (a) | | | 15.95 | % | | | 16.30 | % | | | 16.23 | % | | | 15.62 | % | | | 15.55 | % | | | | | | | | |
| | | | | | | | | | | | | | | | | | | | | | | | | | | | |
| | | | | | | |
Tier 1 common ratio to risk-weighted assets (a) (c) | | | 11.15 | % | | | 11.10 | % | | | 10.75 | % | | | 10.21 | % | | | 10.39 | % | | | | | | | | |
Leverage ratio (a) | | | 11.67 | % | | | 11.19 | % | | | 11.04 | % | | | 10.60 | % | | | 11.07 | % | | | | | | | | |
Total equity to total assets | | | 10.84 | % | | | 10.63 | % | | | 10.51 | % | | | 10.20 | % | | | 10.25 | % | | | | | | | | |
Adjusted tangible common equity to risk-weighted assets (“TCE/RWA”) (a) (c) (d) | | | 10.62 | % | | | 10.65 | % | | | 10.37 | % | | | 9.71 | % | | | 9.71 | % | | | | | | | | |
Tangible common equity/tangible assets (“TCE/TA”) (c) (e) | | | 8.62 | % | | | 8.37 | % | | | 8.24 | % | | | 7.93 | % | | | 8.07 | % | | | | | | | | |
Period-end shares outstanding | | | 237,147 | | | | 236,586 | | | | 236,370 | | | | 236,328 | | | | 240,555 | | | | | * | | | (1 | )% |
Cash dividends declared per common share | | $ | 0.05 | | | $ | 0.05 | | | $ | 0.05 | | | $ | 0.05 | | | $ | 0.05 | | | | | * | | | | * |
Book value per common share | | $ | 9.42 | | | $ | 9.10 | | | $ | 8.93 | | | $ | 8.64 | | | $ | 8.96 | | | | | | | | | |
Tangible book value per common share (c) | | $ | 8.74 | | | $ | 8.41 | | | $ | 8.23 | | | $ | 7.95 | | | $ | 8.28 | | | | | | | | | |
Market capitalization (millions) | | $ | 2,812.6 | | | $ | 2,919.5 | | | $ | 2,753.7 | | | $ | 2,597.2 | | | $ | 2,694.2 | | | | | | | | | |
| | | | | | | | | | | | | | | | | | | | | | | | | | | | |
Certain previously reported amounts have been reclassified to agree with current presentation.
| * | Amount is less than one percent. |
| (a) | Current quarter is an estimate. |
| (b) | All quarters presented include $200 million of tier 1 qualifying trust preferred securities. |
| (c) | Refer to the Non-GAAP to GAAP Reconciliation on page 22 of this financial supplement. |
| (d) | See Glossary of Terms for definition of ratio. |
| (e) | Calculated using period-end balances. |
12
FHN BUSINESS SEGMENT HIGHLIGHTS
Quarterly, Unaudited
| | | | | | | | | | | | | | | | | | | | | | | | | | | | |
| | | | | | | | | | | | | | | | | | 2Q14 Changes vs. | |
(Thousands) | | 2Q14 | | | 1Q14 | | | 4Q13 | | | 3Q13 | | | 2Q13 | | | 1Q14 | | | 2Q13 | |
| | | | | | | |
Regional Banking | | | | | | | | | | | | | | | | | | | | | | | | | | | | |
Net interest income | | $ | 148,654 | | | $ | 142,010 | | | $ | 146,427 | | | $ | 149,541 | | | $ | 148,220 | | | | 5 | % | | | * | |
Noninterest income | | | 66,226 | | | | 59,992 | | | | 62,806 | | | | 63,883 | | | | 61,885 | | | | 10 | % | | | 7 | % |
| | | | | | | | | | | | | | | | | | | | | | | | | | | | |
Total revenues | | | 214,880 | | | | 202,002 | | | | 209,233 | | | | 213,424 | | | | 210,105 | | | | 6 | % | | | 2 | % |
Provision for loan losses | | | 8,425 | | | | 12,990 | | | | 2,585 | | | | 5,159 | | | | 13,201 | | | | (35 | )% | | | (36 | )% |
Noninterest expense | | | 133,564 | | | | 133,050 | | | | 139,186 | | | | 131,961 | | | | 129,584 | | | | * | | | | 3 | % |
| | | | | | | | | | | | | | | | | | | | | | | | | | | | |
Income before income taxes | | | 72,891 | | | | 55,962 | | | | 67,462 | | | | 76,304 | | | | 67,320 | | | | 30 | % | | | 8 | % |
Provision for income taxes | | | 25,843 | | | | 19,880 | | | | 24,049 | | | | 27,554 | | | | 24,146 | | | | 30 | % | | | 7 | % |
| | | | | | | | | | | | | | | | | | | | | | | | | | | | |
Net income | | $ | 47,048 | | | $ | 36,082 | | | $ | 43,413 | | | $ | 48,750 | | | $ | 43,174 | | | | 30 | % | | | 9 | % |
| | | | | | | | | | | | | | | | | | | | | | | | | | | | |
| | | | | | | |
Capital Markets | | | | | | | | | | | | | | | | | | | | | | | | | | | | |
Net interest income | | $ | 2,590 | | | $ | 3,478 | | | $ | 4,301 | | | $ | 3,811 | | | $ | 4,097 | | | | (26 | )% | | | (37 | )% |
Noninterest income | | | 47,564 | | | | 56,758 | | | | 59,509 | | | | 64,115 | | | | 68,199 | | | | (16 | )% | | | (30 | )% |
| | | | | | | | | | | | | | | | | | | | | | | | | | | | |
Total revenues | | | 50,154 | | | | 60,236 | | | | 63,810 | | | | 67,926 | | | | 72,296 | | | | (17 | )% | | | (31 | )% |
Noninterest expense (a) | | | 111 | | | | 52,594 | | | | 53,130 | | | | 57,930 | | | | 59,822 | | | | NM | | | | NM | |
| | | | | | | | | | | | | | | | | | | | | | | | | | | | |
Income before income taxes | | | 50,043 | | | | 7,642 | | | | 10,680 | | | | 9,996 | | | | 12,474 | | | | NM | | | | NM | |
Provision for income taxes | | | 19,146 | | | | 2,845 | | | | 3,981 | | | | 3,765 | | | | 4,651 | | | | NM | | | | NM | |
| | | | | | | | | | | | | | | | | | | | | | | | | | | | |
Net income | | $ | 30,897 | | | $ | 4,797 | | | $ | 6,699 | | | $ | 6,231 | | | $ | 7,823 | | | | NM | | | | NM | |
| | | | | | | | | | | | | | | | | | | | | | | | | | | | |
| | | | | | | |
Corporate | | | | | | | | | | | | | | | | | | | | | | | | | | | | |
Net interest income/(expense) | | $ | (10,522 | ) | | $ | (9,113 | ) | | $ | (10,413 | ) | | $ | (11,654 | ) | | $ | (11,182 | ) | | | (15 | )% | | | 6 | % |
Noninterest income | | | 5,214 | | | | 13,215 | | | | 7,831 | | | | 6,558 | | | | 3,811 | | | | (61 | )% | | | 37 | % |
| | | | | | | | | | | | | | | | | | | | | | | | | | | | |
Total revenues | | | (5,308 | ) | | | 4,102 | | | | (2,582 | ) | | | (5,096 | ) | | | (7,371 | ) | | | NM | | | | 28 | % |
Noninterest expense | | | 15,798 | | | | 19,578 | | | | 18,770 | | | | 21,739 | | | | 17,141 | | | | (19 | )% | | | (8 | )% |
| | | | | | | | | | | | | | | | | | | | | | | | | | | | |
Loss before income taxes | | | (21,106 | ) | | | (15,476 | ) | | | (21,352 | ) | | | (26,835 | ) | | | (24,512 | ) | | | (36 | )% | | | 14 | % |
Benefit for income taxes | | | (17,270 | ) | | | (11,766 | ) | | | (19,004 | ) | | | (16,593 | ) | | | (15,698 | ) | | | (47 | )% | | | (10 | )% |
| | | | | | | | | | | | | | | | | | | | | | | | | | | | |
Net loss | | $ | (3,836 | ) | | $ | (3,710 | ) | | $ | (2,348 | ) | | $ | (10,242 | ) | | $ | (8,814 | ) | | | (3 | )% | | | 56 | % |
| | | | | | | | | | | | | | | | | | | | | | | | | | | | |
| | | | | | | |
Non-Strategic | | | | | | | | | | | | | | | | | | | | | | | | | | | | |
Net interest income | | $ | 16,046 | | | $ | 15,984 | | | $ | 16,820 | | | $ | 17,140 | | | $ | 18,884 | | | | * | | | | (15 | )% |
Noninterest income | | | 7,897 | | | | 15,765 | | | | 4,897 | | | | 15,919 | | | | 8,737 | | | | (50 | )% | | | (10 | )% |
| | | | | | | | | | | | | | | | | | | | | | | | | | | | |
Total revenues | | | 23,943 | | | | 31,749 | | | | 21,717 | | | | 33,059 | | | | 27,621 | | | | (25 | )% | | | (13 | )% |
Provision/(provision credit) for loan losses | | | (3,425 | ) | | | (2,990 | ) | | | 12,415 | | | | 4,841 | | | | 1,799 | | | | (15 | )% | | | NM | |
Noninterest expense (b) | | | 15,859 | | | | 14,992 | | | | 46,011 | | | | 221,926 | | | | 20,861 | | | | 6 | % | | | (24 | )% |
| | | | | | | | | | | | | | | | | | | | | | | | | | | | |
Income/(loss) before income taxes | | | 11,509 | | | | 19,747 | | | | (36,709 | ) | | | (193,708 | ) | | | 4,961 | | | | (42 | )% | | | NM | |
Provision/(benefit) for income taxes | | | 4,438 | | | | 7,686 | | | | (42,839 | ) | | | (45,820 | ) | | | 1,909 | | | | (42 | )% | | | NM | |
| | | | | | | | | | | | | | | | | | | | | | | | | | | | |
Income/(loss) from continuing operations | | | 7,071 | | | | 12,061 | | | | 6,130 | | | | (147,888 | ) | | | 3,052 | | | | (41 | )% | | | NM | |
Income/(loss) from discontinued operations, net of tax | | | — | | | | — | | | | (6 | ) | | | 123 | | | | 1 | | | | NM | | | | NM | |
| | | | | | | | | | | | | | | | | | | | | | | | | | | | |
Net income/(loss) | | $ | 7,071 | | | $ | 12,061 | | | $ | 6,124 | | | $ | (147,765 | ) | | $ | 3,053 | | | | (41 | )% | | | NM | |
| | | | | | | | | | | | | | | | | | | | | | | | | | | | |
| | | | | | | |
Total Consolidated | | | | | | | | | | | | | | | | | | | | | | | | | | | | |
Net interest income | | $ | 156,768 | | | $ | 152,359 | | | $ | 157,135 | | | $ | 158,838 | | | $ | 160,019 | | | | 3 | % | | | (2 | )% |
Noninterest income | | | 126,901 | | | | 145,730 | | | | 135,043 | | | | 150,475 | | | | 142,632 | | | | (13 | )% | | | (11 | )% |
| | | | | | | | | | | | | | | | | | | | | | | | | | | | |
Total revenues | | | 283,669 | | | | 298,089 | | | | 292,178 | | | | 309,313 | | | | 302,651 | | | | (5 | )% | | | (6 | )% |
Provision for loan losses | | | 5,000 | | | | 10,000 | | | | 15,000 | | | | 10,000 | | | | 15,000 | | | | (50 | )% | | | (67 | )% |
Noninterest expense | | | 165,332 | | | | 220,214 | | | | 257,097 | | | | 433,556 | | | | 227,408 | | | | (25 | )% | | | (27 | )% |
| | | | | | | | | | | | | | | | | | | | | | | | | | | | |
Income/(loss) before income taxes | | | 113,337 | | | | 67,875 | | | | 20,081 | | | | (134,243 | ) | | | 60,243 | | | | 67 | % | | | 88 | % |
Provision/(benefit) for income taxes | | | 32,157 | | | | 18,645 | | | | (33,813 | ) | | | (31,094 | ) | | | 15,008 | | | | 72 | % | | | NM | |
| | | | | | | | | | | | | | | | | | | | | | | | | | | | |
Income/(loss) from continuing operations | | | 81,180 | | | | 49,230 | | | | 53,894 | | | | (103,149 | ) | | | 45,235 | | | | 65 | % | | | 79 | % |
Income/(loss) from discontinued operations, net of tax | | | — | | | | — | | | | (6 | ) | | | 123 | | | | 1 | | | | NM | | | | NM | |
| | | | | | | | | | | | | | | | | | | | | | | | | | | | |
Net income/(loss) | | $ | 81,180 | | | $ | 49,230 | | | $ | 53,888 | | | $ | (103,026 | ) | | $ | 45,236 | | | | 65 | % | | | 79 | % |
| | | | | | | | | | | | | | | | | | | | | | | | | | | | |
NM - Not meaningful
| * | Amount is less than one percent. |
| (a) | 2Q14 includes a $47.1 million expense reversal related to agreements with insurance companies for the recovery of expenses incurred in the Sentinel litigation matter which was settled in 2011. |
| (b) | 4Q13 includes $57.0 million of net loss accruals related to legal matters, partially offset by a $30.0 million expense reversal related to the resolution of certain legacy and representation and warranty mortgage loan repurchase obligations to a government sponsored entity; 3Q13 includes a $200.0 million expense stemming from the resolution of certain legacy representation and warranty mortgage loan repurchase obligations to a government sponsored entity. |
13
FHN REGIONAL BANKING
Quarterly, Unaudited
| | | | | | | | | | | | | | | | | | | | | | | | | | | | |
| | | | | | | | | | | | | | | | | | 2Q14 Changes vs. | |
| | | 2Q14 | | | 1Q14 | | | 4Q13 | | | 3Q13 | | | 2Q13 | | | 1Q14 | | | 2Q13 | |
| | | | | | | |
Income Statement (thousands) | | | | | | | | | | | | | | | | | | | | | | | | | | | | |
Net interest income | | $ | 148,654 | | | $ | 142,010 | | | $ | 146,427 | | | $ | 149,541 | | | $ | 148,220 | | | | 5 | % | | | | * |
Provision for loan losses | | | 8,425 | | | | 12,990 | | | | 2,585 | | | | 5,159 | | | | 13,201 | | | | (35 | )% | | | (36 | )% |
Noninterest income: | | | | | | | | | | | | | | | | | | | | | | | | | | | | |
NSF / Overdraft fees (a) | | | 10,636 | | | | 9,156 | | | | 11,411 | | | | 11,660 | | | | 10,250 | | | | 16 | % | | | 4 | % |
Cash management fees | | | 8,537 | | | | 8,916 | | | | 9,063 | | | | 8,760 | | | | 9,133 | | | | (4 | )% | | | (7 | )% |
Debit card income | | | 2,934 | | | | 2,655 | | | | 2,739 | | | | 2,782 | | | | 2,695 | | | | 11 | % | | | 9 | % |
Other | | | 4,850 | | | | 4,864 | | | | 5,112 | | | | 5,126 | | | | 5,183 | | | | | * | | | (6 | )% |
| | | | | | | | | | | | | | | | | | | | | | | | | | | | |
Total deposit transactions and cash management | | | 26,957 | | | | 25,591 | | | | 28,325 | | | | 28,328 | | | | 27,261 | | | | 5 | % | | | (1 | )% |
Brokerage, management fees and commissions | | | 12,844 | | | | 12,276 | | | | 11,505 | | | | 10,868 | | | | 10,540 | | | | 5 | % | | | 22 | % |
Trust services and investment management | | | 7,325 | | | | 6,760 | | | | 6,612 | | | | 6,665 | | | | 6,966 | | | | 8 | % | | | 5 | % |
Bankcard income (b) | | | 7,740 | | | | 4,365 | | | | 4,815 | | | | 5,089 | | | | 5,054 | | | | 77 | % | | | 53 | % |
Other service charges | | | 2,848 | | | | 2,559 | | | | 2,873 | | | | 3,451 | | | | 3,255 | | | | 11 | % | | | (13 | )% |
Miscellaneous revenue | | | 8,512 | | | | 8,441 | | | | 8,676 | | | | 9,482 | | | | 8,809 | | | | 1 | % | | | (3 | )% |
| | | | | | | | | | | | | | | | | | | | | | | | | | | | |
Total noninterest income | | | 66,226 | | | | 59,992 | | | | 62,806 | | | | 63,883 | | | | 61,885 | | | | 10 | % | | | 7 | % |
| | | | | | | | | | | | | | | | | | | | | | | | | | | | |
Noninterest expense: | | | | | | | | | | | | | | | | | | | | | | | | | | | | |
Employee compensation, incentives, and benefits | | | 51,870 | | | | 50,318 | | | | 50,921 | | | | 51,656 | | | | 50,438 | | | | 3 | % | | | 3 | % |
Other | | | 81,694 | | | | 82,732 | | | | 88,265 | | | | 80,305 | | | | 79,146 | | | | (1 | )% | | | 3 | % |
| | | | | | | | | | | | | | | | | | | | | | | | | | | | |
Total noninterest expense | | | 133,564 | | | | 133,050 | | | | 139,186 | | | | 131,961 | | | | 129,584 | | | | * | | | | 3 | % |
| | | | | | | | | | | | | | | | | | | | | | | | | | | | |
Income before income taxes | | $ | 72,891 | | | $ | 55,962 | | | $ | 67,462 | | | $ | 76,304 | | | $ | 67,320 | | | | 30 | % | | | 8 | % |
| | | | | | | | | | | | | | | | | | | | | | | | | | | | |
PPNR (Non-GAAP) (c) | | $ | 81,316 | | | $ | 68,952 | | | $ | 70,047 | | | $ | 81,463 | | | $ | 80,521 | | | | 18 | % | | | 1 | % |
| | | | | | | | | | | | | | | | | | | | | | | | | | | | |
Efficiency ratio (d) | | | 62.16 | % | | | 65.87 | % | | | 66.52 | % | | | 61.83 | % | | | 61.68 | % | | | | | | | | |
| | | | | | | | | | | | | | | | | | | | | | | | | | | | |
| | | | | | | |
Balance Sheet (millions) | | | | | | | | | | | | | | | | | | | | | | | | | | | | |
Average loans | | $ | 12,372 | | | $ | 11,897 | | | $ | 11,972 | | | $ | 12,184 | | | $ | 12,225 | | | | 4 | % | | | 1 | % |
Average other earning assets | | | 57 | | | | 50 | | | | 43 | | | | 54 | | | | 53 | | | | 14 | % | | | 8 | % |
Total average earning assets | | | 12,429 | | | | 11,947 | | | | 12,015 | | | | 12,238 | | | | 12,278 | | | | 4 | % | | | 1 | % |
Average core deposits | | | 14,809 | | | | 14,857 | | | | 14,466 | | | | 14,484 | | | | 14,624 | | | | | * | | | 1 | % |
Average other deposits | | | 512 | | | | 546 | | | | 581 | | | | 595 | | | | 542 | | | | (6 | )% | | | (6 | )% |
Total average deposits | | | 15,321 | | | | 15,403 | | | | 15,047 | | | | 15,079 | | | | 15,166 | | | | (1 | )% | | | 1 | % |
Total period-end deposits | | | 15,418 | | | | 15,723 | | | | 15,480 | | | | 14,862 | | | | 15,562 | | | | (2 | )% | | | (1 | )% |
Total period-end assets | | | 13,702 | | | | 12,891 | | | | 13,019 | | | | 12,909 | | | | 13,496 | | | | 6 | % | | | 2 | % |
| | | | | | | | | | | | | | | | | | | | | | | | | | | | |
Net interest margin (e) | | | 4.87 | % | | | 4.88 | % | | | 4.90 | % | | | 4.91 | % | | | 4.90 | % | | | | | | | | |
Net interest spread | | | 3.46 | | | | 3.41 | | | | 3.50 | | | | 3.49 | | | | 3.46 | | | | | | | | | |
Loan yield | | | 3.63 | | | | 3.61 | | | | 3.71 | | | | 3.74 | | | | 3.72 | | | | | | | | | |
Deposit average yield | | | 0.17 | | | | 0.20 | | | | 0.21 | | | | 0.25 | | | | 0.26 | | | | | | | | | |
| | | | | | | | | | | | | | | | | | | | | | | | | | | | |
| | | | | | | |
Key Statistics | | | | | | | | | | | | | | | | | | | | | | | | | | | | |
Financial center locations | | | 172 | | | | 172 | | | | 172 | | | | 182 | | | | 183 | | | | | * | | | (6 | )% |
| | | | | | | | | | | | | | | | | | | | | | | | | | | | |
| * | Amount is less than one percent. |
| (a) | 1Q14 decline primarily attributable to seasonality in NSF fees. |
| (b) | 2Q14 includes $2.8 million of Visa volume incentives. |
| (c) | Pre-tax, pre-provision, net revenue is a Non-GAAP number and is calculated by adding the provision/(provision credit) for loan losses (GAAP) to Income before income taxes (GAAP). |
| (d) | Noninterest expense divided by total revenue. |
| (e) | Net interest margin is computed using total net interest income adjusted for FTE assuming a statutory federal income tax rate of 35 percent and, where applicable, state income taxes. |
14
FHN CAPITAL MARKETS
Quarterly, Unaudited
| | | | | | | | | | | | | | | | | | | | | | | | | | | | |
| | | | | | | | | | | | | | | | | | 2Q14 Changes vs. | |
| | | 2Q14 | | | 1Q14 | | | 4Q13 | | | 3Q13 | | | 2Q13 | | | 1Q14 | | | 2Q13 | |
| | | | | | | |
Income Statement (thousands) | | | | | | | | | | | | | | | | | | | | | | | | | | | | |
Net interest income | | $ | 2,590 | | | $ | 3,478 | | | $ | 4,301 | | | $ | 3,811 | | | $ | 4,097 | | | | (26 | )% | | | (37 | )% |
Noninterest income: | | | | | | | | | | | | | | | | | | | | | | | | | | | | |
Fixed income | | | 40,457 | | | | 49,614 | | | | 50,937 | | | | 54,428 | | | | 58,535 | | | | (18 | )% | | | (31 | )% |
Other | | | 7,107 | | | | 7,144 | | | | 8,572 | | | | 9,687 | | | | 9,664 | | | | (1 | )% | | | (26 | )% |
| | | | | | | | | | | | | | | | | | | | | | | | | | | | |
Total noninterest income | | | 47,564 | | | | 56,758 | | | | 59,509 | | | | 64,115 | | | | 68,199 | | | | (16 | )% | | | (30 | )% |
Noninterest expense (a) | | | 111 | | | | 52,594 | | | | 53,130 | | | | 57,930 | | | | 59,822 | | | | NM | | | | NM | |
| | | | | | | | | | | | | | | | | | | | | | | | | | | | |
Income before income taxes | | $ | 50,043 | | | $ | 7,642 | | | $ | 10,680 | | | $ | 9,996 | | | $ | 12,474 | | | | NM | | | | NM | |
| | | | | | | | | | | | | | | | | | | | | | | | | | | | |
Efficiency ratio (b) | | | NM | | | | 87.31 | % | | | 83.26 | % | | | 85.28 | % | | | 82.75 | % | | | | | | | | |
Fixed income average daily revenue | | $ | 642 | | | $ | 813 | | | $ | 822 | | | $ | 850 | | | $ | 915 | | | | (21 | )% | | | (30 | )% |
| | | | | | | | | | | | | | | | | | | | | | | | | | | | |
| | | | | | | |
Balance Sheet (millions) | | | | | | | | | | | | | | | | | | | | | | | | | | | | |
Average trading inventory | | $ | 1,112 | | | $ | 1,102 | | | $ | 1,160 | | | $ | 1,156 | | | $ | 1,310 | | | | 1 | % | | | (15 | )% |
Average other earning assets | | | 668 | | | | 628 | | | | 588 | | | | 604 | | | | 714 | | | | 6 | % | | | (6 | )% |
Total average earning assets | | | 1,780 | | | | 1,730 | | | | 1,748 | | | | 1,760 | | | | 2,024 | | | | 3 | % | | | (12 | )% |
Total period-end assets | | | 2,197 | | | | 2,094 | | | | 1,511 | | | | 2,275 | | | | 2,299 | | | | 5 | % | | | (4 | )% |
| | | | | | | | | | | | | | | | | | | | | | | | | | | | |
Net interest margin (c) | | | 0.61 | % | | | 0.82 | % | | | 1.02 | % | | | 0.89 | % | | | 0.84 | % | | | | | | | | |
| | | | | | | | | | | | | | | | | | | | | | | | | | | | |
NM - Not meaningful
| (a) | 2Q14 includes a $47.1 million expense reversal related to agreements with insurance companies for the recovery of expenses incurred in the Sentinel litigation matter which was settled in 2011. |
| (b) | Noninterest expense divided by total revenue. |
| (c) | Net interest margin is computed using total net interest income adjusted for FTE assuming a statutory federal income tax rate of 35 percent and, where applicable, state income taxes. |
FHN CORPORATE
Quarterly, Unaudited
| | | | | | | | | | | | | | | | | | | | | | | | | | | | |
| | | | | | | | | | | | | | | | | | 2Q14 Changes vs. | |
| | | 2Q14 | | | 1Q14 | | | 4Q13 | | | 3Q13 | | | 2Q13 | | | 1Q14 | | | 2Q13 | |
| | | | | | | |
Income Statement (thousands) | | | | | | | | | | | | | | | | | | | | | | | | | | | | |
Net interest income/(expense) | | $ | (10,522 | ) | | $ | (9,113 | ) | | $ | (10,413 | ) | | $ | (11,654 | ) | | $ | (11,182 | ) | | | (15 | )% | | | 6 | % |
Noninterest income excluding securities gains/(losses) | | | 5,138 | | | | 7,558 | | | | 5,649 | | | | 6,690 | | | | 4,174 | | | | (32 | )% | | | 23 | % |
Securities gains/(losses), net (a) | | | 76 | | | | 5,657 | | | | 2,182 | | | | (132 | ) | | | (363 | ) | | | (99 | )% | | | NM | |
Noninterest expense | | | 15,798 | | | | 19,578 | | | | 18,770 | | | | 21,739 | | | | 17,141 | | | | (19 | )% | | | (8 | )% |
| | | | | | | | | | | | | | | | | | | | | | | | | | | | |
Loss before income taxes | | $ | (21,106 | ) | | $ | (15,476 | ) | | $ | (21,352 | ) | | $ | (26,835 | ) | | $ | (24,512 | ) | | | (36 | )% | | | 14 | % |
| | | | | | | | | | | | | | | | | | | | | | | | | | | | |
| | | | | | | |
Average Balance Sheet (millions) | | | | | | | | | | | | | | | | | | | | | | | | | | | | |
Average loans | | $ | 159 | | | $ | 169 | | | $ | 182 | | | $ | 196 | | | $ | 217 | | | | (6 | )% | | | (27 | )% |
Total earning assets | | $ | 4,082 | | | $ | 4,617 | | | $ | 4,026 | | | $ | 3,900 | | | $ | 3,802 | | | | (12 | )% | | | 7 | % |
Net interest margin (b) | | | (1.04 | )% | | | (0.83 | )% | | | (1.00 | )% | | | (1.16 | )% | | | (1.19 | )% | | | | | | | | |
| | | | | | | | | | | | | | | | | | | | | | | | | | | | |
NM - Not meaningful
| (a) | 1Q14 and 4Q13 include gains of $5.6 million and $3.3 million, respectively, on the sale of cost method investments; 4Q13 also includes a $1.1 million other-than-temporary impairment of an investment. |
| (b) | Net interest margin is computed using total net interest income adjusted for FTE assuming a statutory federal income tax rate of 35 percent and, where applicable, state income taxes. |
15
FHN NON-STRATEGIC
Quarterly, Unaudited
| | | | | | | | | | | | | | | | | | | | | | | | | | | | |
| | | | | | | | | | | | | | | | | | 2Q14 Changes vs. | |
| | | 2Q14 | | | 1Q14 | | | 4Q13 | | | 3Q13 | | | 2Q13 | | | 1Q14 | | | 2Q13 | |
| | | | | | | |
Income Statement (thousands) | | | | | | | | | | | | | | | | | | | | | | | | | | | | |
Net interest income | | $ | 16,046 | | | $ | 15,984 | | | $ | 16,820 | | | $ | 17,140 | | | $ | 18,884 | | | | | * | | | (15 | )% |
Noninterest income: | | | | | | | | | | | | | | | | | | | | | | | | | | | | |
Mortgage warehouse valuation (a) | | | 8,213 | | | | 1,045 | | | | (720 | ) | | | (1,441 | ) | | | (2,454 | ) | | | NM | | | | NM | |
Miscellaneous revenue (b) | | | 1,684 | | | | 14,720 | | | | 5,617 | | | | 17,360 | | | | 11,187 | | | | (89 | )% | | | (85 | )% |
Total noninterest income excluding securities gains/(losses) | | | 9,897 | | | | 15,765 | | | | 4,897 | | | | 15,919 | | | | 8,733 | | | | (37 | )% | | | 13 | % |
Securities gains/(losses), net (c) | | | (2,000 | ) | | | — | | | | — | | | | — | | | | 4 | | | | NM | | | | NM | |
Noninterest expense: | | | | | | | | | | | | | | | | | | | | | | | | | | | | |
Repurchase and foreclosure provision | | | — | | | | — | | | | (30,000 | ) | | | 200,000 | | | | — | | | | NM | | | | NM | |
Other expenses (d) | | | 15,859 | | | | 14,992 | | | | 76,011 | | | | 21,926 | | | | 20,861 | | | | 6 | % | | | (24 | )% |
| | | | | | | | | | | | | | | | | | | | | | | | | | | | |
Total noninterest expense | | | 15,859 | | | | 14,992 | | | | 46,011 | | | | 221,926 | | | | 20,861 | | | | 6 | % | | | (24 | )% |
Provision/(provision credit) for loan losses | | | (3,425 | ) | | | (2,990 | ) | | | 12,415 | | | | 4,841 | | | | 1,799 | | | | (15 | )% | | | NM | |
| | | | | | | | | | | | | | | | | | | | | | | | | | | | |
Income/(loss) before income taxes | | $ | 11,509 | | | $ | 19,747 | | | $ | (36,709 | ) | | $ | (193,708 | ) | | $ | 4,961 | | | | (42 | )% | | | NM | |
| | | | | | | | | | | | | | | | | | | | | | | | | | | | |
| | | | | | | |
Average Balance Sheet (millions) | | | | | | | | | | | | | | | | | | | | | | | | | | | | |
Loans | | $ | 2,851 | | | $ | 2,993 | | | $ | 3,119 | | | $ | 3,272 | | | $ | 3,451 | | | | (5 | )% | | | (17 | )% |
Loans held-for-sale | | | 335 | | | | 344 | | | | 343 | | | | 349 | | | | 360 | | | | (3 | )% | | | (7 | )% |
Trading securities | | | 7 | | | | 7 | | | | 13 | | | | 16 | | | | 16 | | | | | * | | | (56 | )% |
Other assets | | | (15 | ) | | | 60 | | | | 342 | | | | 350 | | | | 340 | | | | NM | | | | NM | |
Total assets | | | 3,178 | | | | 3,404 | | | | 3,817 | | | | 3,987 | | | | 4,167 | | | | (7 | )% | | | (24 | )% |
Net interest margin (e) | | | 2.01 | % | | | 1.92 | % | | | 1.93 | % | | | 1.88 | % | | | 1.97 | % | | | | | | | | |
Efficiency ratio (f) | | | 61.13 | % | | | 47.22 | % | | | NM | | | | NM | | | | 75.54 | % | | | | | | | | |
| | | | | | | | | | | | | | | | | | | | | | | | | | | | |
| | | | | | | |
Mortgage Warehouse - Period-end (millions) | | | | | | | | | | | | | | | | | | | | | | | | | | | | |
Ending warehouse balance (loans held-for-sale) | | $ | 330 | | | $ | 332 | | | $ | 336 | | | $ | 346 | | | $ | 358 | | | | (1 | )% | | | (8 | )% |
| | | | | | | | | | | | | | | | | | | | | | | | | | | | |
| | | | | | | |
Key Servicing Metric | | | | | | | | | | | | | | | | | | | | | | | | | | | | |
Ending servicing portfolio (millions) (g) (h) | | $ | 1,456 | | | $ | 1,679 | | | $ | 9,943 | | | $ | 15,033 | | | $ | 16,025 | | | | (13 | )% | | | (91 | )% |
| | | | | | | | | | | | | | | | | | | | | | | | | | | | |
NM - Not meaningful
| * | Amount is less than one percent. |
| (a) | 2Q14 fair value adjustments reflect new information on market pricing for similar assets primarily related to the non-performing portion of the held-for-sale portfolio. |
| (b) | 1Q14 increase reflects the receipt of previously unrecognized servicing fees in conjunction with transfers of servicing in 1Q14; 3Q13 increase reflects the effect of the terms of the agreement to sell servicing. |
| (c) | 2Q14 includes a $2.0 million fair value reduction of an investment. |
| (d) | 4Q13 includes $57.0 million of net loss accruals related to legal matters. |
| (e) | Net interest margin is computed using total net interest income adjusted for FTE assuming a statutory federal income tax rate of 35 percent and, where applicable, state income taxes. |
| (f) | Noninterest expense divided by total revenue excluding securities gains/(losses). |
| (g) | Includes mortgage loans serviced from FHN’s legacy mortgage banking business, legacy equity lending serviced for others, and mortgage loans in portfolio and warehouse. |
| (h) | In 3Q13 FHN signed a definitive agreement to sell substantially all remaining legacy mortgage servicing; transfers of servicing began in fourth quarter. |
16
FHN ASSET QUALITY: CONSOLIDATED
Quarterly, Unaudited
| | | | | | | | | | | | | | | | | | | | | | | | | | | | |
| | | | | | | | | | | | | | | | | | 2Q14 Changes vs. | |
(Thousands) | | 2Q14 | | | 1Q14 | | | 4Q13 | | | 3Q13 | | | 2Q13 | | | 1Q14 | | | 2Q13 | |
Allowance for Loan Losses Walk-Forward | | | | | | | | | | | | | | | | | | | | | | | | | | | | |
Beginning reserve | | $ | 247,246 | | | $ | 253,809 | | | $ | 255,710 | | | $ | 261,934 | | | $ | 265,218 | | | | (3 | )% | | | (7 | )% |
Provision | | | 5,000 | | | | 10,000 | | | | 15,000 | | | | 10,000 | | | | 15,000 | | | | (50 | )% | | | (67 | )% |
Charge-offs | | | (18,246 | ) | | | (24,692 | ) | | | (29,000 | ) | | | (26,046 | ) | | | (30,272 | ) | | | (26 | )% | | | (40 | )% |
Recoveries | | | 9,628 | | | | 8,129 | | | | 12,099 | | | | 9,822 | | | | 11,988 | | | | 18 | % | | | (20 | )% |
| | | | | | | | | | | | | | | | | | | | | | | | | | | | |
Ending balance (Restricted - $.7 million) (a) | | $ | 243,628 | | | $ | 247,246 | | | $ | 253,809 | | | $ | 255,710 | | | $ | 261,934 | | | | (1 | )% | | | (7 | )% |
| | | | | | | | | | | | | | | | | | | | | | | | | | | | |
Reserve for unfunded commitments | | | 2,209 | | | | 2,882 | | | | 3,017 | | | | 2,956 | | | | 2,976 | | | | (23 | )% | | | (26 | )% |
Total allowance for loan losses plus reserve for unfunded commitments | | $ | 245,837 | | | $ | 250,128 | | | $ | 256,826 | | | $ | 258,666 | | | $ | 264,910 | | | | (2 | )% | | | (7 | )% |
| | | | | | | | | | | | | | | | | | | | | | | | | | | | |
| | | | | | | |
Allowance for Loan Losses | | | | | | | | | | | | | | | | | | | | | | | | | | | | |
Regional Banking | | $ | 131,801 | | | $ | 128,234 | | | $ | 121,027 | | | $ | 125,440 | | | $ | 124,627 | | | | 3 | % | | | 6 | % |
Non-Strategic | | | 111,827 | | | | 119,012 | | | | 132,782 | | | | 130,270 | | | | 137,307 | | | | (6 | )% | | | (19 | )% |
Corporate (b) | | | NM | | | | NM | | | | NM | | | | NM | | | | NM | | | | NM | | | | NM | |
| | | | | | | | | | | | | | | | | | | | | | | | | | | | |
Total allowance for loan losses | | $ | 243,628 | | | $ | 247,246 | | | $ | 253,809 | | | $ | 255,710 | | | $ | 261,934 | | | | (1 | )% | | | (7 | )% |
| | | | | | | | | | | | | | | | | | | | | | | | | | | | |
| | | | | | | |
Nonperforming Assets | | | | | | | | | | | | | | | | | | | | | | | | | | | | |
Regional Banking | | | | | | | | | | | | | | | | | | | | | | | | | | | | |
Nonperforming loans | | $ | 89,191 | | | $ | 83,275 | | | $ | 87,324 | | | $ | 118,507 | | | $ | 135,902 | | | | 7 | % | | | (34 | )% |
Foreclosed real estate (c) | | | 26,598 | | | | 27,705 | | | | 28,806 | | | | 33,594 | | | | 34,561 | | | | (4 | )% | | | (23 | )% |
| | | | | | | | | | | | | | | | | | | | | | | | | | | | |
Total Regional Banking | | $ | 115,789 | | | $ | 110,980 | | | $ | 116,130 | | | $ | 152,101 | | | $ | 170,463 | | | | 4 | % | | | (32 | )% |
| | | | | | | | | | | | | | | | | | | | | | | | | | | | |
Non-Strategic | | | | | | | | | | | | | | | | | | | | | | | | | | | | |
Nonperforming loans (d) | | $ | 138,789 | | | $ | 153,972 | | | $ | 163,104 | | | $ | 164,534 | | | $ | 173,705 | | | | (10 | )% | | | (20 | )% |
Nonperforming loans held-for-sale after fair value adjustments (e) | | | 69,184 | | | | 61,631 | | | | 61,139 | | | | 65,972 | | | | 67,077 | | | | 12 | % | | | 3 | % |
Foreclosed real estate (c) | | | 12,183 | | | | 15,265 | | | | 16,947 | | | | 16,437 | | | | 16,781 | | | | (20 | )% | | | (27 | )% |
| | | | | | | | | | | | | | | | | | | | | | | | | | | | |
Total Non-Strategic | | $ | 220,156 | | | $ | 230,868 | | | $ | 241,190 | | | $ | 246,943 | | | $ | 257,563 | | | | (5 | )% | | | (15 | )% |
| | | | | | | | | | | | | | | | | | | | | | | | | | | | |
Corporate | | | | | | | | | | | | | | | | | | | | | | | | | | | | |
Nonperforming loans | | $ | 3,636 | | | $ | 3,672 | | | $ | 4,598 | | | $ | 5,001 | | | $ | 4,526 | | | | (1 | )% | | | (20 | )% |
| | | | | | | | | | | | | | | | | | | | | | | | | | | | |
Total nonperforming assets | | $ | 339,581 | | | $ | 345,520 | | | $ | 361,918 | | | $ | 404,045 | | | $ | 432,552 | | | | (2 | )% | | | (21 | )% |
| | | | | | | | | | | | | | | | | | | | | | | | | | | | |
| | | | | | | |
Net Charge-Offs | | | | | | | | | | | | | | | | | | | | | | | | | | | | |
Regional Banking | | $ | 4,858 | | | $ | 5,783 | | | $ | 6,997 | | | $ | 4,347 | | | $ | 8,735 | | | | (16 | )% | | | (44 | )% |
Non-Strategic | | | 3,760 | | | | 10,780 | | | | 9,904 | | | | 11,877 | | | | 9,549 | | | | (65 | )% | | | (61 | )% |
| | | | | | | | | | | | | | | | | | | | | | | | | | | | |
Total net charge-offs | | $ | 8,618 | | | $ | 16,563 | | | $ | 16,901 | | | $ | 16,224 | | | $ | 18,284 | | | | (48 | )% | | | (53 | )% |
| | | | | | | | | | | | | | | | | | | | | | | | | | | | |
| | | | | | | |
Consolidated Key Ratios (f) | | | | | | | | | | | | | | | | | | | | | | | | | | | | |
NPL % | | | 1.47 | % | | | 1.59 | % | | | 1.66 | % | | | 1.87 | % | | | 1.94 | % | | | | | | | | |
NPA % | | | 1.71 | | | | 1.87 | | | | 1.95 | | | | 2.19 | | | | 2.25 | | | | | | | | | |
Net charge-offs % | | | 0.22 | | | | 0.45 | | | | 0.44 | | | | 0.41 | | | | 0.46 | | | | | | | | | |
Allowance / loans | | | 1.54 | | | | 1.64 | | | | 1.65 | | | | 1.66 | | | | 1.62 | | | | | | | | | |
Allowance / NPL | | | 1.05x | | | | 1.03x | | | | 1.00x | | | | 0.89x | | | | 0.83x | | | | | | | | | |
Allowance / NPA | | | 0.90x | | | | 0.87x | | | | 0.84x | | | | 0.76x | | | | 0.72x | | | | | | | | | |
Allowance / charge-offs | | | 7.05x | | | | 3.68x | | | | 3.79x | | | | 3.97x | | | | 3.57x | | | | | | | | | |
| | | | | | | | | | | | | | | | | | | | | | | | | | | | |
| | | | | | | |
Other | | | | | | | | | | | | | | | | | | | | | | | | | | | | |
Loans past due 90 days or more (g) | | | 68,369 | | | $ | 63,747 | | | $ | 69,863 | | | $ | 75,109 | | | $ | 65,367 | | | | 7 | % | | | 5 | % |
Guaranteed portion (g) | | | 32,782 | | | | 35,063 | | | | 35,260 | | | | 37,509 | | | | 33,483 | | | | (7 | )% | | | (2 | )% |
Foreclosed real estate from government insured loans | | | 18,771 | | | | 23,065 | | | | 25,809 | | | | 21,596 | | | | 18,559 | | | | (19 | )% | | | 1 | % |
Period-end loans, net of unearned income (millions) | | | 15,796 | | | | 15,119 | | | | 15,389 | | | | 15,409 | | | | 16,198 | | | | 4 | % | | | (2 | )% |
NM - Not meaningful
| * | Amount is less than one percent. |
| (a) | Restricted balances parenthetically presented are as of June 30, 2014. |
| (b) | The valuation adjustment taken upon exercise of clean-up calls included expected losses. |
| (c) | Excludes foreclosed real estate from government-insured mortgages. |
| (d) | 2Q14 decrease is primarily related to the TRUPS sale. |
| (e) | 2Q14 increase is related to fair value adjustments. |
| (f) | See Glossary of Terms for definitions of Consolidated Key Ratios. |
| (g) | Includes loans held-for-sale. |
17
FHN ASSET QUALITY: CONSOLIDATED
Quarterly, Unaudited
| | | | | | | | | | | | | | | | | | | | | | | | | | | | |
| | | | | | | | | | | | | | | | | | 2Q14 Changes vs. | |
| | | 2Q14 | | | 1Q14 | | | 4Q13 | | | 3Q13 | | | 2Q13 | | | 1Q14 | | | 2Q13 | |
| | | | | | | |
Key Portfolio Details | | | | | | | | | | | | | | | | | | | | | | | | | | | | |
C&I | | | | | | | | | | | | | | | | | | | | | | | | | | | | |
Period-end loans ($ millions) | | $ | 8,403 | | | $ | 7,753 | | | $ | 7,924 | | | $ | 7,747 | | | $ | 8,368 | | | | 8 | % | | | | * |
| | | | | | | | | | | | | | | | | | | | | | | | | | | | |
30+ Delinq. % (a) | | | 0.19 | % | | | 0.27 | % | | | 0.13 | % | | | 0.11 | % | | | 0.13 | % | | | | | | | | |
NPL % | | | 0.58 | | | | 0.68 | | | | 1.01 | | | | 1.33 | | | | 1.45 | | | | | | | | | |
Charge-offs % (qtr. annualized) | | | 0.20 | | | | 0.22 | | | | 0.21 | | | | 0.08 | | | | 0.14 | | | | | | | | | |
| | | | | | | | | | | | | | | | | | | | | | | | | | | | |
Allowance / loans % | | | 0.82 | % | | | 0.94 | % | | | 1.09 | % | | | 1.18 | % | | | 1.12 | % | | | | | | | | |
Allowance / charge-offs | | | 4.35x | | | | 4.27x | | | | 5.33x | | | | 14.16x | | | | 8.34x | | | | | | | | | |
| | | | | | | | | | | | | | | | | | | | | | | | | | | | |
| | | | | | | |
Commercial Real Estate | | | | | | | | | | | | | | | | | | | | | | | | | | | | |
Period-end loans ($ millions) | | $ | 1,232 | | | $ | 1,152 | | | $ | 1,133 | | | $ | 1,174 | | | $ | 1,219 | | | | 7 | % | | | 1 | % |
| | | | | | | | | | | | | | | | | | | | | | | | | | | | |
30+ Delinq. % (a) | | | 1.10 | % | | | 1.61 | % | | | 0.90 | % | | | 0.60 | % | | | 0.54 | % | | | | | | | | |
NPL % | | | 1.14 | | | | 1.30 | | | | 1.60 | | | | 2.13 | | | | 2.74 | | | | | | | | | |
Charge-offs % (qtr. annualized) | | | NM | | | | 0.12 | | | | NM | | | | NM | | | | NM | | | | | | | | | |
| | | | | | | | | | | | | | | | | | | | | | | | | | | | |
Allowance / loans % | | | 1.28 | % | | | 1.35 | % | | | 0.94 | % | | | 0.94 | % | | | 1.14 | % | | | | | | | | |
Allowance / charge-offs | | | NM | | | | 10.97x | | | | NM | | | | NM | | | | NM | | | | | | | | | |
| | | | | | | | | | | | | | | | | | | | | | | | | | | | |
| | | | | | | |
Consumer Real Estate | | | | | | | | | | | | | | | | | | | | | | | | | | | | |
Period-end loans ($ millions) | | $ | 5,219 | | | $ | 5,258 | | | $ | 5,333 | | | $ | 5,458 | | | $ | 5,549 | | | | (1 | )% | | | (6 | )% |
| | | | | | | | | | | | | | | | | | | | | | | | | | | | |
30+ Delinq. % (a) | | | 0.93 | % | | | 1.01 | % | | | 1.13 | % | | | 1.05 | % | | | 1.10 | % | | | | | | | | |
NPL % | | | 2.51 | | | | 2.51 | | | | 2.20 | | | | 2.23 | | | | 2.15 | | | | | | | | | |
Charge-offs % (qtr. annualized) | | | 0.20 | | | | 0.56 | | | | 0.62 | | | | 0.87 | | | | 0.96 | | | | | | | | | |
| | | | | | | | | | | | | | | | | | | | | | | | | | | | |
Allowance / loans % | | | 2.26 | % | | | 2.35 | % | | | 2.38 | % | | | 2.21 | % | | | 2.18 | % | | | | | | | | |
Allowance / charge-offs | | | 11.30x | | | | 4.17x | | | | 3.79x | | | | 2.54x | | | | 2.26x | | | | | | | | | |
| | | | | | | | | | | | | | | | | | | | | | | | | | | | |
| | | | | | | |
Permanent Mortgage | | | | | | | | | | | | | | | | | | | | | | | | | | | | |
Period-end loans ($ millions) | | $ | 594 | | | $ | 622 | | | $ | 662 | | | $ | 698 | | | $ | 746 | | | | (5 | )% | | | (20 | )% |
| | | | | | | | | | | | | | | | | | | | | | | | | | | | |
30+ Delinq. % (a) | | | 1.71 | % | | | 1.44 | % | | | 2.62 | % | | | 2.48 | % | | | 2.51 | % | | | | | | | | |
NPL % | | | 6.23 | | | | 6.46 | | | | 5.76 | | | | 5.30 | | | | 5.14 | | | | | | | | | |
Charge-offs % (qtr. annualized) | | | 0.12 | | | | 1.04 | | | | 1.46 | | | | 0.29 | | | | 0.62 | | | | | | | | | |
| | | | | | | | | | | | | | | | | | | | | | | | | | | | |
Allowance / loans % | | | 3.99 | % | | | 3.62 | % | | | 3.40 | % | | | 3.66 | % | | | 3.63 | % | | | | | | | | |
Allowance / charge-offs | | | 31.85x | | | | 3.39x | | | | 2.27x | | | | 12.26x | | | | 5.64x | | | | | | | | | |
| | | | | | | | | | | | | | | | | | | | | | | | | | | | |
| | | | | | | |
Credit Card and Other | | | | | | | | | | | | | | | | | | | | | | | | | | | | |
Period-end loans ($ millions) | | $ | 348 | | | $ | 334 | | | $ | 337 | | | $ | 332 | | | $ | 316 | | | | 4 | % | | | 10 | % |
| | | | | | | | | | | | | | | | | | | | | | | | | | | | |
30+ Delinq. % (a) | | | 1.39 | % | | | 1.30 | % | | | 1.35 | % | | | 1.11 | % | | | 1.00 | % | | | | | | | | |
NPL % | | | 0.39 | | | | 0.42 | | | | 0.42 | | | | 0.42 | | | | 0.54 | | | | | | | | | |
Charge-offs % (qtr. annualized) | | | 3.35 | | | | 3.71 | | | | 3.05 | | | | 2.61 | | | | 2.22 | | | | | | | | | |
| | | | | | | | | | | | | | | | | | | | | | | | | | | | |
Allowance / loans % | | | 5.01 | % | | | 3.91 | % | | | 2.22 | % | | | 2.09 | % | | | 2.07 | % | | | | | | | | |
Allowance / charge-offs | | | 1.51x | | | | 1.05x | | | | 0.73x | | | | 0.82x | | | | 0.97x | | | | | | | | | |
| | | | | | | | | | | | | | | | | | | | | | | | | | | | |
NM - Not meaningful
| * | Amount is less than one percent. |
| (a) | 30+ Delinquency % includes all accounts delinquent more than one month and still accruing interest. |
18
FHN ASSET QUALITY: REGIONAL BANKING
Quarterly, Unaudited
| | | | | | | | | | | | | | | | | | | | | | | | | | | | |
| | | | | | | | | | | | | | | | | | 2Q14 Changes vs. | |
| | | 2Q14 | | | 1Q14 | | | 4Q13 | | | 3Q13 | | | 2Q13 | | | 1Q14 | | | 2Q13 | |
| | | | | | |
Total Regional Banking | | | | | | | | | | | | | | | | | | | | | | | | |
Period-end loans ($ millions) | | $ | 12,853 | | | $ | 12,042 | | | $ | 12,167 | | | $ | 12,039 | | | $ | 12,634 | | | | 7 | % | | | 2 | % |
| | | | | | | | | | | | | | | | | | | | | | | | | | | | |
30+ Delinq. % (a) | | | 0.43 | % | | | 0.52 | % | | | 0.38 | % | | | 0.35 | % | | | 0.31 | % | | | | | | | | |
NPL % | | | 0.69 | | | | 0.69 | | | | 0.72 | | | | 0.98 | | | | 1.08 | | | | | | | | | |
Charge-offs % (qtr. annualized) | | | 0.16 | | | | 0.20 | | | | 0.23 | | | | 0.14 | | | | 0.29 | | | | | | | | | |
| | | | | | | | | | | | | | | | | | | | | | | | | | | | |
Allowance / loans % | | | 1.03 | % | | | 1.06 | % | | | 0.99 | % | | | 1.04 | % | | | 0.99 | % | | | | | | | | |
Allowance / charge-offs | | | 6.76x | | | | 5.47x | | | | 4.36x | | | | 7.27x | | | | 3.56x | | | | | | | | | |
| | | | | | | | | | | | | | | | | | | | | | | | | | | | |
| | | | | | | |
Key Portfolio Details | | | | | | | | | | | | | | | | | | | | | | | | | | | | |
C&I | | | | | | | | | | | | | | | | | | | | | | | | | | | | |
Period-end loans ($ millions) | | $ | 7,947 | | | $ | 7,287 | | | $ | 7,431 | | | $ | 7,254 | | | $ | 7,865 | | | | 9 | % | | | 1 | % |
| | | | | | | | | | | | | | | | | | | | | | | | | | | | |
30+ Delinq. % (a) | | | 0.20 | % | | | 0.26 | % | | | 0.14 | % | | | 0.12 | % | | | 0.13 | % | | | | | | | | |
NPL % | | | 0.57 | | | | 0.55 | | | | 0.59 | | | | 0.92 | | | | 0.96 | | | | | | | | | |
Charge-offs % (qtr. annualized) | | | 0.09 | | | | 0.07 | | | | 0.24 | | | | 0.07 | | | | 0.27 | | | | | | | | | |
| | | | | | | | | | | | | | | | | | | | | | | | | | | | |
Allowance / loans % | | | 0.84 | % | | | 0.93 | % | | | 0.97 | % | | | 1.06 | % | | | 0.99 | % | | | | | | | | |
Allowance / charge-offs | | | 10.12x | | | | 13.74x | | | | 4.24x | | | | 15.09x | | | | 3.81x | | | | | | | | | |
| | | | | | | | | | | | | | | | | | | | | | | | | | | | |
| | | | | | | |
Commercial Real Estate | | | | | | | | | | | | | | | | | | | | | | | | | | | | |
Period-end loans ($ millions) | | $ | 1,226 | | | $ | 1,145 | | | $ | 1,124 | | | $ | 1,164 | | | $ | 1,202 | | | | 7 | % | | | 2 | % |
| | | | | | | | | | | | | | | | | | | | | | | | | | | | |
30+ Delinq. % (a) (b) | | | 1.10 | % | | | 1.62 | % | | | 0.91 | % | | | 0.61 | % | | | 0.55 | % | | | | | | | | |
NPL % | | | 1.06 | | | | 1.05 | | | | 1.35 | | | | 1.87 | | | | 2.38 | | | | | | | | | |
Charge-offs % (qtr. annualized) | | | NM | | | | 0.10 | | | | NM | | | | NM | | | | NM | | | | | | | | | |
| | | | | | | | | | | | | | | | | | | | | | | | | | | | |
Allowance / loans % | | | 1.25 | % | | | 1.31 | % | | | 0.88 | % | | | 0.88 | % | | | 1.03 | % | | | | | | | | |
Allowance / charge-offs | | | NM | | | | 13.38x | | | | NM | | | | NM | | | | NM | | | | | | | | | |
| | | | | | | | | | | | | | | | | | | | | | | | | | | | |
| | | | | | | |
Consumer Real Estate | | | | | | | | | | | | | | | | | | | | | | | | | | | | |
Period-end loans ($ millions) | | $ | 3,334 | | | $ | 3,280 | | | $ | 3,278 | | | $ | 3,291 | | | $ | 3,253 | | | | 2 | % | | | 2 | % |
| | | | | | | | | | | | | | | | | | | | | | | | | | | | |
30+ Delinq. % (a) | | | 0.64 | % | | | 0.62 | % | | | 0.65 | % | | | 0.66 | % | | | 0.58 | % | | | | | | | | |
NPL % | | | 0.90 | | | | 0.92 | | | | 0.85 | | | | 0.90 | | | | 0.97 | | | | | | | | | |
Charge-offs % (qtr. annualized) | | | 0.18 | | | | 0.18 | | | | 0.12 | | | | 0.14 | | | | 0.31 | | | | | | | | | |
| | | | | | | | | | | | | | | | | | | | | | | | | | | | |
Allowance / loans % | | | 0.97 | % | | | 0.99 | % | | | 0.96 | % | | | 0.95 | % | | | 0.87 | % | | | | | | | | |
Allowance / charge-offs | | | 5.32x | | | | 5.42x | | | | 7.72x | | | | 6.84x | | | | 2.85x | | | | | | | | | |
| | | | | | | | | | | | | | | | | | | | | | | | | | | | |
| | | | | | | |
Credit Card, Permanent Mortgage, and Other | | | | | | | | | | | | | | | | | | | | | | | | | | | | |
Period-end loans ($ millions) | | $ | 346 | | | $ | 330 | | | $ | 334 | | | $ | 330 | | | $ | 314 | | | | 5 | % | | | 10 | % |
| | | | | | | | | | | | | | | | | | | | | | | | | | | | |
30+ Delinq. % (a) | | | 1.43 | % | | | 1.38 | % | | | 1.55 | % | | | 1.29 | % | | | 1.14 | % | | | | | | | | |
NPL % | | | 0.14 | | | | 0.27 | | | | 0.16 | | | | 0.20 | | | | 0.20 | | | | | | | | | |
Charge-offs % (qtr. annualized) | | | 3.05 | | | | 3.43 | | | | 2.92 | | | | 2.52 | | | | 2.03 | | | | | | | | | |
| | | | | | | | | | | | | | | | | | | | | | | | | | | | |
Allowance / loans % | | | 4.98 | % | | | 3.91 | % | | | 2.21 | % | | | 2.04 | % | | | 2.02 | % | | | | | | | | |
Allowance / charge-offs | | | 1.64x | | | | 1.13x | | | | 0.76x | | | | 0.83x | | | | 1.03x | | | | | | | | | |
| | | | | | | | | | | | | | | | | | | | | | | | | | | | |
| | | | | | | |
| ASSET QUALITY: CORPORATE | | | | | | | | | | | | | | | | | | | | | | | | | | | | |
| | | | | | | |
Permanent Mortgage | | | | | | | | | | | | | | | | | | | | | | | | | | | | |
Period-end loans ($ millions) | | $ | 155 | | | $ | 164 | | | $ | 175 | | | $ | 185 | | | $ | 205 | | | | (5 | )% | | | (24 | )% |
| | | | | | | | | | | | | | | | | | | | | | | | | | | | |
30+ Delinq. % (a) | | | 1.91 | % | | | 1.83 | % | | | 2.34 | % | | | 2.05 | % | | | 1.83 | % | | | | | | | | |
NPL % | | | 2.34 | | | | 2.24 | | | | 2.63 | | | | 2.70 | | | | 2.21 | | | | | | | | | |
Charge-offs % (qtr. annualized) | | | NM | | | | NM | | | | NM | | | | NM | | | | NM | | | | | | | | | |
| | | | | | | | | | | | | | | | | | | | | | | | | | | | |
Allowance / loans % | | | NM | | | | NM | | | | NM | | | | NM | | | | NM | | | | | | | | | |
Allowance / charge-offs | | | NM | | | | NM | | | | NM | | | | NM | | | | NM | | | | | | | | | |
| | | | | | | | | | | | | | | | | | | | | | | | | | | | |
NM - Not meaningful
| * | Amount is less than one percent. |
| (a) | 30+ Delinquency % includes all accounts delinquent more than one month and still accruing interest. |
| (b) | 1Q14 increase is primarily driven by 2 purchase credit impaired loans acquired from MNB. |
19
FHN ASSET QUALITY: NON-STRATEGIC
Quarterly, Unaudited
| | | | | | | | | | | | | | | | | | | | | | | | | | | | |
| | | | | | | | | | | | | | | | | | 2Q14 Changes vs. | |
| | | 2Q14 | | | 1Q14 | | | 4Q13 | | | 3Q13 | | | 2Q13 | | | 1Q14 | | | 2Q13 | |
| | | | | | |
Total Non-Strategic | | | | | | | | | | | | | | | | | | | | | | | | |
Period-end loans ($ millions) | | $ | 2,788 | | | $ | 2,913 | | | $ | 3,047 | | | $ | 3,185 | | | $ | 3,359 | | | | (4 | )% | | | (17 | )% |
| | | | | | | | | | | | | | | | | | | | | | | | | | | | |
30+ Delinq. % (a) | | | 1.24 | % | | | 1.38 | % | | | 1.70 | % | | | 1.53 | % | | | 1.70 | % | | | | | | | | |
NPL % (b) | | | 4.98 | | | | 5.28 | | | | 5.35 | | | | 5.17 | | | | 5.17 | | | | | | | | | |
Charge-offs % (qtr. annualized) | | | 0.53 | | | | 1.46 | | | | 1.26 | | | | 1.44 | | | | 1.11 | | | | | | | | | |
| | | | | | | | | | | | | | | | | | | | | | | | | | | | |
Allowance / loans % | | | 4.01 | % | | | 4.08 | % | | | 4.36 | % | | | 4.09 | % | | | 4.09 | % | | | | | | | | |
Allowance / charge-offs | | | 7.41x | | | | 2.72x | | | | 3.38x | | | | 2.76x | | | | 3.58x | | | | | | | | | |
| | | | | | | | | | | | | | | | | | | | | | | | | | | | |
| | | | | | | |
Key Portfolio Details | | | | | | | | | | | | | | | | | | | | | | | | | | | | |
C&I | | | | | | | | | | | | | | | | | | | | | | | | | | | | |
Period-end loans ($ millions) | | $ | 456 | | | $ | 466 | | | $ | 492 | | | $ | 493 | | | $ | 503 | | | | (2 | )% | | | (9 | )% |
| | | | | | | | | | | | | | | | | | | | | | | | | | | | |
30+ Delinq. % (a) | | | 0.02 | % | | | 0.43 | % | | | 0.06 | % | | | 0.04 | % | | | 0.04 | % | | | | | | | | |
NPL % (b) | | | 0.58 | | | | 2.64 | | | | 7.33 | | | | 7.36 | | | | 9.13 | | | | | | | | | |
Charge-offs % (qtr. annualized) | | | 1.99 | | | | 2.48 | | | | NM | | | | 0.27 | | | | NM | | | | | | | | | |
| | | | | | | | | | | | | �� | | | | | | | | | | | | | | | |
Allowance / loans % | | | 0.38 | % | | | 1.02 | % | | | 2.87 | % | | | 2.89 | % | | | 3.14 | % | | | | | | | | |
Allowance / charge-offs | | | 0.19x | | | | 0.39x | | | | NM | | | | 10.61x | | | | NM | | | | | | | | | |
| | | | | | | | | | | | | | | | | | | | | | | | | | | | |
| | | | | | | |
Commercial Real Estate | | | | | | | | | | | | | | | | | | | | | | | | | | | | |
Period-end loans ($ millions) | | $ | 5 | | | $ | 7 | | | $ | 9 | | | $ | 10 | | | $ | 16 | | | | (29 | )% | | | (69 | )% |
| | | | | | | | | | | | | | | | | | | | | | | | | | | | |
30+ Delinq. % (a) | | | — | % | | | — | % | | | — | % | | | — | % | | | — | % | | | | | | | | |
NPL % | | | 19.34 | | | | 40.93 | | | | 32.30 | | | | 32.16 | | | | 29.38 | | | | | | | | | |
Charge-offs % (qtr. annualized) | | | NM | | | | 3.46 | | | | 3.72 | | | | 1.74 | | | | NM | | | | | | | | | |
| | | | | | | | | | | | | | | | | | | | | | | | | | | | |
Allowance / loans % | | | 9.41 | % | | | 7.43 | % | | | 7.98 | % | | | 7.55 | % | | | 9.56 | % | | | | | | | | |
Allowance / charge-offs | | | NM | | | | 1.80 x | | | | 2.00 x | | | | 2.93 x | | | | NM | | | | | | | | | |
| | | | | | | | | | | | | | | | | | | | | | | | | | | | |
| | | | | | | |
Consumer Real Estate | | | | | | | | | | | | | | | | | | | | | | | | | | | | |
Period-end loans ($ millions) | | $ | 1,885 | | | $ | 1,978 | | | $ | 2,055 | | | $ | 2,167 | | | $ | 2,297 | | | | (5 | )% | | | (18 | )% |
| | | | | | | | | | | | | | | | | | | | | | | | | | | | |
30+ Delinq. % (a) | | | 1.45 | % | | | 1.65 | % | | | 1.89 | % | | | 1.64 | % | | | 1.84 | % | | | | | | | | |
NPL % | | | 5.35 | | | | 5.14 | | | | 4.36 | | | | 4.26 | | | | 3.84 | | | | | | | | | |
Charge-offs % (qtr. annualized) | | | 0.23 | | | | 1.17 | | | | 1.39 | | | | 1.93 | | | | 1.84 | | | | | | | | | |
| | | | | | | | | | | | | | | | | | | | | | | | | | | | |
Allowance / loans % | | | 4.54 | % | | | 4.60 | % | | | 4.64 | % | | | 4.13 | % | | | 4.03 | % | | | | | | | | |
Allowance / charge-offs | | | 19.65x | | | | 3.86x | | | | 3.25x | | | | 2.08x | | | | 2.12x | | | | | | | | | |
| | | | | | | | | | | | | | | | | | | | | | | | | | | | |
| | | | | | | |
Permanent Mortgage | | | | | | | | | | | | | | | | | | | | | | | | | | | | |
Period-end loans ($ millions) | | $ | 427 | | | $ | 446 | | | $ | 475 | | | $ | 499 | | | $ | 527 | | | | (4 | )% | | | (19 | )% |
| | | | | | | | | | | | | | | | | | | | | | | | | | | | |
30+ Delinq. % (a) | | | 1.59 | % | | | 1.21 | % | | | 2.59 | % | | | 2.55 | % | | | 2.70 | % | | | | | | | | |
NPL % | | | 7.71 | | | | 7.99 | | | | 6.96 | | | | 6.28 | | | | 6.31 | | | | | | | | | |
Charge-offs % (qtr. annualized) | | | 0.15 | | | | 1.46 | | | | 2.04 | | | | 0.41 | | | | 0.89 | | | | | | | | | |
| | | | | | | | | | | | | | | | | | | | | | | | | | | | |
Allowance / loans % | | | 5.52 | % | | | 5.00 | % | | | 4.68 | % | | | 5.07 | % | | | 5.10 | % | | | | | | | | |
Allowance / charge-offs | | | 35.18x | | | | 3.36x | | | | 2.25x | | | | 12.14x | | | | 5.58x | | | | | | | | | |
| | | | | | | | | | | | | | | | | | | | | | | | | | | | |
| | | | | | | |
Other Consumer | | | | | | | | | | | | | | | | | | | | | | | | | | | | |
Period-end loans ($ millions) | | $ | 15 | | | $ | 16 | | | $ | 16 | | | $ | 16 | | | $ | 16 | | | | (6 | )% | | | (6 | )% |
| | | | | | | | | | | | | | | | | | | | | | | | | | | | |
30+ Delinq. % (a) | | | 1.79 | % | | | 1.95 | % | | | 2.33 | % | | | 1.63 | % | | | 1.99 | % | | | | | | | | |
NPL % | | | 9.16 | | | | 9.03 | | | | 8.66 | | | | 8.53 | | | | 10.02 | | | | | | | | | |
Charge-offs % (qtr. annualized) | | | 7.81 | | | | 6.83 | | | | 3.35 | | | | 2.12 | | | | 3.72 | | | | | | | | | |
| | | | | | | | | | | | | | | | | | | | | | | | | | | | |
Allowance / loans % | | | 2.94 | % | | | 2.12 | % | | | 2.25 | % | | | 3.06 | % | | | 2.85 | % | | | | | | | | |
Allowance / charge-offs | | | 0.36x | | | | 0.30x | | | | 0.66x | | | | 1.41x | | | | 0.75x | | | | | | | | | |
| | | | | | | | | | | | | | | | | | | | | | | | | | | | |
NM - Not meaningful
| * | Amount is less than one percent. |
| (a) | 30+ Delinquency % includes all accounts delinquent more than one month and still accruing interest. |
| (b) | 2Q14 and 1Q14 NPL decrease related to TRUPS sales. |
20
FHN: PORTFOLIO METRICS
Unaudited
C&I Portfolio: $8.4 Billion (53.2% of Total Loans) as of June 30, 2014
| | | | |
| | | % OS | |
General Corporate, Commercial, and Business Banking Loans | | | 82 | % |
Loans to Mortgage Companies | | | 13 | % |
Trust Preferred Loans | | | 4 | % |
Bank Holding Company Loans | | | 1 | % |
Consumer Real Estate (primarily Home Equity) Portfolio: $5.2 Billion (33.0% of Total Loans)
| | | | | | | | | | | | | | | | |
| Origination LTV and FICO for Portfolio as of June 30, 2014 | | Loan-to-Value | |
(excludes whole loan insurance) | | <=60% | | | >60% - <=80% | | | >80% - 90% | | | >90% | |
FICO score greater than or equal to 740 | | | 11 | % | | | 23 | % | | | 17 | % | | | 9 | % |
FICO score 720-739 | | | 2 | % | | | 4 | % | | | 4 | % | | | 2 | % |
FICO score 700-719 | | | 1 | % | | | 4 | % | | | 4 | % | | | 2 | % |
FICO score 660-699 | | | 2 | % | | | 4 | % | | | 3 | % | | | 3 | % |
FICO score 620-659 | | | - | % | | | 1 | % | | | 1 | % | | | 1 | % |
FICO score less than 620 | | | - | % | | | 1 | % | | | - | % | | | 1 | % |
| | | | | | | | | | | | | | | | |
| Origination LTV and FICO for Portfolio - Regional Bank as of June 30, 2014 | | Loan-to-Value | |
(excludes whole loan insurance) | | <=60% | | | >60% - <=80% | | | >80% - 90% | | | >90% | |
FICO score greater than or equal to 740 | | | 12 | % | | | 24 | % | | | 18 | % | | | 11 | % |
FICO score 720-739 | | | 1 | % | | | 3 | % | | | 3 | % | | | 3 | % |
FICO score 700-719 | | | 1 | % | | | 3 | % | | | 2 | % | | | 2 | % |
FICO score 660-699 | | | 1 | % | | | 4 | % | | | 3 | % | | | 2 | % |
FICO score 620-659 | | | 1 | % | | | 1 | % | | | 1 | % | | | 1 | % |
FICO score less than 620 | | | - | % | | | 1 | % | | | 1 | % | | | 1 | % |
| | | | | | | | | | | | | | | | |
| Origination LTV and FICO for Portfolio - Non-Strategic as of June 30, 2014 | | Loan-to-Value | |
(excludes whole loan insurance) | | <=60% | | | >60% - <=80% | | | >80% - 90% | | | >90% | |
FICO score greater than or equal to 740 | | | 8 | % | | | 21 | % | | | 15 | % | | | 5 | % |
FICO score 720-739 | | | 2 | % | | | 6 | % | | | 6 | % | | | 2 | % |
FICO score 700-719 | | | 2 | % | | | 5 | % | | | 7 | % | | | 2 | % |
FICO score 660-699 | | | 2 | % | | | 5 | % | | | 4 | % | | | 3 | % |
FICO score 620-659 | | | - | % | | | 1 | % | | | 1 | % | | | 1 | % |
FICO score less than 620 | | | - | % | | | - | % | | | - | % | | | 2 | % |
Consumer Real Estate Portfolio Detail:
| | | | | | | | | | | | | | | | | | | | | | | | |
| | | | | | Origination Characteristics | |
Vintage | | Balances ($B) | | | W/A Age (mo.) | | | CLTV | | | FICO | | | % TN | | | % 1st lien | |
pre-2003 | | $ | 0.1 | | | | 150 | | | | 78 | % | | | 703 | | | | 43 | % | | | 31 | % |
2003 | | $ | 0.2 | | | | 132 | | | | 76 | % | | | 720 | | | | 31 | % | | | 38 | % |
2004 | | $ | 0.4 | | | | 119 | | | | 80 | % | | | 722 | | | | 20 | % | | | 27 | % |
2005 | | $ | 0.6 | | | | 107 | | | | 81 | % | | | 729 | | | | 17 | % | | | 16 | % |
2006 | | $ | 0.5 | | | | 96 | | | | 78 | % | | | 732 | | | | 21 | % | | | 17 | % |
2007 | | $ | 0.6 | | | | 84 | | | | 80 | % | | | 736 | | | | 26 | % | | | 19 | % |
2008 | | $ | 0.3 | | | | 73 | | | | 75 | % | | | 745 | | | | 72 | % | | | 50 | % |
2009 | | $ | 0.1 | | | | 61 | | | | 72 | % | | | 749 | | | | 87 | % | | | 56 | % |
2010 | | $ | 0.2 | | | | 47 | | | | 81 | % | | | 751 | | | | 92 | % | | | 73 | % |
2011 | | $ | 0.4 | | | | 35 | | | | 77 | % | | | 760 | | | | 90 | % | | | 86 | % |
2012 | | $ | 0.8 | | | | 24 | | | | 77 | % | | | 763 | | | | 89 | % | | | 91 | % |
2013 | | $ | 0.7 | | | | 13 | | | | 77 | % | | | 757 | | | | 86 | % | | | 84 | % |
2014 | | $ | 0.3 | | | | 3 | | | | 81 | % | | | 756 | | | | 87 | % | | | 86 | % |
Total | | $ | 5.2 | | | | 65 | | | | 78 | % | | | 743 | (a) | | | 57 | % | | | 53 | % |
| | | | | | | | | | | | | | | | | | | | | | | | |
| (a) | 743 average portfolio origination FICO; 736 weighted average portfolio FICO (refreshed). |
21
FHN NON-GAAP TO GAAP RECONCILIATION
Quarterly, Unaudited
| | | | | | | | | | | | | | | | | | | | |
(Thousands) | | 2Q14 | | | 1Q14 | | | 4Q13 | | | 3Q13 | | | 2Q13 | |
Tangible Common Equity (Non-GAAP) | | | | | | | | | | | | | | | | | | | | |
(A) Total equity (GAAP) | | $ | 2,626,151 | | | $ | 2,544,137 | | | $ | 2,500,751 | | | $ | 2,433,293 | | | $ | 2,546,408 | |
Less: Noncontrolling interest (a) | | | 295,431 | | | | 295,431 | | | | 295,431 | | | | 295,431 | | | | 295,431 | |
Less: Preferred stock | | | 95,624 | | | | 95,624 | | | | 95,624 | | | | 95,624 | | | | 95,624 | |
| | | | | | | | | | | | | | | | | | | | |
(B) Total common equity | | $ | 2,235,096 | | | $ | 2,153,082 | | | $ | 2,109,696 | | | $ | 2,042,238 | | | $ | 2,155,353 | |
Less: Intangible assets (GAAP) (b) | | | 161,968 | | | | 162,950 | | | | 163,931 | | | | 162,695 | | | | 163,623 | |
| | | | | | | | | | | | | | | | | | | | |
(C) Tangible common equity (Non-GAAP) | | $ | 2,073,128 | | | $ | 1,990,132 | | | $ | 1,945,765 | | | $ | 1,879,543 | | | $ | 1,991,730 | |
Less: Unrealized gains/(losses) on AFS securities, net of tax | | | 15,596 | | | | (1,762 | ) | | | (11,241 | ) | | | 11,153 | | | | 9,439 | |
| | | | | | | | | | | | | | | | | | | | |
(D) Adjusted tangible common equity (Non-GAAP) (c) | | $ | 2,057,532 | | | $ | 1,991,894 | | | $ | 1,957,006 | | | $ | 1,868,390 | | | $ | 1,982,291 | |
| | | | | | | | | | | | | | | | | | | | |
| | | | | |
Tangible Assets (Non-GAAP) | | | | | | | | | | | | | | | | | | | | |
(E) Total assets (GAAP) | | $ | 24,222,750 | | | $ | 23,941,989 | | | $ | 23,789,833 | | | $ | 23,858,753 | | | $ | 24,852,800 | |
Less: Intangible assets (GAAP) (b) | | | 161,968 | | | | 162,950 | | | | 163,931 | | | | 162,695 | | | | 163,623 | |
| | | | | | | | | | | | | | | | | | | | |
(F) Tangible assets (Non-GAAP) | | $ | 24,060,782 | | | $ | 23,779,039 | | | $ | 23,625,902 | | | $ | 23,696,058 | | | $ | 24,689,177 | |
| | | | | | | | | | | | | | | | | | | | |
| | | | | |
Period-end Shares Outstanding | | | | | | | | | | | | | | | | | | | | |
(G) Period-end shares outstanding | | | 237,147 | | | | 236,586 | | | | 236,370 | | | | 236,328 | | | | 240,555 | |
| | | | | | | | | | | | | | | | | | | | |
| | | | | |
Tier 1 Common (Non-GAAP) | | | | | | | | | | | | | | | | | | | | |
(H) Tier 1 capital (d) (e) | | $ | 2,751,933 | | | $ | 2,666,486 | | | $ | 2,618,976 | | | $ | 2,555,141 | | | $ | 2,712,399 | |
Less: Noncontrolling interest - FTBNA preferred stock (a) (f) | | | 294,816 | | | | 294,816 | | | | 294,816 | | | | 294,816 | | | | 294,816 | |
Less: Preferred Stock | | | 95,624 | | | | 95,624 | | | | 95,624 | | | | 95,624 | | | | 95,624 | |
Less: Trust preferred (g) | | | 200,000 | | | | 200,000 | | | | 200,000 | | | | 200,000 | | | | 200,000 | |
| | | | | | | | | | | | | | | | | | | | |
(I) Tier 1 common (Non-GAAP) | | $ | 2,161,493 | | | $ | 2,076,046 | | | $ | 2,028,536 | | | $ | 1,964,701 | | | $ | 2,121,959 | |
| | | | | | | | | | | | | | | | | | | | |
| | | | | |
Risk Weighted Assets | | | | | | | | | | | | | | | | | | | | |
(J) Risk weighted assets (d) (e) | | $ | 19,379,300 | | | $ | 18,694,719 | | | $ | 18,878,594 | | | $ | 19,236,794 | | | $ | 20,419,117 | |
| | | | | | | | | | | | | | | | | | | | |
| | | | | |
Ratios | | | | | | | | | | | | | | | | | | | | |
(C)/(F) Tangible common equity to tangible assets (“TCE/TA”) (Non-GAAP) | | | 8.62 | % | | | 8.37 | % | | | 8.24 | % | | | 7.93 | % | | | 8.07 | % |
(A)/(E) Total equity to total assets (GAAP) | | | 10.84 | % | | | 10.63 | % | | | 10.51 | % | | | 10.20 | % | | | 10.25 | % |
(C)/(G) Tangible book value per common share (Non-GAAP) | | $ | 8.74 | | | $ | 8.41 | | | $ | 8.23 | | | $ | 7.95 | | | $ | 8.28 | |
(B)/(G) Book value per common share (GAAP) | | $ | 9.42 | | | $ | 9.10 | | | $ | 8.93 | | | $ | 8.64 | | | $ | 8.96 | |
(I)/(J) Tier 1 common to risk weighted assets (Non-GAAP) (d) | | | 11.15 | % | | | 11.10 | % | | | 10.75 | % | | | 10.21 | % | | | 10.39 | % |
(H)/(E) Tier 1 capital to total assets (GAAP) (d) | | | 11.36 | % | | | 11.14 | % | | | 11.01 | % | | | 10.71 | % | | | 10.91 | % |
(D)/(J) Adjusted tangible common equity to risk weighted assets (“TCE/RWA”) (Non-GAAP) (c) (d) | | | 10.62 | % | | | 10.65 | % | | | 10.37 | % | | | 9.71 | % | | | 9.71 | % |
| | | | | | | | | | | | | | | | | | | | |
Certain previously reported amounts have been reclassified to agree with current presentation.
| (a) | Included in Total equity on the Consolidated Balance Sheet. |
| (b) | Includes goodwill and other intangible assets, net of amortization. |
| (c) | See Glossary of Terms for definition of ratio. |
| (d) | Current quarter is an estimate. |
| (e) | Defined by and calculated in conformity with bank regulations. |
| (f) | Represents FTBNA preferred stock included in noncontrolling interest. |
| (g) | Included in Term borrowings on the Consolidated Balance Sheet. |
22
FHN GLOSSARY OF TERMS
Adjusted Tangible Common Equity to Risk Weighted Assets:Common equity excluding intangible assets and unrealized gains/losses on available-for-sale securities divided by risk weighted assets.
Core Businesses:Management considers regional banking, capital markets, and corporate as FHN’s core businesses. Non-strategic has significant legacy assets and operations that are being wound down.
Purchase Credit Impaired (“PCI”) Loans:Acquired loans that have experienced deterioration of credit quality between origination and the time of acquisition and for which the timely collection of the interest and principal is no longer reasonably assured.
Troubled Debt Restructuring (“TDR”):A restructuring of debt whereby a creditor for economic or legal reasons related to the borrower’s financial difficulties grants a concession to the borrower that it would not otherwise consider. Such concession is granted in an attempt to protect as much of the creditor’s investment as possible by increasing the probability of repayment.
Key Ratios
Return on Average Assets:Ratio is annualized net income to average total assets.
Return on Average Common Equity: Ratio is annualized net income available to common shareholders to average common equity.
Fee Income to Total Revenue:Ratio is fee income excluding securities gains/(losses) to total revenue excluding securities gains/(losses).
Efficiency Ratio:Ratio is noninterest expense to total revenue excluding securities gains/(losses).
Asset Quality - Consolidated Key Ratios
NPL %:Ratio is nonperforming loans in the loan portfolio to total period-end loans.
NPA %: Ratio is nonperforming assets related to the loan portfolio to total period-end loans plus foreclosed real estate and other assets.
Net charge-offs %:Ratio is annualized net charge-offs to total average loans.
Allowance / loans:Ratio is allowance for loan losses to total period-end loans.
Allowance / NPL:Ratio is allowance for loan losses to nonperforming loans in the loan portfolio.
Allowance / NPA: Ratio is allowance for loan losses to nonperforming assets related to the loan portfolio.
Allowance / charge-offs: Ratio is allowance for loan losses to annualized net charge-offs.
23
First Horizon National Corporation
Second Quarter 2014 Earnings
July 18, 2014
|
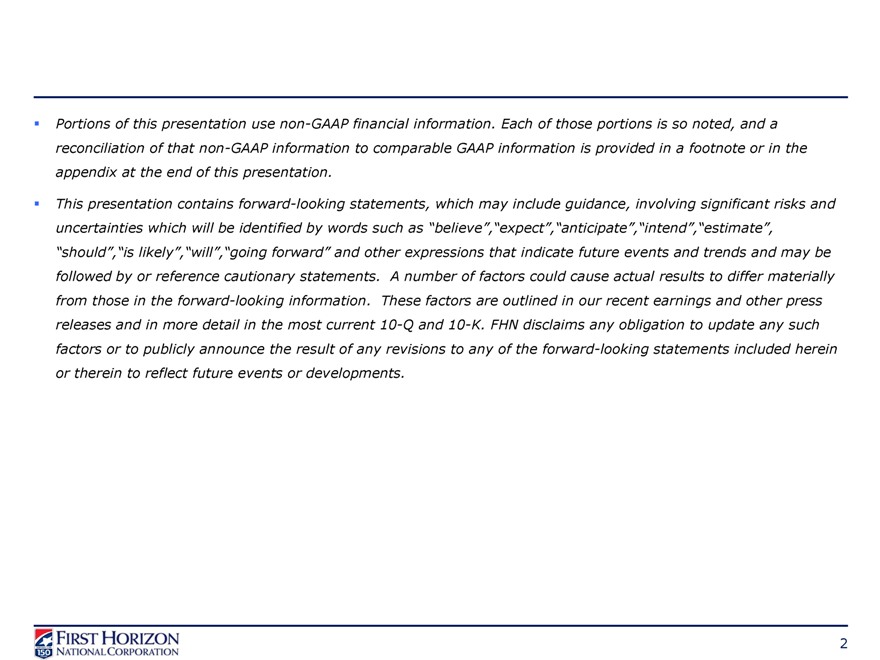 |
Portions of this presentation use non-GAAP financial information. Each of those portions is so noted, and a reconciliation of that non-GAAP information to comparable GAAP information is provided in a footnote or in the appendix at the end of this presentation.
This presentation contains forward-looking statements, which may include guidance, involving significant risks and uncertainties which will be identified by words such as “believe”,“expect”,“anticipate”,“intend”,“estimate”, “should”,“is likely”,“will”,“going forward” and other expressions that indicate future events and trends and may be followed by or reference cautionary statements. A number of factors could cause actual results to differ materially from those in the forward-looking information. These factors are outlined in our recent earnings and other press releases and in more detail in the most current 10-Q and 10-K. FHN disclaims any obligation to update any such factors or to publicly announce the result of any revisions to any of the forward-looking statements included herein or therein to reflect future events or developments.
2
|
 |
Building Franchise Value
Executing “Blue Chip” Priorities
Being easy to do business with
Providing differentiated customer service
Using the bonefish to drive profitability
3
|
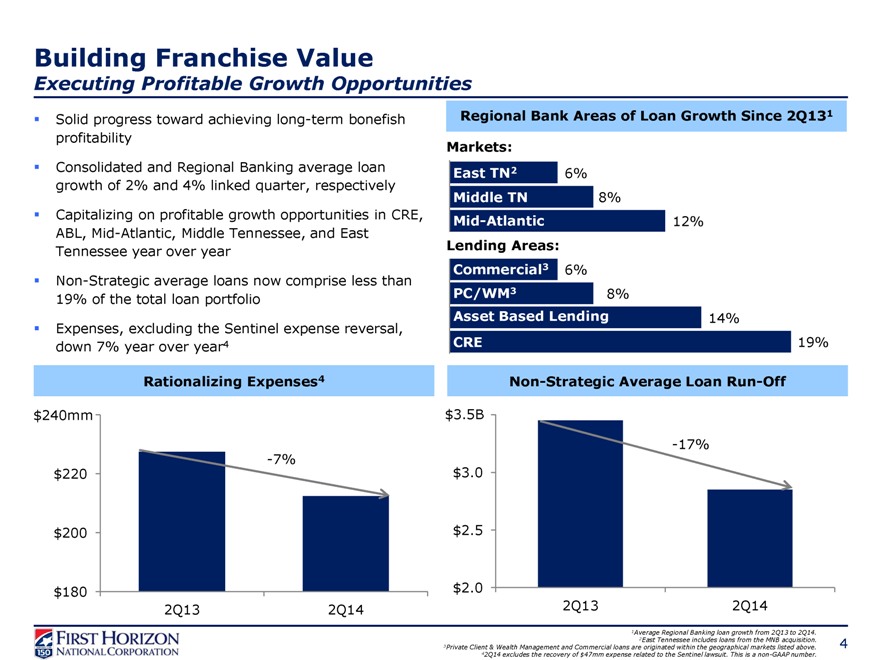 |
Building Franchise Value
Executing Profitable Growth Opportunities
Solid progress toward achieving long-term bonefish Regional Bank Areas of Loan Growth Since 2Q131
profitability Markets:
Consolidated and Regional Banking average loan East TN2 6%
growth of 2% and 4% linked quarter, respectively
Middle TN 8%
Capitalizing on profitable growth opportunities in CRE, Mid-Atlantic 12%
ABL, Mid-Atlantic, Middle Tennessee, and East
Tennessee year over year Lending Areas:
Commercial3 6%
Non-Strategic average loans now comprise less than
19% of the total loan portfolio PC/WM3 8%
Asset Based Lending 14%
Expenses, excluding the Sentinel expense reversal,
down 7% year over year4 CRE 19%
Rationalizing Expenses4 Non-Strategic Average Loan Run-Off
$240mm $3.5B
-17%
-7%
$ 220 $3.0
$ 200 $2.5
$ 180 $2.0
2Q13 2Q14 2Q13 2Q14
1Average Regional Banking loan growth from 2Q13 to 2Q14.
2East Tennessee includes loans from the MNB acquisition.
3Private Client & Wealth Management and Commercial loans are originated within the geographical markets listed above.
42Q14 excludes the recovery of $47mm expense related to the Sentinel lawsuit. This is a non-GAAP number.
4
|
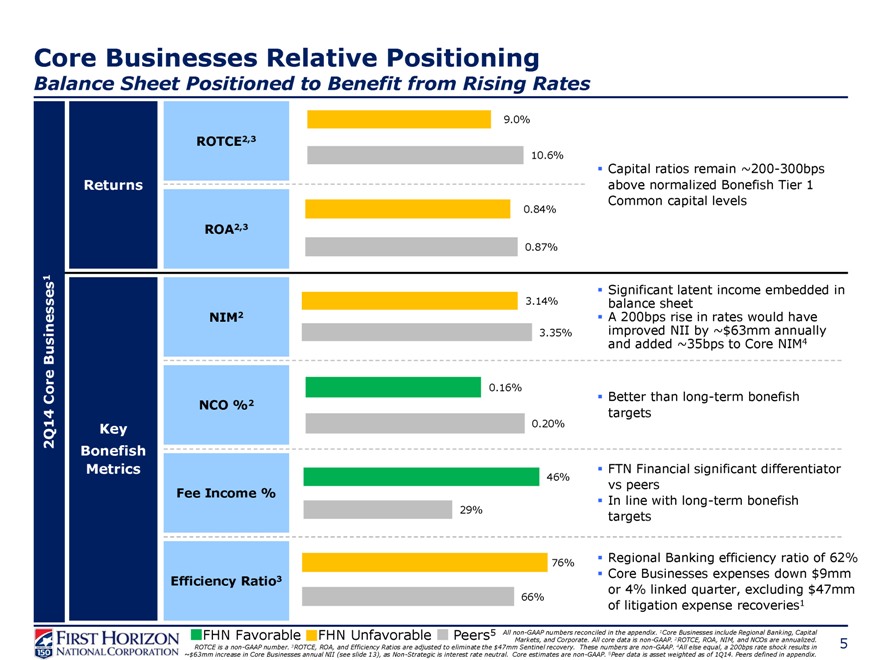 |
Core Businesses Relative Positioning
Balance Sheet Positioned to Benefit from Rising Rates
9.0%
ROTCE2,3
10.6%
Capital ratios remain ~200-300bps
Returns above normalized Bonefish Tier 1
Common capital levels
0.84%
ROA2,3
0.87%
1
Significant latent income embedded in
3.14% balance sheet
NIM2 A 200bps rise in rates would have
3.35% improved NII by ~$63mm annually
Businesses and added ~35bps to Core NIM4
0.16%
Core Better than long-term bonefish
NCO %2 targets
2Q14 Key 0.20%
Bonefish
Metrics FTN Financial significant differentiator
46% vs peers
Fee Income % In line with long-term bonefish
29% targets
76% Regional Banking efficiency ratio of 62%
Efficiency Ratio3 Core Businesses expenses down $9mm
or 4% linked quarter, excluding $47mm
66% of litigation expense recoveries1
FHN Favorable FHN Unfavorable Peers5 All non-GAAP numbers reconciled in the appendix. 1Core Businesses include Regional Banking, Capital
Markets, and Corporate. All core data is non-GAAP. 2ROTCE, ROA, NIM, and NCOs are annualized.
ROTCE is a non-GAAP number. 3ROTCE, ROA, and Efficiency Ratios are adjusted to eliminate the $47mm Sentinel recovery. These numbers are non-GAAP. 4All else equal, a 200bps rate shock results in
~$63mm increase in Core Businesses annual NII (see slide 13), as Non-Strategic is interest rate neutral. Core estimates are non-GAAP. 5Peer data is asset weighted as of 1Q14. Peers defined in appendix.
5
|
 |
FINANCIAL RESULTS
6
|
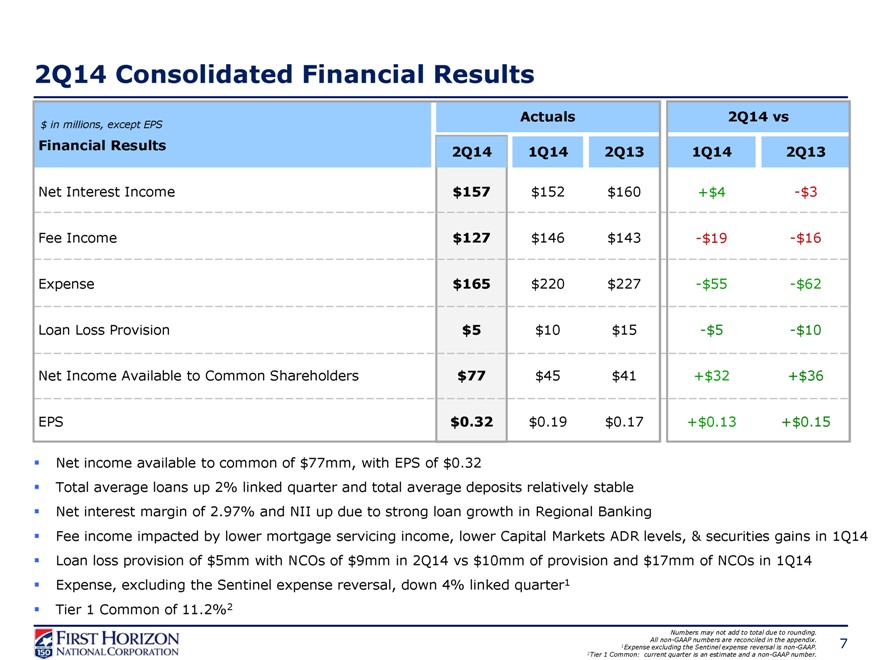 |
2Q14 Consolidated Financial Results
$ in millions, except EPS Actuals 2Q14 vs
Financial Results 2Q14 1Q14 2Q13 1Q14 2Q13
Net Interest Income $157 $152 $160 +$4 -$3
Fee Income $127 $146 $143 -$19 -$16
Expense $165 $220 $227 -$55 -$62
Loan Loss Provision $5 $10 $15 -$5 -$10
Net Income Available to Common Shareholders $77 $45 $41 +$32 +$36
EPS $0.32 $0.19 $0.17 +$0.13 +$0.15
Net income available to common of $77mm, with EPS of $0.32
Total average loans up 2% linked quarter and total average deposits relatively stable Net interest margin of 2.97% and NII up due to strong loan growth in Regional Banking
Fee income impacted by lower mortgage servicing income, lower Capital Markets ADR levels, & securities gains in 1Q14 Loan loss provision of $5mm with NCOs of $9mm in 2Q14 vs $10mm of provision and $17mm of NCOs in 1Q14 Expense, excluding the Sentinel expense reversal, down 4% linked quarter1 Tier 1 Common of 11.2%2
Numbers may not add to total due to rounding.
All non-GAAP numbers are reconciled in the appendix.
1Expense excluding the Sentinel expense reversal is non-GAAP.
2Tier 1 Common: current quarter is an estimate and a non-GAAP number.
7
|
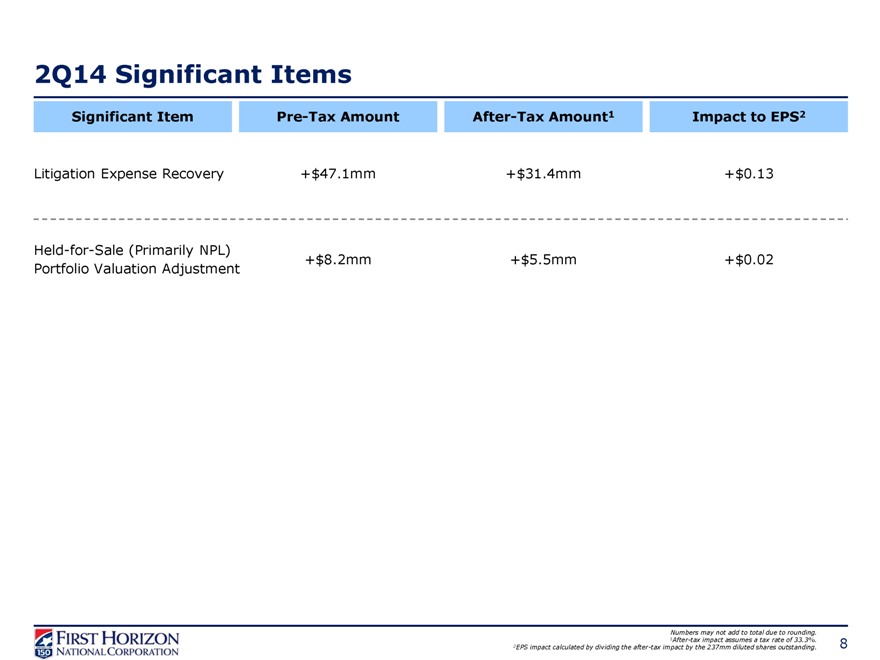 |
2Q14 Significant Items
Significant Item Pre-Tax Amount After-Tax Amount1 Impact to EPS2
Litigation Expense Recovery +$47.1mm +$31.4mm +$0.13
Held-for-Sale (Primarily NPL) +$8.2mm +$5.5mm +$0.02
Portfolio Valuation Adjustment
Numbers may not add to total due to rounding. 1After-tax impact assumes a tax rate of 33.3%.
2EPS impact calculated by dividing the after-tax impact by the 237mm diluted shares outstanding.
8
|
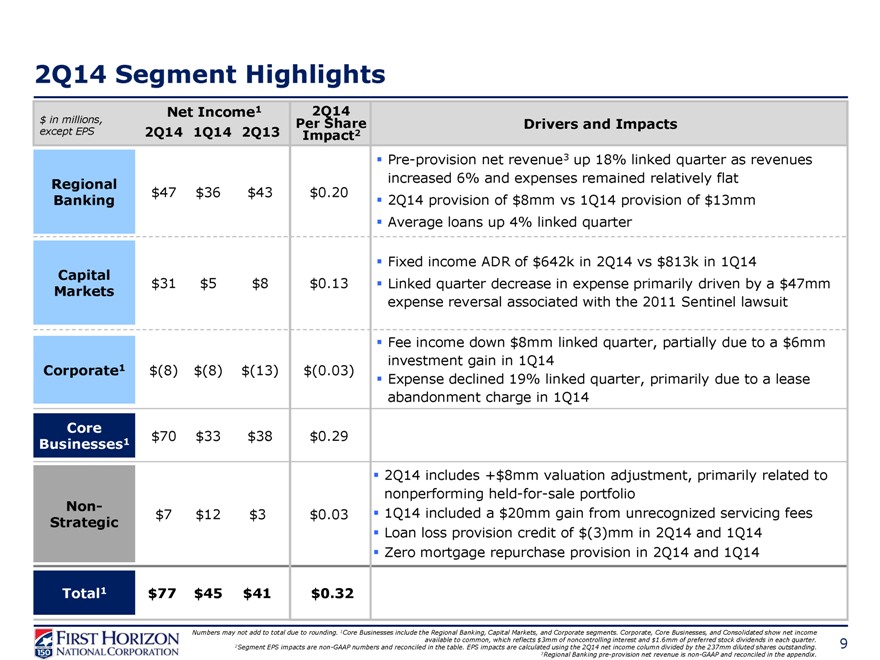 |
2Q14 Segment Highlights
Net Income1 2Q14
$ in millions, Per Share Drivers and Impacts
except EPS 2Q14 1Q14 2Q13 Impact2
Pre-provision net revenue3 up 18% linked quarter as revenues
Regional increased 6% and expenses remained relatively flat
$47 $36 $43 $0.20
Banking 2Q14 provision of $8mm vs 1Q14 provision of $13mm
Average loans up 4% linked quarter
Fixed income ADR of $642k in 2Q14 vs $813k in 1Q14
Capital
Markets $31 $5 $8 $0.13 Linked quarter decrease in expense primarily driven by a $47mm
expense reversal associated with the 2011 Sentinel lawsuit
Fee income down $8mm linked quarter, partially due to a $6mm
investment gain in 1Q14
Corporate1 $(8) $(8) $(13) $(0.03) Expense declined 19% linked quarter, primarily due to a lease
abandonment charge in 1Q14
Core $70 $33 $38 $0.29
Businesses1
2Q14 includes +$8mm valuation adjustment, primarily related to
nonperforming held-for-sale portfolio
Non- $7 $12 $3 $0.03 1Q14 included a $20mm gain from unrecognized servicing fees
Strategic
Loan loss provision credit of $(3)mm in 2Q14 and 1Q14
Zero mortgage repurchase provision in 2Q14 and 1Q14
Total1 $77 $45 $41 $0.32
Numbers may not add to total due to rounding. 1Core Businesses include the Regional Banking, Capital Markets, and Corporate segments. Corporate, Core Businesses, and Consolidated show net income available to common, which reflects $3mm of noncontrolling interest and $1.6mm of preferred stock dividends in each quarter.
2Segment EPS impacts are non-GAAP numbers and reconciled in the table. EPS impacts are calculated using the 2Q14 net income column divided by the 237mm diluted shares outstanding. 3Regional Banking pre-provision net revenue is non-GAAP and reconciled in the appendix.
9
|
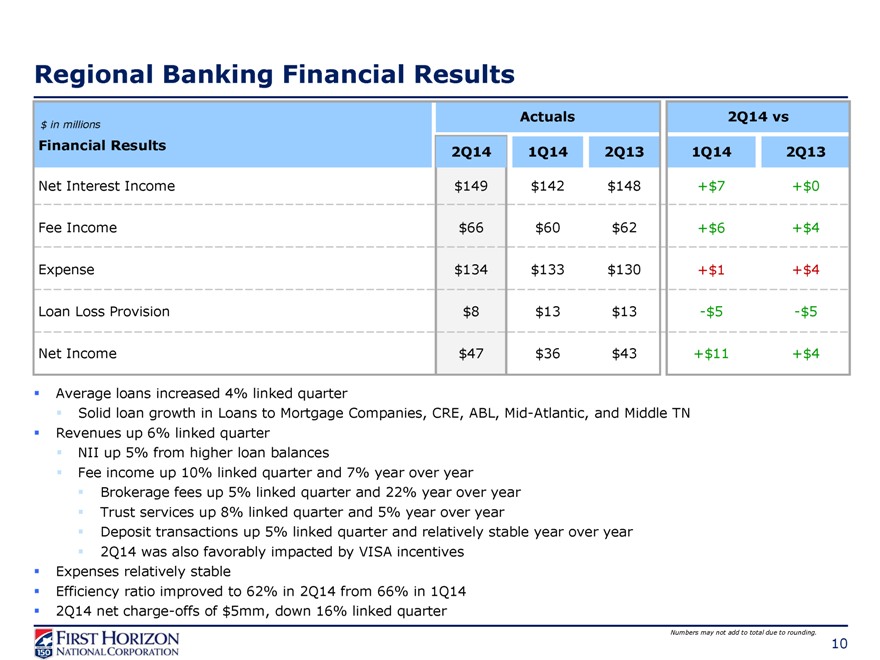 |
Regional Banking Financial Results
$ in millions Actuals 2Q14 vs
Financial Results 2Q14 1Q14 2Q13 1Q14 2Q13
Net Interest Income $149 $142 $148 +$7 +$0
Fee Income $66 $60 $62 +$6 +$4
Expense $134 $133 $130 +$1 +$4
Loan Loss Provision $8 $13 $13 -$5 -$5
Net Income $47 $36 $43 +$11 +$4
Average loans increased 4% linked quarter
Solid loan growth in Loans to Mortgage Companies, CRE, ABL, Mid-Atlantic, and Middle TN Revenues up 6% linked quarter NII up 5% from higher loan balances Fee income up 10% linked quarter and 7% year over year Brokerage fees up 5% linked quarter and 22% year over year Trust services up 8% linked quarter and 5% year over year Deposit transactions up 5% linked quarter and relatively stable year over year 2Q14 was also favorably impacted by VISA incentives Expenses relatively stable Efficiency ratio improved to 62% in 2Q14 from 66% in 1Q14 2Q14 net charge-offs of $5mm, down 16% linked quarter
Numbers may not add to total due to rounding.
10
|
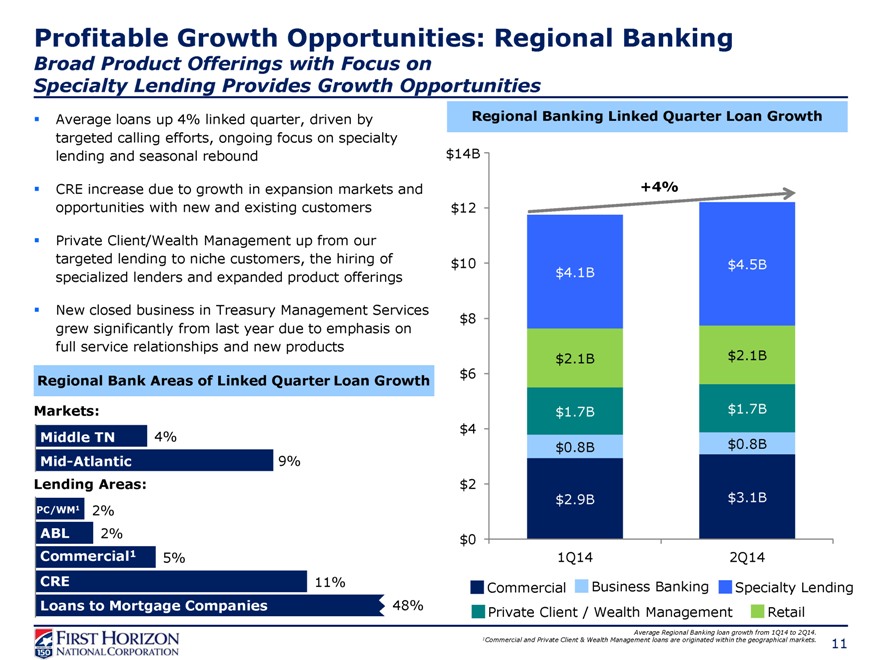 |
Profitable Growth Opportunities: Regional Banking
Broad Product Offerings with Focus on
Specialty Lending Provides Growth Opportunities
Average loans up 4% linked quarter, driven by targeted calling efforts, ongoing focus on specialty lending and seasonal rebound
CRE increase due to growth in expansion markets and opportunities with new and existing customers
Private Client/Wealth Management up from our targeted lending to niche customers, the hiring of specialized lenders and expanded product offerings
New closed business in Treasury Management Services grew significantly from last year due to emphasis on full service relationships and new products
Regional Bank Areas of Linked Quarter Loan Growth
Markets:
Middle TN 4%
Mid-Atlantic 9%
Lending Areas:
PC/WM1 2%
ABL 2%
Commercial1 5%
CRE 11%
Loans to Mortgage Companies 48%
Regional Banking Linked Quarter Loan Growth
$14B
+4%
$12
$10 $4.5B
$4.1B
$8
$2.1B $2.1B
$6
$1.7B $1.7B
$4
$0.8B $0.8B
$2
$2.9B $3.1B
$0
1Q14 2Q14
Commercial Business Banking Specialty Lending
Private Client / Wealth Management Retail
Average Regional Banking loan growth from 1Q14 to 2Q14.
1Commercial and Private Client & Wealth Management loans are originated within the geographical markets.
11
|
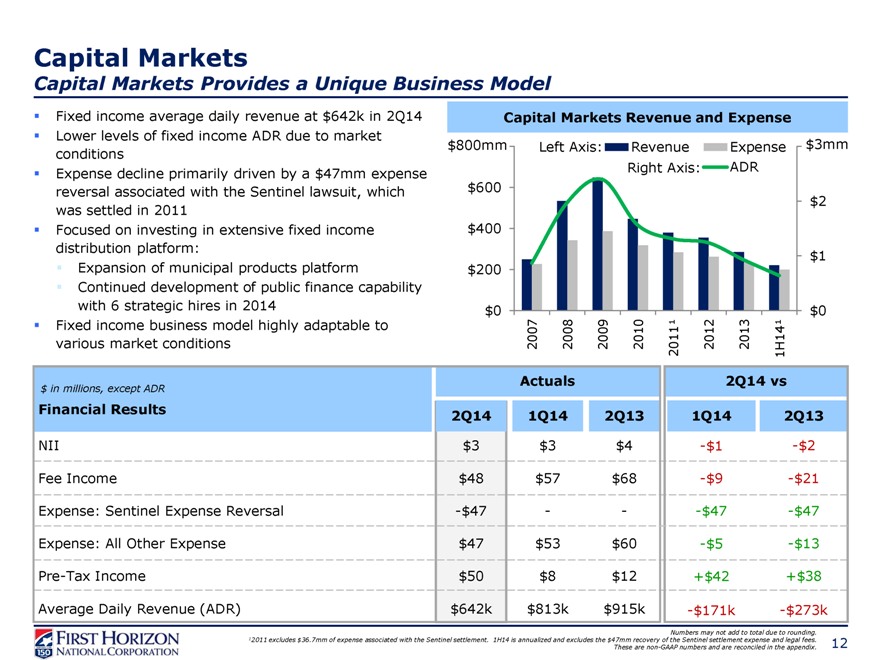 |
Capital Markets
Capital Markets Provides a Unique Business Model
Fixed income average daily revenue at $642k in 2Q14 Capital Markets Revenue and Expense
Lower levels of fixed income ADR due to market
conditions $800mm Left Axis: Revenue Expense $3mm
Expense decline primarily driven by a $47mm expense Right Axis: ADR
reversal associated with the Sentinel lawsuit, which $600 $2
was settled in 2011
Focused on investing in extensive fixed income $400
distribution platform: $1
Expansion of municipal products platform $200
Continued development of public finance capability
with 6 strategic hires in 2014 $0 $0
Fixed income business model highly adaptable to
various market conditions 2007 2008 2009 2010 2011¹ 2012 2013 1H14¹
$ in millions, except ADR Actuals 2Q14 vs
Financial Results 2Q14 1Q14 2Q13 1Q14 2Q13
NII $3 $3 $4 -$1 -$2
Fee Income $48 $57 $68 -$9 -$21
Expense: Sentinel Expense Reversal -$47 - - -$47 -$47
Expense: All Other Expense $47 $53 $60 -$5 -$13
Pre-Tax Income $50 $8 $12 +$42 +$38
Average Daily Revenue (ADR) $642k $813k $915k -$171k -$273k
Numbers may not add to total due to rounding.
12011 excludes $36.7mm of expense associated with the Sentinel settlement. 1H14 is annualized and excludes the $47mm recovery of the Sentinel settlement expense and legal fees.
These are non-GAAP numbers and are reconciled in the appendix.
12
|
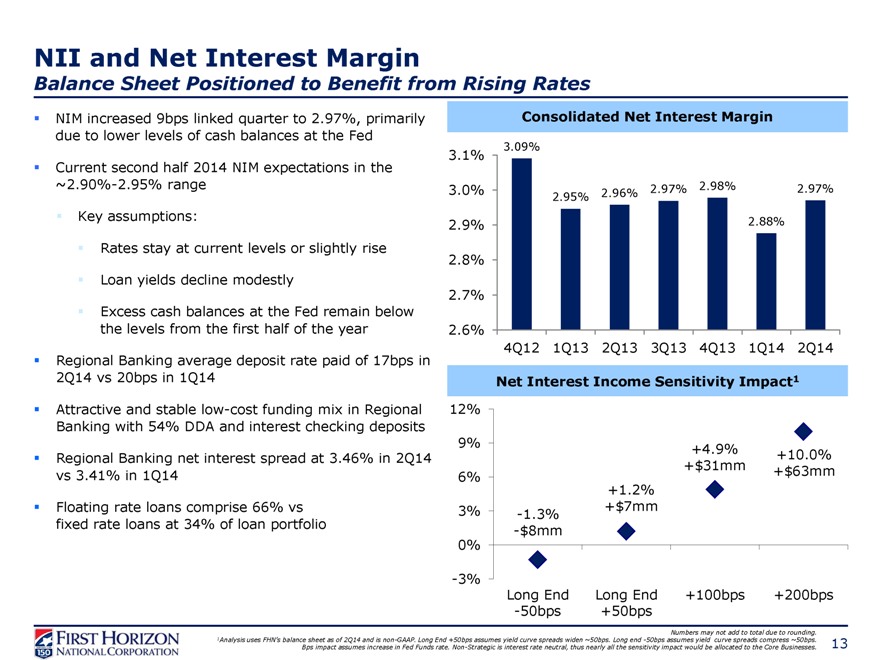 |
NII and Net Interest Margin
Balance Sheet Positioned to Benefit from Rising Rates
NIM increased 9bps linked quarter to 2.97%, primarily Consolidated Net Interest Margin
due to lower levels of cash balances at the Fed
3.1% 3.09%
Current second half 2014 NIM expectations in the
~2.90%-2.95% range 3.0% 2.95% 2.96% 2.97% 2.98% 2.97%
Key assumptions: 2.9% 2.88%
Rates stay at current levels or slightly rise
2.8%
Loan yields decline modestly
2.7%
Excess cash balances at the Fed remain below
the levels from the first half of the year 2.6%
4Q12 1Q13 2Q13 3Q13 4Q13 1Q14 2Q14
Regional Banking average deposit rate paid of 17bps in
2Q14 vs 20bps in 1Q14 Net Interest Income Sensitivity Impact1
Attractive and stable low-cost funding mix in Regional 12%
Banking with 54% DDA and interest checking deposits
9% +4.9%
Regional Banking net interest spread at 3.46% in 2Q14 +10.0%
vs 3.41% in 1Q14 +$31mm +$63mm
6%
+1.2%
Floating rate loans comprise 66% vs 3% -1.3% +$7mm
fixed rate loans at 34% of loan portfolio -$8mm
0%
-3%
Long End Long End +100bps +200bps
-50bps +50bps
Numbers may not add to total due to rounding.
1Analysis uses FHN’s balance sheet as of 2Q14 and is non-GAAP. Long End +50bps assumes yield curve spreads widen ~50bps. Long end -50bps assumes yield curve spreads compress ~50bps.
Bps impact assumes increase in Fed Funds rate. Non-Strategic is interest rate neutral, thus nearly all the sensitivity impact would be allocated to the Core Businesses.
13
|
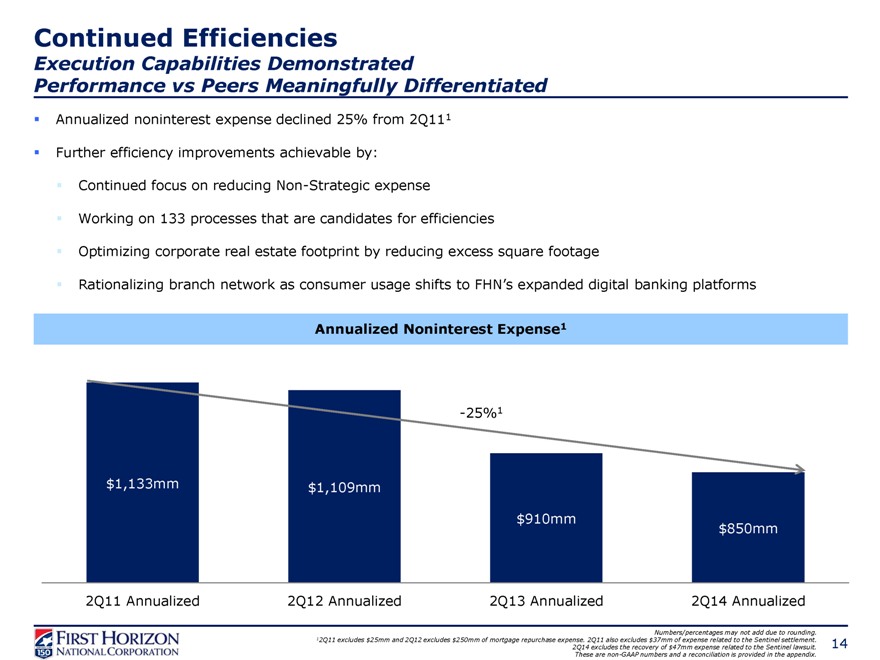 |
Continued Efficiencies
Execution Capabilities Demonstrated
Performance vs Peers Meaningfully Differentiated
Annualized noninterest expense declined 25% from 2Q111Further efficiency improvements achievable by:Continued focus on reducing Non-Strategic expenseWorking on 133 processes that are candidates for efficiencies
Optimizing corporate real estate footprint by reducing excess square footage
Rationalizing branch network as consumer usage shifts to FHN’s expanded digital banking platforms
Annualized Noninterest Expense1
-25%1
$1,133mm $1,109mm
$910mm $850mm
2Q11 Annualized 2Q12 Annualized 2Q13 Annualized 2Q14 Annualized
Numbers/percentages may not add due to rounding.
12Q11 excludes $25mm and 2Q12 excludes $250mm of mortgage repurchase expense. 2Q11 also excludes $37mm of expense related to the Sentinel settlement.
2Q14 excludes the recovery of $47mm expense related to the Sentinel lawsuit.
These are non-GAAP numbers and a reconciliation is provided in the appendix.
14
|
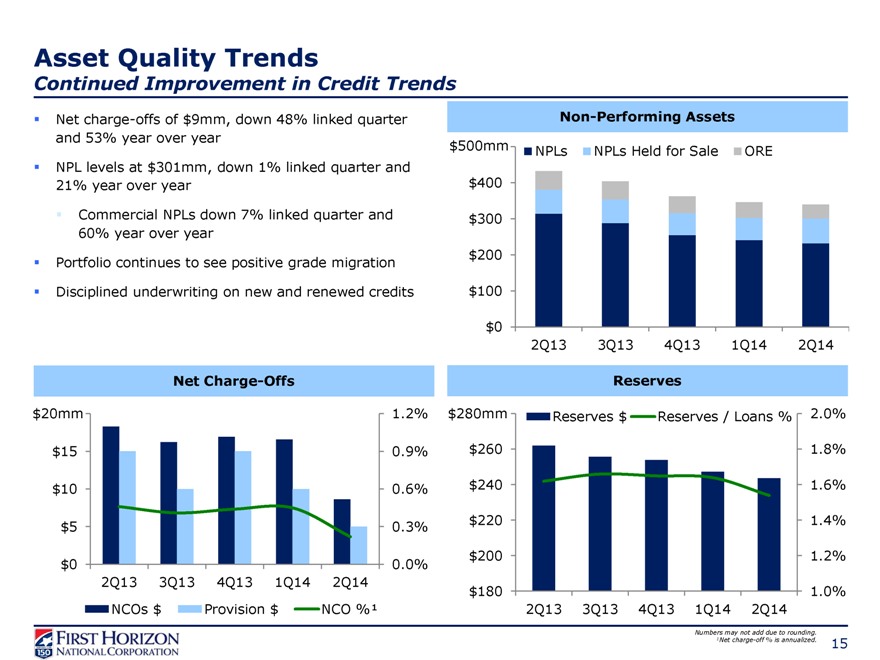 |
Asset Quality Trends
Continued Improvement in Credit Trends
Net charge-offs of $9mm, down 48% linked quarter Non-Performing Assets
and 53% year over year
$500mm NPLs NPLs Held for Sale ORE
NPL levels at $301mm, down 1% linked quarter and
21% year over year $400
Commercial NPLs down 7% linked quarter and $300
60% year over year
Portfolio continues to see positive grade migration $200
Disciplined underwriting on new and renewed credits $100
$0
2Q13 3Q13 4Q13 1Q14 2Q14
Net Charge-Offs Reserves
$20mm 1.2% $280mm Reserves $ Reserves / Loans % 2.0%
$15 0.9% $260 1.8%
$10 0.6% $240 1.6%
$5 0.3% $220 1.4%
$0 0.0% $200 1.2%
2Q13 3Q13 4Q13 1Q14 2Q14 $180 1.0%
NCOs $ Provision $ NCO %¹ 2Q13 3Q13 4Q13 1Q14 2Q14
Numbers may not add due to rounding.
1Net charge-off % is annualized.
15
|
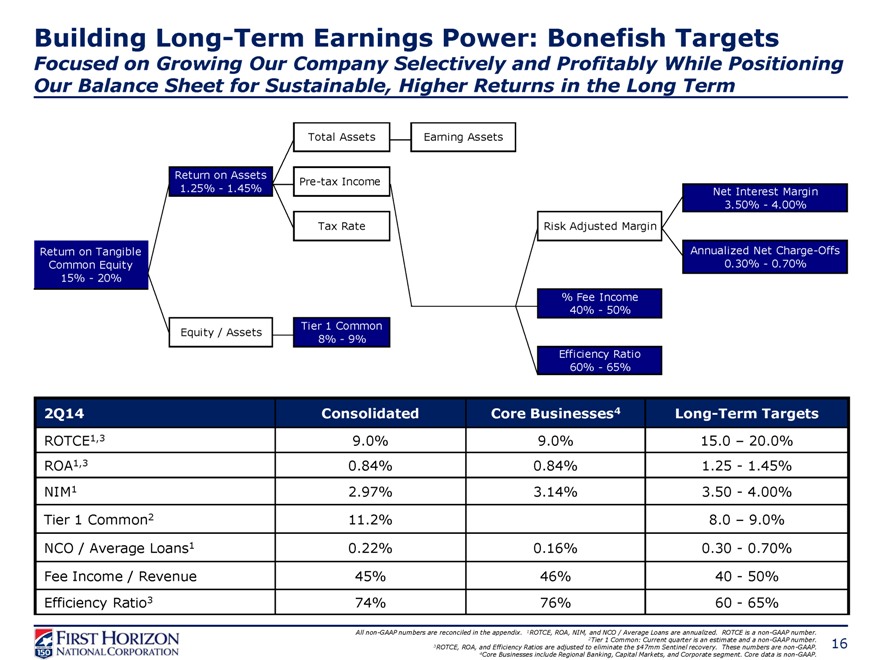 |
Building Long-Term Earnings Power: Bonefish Targets
Focused on Growing Our Company Selectively and Profitably While Positioning Our Balance Sheet for Sustainable, Higher Returns in the Long Term
Total Assets Earning Assets
Return on Assets Pre-tax Income
1.25%—1.45% Net Interest Margin
3.50%—4.00%
Tax Rate Risk Adjusted Margin
Return on Tangible Annualized Net Charge-Offs
Common Equity 0.30%—0.70%
15%—20%
% Fee Income
40%—50%
Equity / Assets Tier 1 Common
8%—9%
Efficiency Ratio
60%—65%
2Q14 Consolidated Core Businesses4 Long-Term Targets
ROTCE1,3 9.0% 9.0% 15.0 – 20.0%
ROA1,3 0.84% 0.84% 1.25—1.45%
NIM1 2.97% 3.14% 3.50—4.00%
Tier 1 Common2 11.2% 8.0 – 9.0%
NCO / Average Loans1 0.22% 0.16% 0.30—0.70%
Fee Income / Revenue 45% 46% 40—50%
Efficiency Ratio3 74% 76% 60—65%
All non-GAAP numbers are reconciled in the appendix. 1ROTCE, ROA, NIM, and NCO / Average Loans are annualized. ROTCE is a non-GAAP number. 2Tier 1 Common: Current quarter is an estimate and a non-GAAP number.
3ROTCE, ROA, and Efficiency Ratios are adjusted to eliminate the $47mm Sentinel recovery. These numbers are non-GAAP. 4Core Businesses include Regional Banking, Capital Markets, and Corporate segment. Core data is non-GAAP.
16
|
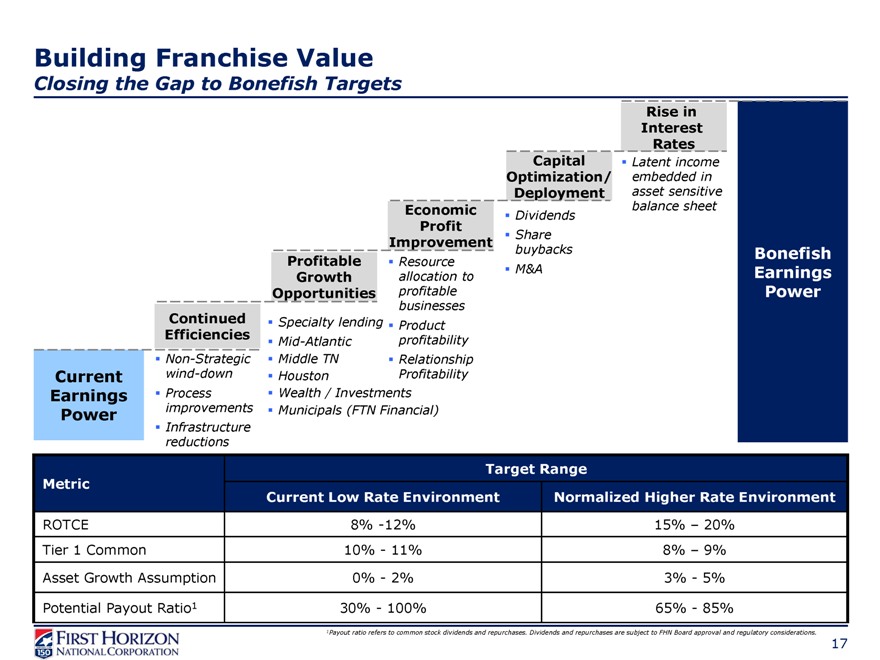 |
Building Franchise Value
Closing the Gap to Bonefish Targets
Rise in
Interest
Rates
Capital Latent income
Optimization/ embedded in
Deployment asset sensitive
Economic Dividends balance sheet
Profit
Improvement Share
Profitable Resource buybacks Bonefish
Growth allocation to M&A Earnings
Opportunities profitable Power
businesses
Continued Specialty lending Product
Efficiencies Mid-Atlantic profitability
Non-Strategic Middle TN Relationship
Current wind-down Houston Profitability
Earnings Process Wealth / Investments
Power improvements Municipals (FTN Financial)
Infrastructure
reductions
Target Range
Metric
Current Low Rate Environment Normalized Higher Rate Environment
ROTCE 8% -12% 15% – 20%
Tier 1 Common 10%—11% 8% – 9%
Asset Growth Assumption 0%—2% 3%—5%
Potential Payout Ratio1 30%—100% 65%—85%
1Payout ratio refers to common stock dividends and repurchases. Dividends and repurchases are subject to FHN Board approval and regulatory considerations.
17
|
 |
Successfully Executing on Key Priorities
FHN Is Well Positioned For Attractive Long-Term Earnings Power
Proven execution capabilities
Unique size, scope, and strengths
Focused on efficiency, productivity, economic profitability, and growth opportunities Organizational alignment on the path to achieving long-term bonefish profitability Breadth and depth of talent that will be able to profitably run and grow the company
Building a Foundation for Attractive Long-Term Earnings Power
18
APPENDIX
19
|
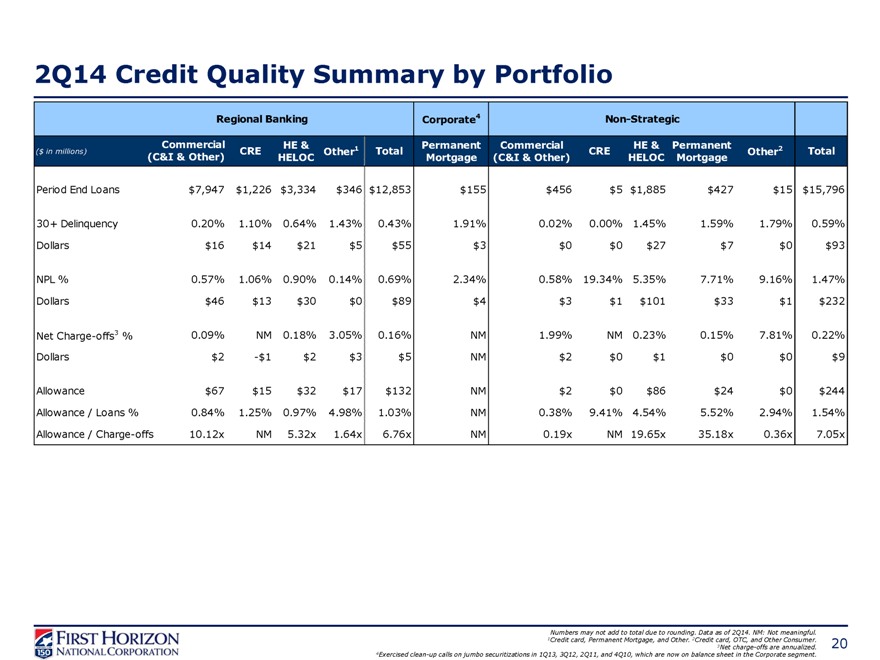 |
2Q14 Credit Quality Summary by Portfolio
Regional Banking Corporate4 Non-Strategic
Commercial HE & Permanent Commercial HE & Permanent
($ in millions) CRE Other1 Total CRE Other2 Total
(C&I & Other) HELOC Mortgage (C&I & Other) HELOC Mortgage
Period End Loans $7,947 $1,226 $3,334 $346 $12,853 $155 $456 $5 $1,885 $427 $15 $15,796
30+ Delinquency 0.20% 1.10% 0.64% 1.43% 0.43% 1.91% 0.02% 0.00% 1.45% 1.59% 1.79% 0.59%
Dollars $16 $14 $21 $5 $55 $3 $0 $0 $27 $7 $0 $93
NPL % 0.57% 1.06% 0.90% 0.14% 0.69% 2.34% 0.58% 19.34% 5.35% 7.71% 9.16% 1.47%
Dollars $46 $13 $30 $0 $89 $4 $3 $1 $101 $33 $1 $232
Net Charge-offs3 % 0.09% NM 0.18% 3.05% 0.16% NM 1.99% NM 0.23% 0.15% 7.81% 0.22%
Dollars $2 -$1 $2 $3 $5 NM $2 $0 $1 $0 $0 $9
Allowance $67 $15 $32 $17 $132 NM $2 $0 $86 $24 $0 $244
Allowance / Loans % 0.84% 1.25% 0.97% 4.98% 1.03% NM 0.38% 9.41% 4.54% 5.52% 2.94% 1.54%
Allowance / Charge-offs 10.12x NM 5.32x 1.64x 6.76x NM 0.19x NM 19.65x 35.18x 0.36x 7.05x
Numbers may not add to total due to rounding. Data as of 2Q14. NM: Not meaningful. 1Credit card, Permanent Mortgage, and Other. 2Credit card, OTC, and Other Consumer.
3Net charge-offs are annualized. 4Exercised clean-up calls on jumbo securitizations in 1Q13, 3Q12, 2Q11, and 4Q10, which are now on balance sheet in the Corporate segment.
20
|
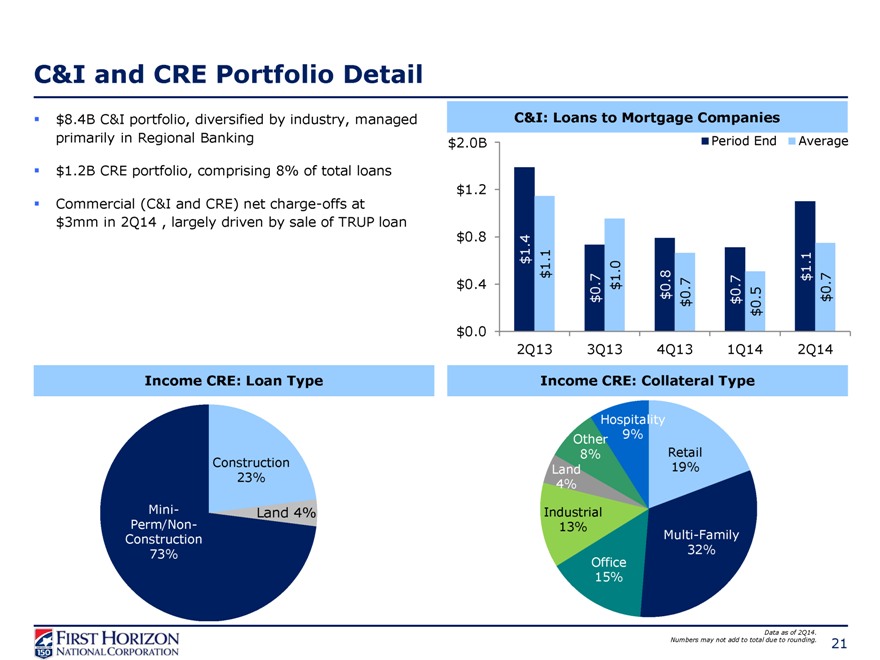 |
C&I and CRE Portfolio Detail
$8.4B C&I portfolio, diversified by industry, managed primarily in Regional Banking
$1.2B CRE portfolio, comprising 8% of total loans
Commercial (C&I and CRE) net charge-offs at $3mm in 2Q14 , largely driven by sale of TRUP loan
Income CRE: Loan Type
Construction
23%
Mini- Land 4%
Perm/Non-
Construction
73%
Income CRE: Collateral Type
Hospitality
Other 9%
8% Retail
Land 19%
4%
Industrial
13% Multi-Family
32%
Office
15%
Data as of 2Q14.
Numbers may not add to total due to rounding.
21
Home Equity Overview
Portfolio Characteristics
First Second Total
Balance $ 2.8B $ 2.4B $ 5.2B
Original FICO 752 735 743
Refreshed FICO 752 723 736
Original CLTV 76% 81% 78%
Full Doc 91% 74% 83%
Owner Occupied 92% 94% 93%
HELOCs $ 0.7B $ 2.0B $ 2.7B
Weighted Average
HELOC Utilization 48% 59% 57%
Percent of Portfolio: Months Until Repayment
35%
30%
25%
20%
15% 29%
10%
17% 18% 15% 14%
5%
7%
0%
0-12 13-24 25-36 37-48 49-60 >60
Geographic Distribution
Other
29% Core
Banking
Customers
FL TN
2% CA 57%
GA 9%
3%
HELOC Draw vs Repayment Balances
$2.5B
$2.0
$1.5
$1.0 $2.0
$0.5
$0.7
$0.0
In Draw In Repayment
Data as of 2Q14. Numbers may not add to total due to rounding.
22
|
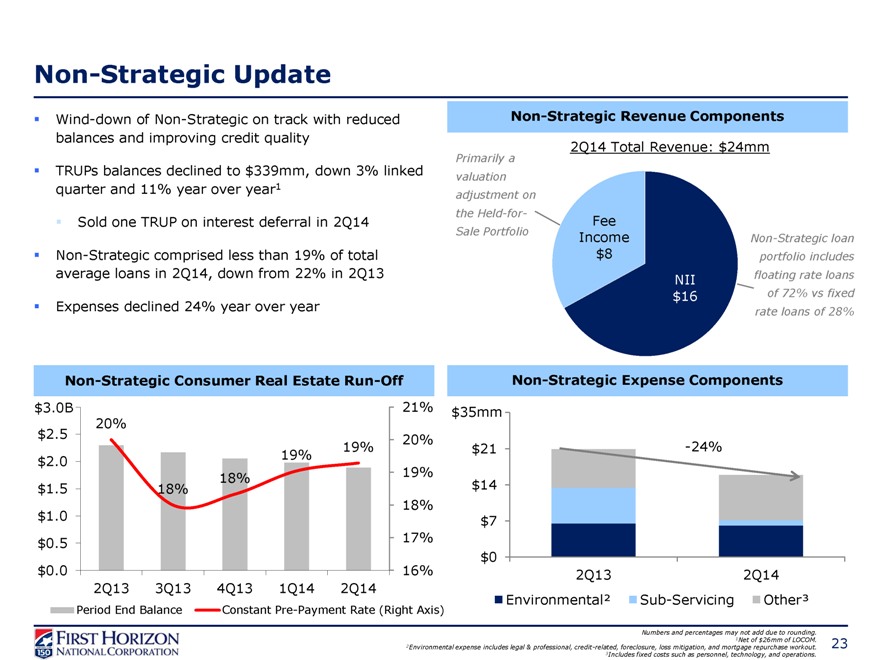 |
Non-Strategic Update
Wind-down of Non-Strategic on track with reduced balances and improving credit quality
TRUPs balances declined to $339mm, down 3% linked quarter and 11% year over year1
Sold one TRUP on interest deferral in 2Q14
Non-Strategic comprised less than 19% of total average loans in 2Q14, down from 22% in 2Q13
Expenses declined 24% year over year
Non-Strategic Consumer Real Estate Run-Off
$3.0B 21%
20%
$2.5 20%
19%
$2.0 19%
18% 19%
$1.5 18%
18%
$1.0
$0.5 17%
$0.0 16%
2Q13 3Q13 4Q13 1Q14 2Q14
Period End Balance Constant Pre-Payment Rate (Right Axis)
Non-Strategic Revenue Components
2Q14 Total Revenue: $24mm
Primarily a
valuation
adjustment on
the Held-for- Fee
Sale Portfolio Income Non-Strategic loan
$8 portfolio includes
NII floating rate loans
$16 of 72% vs fixed
rate loans of 28%
Non-Strategic Expense Components
$35mm
$21 -24%
$14
$7
$0
2Q13 2Q14
Environmental² Sub-Servicing Other³
Numbers and percentages may not add due to rounding.
1Net of $26mm of LOCOM.
2Environmental expense includes legal & professional, credit-related, foreclosure, loss mitigation, and mortgage repurchase workout.
3Includes fixed costs such as personnel, technology, and operations.
23
|
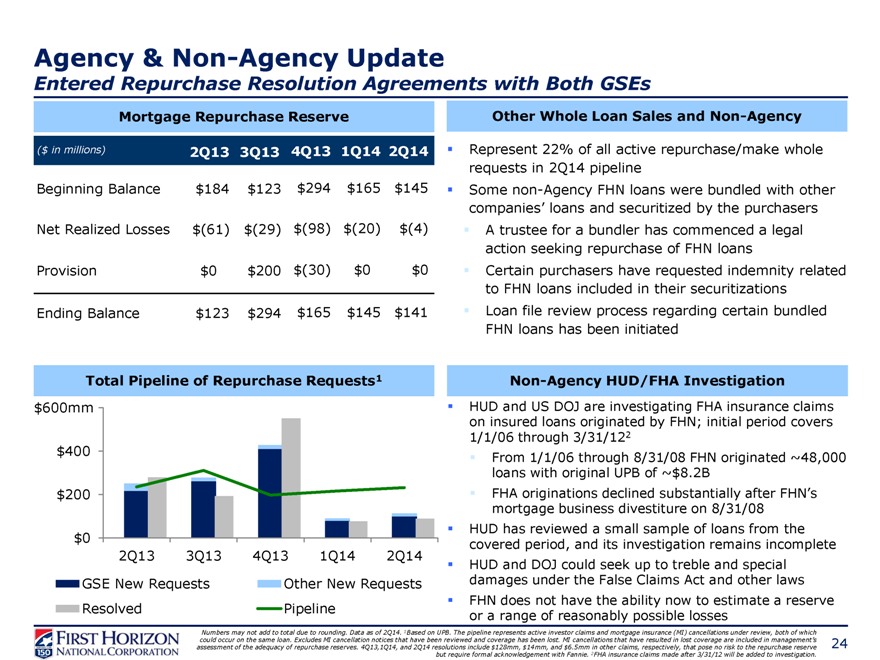 |
Agency & Non-Agency Update
Entered Repurchase Resolution Agreements with Both GSEs
Mortgage Repurchase Reserve
($ in millions) 2Q13 3Q13 4Q13 1Q14 2Q14
Beginning Balance $184 $123 $294 $165 $145
Net Realized Losses $(61) $(29) $(98) $(20) $(4)
Provision $0 $200 $(30) $0 $0
Ending Balance $123 $294 $165 $145 $141
Total Pipeline of Repurchase Requests1
$600mm
$400
$200
$0
2Q13 3Q13 4Q13 1Q14 2Q14
GSE New Requests Other New Requests Resolved Pipeline
Other Whole Loan Sales and Non-Agency
Represent 22% of all active repurchase/make whole requests in 2Q14 pipeline Some non-Agency FHN loans were bundled with other companies’ loans and securitized by the purchasers A trustee for a bundler has commenced a legal action seeking repurchase of FHN loans Certain purchasers have requested indemnity related to FHN loans included in their securitizations Loan file review process regarding certain bundled FHN loans has been initiated
Non-Agency HUD/FHA Investigation
HUD and US DOJ are investigating FHA insurance claims on insured loans originated by FHN; initial period covers 1/1/06 through 3/31/122From 1/1/06 through 8/31/08 FHN originated ~48,000 loans with original UPB of ~$8.2B
FHA originations declined substantially after FHN’s mortgage business divestiture on 8/31/08 HUD has reviewed a small sample of loans from the covered period, and its investigation remains incomplete HUD and DOJ could seek up to treble and special damages under the False Claims Act and other laws FHN does not have the ability now to estimate a reserve or a range of reasonably possible losses
Numbers may not add to total due to rounding. Data as of 2Q14. 1Based on UPB. The pipeline represents active investor claims and mortgage insurance (MI) cancellations under review, both of which could occur on the same loan. Excludes MI cancellation notices that have been reviewed and coverage has been lost. MI cancellations that have resulted in lost coverage are included in management’s assessment of the adequacy of repurchase reserves. 4Q13,1Q14, and 2Q14 resolutions include $128mm, $14mm, and $6.5mm in other claims, respectively, that pose no risk to the repurchase reserve but require formal acknowledgement with Fannie. 2FHA insurance claims made after 3/31/12 will be added to investigation.
24
|
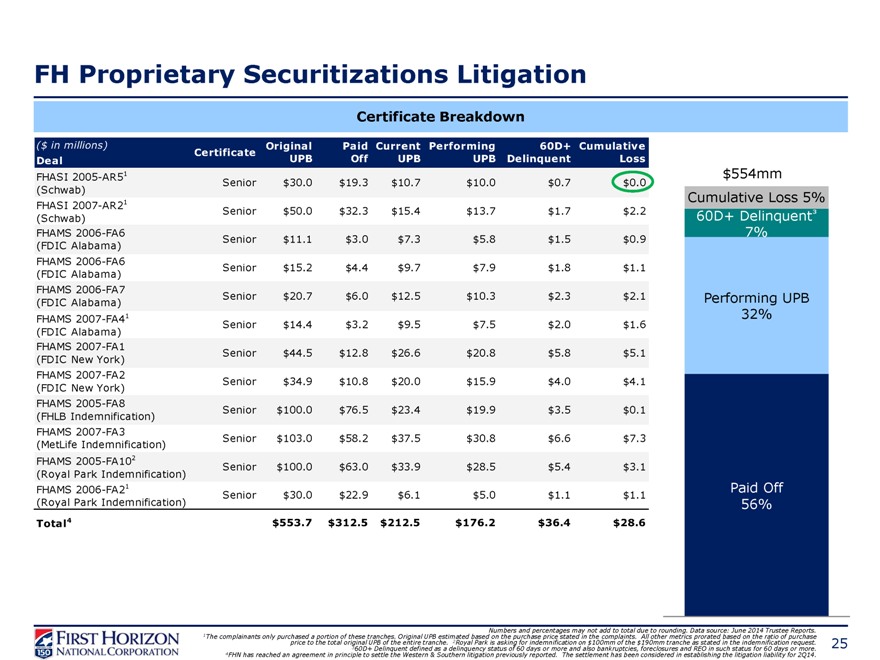 |
FH Proprietary Securitizations Litigation
Certificate Breakdown
($ in millions) Original Paid Current Performing 60D+ Cumulative
Certificate
Deal UPB Off UPB UPB Delinquent Loss
FHASI 2005-AR51 Senior $30.0 $19.3 $10.7 $10.0 $0.7 $0.0
(Schwab)
FHASI 2007-AR21 Senior $50.0 $32.3 $15.4 $13.7 $1.7 $2.2
(Schwab)
FHAMS 2006-FA6 Senior $11.1 $3.0 $7.3 $5.8 $1.5 $0.9
(FDIC Alabama)
FHAMS 2006-FA6
(FDIC Alabama) Senior $15.2 $4.4 $9.7 $7.9 $1.8 $1.1
FHAMS 2006-FA7 Senior $20.7 $6.0 $12.5 $10.3 $2.3 $2.1
(FDIC Alabama)
FHAMS 2007-FA41 Senior $14.4 $3.2 $9.5 $7.5 $2.0 $1.6
(FDIC Alabama)
FHAMS 2007-FA1 Senior $44.5 $12.8 $26.6 $20.8 $5.8 $5.1
(FDIC New York)
FHAMS 2007-FA2 Senior $34.9 $10.8 $20.0 $15.9 $4.0 $4.1
(FDIC New York)
FHAMS 2005-FA8
(FHLB Indemnification) Senior $100.0 $76.5 $23.4 $19.9 $3.5 $0.1
FHAMS 2007-FA3 Senior $103.0 $58.2 $37.5 $30.8 $6.6 $7.3
(MetLife Indemnification)
FHAMS 2005-FA102 Senior $100.0 $63.0 $33.9 $28.5 $5.4 $3.1
(Royal Park Indemnification)
FHAMS 2006-FA21 Senior $30.0 $22.9 $6.1 $5.0 $1.1 $1.1
(Royal Park Indemnification)
Total4 $553.7 $312.5 $212.5 $176.2 $36.4 $28.6
$554mm
Cumulative Loss 5%
60D+ Delinquent³
7%
Performing UPB
32%
Paid Off
56%
1The complainants only purchased a portion of these tranches. Original UPB estimated based Numbers on the purchase and percentages price stated may in not the add complaints. to total due All to other rounding. metrics Data prorated source: based June on 2014 the ratio Trustee of purchase Reports. price to the total original UPB of the entire tranche. 2Royal Park is asking for indemnification on $100mm of the $190mm tranche as stated in the indemnification request.
360D+ Delinquent defined as a delinquency status of 60 days or more and also bankruptcies, foreclosures and REO in such status for 60 days or more. 4FHN has reached an agreement in principle to settle the Western & Southern litigation previously reported. The settlement has been considered in establishing the litigation liability for 2Q14.
25
|
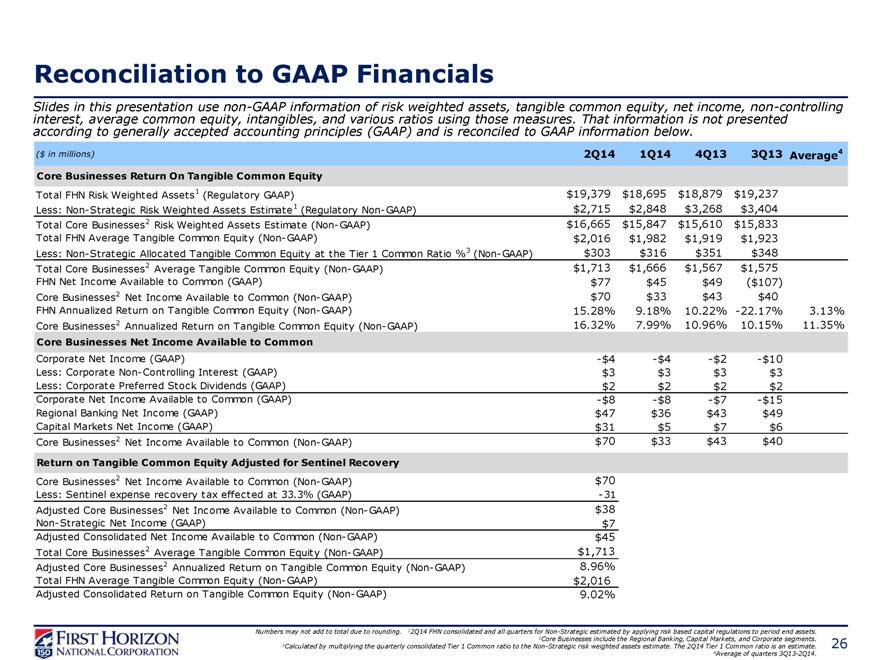 |
Reconciliation to GAAP Financials
Slides in this presentation use non-GAAP information of risk weighted assets, tangible common equity, net income, non-controlling
interest, average common equity, intangibles, and various ratios using those measures. That information is not presented
according to generally accepted accounting principles (GAAP) and is reconciled to GAAP information below.
($ in millions) 2Q14 1Q14 4Q13 3Q13 Average4
Core Businesses Return On Tangible Common Equity
Total FHN Risk Weighted Assets1 (Regulatory GAAP) $19,379 $18,695 $18,879 $19,237
Less: Non- Strategic Risk Weighted Assets Estimate1 (Regulatory Non- GAAP) $2,715 $2,848 $3,268 $3,404
Total Core Businesses2 Risk Weighted Assets Estimate (Non- GAAP) $16,665 $15,847 $15,610 $15,833
Total FHN Average Tangible Common Equity (Non- GAAP) $2,016 $1,982 $1,919 $1,923
Less: Non- Strategic Allocated Tangible Common Equity at the Tier 1 Common Ratio %3 (Non- GAAP) $303 $316 $351 $348
Total Core Businesses2 Average Tangible Common Equity (Non- GAAP) $1,713 $1,666 $1,567 $1,575
FHN Net Income Available to Common (GAAP) $77 $45 $49 ($107)
Core Businesses2 Net Income Available to Common (Non- GAAP) $70 $33 $43 $40
FHN Annualized Return on Tangible Common Equity (Non- GAAP) 15.28% 9.18% 10.22% -22.17% 3.13%
Core Businesses2 Annualized Return on Tangible Common Equity (Non- GAAP) 16.32% 7.99% 10.96% 10.15% 11.35%
Core Businesses Net Income Available to Common
Corporate Net Income (GAAP) -$4 -$4 -$2 -$10
Less: Corporate Non- Controlling Interest (GAAP) $3 $3 $3 $3
Less: Corporate Preferred Stock Dividends (GAAP) $2 $2 $2 $2
Corporate Net Income Available to Common (GAAP) -$8 -$8 -$7 -$15
Regional Banking Net Income (GAAP) $47 $36 $43 $49
Capital Markets Net Income (GAAP) $31 $5 $7 $6
Core Businesses2 Net Income Available to Common (Non- GAAP) $70 $33 $43 $40
Return on Tangible Common Equity Adjusted for Sentinel Recovery
Core Businesses2 Net Income Available to Common (Non- GAAP) $70
Less: Sentinel expense recovery tax effected at 33.3% (GAAP)-31
Adjusted Core Businesses2 Net Income Available to Common (Non- GAAP) $38
Non- Strategic Net Income (GAAP) $7
Adjusted Consolidated Net Income Available to Common (Non- GAAP) $45
Total Core Businesses2 Average Tangible Common Equity (Non- GAAP) $1,713
Adjusted Core Businesses2 Annualized Return on Tangible Common Equity (Non- GAAP) 8.96%
Total FHN Average Tangible Common Equity (Non- GAAP) $2,016
Adjusted Consolidated Return on Tangible Common Equity (Non- GAAP) 9.02%
Numbers may not add to total due to rounding. 12Q14 FHN consolidated and all quarters for Non-Strategic estimated by applying risk based capital regulations to period end assets.
2Core Businesses include the Regional Banking, Capital Markets, and Corporate segments.
3Calculated by multiplying the quarterly consolidated Tier 1 Common ratio to the Non-Strategic risk weighted assets estimate. The 2Q14 Tier 1 Common ratio is an estimate.
4Average of quarters 3Q13-2Q14.
26
|
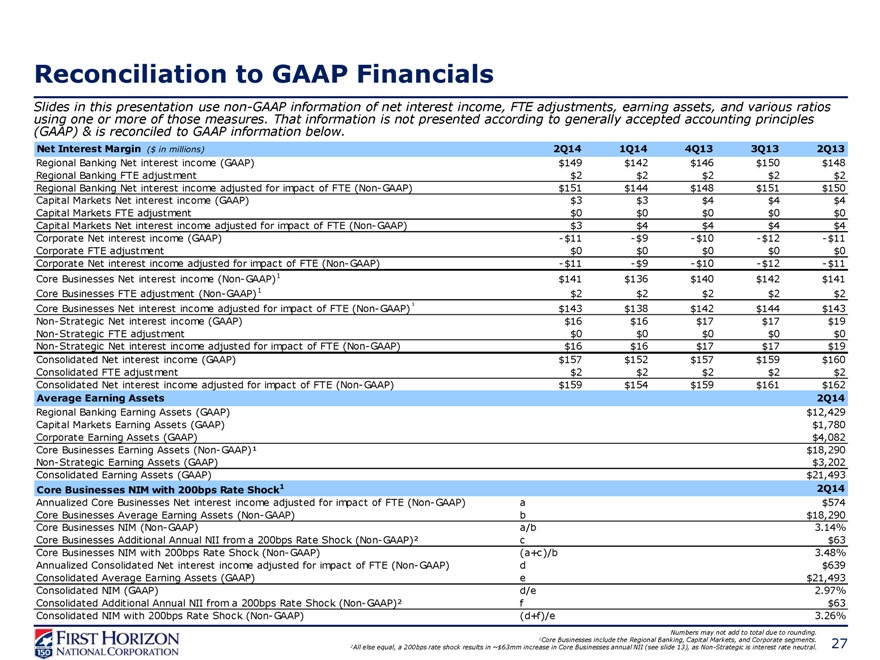 |
Reconciliation to GAAP Financials
Slides in this presentation use non-GAAP information of net interest income, FTE adjustments, earning assets, and various ratios
using one or more of those measures. That information is not presented according to generally accepted accounting principles
(GAAP) & is reconciled to GAAP information below.
Net Interest Margin ($ in millions) 2Q14 1Q14 4Q13 3Q13 2Q13
Regional Banking Net interest income (GAAP) $149 $142 $146 $150 $148
Regional Banking FTE adjustment $2 $2 $2 $2 $2
Regional Banking Net interest income adjusted for impact of FTE (Non- GAAP) $151 $144 $148 $151 $150
Capital Markets Net interest income (GAAP) $3 $3 $4 $4 $4
Capital Markets FTE adjustment $0 $0 $0 $0 $0
Capital Markets Net interest income adjusted for impact of FTE (Non-GAAP) $3 $4 $4 $4 $4
Corporate Net interest income (GAAP)—$11—$9—$10—$12—$11
Corporate FTE adjustment $0 $0 $0 $0 $0
Corporate Net interest income adjusted for impact of FTE (Non-GAAP)—$11—$9—$10—$12—$11
Core Businesses Net interest income (Non- GAAP)1 $141 $136 $140 $142 $141
Core Businesses FTE adjustment (Non- GAAP)1 $2 $2 $2 $2 $2
Core Businesses Net interest income adjusted for impact of FTE (Non-GAAP)¹ $143 $138 $142 $144 $143
Non-Strategic Net interest income (GAAP) $16 $16 $17 $17 $19
Non-Strategic FTE adjustment $0 $0 $0 $0 $0
Non-Strategic Net interest income adjusted for impact of FTE (Non-GAAP) $16 $16 $17 $17 $19
Consolidated Net interest income (GAAP) $157 $152 $157 $159 $160
Consolidated FTE adjustment $2 $2 $2 $2 $2
Consolidated Net interest income adjusted for impact of FTE (Non-GAAP) $159 $154 $159 $161 $162
Average Earning Assets 2Q14
Regional Banking Earning Assets (GAAP) $12,429
Capital Markets Earning Assets (GAAP) $1,780
Corporate Earning Assets (GAAP) $4,082
Core Businesses Earning Assets (Non-GAAP)¹ $18,290
Non-Strategic Earning Assets (GAAP) $3,202
Consolidated Earning Assets (GAAP) $21,493
Core Businesses NIM with 200bps Rate Shock1 2Q14
Annualized Core Businesses Net interest income adjusted for impact of FTE (Non-GAAP) a $574
Core Businesses Average Earning Assets (Non-GAAP) b $18,290
Core Businesses NIM (Non-GAAP) a/b 3.14%
Core Businesses Additional Annual NII from a 200bps Rate Shock (Non- GAAP)² c $63
Core Businesses NIM with 200bps Rate Shock (Non-GAAP) (a+c)/b 3.48%
Annualized Consolidated Net interest income adjusted for impact of FTE (Non-GAAP) d $639
Consolidated Average Earning Assets (GAAP) e $21,493
Consolidated NIM (GAAP) d/e 2.97%
Consolidated Additional Annual NII from a 200bps Rate Shock (Non-GAAP)² f $63
Consolidated NIM with 200bps Rate Shock (Non-GAAP) (d+f)/e 3.26%
Numbers may not add to total due to rounding.
1Core Businesses include the Regional Banking, Capital Markets, and Corporate segments.
2All else equal, a 200bps rate shock results in ~$63mm increase in Core Businesses annual NII (see slide 13), as Non-Strategic is interest rate neutral.
27
|
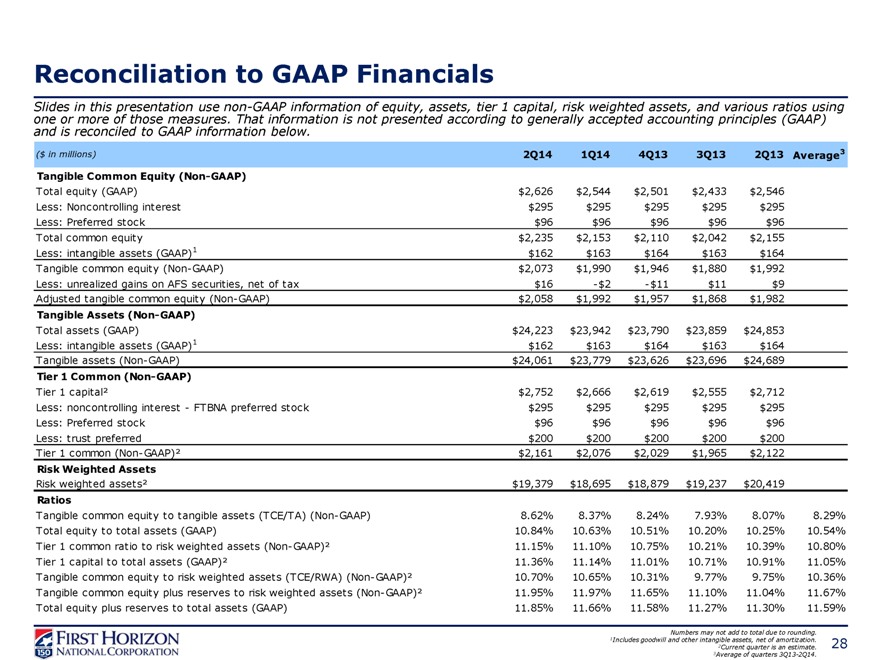 |
Reconciliation to GAAP Financials
Slides in this presentation use non-GAAP information of equity, assets, tier 1 capital, risk weighted assets, and various ratios using
one or more of those measures. That information is not presented according to generally accepted accounting principles (GAAP)
and is reconciled to GAAP information below.
($ in millions) 2Q14 1Q14 4Q13 3Q13 2Q13 Average3
Tangible Common Equity (Non-GAAP)
Total equity (GAAP) $2,626 $2,544 $2,501 $2,433 $2,546
Less: Noncontrolling interest $295 $295 $295 $295 $295
Less: Preferred stock $96 $96 $96 $96 $96
Total common equity $2,235 $2,153 $2,110 $2,042 $2,155
Less: intangible assets (GAAP)1 $162 $163 $164 $163 $164
Tangible common equity (Non- GAAP) $2,073 $1,990 $1,946 $1,880 $1,992
Less: unrealized gains on AFS securities, net of tax $16-$2-$11 $11 $9
Adjusted tangible common equity (Non- GAAP) $2,058 $1,992 $1,957 $1,868 $1,982
Tangible Assets (Non-GAAP)
Total assets (GAAP) $24,223 $23,942 $23,790 $23,859 $24,853
Less: intangible assets (GAAP)1 $162 $163 $164 $163 $164
Tangible assets (Non- GAAP) $24,061 $23,779 $23,626 $23,696 $24,689
Tier 1 Common (Non-GAAP)
Tier 1 capital² $2,752 $2,666 $2,619 $2,555 $2,712
Less: noncontrolling interest-FTBNA preferred stock $295 $295 $295 $295 $295
Less: Preferred stock $96 $96 $96 $96 $96
Less: trust preferred $200 $200 $200 $200 $200
Tier 1 common (Non- GAAP)² $2,161 $2,076 $2,029 $1,965 $2,122
Risk Weighted Assets
Risk weighted assets² $19,379 $18,695 $18,879 $19,237 $20,419
Ratios
Tangible common equity to tangible assets (TCE/TA) (Non- GAAP) 8.62% 8.37% 8.24% 7.93% 8.07% 8.29%
Total equity to total assets (GAAP) 10.84% 10.63% 10.51% 10.20% 10.25% 10.54%
Tier 1 common ratio to risk weighted assets (Non- GAAP)² 11.15% 11.10% 10.75% 10.21% 10.39% 10.80%
Tier 1 capital to total assets (GAAP)² 11.36% 11.14% 11.01% 10.71% 10.91% 11.05%
Tangible common equity to risk weighted assets (TCE/RWA) (Non- GAAP)² 10.70% 10.65% 10.31% 9.77% 9.75% 10.36%
Tangible common equity plus reserves to risk weighted assets (Non- GAAP)² 11.95% 11.97% 11.65% 11.10% 11.04% 11.67%
Total equity plus reserves to total assets (GAAP) 11.85% 11.66% 11.58% 11.27% 11.30% 11.59%
Numbers may not add to total due to rounding.
1Includes goodwill and other intangible assets, net of amortization.
2Current quarter is an estimate.
3Average of quarters 3Q13-2Q14.
28
|
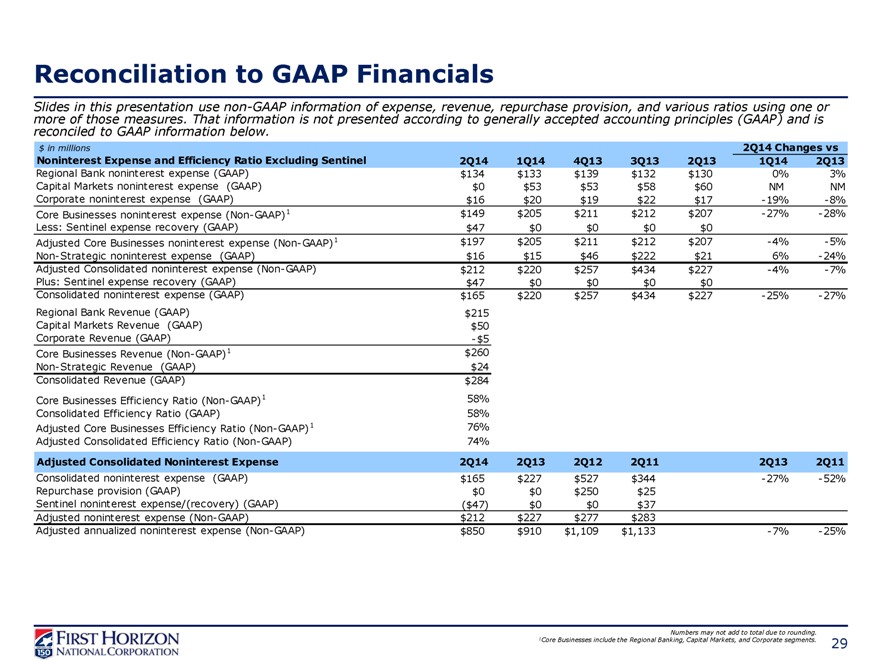 |
Reconciliation to GAAP Financials
Slides in this presentation use non-GAAP information of expense, revenue, repurchase provision, and various ratios using one or
more of those measures. That information is not presented according to generally accepted accounting principles (GAAP) and is
reconciled to GAAP information below.
$ in millions 2Q14 Changes vs
Noninterest Expense and Efficiency Ratio Excluding Sentinel 2Q14 1Q14 4Q13 3Q13 2Q13 1Q14 2Q13
Regional Bank noninterest expense (GAAP) $134 $133 $139 $132 $130 0% 3%
Capital Markets noninterest expense (GAAP) $0 $53 $53 $58 $60 NM NM
Corporate noninterest expense (GAAP) $16 $20 $19 $22 $17—19%—8%
Core Businesses noninterest expense (Non-GAAP)1 $149 $205 $211 $212 $207—27%—28%
Less: Sentinel expense recovery (GAAP) $47 $0 $0 $0 $0
Adjusted Core Businesses noninterest expense (Non-GAAP)1 $197 $205 $211 $212 $207—4%—5%
Non-Strategic noninterest expense (GAAP) $16 $15 $46 $222 $21 6%—24%
Adjusted Consolidated noninterest expense (Non-GAAP) $212 $220 $257 $434 $227—4%—7%
Plus: Sentinel expense recovery (GAAP) $47 $0 $0 $0 $0
Consolidated noninterest expense (GAAP) $165 $220 $257 $434 $227—25%—27%
Regional Bank Revenue (GAAP) $215
Capital Markets Revenue (GAAP) $50
Corporate Revenue (GAAP) -$5
Core Businesses Revenue (Non-GAAP)1 $260
Non-Strategic Revenue (GAAP) $24
Consolidated Revenue (GAAP) $284
Core Businesses Efficiency Ratio (Non-GAAP)1 58%
Consolidated Efficiency Ratio (GAAP) 58%
Adjusted Core Businesses Efficiency Ratio (Non-GAAP)1 76%
Adjusted Consolidated Efficiency Ratio (Non-GAAP) 74%
Adjusted Consolidated Noninterest Expense 2Q14 2Q13 2Q12 2Q11 2Q13 2Q11
Consolidated noninterest expense (GAAP) $165 $227 $527 $344 —27%—52%
Repurchase provision (GAAP) $0 $0 $250 $25
Sentinel noninterest expense/(recovery) (GAAP) ($47) $0 $0 $37
Adjusted noninterest expense (Non-GAAP) $212 $227 $277 $283
Adjusted annualized noninterest expense (Non-GAAP) $850 $910 $1,109 $1,133 —7%—25%
Numbers may not add to total due to rounding.
1Core Businesses include the Regional Banking, Capital Markets, and Corporate segments.
29
|
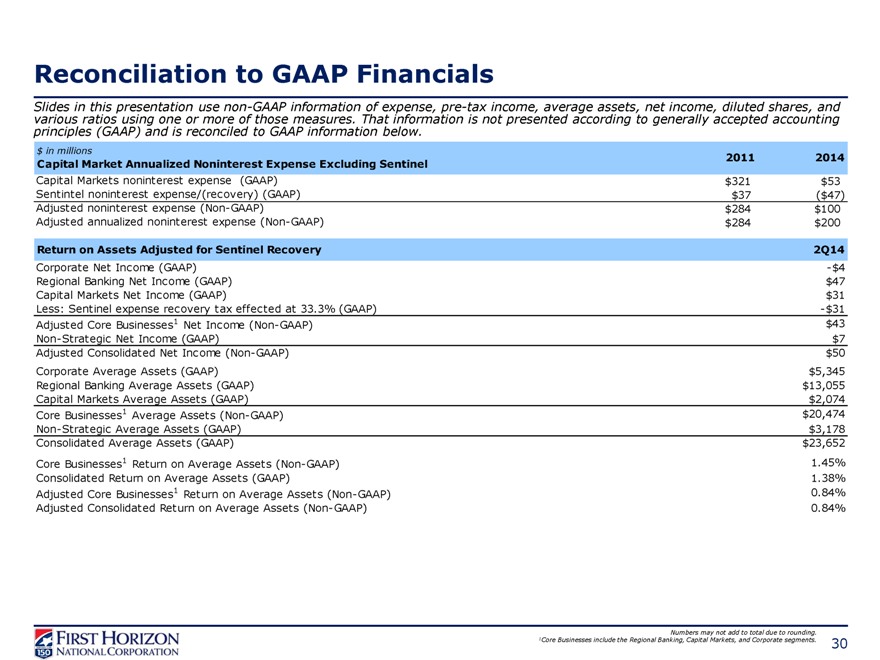 |
Reconciliation to GAAP Financials
Slides in this presentation use non-GAAP information of expense, pre-tax income, average assets, net income, diluted shares, and
various ratios using one or more of those measures. That information is not presented according to generally accepted accounting
principles (GAAP) and is reconciled to GAAP information below.
$ in millions
Capital Market Annualized Noninterest Expense Excluding Sentinel 2011 2014
Capital Markets noninterest expense (GAAP) $321 $53
Sentintel noninterest expense/(recovery) (GAAP) $37 ($47)
Adjusted noninterest expense (Non-GAAP) $284 $100
Adjusted annualized noninterest expense (Non-GAAP) $284 $200
Return on Assets Adjusted for Sentinel Recovery 2Q14
Corporate Net Income (GAAP) -$4
Regional Banking Net Income (GAAP) $47
Capital Markets Net Income (GAAP) $31
Less: Sentinel expense recovery tax effected at 33.3% (GAAP) -$31
Adjusted Core Businesses1 Net Income (Non-GAAP) $43
Non-Strategic Net Income (GAAP) $7
Adjusted Consolidated Net Income (Non-GAAP) $50
Corporate Average Assets (GAAP) $5,345
Regional Banking Average Assets (GAAP) $13,055
Capital Markets Average Assets (GAAP) $2,074
Core Businesses1 Average Assets (Non-GAAP) $20,474
Non-Strategic Average Assets (GAAP) $3,178
Consolidated Average Assets (GAAP) $23,652
Core Businesses1 Return on Average Assets (Non-GAAP) 1.45%
Consolidated Return on Average Assets (GAAP) 1.38%
Adjusted Core Businesses1 Return on Average Assets (Non-GAAP) 0.84%
Adjusted Consolidated Return on Average Assets (Non-GAAP) 0.84%
Numbers may not add to total due to rounding.
1Core Businesses include the Regional Banking, Capital Markets, and Corporate segments.
30
|
 |
Reconciliation to GAAP Financials
Slides in this presentation use non-GAAP information of revenue, expense, and various ratios using one or more of those
measures. That information is not presented according to generally accepted accounting principles (GAAP) and is reconciled to
GAAP information below.
Regional Banking Pre-Provision Net Revenue ($ in millions) 2Q14 1Q14 2Q13
Regional Banking Total Revenue (GAAP) $215 $202 $210
Regional Banking Total Expense (GAAP) $134 $133 $130
Regional Banking Pre-Provision Net Revenue (Non-GAAP) $81 $69 $81
Core Businesses Expense ($ in millions) 2Q14 1Q14 2Q13
Regional Banking Expense (GAAP) $134 $133 $130
Capital Markets Expense (GAAP) $0 $53 $60
Corporate Expense (GAAP) $16 $20 $17
Core Businesses’ Expense1 (Non-GAAP) $149 $205 $207
Non-Strategic Expense (GAAP) $16 $15 $21
Consolidated Expense (GAAP) $165 $220 $227
Peer group includes UBSI, ONB, TRMK, IBKC, BXS, UMBF, BOH, VLY, FULT, FCNCA, WTFC, TCB, SUSQ, HBHC, WBS, CBSH, CFR, ASBC, SNV, BOKF, FNFG. Peer data is as of 1Q14.
Numbers may not add to total due to rounding.
1Core Businesses include the Regional Banking, Capital Markets, and Corporate segments.
31