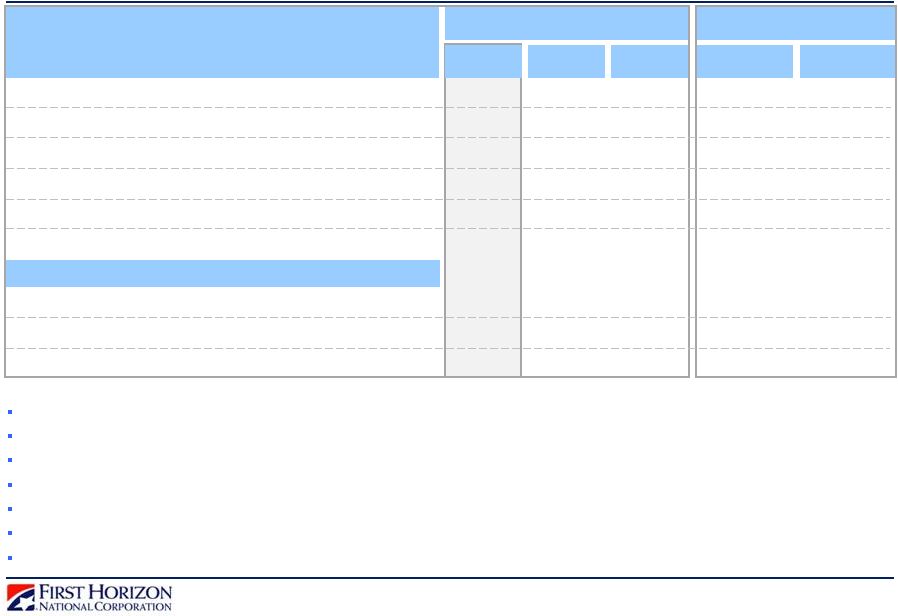
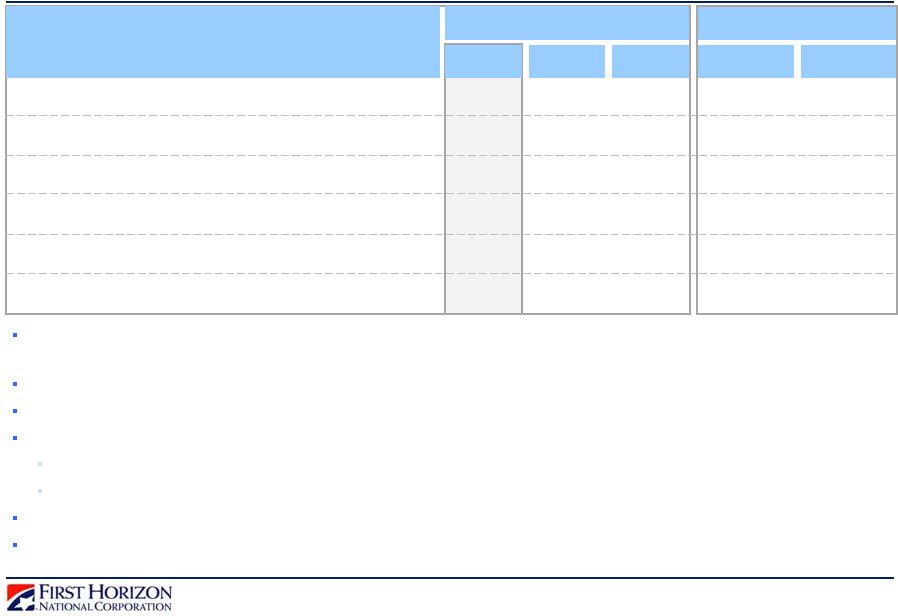
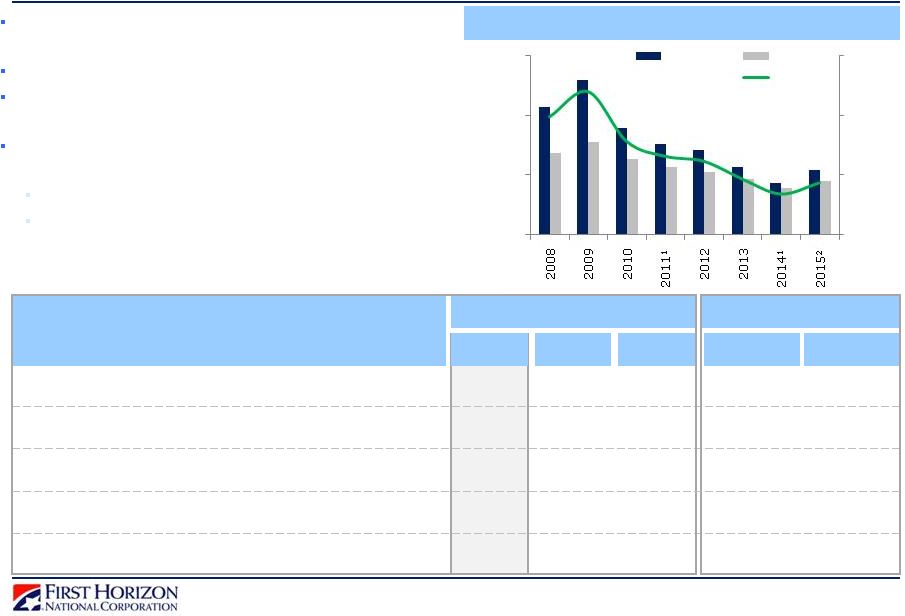
Reconciliation to GAAP Financials 26 Numbers may not add to total due to rounding. 1 Core Businesses include the Regional Banking, Capital Markets, and Corporate segments. 2 All else equal, a 200bps rate shock results in ~$78mm increase in Core Businesses annual NII (see slide 11), as Non-Strategic is interest rate neutral. Slides in this presentation use non-GAAP information of expense, revenue, repurchase provision, and various ratios using one or more of those measures. That information is not presented according to generally accepted accounting principles (GAAP) and is reconciled to GAAP information below. Net Interest Margin ($ in millions) 1Q15 4Q14 3Q14 2Q14 1Q14 Regional Banking Net Interest Income (GAAP) $154 $158 $154 $149 $142 Regional Banking FTE Adjustment $2 $2 $2 $2 $2 Regional Banking Net Interest Income Adjusted for Impact of FTE (Non-GAAP) $157 $160 $156 $151 $144 Capital Markets Net Interest Income (GAAP) $4 $4 $3 $3 $3 Capital Markets FTE Adjustment $0 $0 $0 $0 $0 Capital Markets Net Interest Income Adjusted for Impact of FTE (Non-GAAP) $5 $4 $3 $3 $4 Corporate Net Interest Income (GAAP) -$16 -$18 -$14 -$12 -$10 Corporate FTE Adjustment $0 $0 $0 $0 $0 Corporate Net Interest Income Adjusted for Impact of FTE (Non-GAAP) -$16 -$18 -$14 -$12 -$10 Core Businesses Net Interest Income (Non-GAAP) 1 $143 $143 $143 $139 $136 Core Businesses FTE Adjustment (Non-GAAP) 1 $3 $3 $2 $2 $2 Core Businesses Net Interest Income Adjusted for Impact of FTE (Non-GAAP) $145 $146 $145 $142 $138 Non-Strategic Net Interest Income (GAAP) $14 $16 $17 $17 $17 Non-Strategic FTE Adjustment $0 $0 $0 $0 $0 Non-Strategic Net Interest Income Adjusted for Impact of FTE (Non-GAAP) $14 $16 $17 $17 $17 Consolidated Net Interest Income (GAAP) $157 $159 $160 $157 $152 Consolidated FTE Adjustment $3 $3 $2 $2 $2 Consolidated Net Interest Income Adjusted for Impact of FTE (Non-GAAP) $159 $162 $162 $159 $154 Average Earning Assets 1Q15 Regional Banking Earning Assets (GAAP) $13,561 Capital Markets Earning Assets (GAAP) $2,147 Corporate Earning Assets (GAAP) $5,162 Core Businesses Earning Assets (Non-GAAP) $20,870 Non-Strategic Earning Assets (GAAP) $2,604 Consolidated Earning Assets (GAAP) $23,474 Core Businesses NIM with 200bps Rate Shock 1 1Q15 Annualized Core Businesses Net Interest Income Adjusted for Impact of FTE (Non-GAAP) a $589 Core Businesses Average Earning Assets (Non-GAAP) b $20,870 Core Businesses NIM (Non-GAAP) a/b 2.81% Core Businesses Additional Annual NII from a 200bps Rate Shock (Non-GAAP) c $78 Core Businesses NIM with 200bps Rate Shock (Non-GAAP) (a+c)/b 3.19% Annualized Consolidated Net Interest Income Adjusted for Impact of FTE (Non-GAAP) d $646 Consolidated Average Earning Assets (GAAP) e $23,474 Consolidated NIM (GAAP) d/e 2.74% Consolidated Additional Annual NII from a 200bps Rate Shock (Non-GAAP) f $78 Consolidated NIM with 200bps Rate Shock (Non-GAAP) (d+f)/e 3.09% ² ² 1 1 |