UNITED STATES
SECURITIES AND EXCHANGE COMMISSION
Washington, D.C. 20549
FORM 10-K
| x | ANNUAL REPORT PURSUANT TO SECTION 13 OR 15(d) OF THE SECURITIES EXCHANGE ACT OF 1934 |
For the Fiscal Year Ended December 31, 2013
or
| ¨ | TRANSITION REPORT PURSUANT TO SECTION 13 OR 15(d) OF THE SECURITIES EXCHANGE ACT OF 1934 |
For the transition period from to
Commission File Number 1-6249
WINTHROP REALTY TRUST
(Exact name of Registrant as specified in its certificate of incorporation)
| | |
| Ohio | | 34-6513657 |
(State or other jurisdiction of incorporation or organization) | | (IRS Employer Identification Number) |
| |
| 7 Bulfinch Place, Suite 500, Boston, Massachusetts | | 02114 |
| (Address of principal executive offices) | | (Zip Code) |
(617) 570-4614
(Registrant’s telephone number, including area code)
Securities registered pursuant to Section 12(b) of the Act:
| | |
Title of Each Class | | Name of Exchange on Which Registered |
| Common Shares, $1.00 par value | | New York Stock Exchange |
| 9.25% Series D Cumulative Redeemable Shares, $1.00 par value | | New York Stock Exchange |
Securities registered pursuant to Section 12(g) of the Act: None
Indicate by check mark if the registrant is a well-known seasoned issuer, as defined in Rule 405 of the Securities Act. Yes ¨ No x
Indicate by check mark if the registrant is not required to file reports pursuant to Section 13 or Section 15(d) of the Act. Yes ¨ No x
Indicate by check mark whether the registrant (1) has filed all reports required to be filed by Section 13 or 15(d) of the Securities and Exchange Act of 1934 during the preceding 12 months (or for such shorter period that the registrant was required to file such reports), and (2) has been subject to such filing requirements for at least the past 90 days. Yes x No ¨
Indicate by check mark whether the registrant has submitted electronically and posted on its corporate Web site, if any, every Interactive Data File required to be submitted and posted pursuant to Rule 405 of Regulation S-T (§ 232.405 of this chapter) during the preceding 12 months (or for such shorter period that the registrant was required to submit and post such files). Yes x No ¨
Indicate by check mark if disclosure of delinquent filers pursuant to Item 405 of Regulation S-K is not contained herein, and will not be contained, to the best of registrant’s knowledge, in definitive proxy or information statements incorporated by reference in Part III of this Form 10-K or any amendment to this Form 10-K. ¨
Indicate by check mark whether the registrant is a large accelerated filer, an accelerated filer, a non-accelerated filer, or a smaller reporting company. See the definitions of “large accelerated filer,” “accelerated filer,” and “smaller reporting company” in Rule 12b-2 of the Exchange Act. (Check one):
| | | | | | |
| Large accelerated filer | | ¨ | | Accelerated filer | | x |
| | | |
| Non-accelerated filer | | ¨ (Do not check if a smaller reporting company) | | Smaller reporting company | | ¨ |
Indicate by check mark whether the registrant is a shell company (as defined in Exchange Act Rule 12b-2). Yes ¨ No x
As of March 1, 2014, there were 36,409,710 Common Shares outstanding.
At June 30, 2013, the aggregate market value of the Common Shares held by non-affiliates was $394,931,691.
DOCUMENTS INCORPORATED BY REFERENCE
Portions of the registrant’s definitive Proxy Statement for the Annual Meeting of Shareholders, which is expected to be filed with the Securities and Exchange Commission within 120 days after the Registrant’s fiscal year ended December 31, 2013, are incorporated by reference into Part III hereof.
WINTHROP REALTY TRUST
CROSS REFERENCE SHEET PURSUANT TO ITEM G,
GENERAL INSTRUCTIONS TO FORM 10-K
2
CAUTIONARY STATEMENTS CONCERNING FORWARD-LOOKING STATEMENTS
Any statements included in this prospectus, including any statements in the document that are incorporated by reference herein that are not strictly historical are forward-looking statements within the meaning of the safe harbor provisions of the Private Securities Litigation Reform Act of 1995. Any such forward-looking statements contained or incorporated by reference herein should not be relied upon as predictions of future events. Certain such forward-looking statements can be identified by the use of forward-looking terminology such as “believes,” “expects,” “may,” “will,” “should,” “seeks,” “approximately,” “intends,” “plans,” “pro forma,” “estimates” or “anticipates” or the negative thereof or other variations thereof or comparable terminology, or by discussions of strategy, plans, intentions or anticipated or projected events, results or conditions. Such forward-looking statements are dependent on assumptions, data or methods that may be incorrect or imprecise and they may be incapable of being realized. Such forward-looking statements include statements with respect to:
| | • | | the declaration or payment of dividends by us; |
| | • | | the ownership, management and operation of properties; |
| | • | | potential acquisitions or dispositions of our properties, assets or other businesses; |
| | • | | our policies regarding investments, acquisitions, dispositions, financings and other matters; |
| | • | | our qualification as a real estate investment trust under the Internal Revenue Code of 1986, as amended, which we refer to as the Code; |
| | • | | the real estate industry and real estate markets in general; |
| | • | | the availability of debt and equity financing; |
| | • | | general economic conditions; |
| | • | | supply of real estate investment opportunities and demand; |
| | • | | trends affecting us or our assets; |
| | • | | the effect of acquisitions or dispositions on capitalization and financial flexibility; |
| | • | | the anticipated performance of our assets and of acquired properties and businesses, including, without limitation, statements regarding anticipated revenues, cash flows, funds from operations, earnings before interest, depreciation and amortization, property net operating income, operating or profit margins and sensitivity to economic downturns or anticipated growth or improvements in any of the foregoing; and |
| | • | | our ability, and that of our assets and acquired properties and businesses to grow. |
You are cautioned that, while forward-looking statements reflect our good faith beliefs, they are not guarantees of future performance and they involve known and unknown risks and uncertainties. Actual results may differ materially from those in the forward-looking statements as a result of various factors. The information contained or incorporated by reference in this report and any amendment hereof, including, without limitation, the information set forth in “Item 1A - Risk Factors” below or in any risk factors in documents that are incorporated by reference in this report, identifies important factors that could cause such differences. We undertake no obligation to publicly release the results of any revisions to these forward-looking statements that may reflect any future events or circumstances.
3
PART I
General
Winthrop Realty Trust is a real estate investment trust formed under the laws of the State of Ohio. We conduct our business through our wholly owned operating partnership, WRT Realty L.P., a Delaware limited partnership, which we refer to as the Operating Partnership. All references to the “Trust”, “we”, “us”, “our”, “WRT” or the “Company” refer to Winthrop Realty Trust and its consolidated subsidiaries, including the Operating Partnership.
We are engaged in the business of owning real property and real estate related assets which we categorize into three reportable segments: (i) the ownership of investment properties including wholly owned properties and investments in joint ventures which own investment properties, which we refer to as operating properties; (ii) the origination and acquisition of senior loans, mezzanine loans and debt securities collateralized directly or indirectly by commercial and multi-family real property, which we refer to as loan assets; and (iii) the ownership of equity and debt interests in other real estate investment trusts (REITs), which we refer to as REIT securities.
At December 31, 2013 we held (i) interests in operating properties totaling $868,736,000 containing approximately 5.3 million square feet of rentable space and 6,204 apartment units; (ii) loan assets totaling $147,702,000 and (iii) cash and cash equivalents of $112,512,000. We did not hold any REIT securities at December 31, 2013.
Our executive offices are located at 7 Bulfinch Place, Suite 500, Boston, Massachusetts 02114 and Two Jericho Plaza, Jericho, New York 11753. Our telephone number is (617) 570-4614 and our website is located athttp://www.winthropreit.com. The information contained on our website does not constitute part of this Annual Report on Form 10-K. On our website you can obtain, free of charge, a copy of our Annual Report on Form 10-K, Quarterly Reports on Form 10-Q, Current Reports on Form 8-K and amendments to those reports filed or furnished pursuant to Section 13(a) or 15(d) of the Exchange Act of 1934, as amended, as soon as reasonably practicable after we file such material electronically with, or furnish it to, the Securities and Exchange Commission, which we refer to as the SEC.
History
We began operations in 1961 under the name First Union Real Estate Equity and Mortgage Investments and changed our name to Winthrop Realty Trust in 2005. Since January 1, 2004, we have been externally managed by FUR Advisors LLC, which we refer to as FUR Advisors or our Advisor. Prior to this past year, FUR Advisors was an entity owned by our current executive officer sand senior management and members of senior management of AREA Property Partners, a New York based real estate investment advisor. During 2013, certain of the AREA senior management member’s interest in FUR Advisor was redeemed and, as a result, FUR Advisors is now majority owned by our current executive officers and senior management, including Michael L. Ashner and Carolyn Tiffany.
Commencing January 1, 2004, we began to seek out more opportunistic investments across the real estate spectrum, whether they be operating properties, loan assets or REIT securities. On January 1, 2005 we elected to form the Operating Partnership and contributed all of our assets to the Operating Partnership in exchange for 100% of the ownership interests in the Operating Partnership. Our Operating Partnership structure, commonly referred to as an umbrella partnership real estate investment trust, provides us with additional flexibility when acquiring properties as it enables us to acquire properties for cash and/or by issuing to sellers, as a form of consideration, limited partnership interests in our operating partnership thereby enabling us to structure transactions which may defer tax gains for a seller while preserving our available cash for other purposes.
Management
We have engaged FUR Advisors to administer our affairs including seeking, servicing and managing our investments. For providing these and other services, FUR Advisors is entitled to a base management fee and, in certain instances, an incentive fee and termination fee. See “Employees” below for a description of the fees payable to FUR Advisors.
Pursuant to our bylaws, the consent of our Board of Trustees is required to acquire or dispose of an investment with a value in excess of $10,000,000. Our executive officers are permitted to acquire or dispose of an investment with an aggregate value of $10,000,000 or less without the consent of our Board of Trustees. However, if such transaction is with (i) our Advisor (and any successor advisor), Michael Ashner, or any of their respective affiliates; (ii) certain stated entities which are, or were, affiliated with us; (iii) a beneficial owner of more than 4.9% of our outstanding common shares of beneficial interest which we refer to as our Common Shares, either directly or upon the conversion of any of our preferred shares; or (iv) a beneficial owner of more than 4.9% of any other entity in which we hold a 10% or greater interest, then regardless of the amount of the transaction, such transaction must be approved by a majority of our independent trustees, acting in their capacity as members of our Conflicts Committee.
4
Investment, Operating and Capital Strategy
We are engaged in the business of owning and managing real property and real estate related assets. Our business objective is to maximize long term shareholder value through a total return value approach to real estate investing which emphasizes superior risk adjusted returns. These investments have in the past had, and may in the future have, returns weighted towards the back end of the invested life which negatively impact current earnings and funds from operations or FFO. As a result of our emphasis on total return, while we seek to achieve a stable, predictable dividend for our shareholders, we do not select or manage our investments for short-term dividend growth, but rather towards achieving overall superior total return. While this approach may result in short-term uneven earnings, we believe this approach will result in long term increased entity value.
We are a diversified REIT and as such we are able to invest in transactions which a dedicated REIT with narrow investment parameters would be unable to consider, resulting in a broad range of investment opportunities. These opportunities include different investment types, sectors and geographic areas all at varying levels in the capital stack. In addition, because of our size we are able to make investments in transactions that are smaller and would generally be disregarded by larger real estate investors. Further, we also acquire assets through joint ventures and strategic alliances which allows us to employ third party co-investment capital to maximize diversification of risk and reduce capital concentration and, in certain instances, leverage off our joint venture partner’s experience and expertise in specific geographic areas and/or specific asset types.
While we invested substantial capital in significant new investments in 2013, most notably the portfolio acquisition of four luxury residential multifamily high rise apartment buildings and our election to participate in the hotel portion of our 701 Seventh Avenue investment, we have of late observed very competitive pricing for quality real estate assets. We believe this pricing is a product of a continued relatively low interest rate environment and increasing amounts of capital directed to real estate and real estate related assets. We presently expect that during 2014, absent a change in the macroeconomic economy, new opportunities that meet our investment criteria may be limited. Nevertheless, we will continue to seek new investments and look to our existing portfolio for follow-on investment opportunities.
Consistent with this view, we have evaluated our stabilized mature assets with a view towards selling those assets to take advantage of rising prices and have begun executing on such sales. In so doing, we may increase our cash balances in order to take advantage of changes in the macroeconomic environment that may create favorable investment opportunities or consider other alternatives.
Subject to economic and credit market conditions, we will seek to:
| • | | acquire operating properties of specific property types and locations that we believe: |
| | • | | present an opportunity to outperform the marketplace while providing recurring current or potentially recurring cash flow, or |
| | • | | can provide superior returns through an infusion of capital and/or improved management; |
| • | | acquire portfolios or interests in portfolios at properties with characteristics similar to the above; |
| • | | acquire loan assets using the same criteria for operating properties, as well as consideration of loan assets that may present an opportunity for us to acquire through foreclosure or otherwise an equity interest in the underlying real estate collateral; |
| • | | acquire securities issued by other REITs we believe are undervalued; and |
| • | | divest investments as they mature in value to the point where we may be unlikely to achieve better than market returns in order to redeploy capital to what we believe to be higher yielding opportunities. Consistent with our total return approach to investing, it is not possible to predict when we will exit any particular investment. |
Our primary sources of income are rental income and tenant recoveries from leases of our operating properties, interest income and discount accretion from our loan assets, and interest and dividend income and appreciation from our investments in REIT securities.
We utilize leverage to enhance our total potential return. We seek to limit risk associated with utilization of leverage by seeking to make our investments through discrete single purpose entities in which we do not guaranty, other than customary environmental and recourse carve-out guarantees and, in certain instances, interest guarantees as credit enhancements, the debt of our single purpose subsidiaries, thereby limiting the risk of loss to that particular investment or joint venture.
5
As a REIT, we are primarily dependent on external equity and debt financing to fund the growth of our business. The dividend requirements for a REIT significantly limit our ability to re-invest cash flow and capital proceeds. We have historically used public equity markets, joint venture equity, and secured financing as our primary sources of capital. This includes raising capital through public offerings of equity and debt securities. In this regard, in September 2013 we issued an additional 2,750,000 Common Shares through a public offering. We expect to continue to fund our investments through one or a combination of: cash reserves, borrowings under our credit facility, redeployment of capital from timely asset sales, property loans, the issuance of debt or equity securities and the formation of joint ventures. Finally, we maintain a stock purchase and dividend reinvestment plan which enables our existing shareholders to reinvest their dividends as well as purchase additional shares at a discounted price.
Assets
Operating Properties
See Item 2. Properties for a description of our Operating Properties
Operating Property Acquisition and Financing Activities
1515 Market Street – loan modification, equity acquisition and refinancing – On December 12, 2012 we acquired for $58,650,000 a $70,000,000 non-performing first mortgage loan collateralized by a 20 story, 514,000 square foot office building located at 1515 Market Street, Philadelphia, Pennsylvania (“1515 Market Street”). On February 1, 2013 we entered into a loan modification agreement which extended the maturity date to February 1, 2016, increased the loan balance to $71,629,000, from $70,000,000, and changed the interest rate to be the greater of 7.5% or LIBOR plus 6.5%.
Simultaneously with the modification of the loan, we acquired, for $10,000, an indirect 49% equity interest, including the 0.1% general partner interest, in the entity (“1515 Market Owner”) that owns the property located at 1515 Market Street, Philadelphia, Pennsylvania. As a result, we consolidate this property as of February 1, 2013 and all intercompany transactions, including those associated with our loan receivable are eliminated in consolidation.
On April 25, 2013 1515 Market Owner obtained a $43,000,000 non-recourse first mortgage loan (the “1515 First Mortgage”) from an unaffiliated third party. The 1515 First Mortgage bears interest at LIBOR plus 2.0% per annum, requires monthly payments of interest only and matures on May 1, 2016. On the same date, the 1515 Market Owner entered into an interest rate swap agreement which effectively fixes LIBOR at 0.50% for the term of the 1515 First Mortgage. We received $38,472,000 of loan proceeds from the 1515 First Mortgage financing which reduced the balance on the mortgage loan we hold to $33,157,000. The loan balance can be increased through future funding advances up to an aggregate of $6,000,000 to cover tenant improvements, capital expenditures and leasing commissions. For each $500,000 of future advances, the interest rate increases by 0.10%. As of December 31, 2013 we had advanced an additional $1,500,000 resulting in a 0.3% increase in the interest rate. The loan modification also provides us with a 40% participation interest in the case of a capital event. At December 31, 2013 the loan we hold had a balance of $36,171,000 inclusive of accrued interest, and entitles us to interest in an amount equal to a rate of 14.3% (subject to increase by 0.10% for each additional $500,000 we advance). At December 31, 2013 our investment in this loan was $21,098,000 resulting in an effective interest rate on our cash investment in this asset of 19.6%.
Summit Pointe Apartments – property acquisition – On October 25, 2013 we contributed $4,962,000 for an 80% equity interest in a newly formed venture. On the same date, the venture acquired a 184 unit garden apartment complex known as Summit Pointe Apartments located in Oklahoma City, Oklahoma for a gross purchase price of $14,500,000. In connection with the acquisition, the venture assumed an existing $9,248,000 first mortgage loan. The loan bears interest at a rate of 5.7% per annum, requires monthly payments of principal and interest and matures in February 2021. Pursuant to the terms of the venture agreement, we hold an equity interest which entitles us to an 8% priority return from cash flow and, upon disposition of the property, a minimum priority return equal to a 12% IRR.
Luxury Residential – property acquisition – On October 31, 2013 we acquired through a wholly owned venture four newly constructed luxury apartment buildings for an aggregate purchase price of $246,000,000. The properties are located in Phoenix, Arizona; Stamford, Connecticut; Houston, Texas and San Pedro, California. The properties consist of an aggregate of 761 unsold residential condominium or apartment units and approximately 25,000 square feet of retail space. The acquisition was funded with a $150,000,000 first mortgage loan which is cross collateralized by all four properties. The loan bears interest at a rate of LIBOR plus 2%, requires monthly payments of interest only and matures on October 31, 2016 with two one year extension options. The balance of the purchase was funded from cash on hand. On the same date, the venture
6
entered into an interest rate swap agreement which effectively fixes LIBOR at 0.69% for the initial term of the first mortgage. In addition, the venture acquired two interest rate caps, each with a notional amount of $50,000,000 for an aggregate cost of $390,000. The initial cap is effective for the first one year extension period and caps LIBOR at 4%. The second cap is effective for the second one year extension period and caps LIBOR at 5%.
On November 6, 2013 New Valley LLC (“New Valley”) contributed approximately $16,365,000 to the entity that acquired the properties in exchange for an indirect 16.3% interest in the properties. We retained an 83.7% interest in the venture and have the right to make all decisions with respect to each of the properties, other than the Stamford, Connecticut property, subject to obtaining New Valley’s consent to certain major decisions. With respect to the Stamford, Connecticut property, prior to November 6, 2016 the consent of New Valley is required on all matters other than those that are administrative in nature. New Valley has the right at any time after November 6, 2015 (or in certain instances prior thereto), but on or prior to November 6, 2016, to have its interest in the venture redeemed for a 50% interest in the Stamford, Connecticut property.
Amherst, New York –During 2013 we acquired four residential parcels adjacent to our Amherst, New York office property for an aggregate purchase price of $896,000. We are in the process of leveling the acquired parcels and expanding the parking area for the office property. Development of this property is expected to be completed during the second quarter of 2014. The total estimated cost to complete the development is $1,625,000, of which $482,000 has been incurred as of December 31, 2013.
Houston, Texas – Non Controlling Interest –During 2013 we acquired two additional 1⁄4 limited partner units in 5400 Westheimer Holder LP (“Westheimer”) for an aggregate price of $150,000. As a result of these transactions, we now own 32% of Westheimer.
Churchill, Pennsylvania – financing -On June 28, 2013 we obtained a $5,100,000 first mortgage on our Churchill, Pennsylvania property. The loan bears interest at a rate of 3.5% per annum, requires monthly payments of principal and interest and matures on August 1, 2024. After closing costs, we received net proceeds of approximately $4,922,000.
Operating Property Acquisitions and Financing Activity - Equity Investments
WRT-Elad Lender/Equity (Sullivan Center) – loan modification, equity investment and refinancing – On August 21, 2013 we acquired from an affiliate of Elad Canada Inc. (“Elad”), our joint venture partner, its 50% joint venture interest (the “Elad Interest”) in WRT-Elad One South State Lender LP (“Lender LP”) for $30,000,000 (“Acquisition Price”). The mezzanine loan had an outstanding balance of principal and accrued interest of approximately $56,150,000 at the time the Elad Interest was acquired. Concurrently with the acquisition of the Elad Interest, we entered into an option agreement (the “Elad Option”) which grants Elad the option, but not the obligation, to repurchase its interest in Lender LP for the Acquisition Price adjusted for the pro-rata portion of any accrued and unpaid interest and principal payments made by the borrower. Per the terms of the agreements, the Elad Interest and Elad Option cannot be transferred to parties other than us and Elad. The term of the Elad Option corresponds with Lender LP’s mezzanine loan.
On October 18, 2013 the owner of the Sullivan Center property obtained a new $113,500,000 first mortgage loan. The loan bears interest at a rate of 3.95% per annum, requires monthly payments of interest only and matures on November 6, 2018. The proceeds from the loan were used to repay the existing $110,550,000 first mortgage loan which bore interest at a rate of 11.0% per annum.
In February 2013 our joint venture which holds an indirect future interest in Sullivan Center increased its future ownership interest from 65% to 70%, which interest was further increased to 76% in November 2013. The increases were in exchange for a forbearance by Lender LP with respect to the failure by the borrower to make required debt service payments from January 2013 through October 2013. Our ownership interest becomes direct in 2018.
Atrium Mall LLC – equity investment -On June 20, 2013 we, through a newly formed 50-50 joint venture with Marc Realty, acquired a non-performing $10,650,000 mortgage loan for $6,625,000. In addition, the joint venture paid $1,137,000 to fund escrows at the closing. We invested a total of $3,935,000 in this joint venture during 2013. The loan was in maturity default at the time of acquisition and was acquired with the intention of foreclosing or working out a consensual assignment with the borrower. The loan was collateralized by a leasehold interest in the Atrium Mall in Chicago, Illinois. The leasehold interest is for 71,000 square feet of commercial/retail space that comprises the bottom three floors of an office building known as the James R. Thompson building of which the lease expires in September 2014 with six automatic five-year extensions which are exercisable at the lessee’s option. The building is owned by the State of Illinois.
7
On July 26, 2013 the joint venture entered into an agreement with the borrower pursuant to which the borrower conveyed the leasehold interest to the venture in lieu of foreclosure. Accordingly, the venture now holds the leasehold interest in the property.
701 Seventh Avenue, New York, New York – equity investment – During 2013, with respect to the joint venture that indirectly owns the property located at 701 Seventh Avenue, New York, New York we elected to participate in the future hotel development, and during 2013, we made additional cash contributions to the venture totaling $24,465,000. We have contributed an additional $33,419,000 in 2014 bringing our total capital contributed at such date to $86,855,000 against our $125,000,000 commitment. The contribution was made concurrently with the refinancing of the property’s existing indebtedness with a new $237,500,000 mortgage loan and $315,000,000 mezzanine loan of which $346,500,000 was advanced at closing with the balance to be advanced for constructions costs of the approximately 80,000 square feet of retail space which will include an approximately 120 foot high, 20,000 square foot state of the art LED sign. Both the mortgage loan and mezzanine loan bear interest at LIBOR plus 8% per annum, require payments of interest only and mature January 31, 2017, subject to two-one year extension terms. These loans refinanced the then existing mortgage and mezzanine loans that bore interest at LIBOR plus 11% per annum.
In addition, the venture also entered into two additional loan agreements providing for supplemental loans totalling $262,500,000, which agreements are held in escrow and only become effective upon the satisfaction of certain conditions. At such time as such loan agreements are released from escrow, if at all, the venture will be permitted to draw on such loans to provide additional construction financing in order to develop a 452 room hotel which will be constructed above the retail component. If fully funded, the maximum aggregate debt among the various loans funded would be $815,000,000.
Simultaneous with entering into the loans, the venture executed an agreement with a wholly-owned affiliate of Marriott International, Inc. (NASDAQ: MAR) to manage and operate an “EDITION” hotel at the property. The hotel will include 452-rooms and approximately 30,000 square feet of food, beverage and entertainment space. As additional collateral for the lenders, Marriott International, Inc. agreed to provide the lenders with the right upon an uncured event of default under the loan agreement by the venture to require Marriott to purchase the hotel component of the property during the first two years after opening for $314,600,000.
Construction of the retail and hotel space is expected to be completed in 2017. It is currently budgeted that we will contribute an additional $13,145,000 during 2014 against our remaining commitment of $38,145,000.
WRT-Fenway Wateridge – mortgage loan – On October 15, 2013, our venture that holds this property obtained a $7,000,000 first mortgage loan on its San Diego, California property. The loan bears interest at the greater of 6%, or LIBOR plus 4.5% per annum, requires monthly payments of interest only and matures on November 1, 2016. The venture purchased an interest rate cap which caps LIBOR at 2.5%. In connection with the financing, we received a distribution of $6,255,000 in partial redemption of our preferred equity investment. We retain the balance of our preferred equity interest as well as a 50% equity interest in the venture.
Operating Property Disposition Activity
Andover, Massachusetts – property sale - On March 28, 2013 we sold our Andover, Massachusetts office property to an independent third party for gross sale proceeds of $12,000,000. After costs and pro-rations, we received net proceeds of approximately $11,425,000 and recorded a gain of $2,775,000 on the sale of the property.
Deer Valley, Arizona – property sale -On June 11, 2013 we sold our Deer Valley, Arizona office property to an independent third party for gross sale proceeds of $20,500,000. After costs and pro-rations, we received net proceeds of approximately $19,585,000 and recorded a gain of $6,745,000 on the sale of the property.
Denton, Texas – property sale -On July 2, 2013 we sold our Denton, Texas retail property to an independent third party for gross sale proceeds of $1,850,000. After costs and pro-rations, we received net proceeds of approximately $1,703,000. No gain or loss was recognized on the sale of the property.
Seabrook, Texas – property sale- On August 1, 2013 we sold our Seabrook, Texas retail property to an independent third party for gross sale proceeds of $3,300,000. After costs and pro-rations, we received net proceeds of approximately $3,202,000 and recorded a gain of $1,428,000 on the sale of the property.
8
Lisle, Illinois – property sale –On December 17, 2013 we sold our Lisle, Illinois office property known as 701 Arboretum to an independent third party for gross sale proceeds of $2,500,000. After costs and pro-rations we received net proceeds of approximately $2,351,000 and recorded a gain of $58,000 on the sale of the property.
Meriden, Connecticut –property sale - On February 26, 2014 we sold our Meriden, Connecticut property to an independent third party for gross sale proceeds of $27,500,000. After costs and pro-rations and a transfer of the mortgage debt, we received net proceeds of approximately $5,106,000 on the sale of the property. This property was under contract to be sold with a $500,000 non-refundable deposit as of December 31, 2013. This property was classified as held for sale as of December 31, 2013 and the results of operations have been classified as discontinued operations for all periods presented in the consolidated interim financial statements.
Operating Property Dispositions through our Equity Investments
Sealy Airpark – Nashville, Tennessee – foreclosure – On October 7, 2013 the lender foreclosed on the loan that was collateralized by this property. We held our interest in this property through a venture that was managed by our partner and had previously written down our investment to zero. Accordingly, for financial reporting purposes we did not recognize a gain or loss in connection with the foreclosure.
Sealy Newmarket – Atlanta, Georgia – foreclosure – On December 2, 2013 the lender foreclosed on the loan that was collateralized by this property. We held our interest in this property through a venture that was managed by our partner and had previously written down our investment to zero. Accordingly, for financial reporting purposes we did not recognize a gain or loss in connection with the foreclosure.
Operating Property Significant Leasing Activity
Amherst, New York –On July 29, 2013 we entered into a lease amendment with the existing tenant, Ingram Micro Inc., which leases the entire 200,000 square foot premises. The initial lease was signed in 1988 and was scheduled to expire October 31, 2013 (subject to two five-year extensions). The new lease extends the term through October 31, 2023 with one ten-year or two five-year renewal options. Lease payments under the amendment remained unchanged through the expiration of the original lease. Annual rents under the original lease were $2,016,000. Annual rents under the amended lease are $1,802,000 for the period November 1, 2013 through October 31, 2018 and $2,002,000 for the period November 1, 2018 through October 31, 2023. The base rent is subject to increase upon the delivery of additional parking area to the tenant, which is expected to be completed during the second quarter of 2014. Annual rents are expected to increase by approximately $200,000 upon the delivery of the additional parking.
9
Loan Assets
The following table sets forth certain information relating to our loans receivable, loan securities carried at fair value and loans held in equity investments. All information presented is as of December 31, 2013 (in thousands).
| | | | | | | | | | | | | | | | | | | | | | | | | | |
Name | | Loan
Position | | | Asset Type | | Location | | Stated Interest Rate (1) | | Carrying
Amount
(2) | | | Par
Value | | | Maturity
Date (3) | | | Senior
Debt (4) | |
Loans Receivable | | | | | | | | | | | | | | | | | | | | | | | | | | |
Hotel Wales (10) | | | Whole loan | | | Hotel | | New York, NY | | LIBOR + 4% (5) | | $ | 20,101 | | | $ | 20,000 | | | | 10/05/14 | | | $ | — | |
Shops at Wailea | | | B Note | | | Retail | | Maui, HI | | 6.150% | | | 6,292 | | | | 7,584 | | | | 10/06/14 | | | | 106,170 | |
Legacy Orchard | | | Secured | | | Corporate Loan | | n/a | | 15.00% | | | 9,750 | | | | 9,750 | (6) | | | 10/31/14 | | | | — | |
Queensridge Towers | | | Whole loan | | | Multi-Family | | Las Vegas, NV | | LIBOR + 11.5% (7) | | | 2,942 | | | | 2,908 | | | | 11/15/14 | | | | — | |
San Marbeya (10) | | | Whole loan | | | Multi-Family | | Tempe, AZ | | 5.88% | | | 28,546 | | | | 29,305 | | | | 01/01/15 | | | | — | |
Playa Vista * | | | Mezzanine | | | Office | | Playa Vista, CA | | LIBOR + 14.25% | | | 10,327 | | | | 10,250 | | | | 01/23/15 | | | | 80,300 | |
Churchill | | | Whole loan | | | Mixed use | | Churchill, PA | | LIBOR + 3.75% | | | 683 | | | | 683 | | | | 06/01/15 | | | | — | |
Rockwell (8) | | | Mezzanine | | | Industrial | | Shirley, NY | | 12.00% | | | — | | | | 1,486 | | | | 05/01/16 | | | | 16,383 | |
500-512 7th Ave | | | B Note | | | Office | | New York, NY | | 7.19% | | | 10,250 | | | | 10,871 | | | | 07/11/16 | | | | 243,870 | |
Pinnacle II | | | B Note | | | Office | | Burbank, CA | | 6.313% | | | 4,648 | | | | 5,071 | | | | 09/06/16 | | | | 83,469 | |
Poipu Shopping Village | | | B Note | | | Retail | | Kauai, HI | | 6.618% | | | 2,058 | | | | 2,823 | | | | 01/06/17 | | | | 28,547 | |
Wellington Tower | | | Mezzanine | | | Mixed use | | New York, NY | | 6.79% | | | 2,991 | | | | 3,502 | | | | 07/11/17 | | | | 22,500 | |
Mentor Building | | | Whole loan | | | Retail | | Chicago, IL | | 10.00% | | | 2,512 | | | | 2,497 | | | | 09/10/17 | | | | — | |
| | | | | | | | | | | | | | | | | | | | | | | | | | |
| | | | | | | | | | | | $ | 101,100 | | | | | | | | | | | | | |
| | | | | | | | | | | | | | | | | | | | | | | | | | |
Loan Securities | | | | | | | | | | | | | | | | | | | | | | | | | | |
WBCMT 2007 WHL8 | | | CMBS | | | Hotel | | Various | | LIBOR + 1.75% | | $ | 226 | | | $ | 1,130 | | | | 03/09/14 | | | $ | 1,232,004 | |
| | | | | | | | | | | | | | | | | | | | | | | | | | |
| | | | | | | | | | | | $ | 226 | | | | | | | | | | | | | |
| | | | | | | | | | | | | | | | | | | | | | | | | | |
Loans in Equity Investment | | | | (9) | | | | | | | | | | | | | | | | | | | | | | |
Stamford Office * | | | Mezzanine | | | Office | | Stamford, CT | | LIBOR + 3.25% | | $ | 9,064 | | | $ | 9,400 | | | | 08/06/14 | | | $ | 400,000 | |
| | | | | | | | | | | | | | | | | | | | | | | | | | |
| | | | | | | | | | | | $ | 9,064 | | | | | | | | | | | | | |
| | | | | | | | | | | | | | | | | | | | | | | | | | |
| * | Loan Asset was acquired in 2013. Additional loan asset details are described below. |
| (1) | Represents contractual interest rates without giving effect to loan discount and accretion. The stated interest rate may be significantly different than our effective interest rate on certain loan investments. |
| (2) | Carrying amount includes all applicable accrued interest and accretion of discount. |
| (3) | Maturity date after giving effect to all contractual extensions. |
| (4) | Debt which is senior in payment and priority to our loan. |
| (6) | Par value is presented at the borrower’s discounted payoff option (DPO) amount. |
| (7) | Minimum rate of 12.0%. |
| (8) | Loan defaulted in December 2013. Carrying amount reflects a $348 loan loss reserve. |
| (9) | Does not include our equity interests in Concord, RE CDO Management and WRT-Elad. |
| (10) | Serve as collateral for our secured financings. The weighted average borrowing cost for these loans is 4.56%. The ratio of debt to receivable is 59%. |
Loan Asset Origination Activity
Playa Vista, California – loan origination - On January 24, 2013 we originated a $20,500,000 mezzanine loan collateralized by a 260,000 square foot office campus in the Los Angeles, California area. The loan is subordinate to an $80,300,000 mortgage loan, matures January 23, 2015, bears interest at LIBOR plus 14.25% per annum, with a 0.5% LIBOR floor and requires payments of interest only at a rate of 8.25% with the remaining interest being accrued and added to principal. In connection with the origination, the borrower paid to us an origination fee of $205,000. On March 1, 2013 we sold a 50% pari passu participation interest in the loan for $10,250,000 and gave the transferee a credit of $100,000 from the initial loan origination.
10
Loan Asset Repayment/Disposition Activity
Disney B Note – sale of participation -On January 25, 2013 we sold for $9,000,000 a 100% participation interest in the $10,000,000 B Note collateralized by an office building located in Burbank, California. The selling price was equal to our carrying value of the B Note.
127 West 25th Street – loan payoff - On March 1, 2013 the $8,583,000 loan collateralized by the property located at 127 West 25th Street, New York, New York was paid off in full at par.
180 N Michigan – loan payoff - On March 28, 2013 the $5,200,000 loan collateralized by the property located at 180 North Michigan Avenue, Chicago, Illinois was paid off in full at par.
Fenway Shea – loan payoff -On June 14, 2013 the $2,250,000 loan collateralized by the property located at Shea Blvd. in Phoenix, Arizona was paid off in full at par.
Renaissance Walk – loan payoff –On October 31, 2013 the $3,000,000 loan collateralized by the property known as Renaissance Walk located in Atlanta, Georgia was paid off in full at par.
Queensridge Tower – loan payments –During 2013, several of the condominium units collateralizing the Queensridge Tower loan receivable were sold resulting in payments to us of approximately $35,863,000. We made corresponding pay downs of $23,770,000 in full satisfaction of our recourse debt with KeyBank which was collateralized by the Queensridge Tower loan receivable.
Loan Portfolio – loan sale – In February 2014 we sold our interests in the loans secured directly or indirectly by Hotel Wales, Wellington Tower, 500-512 Seventh Avenue, Legacy Orchard and San Marbeya for an aggregate sales price of $42,917,000 and the senior participations in the Hotel Wales and San Marbeya loans, which for financial reporting purposes were classified as secured financings, were deemed assumed by the purchaser for financial reporting purposes. In connection with the sale, we retained an interest only participation in each of the Legacy Orchard loan and the Hotel Wales loan entitling us to payments equal to interest at 2.5% per annum on the principal amount of the Legacy Orchard loan and 0.5% per annum on the principal amount of the Hotel Wales loan.
Loan Asset Activity through our Equity Investments
RE CDO Management – asset sales - On February 20, 2013, RE CDO Management (“RE CDO”), an entity in which we hold a 50% interest, sold its subordinated interests in, and collateral management agreement with respect to, Sorin CDO III for $2,750,000. On March 8, 2013 RE CDO sold its C Tranche subordinated interests in Sorin CDO IV for $6,240,000. As a result of the sales, we received distributions of approximately $4,416,000 in the aggregate. RE CDO had originally acquired the sold assets and its interest in Sorin CDO IV, which it still retains, for $2,500,000.
CDH CDO LLC – sale of interest - On February 25, 2013 we sold for $25,000 a 17% interest in the equity of CDH CDO, exclusive of the interest in the entity that holds the collateral management agreement of CDH CDO, to Inland American. As a result of the sale, we now hold a 49.67% interest in CDH CDO. We maintain 100% of CDH CDO’s interest in WRP Management.
10 Metrotech Loan LLC – equity investment repayment – On July 30, 2013 the $40,000,000 loan collateralized by the property at 10 Metrotech Center, Brooklyn, New York and held by a venture in which we held a one-third interest was paid off at par. The venture had acquired the loan in August 2012 for $32,500,000. As a result of the payoff, we received a distribution of $13,333,000.
Concord Debt Holdings and CDH CDO – loan payoffs -Two of the underlying loans held by our Concord ventures paid off during the third quarter of 2013. In July 2013 the loan collateralized by the property commonly referred to as Thanksgiving Tower located in Dallas, Texas was satisfied. In August 2013 the loan collateralized by the property referred to as One Riverwalk located in San Antonio, Texas was satisfied. As a result of the loan payoffs we received an aggregate distribution of $6,470,000.
11
REIT Securities
During 2013 we liquidated all of our holdings of REIT securities. In particular, we sold 3,000,716 shares of common stock in Cedar Realty Trust, Inc. (“Cedar”) which we had acquired for an aggregate cost of $12,891,000 for aggregate sales proceeds of $16,292,000. We also sold 1,250,000 shares of MPG Office Trust Inc. which we had acquired for an aggregate cost of $2,984,000 for aggregate sale proceeds of $3,626,000.
Revolving Line of Credit
We maintain a revolving line of credit with KeyBank National Association, which we refer to as KeyBank. Pursuant to the terms of the line (i) we are permitted to borrow up to $50,000,000, subject to having a sufficient borrowing base and (ii) interest accrues on all borrowings at LIBOR plus 3%. We pay to KeyBank a quarterly fee of 0.35% on the unused portion of the line. The line of credit matured on March 3, 2014 and we did not exercise our option to extend the line for an additional year. At December 31, 2013 we had no amounts outstanding on the line.
Employees
As of December 31, 2013 we had no employees. Our affairs are administered by our Advisor pursuant to the terms of an advisory agreement which on February 1, 2013 was amended and restated to, among other things, extended the term for five years (subject to earlier termination by us for both cause (as defined) and without cause), modified the required return on the threshold amount for which the incentive fee is payable as discussed below and provided for a supplemental fee payable to our Advisor in the event of an early termination of the advisory agreement under certain circumstance or on the liquidation or disposition of the Trust. We refer to the advisory agreement, as the same may be amended from time to time, as the “Advisory Agreement.”
Under the Advisory Agreement, we pay to our Advisor a quarterly base management fee equal to 1.5% of (i) the issuance price of our outstanding equity securities plus (ii) 0.25% of any equity contribution by an unaffiliated third party to a venture managed by us. The Advisory Agreement provides that any dividends paid on account of Common Shares that result in a reduction of the threshold amount (as described below) at the date of our liquidation or disposition are deemed a reduction in the aggregate issuance price of the Common Shares, thereby resulting in a reduction of the base management fee. In addition to receiving a base management fee, our Advisor is entitled to receive an incentive fee for administering the Trust and, in certain instances, a supplemental fee upon an early termination of the Advisory Agreement under certain circumstances or the liquidation of disposition of the Trust. Further, our Advisor, or its affiliate, is also entitled to receive property management fees and construction management fees at commercially reasonable rates.
The incentive fee is equal to 20% of any amounts available for distribution in excess of the threshold amount and is only payable at such time, if at all, (i) when holders of our Common Shares receive aggregate dividends above the threshold amount or (ii) upon termination of the Advisory Agreement if the net value of our assets exceeds the threshold amount based on then current market values and appraisals. That is, the incentive fee is not payable annually but only at such time, if at all, as shareholders have received dividends in excess of the threshold amount (set at $534,224,000 on December 31, 2012 plus the issuance price for any equity interests in the Trust issued from and after January 1, 2013 plus an annual return thereon equal to the greater of (x) 4% or (y) the 5 year U.S. Treasury Yield plus 2.5% (such return, the “Growth Factor”) less any dividends paid from and after January 1, 2013). The incentive fee will also be payable if the Advisory Agreement is terminated, other than for cause (as defined) by us or with cause by our Advisor, and if on the date of termination the net value of the Trust’s assets exceeds the threshold amount. At December 31, 2013 the threshold amount required to be distributed before any incentive fee would be payable to FUR Advisors was $563,966,000, which was equivalent to $15.75 per diluted Common Share.
With respect to the supplemental fee, it is only payable if there is (i) a termination of the Advisory Agreement for any reason other than for cause (as defined) by us or with cause by our Advisor, (ii) a disposition of all or substantially all of our assets, or (iii) an election by us to orderly liquidate our assets. The supplemental fee, if payable, is equal to the lesser of (i) the base management fee paid to our Advisor for the prior twelve month period or (ii) either (x) in the case of a termination of the Advisory Agreement, 20% of the positive difference, if any between (A) the appraised net asset value of our assets at the date of termination and (B) the threshold amount less $104,980,000, or (y) in the case of a disposition or liquidation, 20% of any dividends paid on account of our Common Shares at such time as the threshold amount is reduced to $104,980,000, which will be achieved at such time as aggregate distributions of approximately $12.82 per Common Share in excess of the Growth Factor have been paid. For example, if the Trust had been liquidated at January 1, 2014, the supplemental fee would only have been payable if total dividends of approximately $12.82 per Common Share had been paid, and then only until the total supplemental fee paid would have equaled $9,289,000 (the base management fee for calendar 2013), which amount would be achieved when total dividends paid per Common Share equaled approximately $14.12.
12
In the event that the supplemental fee is payable in connection with a disposition, the entire fee is payable upon such disposition. In all other cases where the supplemental fee is payable, we are permitted to defer payment of the first $3,000,000 of the supplemental fee for 30 days and the balance, if any, for a period of six months. If it is determined that the supplemental fee is less than $3,000,000, our Advisor is obligated to promptly return to us the difference between the $3,000,000 paid to it and the actual supplemental fee.
Upon the termination of the Advisory Agreement in connection with a disposition, all the fees payable to our Advisor are required to be paid in immediately available funds. In all other cases where the Advisory Agreement is terminated, we are required to pay the supplemental fee, if any, in immediately available funds and the incentive fee, if any, may be paid in a number of freely tradable Common Shares (subject only to standard securities law restrictions) equal to the amount due to our Advisor divided by thegreater of (x) the closing price for the Common Shares on the date of termination of the Advisory Agreement or (y) $11.05 (which was the closing price of the Common Shares on December 31, 2012).
In connection with the modifications entered into in February 2013 with respect to the Advisory Agreement, we issued 600,000 restricted Common Shares, which Common Shares were issued under our 2007 Long Term Incentive Plan. The restricted Common Shares were issued as follows:
| | | | |
Name and Position | | Number of Shares | |
| |
Michael L. Ashner, Chairman and CEO | | | 198,000 | |
Carolyn Tiffany, President | | | 102,000 | |
John Garilli, Chief Financial Officer | | | 75,000 | |
John Alba, Chief Investment Officer | | | 75,000 | |
Non-Executive Officer Employee Group | | | 150,000 | |
The restricted Common Shares issued are subject to the following restrictions:
| • | | The Common Shares awarded to any person will be forfeited if such person does not remain in continuous service with our Advisor through January 1, 2018. On December 4, 2013, 7,500 shares were forfeited by a Non-Executive Officer. |
| • | | The Common Shares will immediately vest and no longer be subject to forfeiture on the earlier of (i) January 1, 2018, (ii) upon a change in control, (iii) if the Advisory Agreement is terminated by us for any reason other than cause, or by our Advisor for cause, or (iv) in the case of Michael Ashner and Carolyn Tiffany, in the event of the death or disability of the holder. Change in control is defined as the occurrence of any of the following, in one transaction or a series of related transactions: (1) any “person” (as such term is used in Sections 13(d) and 14(d) of the Securities Exchange Act of 1934, as amended (the “Exchange Act”)) becoming a “beneficial owner” (as defined in Rule 13d-3 under the Exchange Act), directly or indirectly, of our securities representing more than 50% of the voting power of our then outstanding securities; (2) our consolidation, equity exchange, reorganization or merger resulting in our equity holders immediately prior to such event not owning at least a majority of the voting power of the resulting entity’s securities outstanding immediately following such event; (3) the sale or other disposition of all or substantially all of our assets; or (4) our dissolution. |
| • | | So long as the Common Shares awarded are subject to forfeiture, our secretary has the sole and exclusive right to exercise all voting rights with respect to the awarded Common Shares. |
| • | | Until the Common Shares awarded are no longer subject to forfeiture, all cash dividends payable thereon will be payable as follows: (i) the holder will receive a portion of the dividend equal to (i) five percent, multiplied by (ii) the number of full calendar quarters that have transpired between January 1, 2013 and the applicable dividend payment date, less any required tax withholding and (ii) the remaining portion of the dividend will be held by us in escrow and will only be paid to the holder thereof if and when the Common Shares awarded are no longer subject to forfeiture. If the Common Shares awarded are forfeited, then the dividends held in escrow will similarly be forfeited. |
Competition
We have competition with respect to our acquisition of operating properties and our acquisition and origination of loan assets with many other companies, including other REITs, insurance companies, commercial banks, private investment funds, hedge
13
funds, specialty finance companies and other investors. Some competitors may have a lower cost of funds and access to funding sources that are not available to us. In addition, some of our competitors may have higher risk tolerances or make different risk assessments, which could allow them to consider a wider variety of investments. We cannot assure you that the competitive pressures we face will not have a material adverse effect on our business, financial condition and results of operations.
We will continue to capitalize on the acquisition and investment opportunities that our Advisor brings to us as a result of its acquisition experience as well as our partners in ventures. We derive significant benefit from our present advisor structure, where our Advisor’s experienced management team provides us with resources at substantially less cost than if such persons were directly employed by us. Through its broad experience, our Advisor’s senior management team has established a network of contacts and relationships, including relationships with operators, financing sources, investment bankers, commercial real estate brokers, potential tenants and other key industry participants.
Environmental Regulations
Our operations and properties are subject to various federal, state and local laws and regulations concerning the protection of the environment including air and water quality, hazardous or toxic substances and health and safety. These are discussed further under Item 1A – Risk Factors.
Segment Data
Business segment data may be found under Item 8 – Financial Statements and Supplementary Data Note 23.
Additional Information
The following materials are available free of charge through our website at www.winthropreit.com as soon as reasonably practicable after they are electronically filed with or furnished to the SEC under the Securities Exchange Act of 1934, as amended:
| | • | | our Annual Reports on Form 10-K and all amendments thereto; |
| | • | | our quarterly reports on Form 10-Q and all amendments thereto; |
| | • | | our current reports on Form 8-K and all amendments thereto; |
| | • | | organizational documents; |
| | • | | Audit Committee Charter; |
| | • | | Compensation Committee Charter; |
| | • | | Conflicts Committee Charter; |
| | • | | Nominating and Corporate Governance Committee Charter; |
| | • | | Code of Business Conduct and Ethics; and |
| | • | | Corporate Governance Guidelines. |
We will provide a copy of the foregoing materials without charge to anyone who makes a written request to our Investor Relations Department, c/o FUR Advisors, LLC, 7 Bulfinch Place, Suite 500, P.O. Box 9507, Boston, Massachusetts 02114.
We also intend to promptly disclose on our website any amendments that we make to, or waivers for our Trustees or executive officers that we grant from, the Code of Business Conduct and Ethics.
New York Stock Exchange Certification
As required by applicable New York Stock Exchange listing rules, on May 22, 2013, following our 2013 Annual Meeting of Shareholders, our Chairman and Chief Executive Officer submitted to the New York Stock Exchange a certification that he was not aware of any violation by us of New York Stock Exchange corporate governance listing standards.
14
ITEM 1A – RISK FACTORS
We, our assets and the entities in which we invest are subject to a number of risks customary for REITs, property owners, loan originators and holders and equity investors as well as a number of risks involved in our investment, operating, and capital strategy policy that not all REITs may have. Material factors that may adversely affect our business operations and financial conditions are summarized below.
Risks incidental to real estate investments
As a REIT our investments are limited to direct ownership and operation of operating properties, loan assets secured, directly or indirectly, by operating properties, and investments in other REITs. Accordingly, an investment in us depends upon our financial performance and the value of our operating properties held from time to time as well as those securing our loan assets, and those held by the REITs in which we invest, which operating properties are subject to the risks normally associated with the ownership, operation and disposal of real estate properties and real estate related assets, including:
| | • | | adverse changes in general and local economic conditions which affect the demand for real estate assets; |
| | • | | competition from other properties; |
| | • | | fluctuations in interest rates; |
| | • | | reduced availability of financing; |
| | • | | the cyclical nature of the real estate industry and possible oversupply of, or reduced demand for, properties in the markets in which our investments are located; |
| | • | | the attractiveness of our properties to tenants and purchasers; |
| | • | | how well we manage our properties; |
| | • | | changes in market rental rates and our ability to rent space on favorable terms; |
| | • | | the financial condition of our tenants and borrowers including their becoming insolvent and bankrupt; |
��
| | • | | the need to periodically renovate, repair and re-lease space and the costs thereof; |
| | • | | increases in maintenance, insurance and operating costs; |
| | • | | civil unrest, armed conflict or acts of terrorism against the United States; and |
| | • | | earthquakes, floods and other natural disasters or acts of God that may result in uninsured losses. |
In addition, changes to applicable federal, state and local regulations, zoning and tax laws and potential liability under environmental and other laws affect real estate values. Further, throughout the period that we own real property, regardless of whether or not a property is producing any income, we must make significant expenditures, including those for property taxes, maintenance, insurance and related charges and debt service. The risks associated with real estate investments may adversely affect our operating results and financial position, and therefore the funds available for distribution to you as dividends.
We may change our investment and operational policies.
We may change our investment and operating strategy either voluntarily or as result of changing economic conditions, including our policies with respect to investments, acquisitions, growth, operations, indebtedness, capitalization and dividends at any time which could result in our making investments that are different from, and possibly riskier than, our current investments. A change in our investment strategy may increase our exposure to interest rate risk, default risk and real estate market fluctuations, all of which could adversely affect our financial condition, results of operations, share price and our ability to pay dividends.
We may not be able to invest our cash reserves in accretive investments.
As of December 31, 2013, we had approximately $112,512,000 of cash and cash equivalents available for investment. Our ability to increase our overall net worth is dependent upon our ability to grow our asset base by investing these funds, as well as additional funds which we may raise or borrow, in real estate related assets that will ultimately generate returns in excess of our cost of capital.
15
We may not be able to obtain capital to make investments.
As a REIT, we are in a capital intensive business that is dependent primarily on third party debt and equity financing to fund the growth of our business because one of the requirements for a REIT is that it distribute at least 90% of its annual REIT taxable income, subject to certain adjustments, to its shareholders. Access to third party capital sources depends, in part, on general market conditions, the market’s perception of our growth potential, our current and expected future earnings, our cash flow and the market price of our Common Shares. Additionally, we may not be able to obtain debt or equity financing on favorable terms. Accordingly, if we cannot obtain capital from third parties or if such access is on unfavorable terms, it will likely have a material adverse effect on our financial condition and results of operations, our stock price and our ability to pay dividends to our shareholders.
We are subject to significant competition and we may not compete successfully.
We have significant competition with respect to our acquisition of operating properties and our acquisition and origination of loan assets with many other companies, including other REITs, insurance companies, commercial banks, private investment funds, hedge funds, specialty finance companies and other investors some of which may have a lower cost of funds and access to funding sources that are not available to us. In addition, many of our competitors have greater resources than we do and for this and other reasons, we may not be able to compete successfully for particular investments.
Investing through ventures presents additional risks.
Our investments in ventures present additional risks such as our having objectives that differ from those of our partners or in the investments we make, becoming involved in disputes concerning operations, or possibly competing with those persons for investments unrelated to our venture. In addition, where we do not control the venture, we rely on the internal controls and financial reporting controls of our partners and, as such, their failure to comply with applicable standards and maintain effective internal controls over financial reporting may adversely affect us.
Investing in private companies involves specific risks.
We have held and may acquire additional ownership interests in private companies not subject to the reporting requirements of the SEC. Investments in private businesses involve a higher degree of business and financial risk, which can result in substantial losses and accordingly should be considered speculative. There is generally no publicly available information about these private companies, and we will rely significantly on the due diligence of our Advisor to obtain information in connection with our investment decisions.
Our due diligence may not reveal all of the liabilities associated with a proposed investment and may not reveal other weaknesses.
There can be no assurance that due diligence by our Advisor in connection with a new investment will uncover all relevant facts which could adversely affect the value of the investment and the success of the investment.
We face risks associated with property acquisitions.
We acquire properties and portfolios of properties, including large portfolios that would increase our size and potentially alter our capital structure. Although we enter into these acquisitions with the belief that they will enhance our future financial performance, the success of such transactions is subject to a number of factors, including the risk that:
| | • | | we may not be able to obtain financing for acquisitions on favorable terms; |
| | • | | acquired properties may fail to perform as expected; |
| | • | | the actual costs of repositioning or redeveloping acquired properties may be higher than our estimates; |
| | • | | acquired properties may be located in new markets where we may have limited knowledge and understanding of the local economy, an absence of business relationships in the area or unfamiliarity with local governmental and permitting procedures; and |
| | • | | we may not be able to efficiently integrate acquired properties, particularly portfolios of properties, into our organization and manage new properties in a way that allows us to realize cost savings and synergies. |
In the future we may acquire properties or portfolios of properties through tax deferred contribution transactions in exchange for partnership interests in our Operating Partnership. This acquisition structure has the effect, among other factors, of reducing the amount of tax depreciation we can deduct over the tax life of the acquired properties, and typically requires that
16
we agree to protect the contributors’ ability to defer recognition of taxable gain through restrictions on our ability to dispose of the acquired properties and/or the allocation of partnership debt to the contributors to maintain their tax bases. These restrictions on dispositions could limit our ability to sell an asset during a specified time, or on terms, that would be favorable absent such restrictions.
Acquired properties may subject us to known and unknown liabilities.
Properties that we acquire may be subject to known and unknown liabilities for which we would have no recourse, or only limited recourse, to the former owners of such properties. As a result, if a liability were asserted against us based upon ownership of an acquired property, we might be required to pay significant sums to settle it, which could adversely affect our financial results and cash flow. Unknown liabilities relating to acquired properties could include:
| | • | | liabilities for clean-up of pre-existing disclosed or undisclosed environmental contamination; |
| | • | | claims by tenants, vendors or other persons arising on account of actions or omissions of the former owners of the properties; and |
| | • | | liabilities incurred in the ordinary course of business. |
Failure to renew expiring leases could adversely affect our financial condition.
We are subject to the risk that, upon expiration, leases may not be renewed, the space may not be relet or the terms of renewal or reletting, including the cost of any required renovations, may be less favorable than the prior or current lease terms. This risk is substantial with respect to our net leased properties. As of December 31, 2013, our 11 single tenant properties, containing an aggregate of approximately 2,093,000 square feet of space are net leased to 9 different tenants. Gross leases accounting for approximately 4% of the aggregate annual base rent from our operating properties for 2013, representing approximately 3% of the net rentable square feet at the properties, are scheduled to expire in 2014. Other leases grant tenants early termination rights upon payment of a termination penalty. Lease expirations will require us to locate new tenants and negotiate replacement leases with them. The costs for tenant improvements, tenant concessions and leasing commissions with respect to new leases are traditionally greater than costs relating to renewal leases. If we are unable to promptly relet or renew leases for all or a substantial portion of the space subject to expiring leases, or if the rental rates upon such renewal or reletting are significantly lower than expected, our revenue and net income could be adversely affected.
We are subject to risks associated with the financial condition of our tenants and our borrower’s tenants.
Our tenants or tenants at properties securing our loan assets may experience a downturn in their business resulting in their inability to make rental payments when due. In addition, a tenant may seek the protection of bankruptcy, insolvency or similar laws, which could result in the rejection and termination of such tenant’s lease and cause a reduction in our cash flow. If this were to occur at a net lease property, the entire property would become vacant.
We cannot evict a tenant solely because of its filing for bankruptcy. A bankruptcy court, however, may authorize a tenant to reject and terminate its lease. In such a case, our claim against the tenant for past due rent and unpaid future rent would be subject to a statutory cap that might be substantially less than the remaining rent owed under the lease. In any event, it is unlikely that a bankrupt tenant will pay the entire amount it owes us under a lease. The loss of rental payments from tenants could adversely affect our financial condition and results of operations.
Similarly, if a tenant at a property securing a loan asset fails to meet its rental obligations, the borrower may have insufficient funds to satisfy the debt service resulting in a default on our loan asset. Additionally, the loss of a tenant at a property securing a loan asset could negatively impact the value of the property and, therefore, our collateral.
The loss of a major tenant could adversely affect our financial condition.
We are and expect that we will continue to be subject to a degree of tenant concentration at certain of our operating properties and the properties securing our loan assets. As indicated above, we are subject to risks associated with the financial condition of our tenants and tenants at properties securing our loan assets. In the event that a tenant occupying a significant portion of one or more of our properties or whose rental income represents a significant portion of the rental revenue at such property or properties were to experience financial weakness, default on its lease, elect not to renew its lease or file bankruptcy it would negatively impact our financial condition and results of operations. Similarly, if a tenant occupying a significant portion of one or more of the properties securing our loan assets or whose rental income represents a significant portion of the rental revenue at such property or properties experiences financial weakness defaults on its lease, elects not to renew its lease or files for bankruptcy, it would negatively impact our financial condition and results of operations.
17
We may experience increased operating costs, which might reduce our profitability.
Our properties are subject to increases in operating expenses such as for cleaning, electricity, heating, ventilation and air conditioning, administrative costs and other costs associated with security, landscaping and repairs and maintenance of our properties. In general, under our leases with tenants, we pass through all or a portion of these costs to them. There can be no assurance that tenants will actually bear the full burden of these higher costs, or that such increased costs will not lead them, or other prospective tenants, to seek office space elsewhere. If operating expenses increase, the availability of other comparable office space in the geographic markets of our properties might limit our ability to increase rents; if operating expenses increase without a corresponding increase in revenues, our profitability could diminish and limit our ability to pay dividends to shareholders.
We leverage our portfolio, which may adversely affect our financial condition and results of operations.
We seek to leverage our portfolio through borrowings. Our return on investments and cash available to pay dividends to holders of our Series D Preferred Shares and Common Shares may be reduced to the extent that changes in market conditions make new borrowings or refinancing of existing debt difficult or even impossible or cause the cost of our financings to increase relative to the income that can be derived from the assets. Our debt service payments, including interest payable on our Senior Notes, reduce the cash available to pay dividends to holders of Series D Preferred Shares and Common Shares. We may not be able to meet our debt service obligations and, to the extent that we cannot, we risk the loss of some or all of our assets to foreclosure or forced sale to satisfy our debt obligations. A decrease in the value of the assets may lead to a requirement that we repay certain existing or future credit facilities. We may not have the funds available, or the ability to obtain replacement financing, to satisfy such repayments.
Interest rate fluctuations may reduce our investment return.
Certain of our loan obligations and loan assets have floating interest rates. In such cases, an increase in interest rates would increase our loan obligations while a decrease in interest rates would decrease the interest received on our loan assets. Where possible we seek to mitigate these risks by acquiring interest rate cap agreements, rate collars and other similar protections. To the extent we have not mitigated these risks or our actions are ineffective, a fluctuation in interest rates could negatively impact our cash flow due to an increase in loan obligations or a decrease in interest received on our loan assets.
We engage in hedging transactions that may limit gains or result in losses.
We have and may continue to use hedging instruments in our risk management strategy to limit the effects of changes in interest rates on our operations. A hedge may not be effective in eliminating all of the risks inherent in any particular position. Further, we have and could in the future recognize losses on a hedge position which adversely effects our financial condition and results of operations. In addition, we run the risk of default by a counterparty to a hedging arrangement.
We may be unable to refinance our existing debt or preferred share financings or obtain favorable refinancing terms.
We are subject to the normal risks associated with debt and preferred share financings, including the risk that our cash flow will be insufficient to meet required payments of principal and interest on debt and dividends and redemption payments to holders of preferred shares and the risk that indebtedness on our properties, or unsecured indebtedness, will not be able to be renewed, repaid or refinanced when due, or that the terms of any renewal or refinancing will not be as favorable as the terms of such indebtedness. If we were unable to refinance indebtedness or preferred share financings on acceptable terms, or at all, we might be forced to dispose of one or more of our investments on disadvantageous terms, which might result in losses to us, which could have a material adverse effect on us and our ability to pay dividends to our holders of preferred shares and Common Shares. Furthermore, if a property is mortgaged or a loan pledged to secure payment of indebtedness and we are unable to meet the debt payments, the lender could foreclose upon the property or the loan, appoint a receiver or obtain an assignment of rents and leases or pursue other remedies, all with a consequent loss of revenues and asset value to us. Foreclosures could also create taxable income without accompanying cash proceeds, thereby hindering our ability to meet the REIT dividend requirements.
18
The loans we invest in are subject to delinquency and loss.
Our loan assets are directly or indirectly secured by income producing property. The ability of a borrower to make payments on the loan underlying these securities is dependent primarily upon the successful operation of the property rather than upon the existence of independent income or assets of the borrower since the underlying loans are generally non-recourse in nature. These loans are subject to risks of delinquency and foreclosure as well as risk associated with the capital markets. If a borrower were to default on a loan, it is possible that we would not recover the full value of the loan.
We may be unable to foreclose on the collateral securing our loan assets on a timely basis or our loan assets may be subject to unfavorable treatment in a borrower bankruptcy.
In certain states foreclosing on a property can be a lengthy and costly process. In addition, a borrower can file for bankruptcy or raise defenses that could delay our ability to realize on our collateral on a timely basis. In such instances, the increased costs and time required to realize on our collateral would likely result in a reduced return or loss on the investment. Further, if a borrower were to file for bankruptcy protection, a plan could be approved over our objection that would extend our loan for a period of time at an interest rate that is less than our cost of funds, thereby having a negative impact on our cash flow.
The subordinate loan assets in which we invest are subject to risks relating to the structure and terms of the transactions, and there may not be sufficient funds or assets to satisfy our subordinate notes, which may result in losses to us.
We invest in loan assets that are subordinate in payment and collateral to more senior loans. If a borrower defaults or declares bankruptcy, after the more senior obligations are satisfied, there may not be sufficient funds or assets remaining to satisfy our subordinate notes. Because each transaction is privately negotiated, subordinate loan assets can vary in their structural characteristics and lender rights, including our rights to control the default or bankruptcy process. The subordinate loan assets that we invest in may not give us the right to demand foreclosure as a subordinate debt holder. Furthermore, the presence of intercreditor agreements, co-lender agreements and participation agreements may limit our ability to amend the loan documents, assign the loans, accept prepayments, exercise remedies and control decisions made in bankruptcy proceedings relating to borrowers. Bankruptcy and borrower litigation can significantly increase the time needed for us to acquire possession of underlying collateral in the event of a default, during which time the collateral may decline in value. In addition, there are significant costs and delays associated with the foreclosure process.
The widening of credit spreads could have a negative impact on the value of our loan assets and REIT debt securities.
The fair value of our loan assets is dependent upon the yield demanded on these assets by the market based on the underlying credit as well as general economic conditions. Although many of our directly held loan assets were purchased at significant discounts, a further deterioration of the real estate markets or a large supply of these loan assets available for sale combined with reduced demand will generally cause the market to require a higher yield on these loan assets, resulting in a higher, or “wider,” spread over the benchmark rate of such loan assets. Under these conditions, the value of the loan assets in our portfolio would decline.
Our investments in REIT debt securities are also subject to changes in credit spreads as their value is dependent upon the yield demanded on these securities by the market based on the underlying credit. Excessive supply of these securities combined with reduced demand will generally cause the market to require a higher yield on these real estate securities, resulting in the use of a higher, or “wider,” spread over the benchmark rate to value such securities. Under such conditions, the value of our REIT debt securities portfolio would tend to decline. Such changes in the market value of our portfolio may adversely affect our financial condition and results of operations.
Deterioration of the credit markets may have an adverse impact on the ability of borrowers to obtain replacement financing.
A deterioration in the credit markets will make it extremely difficult for borrowers to obtain mortgage financing. The inability of borrowers to obtain replacement financing has, in the past, led and will in the future, likely lead to more loan defaults thereby resulting in expensive and time consuming foreclosure actions and/or negotiated extensions to existing loans beyond their current expirations on terms which may not be as favorable to us as the existing loans.
A prolonged economic slowdown, a lengthy or severe recession or continued instability in the credit markets could harm our operations and viability.
A prolonged economic slowdown, a lengthy or severe recession or the continued instability in the credit market will affect our operations and viability in a number of ways including:
| | • | | Depressing prices for our investments, operating properties and loan assets; |
19
| | • | | Decreasing interest income received or increases in interest expenses paid; |
| | • | | Reducing the number of potential purchasers for our assets; |
| | • | | Increasing risk of default on loan assets; |
| | • | | Limiting the ability to obtain new or replacement financing; and |
| | • | | Limiting the ability to sell additional debt or equity securities. |
Many of our investments are illiquid, and we may not be able to adjust our portfolio in response to changes in economic and other conditions, which may result in losses to us.
Many of our investments are relatively illiquid and, therefore, our ability to sell or purchase assets in response to a change in economic or other conditions may be limited. The requirements of the Code that we hold assets for a set period of time or risk losing status as a REIT also may limit our ability to sell investments. These considerations could make it difficult for us to dispose of assets, even if a disposition were in the best interest of our shareholders. As a result, our ability to adjust our portfolio in response to changes in economic and other conditions may be relatively limited, which may result in losses and lost opportunities.
Our investments in REIT securities are subject to specific risks relating to the particular REIT issuer of the securities and to the general risks of investing in REITs.
Our investments in REIT securities involve special risks. These risks include many, if not all, of the foregoing risks which apply to an investment in us, including: (i) risks generally incident to interests in real estate assets; (ii) risks associated with the failure to maintain REIT qualification; (iii) risks that may be presented by the type and use of a particular property; and (iv) risks that the issuer of the security may reduce or eliminate expected dividend payments.
Some of our potential losses may not be covered by insurance.
We use our discretion in determining amounts, coverage limits and deductibility provisions of insurance, with a view to maintaining appropriate insurance coverage on our investments at a reasonable cost and on suitable terms. This may result in insurance coverage that, in the event of a substantial loss, would not be sufficient to pay the full current market value or current replacement cost of the lost investment and also may result in certain losses being totally uninsured. Inflation, changes in building codes, zoning or other land use ordinances, environmental considerations, lender imposed restrictions or other factors might not make it feasible to use insurance proceeds to replace the building after such building has been damaged or destroyed. Under such circumstances, the insurance proceeds, if any, received by us might not be adequate to restore our economic position with respect to such property. With respect to our net leased properties, under the lease agreements for such properties, the tenant is required to adequately insure the property, but should a loss occur their failure or inability to have adequate coverage might adversely affect our economic position with respect to such property.
We have significant interest obligations to holders of our Senior Notes and dividend obligations to holders of our Series D Preferred Shares.
The provisions of our Senior Notes require us to pay quarterly interest presently aggregating $1,671,094 or $6,684,375 annually. The provisions of our Series D Preferred Shares require us to pay quarterly dividends presently aggregating $2,786,562 or $11,146,250 annually before any dividends may be paid on our Common Shares.
Covenants and other provisions in our debt instruments could adversely affect our financial condition and our ability to make future investments.
Debt instruments under which we are an obligor contain customary covenants such as those that limit our ability, without the prior consent of the lender, to further encumber, directly or indirectly, the applicable property. Our credit facility contains, and other loans that we may obtain in the future may contain, customary restrictions, requirements and other limitations on our ability to incur indebtedness. These restrictions can include, among other things, a limitation on our ability to incur debt based upon the level of our ratio of total debt to total assets, our ratio of secured debt to total assets, our ratio of earnings before interest, taxes, depreciation and amortization (which is commonly referred to as “EBITDA”) to interest expense and fixed charges, and a requirement for us to maintain a certain level of unencumbered assets to unsecured debt. Our ability to borrow under our credit facility with KeyBank National Association is subject to compliance with certain other covenants including the absence of factors both within and outside of our control. In addition, the Indenture governing our Senior Notes
20
provides that it is an event of default under the Indenture if (i) our consolidated leverage ratio (as defined in the Indenture) is equal to or greater than 60% on the last day of any calendar quarter or (ii) subject to certain exceptions, we or any of our consolidated subsidiaries do not pay when due, after the expiration of any applicable grace period, the principal of indebtedness in the aggregate principal amount of $7,500,000 or more, or the acceleration of our or our consolidated subsidiary’s indebtedness in the aggregate principal amount of $7,500,000 or more so that it becomes due and payable before the date on which it would otherwise have become due and payable. If we fail to comply with our covenants, it would cause a default under the applicable debt instrument, and we may then be required to repay such debt with funds from other sources which may not be available to us, or be available only on unattractive terms. Further, a default under a debt instrument could limit our ability to obtain additional equity or debt financing in the future, either of which would adversely affect our financial condition and results of operations.
Increased market interest rates may hurt the value of our common and preferred shares.
We believe that investors consider the dividend rate on REIT shares, expressed as a percentage of the price of the shares, relative to market interest rates as an important factor in deciding whether to buy or sell the shares. If market interest rates go up, prospective purchasers of REIT shares may expect a higher dividend rate. Higher interest rates would likely increase our borrowing costs and might decrease funds available to pay dividends. Thus, higher market interest rates could cause the market price of our common and preferred shares to decline.
Future issuances and sales of equity or debt interests may affect the market price of our Common Shares and the amount of dividends payable to our shareholders.
We can issue preferred and Common Shares without common shareholder approval. The actual issuance of additional common or preferred shares or the sale of debt securities by us may decrease the market price of our Common Shares. In paying dividends on our Common Shares we endeavor to have our dividends track recurring cash flow from operations. Accordingly, as we issue additional Common Shares, the per share dividend will likely decrease until such time as we deploy the proceeds from such issuance of Common Shares in investments which increase our recurring cash flow.
We may issue Common Shares or equity or debt securities convertible into Common Shares at a price or conversion price less than our then per Common Share net asset value.
Our Common Share price has historically traded at a price less than our estimated per Common Share net asset value. Accordingly, if we were to issue additional Common Shares or debt or equity securities convertible into Common Shares it is likely that the offer price or conversion price, as applicable, will be less than such net asset value. As a result, such issuance would create a dilution to the net asset value of our assets until such time, if at all, as the proceeds from such offering were invested in assets that are accretive to our net asset value.
Our focus on total return investing may impact our ability to maintain our dividend rate.
Our focus on a total return value approach to investing may result in our inability to maintain the current dividend rate as we do not necessarily seek assets that provide recurring or potentially recurring cash flow but seek to invest in assets that we believe will provide us with a superior risk-adjusted total return which encompasses both current return and capital appreciation. Accordingly, the true value of an investment may not be realized until such investment is liquidated.
If we issue preferred equity or debt we may be exposed to additional restrictive covenants and limitations on our operating flexibility, which could adversely affect our ability to pay dividends.
If we decide to issue preferred equity or debt in the future, it is likely that they will be governed by an indenture or other instrument containing covenants that may restrict our operating flexibility which could have an adverse effect on the market price of our Common Shares or our ability to pay dividends.
The change of control conversion feature of our Series D Preferred Shares may make it more difficult for a party to take over our company or discourage a party from taking over our company.
Upon the occurrence of a change of control, holders of the Series D Preferred Shares will have the right (unless we timely provide notice of our election to redeem the Series D Preferred Shares) to convert some or all of their Series D Preferred Shares into our Common Shares (or equivalent value of alternative consideration). Upon such a conversion, the holders will be limited to a maximum number of our Common Shares equal to the applicable share cap multiplied by the number of
21
Series D Preferred Shares converted. If the Common Share price is less than $4.44, subject to adjustment, the holders will receive a maximum of 5.6306 Common Shares per share of Series D Preferred Shares, which may result in a holder receiving a value that is less than the liquidation preference of the Series D Preferred Shares. In addition, the change of control conversion feature of the Series D Preferred Shares may have the effect of discouraging a third party from making an acquisition proposal for our company or of delaying, deferring or preventing certain change of control transactions of our company under circumstances that otherwise could provide the holders of our Common Shares and Series D Preferred Shares with the opportunity to realize a premium over the then-current market price or that shareholders may otherwise believe is in their best interests.
We may fail to remain qualified as a REIT, which would reduce the cash available for dividends to our shareholders.
Qualification as a REIT for federal income tax purposes is governed by highly technical and complex provisions of the Code for which there are only limited judicial or administrative interpretations. Our qualification as a REIT also depends on various facts and circumstances that are not entirely within our control. In addition, legislation, new regulations, administrative interpretations or court decisions might change the tax laws with respect to the requirements for qualification as a REIT or the federal income tax consequences of qualification as a REIT. Although we currently intend to operate in a manner designed to allow us to continue to qualify as a REIT, future economic, market, legal, tax or other considerations might cause us to elect to revoke the REIT election. In that event, we and our shareholders would no longer be entitled to the federal income tax benefits applicable to a REIT.
If, with respect to any taxable year, we were to fail to maintain our qualification as a REIT or elect to revoke our REIT election, we would not be able to deduct dividends paid to our shareholders in computing our taxable income and would have to pay federal corporate income tax (including any applicable alternative minimum tax) on our taxable income. If we had to pay federal income tax, the amount of money available to distribute to our shareholders would be reduced for the year or years involved. In addition, we would be disqualified from treatment as a REIT for the four taxable years following the year during which qualification was lost and thus our cash available to pay dividends to our shareholders would be reduced in each of those years, unless we were entitled to relief under relevant statutory or regulatory provisions.
In order to maintain our status as a REIT, we may be forced to borrow funds or sell assets during unfavorable market conditions.
As a REIT, we must distribute at least 90% of our annual REIT taxable income, subject to certain adjustments, to our shareholders. To the extent that we satisfy the REIT dividend requirement but distribute less than 100% of our taxable income, we will be subject to federal and, where applicable, state corporate income tax on our undistributed taxable income. In addition, if we fail to distribute at least 90% of our annual REIT taxable income, subject to certain adjustments, we will be subject to a 4% nondeductible excise tax.
From time to time, we may have taxable income greater than our cash available to pay dividends to our shareholders (for example, due to substantial non-deductible cash outlays, such as capital expenditures or principal payments on debt). If we did not have other sources of funds available in these situations, we could be required to borrow funds, sell investments at disadvantageous prices or find alternative sources of funds to pay dividends sufficient to enable us to pay out enough of our taxable income to satisfy the REIT dividend requirement and to avoid income and excise taxes in a particular year. Additionally, we could elect to pay a portion of our required dividend in Common Shares. Each of these alternatives could increase our operating costs and diminish our rate of growth.
Factors that may cause us to lose our New York Stock Exchange listing.
We might lose our listing on the New York Stock Exchange depending on a number of factors, including failure to qualify as a REIT, or our not meeting the New York Stock Exchange’s requirements, including those relating to the number of shareholders, the price of our Common Shares and the amount and composition of our assets.
Ownership limitations in our bylaws may adversely affect the market price of our Common Shares.
Our bylaws and the certificate of designations for our Series D Preferred Shares contain ownership limitations that are designed to prohibit any transfer of Common Shares or Series D Preferred Shares that would result in our being “closely-held” within the meaning of Section 856(h) of the Code. This ownership limitation, which may be waived by our Board of Trustees, generally prohibits any single shareholder, or any group of affiliated shareholders, from beneficially or constructively owning more than 9.8% of our outstanding Common Shares or Series D Preferred Shares. Our Board of Trustees has waived this
22
ownership limitation in the past where there is believed to be a benefit derived by us from granting such waiver and the party obtaining the waiver provides assurances that the issuance of the waiver will not result in us becoming, or likely becoming, “closely held.” Unless the Board of Trustees waives the restrictions or approves a bylaw amendment, Common Shares or Series D Preferred Shares owned by a person or group of persons in excess of 9.8% of our outstanding Common Shares or Series D Preferred Shares are not entitled to any voting rights, are not considered outstanding for quorum or voting purposes, and are not entitled to dividends, interest or any other distributions with respect to the Common Shares. The ownership limit may have the effect of inhibiting or impeding a change of control or a tender offer for our Common Shares.
We must manage our investments in a manner that allows us to rely on an exemption from registration under The Investment Company Act in order to avoid the consequences of regulation under that Act.
We intend to operate our business so that we are exempt from registration as an investment company under the Investment Company Act of 1940, as amended. Therefore, the assets that we may invest in, or acquire, are limited by the provisions of the Investment Company Act and the rules and regulations promulgated thereunder. If we are required to make investments in order to be exempt from registration, such investments may not represent an optimum use of our capital when compared to other available investments.
Certain of our subsidiaries are required to comply with the Investment Advisers Act of 1940.
RE CDO Management LLC, an entity in which we hold a 50% economic interest, and WRP-Management LLC, an entity in which we hold a 100% economic interest, are registered as investment advisers under the Investment Advisers Act of 1940, as amended, which we refer to as the Advisers Act, because they provide collateral management services to private funds as defined under the Advisers Act. As registered investment advisors, these subsidiaries are required to operate in compliance with the Advisers Act which results in increased cost to us. Further, if we were to fail to comply with the Advisers Act, we could be subject to sanctions, up to and including no longer being permitted to provide services to private funds which could have an adverse effect on our results.
Compliance with the Americans with Disabilities Act and fire, safety and other regulations may require us to make unanticipated expenditures that adversely affect our financial condition and results of operations.
All of our properties are required to comply with the Americans with Disabilities Act, which we refer to as the ADA. The ADA has separate compliance requirements for “public accommodations” and “commercial facilities,” but generally requires that buildings be made accessible to people with disabilities. Although we believe that our properties are in compliance with the ADA, it is possible that we may have to incur additional expenditures which, if substantial, could adversely affect our financial condition and results of operations.
In addition, we are required to operate our properties in compliance with fire and safety regulations, building codes and other land use regulations, as they may be adopted by local, state and federal governmental agencies and bodies and become applicable to our properties. We may be required to make substantial capital expenditures to comply with those requirements and these expenditures could have an adverse effect on our financial condition and results of operations.
We may incur costs to comply with environmental laws.
The obligation to pay for the cost of complying with existing environmental laws, ordinances and regulations, as well as the cost of complying with future legislation, may increase our operating costs. Under various federal, state and local environmental laws, ordinances and regulations, a current or previous owner or operator of real property may be liable for the costs of removal or remediation of hazardous or toxic substances on or under the property. Environmental laws often impose liability whether or not the owner or operator knew of, or was responsible for, the presence of such hazardous or toxic substances and whether or not such substances originated from the property. In addition, the presence of hazardous or toxic substances, or the failure to remediate such property properly, may adversely affect our ability to borrow by using such property as collateral. We maintain insurance related to potential environmental issues on our properties which are not net leased which may not be adequate to cover all possible contingencies. In 2011 we were conveyed title to the land underlying our Churchill, Pennsylvania property. Prior to the conveyance of the land, a Phase II environmental study was performed. The study found that there were certain contaminants at the property all of which were within permitted ranges. In addition, given the nature and use of the property currently and in the past, it is possible that additional contamination could occur which could require remediation. We believe that based on applicable law and existing agreements any such remediation costs would be the responsibility of a prior owner or tenant.
23
Ability of our Advisor and other third parties directly affects our financial condition.
Other than for severe economic conditions or natural forces which may be unanticipated or uncontrollable, the ultimate value of our assets and the results of our operations will depend on the ability of our Advisor and other third parties we retain to operate and manage our assets in a manner sufficient to maintain or increase revenues and control our operating and other expenses in order to generate sufficient cash flows to pay amounts due on our indebtedness and to pay dividends to our shareholders.
We are dependent on our Advisor and the loss of our Advisor’s key personnel could harm our operations and adversely affect the value of our shares.
We have no paid employees. Our officers are employees of our Advisor. We have no separate facilities and are completely reliant on our Advisor who has significant discretion as to the implementation of our investment and operating strategies. We are subject to the risk that our Advisor will terminate its Advisory Agreement with us and that no suitable replacement will be found. Furthermore, we are dependent on the efforts, diligence, skill, network of business contacts and close supervision of all aspects of our business by our Advisor and, in particular, Michael Ashner, Chairman of our Board of Trustees and our chief executive officer, Carolyn Tiffany, our president, as well as our other executive officers. While we believe that we could find replacements for these key personnel, the loss of their services could have a negative impact on our operations and the market price of our shares.
The supplemental fee and incentive fee payable to our Advisor may be substantial.
Pursuant to the terms of our Advisory Agreement with our Advisor, our Advisor is entitled to receive an incentive fee and, in certain instances, a supplemental fee equal to 20% of any amounts available for distribution in excess of a threshold amount. The incentive fee is only payable at such time, if at all, (i) when holders of our Common Shares receive aggregate dividends above a threshold amount or (ii) upon termination of our Advisory Agreement, if the value of our net assets exceed the threshold amount based on then current market values and appraisals. That is, the incentive fee is not payable annually but only at such time, if at all, as shareholders have received the threshold amount or, if the Advisory Agreement is terminated, the net assets of the Trust exceed the threshold amount. At December 31, 2013, the threshold amount required to be distributed before any incentive fee would be payable to FUR Advisors was approximately $563,966,000 which was equivalent to $15.75 for each of our Common Shares on a fully diluted basis. The threshold amount required to be distributed before any supplemental fee payable to FUR Advisors was approximately $458,986,000 which was equivalent to $12.82 for each of our Common Shares on a fully diluted basis. At such time as shareholders’ equity in accordance with generally accepted accounting principles exceeds the applicable threshold amount, we will record a liability in our financial statements equal to approximately 20% of the excess of shareholders’ equity in accordance with generally accepted accounting principles and the applicable threshold amount.
Termination of the Advisory Agreement may be costly or not in our best interest.
Termination of the Advisory Agreement either by us without cause or by our Advisor for cause may be costly. Upon termination of the Advisory Agreement, our Advisor would be entitled to the incentive fee that would be paid as if we sold all of our assets for an amount based on appraised valuation of our assets assuming we were then liquidated. In addition, unless the Advisory Agreement is terminated by us for cause or by our Advisor without cause, our Advisor will also be entitled to the supplemental fee upon the termination of the Advisory Agreement or the liquidation or disposition of all or substantially all of our assets. The amount payable on termination of the Advisory Agreement, or liquidation or disposition, could be substantial which may have a negative effect on the price of our Common Shares. Further, affiliates of our Advisor hold approximately 9.4% of our outstanding Common Shares and serve as our executive officers. Accordingly, if we were inclined to terminate the Advisory Agreement, the ownership position of our Advisor in our Common Shares could result in other adverse effects to us and the price of our Common Shares.
If we recognize substantial impairment charges on our properties, loan assets, or equity and preferred equity investments, our net income may be reduced.
On a combined basis, we have recognized impairment charges and loan loss reserves totaling $10,939,000, $3,260,000 and $28,658,000 for the years ended December 31, 2013, 2012 and 2011, respectively. In the future, we may incur substantial impairment charges, which we are required to recognize whenever we sell a property or loan asset for less than its carrying value or we determine that the carrying amount of the property or loan asset is not recoverable and exceeds its fair value. For equity and preferred equity investments, we are required to recognize impairment charges when the estimated fair value of the
24
investment’s underlying net assets in comparison to the carrying value of our interest in the investment has declined on an other-than-temporary basis. By their nature, the timing and extent of impairment charges are not predictable. We may incur non-cash impairment charges in the future, which may reduce our net income.
ITEM 1B – UNRESOLVED STAFF COMMENTS
None.
25
ITEM 2 – PROPERTIES
CONSOLIDATED OPERATING PROPERTIES
The following table sets forth a schedule of consolidated operating properties at December 31, 2013. Our portfolio of consolidated properties consists of 19 commercial properties consisting of 3,671,000 square feet and seven residential apartment complexes consisting of 1,549 units.
| | | | | | | | | | | | | | | | | | | | | | | | | | | | | | | | | | | | |
Description and
Location | | Year
Acquired | | Trust’s
Ownership | | | Rentable
Square
Feet | | | (**)
%
Leased | | | Major Tenants
(Lease / Options
Expiration) | | Major
Tenant
Sq. Ft. | | | ($000’s)
Depreciated
Cost
Basis | | | Cost per
Square
Foot or
Unit | | | Ownership
of Land | | ($000’s) Debt
Balance | | | Debt
Maturity
& Int
Rate (2) |
Office | | | | | | | | | | | | | | | | | | | | | | | | | | | | | | | | | | | | |
Amherst, NY | | 2005 | | | 100 | % | | | 200,000 | | | | 100 | % | | Ingram Micro | | | 200,000 | | | $ | 17,108 | | | $ | 86 | | | Fee | | | | (1) | | (1) |
| | | | | | | | | | | | | | | | Systems | | | | | | | | | | | | | | | | | | | | |
| | | | | | | | | | | | | | | | (2023/2033) | | | | | | | | | | | | | | | | | | | | |
| | | | | | | | | | | |
Cerritos, CA (3) | | 2012 | | | 100 | % | | | 187,000 | | | | 80 | % | | Sunwest | | | 37,000 | | | | 21,884 | | | | 117 | | | Fee | | $ | 23,142 | | | 01/2017 |
| | | | | | | | | | | | | | | | (2018) | | | | | | | | | | | | | | | | | | | | 5.07% |
| | | | | | | | | | | |
Chicago, IL | | 2005 | | | 100 | % | | | 126,000 | | | | 97 | % | | River North | | | 15,000 | | | | 20,718 | | | | 164 | | | Fee | | | 19,856 | | | 03/2016 |
(One East Erie) | | | | | | | | | | | | | | | | Surgery (2023) | | | | | | | | | | | | | | | | | | | | 5.75% |
| | | | | | | | | | | |
Chicago, IL | | 2007 | | | 60 | % | | | 253,000 | | | | 50 | % | | ITAV | | | 37,000 | | | | 14,252 | | | | 56 | | | Fee | | | 8,579 | | | 04/2015 |
(River City / Marc Realty) | | | | | | | | | | | | | | | | (2024/2029) | | | | | | | | | | | | | | | | | | | | 5.50% |
| | | | | | | | | | | | | | | | MFS/Worldcom | | | 60,000 | | | | | | | | | | | | | | | | | |
| | | | | | | | | | | | | | | | (2019/2023) | | | | | | | | | | | | | | | | | | | | |
| | | | | | | | | | | |
Englewood, CO | | 2010 | | | 100 | % | | | 118,000 | | | | 96 | % | | Hitachi Data | | | 61,000 | | | | 7,283 | | | | 62 | | | Fee | | | | (1) | | (1) |
Crossroads I | | | | | | | | | | | | | | | | (2024/2034) | | | | | | | | | | | | | | | | | | | | |
| | | | | | | | | | | | | | | | RGN-Denver LLC | | | 17,000 | | | | | | | | | | | | | | | | | |
| | | | | | | | | | | | | | | | (2015/ 2025) | | | | | | | | | | | | | | | | | | | | |
| | | | | | | | | | | |
Englewood, CO | | 2010 | | | 100 | % | | | 118,000 | | | | 96 | % | | TIC Holdings | | | 95,000 | | | | 9,989 | | | | 85 | | | Fee | | | | (1) | | (1) |
Crossroads II | | | | | | | | | | | | | | | | (2019/2044) | | | | | | | | | | | | | | | | | | | | |
| | | | | | | | | | | |
Houston, TX | | 2004 | | | 32 | % | | | 614,000 | | | | 100 | % | | Spectra Energy | | | 614,000 | | | | 55,358 | | | | 90 | | | Fee | | | 47,201 | | | 04/2016 |
| | | | | | | | | | | | | | | | (2026/2036) | | | | | | | | | | | | | | | | | | | | 6.01% |
| | | | | | | | | | | |
Lisle, IL | | 2006 | | | 100 | % | | | 169,000 | | | | 78 | % | | United Healthcare | | | 41,000 | | | | 18,827 | | | | 111 | | | Fee | | | 5,752 | | | 10/2014 |
| | | | | | | | | | | | | | | | (2015) | | | | | | | | | | | | | | | | | | | | Libor+2.5% |
| | | | | | | | | | | |
Lisle, IL | | | | | | | | | | | | | | | | Ryerson | | | | | | | | | | | | | | | | | | | | 03/2017 |
(Marc Realty) | | 2006 | | | 60 | % | | | 54,000 | | | | 100 | % | | (2018/2023) | | | 54,000 | | | | 3,637 | | | | 67 | | | Fee | | | 5,470 | | | 5.55% |
| | | | | | | | | | | |
New York, NY | | 2011 | | | (4 | ) | | | 105,000 | | | | 82 | % | | Alice + Olivia | | | 27,000 | | | | 56,507 | | | | 194 | | | Ground | | | 51,950 | | | 05/2016 |
(450 West 14th) | | | | | | | | | | | | | | | | (2021/2031) | | | | | | | | | | | | | | Lease | | | | | | Libor + 2.5% |
| | | | | | | | | | | | | | | | Fast Retailing | | | 23,000 | | | | | | | | | | | | | | | | | |
| | | | | | | | | | | | | | | | (2026/2036) | | | | | | | | | | | | | | | | | | | | |
| | | | | | | | | | | | | | | | Access Industries | | | 14,000 | | | | | | | | | | | | | | | | | |
| | | | | | | | | | | | | | | | (2021/2031) | | | | | | | | | | | | | | | | | | | | |
| | | | | | | | | | | |
Orlando, FL | | 2004 | | | 100 | % | | | 257,000 | | | | 100 | % | | Siemens Real | | | 257,000 | | | | 13,346 | | | | 52 | | | Ground | | | 36,983 | | | 07/2017 |
| | | | | | | | | | | | | | | | Estate, Inc. | | | | | | | | | | | | | | Lease | | | | | | 6.40% |
| | | | | | | | | | | | | | | | (2017/2042) | | | | | | | | | | | | | | | | | | | | |
| | | | | | | | | | | |
Philadelphia, PA | | 2013 | | | 49 | % | | | 502,000 | | | | 73 | % | | Temple University | | | 128,000 | | | | 43,391 | | | | 86 | | | Fee | | | 42,440 | | | 05/2016 |
(1515 Market Street) | | | | | | | | | | | | | | | | (2022) | | | | | | | | | | | | | | | | | | | | Libor+2.0% |
| | | | | | | | | | | |
Plantation, FL | | 2004 | | | 100 | % | | | 120,000 | | | | 100 | % | | AT&T Service, | | | 120,000 | | | | 10,897 | | | | 91 | | | Fee | | | 10,684 | | | 04/2018 |
| | | | | | | | | | | | | | | | Inc. | | | | | | | | | | | | | | | | | | | | 6.48% |
| | | | | | | | | | | | | | | | (2020/2035) | | | | | | | | | | | | | | | | | | | | |
| | | | | | | | | | | |
South Burlington, VT | | 2005 | | | 100 | % | | | 54,000 | | | | 100 | % | | Fairpoint Comm. | | | 54,000 | | | | 2,737 | | | | 51 | | | Ground | | | | (1) | | (1) |
| | | | | | | | | | | | | | | | (2014) | | | | | | | | | | | | | | Lease | | | | | | |
| | | | | | | | | | | | | | | | | | | | | | | | | | | | | | | | | | | | |
Subtotal - Office | | | | | | | | | 2,877,000 | | | | | | | | | | | | | $ | 295,934 | | | | | | | | | $ | 252,057 | | | |
| | | | | | | | | | | | | | | | | | | | | | | | | | | | | | | | | | | | |
(Continued on next page)
26
CONSOLIDATED OPERATING PROPERTIES (Continued)
| | | | | | | | | | | | | | | | | | | | | | | | | | | | | | | | | | | | |
| | | | | | | | | | | |
| | | | | | | | | | | | | | | | The Kroger Co. | | | | | | | | | | | | | | Ground | | | | | | |
Greensboro, NC | | 2004 | | | 100 | % | | | 46,000 | | | | 100 | % | | (2017/2037) | | | 46,000 | | | | 2,934 | | | | 64 | | | Lease | | | | (1) | | (1) |
| | | | | | | | | | | |
| | | | | | | | | | | | | | | | The Kroger Co. | | | | | | | | | | | | | | | | | | | | |
Louisville, KY | | 2004 | | | 100 | % | | | 47,000 | | | | 100 | % | | (2015/2040) | | | 47,000 | | | | 2,477 | | | | 53 | | | Fee | | | | (1) | | (1) |
| | | | | | | | | | | | | | | | | | | | | | | | | | | | | | | | | | | | |
Subtotal Retail | | | | | | | | | 154,000 | | | | | | | | | | | | | $ | 7,227 | | | | | | | | | | | | | |
| | | | | | | | | | | | | | | | | | | | | | | | | | | | | | | | | | | | |
| | | | | | | | | | | |
Other | | | | | | | | | | | | | | | | | | | | | | | | | | | | | | | | | | | | |
| | | | | | | | | | | |
Warehouse | | | | | | | | | | | | | | | | | | | | | | | | | | | | | | | | | | | | |
| | | | | | | | | | | | | | | | Football | | | | | | | | | | | | | | | | | | | | |
| | | | | | | | | | | | | | | | Fanatics | | | | | | | | | | | | | | | | | | | | |
Jacksonville, FL | | 2004 | | | 100 | % | | | 588,000 | | | | 100 | % | | (2015/2024) | | | 561,000 | | | $ | 10,550 | | | | 18 | | | Fee | | | | (1) | | (1) |
| | | | | | | | | | | |
Mixed Use | | | | | | | | | | | | | | | | | | | | | | | | | | | | | | | | | | | | |
| | | | | | | | | | | | | | | | Westinghouse | | | | | | | | | | | | | | | | | | | | 08/2024 |
Churchill, PA | | 2004 | | | 100 | % | | | 52,000 | | | | 100 | % | | (2024) | | | 52,000 | | | | 5,529 | | | | 106 | | | Fee | | $ | 5,049 | | | 3.50% |
| | | | | | | | | | | | | | | | | | | | | | | | | | | | | | | | | | | | |
| | | | | | | | | | | |
Subtotal - Other | | | | | | | | | 640,000 | | | | | | | | | | | | | $ | 16,079 | | | | | | | | | $ | 5,049 | | | |
| | | | | | | | | | | | | | | | | | | | | | | | | | | | | | | | | | | | |
| | | | | | | | | | | |
Residential | | | | | | | | | | | | | | | | | | | | | | | | | | | | | | | | | | | | |
| | | | | | | | | | | | | | | | | | | | | | | | | | | | | | | | | | | | 08/2014 |
| | | | | | | | | | | | | | | | | | | | | | | | | | | | | | | | | | | | Libor + |
Memphis, TN | | 2012 | | | 100 | % | | | 320 units | | | | 93 | % | | n/a | | | n/a | | | $ | 20,298 | | | | 65 | | | Fee | | $ | 13,125 | | | 2.5% |
| | | | | | | | | | | | | | | | | | | | | | | | | | | | | | | | | | | | 10/2016 |
| | | | | | | | | | | | | | | | | | | | | | | | | | | | | | | | | | | | LIBOR + |
Houston, TX | | 2013 | | | 84 | % | | | 396 units | | | | 90 | % | | n/a | | | n/a | | | | 104,519 | | | | 264 | | | Fee | | | 64,635 | | | 2.0% |
| | | | | | | | | | | | | | | | | | | | | | | | | | | | | | | | | | | | 10/2016 |
| | | | | | | | | | | | | | | | | | | | | | | | | | | | | | | | | | | | LIBOR + |
San Pedro, CA | | 2013 | | | 84 | % | | | 89 units | | | | 99 | % | | n/a | | | n/a | | | | 19,733 | | | | 222 | | | Fee | | | 12,195 | | | 2.0% |
| | | | | | | | | | | | | | | | | | | | | | | | | | | | | | | | | | | | 10/2016 |
| | | | | | | | | | | | | | | | | | | | | | | | | | | | | | | | | | | | LIBOR + |
Stamford, CT | | 2013 | | | 84 | % | | | 92 units | | | | 95 | % | | n/a | | | n/a | | | | 78,852 | | | | 857 | | | Fee | | | 48,780 | | | 2.0% |
| | | | | | | | | | | | | | | | | | | | | | | | | | | | | | | | | | | | 10/2016 |
| | | | | | | | | | | | | | | | | | | | | | | | | | | | | | | | | | | | LIBOR + |
Phoenix, AZ | | 2013 | | | 84 | % | | | 184 units | | | | 93 | % | | n/a | | | n/a | | | | 39,360 | | | | 214 | | | Fee | | | 24,390 | | | 2.0% |
| | | | | | | | | | | | | | | | | | | | | | | | | | | | | | | | | | | | 08/2016 |
Greensboro, NC (5) | | 2012 | | | 100 | % | | | 284 units | | | | 96 | % | | n/a | | | n/a | | | | 17,809 | | | | 65 | | | Fee | | | 14,735 | | | 6.22% |
Oklahoma City, | | | | | | | | | | | | | | | | | | | | | | | | | | | | | | | | | | | | 02/2021 |
OK | | 2013 | | | 80 | % | | | 184 units | | | | 97 | % | | n/a | | | n/a | | | | 14,609 | | | | 79 | | | Fee | | | 9,967 | | | 5.7% |
| | | | | | | | | | | | | | | | | | | | | | | | | | | | | | | | | | | | |
Subtotal - Residential | | | | | | | | | 1,549 units | | | | | | | | | | | | | $ | 295,178 | | | | | | | | | $ | 187,827 | | | |
| | | | | | | | | | | | | | | | | | | | | | | | | | | | | | | | | | | | |
Total Consolidated Properties | | | | | | | | | 3,671,000 | | | | | | | | | | | | | $ | 614,420 | | | | | | | | | $ | 444,933 | | | |
| | | | | | | | | | | | | | | | | | | | | | | | | | | | | | | | | | | | |
| (**) | Occupancy rates include all signed leases, including space undergoing tenant improvements. |
Notes to Consolidated Properties - Selected Data
| (1) | These properties collateralize our revolving line of credit. |
| (2) | The one month LIBOR rate at December 31, 2013 was 0.1677%. |
| (3) | The stated debt balance is the fair value of the debt at December 31, 2013. The contractual debt balance was $23,000 at December 31, 2013. |
| (4) | We hold a preferred equity interest. At December 31, 2013 our effective ownership interest was 88%. |
| (5) | The stated debt balance is the fair value of the debt at December 31, 2013. The contractual debt balance was $13,600 at December 31, 2013. |
27
UNCONSOLIDATED OPERATING PROPERTIES
The following table sets forth a schedule of unconsolidated operating properties at December 31, 2013. Our portfolio of unconsolidated properties is accounted for under the equity method of accounting. These properties consist of 10 commercial properties consisting of 2,339,000 square feet and 27 residential apartment complexes consisting of 4,655 units.
| | | | | | | | | | | | | | | | | | | | | | | | | | | | | | | | |
| | | Year
Acquired | | Trust’s
Ownership | | | Rentable
Square Feet | | | (**) %
Leased | | | Major Tenants
(Lease / Options
Expiration) | | Major
Tenants
Sq. Ft. | | | ($000’s)
Equity
Investment
Balance | | | Ownership
of Land | | ($ 000’s)
Debt
Balance
(1) | | | Debt
Maturity &
Int Rate
(13) |
Marc Realty Portfolio - Equity Investments | | | | | | | | | | | | | | | | | | | | | | | | | | | | | | | | |
| | | | | | | | | | |
223 West Jackson | | | | | | | | | | | | | | | | | | | | | | | | | | | | | | | | |
Chicago, IL | | | | | | | | | | | | | | | | No tenants over | | | | | | | | | | | | | | | | 09/2017 |
(Brooks Building) | | 2005 | | | 50 | % | | | 168,000 | | | | 75 | % | | 10% | | | — | | | | 6,551 | | | Fee | | | 6,770 | | | Libor + 2.75% |
| | | | | | | | | | |
4415 West Harrison | | | | | | | | | | | | | | | | North American | | | | | | | | | | | | | | | | |
Hillside, IL | | | | | | | | | | | | | | | | Medical Mgmt | | | | | | | | | | | | | | | | 12/2015 |
(High Point) | | 2005 | | | 50 | % | | | 192,000 | | | | 65 | % | | (2015/2020) | | | 24,000 | | | | — | | | Fee | | | 4,335 | | | 5.62% |
| | | | | | | | | | |
1701 E. Woodfield, | | | | | | | | | | | | | | | | No tenants over | | | | | | | | | | | | | | | | 09/2015 |
Schaumburg, IL | | 2005 | | | 50 | % | | | 175,000 | | | | 87 | % | | 10% | | | — | | | | 150 | | | Fee | | | 5,369 | | | Libor + 3% (2) |
| | | | | | | | | | |
| | | | | | | | | | | | | | | | Consumer | | | | | | | | | | | | | | | | |
2205-55 Enterprise | | | | | | | | | | | | | | | | Portfolio | | | | | | | | | | | | | | | | |
Westchester, IL | | 2005 | | | 50 | % | | | 130,000 | | | | 91 | % | | (2014/2019) | | | 18,900 | | | | | | | | | | | | | |
| | | | | | | | | | | | | | | | Uro Partners | | | | | | | | | | | | | | | | 10/2019 |
| | | | | | | | | | | | | | | | (2015) | | | 14,500 | | | | 50 | | | Fee | | | 8,759 | | | 4.30% |
| | | | | | | | | | | | | | | | | | | | | | | | | | | | | | | | |
Total - Marc Realty Portfolio | | | | | | | | | 665,000 | | | | | | | | | | | | | $ | 6,751 | | | | | | $25,233 | | | |
| | | | | | | | | | | | | | | | | | | | | | | | | | | | | | | | |
| | | | | | | | | | |
Sealy Venture Properties - Equity Investments | | | | | | | | | | | | | | | | | | | | | | | | | | | | | | | | |
| | | | | | | | | | | | | | | | | | | | | | | | | | | | | | | | 09/2015 |
Atlanta, GA | | | | | | | | | | | | | | | | Original Mattress | | | | | | | | | | | | | | | | Libor + 5.35% |
(Northwest Atlanta) | | 2006 | | | 60 | % | | | 472,000 | | | | 77 | % | | (2020/2025) | | | 57,000 | | | $ | 7,635 | | | Fee | | $ | 13,592 | | | (3) |
| | | | | | | | | | | | | | | | | | | | | | | | | | | | | | | | |
| | | | | | | | | | |
Mentor Retail LLC - Equity Investment | | | | | | | | | | | | | | | | | | | | | | | | | | | | | | | | |
| | | | | | | | | | | | | | | | American | | | | | | | | | | | | | | | | |
39 South State Street | | | | | | | | | | | | | | | | Apparel | | | | | | | | | | | | | | | | 09/2017 |
Chicago, IL | | 2012 | | | 50 | % | | | 7,000 | | | | 100 | % | | (2022) | | | 7,000 | | | $ | 635 | | | Fee | | $ | 2,497 | | | 10% |
| | | | | | | | | | | | | | | | | | | | | | | | | | | | | | | | |
WRT-Elad One South State - Equity Investment | | | | | | | | | | | | | | | | | | | | | | | | | | | | | | | | |
| | | | | | | | | | |
One South State Street | | | | | | | | | | | | | | | | | | | | | | | | | | | | | | | | |
Chicago, IL | | | | | | | | | | | | | | | | Target | | | | | | | | | | | | | | | | 11/2018 |
(Sullivan Center) | | 2012 | | | 38 | % | | | 942,000 | | | | 83 | % | | (2038/2063) | | | 147,000 | | | $ | 23,661 | | | Fee | | $ | 113,500 | | | 3.95% |
| | | | | | | | | | | | | | | | | | | | | | | | | | | | | | | | |
| | | | | | | | | | | | | | | | Walgreens
(2022/2027) | | | 95,000 | | | | | | | | | | | | | |
| | | | | | | | | | |
| | | | | | | | | | | | | | | | Illinois Dept. of
Employment
(2019/2024) | | | 243,000 | | | | | | | | | | | | | |
| | | | | | | | | | |
| | | | | | | | | | | | | | | | Art Institute of
Chicago
(2020/2030) | | | 153,000 | | | | | | | | | | | | | |
| | | | | | | | | | |
701 Seventh WRT Investor - Equity Investment | | | | | | | | | | | | | | | | | | | | | | | | | | | | | | | | 10/2015 |
701 Seventh Avenue | | | | | | | | | Under | | | | | | | | | | | | | | | | | | | | | | | LIBOR + |
New York, NY | | 2012 | | | 54 | % | | | Development | | | | | | | (5) | | | — | | | $ | 55,259 | | | Fee | | $ | 376,600 | | | 10.20%(4) |
| | | | | | | | | | | | | | | | | | | | | | | | | | | | | | | | |
WRT-Fenway Wateridge - Equity Investment | | | | | | | | | | | | | | | | | | | | | | | | | | | | | | | | 11/2016 |
10525 Vista Sorrento | | | | | | | | | | | | | | | | | | | | | | | | | | | | | | | | Greater of 6% |
Parkway San Diego, | | | | | | | | | | | | | | | | Verint Americas | | | | | | | | | | | | | | | | or LIBOR + |
CA | | 2012 | | | 50 | % | | | 62,000 | | | | 89 | % | | (2018) | | | 6,500 | | | $ | 1,898 | | | Fee | | $ | 7,000 | | | 4.5%(6) |
| | | | | | | | | | | | | | | | | | | | | | | | | | | | | | | | |
| | | | | | | | | | | | | | | | Flores Lund | | | | | | | | | | | | | | | | |
| | | | | | | | | | | | | | | | (2017) | | | 10,000 | | | | | | | | | | | | | |
| | | | | | | | | | |
| | | | | | | | | | | | | | | | Quidel Corp. | | | | | | | | | | | | | | | | |
| | | | | | | | | | | | | | | | (2014) | | | 11,000 | | | | | | | | | | | | | |
| | | | | | | | | | |
| | | | | | | | | | | | | | | | Verizon Wireless | | | | | | | | | | | | | | | | |
| | | | | | | | | | | | | | | | (2016) | | | 13,000 | | | | | | | | | | | | | |
| | | | | | | | | | |
Atrium | | | | | | | | | | | | | | | | | | | | | | | | | | | | | | | | |
| | | | | | | | | | | | | | | | No tenants over | | | | | | | | | | | | | | | | |
Chicago, IL | | 2013 | | | 50 | % | | | 71,000 | | | | 76 | % | | 10% | | | — | | | $ | 3,845 | | | Fee | | $ | — | | | |
| | | | | | | | | | | | | | | | | | | | | | | | | | | | | | | | |
| | |
(**) Occupancy rates include all signed leases including space undergoing tenant improvements | | |
(Continued on next page)
28
UNCONSOLIDATED OPERATING PROPERTIES (Continued)
| | | | | | | | | | | | | | | | | | | | | | | | | | | | | | |
| | | Year
Acquired | | | Trust’s
Ownership | | | Units | | | %
Leased | | | Ownership
of Land | | ($000’s)
Debt
Balance
(1) | | | Debt
Maturity &
Int Rate (8) | | Subordinated
Debt ($
000’s) | | | Subordinated
Debt
Maturity |
Vintage Housing Holdings LLC - Equity Investment | | | | | | | | | | | | | | | | | | | | | | | | | | | | | | |
| | | | | | | | | |
Agave Associates | | | | | | | | | | | | | | | | | | | | | | | | 10/2036 | | | | | | 12/2036 |
Elk Grove, CA | | | 2011 | | | | | (7) | | | 188 | | | | 97 | % | | Fee | | $ | 14,600 | | | SIFMA + 1.28% | | $ | 2,500 | | | 3.50% |
| | | | | | | | | |
Vintage at Bend | | | | | | | | | | | | | | | | | | | | | | | | 12/2036 | | | | | | |
Bend, OR | | | 2011 | | | | | (7) | | | 106 | | | | 99 | % | | Fee | | | 5,500 | | | SIFMA + 1.24% | | | | | | |
| | | | | | | | | |
The Bluffs Apartments | | | | | | | | | | | | | | | | | | | | | | | | 10/2035 | | | | | | 7/2033 |
Reno, NV | | | 2011 | | | | | (7) | | | 300 | | | | 96 | % | | Fee | | | 18,300 | | | SIFMA + 1.57% | | | 8 | | | 3% |
| | | | | | | | | |
Bouquet Canyon Seniors | | | | | | | | | | | | | | | | | | | | | | | | 7/2028 | | | | | | |
Santa Clarita, CA | | | 2011 | | | | | (7) | | | 264 | | | | 98 | % | | Fee | | | 10,728 | | | 6.38% | | | | | | |
| | | | | | | | | |
Vintage at Bremerton | | | | | | | | | | | | | | | | | | | | | | | | 3/2033 | | | | | | |
Bremerton, WA | | | 2011 | | | | | (7) | | | 143 | | | | 95 | % | | Fee | | | 6,200 | | | SIFMA + 1.55% | | | | | | |
| | | | | | | | | |
Vintage at Burien | | | | | | | | | | | | | | | | | | | | | | | | 1/2038 | | | | | | |
Burien, WA | | | 2011 | | | | | (7) | | | 101 | | | | 96 | % | | Ground Lease | | | 6,680 | | | SIFMA + 1.50% | | | | | | |
| | | | | | | | | |
Vintage at Chehalis | | | | | | | | | | | | | | | | | | | | | | | | 6/2040 | | | | | | |
Chehalis, WA | | | 2011 | | | | | (7) | | | 150 | | | | 100 | % | | Fee | | | 8,190 | | | SIFMA + 1.70% (9) | | | | | �� | |
| | | | | | | | | |
Elk Creek Apartments | | | | | | | | | | | | | | | | | | | | | | | | 11/2039 | | | | | | |
Sequim, WA | | | 2011 | | | | | (7) | | | 138 | | | | 95 | % | | Fee | | | 7,302 | | | 6.60% | | | | | | |
| | | | | | | | | |
Vintage at Everett | | | | | | | | | | | | | | | | | | | | | | | | 1/2038 | | | | | | |
Everett, WA | | | 2011 | | | | | (7) | | | 259 | | | | 100 | % | | Fee | | | 16,180 | | | SIFMA + 1.50% | | | | | | |
| | | | | | | | | |
Falls Creek Apartments | | | | | | | | | | | | | | | | | | | | | | | | 12/2040 | | | | | | |
Couer d’ Alene, ID | | | 2011 | | | | | (7) | | | 170 | | | | 93 | % | | Fee | | | 8,267 | | | 6.37% | | | | | | |
| | | | | | | | | |
Forest Creek Apartments | | | | | | | | | | | | | | | | | | | | | | | | 6/2040 | | | | | | |
Spokane, WA | | | 2011 | | | | | (7) | | | 252 | | | | 96 | % | | Fee | | | 13,680 | | | SIFMA + 1.68% | | | | | | |
| | | | | | | | | |
Hamilton Place Seniors | | | | | | | | | | | | | | | | | | | | | | | | 7/2033 | | | | | | 7/2014 |
Bellingham, WA | | | 2011 | | | | | (7) | | | 94 | | | | 96 | % | | Fee | | | 3,590 | | | SIFMA + 1.67% | | | 43 | | | 5.88% |
| | | | | | | | | |
Heritage Place Apartments | | | | | | | | | | | | | | | | | | | | | | | | 7/2015 | | | | | | 5/2039 |
St. Ann, MO | | | 2011 | | | | | (7) | | | 113 | | | | 90 | % | | Fee | | | 1,732 | | | 8.37% | | | 490 | | | 1.0% |
| | | | | | | | | |
Holly Village Apartments | | | | | | | | | | | | | | | | | | | | | | | | 7/2032 | | | | | | |
Everett, WA | | | 2011 | | | | | (7) | | | 149 | | | | 97 | % | | Fee | | | 6,870 | | | SIFMA + 1.58% | | | | | | |
| | | | | | | | | |
Larkin Place Apartments | | | | | | | | | | | | | | | | | | | | | | | | 7/2033 | | | | | | |
Bellingham, WA | | | 2011 | | | | | (7) | | | 101 | | | | 96 | % | | Fee | | | 4,825 | | | SIFMA + 1.51% | | | | | | |
| | | | | | | | | |
| | | | | | | | | | | | | | | | | | | | | | | | 1/2037 | | | | | | |
Vintage at Mt. Vernon | | | | | | | | | | | | | | | | | | | | | 7,500 | | | SIFMA + 1.73% (10) | | | | | | |
Mt. Vernon, WA | | | 2011 | | | | | (7) | | | 154 | | | | 99 | % | | Fee | | | 930 | | | SIFMA + 1.73% (11) | | | | | | |
| | | | | | | | | |
Vintage at Napa | | | | | | | | | | | | | | | | | | | | | | | | 6/2034 | | | | | | |
Napa, CA | | | 2011 | | | | | (7) | | | 115 | | | | 99 | % | | Fee | | | 5,899 | | | 6.26% | | | | | | |
| | | | | | | | | |
Vintage at Richland | | | | | | | | | | | | | | | | | | | | | | | | 1/2038 | | | | | | |
Richland, WA | | | 2011 | | | | | (7) | | | 150 | | | | 96 | % | | Fee | | | 7,535 | | | SIFMA + 1.83% | | | | | | |
| | | | | | | | | |
Rosecreek Senior Living | | | | | | | | | | | | | | | | | | | | | | | | 12/2037 | | | | | | |
Arlington, WA | | | 2011 | | | | | (7) | | | 100 | | | | 99 | % | | Fee | | | 3,267 | | | SIFMA + 0.51% | | | | | | |
| | | | | | | | | |
Vintage at Sequim | | | | | | | | | | | | | | | | | | | | | | | | 3/2038 | | | | | | |
Sequim, WA | | | 2011 | | | | | (7) | | | 118 | | | | 98 | % | | Fee | | | 6,234 | | | SIFMA + 2.35% | | | | | | |
| | | | | | | | | |
Silver Creek Apartments | | | | | | | | | | | | | | | | | | | | | | | | 1/2018 | | | | | | |
Pasco, WA | | | 2011 | | | | | (7) | | | 242 | | | | 97 | % | | Fee | | | 12,775 | | | SIFMA + 1.75% | | | | | | |
| | | | | | | | | |
Vintage at Silverdale | | | | | | | | | | | | | | | | | | | | | | | | 9/2039 | | | | | | |
Silverdale, WA | | | 2011 | | | | | (7) | | | 240 | | | | 97 | % | | Fee | | | 14,880 | | | SIFMA + 2.89% (12) | | | | | | |
| | | | | | | | | |
Vintage at Spokane | | | | | | | | | | | | | | | | | | | | | | | | 8/2040 | | | | | | |
Spokane, WA | | | 2011 | | | | | (7) | | | 287 | | | | 99 | % | | Fee | | | 16,295 | | | SIFMA + 1.46% | | | | | | |
| | | | | | | | | |
Seven Hills/ St Rose | | | | | | | | | | | | | | | | | | | | | | | | 10/2035 | | | | | | |
Henderson, NV | | | 2011 | | | | | (7) | | | 244 | | | | 97 | % | | Fee | | | 14,770 | | | SIFMA + 1.47% | | | | | | |
| | | | | | | | | |
| | | | | | | | | | | | | | | | | | | | | | | | 1/2038 | | | | | | |
Twin Ponds Apartments | | | | | | | | | | | | | | | | | | | | | 5,515 | | | SIFMA + 1.53% | | | | | | |
Arlington, WA | | | 2011 | | | | | (7) | | | 134 | | | | 96 | % | | Fee | | | 1,179 | | | 6.20% | | | | | | |
| | | | | | | | | |
| | | | | | | | | | | | | | | | | | | | | | | | 1/2035 | | | | | | |
Vintage at Vancouver | | | | | | | | | | | | | | | | | | | | | 7,725 | | | SIFMA + 2.16% | | | | | | |
Vancouver, WA | | | 2011 | | | | | (7) | | | 154 | | | | 98 | % | | Fee | | | 539 | | | 8.12% | | | | | | |
| | | | | | | | | |
Vista Sonoma Seniors Apts | | | | | | | | | | | | | | | | | | | | | | | | 1/2032 | | | | | | |
Santa Rosa, CA | | | 2011 | | | | | (7) | | | 189 | | | | 98 | % | | Fee | | | 9,778 | | | 6.562% | | | | | | |
| | | | | | | | | | | | | | | | | | | | | | | | | | | | | | |
Total - Vintage Properties | | | | | | | | | | | 4,655 units | | | | | | | | | $ | 247,465 | | | | | $ | 3,041 | | | |
| | | | | | | | | | | | | | | | | | | | | | | | | | | | | | |
29
UNCONSOLIDATED OPERATING PROPERTIES - (Continued)
Notes to Unconsolidated Operating Properties Table
| (1) | Debt balance shown represents the property level debt encumbering the properties. |
| (2) | An interest rate swap agreement with a notional amount of $5,369 effectively converts the interest rate to a fixed rate of 4.78% |
| (3) | An interest rate cap was purchased that caps LIBOR at 1%. |
| (4) | There is a LIBOR floor of 1%. |
| (5) | There are no major tenants as the property is currently in development. |
| (6) | An interest rate cap was purchased that caps LIBOR at 2.5%. |
| (7) | The Vintage equity investment of $34,153 represents a 75% interest in Vintage Housing Holdings LLC, an entity which owns the general partnership interests in the properties listed above. |
| (8) | SIFMA = Securities Industry and Financial Markets Association Municipal Swap Index. The one-month SIFMA rate at November 30, 2013 was 0.05%. Each of the Vintage floating rate debt instruments is subject to an interest rate cap ranging from 5.50% and 8.25%. |
| (9) | An interest rate swap agreement with a notional amount of $7,844 effectively converts the interest rate to a fixed rate of 4.76%. |
| (10) | An interest rate swap agreement with a notional amount of $7,500 effectively converts the interest rate to a fixed rate of 5.31%. |
| (11) | An interest rate swap agreement with a notional amount of $920 effectively converts the interest rate to a fixed rate of 6.86%. |
| (12) | An interest rate swap agreement with a notional amount of $14,246 effectively converts the interest rate to a fixed rate of 5.72%. |
| (13) | The one month LIBOR rate at December 31, 2013 was 0.1677%. |
LEASE EXPIRATIONS
The following table sets forth a schedule of lease expirations at our consolidated and unconsolidated commercial properties respectively, with respect to leases in place at December 31, 2013 for each of the next ten years and thereafter (assuming that no tenants exercise renewals or cancellation options and that there are no tenant bankruptcies or other tenant defaults). Annual contractual rent under expiring leases represents base rent charges for the year ended December 31, 2013 and does not reflect any straight-line rent adjustments or expense reimbursements. The average annualized revenue per square foot as of December 31, 2013 was $22.56 for consolidated multi-tenant operating properties and $9.15 for consolidated single tenant operating properties. Annualized revenue represents contractual base rent for December multiplied by twelve.
30
The following tables set forth certain information concerning lease expirations:
| | | | | | | | | | | | | | | | | | | | |
Year of Lease Expirations | | Number of
Expiring Leases | | | Net Rentable
Square Feet
Subject to
Expiring Leases | | | Percentage of Leased
Square Footage
Represented by
Expiring Leases (%) | | | Annual Contractual
Rent Under
Expiring Leases ($) | | | Annual Rent Per
Leased Square Foot
of Expiring
Leases ($) | |
Consolidated Multi Tenant | | | | | | | | | | | | | | | | | | | | |
Operating Properties: | | | | | | | | | | | | | | | | | | | | |
2014 | | | 29 | | | | 102,000 | | | | 8 | % | | $ | 1,635,000 | | | $ | 16.03 | |
2015 | | | 23 | | | | 130,000 | | | | 11 | % | | | 2,453,000 | | | | 18.87 | |
2016 | | | 18 | | | | 67,000 | | | | 6 | % | | | 1,272,000 | | | | 18.99 | |
2017 | | | 19 | | | | 94,000 | | | | 8 | % | | | 1,664,000 | | | | 17.70 | |
2018 | | | 26 | | | | 130,000 | | | | 11 | % | | | 2,596,000 | | | | 19.97 | |
2019 | | | 14 | | | | 211,000 | | | | 18 | % | | | 4,904,000 | | | | 23.24 | |
2020 | | | 3 | | | | 7,000 | | | | 1 | % | | | 146,000 | | | | 20.86 | |
2021 | | | 10 | | | | 87,000 | | | | 7 | % | | | 4,554,000 | | | | 52.34 | |
2022 | | | 8 | | | | 182,000 | | | | 15 | % | | | 4,319,000 | | | | 23.73 | |
2023 | | | 4 | | | | 38,000 | | | | 3 | % | | | 996,000 | | | | 26.21 | |
2024 and Thereafter | | | 11 | | | | 147,000 | | | | 12 | % | | | 2,426,000 | | | | 16.50 | |
| | | | | | | | | | | | | | | | | | | | |
| | | | | | | | | | | 100 | % | | | | | | | | |
| | | | | | | | | | | | | | | | | | | | |
Consolidated Single Tenant | | | | | | | | | | | | | | | | | | | | |
Operating Properties: | | | | | | | | | | | | | | | | | | | | |
2014 | | | 1 | | | | 54,000 | | | | 3 | % | | | 840,000 | | | | 15.56 | |
2015 | | | 2 | | | | 608,000 | | | | 29 | % | | | 1,045,000 | | | | 1.72 | |
2016 | | | 2 | | | | 88,000 | | | | 4 | % | | | 382,000 | | | | 4.34 | |
2017 | | | 2 | | | | 303,000 | | | | 14 | % | | | 3,822,000 | | | | 12.61 | |
2018 | | | 1 | | | | 54,000 | | | | 3 | % | | | 945,000 | | | | 17.50 | |
2019 | | | — | | | | — | | | | — | | | | — | | | | — | |
2020 | | | 1 | | | | 120,000 | | | | 6 | % | | | 1,447,000 | | | | 12.06 | |
2021 | | | — | | | | — | | | | — | | | | — | | | | — | |
2022 | | | — | | | | — | | | | — | | | | — | | | | — | |
2023 | | | 1 | | | | 200,000 | | | | 9 | % | | | 1,980,000 | | | | 9.90 | |
2024 and Thereafter | | | 2 | | | | 666,000 | | | | 32 | % | | | 8,684,000 | | | | 13.04 | |
| | | | | | | | | | | | | | | | | | | | |
| | | | | | | | | | | 100 | % | | | | | | | | |
| | | | | | | | | | | | | | | | | | | | |
Unconsolidated | | | | | | | | | | | | | | | | | | | | |
Operating Properties: | | | | | | | | | | | | | | | | | | | | |
2014 | | | 77 | | | | 148,000 | | | | 11 | % | | | 2,328,000 | | | | 15.74 | |
2015 | | | 66 | | | | 168,000 | | | | 12 | % | | | 3,654,000 | | | | 21.80 | |
2016 | | | 32 | | | | 97,000 | | | | 7 | % | | | 3,634,000 | | | | 37.56 | |
2017 | | | 23 | | | | 70,000 | | | | 5 | % | | | 3,087,000 | | | | 44.01 | |
2018 | | | 26 | | | | 73,000 | | | | 5 | % | | | 2,625,000 | | | | 35.75 | |
2019 | | | 16 | | | | 342,000 | | | | 25 | % | | | 8,060,000 | | | | 23.59 | |
2020 | | | 12 | | | | 169,000 | | | | 12 | % | | | 6,457,000 | | | | 38.30 | |
2021 | | | 4 | | | | 5,000 | | | | — | | | | 693,000 | | | | 126.35 | |
2022 | | | 4 | | | | 135,000 | | | | 10 | % | | | 6,230,000 | | | | 46.18 | |
2023 | | | 5 | | | | 22,000 | | | | 2 | % | | | 2,948,000 | | | | 135.46 | |
2024 and thereafter | | | 23 | | | | 159,000 | | | | 11 | % | | | 4,897,000 | | | | 30.83 | |
| | | | | | | | | | | | | | | | | | | | |
| | | | | | | | | | | 100 | % | | | | | | | | |
| | | | | | | | | | | | | | | | | | | | |
31
TENANT DIVERSIFICATION
The following table sets forth information regarding the leases with respect to the five largest tenants in our consolidated properties portfolio, based on the amount of square footage leased by our tenants at December 31, 2013.
| | | | | | | | | | | | | | | | | | |
Tenant | | Property | | Remaining
Lease Term in
months | | | Total Leased
Square Fee | | | Percentage of
Aggregate
Portfolio
Leased Square
Feet (%) (1) | | | Percentage of
Aggregate
Portfolio Annual
Rent (%) (2) | |
| | | | | |
Spectra Energy | | Houston, TX | | | 148 | | | | 614,000 | | | | 18.5 | % | | | 12.0 | % |
| | | | | |
Football Fanatics, Inc. | | Jacksonville, FL | | | 19 | | | | 561,000 | | | | 16.9 | % | | | 1.6 | % |
| | | | | |
Siemens Real Estate, Inc. | | Orlando, FL | | | 48 | | | | 257,000 | | | | 7.8 | % | | | 7.4 | % |
| | | | | |
Ingram Micro, Inc. | | Amherst, NY | | | 58 | | | | 200,000 | | | | 6.0 | % | | | 3.9 | % |
| | | | | |
The Kroger Company | | Various (3) | | | 29 | | | | 154,000 | | | | 4.7 | % | | | 1.5 | % |
| (1) | Represents percentage of square footage leased excluding month to month leases. |
| (2) | Represents base rent plus straight line rent adjustments. |
| (3) | The Kroger Company is a tenant in three net leased properties located in Georgia, Kentucky and North Carolina. Remaining lease term represents a weighted average based on square footage and percentage of annual rent represents an aggregate of all three properties. |
GROUND LEASES
On certain of our properties we own the improvements and lease the land underlying the improvements pursuant to ground leases.
The following table sets forth the terms of the ground leases:
| | | | | | |
Property Location | | Current Term
Expiration | | Renewal Terms | | Lease Term Rents Per Annum |
| | | |
Atlanta, GA | | 09/30/16 | | Two 5-Year Renewal Options (Extended Term 2026) | | Ground lease calls for $30,000/yr. plus 1/2 of 1% of sales greater than $27,805,800. (1) |
| | | |
Greensboro, NC | | 12/31/17 | | Two 5-Year and 15 one-year Renewal options (Extended Term 2042) | | Ground lease calls for $83,041/yr. increased by approximately $12,000 for each successive renewal period plus 1% of sales over $37,405,200. (1) |
| | | |
Orlando, FL | | 12/31/17 | | Five 5-Year Renewal Options (Extended Term 2037) | | Ground lease calls for $2/yr. of rent though the current term and then fair market value for each successive renewal period. (1) |
| | | |
South Burlington, VT | | 01/02/15 | | Three 5-Year and One 10-Year Renewal Options (Extended Term 2040) | | Ground lease calls for $51,854/yr. though the current term and then fair market value. (1) |
| | | |
450 West 14th Street
New York, NY | | 05/31/53 | | None | | Ground Lease calls for $115,032/month plus increases of 3% per annum each June as well as $100,000 increases per annum on November 1, 2015 and 2017. |
| (1) | The lease requires the tenant to perform all covenants under the ground lease including the payment of ground rent. All extensions are at our option. |
32
MORTGAGE LOANS
Information pertaining to the terms of the first mortgages for each of the properties is included in the table at the beginning of Item 2 - Properties.
ITEM 3 – LEGAL PROCEEDINGS
The Trust is involved from time to time in litigation on various matters, including disputes with tenants and disputes arising out of agreements to purchase or sell properties. Given the nature of the Trust’s business activities, these lawsuits are considered routine to the conduct of its business. The Trust does not expect that the liabilities, if any, that may ultimately result from such legal actions will have a material adverse effect on the consolidated financial position, results of operations or cash flows of the Trust. As of December 31, 2013, the Trust was not involved in any material litigation.
ITEM 4 – MINE SAFETY DISCLOSURES
Not Applicable.
33
PART II
ITEM 5 – MARKET FOR TRUST’S COMMON EQUITY, RELATED SHAREHOLDER MATTERS AND ISSUER PURCHASES OF EQUITY SECURITIES
Market Information
Our Common Shares are listed for trading on the New York Stock Exchange, under the symbol “FUR.”
The table below sets forth the high and low sales prices as reported by the New York Stock Exchange for our Common Shares for each of the periods indicated.
| | | | | | | | |
| | | High | | | Low | |
| | |
Year Ended December 31, 2012: | | | | | | | | |
First quarter | | $ | 12.28 | | | $ | 10.32 | |
Second quarter | | | 12.28 | | | | 10.04 | |
Third quarter | | | 12.67 | | | | 10.55 | |
Fourth quarter | | | 11.50 | | | | 10.32 | |
| | |
Year Ended December 31, 2013: | | | | | | | | |
First Quarter | | $ | 12.80 | | | $ | 11.04 | |
Second Quarter | | | 13.29 | | | | 11.40 | |
Third Quarter | | | 13.66 | | | | 11.07 | |
Fourth Quarter | | | 12.02 | | | | 10.77 | |
Holders
As of December 31, 2013 there were 601 record holders of our Common Shares. This does not include beneficial owners for whom Cede & Co. or others act as nominee.
Dividends
In order to retain REIT status, and thus avoid paying federal corporate tax, we are required by the Code to distribute at least 90% of our REIT taxable income. We declared dividends of $0.1625 per Common Share in each quarter for the last two years.
Pursuant to the terms of our Series D Preferred Shares, we are required to pay quarterly dividends of $0.578125 per Series D Preferred Share.
While we intend to continue paying regular quarterly dividends to holders of our Common Shares, future dividend declarations will be at the discretion of our Board of Trustees and will depend on our actual cash flow, our financial condition, capital requirements, the annual dividend requirements under the REIT provisions of the Code and such other factors as our Board of Trustees deems relevant. The actual cash flow available to pay dividends will be affected by a number of factors, including, among others, the risks discussed under “Risk Factors” in Part I, Item 1A and “Management’s Discussion and Analysis of Financial Condition and Results of Operations” in Part II, Item 7 of this Annual Report.
We do not believe that the financial covenants contained in our loan agreements will have any adverse impact on our ability to pay dividends in the normal course of business to our common and preferred shareholders or to distribute amounts necessary to maintain our qualifications as a REIT.
See Item 7 – Common and Preferred Share Dividends for a further description of our dividend policy.
34
The following table sets forth the shares repurchased during the fourth quarter of 2012. No additional shares have been repurchased since November 30, 2012.
| | | | | | | | | | | | | | | | |
Period | | Total Number of
Common Shares
Purchased | | | Average Price
Paid per
Common Share | | | Total Number of Shares
Purchased as Part of Publicly
Announced Plans or Programs | | | Maximum Number of Shares
that May Yet Be Purchased
Under the Plans or Programs | |
| | | | |
11/1/12 – 11/30/12 | | | 70,040 | | | $ | 10.52 | | | | 70,040 | | | | 1,429,960 | |
Performance Graph
The following graph is a comparison of the five-year cumulative return of Common Shares, a peer group index and the Morgan Stanley REIT Index (“MSCI US REIT”) for the periods shown. The peer group consists of REITs with diverse investments which is in contrast to REITs which target a certain asset type, class or geographic location. The peer group REITs also have current market values as of January 27, 2014 under $750,000,000. The graph assumes that $100 was invested on December 31, 2008 in our Common Shares, a peer group index and the Morgan Stanley REIT Index and that all dividends were reinvested without the payment of any commissions. There can be no assurance that the performance of our shares will continue in line with the same or similar trends depicted in the graph. It should also be noted that if Common Shares were purchased at times after December 31, 2008, the results depicted would not have been the same.
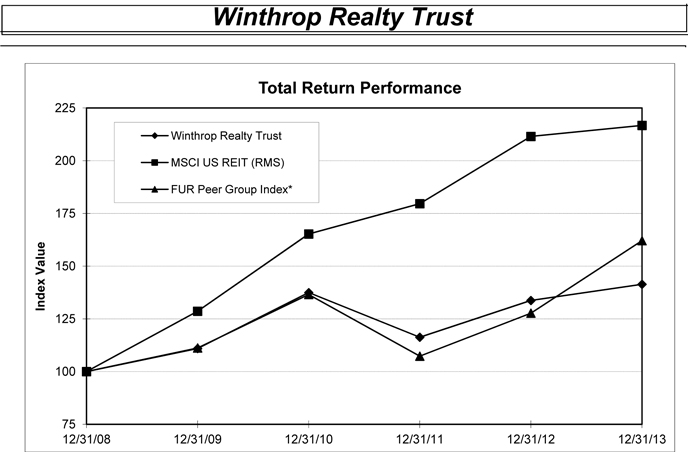
| | | | | | | | | | | | | | | | | | | | | | | | |
| | | Period Ending | |
Index | | 12/31/08 | | | 12/31/09 | | | 12/31/10 | | | 12/31/11 | | | 12/31/12 | | | 12/31/13 | |
Winthrop Realty Trust | | | 100.00 | | | | 110.95 | | | | 137.45 | | | | 116.26 | | | | 133.70 | | | | 141.39 | |
MSCI US REIT (RMS) | | | 100.00 | | | | 128.61 | | | | 165.23 | | | | 179.60 | | | | 211.50 | | | | 216.73 | |
FUR Peer Group Index* | | | 100.00 | | | | 111.18 | | | | 136.54 | | | | 107.30 | | | | 127.69 | | | | 162.06 | |
| * | Peer Group consists of REITs with a diversity and other property focus and have a current market value as of January 27, 2014 of less than $750M. |
35
ITEM 6 – SELECTED FINANCIAL DATA
The following table sets forth selected, historical, consolidated financial data for the Trust and should be read in conjunction with the Consolidated Financial Statements of the Trust and Notes thereto and Management’s Discussion and Analysis of Financial Condition and Results of Operations included in this Annual Report on Form 10-K.
| | | | | | | | | | | | | | | | | | | | |
| | | Years Ended December 31, | |
| Operating Results | | 2013 | | | 2012 | | | 2011 | | | 2010 | | | 2009 | |
| (in thousands, except per share data) | | | | | | | | | | | | | | | |
| | | | | |
Revenue | | $ | 61,103 | | | $ | 44,213 | | | $ | 35,848 | | | $ | 32,984 | | | $ | 34,410 | |
| | | | | | | | | | | | | | | | | | | | |
| | | | | |
Income (loss) from continuing operations (1) | | $ | 21,111 | | | $ | 24,749 | | | $ | 10,584 | | | $ | 19,452 | | | $ | (86,631 | ) |
Income (loss) from discontinued operations (2) | | | 7,667 | | | | (118 | ) | | | 349 | | | | (2,975 | ) | | | 2,284 | |
| | | | | | | | | | | | | | | | | | | | |
Net income (loss) attributable to Winthrop Realty Trust | | | 28,778 | | | | 24,631 | | | | 10,933 | | | | 16,477 | | | | (84,347 | ) |
Preferred dividends | | | (11,146 | ) | | | (9,285 | ) | | | (924 | ) | | | (288 | ) | | | (147 | ) |
Amount allocated to Restricted Common Shares | | | (307 | ) | | | — | | | | — | | | | — | | | | — | |
| | | | | | | | | | | | | | | | | | | | |
Net income (loss) applicable to Common Shares | | $ | 17,325 | | | $ | 15,346 | | | $ | 10,009 | | | $ | 16,189 | | | $ | (84,494 | ) |
| | | | | | | | | | | | | | | | | | | | |
| | | | | |
Per Common Share | | | | | | | | | | | | | | | | | | | | |
Income (loss) from continuing operations, basic | | $ | 0.28 | | | $ | 0.46 | | | $ | 0.31 | | | $ | 0.85 | | | $ | (5.33 | ) |
Income (loss) from discontinued operations, basic (2) | | | 0.23 | | | | — | | | | 0.01 | | | | (0.13 | ) | | | 0.14 | |
| | | | | | | | | | | | | | | | | | | | |
Net income (loss) applicable to Common Shares, basic | | $ | 0.51 | | | $ | 0.46 | | | $ | 0.32 | | | $ | 0.72 | | | $ | (5.19 | ) |
| | | | | | | | | | | | | | | | | | | | |
| | | | | |
Income (loss) from continuing operations, diluted | | $ | 0.28 | | | $ | 0.46 | | | $ | 0.31 | | | $ | 0.85 | | | $ | (5.33 | ) |
Income (loss) from discontinued operations, diluted | | | 0.23 | | | | — | | | | 0.01 | | | | (0.13 | ) | | | 0.14 | |
| | | | | | | | | | | | | | | | | | | | |
Net income (loss) applicable to Common Shares, diluted | | $ | 0.51 | | | $ | 0.46 | | | $ | 0.32 | | | $ | 0.72 | | | $ | (5.19 | ) |
| | | | | | | | | | | | | | | | | | | | |
| | | | | |
Cash dividends declared per Common Share | | $ | 0.65 | | | $ | 0.65 | | | $ | 0.65 | | | $ | 0.65 | | | $ | 0.9125 | |
| | | | | | | | | | | | | | | | | | | | |
| | | | | |
| Balance Sheet Data: | | | | | | | | | | | | | | | |
| (in thousands) | | | | | | | | | | | | | | | |
| | | | | |
Total Assets | | $ | 1,132,324 | | | $ | 923,163 | | | $ | 733,933 | | | $ | 610,128 | | | $ | 493,192 | |
| | | | | | | | | | | | | | | | | | | | |
Total Debt | | $ | 562,075 | | | $ | 421,422 | | | $ | 300,090 | | | $ | 277,193 | | | $ | 238,067 | |
| | | | | | | | | | | | | | | | | | | | |
Non-Controlling redeemable preferred interest | | $ | — | | | $ | — | | | $ | — | | | $ | 3,221 | | | $ | 12,169 | |
| | | | | | | | | | | | | | | | | | | | |
Series D Cumulative Redeemable Preferred Shares | | $ | 120,500 | | | $ | 120,500 | | | $ | 40,000 | | | $ | — | | | $ | — | |
| | | | | | | | | | | | | | | | | | | | |
Total Shareholders’ Equity | | $ | 480,874 | | | $ | 454,510 | | | $ | 387,802 | | | $ | 295,771 | | | $ | 217,089 | |
| | | | | | | | | | | | | | | | | | | | |
| (1) | Income (loss) from continuing operations, including per share data, are net of non-controlling interests. |
| (2) | The results of the Creekwood apartment property were classified as discontinued operations for 2009. The results of the Athens, Georgia and Sherman, Texas properties were classified as discontinued operations for 2009 and 2010. The results of the Lafayette, Louisiana; Knoxville, Tennessee and St. Louis, Missouri properties were classified as discontinued operations for 2009 through 2011. The results of the Indianapolis, Indiana and Memphis, Tennessee properties were classified as discontinued operations for 2009 through 2012. The results of the Andover, Massachusetts; Denton, Texas; Lisle, Illinois (701 Arboretum) and Seabrook, Texas properties were classified as discontinued operation for 2009 through 2013. The results of the Deer Valley, Arizona and Meriden, Connecticut properties were classified as discontinued operations for 2010 through 2013. |
36
ITEM 7 – MANAGEMENT’S DISCUSSION AND ANALYSIS OF FINANCIAL CONDITION AND RESULTS OF OPERATIONS
Certain statements contained herein constitute forward-looking statements as such term is defined in Section 27A of the Securities Act of 1933, as amended, and Section 21E of the Securities Exchange Act of 1934, as amended. Forward-looking statements are not guarantees of performance. They involve risks, uncertainties and assumptions. Our future results, financial condition and business may differ materially from those expressed in these forward-looking statements. You can find many of these statements by looking for words such as “approximates,” “believes,” “expects,” “anticipates,” “intends,” “plans,” “would,” “may” or similar expressions in this Annual Report on Form 10-K. These forward-looking statements are subject to numerous assumptions, risks and uncertainties. Many of the factors that will determine these items are beyond our ability to control or predict. Factors that may cause actual results to differ materially from those contemplated by the forward-looking statements include, but are not limited to, those set forth under “Forward Looking Statements” and “Item 1A – Risk Factors,” as well as our other filings with the SEC. For these statements, we claim the protection of the safe harbor for forward-looking statements contained in the Private Securities Litigation Reform Act of 1995. We expressly disclaim any responsibility to update forward-looking statements, whether as a result of new information, future events or otherwise. Accordingly, investors should use caution in relying on forward-looking statements, which are based on information, judgments and estimates at the time they are made, to anticipate future results or trends.
The preparation of financial statements in conformity with accounting principles generally accepted in the United States of America requires management to make estimates and assumptions that affect the reported amounts of assets and liabilities and disclosure of contingent assets and liabilities at the date of the financial statements and the amounts of revenues and expenses during the reporting periods. Actual results could differ from those estimates. This section should be read in conjunction with the financial statements, footnotes thereto and other items contained elsewhere in this report.
Overview
As a diversified REIT, we operate in three strategic segments: (i) operating properties; (ii) loan assets; and (iii) REIT securities. As value investors we focus and aggressively pursue our investment activity in the segment we believe will generate the greater overall return to us given market conditions at the time. In prior years we have demonstrated our ability to adjust our business plan to capitalize on evolving market conditions both with respect to business segment and capital structure. We will continue to invest in opportunities which we believe will yield superior risk adjusted returns. These investments have in the past had, and may in the future have returns weighted towards the back end of the invested life which negatively impact current earnings and funds from operations.
In connection with our strategy, in certain instances, we seek to acquire assets through joint ventures which allows us to employ third party co-investment capital to maximize diversification of risk and reduce capital concentration and in certain instances leverage off of our joint venture partner’s experience and expertise in specific geographic areas and/or specific asset types.
As value investors we focus and aggressively pursue our investment activity in the real estate investment segments we believe will generate the greater overall return to us given market conditions at the time. In prior years we have demonstrated our ability to adjust our business plan to capitalize on evolving market conditions both with respect to business segment and capital structure. While we made significant new investments in 2013, most notably the portfolio acquisition of four luxury residential multifamily high rises and our election to participate in the hotel portion of our 701 Times Square investment, we have observed very competitive pricing for quality real estate resulting from a low interest rate environment and increasing capital seeking real estate and real estate related investments. We expect that during 2014, absent a change in the macroeconomic environment, new opportunities that meet our asset quality and investment return requirements may be limited. Nevertheless, we will continue to seek new investments and we will continue to look to our existing portfolio for follow-on investment opportunities. Consequently, we have evaluated our stabilized assets with a view towards selling those assets to take advantage of rising prices and have begun executing on such sales. In addition, subject only to the disposition restrictions under the Internal Revenue Code in order to maintain our REIT status, we will continue to realize returns on those investments that we believe have matured in value and recycle the proceeds for new investments and/or corporate reserves.
During 2013 we (i) invested $284,408,000 in new operating property assets and $51,437,000 in new loan assets. (see Item 8 – Financial Statements and Supplementary Data, Note 4 for a description of our acquisitions), (ii) sold operating properties and loan assets for aggregate proceeds of $77,953,000; (iii) received $76,477,000 in loan repayments and returns of our capital investment from our equity investments and (iv) received net proceeds of $30,021,000 from the issuance of 2,750,000 common shares of beneficial interest which we refer to as our Common Shares.
37
We often acquire assets through joint ventures which allows us to employ third party co-investment capital to maximize diversification of risk and reduce capital concentration and in certain instances, leverage off of our joint venture partner’s experience and expertise in specific geographic areas and/or specific asset types.
With respect to our operating results for 2013, net income attributable to Common Shares was $17,325,000 or $0.51 per Common Share as compared with net income in 2012 of $15,346,000 or $0.46 per Common Share. Funds From Operations attributable to Common Shares was $45,817,000 or $1.36 per Common Share for 2013 as compared to Funds From Operations of $46,449,000 or $1.40 per Common Share in 2012. See “Results of Operations” below.
Loan Assets
During 2013 we (i) received repayment in full on four loans receivable and partial repayment on one loan receivable for a total repayment of $56,088,000, (ii) had three loans held in equity investments that were fully repaid resulting in return of capital distributions to us totaling $13,844,000, (iii) sold two loans receivable for net proceeds of $19,319,000, (iv) sold loan assets held in an equity investment resulting in a return of capital distribution to us of $774,000, and (v) invested approximately $51,437,000 in new loan assets consisting of a mezzanine loan and a secured financing receivable. As a result of our loan investments, operating income from loan assets increased by $2,306,000 to $35,661,000 for the year ended December 31, 2013 compared to $33,355,000 for the year ended December 31, 2012. For a description of our loan assets acquired during 2013 see Item 8. Financial Statements, Note 4.
With the exception of our $1,500,000 mezzanine loan collateralized by a flex warehouse property located in Shirley, New York which was recently vacated by its tenant and is in default, all of our loan assets are performing in accordance with their terms.
When making new loan investments, we focus on loans with underlying collateral value, future income return potential and in certain cases, acquisitions of non-performing loans in the fulcrum position which have a high possibility that our debt position in the capital stack will be converted into equity participation.
Operating Properties
During 2013 we (i) acquired five new consolidated operating properties, (ii) made an equity investment in one new operating property, (iii) sold five consolidated operating properties and (iv) lost through foreclosure two of our Sealy equity investments, which we carried at $0. For details of our 2013 operating property transactions see Item 8 – Financial Statements, Note 4.
Consolidated Operating Properties
During 2013 we have seen increases in our operating income from our operating properties as a result of favorable operating results from same store properties, that is, properties held for all 12 months of both 2013 and 2012, complemented by our new store property operating results, that is, properties not held during both complete 12 month periods. The full impact of the improvement is not reflected in continuing operations as certain of our properties with improved operating results were sold or are held for sale and are classified as discontinued operations. See our Results of Operations section below for details of our consolidated properties net income. As of December 31, 2013 our consolidated properties were approximately 90.0% leased compared to approximately 89.9% leased at December 31, 2012.
Tenant Concentration –At December 31, 2013, we had two tenants, Spectra Energy and Siemens Real Estate, which represented approximately 12.1% and 7.4%, respectively, of our annualized base rental revenues from consolidated commercial operating properties and 7.0% and 4.3%, respectively, of total revenue.
1515 Market Street – On February 1, 2013 we entered into a loan modification agreement which extended the maturity date to February 1, 2016, increased the loan balance to $71,629,000, from $70,000,000, and changed the interest rate to be the greater of 7.5% or LIBOR plus 6.5%.
Simultaneously with the modification of the loan, we acquired, for $10,000, an indirect 49% equity interest, including the 0.1% general partner interest, in the entity (“1515 Market Owner”) that owns the property located at 1515 Market Street, Philadelphia, Pennsylvania. We have consolidated this property as of February 1, 2013. For segment reporting purposes, this property will be classified within the operating properties segment as of February 1, 2013. Prior to consolidation, this investment was part of the loan assets segment.
38
On April 25, 2013 1515 Market Owner obtained a $43,000,000 non-recourse first mortgage loan (the “1515 First Mortgage”) from an unaffiliated third party. The 1515 First Mortgage bears interest at LIBOR plus 2.0% per annum, requires monthly payments of interest only and matures on May 1, 2016. On the same date, the 1515 Market Owner entered into an interest rate swap agreement which effectively fixes LIBOR at 0.50% for the term of the 1515 First Mortgage. We received $38,472,000 of loan proceeds from the 1515 First Mortgage financing which reduced the balance on the mortgage loan we hold to $33,157,000. The loan balance can be increased through future funding advances up to an aggregate of $6,000,000 to cover tenant improvements, capital expenditures and leasing commissions. For each $500,000 of future advances, the interest rate increases by 0.10%. At December 31, 2013 we had advanced an additional $1,500,000 resulting in a 0.3% increase in the interest rate. The loan modification also provides the lender with a 40% participation interest in the case of a capital event At December 31, 2013 the loan we hold had a balance of $36,171,000, inclusive of accrued interest, and entitles us to interest in an amount equal to a rate of 14.3% (subject to increase by 0.10% for each additional $500,000 we advance). At December 31, 2013 our investment in this loan was $21,098,000 resulting in an effective interest rate on our cash investment in this asset of 19.6%.
Summit Pointe Apartments –On October 25, 2013 we contributed $4,962,000 for an 80% equity interest in a newly formed venture. On the same date, the venture acquired a 184 unit garden apartment complex known as Summit Pointe Apartments located in Oklahoma City, Oklahoma for a gross purchase price of $14,500,000. In connection with the acquisition, the venture assumed an existing $9,248,000 first mortgage loan. The loan bears interest at a rate of 5.7% per annum, requires monthly payments of principal and interest and matures in February 2021. Pursuant to the terms of the venture agreement, we hold an equity interest which entitles us to an 8% priority return from cash flow and, upon disposition of the property, a minimum priority return equal to a 12% internal rate of return (“IRR”).
Luxury Residential –On October 31, 2013 we acquired through a wholly owned venture four newly constructed luxury apartment buildings for an aggregate purchase price of $246,000,000. The properties are located in Phoenix, Arizona; Stamford, Connecticut; Houston, Texas and San Pedro, California. The properties consist of an aggregate of 761 unsold residential condominium or apartment units and approximately 25,000 square feet of retail space. The acquisition was funded with a $150,000,000 first mortgage loan which is cross collateralized by all four properties. The loan bears interest at a rate of LIBOR plus 2%, requires monthly payments of interest only and matures on October 31, 2016 with two one year extension options. The balance of the purchase was funded from cash on hand. On the same date, the venture entered into an interest rate swap agreement which effectively fixes LIBOR at 0.69% for the initial term of the first mortgage. In addition, the venture acquired two interest rate caps, each with a notional amount of $50,000,000 for an aggregate cost of $390,000. The initial cap is effective for the first one year extension period and caps LIBOR at 4%. The second cap is effective for the second one year extension period and caps LIBOR at 5%.
On November 6, 2013 New Valley LLC (“New Valley”) contributed approximately $16,365,000 to the entity that acquired the properties in exchange for an indirect 16.3% interest in the properties. We retained an 83.7% interest in the venture and have the right to make all decisions with respect to each of the properties, other than the Stamford, Connecticut property, subject to obtaining New Valley’s consent to certain major decisions. With respect to the Stamford, Connecticut property, prior to November 6, 2016 the consent of New Valley is required on all matters other than those that are administrative in nature. New Valley has the right at any time after November 6, 2015 (or in certain instances prior thereto), but on or prior to November 6, 2016, to have its interest in the venture redeemed for a 50% interest in the Stamford, Connecticut property.
Leasing
Amherst, New York –On July 29, 2013 we executed a lease amendment with the existing tenant, Ingram Micro Inc., which leases the entire 200,000 square foot premises. The initial lease was signed in 1988 and was scheduled to expire October 31, 2013 (subject to two five-year extensions). The new lease extends the term through October 31, 2023 with one ten-year or two five-year renewal options. Lease payments under the amendment remained unchanged through the expiration of the original lease. Annual rents under the original lease were $2,016,000. Annual rents under the amended lease are $1,802,000 for the period November 1, 2013 through October 31, 2018 and $2,002,000 for the period November 1, 2018 through October 31, 2023. The base rent is subject to increase upon the delivery of additional parking area to the tenant, which is expected to be completed during the second quarter of 2014.
39
Sales
Andover, Massachusetts –On March 28, 2013 we sold our Andover, Massachusetts office property to an independent third party for gross sale proceeds of $12,000,000. After costs and pro-rations, we received net proceeds of approximately $11,425,000 and recorded a gain of $2,775,000 on the sale of the property. The results of operations have been classified as discontinued operations for all periods presented in the consolidated interim financial statements.
Deer Valley, Arizona –On June 11, 2013 we sold our Deer Valley, Arizona office property to an independent third party for gross sale proceeds of $20,500,000. After costs and pro-rations, we received net proceeds of approximately $19,585,000 and recorded a gain of $6,745,000 on the sale of the property. The results of operations have been classified as discontinued operations for all periods presented in the consolidated interim financial statements.
Denton, Texas –On July 2, 2013 we sold our Denton, Texas property to an independent third party for gross sale proceeds of $1,850,000. After costs and pro-rations, we received net proceeds of approximately $1,703,000. No gain or loss was recorded on the sale of the property. The results of operations have been classified as discontinued operations for all periods presented in the consolidated interim financial statements.
Seabrook, Texas – On August 1, 2013 we sold our Seabrook, Texas property to an independent third party for gross sale proceeds of $3,300,000. After costs and pro-rations, we received net proceeds of approximately $3,202,000 and recorded a gain of $1,428,000 on the sale of the property. The results of operations have been classified as discontinued operations for all periods presented in the consolidated interim financial statements.
Lisle, Illinois –On December 17, 2013 we sold our Lisle, Illinois office property known as 701 Arboretum to an independent third party for gross sale proceeds of $2,500,000. After costs and pro-rations we received net proceeds of approximately $2,351,000 and recorded a gain of $58,000 on the sale of the property. The results of operations have been classified as discontinued operations for all periods presented in the consolidated interim financial statements.
Meriden, Connecticut –On February 26, 2014 we sold our Meriden, Connecticut property to an independent third party for gross sale proceeds of $27,500,000. After costs and pro-rations and a transfer of the mortgage debt, we received net proceeds of approximately $5,106,000 on the sale of the property. This property was under contract to be sold with a $500,000 non-refundable deposit as of December 31, 2013. This property was classified as held for sale as of December 31, 2013 and the results of operations have been classified as discontinued operations for all periods presented in the consolidated interim financial statements.
Equity Investments
Vintage Housing -During the years ended December 31, 2013 and 2012, we recorded net income from our investment in Vintage Housing of $9,174,000 and $4,603,000, respectively, and received cash distributions of $5,555,000 and $6,023,000, respectively. The Vintage properties were 97% occupied at November 30, 2013. We have elected to recognize our earnings on a one month lag.
WRT-Elad Lender/Equity – Sullivan Center - On August 21, 2013 we acquired from an affiliate of Elad Canada Inc. (“Elad”), our joint venture partner, its 50% joint venture interest (the “Elad Interest”) in WRT-Elad One South State (“Lender LP”) for $30,000,000 (“Acquisition Price”). The mezzanine loan had an outstanding balance of principal and accrued interest of approximately $56,150,000 at the time the Elad Interest was acquired. Concurrently with the acquisition of the Elad Interest, we entered into an option agreement (the “Elad Option”) which grants Elad the option, but not the obligation, to repurchase its interest in Lender LP for the Acquisition Price adjusted for the pro-rata portion of any accrued and unpaid interest and principal payments made by the borrower. Per the terms of the agreements, the Elad Interest and Elad Option cannot be transferred to parties other than us and Elad. The term of the Elad Option corresponds with Lender LP’s mezzanine loan.
On October 18, 2013, the owner of the Sullivan Center property obtained a new $113,500,000 first mortgage loan. The loan bears interest at a rate of 3.95% per annum, requires monthly payments of interest only and matures on November 6, 2018. The proceeds from the loan were used to repay the existing $110,550,000 first mortgage loan which bore interest at a rate of 11.0% per annum. The new loan eliminates the requirement for the cash trap with the lender and the property owner re-commenced making payments on the mezzanine loan on November 9, 2013 in accordance with the terms of the forbearance agreement.
40
In February 2013, our joint venture which holds an indirect future interest in Sullivan Center increased its future ownership interest from 65% to 70%, which interest was further increased to 76% in November 2013. The increases were in exchange for a forbearance by Lender LP with respect to the failure by the borrower to make required debt service payments from January 2013 through October 2013.
During the years ended December 31, 2013 and 2012, we recorded net income on our equity investments in Sullivan Center of $1,315,000 and $903,000, respectively, and received cash distributions of $5,116,000 and $0, respectively. The Sullivan Center was 83% leased at November 30, 2013. We have elected to recognize our earnings on a one month lag.
701 Seventh Avenue, New York, New York – During 2013, with respect to the joint venture that indirectly owns the property located at 701 Seventh Avenue, New York, New York we elected to participate in the future hotel development and during 2013, we made additional cash contributions to the venture totaling $24,465,000. We have contributed an additional $33,419,000 in 2014 bringing our total capital contributed at such date to $86,855,000 against our $125,000,000 commitment. The contribution was made concurrently with the refinancing of the property’s existing indebtedness with a new $237,500,000 mortgage loan and $315,000,000 mezzanine loan of which $346,500,000 was advanced at closing with the balance to be advanced for constructions costs of the approximately 80,000 square feet of retail space which will include an approximately 120 foot high, 20,000 square foot state of the art LED sign. Both the mortgage loan and mezzanine loan bear interest at LIBOR plus 8% per annum, require payments of interest only and mature January 31, 2017, subject to two-one year extension terms. These loans refinanced the then existing mortgage and mezzanine loans that bore interest at LIBOR plus 11% per annum.
In addition, the venture also entered into two additional loan agreements providing for supplemental loans totalling $262,500,000, which agreements are held in escrow and only become effective upon the satisfaction of certain conditions. At such time as such loan agreements are released from escrow, if at all, the venture will be permitted to draw on such loans to provide additional construction financing in order to develop a 452 room hotel which will be constructed above the retail component. If fully funded, the maximum aggregate debt among the various loans funded would be $815,000,000.
During the years ended December 31, 2013 and 2012, we recorded net income from our investment in 701 Seventh Avenue of $3,424,000 and $0, respectively and received cash distributions of $2,813,000 and $290,000, respectively. We have elected to recognize our earnings on a three month lag.
Atrium Mall LLC-On June 20, 2013 we, through a newly formed 50-50 joint venture with Marc Realty, acquired a non-performing $10,650,000 mortgage loan for $6,625,000. In addition, the joint venture paid $1,137,000 to fund escrows at the closing. We invested a total of $3,935,000 in this joint venture during 2013. The loan was in maturity default at the time of acquisition and was acquired with the intention of foreclosing or working out a consensual assignment with the borrower. The loan was collateralized by a leasehold interest in the Atrium Mall in Chicago, Illinois. The leasehold interest is for 71,000 square feet of commercial/retail space that comprises the bottom three floors of an office building known as the James R. Thompson building of which the lease expires in September 2014 with six automatic five-year extensions which are exercisable at the lessee’s option. The building is owned by the State of Illinois.
On July 26, 2013 the joint venture entered into an agreement with the borrower pursuant to which the borrower conveyed the leasehold interest to the venture in lieu of foreclosure. Accordingly, the venture now holds the leasehold interest in the property.
WRT-Fenway Wateridge – On October 15, 2013, our venture that holds this property obtained a $7,000,000 first mortgage loan on its San Diego, California property. The loan bears interest at the greater of 6%, or LIBOR plus 4.5% per annum, requires monthly payments of interest only and matures on November 1, 2016. The venture purchased an interest rate cap which caps LIBOR at 2.5%. In connection with the financing, we received a distribution of $6,255,000 in partial redemption of our preferred equity investment. Subsequent to the distribution, our preferred equity balance is $229,000. We retain the balance of our preferred equity interest as well as a 50% equity interest in the venture.
Sealy Airpark – Nashville, Tennessee –On October 7, 2013 the lender foreclosed on the loan that was collateralized by this property. We held our interest in this property through a venture that was managed by our partner and had previously written down our investment to zero. Accordingly, for financial reporting purposes we did not recognize a gain or loss in connection with the foreclosure.
Sealy Newmarket – Atlanta, Georgia - On December 2, 2013 the lender foreclosed on the loan that was collateralized by this property. We held our interest in this property through a venture that was managed by our partner and had previously written down our investment to zero. Accordingly, for financial reporting purposes we did not recognize a gain or loss in connection with the foreclosure.
41
Marc Realty-In February 2014 we entered into a letter agreement with Marc Realty to sell our interest in the three suburban Chicago, Illinois properties and our interest in the River City, Chicago, Illinois consolidated property for a gross sales price of $6,000,000. The sale of these assets occurred on March 5, 2014. See Results of Operations for additional discussion on the other-than-temporary impairment charges totaling $6,235,000 on our investments in the three suburban properties at December 31, 2013. These impairment charges are reflected in equity in earnings for the year ended December 31, 2013. See Results of Operations for additional discussion on these impairments.
We also granted to Marc Realty an option exercisable within two years to acquire our interest in the property located at 223 W. Jackson, Chicago, Illinois for a purchase price, depending on adjustments and timing, expected to be not less than $5,800,000. See Results of Operations for additional discussion on the other-than-temporary impairment charge of $1,452,000 at December 31, 2013 on our equity investment in this property. This impairment charge is reflected in equity in earnings for the year ended December 31, 2013.
REIT Securities
During 2013 we liquidated all of our holdings of REIT securities. In particular, we sold 3,000,716 shares of common stock in Cedar Realty Trust, Inc. (“Cedar”) which we had acquired for an aggregate cost of $12,891,000 for aggregate sales proceeds of $16,292,000. We also sold 1,250,000 shares of MPG Office Trust Inc. which we had acquired for an aggregate cost of $2,984,000 for aggregate sale proceeds of $3,626,000.
Liquidity and Capital Resources
At December 31, 2013, we held $112,512,000 in unrestricted cash and cash equivalents.
We believe that cash flow from operations will continue to provide adequate capital to fund our operating and administrative expenses, as well as debt service obligations in the short term. As a REIT, we must distribute annually at least 90% of our REIT taxable income. As a result of this dividend requirement, we, like other REITs, are unable to reinvest all of our operating cash flow and are dependent on raising capital through equity and debt issuances or forming ventures with investors to obtain funds with which to expand our business. Accordingly, we anticipate that capital with which to make future investment and financing activities will be provided from return of capital received from proceeds from loan maturities and prepayments, borrowings, the issuance of additional equity and debt securities as well as proceeds from sales of existing assets.
Our primary sources of funds include:
| | • | | the use of cash and cash equivalents; |
| | • | | rents and reimbursements received from our operating properties; |
| | • | | payments received under our loan assets; |
| | • | | disposition of REIT securities; |
| | • | | sale of existing assets; |
| | • | | cash distributions from joint ventures; |
| | • | | asset specific borrowings; and |
| | • | | the issuance of equity and debt securities. |
Public Offerings
On September 30, 2013 we closed a public offering of 2,750,000 Common Shares at a price of $11.45 per share before underwriters discount. We received net proceeds of approximately $30,021,000 after underwriters discount and expenses.
Debt Maturities
At December 31, 2013, we had consolidated mortgage loans payable of $444,933,000. We have $18,877,000 of mortgage debt maturing in 2014, $8,579,000 maturing in 2015 and $326,182,000 maturing in 2016 with the remainder maturing in 2017 or later. With respect to our two mortgage loans maturing in 2014, we anticipate exercising our one year extension options which are available on each loan. Our $50,000,000 revolving line of credit had no amounts outstanding at December 31, 2013
42
and matures in March 2014. We elected not to exercise our one remaining one-year renewal option. We continually evaluate our debt maturities and based on our current assessment, we believe there are viable financing and refinancing alternatives for debts as they mature that will not materially adversely impact our liquidity or our expected financial results.
Net Loss Carry Forwards
At December 31, 2012, we had a net operating loss carry forward of approximately $4,830,000 which expires in 2023. We do not anticipate having to utilize any of the net operating loss carry forward to offset 2013 taxable income. The utilization of a majority of our net operating loss carry forward will limit our ability to shelter taxable income in the future which may require us to distribute funds and reduce cash available for reinvestment on a going forward basis. We had capital loss carry forwards of $31,697,000 at December 31, 2012 which expire from 2014 through 2015. We anticipate utilizing $15,697,000 of the capital loss carry forward to offset 2013 capital gains.
Cash Flows
Our liquidity based upon cash and cash equivalents increased by approximately $14,830,000 from $97,682,000 at December 31, 2012 to $112,512,000 at December 31, 2013.
Our cash flow activities for the year ended December 31, 2013 are summarized as follows (in thousands):
| | | | |
Net cash flow provided by operating activities | | $ | 30,268 | |
Net cash flow used in investing activities | | | (182,278 | ) |
Net cash flow provided by financing activities | | | 166,840 | |
| | | | |
Increase in cash and cash equivalents | | $ | 14,830 | |
| | | | |
Operating Activities
For the year ended December 31, 2013, our operating activities generated net income of $24,488,000 and positive cash flow of $30,268,000. Our cash provided by operations reflects our net income adjusted by: (i) a decrease for non-cash items of $10,337,000 representing primarily equity earnings from non-consolidated interests, current period loan discount accretion and realized gains on the sale of real estate investments offset by adding back depreciation and amortization expenses and $10,591,000 for impairment charges; (ii) an increase of $37,000 for discount accretion received in cash; (iii) an increase for $24,719,000 of distributions from non-consolidated interests; and (iv) a net decrease due to changes in other operating assets and liabilities of $8,639,000. See our discussion of Results of Operations below for additional details on our operations.
Investing Activities
Cash flow used in investing activities for the year ended December 31, 2013 was approximately $182,278,000 as compared to cash flows used in investing activities of approximately $109,447,000 for the comparable period in 2012. Cash is used in investing activities primarily to fund acquisitions, loan originations and net investments in unconsolidated joint ventures. Investing activity for 2013 consisted primarily of the acquisition of five residential properties, a new loan origination, the acquisition of a commercial property through a newly formed unconsolidated joint venture and follow on investments in existing joint ventures. These investments were offset by proceeds received from the sale of five properties, two loans receivable and all of our REIT securities holdings as well as distributions from our unconsolidated joint ventures.
Net cash used in investing activities of $182,278,000 for the year ended December 31, 2013 was comprised primarily of the following:
| | • | | $245,931,000 for the acquisition of four luxury apartment buildings which were acquired on October 31, 2013; |
| | • | | $30,000,000 for the secured financing transaction related to the purchase of Elad’s 50% interest in Lender LP; |
| | • | | $25,913,000 for investment in our 701 Seventh Avenue venture; |
| | • | | $20,569,000 for our mezzanine loan origination indirectly secured by a property in Playa Vista, California; |
| | • | | $5,867,000 for the acquisition of our Oklahoma City, Oklahoma residential property; |
| | • | | $5,344,000 for investment in capital and tenant improvements at our operating properties; |
| | • | | $3,935,000 for investment in our new Atrium Mall joint venture; and |
| | • | | $868,000 of advances made on our 1515 Market Street loan receivable prior to our consolidating this property. |
43
These uses of cash flow were offset primarily by:
| | • | | $56,088,000 in collection of loans receivable; |
| | • | | $19,918,000 in proceeds from the sale of securities carried at fair value; |
| | • | | $19,774,000 in proceeds from the sale of our Deer Valley, Arizona office property; |
| | • | | $19,319,000 in proceeds from the sale of two loans receivable; |
| | • | | $11,538,000 in proceeds from the sale of our Andover, Massachusetts office property; |
| | • | | $10,834,000 in return of capital distributions from our 10 Metrotech venture; |
| | • | | $5,771,000 in return of capital distributions from our WRT-Fenway Wateridge joint venture; |
| | • | | $4,905,000 in proceeds from the sale of two net lease retail properties; |
| | • | | $3,009,000 in return of capital distributions from our Concord joint ventures; |
| | • | | $2,473,000 in proceeds from the sale of out Lisle, Illinois property known as 701 Arboretum; and |
| | • | | $774,000 in return of capital distributions from our RE CDO Management joint venture. |
Financing Activities
Cash flow provided by financing activities for the year ended December 31, 2013 was approximately $166,840,000 as compared to cash flow provided by financing activities of approximately $119,742,000 for the comparable period in 2012. This change of approximately $47,098,000 resulted primarily from proceeds from new mortgage loans payable and proceeds from the issuance of our Common Shares.
Net cash provided by financing activities of $166,840,000 for the year ended December 31, 2013 was comprised primarily of the following:
| | • | | $150,000,000 in proceeds from a new mortgage loan on our four luxury residential properties; |
| | • | | $43,000,000 in proceeds from a new mortgage loan on our 1515 Market Street office property; |
| | • | | $30,021,000 in proceeds from the issuance of Common Shares; |
| | • | | $16,365,000 in contributions from non-controlling interests at our four luxury residential properties; |
| | • | | $5,100,000 in proceeds from a new mortgage loan on our Churchill, Pennsylvania property; |
| | • | | $1,342,000 in contributions from non-controlling interests at our Summit Pointe Apartments, Oklahoma property; and |
| | • | | $922,000 in contributions from non-controlling interests at our 450 W 14th Street property. |
These sources of cash flow were offset primarily by:
| | • | | $23,770,000 for payments on our recourse secured financing; |
| | • | | $22,287,000 for principal payments on our mortgage loans payable; |
| | • | | $21,919,000 for dividend payments on our Common Shares; |
| | • | | $11,146,000 for dividend payments on our Series D Preferred Shares; |
| | • | | $796,000 for deferred financing costs; and |
| | • | | $150,000 for the acquisition of non-controlling interests on our 5400 Westheimer Houston, Texas property. |
Future Cash Commitments
Future Funding Requirements
We have future funding requirements relating to our 450 W 14th Street property, our 701 Seventh Avenue investment and our 1515 Market Street loan which total approximately $71,092,000 at December 31, 2013. In January 2014 we increased our funding commitment to our 701 Seventh Avenue investment by $5,000,000 and to date in 2014 we made additional contributions of $33,419,000 to our 701 Seventh Avenue investment reducing our overall future funding commitment for these investments to $42,673,000.
44
Common and Preferred Share Dividends
As a result of our emphasis on total return, while we seek to achieve a stable, predictable dividend for our shareholders, we do not select or manage our investments for short-term dividend growth, but rather towards achieving overall superior total return. While we intend to continue paying dividends each quarter, the amount of our dividend will depend on the actual cash flow, financial condition, capital requirements, utilization of available capital losses, distribution requirements for REITs under the Internal Revenue Code, and such other factors as our Board of Trustees deem relevant. Subject to the foregoing, we expect to continue distributing our current cash flow from operations after reserving normal and customary amounts to maintain adequate capital reserves. In addition, when deemed prudent or necessitated by applicable dividend requirements for REITs under the Internal Revenue Code, we may make one or more special dividends during any particular year. However, during a favorable investing environment, we expect that we will utilize our carry forward capital losses to shelter gains from the disposition of our assets so we may use the proceeds for investment. We expect to continue applying these standards with respect to our dividends on a quarterly basis which may cause the dividends to increase or decrease depending on these various factors.
During 2013 we paid a regular quarterly dividend of $0.1625 per Common Share. We paid a regular quarterly dividend of $0.578125 per Series D Preferred Share.
Contractual Obligations
The following table summarizes our payment obligations under contractual obligations, including all fixed and variable rate debt obligations, except as otherwise noted, as of December 31, 2013 (in thousands):
| | | | | | | | | | | | | | | | | | | | |
| | | Payments Due By Period | |
| | | Total | | | Less than
1 Year | | | 2-3 Years | | | 4-5 Years | | | After
5 Years | |
Mortgage loans payable (principal and interest) (1) | | $ | 513,711 | | | $ | 45,646 | | | $ | 350,973 | | | $ | 80,141 | | | $ | 36,951 | |
Senior notes payable (principal and interest) | | | 143,903 | | | | 6,684 | | | | 13,369 | | | | 13,369 | | | | 110,481 | |
Secured financings | | | 29,885 | | | | 14,735 | | | | 15,150 | | | | — | | | | — | |
Revolving line of credit (principal and interest) (1) | | | — | | | | — | | | | — | | | | — | | | | — | |
Ground lease obligations (2) | | | 115,534 | | | | 1,405 | | | | 3,055 | | | | 3,447 | | | | 107,627 | |
Advisors’ fee (3) | | | 37,156 | | | | 9,289 | | | | 18,578 | �� | | | 9,289 | | | | — | |
| | | | | | | | | | | | | | | | | | | | |
| | $ | 840,189 | | | $ | 77,759 | | | $ | 401,125 | | | $ | 106,246 | | | $ | 255,059 | |
| | | | | | | | | | | | | | | | | | | | |
| (1) | Does not reflect financing activity subsequent to December 31, 2013. |
| (2) | This obligation relates to the ground lease at our property located at 450 West 14th Street, New York, New York which expires May 31, 2053. |
| (3) | Advisor’s fee based upon the terms of the Advisory Agreement with our external advisor, effective January 1, 2014, with no effect given to any equity that may be issued or repurchased after December 31, 2013. No amounts have been included for subsequent renewal periods of the Advisory Agreement. |
We carry comprehensive liability and all risk property insurance covering fire, flood, extended coverage, “acts of terrorism,” as defined in the Terrorism Risk Insurance Act of 2002 and rental loss insurance with respect to our operating properties where coverage is not provided by our net lease tenants. Under the terms of our net leases, the tenant is obligated to maintain adequate insurance coverage.
Our debt instruments, consisting of mortgage loans secured by our operating properties (which are generally non-recourse to us), contain customary covenants requiring us to maintain insurance. Although we believe that we have adequate insurance coverage under these agreements, we may not be able to obtain an equivalent amount of coverage at reasonable costs in the future. Further, if lenders insist on greater coverage than we are able to obtain at reasonable costs, it could adversely affect our ability to finance and/or refinance our properties and expand our portfolio.
45
Comparability of Financial Data from Period to Period
The comparability of financial data from period to period is affected by several items including (i) the timing of our acquisitions and leasing activities; (ii) the purchases and sales of assets and investments; (iii) when material other-than-temporary impairment charges on assets in our portfolio are taken; and (iv) the reclassification of assets. In this regard, the comparability of financial results for the years presented were impacted by other-than-temporary impairment charges on our equity investments recognized in 2013, property impairments recognized in 2012, the addition of five operating properties in 2013 and three operating properties in 2012, the acquisition of several loan assets in 2012, the divestiture of our REIT securities in 2013 and 2012, the sale of five consolidated operating properties in 2013 and the sale of several of our Marc Realty equity investments in 2012.
Results of Operations
Our results of operations are discussed below by segment:
| | • | | Operating Properties – our wholly and partially owned operating properties; |
| | • | | Loan Assets – our loans receivable, loan securities carried at fair value, and equity investments in loan assets; |
| | • | | REIT Securities – our ownership of equity and debt securities in other real estate investment trusts; and |
Non-segment specific results which include interest on cash reserves, general and administrative expenses and other non-segment specific income and expense items, are reported under corporate income (expense).
The following table summarizes our assets by segment at year end (in thousands):
| | | | | | | | |
| | | 2013 | | | 2012 | |
| | |
Operating properties | | $ | 845,698 | | | $ | 562,822 | |
Loan assets | | | 147,702 | | | | 239,534 | |
REIT securities | | | — | | | | 19,694 | |
Corporate | | | | | | | | |
Cash and cash equivalents | | | 112,512 | | | | 97,682 | |
Restricted cash | | | 186 | | | | — | |
Accounts receivable and prepaids | | | 543 | | | | 336 | |
Deferred financing costs | | | 2,645 | | | | 3,095 | |
Discontinued Operations | | | 23,038 | | | | — | |
| | | | | | | | |
Total Assets | | $ | 1,132,324 | | | $ | 923,163 | |
| | | | | | | | |
Our increase in operating property assets is due to our acquisition of four luxury residential properties ($248,648,000), and our Summit Pointe Apartments Oklahoma City, Oklahoma residential property ($15,261,000), and the conversion of our 1515 Market Street property from a loan asset to an operating property ($67,405,000) as a result of our acquisition of a 49% equity interest, inclusive of the general partner interest, in the property. These increases were partially offset from the sale of five operating properties in 2013 ($31,605,000).
The decrease in loan assets was due primarily to the conversion of our 1515 Market Street property to an operating property, collections on our Queensridge loan receivable, the sale of our Disney B Note at par, the payoffs at par of three loans receivable, and the payoff of our Metrotech loan equity investment offset by the acquisition of our venture partner’s interest in the Sullivan Center mezzanine loan and the origination of our loan receivable indirectly secured by a property in Playa Vista, California.
The decrease in REIT securities assets was the result of the sale of all of our holdings of REIT securities.
46
The following table summarizes our results from continuing operations by segment for each of the years ended December 31, (in thousands):
| | | | | | | | | | | | |
| | | 2013 | | | 2012 | | | 2011 | |
Operating properties | | $ | 5,708 | | | $ | 219 | | | $ | (14,736 | ) |
Loan assets | | | 33,369 | | | | 31,740 | | | | 35,295 | |
REIT securities | | | 600 | | | | 8,011 | | | | 3,895 | |
Corporate expenses | | | (22,856 | ) | | | (15,468 | ) | | | (13,056 | ) |
| | | | | | | | | | | | |
Consolidated income from continuing operations | | $ | 16,821 | | | $ | 24,502 | | | $ | 11,398 | |
| | | | | | | | | | | | |
Comparison 2013 to 2012
Operating Properties
The following table summarizes our results from continuing operations for our operating properties segment for the years ended December 31, 2013 and 2012 (in thousands):
| | | | | | | | |
| | | 2013 | | | 2012 | |
| | |
Rents and reimbursements | | $ | 61,103 | | | $ | 44,213 | |
Operating expenses | | | (20,724 | ) | | | (13,614 | ) |
Real estate taxes | | | (5,876 | ) | | | (3,672 | ) |
Equity in income (loss) of Marc Realty investments | | | (284 | ) | | | 33 | |
Equity in income of 701 Seventh Avenue | | | 3,424 | | | | — | |
Equity in income of WRT-Fenway Wateridge | | | 796 | | | | — | |
Equity in loss of Atrium Mall | | | (90 | ) | | | — | |
Equity in loss of Sealy Northwest Atlanta | | | (469 | ) | | | (388 | ) |
Equity in income of Vintage Housing | | | 9,174 | | | | 4,603 | |
Equity in income of WRT-Elad | | | 1,315 | | | | 903 | |
Equity in income of Mentor | | | 84 | | | | 46 | |
Equity in loss of Sealy Newmarket | | | — | | | | (2,811 | ) |
Equity in income of F-II Co-invest | | | — | | | | 232 | |
| | | | | | | | |
Operating properties operating income | | | 48,453 | | | | 29,545 | |
| | |
Depreciation and amortization expense | | | (20,443 | ) | | | (15,119 | ) |
Interest expense | | | (14,204 | ) | | | (12,348 | ) |
Impairment loss on investments in real estate | | | — | | | | (1,738 | ) |
Impairment loss on Marc Realty equity investment | | | (7,687 | ) | | | — | |
Settlement expense | | | (411 | ) | | | — | |
Gain (loss) on extinguishment of debt | | | — | | | | (121 | ) |
| | | | | | | | |
Operating properties net income | | $ | 5,708 | | | $ | 219 | |
| | | | | | | | |
Operating income from our operating properties, which we define for our consolidated operating properties as all items of income and expense directly derived from or incurred by this segment before depreciation, amortization, interest expense and other non-recurring non-operating items, and including our share of income or loss from equity investments, increased by $18,908,000 compared to the prior year period.
47
The following table sets forth our operating results from same store properties (properties held throughout both the current and prior year reporting periods) and new store properties (in thousands):
Consolidated Operating Properties
| | | | | | | | |
| | | For the Year Ended December 31, | |
| | | 2013 | | | 2012 | |
Rents and reimbursements | | | | | | | | |
Same store properties | | $ | 38,872 | | | $ | 41,004 | |
New store properties | | | 22,231 | | | | 3,209 | |
| | | | | | | | |
| | | 61,103 | | | | 44,213 | |
| | | | | | | | |
Operating expenses | | | | | | | | |
Same store properties | | | 10,976 | | | | 12,258 | |
New store properties | | | 9,748 | | | | 1,356 | |
| | | | | | | | |
| | | 20,724 | | | | 13,614 | |
| | | | | | | | |
Real estate taxes | | | | | | | | |
Same store properties | | | 2,968 | | | | 3,277 | |
New store properties | | | 2,908 | | | | 395 | |
| | | | | | | | |
| | | 5,876 | | | | 3,672 | |
| | | | | | | | |
Consolidated operating properties operating income | | | | | | | | |
Same store properties | | | 24,928 | | | | 25,469 | |
New store properties | | | 9,575 | | | | 1,458 | |
| | | | | | | | |
| | $ | 34,503 | | | $ | 26,927 | |
| | | | | | | | |
The decrease in operating income for our same store properties was primarily the result of a decrease in revenues of $2,132,000 which was partially offset by a decrease in operating expenses of $1,282,000 and a decrease in real estate taxes of $309,000. The same store results were supplemented by positive results from our new store properties.
| | • | | Rental revenues increased by $16,890,000 due to an increase in new store revenues of $19,022,000, while there was a decrease in same store revenues of $2,132,000. The decrease in same store revenue was the result of: |
| | • | | A decrease in average occupancy at our Chicago, Illinois property known as River City from 63% to 49% primarily due to the loss of a 55,000 square foot tenant in August 2012. The space previously occupied by this tenant remained vacant at December 31, 2013. |
| | • | | An amendment to the lease terms for Spectra Energy at 5400 Westheimer located in Houston, Texas. The modified lease reduces the average annual contractual obligation but extends the term of the lease through April 30, 2026; |
| | • | | The sale of a portion of our Churchill, Pennsylvania property which occurred May 14, 2012; |
| | • | | An amendment to the lease terms for Ingram Micro Inc. at our Amherst, New York property. The modified lease reduces the average annual contractual obligation but extends the term of the lease through October 31, 2023. |
Which were partially offset by increases from:
| | • | | Increased average occupancy at our property known as 450 W 14th Street located in New York, New York from 82% to 83%; |
| | • | | Increased average occupancy at our property known as Crossroads II located in Englewood, Colorado from 82% to 88%; |
| | • | | Increased average occupancy at our property known as Crossroads I located in Englewood, Colorado from 65% to 80%. |
New store revenues for the year ended December 31, 2013 were as follows:
| | • | | $9,484,000 from our 1515 Market St office property in Philadelphia, Pennsylvania which is consolidated as of February 1, 2013; |
| | • | | $3,873,000 from our four luxury residential properties acquired on October 31, 2013; |
| | • | | $3,430,000 from our Waterford Apartments property in Memphis, Tennessee which was acquired April 17, 2012; |
| | • | | $2,756,000 from our office property in Cerritos, California which was acquired October 4, 2012; |
| | • | | $2,353,000 from our Lake Brandt Apartments property in Greensboro, North Carolina which was acquired November 2, 2012; and |
| | • | | $335,000 from our Summit Pointe Apartments property in Oklahoma City, Oklahoma which was acquired October 24, 2013. |
48
Operating expenses increased by $7,110,000 due to an increase in expenses at our new store properties of $8,392,000. Same store operating expenses decreased by $1,282,000 due primarily to a decrease in expenses of $1,277,000 at our Churchill, Pennsylvania property as a result of the partial sale of the property and the new net lease with Westinghouse.
Real estate tax expense increased by $2,204,000. Real estate tax of $2,908,000 at our new store properties was offset by a decrease of $309,000 at our same store properties. The reduction at our same store properties was a result of the following:
| | • | | A decrease of $187,000 at our Crossroads I property due primarily to a prior year tax abatement approved and received in 2013; |
| | • | | A decrease of $175,000 at our Crossroads II property due primarily to a prior year tax abatement approved and received in 2013; |
| | • | | A decrease of $112,000 at our Churchill, Pennsylvania property as a result of a prior year tax abatement approved and received in 2013. |
These decreases were partially offset by an increase in real estate tax of $238,000 at our Chicago, Illinois (River City) property.
Depreciation and amortization expense increased by $5,324,000 in 2013 primarily as a result of our new store properties. Interest expenses related to our operating properties increased by $1,856,000 primarily as a result of financing at our new store properties in Memphis, Tennessee; Greensboro, North Carolina and Cerritos, California which were all acquired in 2012 and at our new store properties in Philadelphia, Pennsylvania; Oklahoma City, Oklahoma; Houston, Texas; Stamford, Connecticut; Phoenix, Arizona and San Pedro, California which were acquired in 2013.
During 2012 we recognized impairment charges of $1,738,000 on our Atlanta, Georgia Kroger property and $824,000 on our Denton, Texas Kroger property as a result of changes to the respective holding periods for these properties.
Non-Consolidated Operating Properties: Equity Investments
Net operating income from equity investments was $13,950,000 for the year ended December 31, 2013 compared to net income of $2,618,000 for the year ended December 31, 2012. The increase was due primarily to:
| | • | | Operating income from our Vintage portfolio increased by $4,571,000 primarily due to a decrease in amortization of lease intangibles; |
| | • | | Operating income from our 701 Seventh Avenue investment, which closed October 16, 2012, was $3,424,000; |
| | • | | Operating loss from our Sealy Newmarket investment decreased by $2,811,000 as a result of having recognized losses in 2012, which brought our investment balance to zero at December 31, 2012 and the suspension of recognition of additional losses in 2013; |
| | • | | Operating income from our combined WRT-Elad investment which closed February 3, 2012 increased by $412,000; and |
| | • | | Operating income from our WRT-Fenway Wateridge investment, which closed December 21, 2012, was $796,000. |
During the fourth quarter of 2013, our equity investments in the Brooks Building, LLC (“223 West Jackson”), High Point Plaza, LLC (“High Point”), 1701 Woodfield, LLC (“1701 Woodfield”), and Enterprise Center, LLC (individually “Enterprise” and the aforementioned investments collectively the “Marc Investments”) suffered declines in occupancy, increasing competition for tenants, and increasing costs to operate the investments. Additionally, recent discussions related to marketing available space to potential tenants, along with lease renewals with existing tenants, indicated a capital infusion from us would be necessary to upgrade the investments to achieve rental rates in line with the suburban Chicago, Illinois office market. The factors above along with increasing capital demands and rising cost of capital caused us to reassess our business plan associated with the Marc Investments in the fourth quarter of 2013.
Subsequent to year end we entered into an agreement with Marc Realty, our joint venture partner in these equity investments, to sell our interests in High Point, 1701 Woodfield and Enterprise Center along with our controlling interest in the River City property, located in Chicago, Illinois, which is consolidated, for a gross sales price of $6,000,000. Additionally, we granted Marc Realty an option exercisable within two years to acquire our interest in 223 West Jackson for a purchase price ranging from $5,000,000 to $6,600,000. The purchase price for 223 West Jackson is dependent upon when the option is exercised and certain operating characteristics of the investment at the time of exercise.
49
Based on the factors noted above, we concluded that each of the Marc Investments were other-than-temporarily impaired in the aggregate by $7,687,000 at December 31, 2013 and a corresponding impairment charge has been included in equity in income (loss) of equity investments for the year then ended.
Loan Assets
The following table summarizes our results from our loan assets segment for the years ended December 31, 2013 and 2012 (in thousands):
| | | | | | | | |
| | | 2013 | | | 2012 | |
| | |
Interest | | $ | 14,334 | | | $ | 11,736 | |
Discount accretion | | | 4,121 | | | | 8,333 | |
Earnings of Concord Debt Holdings | | | 3,072 | | | | 422 | |
Earnings of CDH CDO | | | 1,033 | | | | 1,715 | |
Equity in earnings of ROIC-Riverside | | | — | | | | 706 | |
Realized gain on sale of loan securities carried at fair value | | | — | | | | 614 | |
Unrealized gain on loan securities carried at fair value | | | 215 | | | | 447 | |
Equity in loss of ROIC Lakeside Eagle | | | (25 | ) | | | (42 | ) |
Equity in earnings of RE CDO Management | | | 3,709 | | | | 67 | |
Equity in earnings (loss) of SoCal Office Loan Portfolio | | | (2 | ) | | | 9,706 | |
Equity in earnings (loss) of Concord Debt Holdings (1) | | | 64 | | | | (456 | ) |
Equity in earnings (loss) of CDH CDO (1) | | | 4,926 | | | | (997 | ) |
Equity in earnings of WRT-Stamford | | | 930 | | | | 769 | |
Equity in earnings of 10 Metrotech | | | 3,284 | | | | 335 | |
| | | | | | | | |
Loan assets operating income | | | 35,661 | | | | 33,355 | |
| | |
Interest expense | | | (1,898 | ) | | | (1,494 | ) |
| | |
Provision for loss on loans receivable | | | (348 | ) | | | — | |
General and administrative expense | | | (46 | ) | | | (121 | ) |
| | | | | | | | |
Loan assets net income | | $ | 33,369 | | | $ | 31,740 | |
| | | | | | | | |
| (1) | Represents the interest acquired from Lexington Realty Trust on May 1, 2012. |
Operating income from loan assets, which we define as all items of income and expense directly derived from or incurred by this segment before general and administrative and interest expense and other non-recurring non-operating items, increased by $2,306,000 as compared to the prior year period. The increase was due primarily to:
| | • | | a $8,411,000 increase in net earnings from our Concord equity investments resulting from the payoffs of two of the underlying loan assets during the third quarter of 2013; |
| | • | | a $3,642,000 increase in net earnings from our RE CDO Management equity investment which resulted from the sale of subordinated interests in collateralized debt obligation entities held by this venture; |
| | • | | a $2,949,000 increase in net earnings from our 10 Metrotech equity investment as a result of the underlying loan asset being paid off at par in July 2013; and |
| | • | | a $2,598,000 increase in interest income as a result of our 2012 and 2013 origination and acquisition activity, primarily our Queensridge Tower loan which generated $2,200,000 of interest income during the year ended December 31, 2013. |
Partially offset by:
| | • | | a $9,708,000 decrease in earnings from our SoCal Office Portfolio Loan investment as a result of the payoff of the underlying loan asset at par in September 2012; and |
| | • | | a $4,212,000 decrease in discount accretion due primarily to the payoff at par in May 2012 of our 160 Spear and Magazine loans which had been acquired at a discount. |
50
Interest expense represents interest on (i) the $15,150,000 senior participation held by Concord Real Estate CDO 2006-1, Ltd. (“CDO-1”), an unaffiliated third party, on our San Marbeya loan receivable, (ii) the $14,000,000 senior participation held by CDO-1 on our Hotel Wales loan and (iii) on the recourse secured financing on our Queensridge Towers loan receivable. Both of the senior participations are treated as secured financings for financial statement purposes.
REIT Securities
The following table summarizes our results from our REIT securities segment for the years ended December 31, 2013 and 2012 (in thousands):
| | | | | | | | |
| | | 2013 | | | 2012 | |
| | |
Dividends | | $ | — | | | $ | 1,054 | |
Gain on sale of securities carried at fair value | | | 742 | | | | 41 | |
Unrealized gain on securities carried at fair value | | | (142 | ) | | | 6,916 | |
| | | | | | | | |
REIT securities operating income | | $ | 600 | | | $ | 8,011 | |
| | | | | | | | |
Operating income from REIT securities, which we define as all items of income and expense directly derived from or incurred by this segment before interest expense, decreased by $7,411,000 as compared to the prior year period. The decrease was primarily due to the liquidation of all of our holdings of REIT securities in 2013.
Corporate
The following table summarizes our results from our non-segment specific income and expense items for the years ended December 31, 2013 and 2012 (in thousands):
| | | | | | | | |
| | | 2013 | | | 2012 | |
| | |
Interest and other income | | $ | 375 | | | $ | 699 | |
General and administrative | | | (4,317 | ) | | | (3,408 | ) |
Related party fees | | | (9,289 | ) | | | (8,953 | ) |
Transaction costs | | | (1,885 | ) | | | (421 | ) |
Interest expense | | | (7,310 | ) | | | (3,153 | ) |
Federal, state and local taxes | | | (430 | ) | | | (232 | ) |
| | | | | | | | |
Operating loss | | $ | (22,856 | ) | | $ | (15,468 | ) |
| | | | | | | | |
The decrease in corporate operations for the comparable periods was due primarily to the following:
| | • | | an increase in corporate interest expense of $4,178,000 resulting from the issuance of our Senior Notes in August 2012; |
| | • | | a $1,464,000 increase in transaction costs primarily associated with our acquisition of the four luxury residential properties; and |
| | • | | a $909,000 increase in general and administrative expense due to $899,000 in compensation expense associated with the issuance of Restricted Shares in 2013. |
51
Comparison 2012 to 2011
Operating Properties
The following table summarizes our results from continuing operations for our operating properties segment for the years ended December 31, 2012 and 2011. Certain balances have been reclassified as a result of discontinued operations (in thousands):
| | | | | | | | |
| | | 2012 | | | 2011 | |
| | |
Rents and reimbursements | | $ | 44,213 | | | $ | 35,848 | |
Operating expenses | | | (13,614 | ) | | | (12,437 | ) |
Real estate taxes | | | (3,672 | ) | | | (3,541 | ) |
Equity in income (loss) of Marc Realty investments | | | 33 | | | | (775 | ) |
Equity in income (loss) of Sealy Northwest Atlanta | | | (388 | ) | | | 4,308 | |
Equity in loss of Sealy Airpark Nashville | | | — | | | | (1,034 | ) |
Equity in loss of Sealy Newmarket | | | (2,811 | ) | | | (2,936 | ) |
Equity in income of Vintage Housing | | | 4,603 | | | | 113 | |
Equity in income of WRT-Elad | | | 903 | | | | — | |
Equity in income of Mentor | | | 46 | | | | — | |
Equity in income of F-II Co-invest | | | 232 | | | | — | |
| | | | | | | | |
Operating income | | | 29,545 | | | | 19,546 | |
| | |
Depreciation and amortization expense | | | (15,119 | ) | | | (10,692 | ) |
Interest expense | | | (12,348 | ) | | | (11,057 | ) |
Impairment loss on investments in real estate | | | (1,738 | ) | | | (4,600 | ) |
Impairment loss on Marc Realty equity investment | | | — | | | | (15,764 | ) |
Gain on consolidation of property | | | — | | | | 818 | |
Settlement income | | | — | | | | 5,868 | |
Impairment loss on Sealy equity investments | | | — | | | | (5,294 | ) |
Gain (loss) on extinguishment of debt | | | (121 | ) | | | 6,439 | |
| | | | | | | | |
Operating properties net income (loss) | | $ | 219 | | | $ | (14,736 | ) |
| | | | | | | | |
Operating income from our operating properties, which we define for our consolidated operating properties as all items of income and expense directly derived from or incurred by this segment before depreciation, amortization and interest expense and other non-recurring non-operating items and our share of income or loss from equity investments, increased by $9,999,000 compared to the prior year period.
The following table breaks out our operating results from same store properties (properties held throughout both the current and prior year reporting periods) and new store properties (in thousands):
Consolidated Operating Properties
| | | | | | | | |
| | | For the Year Ended December 31, | |
| | | 2012 | | | 2011 | |
Rents and reimbursements | | | | | | | | |
Same store properties | | $ | 34,586 | | | $ | 34,927 | |
New store properties | | | 9,627 | | | | 921 | |
| | | | | | | | |
| | | 44,213 | | | | 35,848 | |
| | | | | | | | |
| | |
Operating expenses | | | | | | | | |
Same store properties | | | 8,179 | | | | 12,111 | |
New store properties | | | 5,435 | | | | 326 | |
| | | | | | | | |
| | | 13,614 | | | | 12,437 | |
| | | | | | | | |
| | |
Real estate taxes | | | | | | | | |
Same store properties | | | 2,544 | | | | 3,474 | |
New store properties | | | 1,128 | | | | 67 | |
| | | | | | | | |
| | | 3,672 | | | | 3,541 | |
| | | | | | | | |
| | |
Consolidated operating properties operating income | | | | | | | | |
Same store properties | | | 23,863 | | | | 19,342 | |
New store properties | | | 3,064 | | | | 528 | |
| | | | | | | | |
| | $ | 26,927 | | | $ | 19,870 | |
| | | | | | | | |
52
The increase in operating income for our same store properties was primarily the result of a decrease in operating expenses of $3,932,000 and a decrease in real estate taxes of $930,000. The same store results were supplemented by positive results from our new store properties.
| | • | | Rental revenues increased by $8,365,000 due to an increase in new store revenues of $8,706,000, while there was a slight decrease in same store revenues of $341,000. The decrease in same store revenue was the result of: |
| | • | | The sale of a portion of our Churchill, Pennsylvania property which occurred May 14, 2012; |
| | • | | An amendment to the lease terms for Spectra Energy at 5400 Westheimer located in Houston, Texas. The modified lease reduces the average annual contractual obligation but extends the term of the lease through April 30, 2026; |
| | • | | A decline in parking revenue at our One East Erie property located in Chicago, Illinois resulting from spaces taken out of service due to a restoration project. |
Which were partially offset by increases from:
| | • | | Lease termination income of $785,000 from a 55,000 square foot tenant at our Chicago, Illinois property known as River City, which tenant terminated the lease effective August 2012; |
| | • | | Increased average occupancy at our property known as Crossroads II located in Englewood, Colorado from 51% to 82%; |
| | • | | Increased average occupancy at our property known as 550/650 Corporetum located in Lisle, Illinois from 58% to 75%. |
| | • | | Operating expenses increased by $1,177,000 due to expenses at our new store properties of $5,435,000. Same store operating expenses decreased by $3,932,000 due primarily to a decrease in expenses of $3,240,000 at our Churchill, Pennsylvania property, which had incurred $1,423,000 of costs associated with pursuing a settlement in 2011, and $599,000 at our Chicago, Illinois (River City) property; |
| | • | | Real estate tax expense increased by $131,000 as a result of our new store properties. Real estate tax of $1,128,000 at our new store properties was offset by a decrease of $930,000 at our same store properties. The reduction at our same store properties was primarily due to lower taxes at our Churchill, Pennsylvania and Chicago, Illinois (River City) properties. |
Depreciation and amortization expense increased by $4,427,000 in 2012 primarily as a result of our new store properties. Interest expenses related to our operating properties increased by $1,291,000 primarily as a result of interest expense of $2,240,000 at our new store properties, in particular $1,594,000 at our 450 W 14th Street new store property located in New York, New York. This increase was partially offset by refinancing our Lisle, Illinois properties which resulted in decreased interest expense of $422,000 as well through amortization of our other same store properties.
During 2012 we recognized impairment charges of $1,738,000 on our Atlanta, Georgia retail property as a result of a change to the holding period for this property. During 2011 we recognized impairment charges of $4,600,000 on our Churchill, Pennsylvania property. In addition, we recognized income of $5,868,000 in connection with the settlement of the litigation at our Churchill, Pennsylvania property. We also recognized $6,439,000 of gain on extinguishment of debt in connection with the early satisfaction of the debt on our Lisle, Illinois property. As a result of a change in control at our 450 W 14th Street property effective November 1, 2011, we began consolidating this property in 2011, and we recognized a gain on consolidation of $818,000 in 2011.
Non-Consolidated Operating Properties: Equity Investments
Net operating income from equity investments was $2,968,000 for the year ended December 31, 2012 compared to a net loss of $324,000 for the year ended December 31, 2011. The increase was due primarily to:
| | • | | Operating income from our Vintage portfolio increased by $4,490,000 primarily due to recognizing a full year’s income in 2012, a decrease in amortization expense and the addition of two properties. Our initial investment in the Vintage portfolio closed on June 24, 2011. |
| | • | | Operating loss from our Sealy Airpark Nashville investment decreased by $1,034,000 as a result of having written this investment down to $0 as of December 31, 2011. |
53
| | • | | Operating income from our combined WRT-Elad investment which closed February 3, 2012 was $903,000 for the year ended December 31, 2012. |
| | • | | Operating loss from our Marc Realty investments decreased by $808,000 primarily as a result of the sale of five investments during 2012. We recognized a gain of $165,000 on these sales. |
Partially offset by:
| | • | | Operating income from our Sealy Northwest Atlanta investment decreased by $4,696,000 due primarily to the discounted payoff of the first mortgage loan in June 2011. The discounted payoff resulted in an allocation of cancellation of debt income to us of approximately $5,502,000. |
We recognized other-than-temporary impairment charges of $15,764,000 on our Marc Realty equity investments in the fourth quarter of 2011 as a result of continued decline in operations particularly in the suburban Chicago, Illinois assets, together with increased capital needs both of which have resulted in an effort by us to divest of certain of these investments. We recognized $5,294,000 of other-than-temporary impairment charges on our Sealy investments due primarily to overleverage concerns as well as continued market declines on these properties.
Loan Assets
The following table summarizes our results from our loan assets segment for the years ended December 31, 2012 and 2011 (in thousands):
| | | | | | | | |
| | | 2012 | | | 2011 | |
| | |
Interest | | $ | 11,736 | | | $ | 11,073 | |
Discount accretion | | | 8,333 | | | | 13,401 | |
Equity in earnings of preferred equity investment of Marc Realty | | | — | | | | 338 | |
Equity in earnings of Lex-Win Concord | | | — | | | | 258 | |
Equity in earnings of ROIC Riverside | | | 706 | | | | 936 | |
Equity in earnings of Concord Debt Holdings | | | 422 | | | | 3,216 | |
Equity in earnings of CDH CDO | | | 1,715 | | | | 480 | |
Equity in earnings (loss) of ROIC Lakeside Eagle | | | (42 | ) | | | 664 | |
Equity in earnings of 46th Street Gotham | | | — | | | | 621 | |
Equity in earnings of Sofitel | | | — | | | | 2,177 | |
Equity in earnings of RE CDO Management | | | 67 | | | | 46 | |
Equity in earnings of Socal Office Loan Portfolio | | | 9,706 | | | | 272 | |
Equity in loss of Concord Debt Holdings (1) | | | (456 | ) | | | — | |
Equity in loss of CDH CDO (1) | | | (997 | ) | | | — | |
Equity in earnings of WRT-Stamford | | | 769 | | | | — | |
Equity in earnings of 10 Metrotech | | | 335 | | | | — | |
Realized gain on sale of securities carried at fair value | | | 614 | | | | — | |
Unrealized gain on loan securities carried at fair value | | | 447 | | | | 2,738 | |
| | | | | | | | |
Loan assets operating income | | | 33,355 | | | | 36,220 | |
| | |
General and administrative expense | | | (121 | ) | | | (75 | ) |
Interest expense | | | (1,494 | ) | | | (850 | ) |
| | | | | | | | |
Loan assets net income | | $ | 31,740 | | | $ | 35,295 | |
| | | | | | | | |
| (1) | Represents the interest acquired from Lexington Realty Trust on May 1, 2012. |
Operating income from loan assets, which we define as all items of income and expense directly derived from or incurred by this business segment before general and administrative and interest expense, decreased by $2,865,000 as compared to the prior year period. The decrease was due primarily to:
| | • | | a $5,068,000 decrease in discount accretion due primarily to the repayment of our Metropolitan Tower and Beverly Hilton loans in 2011 which was partially offset by an increase related to our 160 Spear and Magazine loans in May 2012; |
54
| | • | | a $3,270,000 decrease in earnings from our Concord investment primarily due to a loan loss reserve on Concord’s Thanksgiving Tower loan in 2012; and |
| | • | | a $2,291,000 decrease in unrealized gain on loan securities carried at fair value. |
Partially offset by:
| | • | | a $6,825,000 increase in net earnings from our other equity investment loan assets primarily due to earnings of $9,706,000 on our SoCal office portfolio loan investment which resulted from the payoff of the underlying loan asset at par. |
Interest expense represents interest on (i) the $15,150,000 senior participation held by CDO-1, an unaffiliated third party, on our San Marbeya loan receivable, (ii) the $14,000,000 senior participation held by CDO-1 on our Hotel Wales loan and (iii) on the $23,770,000 recourse secured financing on our Queensridge Towers loan receivable. Both of the senior participations are treated as secured financings for financial statement purposes.
REIT Securities
The following table summarizes our results from our REIT securities segment for the years ended December 31, 2012 and 2011 (in thousands):
| | | | | | | | |
| | | 2012 | | | 2011 | |
| | |
Dividends | | $ | 1,054 | | | $ | 984 | |
Gain on sale of securities carried at fair value | | | 41 | �� | | | 123 | |
Unrealized gain on securities carried at fair value | | | 6,916 | | | | 2,788 | |
| | | | | | | | |
REIT securities net income | | $ | 8,011 | | | $ | 3,895 | |
| | | | | | | | |
Operating income from REIT securities, which we define as all items of income and expense directly derived from or incurred by this segment before interest expense, increased by $4,116,000 as compared to the prior year period. The increase was primarily due to a $4,128,000 increase in unrealized gain on securities carried at fair value primarily as a result of a change in the value of our shares of Cedar acquired subsequent to September 30, 2011.
Corporate
The following table summarizes our results from our non-segment specific income and expense items for the years ended December 31, 2012 and 2011 (in thousands):
| | | | | | | | |
| | | 2012 | | | 2011 | |
| | |
Interest and other income | | $ | 699 | | | $ | 1,175 | |
General and administrative | | | (3,408 | ) | | | (3,452 | ) |
Related party fees | | | (8,953 | ) | | | (7,690 | ) |
Transaction costs | | | (421 | ) | | | (519 | ) |
Interest expense | | | (3,153 | ) | | | (2,094 | ) |
Loss on redemption of Series B-1 Preferred Shares | | | — | | | | (100 | ) |
State and local taxes | | | (232 | ) | | | (376 | ) |
| | | | | | | | |
Operating loss | | $ | (15,468 | ) | | $ | (13,056 | ) |
| | | | | | | | |
The increase in operating loss for the comparable periods was due primarily to a $1,220,000 increase in general and administrative expense due primarily to an increase in the base management fee paid to our Advisor of $1,263,000 and an increase of $361,000 in accounting fees which was partially offset by a $364,000 decrease in legal fees, and an increase in corporate interest expense of $1,059,000 resulting from the issuance of our Senior Notes.
55
Discontinued Operations
Our office properties in Deer Valley, Arizona; Lisle, Illinois; Indianapolis, Indiana; and Andover, Massachusetts, our retail properties in Lafayette, Louisiana; St. Louis, Missouri; Knoxville, Tennessee, Memphis, Tennessee; Denton, Texas; and Seabrook, Texas and our residential property in Meriden, Connecticut are classified as discontinued operations for all periods presented.
The Lafayette, Louisiana property was classified as discontinued operations as of September 30, 2010. The ownership of the Lafayette, Louisiana property to reverted back to the land owner as of November 1, 2010. Final settlement with the tenant occurred in 2011.
The Knoxville, Tennessee location has also been classified as discontinued operations since September 30, 2010. In August 2011, we sold our Knoxville, Tennessee property for net proceeds of $2,151,000.
In January 2011 the St. Louis, Missouri property was reclassified into discontinued operations. In February 2011 we entered into an agreement to sell this property and in December 2011 the property was sold for net proceeds of $1,485,000.
In September 2012 we classified our Indianapolis, Indiana property as discontinued operations upon entering into a purchase contract for, and the subsequent sale of this property. The property was sold on September 28, 2012 for $6,300,000 and we received proceeds of $1,071,000 after satisfaction of the debt.
We also classified our Memphis, Tennessee property as discontinued operations in the third quarter of 2012. On September 28, 2012, the Kroger Co. terminated its lease on this property and paid a cancellation fee of $600,000. Concurrently, we sold the property to an independent third party for $600,000. We recorded a $698,000 impairment charge in connection with the sale of the property.
In March 2013 the Andover, Massachusetts property was classified as discontinued operations and sold. The property was sold for net proceeds of $11,538,000 and we recorded a $2,775,000 gain on the sale of the property.
In June 2013 the Deer Valley, Arizona and Denton, Texas properties were classified as discontinued operations. The Deer Valley, Arizona property was sold in June 2013 for net proceeds of $19,585,000 and we recorded a $6,745,000 gain on the sale of the property. We recorded an $824,000 impairment charge on the Denton, Texas property in 2012 as a result of a change to the anticipated holding period of this property. We recorded an additional $154,000 impairment charge for this property in June 2013 as a result of the purchase contract. The property was sold in July 2013 and we received net proceeds of $1,708,000.
In August 2013, the Seabrook, Texas property was classified as discontinued operations. The property was sold in August 2013 for net proceeds of $3,202,000 and we recorded a $1,428,000 gain on the sale of the property.
In September 2013, our 701 Arboretum property located in Lisle, Illinois was classified as held for sale. We had previously recorded a $3,000,000 impairment charge on this property in 2011 as a result of continued declines in occupancy. We recorded an additional $2,750,000 impairment charge in 2013 as a result of the purchase contract. The property was sold in December 2013 for net proceeds of $2,351,000 and we recorded a $58,000 gain on the sale.
The Meriden, Connecticut property was classified as held for sale as of December 31, 2013. A purchase and sale contract was signed for a gross sales price of $27,500,000 and we received a non-refundable deposit of $500,000. The sale of the property was consummated on February 26, 2014. After satisfaction of the debt, we received net proceeds of $5,106,000 on the sale of the property.
Funds From Operations
We have adopted the revised definition of Funds from Operations (“FFO”), adopted by the Board of Governors of the National Association of Real Estate Investment Trust (“NAREIT”). Management considers FFO to be an appropriate measure of performance of a REIT. We calculate FFO by adjusting net income (loss) (computed in accordance with GAAP, including non-recurring items), for gains (or losses) from sales of properties, real estate related depreciation and amortization, depreciation and amortization related to unconsolidated partnerships and ventures, and impairments. Management believes that in order to facilitate a clear understanding of our historical operating results, FFO should be considered in conjunction
56
with net income as presented in the consolidated financial statements included elsewhere herein. Management considers FFO to be a useful measurement for reviewing our comparative operating and financial performance because, by excluding gains and losses related to sales of previously depreciated operating real estate assets and excluding real estate asset depreciation and amortization (which can vary among owners of identical assets in similar condition based on historical cost accounting and useful life estimates), FFO can help one compare the operating performance of a company’s real estate between periods or as compared to different companies.
Calculation of FFO may not be directly comparable to FFO reported by other REITs or similar real estate companies that have not adopted the term in accordance with the current NAREIT definition or that interpret the current NAREIT definition differently. FFO is not a GAAP financial measure and should not be considered as an alternative to net income (loss), the most directly comparable financial measure of our performance calculated and presented in accordance with GAAP, as an indication of our performance. FFO does not represent cash generated from operating activities determined in accordance with GAAP and is not a measure of liquidity or an indicator of our ability to pay dividends. We believe that to further understand our performance, FFO should be compared with our reported net income and considered in addition to cash flows in accordance with GAAP, as presented in our consolidated financial statements.
Based on the October 31, 2011 and January 6, 2012 updated guidance on reporting FFO, we have excluded impairment losses on depreciable real estate as well as other-than-temporary impairment on real estate equity method joint ventures in the calculations of FFO and have restated prior period calculations to be consistent with this presentation. The other-than-temporary impairments have been excluded as they relate to decreases in the fair value of depreciable real estate held by the investee.
57
The following presents a reconciliation of net income to funds from operations for the years ended December 31, 2013, 2012 and 2011 (in thousands, except per share amounts):
| | | | | | | | | | | | |
| | | 2013 | | | 2012 | | | 2011 | |
Basic | | | | | | | | | | | | |
Net income attributable to Winthrop Realty Trust | | $ | 28,778 | | | $ | 24,631 | | | $ | 10,933 | |
Real estate depreciation | | | 13,671 | | | | 11,281 | | | | 8,646 | |
Amortization of lease intangibles | | | 8,235 | | | | 6,785 | | | | 4,895 | |
Gain on sale of real estate | | | (11,005 | ) | | | (945 | ) | | | (392 | ) |
(Gain) loss on sale of equity investments | | | 110 | | | | (199 | ) | | | (207 | ) |
Gain on property consolidation | | | — | | | | — | | | | (818 | ) |
Trust’s share of real estate depreciation and amortization of unconsolidated interests | | | 10,314 | | | | 13,752 | | | | 11,466 | |
Trust’s share of loss on sale of real estate of unconsolidated interests | | | 722 | | | | — | | | | — | |
Impairment loss on investments in real estate | | | 2,904 | | | | 3,260 | | | | 7,600 | |
Impairment loss on equity investments | | | 7,687 | | | | — | | | | 21,058 | |
Less: Non-controlling interest share of real estate depreciation and amortization | | | (4,146 | ) | | | (2,831 | ) | | | (3,483 | ) |
| | | | | | | | | | | | |
Funds from operations | | | 57,270 | | | | 55,734 | | | | 59,698 | |
Preferred dividend on Series C Preferred Shares | | | — | | | | — | | | | (585 | ) |
Preferred dividend on Series D Preferred Shares | | | (11,146 | ) | | | (9,285 | ) | | | (339 | ) |
Amount allocated to Restricted Shares | | | (307 | ) | | | — | | | | — | |
Allocation of earnings to Series B-1 Preferred Shares | | | — | | | | — | | | | (325 | ) |
Allocation of earnings to Series C Preferred Shares | | | — | | | | — | | | | (213 | ) |
| | | | | | | | | | | | |
FFO applicable to Common Shares - Basic | | $ | 45,817 | | | $ | 46,449 | | | $ | 58,236 | |
| | | | | | | | | | | | |
Weighted-average Common Shares | | | 33,743 | | | | 33,062 | | | | 31,428 | |
| | | | | | | | | | | | |
FFO Per Common Share - Basic | | $ | 1.36 | | | $ | 1.40 | | | $ | 1.85 | |
| | | | | | | | | | | | |
| | | |
Diluted | | | | | | | | | | | | |
Funds from operations | | $ | 57,270 | | | $ | 55,734 | | | $ | 59,698 | |
Preferred dividend on Series C Preferred Shares | | | — | | | | — | | | | (585 | ) |
Preferred dividend on Series D Preferred Shares | | | (11,146 | ) | | | (9,285 | ) | | | (339 | ) |
Amount allocated to Restricted C Shares | | | (307 | ) | | | — | | | | — | |
Allocation of earnings to Series B-1 Preferred Shares | | | — | | | | — | | | | (325 | ) |
Allocation of earnings to Series C Preferred Shares | | | — | | | | — | | | | (213 | ) |
| | | | | | | | | | | | |
FFO applicable to Common Shares | | $ | 45,817 | | | $ | 46,449 | | | $ | 58,236 | |
| | | | | | | | | | | | |
| | | |
Weighted-average Common Shares | | | 33,743 | | | | 33,062 | | | | 31,428 | |
Stock options | | | — | | | | — | | | | — | |
Restricted Shares | | | 31 | | | | — | | | | — | |
| | | | | | | | | | | | |
Diluted weighted-average Common Shares | | | 33,774 | | | | 33,062 | | | | 31,428 | |
| | | | | | | | | | | | |
FFO Per Common Share - Diluted | | $ | 1.36 | | | $ | 1.40 | | | $ | 1.85 | |
| | | | | | | | | | | | |
Off-Balance Sheet Investments
We have nine off-balance sheet investments in operating properties totaling $133,837,000 and six off-balance sheet investments in loan assets totaling $15,248,000 at December 31, 2013. Our exposure to loss is limited to our investment balance. See Item 8 – Financial Statements, Note 8 for additional information on these investments.
Critical Accounting Policies and Estimates
Below is a discussion of the accounting policies that management believes are critical to our operations. We consider these policies critical because they involve difficult management judgments and assumptions, require estimates about matters that are inherently uncertain and because they are important for understanding and evaluating our reported financial results. These judgments affect the reported amounts of assets and liabilities and our disclosure of contingent assets and liabilities at the dates of the financial statements and the reported amounts of revenue and expenses during the reporting periods. With different estimates or assumptions, materially different amounts could be reported in our financial statements. Additionally, other companies may utilize different estimates that may impact the comparability of our results of operations to those of companies in similar businesses. Our most sensitive estimates involve the allocation of the purchase price of acquired properties and evaluating our real estate-related investments for impairment.
58
Investments in Real Estate
Upon the acquisition of real estate, we assess the fair value of acquired assets (including land, buildings and improvements, and identified intangibles such as above and below market leases and acquired in-place leases and tenant relationships) and acquired liabilities and we allocate purchase price based on these assessments. We assess fair value based on estimated cash flow projections and utilize appropriate discount and capitalization rates and available market information. Estimates of future cash flows are based on a number of factors including the historical operating results, known trends, and market/economic conditions that may affect the property.
Impairment
Operating properties –We evaluate the need for an impairment loss on real estate assets when indicators of impairment are present and the projected undiscounted cash flows from an asset are not sufficient to recover an asset group’s carrying amount. The impairment loss is measured by comparing the fair value of the asset group to its carrying amount. The projection of cash flows used in the impairment evaluation involves significant judgment by management.
Loan assets –Loan assets are periodically evaluated for possible impairment in order to determine whether it is necessary to establish a loan loss allowance. In some instances if a borrower is experiencing difficulties making loan payments we may assist the borrower to address the problems, which could include extending the loan term, making additional advances, or reducing required payments. A loan asset is considered to be impaired when, based on current information and events, it is probable that we will be unable to collect all amounts due according to the existing contractual terms of the loan. Impairment is then measured based on the present value of expected future cash flows or, if the loan is collateral dependent, the fair value of the collateral. When a loan is considered to be impaired, we will establish an allowance for loan losses and record a corresponding charge to earnings. Significant judgments are required in determining impairment. We do not record interest income on impaired loans. Any cash receipts on impaired loans are recorded as a recovery reducing the allowance for loan losses.
Preferred equity investments –We have certain investments which are classified as preferred equity investments. Determining whether a preferred equity investment is other-than-temporarily impaired requires significant judgment. This evaluation includes consideration of the length of time and extent to which the fair value of an investment has been less than its cost basis, our intent and ability to hold the investment until a forecasted recovery in value and the collateral underlying the investment.
Equity investments – Equity investments are reviewed for impairment periodically. For equity investments in which the carrying value exceeds the fair value, we evaluate if these are other-than-temporarily impaired. See Item 8 – Note 3 for further discussion on significant estimates associated with our equity investments.
Contingent liabilities – Estimates are used when accounting for the allowance for contingent liabilities and other commitments. Estimating probable losses requires analysis of multiple forecasts that often depend on judgments about potential and likelihood of actions by third parties such as regulators. All of the estimates and evaluations are susceptible to change and actual results could differ from the estimates and evaluations.
Variable Interest Entities
Consolidated Variable Interest Entities
Consolidated variable interest entities are those where we are the primary beneficiary of a variable interest entity. The primary beneficiary is the party that has a controlling financial interest in the VIE, which is defined by the entity having both of the following characteristics: 1) the power to direct the activities that, when taken together, most significantly impact the VIE’s performance, and 2) the obligation to absorb losses and right to receive the returns from the VIE that would be significant to the VIE. We have two consolidated variable interest entities at December 31, 2013.
Variable Interest Entities Not Consolidated
Equity Method and Preferred Equity Investments – We have reviewed our various equity method and preferred equity investments and identified nine investments for which we hold a variable interest in a VIE. Of these nine interests, there are five investments for which the underlying entities do not have sufficient equity at risk to permit them to finance their activities without additional subordinated financial support. There are four additional entities for which the VIE assessment was
59
primarily based on the fact that the voting rights of the entity holders are not proportional to their obligations to absorb expected losses and rights to receive residual returns of the legal entities. These unconsolidated joint ventures are those where we are not the primary beneficiary of a VIE.
Loans Receivable and Loan Securities – We have reviewed our loans receivable and loan securities and certain of these assets have been identified as variable interests in a VIE because the equity investment at risk at the borrowing entity level is not considered sufficient for the entity to finance its activities without additional subordinated financial support. There is one additional loan receivable for which the VIE assessment was made primarily based on the fact that the equity holders of the underlying investment lack the right to receive returns due to the lender’s participation interest.
Certain loans receivable and loan securities which have been determined to be VIEs are performing assets, meeting their debt service requirements, and the borrowers hold title to the collateral. In these cases the borrower holds legal title to the real estate collateral and has the power to direct the activities that most significantly impact the economic performance of the VIE, including management and leasing activities. In the event of default under these loans we only have protective rights and have the risk to absorb losses only to the extent of our loan investment. The borrower has been determined to be the primary beneficiary for these performing assets.
We have determined that we do not currently have the power to direct the activities of the ventures collateralizing any of its loans receivable and loan securities. For this reason, we believe that we do not control, nor are we the primary beneficiary of these ventures. Accordingly, we account for these investments under the guidance for loans receivable and real estate debt investments.
Recently Issued Accounting Standards
See “Item 8. Financial Statements and Supplementary Data - Note 2.”
60
ITEM 7A – QUANTITATIVE AND QUALITATIVE DISCLOSURES ABOUT MARKET RISK
Interest Rate Risk
We have exposure to fluctuations in market interest rates. Market interest rates are highly sensitive to many factors beyond our control. Various financial vehicles exist which would allow management to mitigate the potential negative effects of interest rate fluctuations on our cash flow and earnings.
Our liabilities include both fixed and variable rate debt. As discussed in Item 7 – Management’s Discussion and Analysis of Financial Conditions and Results of Operations, we seek to limit our risk to interest rate fluctuations through match financing on our loan assets as well as through hedging transactions.
The table below presents information about the Trust’s derivative financial instruments at December 31, 2013 (in thousands):
| | | | | | | | | | | | | | | | | | |
Type | | Maturity | | Strike Rate | | | Notional
Amount of
Hedge | | | Cost of Hedge | | | Estimated Fair
Value of Hedge | |
| | | | | |
Cap | | May-14 | | | 1.75 | % | | $ | 51,982 | | | $ | 434 | | | $ | — | |
Cap | | Aug-14 | | | 0.50 | % | | | 13,408 | | | | 22 | | | | (4 | ) |
Cap | | Oct-14 | | | 1.00 | % | | | 5,753 | | | | 174 | | | | 1 | |
Swap | | May-16 | | | 0.50 | % | | | 42,440 | | | | — | | | | (33 | ) |
Swap | | Oct-16 | | | 0.69 | % | | | 150,000 | | | | — | | | | (86 | ) |
Cap | | Nov-17 | | | 4.00 | % | | | 50,000 | | | | 165 | | | | 186 | |
Cap | | Nov-18 | | | 5.00 | % | | | 50,000 | | | | 220 | | | | 248 | |
The fair value of our mortgage loans payable and secured financings, based on discounted cash flows at the current rate at which similar loans would be made to borrowers with similar credit ratings for the remaining term of such debt, was $474,112,000 and $324,177,000 at December 31, 2013 and December 31, 2012, respectively. The fair value of our Senior Notes, based on quoted market price, was $86,940,000 and $89,183,000 at December 31, 2013 and 2012, respectively.
The following table shows what the annual effect a change in the LIBOR rate would have on interest expense based upon our variable rate debt at December 31, 2013 taking into consideration the effect of our derivative financial investments (in thousands):
| | | | | | | | | | | | | | | | |
| | | Change in LIBOR (2) | |
| | | –0.17% | | | 1% | | | 2% | | | 3% | |
| | | | |
Change in consolidated interest expense | | $ | (10 | ) | | $ | 135 | | | $ | 437 | | | $ | 461 | |
| | | | |
Pro-rata share of change in interest expense of debt on non-consolidated entities (1) | | | (19 | ) | | | 102 | | | | 159 | | | | 204 | |
| | | | | | | | | | | | | | | | |
| | | | |
(Increase) decrease in net income | | $ | (29 | ) | | $ | 237 | | | $ | 596 | | | $ | 665 | |
| | | | | | | | | | | | | | | | |
| (1) | Represents our pro-rata share of a change in interest expense in our Marc Realty and Sealy equity investments. The amount does not reflect our equity investment in Concord which has been written down to zero. |
| (2) | The one month LIBOR rate at December 31, 2013 was 0.1677%. |
61
The Trust’s equity investment in Vintage, which is reported on a 30 day lag, holds floating rate debt of approximately $170,541,000 and bears interest at a rate indexed to the Securities Industry and Financial Markets Association Municipal Swap Index (SIFMA). The following table shows the annual effect a change in the SIFMA rate would have on the Trust based on property level interest expense based upon the unhedged balances in variable rate debt at November 30, 2013 (in thousands):
| | | | | | | | | | | | | | | | |
| | | Change in SIFMA(1) | |
| | | 0.05% | | | 1% | | | 2% | | | 3% | |
| | | | |
Change in consolidated interest expense | | $ | — | | | $ | — | | | $ | — | | | $ | — | |
| | | | |
Pro-rata share of change in interest expense on Vintage debt | | | (46 | ) | | | 922 | | | | 1,844 | | | | 2,766 | |
| | | | | | | | | | | | | | | | |
| | | | |
(Increase) decrease in net income | | $ | (46 | ) | | $ | 922 | | | $ | 1,844 | | | $ | 2,766 | |
| | | | | | | | | | | | | | | | |
| (1) | The one-month SIFMA rate at November 30, 2013 was 0.05%. |
We may utilize various financial instruments to mitigate the potential negative impact of interest rate fluctuations on our cash flows and earnings, including hedging strategies, depending on our analysis of the interest rate environment and the costs and risks of such strategies.
The following table shows what the annual effect a change in the LIBOR rate would have on interest income based upon our variable rate loan assets at December 31, 2013 (in thousands):
| | | | | | | | | | | | | | | | |
| | | Change in LIBOR (1) | |
| | | –0.17% | | | 1% | | | 2% | | | 3% | |
| | | | |
Change in consolidated interest income | | $ | (3 | ) | | $ | 38 | | | $ | 85 | | | $ | 165 | |
| | | | |
Pro-rata share of change in interest income of loan assets in non-consolidated entities | | | (17 | ) | | | 100 | | | | 200 | | | | 300 | |
| | | | | | | | | | | | | | | | |
| | | | |
Increase (decrease) in net income | | $ | (20 | ) | | $ | 138 | | | $ | 285 | | | $ | 465 | |
| | | | | | | | | | | | | | | | |
| (1) | The one month LIBOR rate at December 31, 2013 was 0.1677%. |
Market Value Risk
Our hedge transactions using derivative instruments also involve certain additional risks such as counterparty credit risk, the enforceability of hedging contracts and the risk that unanticipated and significant changes in interest rates will cause a significant loss of basis in the contract. We believe that there is a low likelihood that these counterparties will fail to meet their obligations. There can be no assurance that we will adequately protect against the foregoing risks.
62
ITEM 8 – FINANCIAL STATEMENTS AND SUPPLEMENTARY DATA
63
Report of Independent Registered Public Accounting Firm
To the Board of Trustees and Shareholders of Winthrop Realty Trust:
In our opinion, the consolidated financial statements listed in the accompanying index present fairly, in all material respects, the financial position of Winthrop Realty Trust and its subsidiaries at December 31, 2013 and December 31, 2012, and the results of their operations and their cash flows for each of the three years in the period ended December 31, 2013 in conformity with accounting principles generally accepted in the United State of America. In addition, in our opinion, the financial statement schedules listed in the index appearing under Item 15(a)(2) present fairly, in all material respects, the information set forth therein when read in conjunction with the related consolidated financial statements. Also in our opinion, the Company maintained, in all material respects, effective internal control over financial reporting as of December 31, 2013, based on criteria established inInternal Control - Integrated Framework (1992) issued by the Committee of Sponsoring Organizations of the Treadway Commission (COSO). The Company’s management is responsible for these financial statements and financial statement schedules, for maintaining effective internal control over financial reporting and for its assessment of the effectiveness of internal control over financial reporting, included in Management’s Report on Internal Control over Financial Reporting appearing under Item 9A. Our responsibility is to express opinions on these financial statements, on the financial statement schedules, and on the Company’s internal control over financial reporting based on our integrated audits. We conducted our audits in accordance with the standards of the Public Company Accounting Oversight Board (United States). Those standards require that we plan and perform the audits to obtain reasonable assurance about whether the financial statements are free of material misstatement and whether effective internal control over financial reporting was maintained in all material respects. Our audits of the financial statements included examining, on a test basis, evidence supporting the amounts and disclosures in the financial statements, assessing the accounting principles used and significant estimates made by management, and evaluating the overall financial statement presentation. Our audit of internal control over financial reporting included obtaining an understanding of internal control over financial reporting, assessing the risk that a material weakness exists, and testing and evaluating the design and operating effectiveness of internal control based on the assessed risk. Our audits also included performing such other procedures as we considered necessary in the circumstances. We believe that our audits provide a reasonable basis for our opinions.
A company’s internal control over financial reporting is a process designed to provide reasonable assurance regarding the reliability of financial reporting and the preparation of financial statements for external purposes in accordance with generally accepted accounting principles. A company’s internal control over financial reporting includes those policies and procedures that (i) pertain to the maintenance of records that, in reasonable detail, accurately and fairly reflect the transactions and dispositions of the assets of the company; (ii) provide reasonable assurance that transactions are recorded as necessary to permit preparation of financial statements in accordance with generally accepted accounting principles, and that receipts and expenditures of the company are being made only in accordance with authorizations of management and directors of the company; and (iii) provide reasonable assurance regarding prevention or timely detection of unauthorized acquisition, use, or disposition of the company’s assets that could have a material effect on the financial statements.
Because of its inherent limitations, internal control over financial reporting may not prevent or detect misstatements. Also, projections of any evaluation of effectiveness to future periods are subject to the risk that controls may become inadequate because of changes in conditions, or that the degree of compliance with the policies or procedures may deteriorate.
/s/ PricewaterhouseCoopers LLP
Boston, MA
March 17, 2014
64
WINTHROP REALTY TRUST
CONSOLIDATED BALANCE SHEETS
(in thousands, except share and per share data)
| | | | | | | | |
| | | December 31, | |
| | | 2013 | | | 2012 | |
ASSETS | | | | | | | | |
Investments in real estate, at cost | | | | | | | | |
Land | | $ | 82,215 | | | $ | 43,252 | |
Buildings and improvements | | | 588,653 | | | | 378,737 | |
| | | | | | | | |
| | | 670,868 | | | | 421,989 | |
Less: accumulated depreciation | | | (56,448 | ) | | | (51,553 | ) |
| | | | | | | | |
Investments in real estate, net (variable interest entities $65,275 and $21,423, respectively) | | | 614,420 | | | | 370,436 | |
Cash and cash equivalents (variable interest entities $1,163 and $509, respectively) | | | 112,512 | | | | 97,682 | |
Restricted cash held in escrows (variable interest entities $7,340 and $1,101, respectively) | | | 13,372 | | | | 13,250 | |
Loans receivable, net | | | 101,100 | | | | 211,250 | |
Secured financing receivable | | | 30,728 | | | | — | |
Accounts receivable, net of allowances of $414 and $374, respectively | | | 2,229 | | | | 1,418 | |
Accrued rental income | | | 19,760 | | | | 17,241 | |
Securities carried at fair value | | | — | | | | 19,694 | |
Loan securities carried at fair value | | | 226 | | | | 11 | |
Preferred equity investments | | | 6,485 | | | | 12,250 | |
Equity investments | | | 149,085 | | | | 134,859 | |
Lease intangibles, net (variable interest entities $20,043 and $3,485, respectively) | | | 49,866 | | | | 37,744 | |
Deferred financing costs, net | | | 6,189 | | | | 4,864 | |
Other assets | | | 3,314 | | | | 2,464 | |
Assets held for sale | | | 23,038 | | | | — | |
| | | | | | | | |
TOTAL ASSETS | | $ | 1,132,324 | | | $ | 923,163 | |
| | | | | | | | |
| | |
LIABILITIES | | | | | | | | |
Mortgage loans payable (variable interest entities $90,404 and $23,184, respectively) | | $ | 444,933 | | | $ | 280,576 | |
Senior notes payable | | | 86,250 | | | | 86,250 | |
Secured financings | | | 29,150 | | | | 52,920 | |
Notes payable (variable interest entities $942 and $876, respectively) | | | 1,742 | | | | 1,676 | |
Accounts payable, accrued liabilities and other liabilities | | | 26,266 | | | | 21,056 | |
Related party fees payable | | | 2,831 | | | | 2,664 | |
Dividends payable | | | 6,099 | | | | 5,366 | |
Deferred income | | | 1,353 | | | | 1,136 | |
Below market lease intangibles, net (variable interest entities $527 and $51, respectively) | | | 2,399 | | | | 2,255 | |
Liabilities of assets held for sale | | | 21,638 | | | | — | |
| | | | | | | | |
TOTAL LIABILITIES | | | 622,661 | | | | 453,899 | |
| | | | | | | | |
| | |
COMMITMENTS AND CONTINGENCIES | | | | | | | | |
| | |
EQUITY | | | | | | | | |
Winthrop Realty Trust Shareholders’ Equity: | | | | | | | | |
Series D Cumulative Redeemable Preferred Shares, $25 per share liquidation preference, 5,060,000 shares authorized and 4,820,000 shares both issued and outstanding at December 31, 2013 and December 31, 2012 | | | 120,500 | | | | 120,500 | |
Common Shares of Beneficial Interest, $1 par, unlimited shares authorized; 36,401,438 and 33,018,711 issued and outstanding at December 31, 2013 and December 31, 2012, respectively | | | 35,809 | | | | 33,019 | |
Additional paid-in capital | | | 647,121 | | | | 618,426 | |
Accumulated distributions in excess of net income | | | (322,432 | ) | | | (317,385 | ) |
Accumulated other comprehensive loss | | | (124 | ) | | | (50 | ) |
| | | | | | | | |
Total Winthrop Realty Trust Shareholders’ Equity | | | 480,874 | | | | 454,510 | |
Non-controlling interests | | | 28,789 | | | | 14,754 | |
| | | | | | | | |
Total Equity | | | 509,663 | | | | 469,264 | |
| | | | | | | | |
TOTAL LIABILITIES AND EQUITY | | $ | 1,132,324 | | | $ | 923,163 | |
| | | | | | | | |
See Notes to Consolidated Financial Statements.
65
WINTHROP REALTY TRUST
CONSOLIDATED STATEMENTS OF OPERATIONS AND COMPREHENSIVE INCOME (LOSS)
(in thousands, except per share data)
| | | | | | | | | | | | |
| | | Years Ended December 31, | |
| | | 2013 | | | 2012 | | | 2011 | |
Revenue | | | | | | | | | | | | |
Rents and reimbursements | | $ | 61,103 | | | $ | 44,213 | | | $ | 35,848 | |
Interest, dividends and discount accretion | | | 18,455 | | | | 21,123 | | | | 25,458 | |
| | | | | | | | | | | | |
| | | 79,558 | | | | 65,336 | | | | 61,306 | |
| | | | | | | | | | | | |
Expenses | | | | | | | | | | | | |
Property operating | | | 20,724 | | | | 13,614 | | | | 12,437 | |
Real estate taxes | | | 5,876 | | | | 3,672 | | | | 3,541 | |
Depreciation and amortization | | | 20,443 | | | | 15,119 | | | | 10,692 | |
Interest | | | 23,412 | | | | 16,995 | | | | 14,001 | |
Impairment loss on investments in real estate | | | — | | | | 1,738 | | | | 4,600 | |
Provision for loss on loans receivable | | | 348 | | | | — | | | | — | |
General and administrative | | | 4,363 | | | | 3,529 | | | | 3,527 | |
Related party fees | | | 9,289 | | | | 8,953 | | | | 7,690 | |
Transaction costs | | | 1,885 | | | | 421 | | | | 519 | |
Federal, state and local taxes | | | 430 | | | | 232 | | | | 376 | |
| | | | | | | | | | | | |
| | | 86,770 | | | | 64,273 | | | | 57,383 | |
| | | |
Other income (loss) | | | | | | | | | | | | |
Equity in income (loss) of equity investments (inclusive of impairments of $7,687, $0 and $21,058) | | | 22,641 | | | | 14,843 | | | | (12,712 | ) |
Earnings from preferred equity investments | | | 613 | | | | — | | | | 338 | |
Realized gain on sale of securities carried at fair value | | | 742 | | | | 41 | | | | 123 | |
Unrealized gain (loss) on securities carried at fair value | | | (142 | ) | | | 6,916 | | | | 2,788 | |
Gain (loss) on extinguishment of debt, net | | | — | | | | (121 | ) | | | 6,339 | |
Realized gain on loan securities carried at fair value | | | — | | | | 614 | | | | — | |
Unrealized gain on loan securities carried at fair value | | | 215 | | | | 447 | | | | 2,738 | |
Settlement income (expense) | | | (411 | ) | | | — | | | | 5,868 | |
Gain on consolidation of property | | | — | | | | — | | | | 818 | |
Interest and other income | | | 375 | | | | 699 | | | | 1,175 | |
| | | | | | | | | | | | |
| | | 24,033 | | | | 23,439 | | | | 7,475 | |
| | | | | | | | | | | | |
Income from continuing operations | | | 16,821 | | | | 24,502 | | | | 11,398 | |
Discontinued operations | | | | | | | | | | | | |
Net income (loss) from discontinued operations | | | 7,667 | | | | (118 | ) | | | 349 | |
| | | | | | | | | | | | |
Net income | | | 24,488 | | | | 24,384 | | | | 11,747 | |
Net loss (income) attributable to non-controlling interest | | | 4,290 | | | | 247 | | | | (814 | ) |
| | | | | | | | | | | | |
Net income attributable to Winthrop Realty Trust | | | 28,778 | | | | 24,631 | | | | 10,933 | |
Preferred dividend of Series C Preferred Shares | | | — | | | | — | | | | (585 | ) |
Preferred dividend of Series D Preferred Shares | | | (11,146 | ) | | | (9,285 | ) | | | (339 | ) |
Amount allocated to Restricted Common Shares | | | (307 | ) | | | — | | | | — | |
| | | | | | | | | | | | |
Net income attributable to Common Shares | | $ | 17,325 | | | $ | 15,346 | | | $ | 10,009 | |
| | | | | | | | | | | | |
Per Common Share data - Basic | | | | | | | | | | | | |
Income from continuing operations | | $ | 0.28 | | | $ | 0.46 | | | $ | 0.31 | |
Income (loss) from discontinued operations | | | 0.23 | | | | — | | | | 0.01 | |
| | | | | | | | | | | | |
Net income attributable to Common Shares | | $ | 0.51 | | | $ | 0.46 | | | $ | 0.32 | |
| | | | | | | | | | | | |
Per Common Share data - Diluted | | | | | | | | | | | | |
Income from continuing operations | | $ | 0.28 | | | $ | 0.46 | | | $ | 0.31 | |
Income (loss) from discontinued operations | | | 0.23 | | | | — | | | | 0.01 | |
| | | | | | | | | | | | |
Net income attributable to Common Shares | | $ | 0.51 | | | $ | 0.46 | | | $ | 0.32 | |
| | | | | | | | | | | | |
Basic Weighted-Average Common Shares | | | 33,743 | | | | 33,062 | | | | 31,428 | |
| | | | | | | | | | | | |
Diluted Weighted-Average Common Shares | | | 33,774 | | | | 33,062 | | | | 31,428 | |
| | | | | | | | | | | | |
Comprehensive income | | | | | | | | | | | | |
Net income | | $ | 24,488 | | | $ | 24,384 | | | $ | 11,747 | |
Change in unrealized gain (loss) on interest rate derivatives | | | (74 | ) | | | 42 | | | | (29 | ) |
| | | | | | | | | | | | |
Consolidated comprehensive income | | | 24,414 | | | | 24,426 | | | | 11,718 | |
Net (income) loss attributable to non-controlling interest | | | 4,290 | | | | 247 | | | | (814 | ) |
| | | | | | | | | | | | |
Comprehensive (income) loss attributable to non-controlling interest | | | 4,290 | | | | 247 | | | | (814 | ) |
| | | | | | | | | | | | |
Comprehensive income attributable to Winthrop Realty Trust | | $ | 28,704 | | | $ | 24,673 | | | $ | 10,904 | |
| | | | | | | | | | | | |
See Notes to Consolidated Financial Statements.
66
WINTHROP REALTY TRUST
CONSOLIDATED STATEMENTS OF SHAREHOLDERS’ EQUITY
FOR THE YEARS ENDED DECEMBER 31, 2013, 2012 AND 2011
(In thousands except per share data)
| | | | | | | | | | | | | | | | | | | | | | | | | | | | | | | | | | | | |
| | | Series D Preferred Shares
of Beneficial Interest | | | Common Shares
of Beneficial
Interest | | | Additional
Paid-In | | | Accumulated
Distributions
in Excess of | | | Accumulated
Other
Comprehensive | | | Non-
Controlling | | | | |
| | | Shares | | | Amount | | | Shares | | | Amount | | | Capital | | | Net Income | | | Income (Loss) | | | Interests | | | Total | |
| | | | | | | | | |
Balance, December 31, 2010 | | | — | | | $ | — | | | | 27,030 | | | $ | 27,030 | | | $ | 569,586 | | | $ | (300,782 | ) | | $ | (63 | ) | | $ | 14,076 | | | $ | 309,847 | |
| | | | | | | | | |
Net income attributable to Winthrop Realty Trust | | �� | — | | | | — | | | | — | | | | — | | | | — | | | | 10,933 | | | | — | | | | — | | | | 10,933 | |
Net income attributable to non-controlling interests | | | — | | | | — | | | | — | | | | — | | | | — | | | | — | | | | — | | | | 814 | | | | 814 | |
Distributions to non-controlling interests | | | — | | | | — | | | | — | | | | — | | | | — | | | | — | | | | — | | | | (356 | ) | | | (356 | ) |
Contributions from non-controlling interests | | | — | | | | — | | | | — | | | | — | | | | — | | | | — | | | | — | | | | 6,526 | | | | 6,526 | |
Dividends declared on Common Shares of beneficial interest ($0.65 per share) | | | — | | | | — | | | | — | | | | — | | | | — | | | | (20,473 | ) | | | — | | | | — | | | | (20,473 | ) |
Dividends declared on Series C Preferred Shares ($1.43 per share) | | | — | | | | — | | | | — | | | | — | | | | — | | | | (585 | ) | | | — | | | | — | | | | (585 | ) |
Dividends declared on Series D Preferred Shares ($0.212 per share) | | | — | | | | — | | | | — | | | | — | | | | — | | | | (339 | ) | | | — | | | | — | | | | (339 | ) |
Change in unrealized loss on interest rate derivatives | | | — | | | | — | | | | — | | | | — | | | | — | | | | — | | | | (29 | ) | | | (26 | ) | | | (55 | ) |
Net proceeds from Common Shares offering | | | — | | | | | | | | 5,750 | | | | 5,750 | | | | 55,636 | | | | — | | | | — | | | | — | | | | 61,386 | |
Net proceeds from Series D Preferred Shares offering | | | 1,600 | | | | 40,000 | | | | — | | | | — | | | | (1,622 | ) | | | — | | | | — | | | | — | | | | 38,378 | |
Stock issued pursuant to dividend reinvestment plan | | | — | | | | — | | | | 261 | | | | 261 | | | | 2,499 | | | | — | | | | — | | | | — | | | | 2,760 | |
| | | | | | | | | | | | | | | | | | | | | | | | | | | | | | | | | | | | |
Balance, December 31, 2011 | | | 1,600 | | | $ | 40,000 | | | | 33,041 | | | $ | 33,041 | | | $ | 626,099 | | | $ | (311,246 | ) | | $ | (92 | ) | | $ | 21,034 | | | $ | 408,836 | |
| | | | | | | | | | | | | | | | | | | | | | | | | | | | | | | | | | | | |
See Notes to Consolidated Financial Statements.
67
WINTHROP REALTY TRUST
CONSOLIDATED STATEMENTS OF SHAREHOLDERS’ EQUITY
FOR THE YEARS ENDED DECEMBER 31, 2013, 2012 AND 2011
(In thousands except per share data)
| | | | | | | | | | | | | | | | | | | | | | | | | | | | | | | | | | | | |
| | | Series D Preferred Shares
of Beneficial Interest | | | Common Shares
of Beneficial
Interest | | | Additional
Paid-In | | | Distributions
in Excess of | | | Other
Comprehensive | | | Non-
Controlling | | | | |
| | | Shares | | | Amount | | | Shares | | | Amount | | | Capital | | | Net Income | | | Income (Loss) | | | Interests | | | Total | |
| | | | | | | | | |
Balance, December 31, 2011 | | | 1,600 | | | $ | 40,000 | | | | 33,041 | | | $ | 33,041 | | | $ | 626,099 | | | $ | (311,246 | ) | | $ | (92 | ) | | $ | 21,034 | | | $ | 408,836 | |
| | | | | | | | | |
Net income attributable to Winthrop Realty Trust | | | — | | | | — | | | | — | | | | — | | | | — | | | | 24,631 | | | | — | | | | — | | | | 24,631 | |
Net income attributable to non-controlling interests | | | — | | | | — | | | | — | | | | — | | | | — | | | | — | | | | — | | | | (247 | ) | | | (247 | ) |
Distributions to non-controlling interests | | | — | | | | — | | | | — | | | | — | | | | — | | | | — | | | | — | | | | (7,242 | ) | | | (7,242 | ) |
Contributions from non-controlling interests | | | — | | | | — | | | | — | | | | — | | | | — | | | | — | | | | — | | | | 4,576 | | | | 4,576 | |
Purchase of non-controlling interests | | | — | | | | — | | | | — | | | | — | | | | (4,533 | ) | | | — | | | | — | | | | (3,367 | ) | | | (7,900 | ) |
Dividends declared on Common Shares of beneficial interest ($0.65 per share) | | | — | | | | — | | | | — | | | | — | | | | — | | | | (21,485 | ) | | | — | | | | — | | | | (21,485 | ) |
Dividends declared on Series D Preferred Shares ($1.92628 per share) | | | — | | | | — | | | | — | | | | — | | | | — | | | | (9,285 | ) | | | — | | | | — | | | | (9,285 | ) |
Series D Preferred Share offering | | | 3,220 | | | | 80,500 | | | | — | | | | — | | | | (2,937 | ) | | | — | | | | — | | | | — | | | | 77,563 | |
Change in unrealized gain on interest rate derivatives | | | — | | | | — | | | | — | | | | — | | | | — | | | | — | | | | 42 | | | | — | | | | 42 | |
Stock issued pursuant to Dividend Reinvestment Plan | | | — | | | | — | | | | 48 | | | | 48 | | | | 469 | | | | — | | | | — | | | | — | | | | 517 | |
Stock buyback | | | — | | | | — | | | | (70 | ) | | | (70 | ) | | | (672 | ) | | | — | | | | — | | | | — | | | | (742 | ) |
| | | | | | | | | | | | | | | | | | | | | | | | | | | | | | | | | | | | |
Balance, December 31, 2012 | | | 4,820 | | | $ | 120,500 | | | | 33,019 | | | $ | 33,019 | | | $ | 618,426 | | | $ | (317,385 | ) | | $ | (50 | ) | | $ | 14,754 | | | $ | 469,264 | |
| | | | | | | | | | | | | | | | | | | | | | | | | | | | | | | | | | | | |
| | | | | | | | | |
Net income attributable to Winthrop Realty Trust | | | — | | | | — | | | | — | | | | — | | | | — | | | | 28,778 | | | | — | | | | — | | | | 28,778 | |
Net income attributable to non-controlling interests | | | — | | | | — | | | | — | | | | — | | | | — | | | | — | | | | — | | | | (4,290 | ) | | | (4,290 | ) |
Distributions to non-controlling interests | | | — | | | | — | | | | — | | | | — | | | | — | | | | — | | | | — | | | | (51 | ) | | | (51 | ) |
Contributions from non-controlling interests | | | — | | | | — | | | | — | | | | — | | | | — | | | | — | | | | — | | | | 18,629 | | | | 18,629 | |
Purchase of non-controlling interests | | | — | | | | — | | | | — | | | | — | | | | 103 | | | | — | | | | — | | | | (253 | ) | | | (150 | ) |
Dividends declared on Common Shares of Beneficial Interest ($0.65 per share) | | | — | | | | — | | | | — | | | | — | | | | — | | | | (22,372 | ) | | | — | | | | — | | | | (22,372 | ) |
Dividends declared on Series D Preferred Shares ($2.3125 per share) | | | — | | | | — | | | | — | | | | — | | | | — | | | | (11,146 | ) | | | — | | | | — | | | | (11,146 | ) |
Dividends declared on Restricted Shares | | | — | | | | — | | | | — | | | | — | | | | — | | | | (307 | ) | | | — | | | | — | | | | (307 | ) |
Change in unrealized loss on interest rate derivatives | | | — | | | | — | | | | — | | | | — | | | | — | | | | — | | | | (74 | ) | | | — | | | | (74 | ) |
Stock issued pursuant to Dividend Reinvestment Plan | | | — | | | | — | | | | 40 | | | | 40 | | | | 424 | | | | — | | | | — | | | | — | | | | 464 | |
Net proceeds from Common Shares offering | | | — | | | | — | | | | 2,750 | | | | 2,750 | | | | 27,271 | | | | — | | | | — | | | | — | | | | 30,021 | |
Issuance of Restricted Shares | | | — | | | | — | | | | 592 | | | | — | | | | — | | | | — | | | | — | | | | — | | | | — | |
Amortization of Restricted Shares | | | — | | | | — | | | | — | | | | — | | | | 897 | | | | — | | | | — | | | | — | | | | 897 | |
| | | | | | | | | | | | | | | | | | | | | | | | | | | | | | | | | | | | |
Balance, December 31, 2013 | | | 4,820 | | | $ | 120,500 | | | | 36,401 | | | $ | 35,809 | | | $ | 647,121 | | | $ | (322,432 | ) | | $ | (124 | ) | | $ | 28,789 | | | $ | 509,663 | |
| | | | | | | | | | | | | | | | | | | | | | | | | | | | | | | | | | | | |
See Notes to Consolidated Financial Statements.
68
WINTHROP REALTY TRUST
CONSOLIDATED STATEMENTS OF CASH FLOWS
(in thousands)
| | | | | | | | | | | | |
| | | Years Ended December 31, | |
| | | 2013 | | | 2012 | | | 2011 | |
Cash flows from operating activities | | | | | | | | | | | | |
Net Income | | $ | 24,488 | | | $ | 24,384 | | | $ | 11,747 | |
Adjustments to reconcile net income to net cash provided by operating activities: | | | | | | | | | | | | |
Depreciation and amortization (including amortization of deferred financing costs and fair value of debt) | | | 15,451 | | | | 11,824 | | | | 9,412 | |
Amortization of lease intanigibles | | | 8,550 | | | | 6,746 | | | | 4,472 | |
Straight-line rental income | | | 669 | | | | (2,177 | ) | | | (872 | ) |
Loan discount accretion | | | (4,121 | ) | | | (8,333 | ) | | | (13,401 | ) |
Discount accretion received in cash | | | 37 | | | | 15,720 | | | | 13,290 | |
Earnings of preferred equity investments | | | (613 | ) | | | — | | | | (338 | ) |
Distrubutions of income from preferred equity investments | | | 607 | | | | 97 | | | | 571 | |
(Income) loss of equity investments | | | (22,641 | ) | | | (14,678 | ) | | | 12,712 | |
Distributions of income from equity investments | | | 24,112 | | | | 21,593 | | | | 12,696 | |
Restricted cash held in escrows | | | 1,242 | | | | (3,477 | ) | | | 1,431 | |
Gain on sale of securities carried at fair value | | | (742 | ) | | | (41 | ) | | | (123 | ) |
Unrealized loss (gain) on securities carried at fair value | | | 142 | | | | (6,916 | ) | | | (2,788 | ) |
Gain on sale of real estate investments | | | (11,005 | ) | | | (945 | ) | | | (392 | ) |
Gain on sale of loan securities carried at fair value | | | — | | | | (614 | ) | | | — | |
Unrealized gain on loan securities carried at fair value | | | (215 | ) | | | (447 | ) | | | (2,738 | ) |
Impairment loss on investments in real estate | | | 2,904 | | | | 3,260 | | | | 7,600 | |
Loss (gain) on extinguishment of debt | | | — | | | | 121 | | | | (9,258 | ) |
Gain on consolidation of property | | | — | | | | — | | | | (818 | ) |
Provision for loss on loans receivable | | | 348 | | | | — | | | | — | |
Tenant leasing costs | | | (4,229 | ) | | | (4,250 | ) | | | (1,314 | ) |
Equity compensation expenses | | | 897 | | | | — | | | | — | |
Bad debt expense (recovery) | | | 40 | | | | (265 | ) | | | 377 | |
Changes in assets and liabilities: | | | | | | | | | | | | |
Interest receivable | | | (214 | ) | | | (516 | ) | | | 37 | |
Accounts receivable and other assets | | | (1,316 | ) | | | 726 | | | | (785 | ) |
Accounts payable, accrued liabilities and other liabilities | | | (4,123 | ) | | | 4,623 | | | | (1,831 | ) |
| | | | | | | | | | | | |
Net cash provided by operating activities | | | 30,268 | | | | 46,435 | | | | 39,687 | |
| | | | | | | | | | | | |
| | | |
Cash flows from investing activities | | | | | | | | | | | | |
Issuance and acquisition of loans receivable | | | (21,437 | ) | | | (163,800 | ) | | | (67,619 | ) |
Investment in real estate | | | (257,142 | ) | | | (37,678 | ) | | | (9,751 | ) |
Investment in equity investments | | | (30,341 | ) | | | (78,679 | ) | | | (151,219 | ) |
Investment in preferred equity investment | | | — | | | | (10,750 | ) | | | (7,564 | ) |
Return of capital distribution from equity investments | | | 14,618 | | | | 84,026 | | | | 31,890 | |
Return of capital distribution from preferred equity investment | | | 5,771 | | | | — | | | | — | |
Return of capital distribution from securities carried at fair value | | | 376 | | | | — | | | | — | |
Purchase of securities carried at fair value | | | — | | | | (5,655 | ) | | | (19,321 | ) |
Proceeds from sale of investments in real estate | | | 38,690 | | | | 7,024 | | | | 3,629 | |
Proceeds from sale of equity investments | | | 26 | | | | 4,297 | | | | 6,000 | |
Proceeds from sale of securities carried at fair value | | | 19,918 | | | | 21,774 | | | | 26,408 | |
Proceeds from pay off of loan securities | | | — | | | | 6,359 | | | | 8,748 | |
Proceeds from sale of loan receivables | | | 19,319 | | | | — | | | | — | |
Restricted cash held in escrows | | | 863 | | | | (5,600 | ) | | | 3,160 | |
Issuance of secured financing receivable | | | (30,000 | ) | | | — | | | | — | |
Collection of loans receivable | | | 56,088 | | | | 68,824 | | | | 70,289 | |
Deposits on assets held for sale | | | 500 | | | | — | | | | — | |
Cash from consolidation of properties | | | 473 | | | | — | | | | — | |
Cash from foreclosure on properties | | | — | | | | 411 | | | | — | |
| | | | | | | | | | | | |
Net cash used in investing activities | | | (182,278 | ) | | | (109,447 | ) | | | (105,350 | ) |
| | | | | | | | | | | | |
(Continued on next page)
See Notes to Consolidated Financial Statements.
69
WINTHROP REALTY TRUST
CONSOLIDATED STATEMENTS OF CASH FLOWS
(in thousands, continued)
| | | | | | | | | | | | |
| | | Years Ended December 31, | |
| | | 2013 | | | 2012 | | | 2011 | |
Cash flows from financing activities | | | | | | | | | | | | |
Proceeds from mortgage loans payable | | $ | 198,100 | | | $ | 36,897 | | | $ | 32,494 | |
Proceeds from notes payable | | | — | | | | 880 | | | | — | |
Payment of notes payable | | | — | | | | (80 | ) | | | — | |
Proceeds from revolving line of credit | | | — | | | | — | | | | 67,324 | |
Payment of revolving line of credit | | | — | | | | (40,000 | ) | | | (52,774 | ) |
Principal payments of mortgage loans payable | | | (22,287 | ) | | | (25,584 | ) | | | (72,574 | ) |
Proceeds from issuance of senior notes payable | | | — | | | | 86,250 | | | | — | |
Proceeds from secured financing | | | — | | | | 25,000 | | | | 29,150 | |
Payment of secured financing | | | (23,770 | ) | | | (1,230 | ) | | | — | |
Restricted cash held in escrows | | | (228 | ) | | | (42 | ) | | | 89 | |
Deferred financing costs | | | (796 | ) | | | (4,198 | ) | | | (788 | ) |
Purchase of non-controlling interests | | | (150 | ) | | | (2,050 | ) | | | — | |
Contribution from non-controlling interest | | | 18,629 | | | | 4,576 | | | | 1,349 | |
Distribution to non-controlling interest | | | (51 | ) | | | (7,242 | ) | | | (356 | ) |
Proceeds from issuance of Common Shares under Dividend Reinvestment Plan | | | 464 | | | | 517 | | | | 2,760 | |
Proceeds from issuance of Common Shares through offering, net | | | 30,021 | | | | — | | | | 61,386 | |
Buyback of Common Shares | | | — | | | | (742 | ) | | | — | |
Issuance of Series D Preferred Shares | | | — | | | | 77,563 | | | | 38,378 | |
Dividend paid on Common Shares | | | (21,919 | ) | | | (21,488 | ) | | | (19,496 | ) |
Dividend paid on Series C Preferred Shares | | | — | | | | — | | | | (624 | ) |
Dividend paid on Series D Preferred Shares | | | (11,146 | ) | | | (9,285 | ) | | | (339 | ) |
Dividend paid on Restricted Shares | | | (27 | ) | | | — | | | | — | |
Redemption of Series B-1 Preferred Shares | | | — | | | | — | | | | (21,400 | ) |
Redemption of Series C Preferred Shares | | | — | | | | — | | | | (3,221 | ) |
| | | | | | | | | | | | |
Net cash provided by financing activities | | | 166,840 | | | | 119,742 | | | | 61,358 | |
| | | | | | | | | | | | |
| | | |
Net increase (decrease) in cash and cash equivalents | | | 14,830 | | | | 56,730 | | | | (4,305 | ) |
Cash and cash equivalents at beginning of year | | | 97,682 | | | | 40,952 | | | | 45,257 | |
| | | | | | | | | | | | |
Cash and cash equivalents at end of year | | $ | 112,512 | | | $ | 97,682 | | | $ | 40,952 | |
| | | | | | | | | | | | |
| | | |
Supplemental Disclosure of Cash Flow Information | | | | | | | | | | | | |
Interest paid | | $ | 23,735 | | | $ | 16,467 | | | $ | 16,246 | |
| | | | | | | | | | | | |
Capitalized interest | | $ | 1,443 | | | $ | — | | | $ | — | |
| | | | | | | | | | | | |
Taxes paid | | $ | 247 | | | $ | 332 | | | $ | 396 | |
| | | | | | | | | | | | |
| | | |
Supplemental Disclosure on Non-Cash Investing and Financing Activities | | | | | | | | | | | | |
Dividends accrued on Common Shares and Restricted Shares | | $ | 6,099 | | | $ | 5,366 | | | $ | 5,396 | |
| | | | | | | | | | | | |
Capital expenditures accrued | | $ | 3,140 | | | $ | 4,011 | | | $ | 4,285 | |
| | | | | | | | | | | | |
Assumption of mortgage loan on investment in real estate | | $ | 9,248 | | | $ | 13,600 | | | $ | 49,091 | |
| | | | | | | | | | | | |
Contribution to WRT-Elad One South State Equity L.P. | | $ | 2,083 | | | $ | — | | | $ | — | |
| | | | | | | | | | | | |
Distribution from WRT-One South State Lender LP | | $ | (2,083 | ) | | $ | — | | | $ | — | |
| | | | | | | | | | | | |
Fair value of assets acquired | | $ | 62,208 | | | $ | — | | | $ | — | |
| | | | | | | | | | | | |
Fair value of liabilities assumed | | $ | 62,198 | | | $ | — | | | $ | — | |
| | | | | | | | | | | | |
Transfer from preferred equity investments | | $ | — | | | $ | 3,923 | | | $ | 7,843 | |
| | | | | | | | | | | | |
Transfer from loans receivable | | $ | (877 | ) | | $ | 2,938 | | | $ | — | |
| | | | | | | | | | | | |
Transfer to equity investments | | $ | — | | | $ | (6,861 | ) | | $ | (5,035 | ) |
| | | | | | | | | | | | |
Transfer from equity investments | | $ | — | | | $ | 17,600 | | | $ | 12,544 | |
| | | | | | | | | | | | |
Transfer to loans receivable | | $ | — | | | $ | (11,750 | ) | | $ | (6,534 | ) |
| | | | | | | | | | | | |
Transfer to additional paid-in capital | | $ | — | | | $ | (5,487 | ) | | $ | — | |
| | | | | | | | | | | | |
Transfer to non-controlling interests | | $ | — | | | $ | (363 | ) | | $ | — | |
| | | | | | | | | | | | |
Transfer to preferred equity investments | | $ | — | | | $ | — | | | $ | (2,022 | ) |
| | | | | | | | | | | | |
Transfer to investments in lease intangibles | | $ | — | | | $ | — | | | $ | (11,904 | ) |
| | | | | | | | | | | | |
Transfer to investments in real estate | | $ | — | | | $ | — | | | $ | (52,778 | ) |
| | | | | | | | | | | | |
Transfer to below market lease intangibles | | $ | — | | | $ | — | | | $ | 1,005 | |
| | | | | | | | | | | | |
Transfer from loan securities | | $ | — | | | $ | — | | | $ | 662 | |
| | | | | | | | | | | | |
See Notes to Consolidated Financial Statements.
F-70
WINTHROP REALTY TRUST
NOTES TO CONSOLIDATED FINANCIAL STATEMENTS
Amounts related to number of buildings, square footage, occupancy and tenant data are unaudited.
Winthrop Realty Trust (“WRT”), a real estate investment trust (“REIT”) under Sections 856-860 of the Internal Revenue Code (the “Code”), is an unincorporated association in the form of a business trust organized in Ohio under a Declaration of Trust dated August 1, 1961, as amended and restated on May 21, 2009, which has as its stated principal business activity the ownership and management of, and lending to, real estate and related investments.
Since January 1, 2005, WRT has conducted its business through WRT Realty L.P., a Delaware limited partnership (the “Operating Partnership”). WRT is the sole general partner of, and owns directly and indirectly, 100% of the limited partnership interest in the Operating Partnership. All references to the “Trust” refer to WRT and its consolidated subsidiaries, including the Operating Partnership.
The Trust is engaged in the business of owning real property and real estate related assets which it categorizes into three segments: (i) ownership of investment properties including wholly owned properties and investments in joint ventures which own properties (“operating properties”); (ii) origination and acquisition of loans and debt securities collateralized directly or indirectly by commercial and multi-family real property, including collateral mortgage-backed securities and collateral debt obligation securities (collectively “loan assets”); and (iii) equity and debt interests in other real estate investment trusts (“REIT securities”).
| 2. | Summary of Significant Accounting Policies |
Consolidation and Basis of Presentation
The consolidated financial statements represent the consolidated results of WRT, its wholly-owned taxable REIT subsidiary, WRT-TRS Management Corp. (“TRS”), and the Operating Partnership. TRS’ sole assets are its nominal ownership interest in the Operating Partnership, an indirect 33% interest in WRT-NV ST Holdings LLC and an indirect interest in CDH CDO LLC. All majority-owned subsidiaries and affiliates over which the Trust has financial and operating control and variable interest entities (“VIE“s) in which the Trust has determined it is the primary beneficiary are included in the consolidated financial statements. All significant intercompany balances and transactions have been eliminated in consolidation. The Trust accounts for all other unconsolidated joint ventures using the equity method of accounting. Accordingly, the Trust’s share of the earnings of these joint ventures and companies is included in consolidated net income.
Reclassifications
Certain prior year balances relating to gain on sale of equity investments have been reclassified to equity income, and certain prior year balances of accounts receivable have been reclassified to accrued rental income in order to conform to the current year presentation. Discontinued operations for the periods presented include the Trust’s properties in Deer Valley, Arizona; Lisle, Illinois, Indianapolis, Indiana; Andover, Massachusetts; St. Louis, Missouri; Knoxville, Tennessee; Memphis, Tennessee; Denton, Texas; and Seabrook, Texas. Also included in discontinued operations for all periods presented are the operations of the Trust’s residential property in Meriden, Connecticut which was under contract to be sold and is classified as held for sale at December 31, 2013. This property was sold on February 26, 2014.
Out of Period Adjustments
During 2013, the Trust identified an error in its previously reported interim financial statements relating to the purchase price allocation of the Trust’s investment in the 1515 Market Street property. The Trust recorded an out of period adjustment in the amount of $1.3 million to correct the overstatement of other liabilities and overstatement of building in the Trust’s consolidated balance sheet. The Trust also recorded an out of period adjustment to reduce depreciation expense in the amount of $21,000 during the Trust’s fourth quarter of 2013 to correct the depreciation expense in the consolidated statement of operations. The Trust concluded that these adjustments are not material to the current period or the prior period’s financial position or results from operations. As such, this cumulative change was recorded in the consolidated balance sheet and consolidated statement of operations during the quarter ended on December 31, 2013. This error had no impact on any other periods presented.
71
During the quarter ended December 31, 2011, the Trust identified an error related to lease termination fee income for its St. Louis, Missouri property, included in discontinued operations, which should have been in its December 31, 2010 financial statements. As a result, net income was understated by $450,000 for the year ended December 31, 2010. This income was recorded by the Trust in the quarter ended December 31, 2011. The Trust determined that this amount was not material to the year or any quarter for the years ended December 31, 2011 or 2010. There was no impact on cash flow from operations.
Use of Estimates
The preparation of financial statements in conformity with accounting principles generally accepted in the United States of America (“GAAP”) requires management to make estimates and assumptions in determining the values of assets and liabilities, disclosure of contingent assets and liabilities at the date of the consolidated financial statements and the amounts of revenue and expenses during the reporting period. The estimates that are particularly susceptible to management’s judgment include but are not limited to the impairment of real estate, loans and investments in ventures and real estate securities carried at fair value. In addition, estimates are used in accounting for the allowance for doubtful accounts. All of the estimates and evaluations are susceptible to change and actual results could differ from the estimates and evaluations.
Investments in Real Estate
Real estate assets are stated at historical cost. Expenditures for repairs and maintenance are expensed as incurred. Significant renovations that extend the useful life of the properties are capitalized. Depreciation for financial reporting purposes is computed using the straight-line method. Buildings are depreciated over their estimated useful lives of 40 years, based on the property’s age, overall physical condition, type of construction materials and intended use. Improvements to the buildings are depreciated over the shorter of the estimated useful life of the improvement or the remaining useful life of the building at the time the improvement is completed. Tenant improvements are depreciated over the shorter of the estimated useful life of the improvement or the term of the lease of the tenant.
Upon the acquisition of real estate, the Trust assesses the fair value of acquired assets (including land, buildings and improvements, and identified intangibles such as above and below market leases and acquired in-place leases and tenant relationships) and acquired liabilities and the Trust allocates purchase price based on these assessments. The Trust assesses fair value based on estimated cash flow projections and utilizes appropriate discount and capitalization rates and available market information. Estimates of future cash flows are based on a number of factors including the historical operating results, known trends, and market/economic conditions that may affect the property. If the acquisition is determined to be a business combination, then the related acquisition costs will be expended. If the acquisition is determined to be an asset acquisition, then the related acquisition costs will be capitalized.
The fair value of the tangible assets of an acquired property is determined by valuing the property as if it were vacant, and the “as-if-vacant” value is then allocated to land, building and improvements and fixtures and equipment based on management’s determination of the fair values of these assets. Factors considered by management in performing these analyses include an estimate of carrying costs during the expected lease-up periods, current market conditions and costs to execute similar leases. In estimating carrying costs, management includes real estate taxes, insurance and other operating expenses and estimates of lost rental revenue during the expected lease-up periods based on current market demand. Management also estimates costs to execute similar leases including leasing commissions.
Real estate investments and purchased intangible assets subject to amortization are reviewed for impairment whenever events or changes in circumstances indicate that the carrying amount of an asset group may not be recoverable. Recoverability of real estate investments to be held and used is measured by a comparison of the carrying amount of an asset group to estimated undiscounted future cash flows expected to be generated from the use and eventual disposition of the asset group. If the carrying amount of an asset group exceeds its estimated undiscounted future cash flows, an impairment charge is recognized equal to the amount by which the carrying amount of the asset group exceeds the fair value of the asset group.
Assets to be disposed of that qualify as being held for sale are separately presented in the balance sheet and reported at the lower of the carrying amount or fair value less costs to sell. The assets and liabilities to be assumed by the buyer are classified separately as held for sale in the consolidated balance sheet and are no longer depreciated.
72
Cash and Cash Equivalents
Cash and cash equivalents include all highly liquid investments purchased with maturities of three months or less. The Trust maintains cash and cash equivalents in financial institutions in excess of insured limits, but believes this risk is mitigated by only investing in or through major financial institutions.
Restricted Cash
Restricted cash in escrow accounts include cash reserves for tenant improvements, leasing commissions, real estate taxes and other expenses pursuant to the loan agreements. In addition, certain security deposit accounts are classified as restricted cash. The classification of restricted cash within the Consolidated Statement of Cash Flows is determined by the nature of the escrow account. Activity in escrow accounts related to real estate taxes, insurance, rent reserves and security deposits is classified as operating activity. Activity in escrow accounts related to capital improvements and tenant improvements is classified as investing activity. Any debt service reserves are classified as financing activity.
Loans Receivable
The Trust’s policy is to record loans receivable at cost, net of unamortized discounts unless such loan receivable is deemed to be impaired. Discounts on loans receivable are amortized over the life of the loan receivable using the effective interest method based upon an evaluation of prospective future cash flows. The amortization is reflected as an adjustment to interest income. Other costs incurred in connection with acquiring loans, such as marketing and administrative costs, are charged to expense as incurred. Loan fees and direct costs associated with loans originated by the Trust are deferred and amortized over the life of the loan as interest income.
The Trust evaluates the collectability of the interest and principal of each of its loans to determine potential impairment. A loan receivable is considered to be impaired when, based on current information and events, it is probable that the Trust will be unable to collect all amounts due according to the existing contractual terms of the loan receivable. Impairment is then measured based on the present value of expected future cash flows or the fair value of the collateral. When a loan receivable is considered to be impaired, the Trust will record a loan loss allowance and a corresponding charge to earnings equal to the amount by which the Trust’s net investment in the loan exceeds its fair value. Significant judgments are required in determining impairment. The Trust does not record interest income on impaired loans receivable. Any cash receipts on impaired loans receivable are recorded as a recovery reducing the allowance for loan losses. The Trust charges uncollectible loans against its allowance for loan loss after it has exhausted all economically warranted legal rights and remedies to collect the receivables or upon successful foreclosure and taking of loan collateral.
Certain real estate operating properties are acquired through foreclosure or through deed-in-lieu of foreclosure in full or partial satisfaction of non-performing loans that the Trust intends to hold, operate or develop for a period of at least twelve months. Upon acquisition of a property, tangible and intangible assets and liabilities acquired are recorded at their estimated fair values and depreciation is computed in the same manners as described in “Investments in Real Estate” above.
Accounts Receivable
Accounts receivable are recorded at the contractual amount and do not bear interest. The allowance for doubtful accounts is the Trust’s best estimate of the amount of probable credit losses in existing accounts receivable. The Trust reviews the allowance for doubtful accounts monthly. Past due balances are reviewed individually for collectability. Account balances are charged off against the allowance for doubtful accounts after all means of collection have been exhausted and the potential for recovery is considered remote.
Accrued rental income includes the difference between straight line rent and contractual amounts due. The Trust reviews its straight line rent receivables monthly in conjunction with its review of allowance of doubtful accounts.
Securities and Loan Securities at Fair Value
The Trust has the option to elect fair value for these financial assets. The Trust elected the fair value option for real estate securities to mitigate a divergence between accounting and economic exposure for these assets. These securities are recorded on the consolidated balance sheets as securities carried at fair value and loan securities carried at fair value. The changes in the fair value of these instruments are recorded in unrealized gain (loss) on securities and loan securities carried at fair value in the Consolidated Statements of Operations.
73
Preferred Equity Investment
The Trust has certain investments in ventures which entitle it to priority returns ahead of the other equity holders in the ventures. At the inception of each such investment, management must determine whether such investment should be accounted for as a loan, preferred equity, equity or as real estate. The Trust classifies these investments as preferred equity investments and they are accounted for using the equity method because the Trust has the ability to significantly influence, but not control, the entity’s operating and financial policies. Earnings for each investment are recognized in accordance with each respective investment agreement and where applicable, based upon an allocation of the investment’s net assets at adjusted book value as if the investment was hypothetically liquidated at the end of each reporting period.
At each reporting period the Trust assesses whether there are any indicators of declines in the fair value of preferred equity investments. An investment’s value is impaired only if the Trust’s estimate of the fair value of the investment is less than the carrying value of the investment and such difference is deemed to be other-than-temporary. To the extent impairment has occurred, the loss shall be measured as the excess of the carrying amount of the investment over the estimated fair value of the investment.
Equity Investments
The Trust accounts for its investments in entities in which it has the ability to significantly influence, but does not have a controlling interest, by using the equity method of accounting. Factors that are considered in determining whether or not the Trust exercises control include (i) the right to remove the general partner or managing member in situations where the Trust is not the general partner or managing member, and (ii) substantive participating rights of equity holders in significant business decisions including dispositions and acquisitions of assets, financing, operations and capital budgets, and other contractual rights. Under the equity method, the investment, originally recorded at cost, is adjusted to recognize the Trust’s share of net earnings or losses as they occur and for additional contributions made or distributions received. To recognize the character of distributions from equity investments, the Trust looks at the nature of the cash distribution to determine the proper character of cash flow distributions as either returns on investment, which would be included in operating activities, or returns of investment, which would be included in investing activities.
At each reporting period the Trust assesses whether there are any indicators or declines in the fair value of the equity investments. An investment’s value is impaired only if the Trust’s estimate of the fair value of the investment is less than the carrying value of the investment and such difference is deemed to be other-than-temporary. To the extent impairment has occurred, the loss shall be measured as the excess of the carrying amount of the investment over the estimated fair value of the investment.
Lease Intangibles
In estimating the fair value of the identified intangible assets and liabilities of an acquired property, above-market and below-market lease values are recorded based on the difference between the current in-place lease rent and a management estimate of current market rents. Below-market lease intangibles are recorded as a liability and amortized into rental revenue over the non-cancelable periods of the respective leases plus the term of any below-market fixed rate renewal options, if any. Above-market leases are recorded as part of intangible assets and amortized as a direct charge against rental revenue over the non-cancelable portion of the respective leases. In-place lease values are based upon the Trust’s evaluation of the specific characteristics of each tenant lease. Factors considered include estimates of carrying costs during a hypothetical lease up period considering current market conditions and costs to execute similar leases. The in-place lease value is recorded as an intangible asset and amortized as a charge to amortization expense over the life of the respective lease.
Deferred Financing Costs
Direct financing costs are deferred and amortized over the terms of the related agreements as a component of interest expense.
Financial Instruments
Financial instruments held by the Trust include cash and cash equivalents, restricted cash, real estate securities, loans receivable, interest rate hedge agreements, accounts receivable, revolving line of credit, accounts payable and long term debt. Cash and cash equivalents, restricted cash, real estate securities and interest rate hedge agreements are recorded at fair value. The fair value of accounts receivable and accounts payable approximate their current carrying amounts.
74
Derivative Financial Instruments
The Trust’s interest rate swap and interest rate cap agreements are classified on the balance sheet as other assets and are carried at fair value. An interest rate swap is carried as an asset if the counterparty would be required to pay the Trust, or as a liability if the Trust would be required to pay the counterparty to settle the swap. For the Trust’s interest rate contracts that are designated as “cash flow hedges,” the change in the fair value of such derivative is recorded in other comprehensive income or loss for hedges that qualify as effective and the change in the fair value is transferred from other comprehensive income or loss to earnings as the hedged item affects earnings. The ineffective amount of the interest rate swap agreement, if any, is recognized in earnings.
Upon entering into hedging transactions, the Trust documents the relationship between the interest rate financial instrument agreements and the hedged item. The Trust also documents its risk management policies, including objectives and strategies, as they relate to its hedging activities. Both at inception of a hedge and on an on-going basis, the Trust assesses whether or not the hedge is “highly effective” in achieving offsetting changes in cash flow attributable to the hedged item. The Trust discontinues hedge accounting on a prospective basis with changes in the estimated fair value reflected in earnings when: (i) it is determined that the derivative is no longer effective in offsetting cash flows of a hedged item (including forecasted transactions); (ii) it is no longer probable that the forecasted transaction will occur; or (iii) it is determined that designating the derivative as a hedge is no longer appropriate. The Trust utilizes its interest rate swap and interest rate cap agreements to manage interest rate risk and does not intend to enter into derivative transactions for speculative or trading purposes.
Revenue Recognition
The Trust accounts for its leases with tenants as operating leases with rental revenue recognized on a straight-line basis over the minimum non-cancellable term of the lease. The straight-line rent adjustment decreased revenue by $862,000 in 2013 and increased revenue by $2,177,000 in 2012 and $872,000 in 2011. The accrued straight-line rent receivable amounts at December 31, 2013 and 2012 were $19,760,000 and $17,241,000, respectively.
Leases typically provide for reimbursement to the Trust of common area maintenance costs, real estate taxes and other operating expenses. Operating expense reimbursements are recognized as earned and the expenses are incurred.
Pursuant to the terms of the lease agreements with respect to net lease properties, the tenant at each property is required to pay all costs associated with the property including property taxes, ground rent, maintenance costs and insurance. These costs are not reflected in the consolidated financial statements.
Tenant leases that are not net leases generally provide for (i) billings of fixed minimum rental and (ii) billings of certain operating costs. The Trust accrues the recovery of operating costs based on actual costs incurred.
The Trust recognizes lease termination payments as a component of rental revenue in the period received, provided that the Trust has no further obligations under the lease; otherwise, the lease termination payment is amortized on a straight-line basis over the remaining obligation period.
Income Taxes
The Trust operates in a manner intended to enable it to continue to qualify as a REIT. In order to qualify as a REIT, the Trust is generally required each year to distribute to its shareholders at least 90% of its taxable income (excluding any net capital gains). There is also a separate requirement to distribute net capital gains or pay a corporate level tax. The Trust intends to comply with the foregoing minimum dividend requirements.
In order for the Trust to continue to qualify as a REIT, the value of the TRS stock cannot exceed 25% of the value of the Trust’s total assets. The net income of TRS is taxable at regular corporate tax rates. Current income taxes are recognized during the period in which transactions enter into the determination of financial statement income, with deferred income taxes being provided for temporary differences between the carrying values of assets and liabilities for financial reporting purposes and such values as determined by income tax laws. Changes in deferred income taxes attributable to these temporary differences are included in the determination of income. The Trust and TRS do not file consolidated tax returns.
The Trust reviews its tax positions under accounting guidance which require that a tax position may only be recognized in the financial statements if it is more likely than not that the tax position will prevail if challenged by taxing authorities. The Trust believes it is more likely than not that its tax positions will be sustained in any tax examination. The Trust has no income tax
75
expense, deferred tax assets or deferred tax liabilities associated with any such uncertain tax positions for the operations of any entity included in the Consolidated Statement of Operations and Comprehensive Income. The only provision for federal income taxes relates to the TRS. Our tax returns are subject to audit by taxing authorities. The tax years 2010-2013 remain open to examination by major taxing jurisdictions to which we are subject.
Series D Preferred Shares
On March 23, 2012 the Trust closed on a public offering of 3,220,000 Series D Cumulative Redeemable Preferred Shares of Beneficial Interest (the “Series D Preferred Shares”) at a price of $25.0385 per share, par value of $1 per share. The Trust received net proceeds, after underwriters discounts and expenses, of $77,563,000. The Series D Preferred Shares rank senior to the Common Shares with respect to dividend rights and liquidation or dissolution rights. The Series D Preferred Shares have no stated maturity date and are not subject to mandatory redemption or any sinking fund. Holders of the Series D Preferred Shares will generally have no voting rights except for limited voting rights if the Trust fails to pay dividends for six or more quarterly periods. The Series D Preferred Shares are classified as a component of permanent equity at December 31, 2013 and 2012.
Concurrent with the Series D Preferred Shares offering, the Trust entered into an agreement with the holders of the Series B-1 Cumulative Convertible Redeemable Preferred Shares (“Series B-1 Preferred Shares”) and Series C Cumulative Convertible Redeemable Preferred Shares (“Series C Preferred Shares”) to repurchase all the outstanding shares prior to the consummation of the Series D Preferred Shares closing and issuance. The Trust repurchased 100% of the Series B-1 Preferred Shares and the Series C Preferred Shares on November 18, 2011 at a price of $25,000,000 plus accrued dividends. The Trust recognized a loss of $100,000 on the repurchase of the Series B-1 Preferred Shares.
Stock-Based Compensation
Pursuant to the Trust’s 2007 Long Term Stock Incentive Plan the Trust may, from time to time, issue stock-based compensation awards to certain eligible persons including those performing services for FUR Advisors LLC (“FUR Advisors”), the Trust’s external advisor. During 2013, the Trust issued 600,000 restricted common shares of beneficial interest. See Note 21 for further discussion. The Trust accounts for this stock-based compensation in accordance with ASC 505-50,Equity-Based Payments to Non-Employees. Until the awards are no longer subject to forfeiture, the Trust measures stock-based compensation expense at each reporting date for any changes in fair value and recognizes the expense prorated for the portion of the requisite service period completed.
Earnings Per Share
The Trust determines basic earnings per share based on the weighted average number of common shares of beneficial interest (“Common Shares”) outstanding during the period and reflects the impact of participating securities. Prior to November 18, 2011, when the Trust repurchased 100% of the Series B-1 Preferred Shares and the Series C Preferred Shares, the holders of the Trust’s Series B-1 Preferred Shares and the Series C Preferred Shares were entitled to receive cumulative preferential dividends on a quarterly basis equal to the greater of (i) $0.40625 per share quarterly (6.5% of the liquidation preference on an annualized basis) or (ii) cash dividends payable on the number of Common Shares into which the Series B-1 Preferred Shares and Series C Preferred Shares (assuming for this purpose that the conversion price of the Series C Preferred Shares equals the conversion price of the Series B-1 Preferred Shares) were convertible. The Trust computes diluted earnings per share based on the weighted average number of Common Shares outstanding combined with the incremental weighted average effect from all outstanding potentially dilutive instruments.
76
The Trust has calculated earnings per share in accordance with relevant accounting guidance for participating securities and the two class method. The reconciliation of earnings attributable to Common Shares outstanding for the basic and diluted earnings per share calculation is as follows (in thousands, except per share data):
| | | | | | | | | | | | |
| | | 2013 | | | 2012 | | | 2011 | |
Basic | | | | | | | | | | | | |
Income from continuing operations | | $ | 16,821 | | | $ | 24,502 | | | $ | 11,398 | |
(Income) loss attributable to non-controlling interest | | | 4,290 | | | | 247 | | | | (814 | ) |
Preferred dividend of Series C Preferred Shares | | | — | | | | — | | | | (585 | ) |
Preferred dividend of Series D Preferred Shares | | | (11,146 | ) | | | (9,285 | ) | | | (339 | ) |
Amount allocated to Restricted Shares | | | (307 | ) | | | — | | | | — | |
| | | | | | | | | | | | |
Income from continuing operations applicable to Common Shares | | | 9,658 | | | | 15,464 | | | | 9,660 | |
Income (loss) from discontinued operations | | | 7,667 | | | | (118 | ) | | | 349 | |
| | | | | | | | | | | | |
Net income applicable to Common Shares for earnings per share purposes | | $ | 17,325 | | | $ | 15,346 | | | $ | 10,009 | |
| | | | | | | | | | | | |
| | | |
Basic weighted-average Common Shares | | | 33,743 | | | | 33,062 | | | | 31,428 | |
| | | | | | | | | | | | |
| | | |
Income from continuing operations | | $ | 0.28 | | | $ | 0.46 | | | $ | 0.31 | |
Income (loss) from discontinued operations | | | 0.23 | | | | — | | | | 0.01 | |
| | | | | | | | | | | | |
Net income per Common Share - basic | | $ | 0.51 | | | $ | 0.46 | | | $ | 0.32 | |
| | | | | | | | | | | | |
| | | |
Diluted | | | | | | | | | | | | |
Income from continuing operations | | $ | 16,821 | | | $ | 24,502 | | | $ | 11,398 | |
(Income) loss attributable to non-controlling interest | | | 4,290 | | | | 247 | | | | (814 | ) |
Preferred dividend of Series C Preferred Shares | | | — | | | | — | | | | (585 | ) |
Preferred dividend of Series D Preferred Shares | | | (11,146 | ) | | | (9,285 | ) | | | (339 | ) |
Amount allocated to Restricted Shares | | | (307 | ) | | | — | | | | — | |
| | | | | | | | | | | | |
Income from continuing operations applicable to Common Shares | | | 9,658 | | | | 15,464 | | | | 9,660 | |
Income (loss) from discontinued operations | | | 7,667 | | | | (118 | ) | | | 349 | |
| | | | | | | | | | | | |
Net income applicable to Common Shares for earnings per share purposes | | $ | 17,325 | | | $ | 15,346 | | | $ | 10,009 | |
| | | | | | | | | | | | |
| | | |
Basic weighted-average Common Shares | | | 33,743 | | | | 33,062 | | | | 31,428 | |
Series B-1 Preferred Shares (1) | | | — | | | | — | | | | — | |
Series C Preferred Shares (2) | | | — | | | | — | | | | — | |
Stock options (3) | | | — | | | | — | | | | — | |
Restricted Shares (4) | | | 31 | | | | — | | | | — | |
| | | | | | | | | | | | |
Diluted weighted-average Common Shares | | | 33,774 | | | | 33,062 | | | | 31,428 | |
| | | | | | | | | | | | |
| | | |
Income from continuing operations | | $ | 0.28 | | | $ | 0.46 | | | $ | 0.31 | |
Income (loss) from discontinued operations | | | 0.23 | | | | — | | | | 0.01 | |
| | | | | | | | | | | | |
Net income per Common Share - diluted | | $ | 0.51 | | | $ | 0.46 | | | $ | 0.32 | |
| | | | | | | | | | | | |
| (1) | The Series B-1 Preferred Shares are anti-dilutive for the year ended December 31, 2011 and are not included in the weighted-average shares outstanding for the calculation of diluted earnings per Common Share. |
| (2) | The Series C Preferred Shares were anti-dilutive for the year ended December 31, 2011 are not included in the weighted-average shares outstanding for the calculation of diluted earnings per Common Share. |
| (3) | The Trust’s stock options were exercised in 2013. The resulting shares were included in the basic weighted average Common Shares. The Trust’s stock options were dilutive for the year ended December 31, 2012. The weighted-average stock options for the year ended December 31, 2012 were less than one thousand shares. The stock options were anti-dilutive for the year ended December 31, 2011 are not included in the weighted-average shares outstanding for the calculation of diluted earnings per Common Share. |
| (4) | The Trust’s Restricted Shares were issued in 2013 and were dilutive for the year ended December 31, 2013. |
77
Recently Issued Accounting Standards
On February 5, 2013, FASB issued ASU No. 2013-02: Comprehensive Income (Topic 220): Reporting of Amounts Reclassified Out of Accumulated Other Comprehensive Income, to improve the transparency of reporting the reclassifications of significant amounts out of accumulated other comprehensive income. This guidance requires entities to present the effects on the line items of net income of significant reclasses from accumulated other comprehensive income, either where net income is presented or in the notes, as well as cross-reference to other disclosures currently required under U.S. GAAP for other reclassification items (that are not required under U.S. GAAP) to be reclassified directly to net income in their entirety in the same reporting period. The new disclosure requirements are effective for annual reporting periods beginning on or after January 1, 2013. The new disclosures are required for both interim and annual reporting. The adoption did not have a material impact on the Trust’s consolidated financial statements.
On December 16, 2011, FASB issued ASU No. 2011-11:Balance Sheet (Topic 210)—Disclosures about Offsetting Assets and Liabilities which requires entities to disclose both gross information and net information about both instruments and transactions eligible for offset in the financial statements particularly for transactions related to derivatives, sale and repurchase agreements and reverse sale and repurchase agreements, and securities borrowing and securities lending arrangements. The new disclosure requirements are effective for annual reporting periods beginning on or after January 1, 2013. The new disclosures are required for all prior comparative periods presented. The adoption did not have a material impact on the Trust’s consolidated financial statements as there was no collateral received or posted related to the Trust’s derivatives.
| 3. | Fair Value Measurements |
The accounting standards establish a framework for measuring fair value as well as disclosures about fair value measurements. They emphasize that fair value is a market based measurement, not an entity-specific measurement. Therefore a fair value measurement should be determined based on the assumptions that market participants would use in pricing the asset or liability. As a basis for considering market participant assumptions in fair value measurements, the standards establish a fair value hierarchy that distinguishes between market participant assumptions based on market data obtained from sources independent of the reporting entity (observable inputs that are classified within Levels 1 and 2 of the hierarchy) and the reporting entity’s own assumptions about market participant assumptions (unobservable inputs classified within Level 3 of the hierarchy).
Level 1 inputs utilize unadjusted quoted prices in active markets for identical assets or liabilities that the Trust has the ability to access. Level 2 inputs are inputs other than quoted prices included in Level 1 that are observable for the asset or liability, either directly or indirectly. Level 2 inputs may include quoted prices for similar assets and liabilities in active markets, as well as inputs that are observable for the asset or liability other than quoted prices, such as interest rates, foreign exchange rates, and yield curves that are observable at commonly quoted intervals. Level 3 inputs are unobservable inputs for the asset or liability which are typically based on an entity’s own assumptions, as there is little, if any, related market activity. In instances where the determination of the fair value measurement is based on inputs from different levels of the fair value hierarchy, the level in the fair value hierarchy within which the entire fair value measurement falls is based on the lowest level input that is significant to the fair value measurement in its entirety. The Trust’s assessment of the significance of a particular input to the fair value measurement in its entirety requires judgment, and considers factors specific to the asset or liability.
Level 1 financial investments include highly liquid government bonds, mortgage products and exchange-traded equities. If quoted market prices are not available, then fair values are estimated by using pricing models, quoted prices of securities with similar characteristics, or discounted cash flows. Examples of such instruments, which would generally be classified within Level 2 of the valuation hierarchy, include certain derivative financial instruments. In certain cases where there is limited activity or less transparency around inputs to the valuation, securities are classified within Level 3 of the valuation hierarchy. Securities classified within Level 3 include, for example, residual interests in securitizations and other less liquid securities, investments in joint ventures and real estate investments.
The following is a description of the valuation methodologies used for instruments measured at fair value, as well as the general classification of such instruments pursuant to the valuation hierarchy.
Recurring Measurements
Securities Carried at Fair Value
Securities carried at fair value are classified within Level 1 of the fair value hierarchy.
78
Loan Securities Carried at Fair Value
The Trust uses a third party pricing model to establish values for the loan securities in its portfolio. The Trust also performs further analysis of the performance of the loans and collateral underlying the securities, the estimated value of the collateral supporting such loans and a consideration of local, industry and broader economic trends and factors. Significant judgment is utilized in the ultimate determination of fair value. The significant assumptions used in this analysis include market interest rates and interest rate spreads. This valuation methodology has been characterized as Level 3 in the fair value hierarchy.
Derivative Financial Instruments
The Trust uses interest rate swaps and interest rate caps to manage its interest rate risk. The valuation of these instruments is determined using both quantitative and qualitative valuation techniques including discounted cash flow analysis on the expected cash flows of each derivative as well as potential credit risks with the swap counterparty. This analysis reflects the contractual terms of the derivatives, including the period to maturity, and uses observable market-based inputs, including interest rate curves, and implied volatilities. The fair values of interest rate swaps and interest rate caps are determined using the market standard methodology of netting the discounted future fixed cash receipts (or payments) and the discounted expected variable cash payments (or receipts). The variable cash payments (or receipts) are based on an expectation of future interest rates (forward curves) derived from observable market interest rate curves.
The Trust incorporates credit valuation adjustments to appropriately reflect both its own nonperformance risk and the respective counterparty’s nonperformance risk in the fair value measurements. In adjusting the fair value of its derivative contracts for the effect of nonperformance risk, the Trust has considered the impact of netting as well as any applicable credit enhancements, such as collateral postings, thresholds, mutual puts and guarantees.
Although the Trust has determined that the majority of the inputs used to value its derivatives fall within Level 2 of the fair value hierarchy, the credit valuation adjustments associated with its derivatives utilize Level 3 inputs, such as estimates of current credit spreads, to evaluate the likelihood of default by itself and its counterparties. However, the Trust has assessed the significance of the impact of the credit valuation adjustments on the overall valuation of its derivative positions and has determined that the credit valuation adjustments are not significant to the overall valuation of its derivatives. As a result, the Trust has determined that the derivative valuations in their entirety should be classified in Level 2 of the fair value hierarchy.
The table below presents the Trust’s assets and liabilities measured at fair value on a recurring basis as of December 31, 2013, according to the level in the fair value hierarchy within which those measurements fall (in thousands):
| | | | | | | | | | | | | | | | |
Recurring Basis | | Quoted Prices in
Active Markets for
Identical Assets and
Liabilities (Level 1) | | | Significant Other
Observable Inputs
(Level 2) | | | Significant
Unobservable
Inputs (Level 3) | | | Total | |
Assets | | | | | | | | | | | | | | | | |
Loan securities carried at fair value | | $ | — | | | $ | — | | | $ | 226 | | | $ | 226 | |
Interest rate hedges | | | — | | | | 316 | | | | — | | | | 316 | |
| | | | | | | | | | | | | | | | |
| | $ | — | | | $ | 316 | | | $ | 226 | | | $ | 542 | |
| | | | | | | | | | | | | | | | |
79
The table below presents the Trust’s assets and liabilities measured at fair value on a recurring basis as of December 31, 2012, according to the level in the fair value hierarchy within which those measurements fall (in thousands):
| | | | | | | | | | | | | | | | |
Recurring Basis | | Quoted Prices in
Active Markets for
Identical Assets and
Liabilities (Level 1) | | | Significant Other
Observable Inputs
(Level 2) | | | Significant
Unobservable
Inputs (Level 3) | | | Total | |
Assets | | | | | | | | | | | | | | | | |
Securities carried at fair value | | $ | 19,694 | | | $ | — | | | $ | — | | | $ | 19,694 | |
Loan securities carried at fair value | | | — | | | | — | | | | 11 | | | | 11 | |
Interest rate hedges | | | — | | | | 8 | | | | — | | | | 8 | |
| | | | | | | | | | | | | | | | |
| | $ | 19,694 | | | $ | 8 | | | $ | 11 | | | $ | 19,713 | |
| | | | | | | | | | | | | | | | |
There were no inter-level transfers of assets or liabilities during the years ended December 31, 2013 and 2012.
The table below includes a roll forward (in thousands) of the balance sheet amounts from January 1, 2011 to December 31, 2013, including the change in fair value, for financial instruments classified by the Trust within Level 3 of the valuation hierarchy. When a determination is made to classify a financial instrument within Level 3 of the valuation hierarchy, the determination is based upon the significance of the unobservable factors to the overall fair value measurement.
| | | | |
| | | Loan Securities
Carried at Fair
Value | |
Fair value, January 1, 2011 | | $ | 11,981 | |
Purchases | | | — | |
Sale/repayment | | | (662 | ) |
Payoff at par | | | (8,748 | ) |
Realized gain | | | — | |
Unrealized gain | | | 2,738 | |
Transfers in/and or out of Level 3 | | | — | |
| | | | |
Fair value, December 31, 2011 | | | 5,309 | |
| | | | |
Purchases | | | — | |
Sale/repayment | | | (6,359 | ) |
Realized gain | | | 614 | |
Unrealized gain | | | 447 | |
Transfers in and/or out of Level 3 | | | — | |
| | | | |
Fair value, December 31, 2012 | | | 11 | |
| | | | |
Purchases | | | — | |
Sale/repayment | | | — | |
Realized gain | | | — | |
Unrealized gain | | | 215 | |
Transfers in and/or out of Level 3 | | | — | |
| | | | |
Fair value, December 31, 2013 | | $ | 226 | |
| | | | |
80
| | | | | | | | |
| | | Year Ended
December 31, 2013 | | | Year Ended
December 31, 2012 | |
| | |
The amount of total gains or losses for the period included in earnings attributable to the change in unrealized gains or losses relating to assets still held at the reporting date | | $ | 215 | | | $ | 23 | |
| | | | | | | | |
Quantitative Information about Level 3 Fair Value Measurements
At December 31, 2013 the Trust held only one loan security which is valued at $226,000, or 20% of face value. The valuation reflects assumptions that would be considered by market participants along with management’s assessment of collectible future cash flows.
Non-Recurring Measurements
Equity and Preferred Equity Investments
Equity and preferred equity investments are assessed for other-than-temporary impairment when the carrying value of the Trust’s investment exceeds its fair value. The fair value of equity investments is determined using a discounted cash flow model which incorporates a residual value utilizing an income capitalization approach considering prevailing market capitalization rates. The Trust reviews each investment based on the highest and best use of the investment and market participation assumptions. The significant assumptions used in this analysis include rental revenues, operating expenses, inflation rates, market absorption rates, tenanting costs, the discount rate and capitalization rates used in the income capitalization valuation. The Trust has determined that the significant inputs used to value its Marc Realty and Sealy equity investments fall within Level 3. The Trust recognized other-than-temporary impairment losses of $7,687,000, $0, and $21,058,000, on these investments during the years ended December 31, 2013, 2012 and 2011, respectively. See Note 8-Equity Investments for further details on these impairments.
The Trust has determined that the significant inputs used to value certain of its preferred equity investments fall within Level 3. There were no impairment losses recorded on these preferred equity investments during the years ended December 31, 2013, 2012 and 2011.
Investments in Real Estate and Assets Held For Sale
During 2013, 2012, and 2011 the Trust recognized impairment charges of $2,904,000, $3,260,000 and $7,600,000, respectively, relative to investments in real estate and assets held for sale. The Trust assesses the assets in its portfolio for recoverability based upon a determination of the existence of impairment indicators including significant decreases in market pricing and market rents, a change in the extent or manner in which real estate assets are being used or a decline in their physical condition, current period losses combined with a history of losses or a projection of continuing losses, and a current expectation that real estate assets will be sold or otherwise disposed of before the end of their previously estimated useful lives. When such impairment indicators exists, management estimates the undiscounted cash flows from the expected use and disposition of the asset. Significant inputs for this recoverability analysis include the anticipated holding period for the asset as well as assumptions over rental revenues, operating expenses, inflation rates, market absorption rates, tenanting and other capital improvement costs and the asset’s estimated residual value. For those assets not deemed to be fully recoverable, the Trust records an impairment charge equal to the difference between the carrying value and estimated fair value of the asset less costs to sell the asset. Management determines the fair value of those assets using an income valuation approach based on assumptions it believes a market participant would utilize. Significant assumptions include discount and capitalization rates used in the income valuation approach.
The Trust’s Memphis, Tennessee property was placed into discontinued operations during the period ended September 30, 2012. The carrying value of the property exceeded the fair value less costs to sell resulting in a $698,000 impairment charge.
At December 31, 2012 the Trust re-evaluated its business plan and revised its holding period for two assets in the operating properties segment. As a result, it was determined that due to the shorter hold period, the carrying value of the Atlanta, Georgia and Denton, Texas properties were no longer fully recoverable. Impairment charges of $1,738,000 and $824,000 were recorded on the Atlanta, Georgia and Denton, Texas assets, respectively.
81
During the quarter ended June 30, 2013 the Trust entered into a purchase and sale agreement on its Denton, Texas property. At June 30, 2013 the purchase deposit was non-refundable and it was probable that the sale would be consummated. As a result the property was classified as held for sale at June 30, 2013. A fair value measurement was prepared based on the purchase contract less costs to sell and a $154,000 impairment charge was recorded at June 30, 2013. The property was sold on July 2, 2013.
In light of continued leasing challenges and specific sub-market dynamics, at September 30, 2013 the Trust re-evaluated its business plan and revised its holding period for its operating property in Lisle, Illinois referred to as 701 Arboretum. As a result, it was determined that due to the shorter holding period, the carrying value of the 701 Arboretum property was no longer fully recoverable. The Trust had previously recorded a $3,000,000 impairment charge in 2011 as a result of continued declines in occupancy. The Trust recorded an additional $2,750,000 impairment charge in 2013 as a result of the purchase contract. The property was sold on December 17, 2013.
The table below presents the Trust’s assets and liabilities measured at fair value as of December 31, 2013, according to the level in the fair value hierarchy within which those measurements fall (in thousands):
| | | | | | | | | | | | | | | | |
Non-Recurring Basis | | Quoted Prices in
Active Markets for
Identical Assets and
Liabilities (Level 1) | | | Significant Other
Observable Inputs
(Level 2) | | | Significant
Unobservable
Inputs (Level 3) | | | Total | |
| | | | |
Equity Investments | | $ | — | | | $ | — | | | $ | 6,751 | | | $ | 6,751 | |
Assets held for sale | | | — | | | | — | | | | — | | | | — | |
| | | | | | | | | | | | | | | | |
| | $ | — | | | $ | — | | | $ | 6,751 | | | $ | 6,751 | |
| | | | | | | | | | | | | | | | |
The table below presents the Trust’s assets and liabilities measured at fair value as of December 31, 2012 according to the level in the fair value hierarchy within which those measurements fall (in thousands):
| | | | | | | | | | | | | | | | |
Non-Recurring Basis | | Quoted Prices in
Active Markets for
Identical Assets and
Liabilities (Level 1) | | | Significant Other
Observable Inputs
(Level 2) | | | Significant
Unobservable
Inputs (Level 3) | | | Total | |
| | | | |
Investments in real estate | | $ | — | | | $ | — | | | $ | 3,733 | | | $ | 3,733 | |
| | | | | | | | | | | | | | | | |
| | $ | — | | | $ | — | | | $ | 3,733 | | | $ | 3,733 | |
| | | | | | | | | | | | | | | | |
The following table provides quantitative information about the significant unobservable inputs used for non-recurring fair value measurements categorized within Level 3 at December 31, 2013. Fair value measurements related to impairments involve Level 3 inputs.
| | | | | | | | | | | | |
| | | Assets
Measured at
Fair Value
(in thousands) | | | Valuation Technique | | Unobservable Input | | Input Range | | Weighted
Average |
Equity Investment | | $ | 6,551 | | | Indicative Bids (1) | | Indicative Bids | | N/A | | N/A |
| | | | | |
Equity Investment | | $ | 150 | | | Indicative Bids (1) | | Indicative Bids | | N/A | | N/A |
| | | | | |
Equity Investment | | $ | 50 | | | Indicative Bids (1) | | Indicative Bids | | N/A | | N/A |
| (1) | This fair value measurement was developed from a purchase contract currently in negotiation. |
82
Financial Instruments Not Reported at Fair Value
The carrying value and estimated fair value of financial instruments not recorded at fair value on a recurring basis but required to be disclosed at fair value were as follows (in thousands):
| | | | | | | | | | | | | | | | | | | | |
| | | December 31, 2013 | |
| | | | | | | | | Fair value hierarchy level | |
| | | Carrying | | | | | | | | | | | | | |
| | | Amount | | | Fair Value | | | Level 1 | | | Level 2 | | | Level 3 | |
| | | | | |
Loans receivable | | $ | 101,100 | | | $ | 105,045 | | | $ | — | | | $ | — | | | $ | 105,045 | |
Secured financing receivable | | | 30,728 | | | | 30,728 | | | | — | | | | — | | | | 30,728 | |
Mortgage loans payable | | | 444,933 | | | | 444,785 | | | | — | | | | — | | | | 444,785 | |
Senior notes payable | | | 86,250 | | | | 86,940 | | | | 86,940 | | | | — | | | | — | |
Secured financings | | | 29,150 | | | | 29,327 | | | | — | | | | — | | | | 29,327 | |
Notes payable | | | 1,742 | | | | 1,742 | | | | — | | | | — | | | | 1,742 | |
| | | | | | | | | | | | | | | | | | | | |
| | | December 31, 2012 | |
| | | | | | | | | Fair value hierarchy level | |
| | | Carrying | | | | | | | | | | | | | |
| | | Amount | | | Fair Value | | | Level 1 | | | Level 2 | | | Level 3 | |
| | | | | |
Loans receivable | | $ | 211,250 | | | $ | 222,246 | | | $ | — | | | $ | — | | | $ | 222,246 | |
Mortgage loans payable | | | 280,576 | | | | 270,923 | | | | — | | | | — | | | | 270,923 | |
Senior notes payable | | | 86,250 | | | | 89,183 | | | | 89,183 | | | | — | | | | — | |
Secured financings | | | 52,920 | | | | 53,253 | | | | — | | | | — | | | | 53,253 | |
Notes payable | | | 1,676 | | | | 1,676 | | | | — | | | | — | | | | 1,676 | |
Fair Value Option
The current accounting guidance for fair value measurement provides a fair value option election that allows companies to irrevocably elect fair value as the measurement attribute for certain financial assets and liabilities. Changes in fair value for assets and liabilities for which the election is made are recognized in earnings on a quarterly basis based on the then market price regardless of whether such assets or liabilities have been disposed of at such time. The fair value option guidance permits the fair value option election to be made on an instrument by instrument basis when it is initially recorded or upon an event that gives rise to a new basis of accounting for that asset or liability. The Trust has elected the fair value option for all loan securities and REIT securities.
The Trust recognized a net unrealized gain of $73,000, $7,363,000 and $5,526,000 for the years ended December 31, 2013, 2012 and 2011 respectively, as a result of the change in fair value of the securities and loan securities carried at fair value, which is recorded as an unrealized gain in the Trust’s Consolidated Statements of Operations. Income related to securities carried at fair value is recorded as interest and dividend income.
83
The following table presents as of December 31, 2013 and December 31, 2012 the Trust’s financial assets for which the fair value option was elected (in thousands):
| | | | | | | | |
Financial Instruments at Fair Value | | December 31, 2013 | | | December 31, 2012 | |
| | |
Assets | | | | | | | | |
Securities carried at fair value: | | | | | | | | |
REIT Common shares | | $ | — | | | $ | 19,694 | |
Loan securities carried at fair value | | | 226 | | | | 11 | |
| | | | | | | | |
| | $ | 226 | | | $ | 19,705 | |
| | | | | | | | |
The table below presents as of December 31, 2013 the difference between fair values and the aggregate contractual amounts due for which the fair value option has been elected (in thousands):
| | | | | | | | | | | | |
| | | Fair Value at
December 31, 2013 | | | Amount Due
Upon Maturity | | | Difference | |
| | | |
Assets | | | | | | | | | | | | |
| | | |
Loan securities carried at fair value | | $ | 226 | | | $ | 1,130 | | | $ | 904 | |
| | | | | | | | | | | | |
| | $ | 226 | | | $ | 1,130 | | | $ | 904 | |
| | | | | | | | | | | | |
| 4. | Acquisition, Disposition, Leasing and Financing Activities |
Operating Properties
Operating Properties - Acquisition and Financing Activities
1515 Market Street – loan modification, equity acquisition and refinancing – On December 12, 2012, the Trust acquired for $58,650,000 a $70,000,000 non-performing first mortgage loan collateralized by a 20 story, 514,000 square foot office building located at 1515 Market Street, Philadelphia, Pennsylvania (“1515 Market Street”). On February 1, 2013 the Trust entered into a loan modification agreement which extended the maturity date to February 1, 2016, increased the loan balance to $71,629,000, from $70,000,000, and changed the interest rate to be the greater of 7.5% or LIBOR plus 6.5%.
Simultaneously with the modification of the loan, the Trust acquired, for $10,000, an indirect 49% equity interest in the entity (“1515 Market Owner”) that owns 1515 Market Street and the general partner interest in 1515 Market Owner. Management has determined that this entity is a variable interest entity (“VIE”) and the Trust is the primary beneficiary of the VIE. As a result, the Trust has consolidated this property as of February 1, 2013. All intercompany transactions have been eliminated in consolidation. For segment reporting purposes, this investment will be classified within the operating properties segment as of February 1, 2013. Prior to consolidation, the investment was part of the loan asset segment.
On April 25, 2013 1515 Market Owner obtained a $43,000,000 non-recourse first mortgage loan (the “1515 First Mortgage”) from an unaffiliated third party. The 1515 First Mortgage bears interest at LIBOR plus 2.0% per annum, requires monthly payments of interest only and matures on May 1, 2016. On the same date, the 1515 Market Owner entered into an interest rate swap agreement which effectively fixes LIBOR at 0.50% for the term of the 1515 First Mortgage. The Trust received $38,472,000 of loan proceeds from the 1515 First Mortgage financing which reduced the balance on the mortgage loan it holds to $33,157,000. The loan balance can be increased through future funding advances up to an aggregate of $6,000,000 to cover tenant improvements, capital expenditures and leasing commissions. For each $500,000 of future advances, the interest rate increases by 0.10%. As of December 31, 2013 the Trust had advanced an additional $1,500,000 resulting in a 0.3% increase in the interest rate. The loan modification also provides the Trust with a 40% participation interest in the case of a capital event. At December 31, 2013 the loan the Trust holds had a balance of $36,171,000 inclusive of accrued interest, and entitles it to interest in an amount equal to a rate of 14.3% (subject to increase by 0.10% for each additional $500,000 advance by the Trust). At December 31, 2013 the Trust’s investment in this loan was $21,098,000 resulting in an effective interest rate on its cash investment in this asset of 19.6%.
84
Summit Pointe Apartments – property acquisition – On October 25, 2013 the Trust contributed $4,962,000 for an 80% equity interest in a newly formed venture. On the same date, the venture acquired a 184 unit garden apartment complex known as Summit Pointe Apartments located in Oklahoma City, Oklahoma for a gross purchase price of $14,500,000. In connection with the acquisition, the venture assumed an existing $9,248,000 first mortgage loan. The loan bears interest at a rate of 5.7% per annum, requires monthly payments of principal and interest and matures in February 2021. Pursuant to the terms of the venture agreement, the Trust holds an equity interest which entitles the Trust to an 8% priority return from cash flow and, upon disposition of the property, a minimum priority return equal to a 12% IRR. The Trust is the managing member of the venture and has a majority voting interest. The Trust has control akin to that of a general partner and therefore consolidates the venture as of October 25, 2013, the date of acquisition.
Luxury Residential – property acquisition – On October 31, 2013 the Trust acquired through a wholly owned venture four newly constructed luxury apartment buildings for an aggregate purchase price of $246,000,000. The properties are located in Phoenix, Arizona; Stamford, Connecticut; Houston, Texas and San Pedro, California. The properties consist of an aggregate of 761 unsold residential condominium or apartment units and approximately 25,000 square feet of retail space. The acquisition was funded with a $150,000,000 first mortgage loan which is cross collateralized by all four properties. The loan bears interest at a rate of LIBOR plus 2%, requires monthly payments of interest only and matures on October 31, 2016 with two one year extension options. The balance of the purchase was funded from cash on hand. On the same date, the venture entered into an interest rate swap agreement which effectively fixes LIBOR at 0.69% for the initial term of the first mortgage. In addition, the venture acquired two interest rate caps, each with a notional amount of $50,000,000 for an aggregate cost of $390,000. The initial cap is effective for the first one year extension period and caps LIBOR at 4%. The second cap is effective for the second one year extension period and caps LIBOR at 5%.
On November 6, 2013, New Valley LLC (“New Valley”) contributed approximately $16,365,000 to the entity that acquired the properties in exchange for an indirect 16.3% interest in the properties. The Trust retained an 83.7% interest in the venture and has the right to make all decisions with respect to each of the properties, other than the Stamford, Connecticut property, subject to obtaining New Valley’s consent to certain major decisions. New Valley has the right at any time after November 6, 2015 (or in certain instances prior thereto), but on or prior to November 6, 2016, to have its interest in the venture redeemed for a 50% interest in the Stamford, Connecticut property.
The following table summarizes the allocation of the aggregate purchase price of 1515 Market Street, Summit Pointe Apartments and Luxury Residential at their respective dates of acquisition (in thousands):
| | | | | | | | | | | | | | | | |
| | | 1515 Market Street | | | Summit Pointe
Apartments | | | Luxury Residential | | | Total | |
Land | | $ | 18,627 | | | $ | 1,328 | | | $ | 26,805 | | | $ | 46,760 | |
Building | | | 21,860 | | | | 11,962 | | | | 214,505 | | | | 248,327 | |
Other improvements | | | 73 | | | | 1,126 | | | | 197 | | | | 1,396 | |
Fixtures and equipment | | | — | | | | 263 | | | | 1,895 | | | | 2,158 | |
Tenant improvements | | | 1,407 | | | | — | | | | 72 | | | | 1,479 | |
Lease intangibles | | | 14,943 | | | | 283 | | | | 2,860 | | | | 18,086 | |
Above market lease intangibles | | | 2,867 | | | | — | | | | 49 | | | | 2,916 | |
Net working capital acquired | | | 1,132 | | | | 284 | | | | (2,096 | ) | | | 680 | |
Below market lease intangibles | | | (620 | ) | | | — | | | | (383 | ) | | | (1,003 | ) |
| | | | | | | | | | | | | | | | |
Total fair value of assets acquired | | | 60,289 | | | | 15,246 | | | | 243,904 | | | | 320,799 | |
Long term liabilities assumed | | | (60,279 | ) | | | (9,248 | ) | | | — | | | | (69,527 | ) |
Assumed debt premium | | | — | | | | (712 | ) | | | — | | | | (712 | ) |
| | | | | | | | | | | | | | | | |
Net assets acquired | | $ | 10 | | | $ | 5,286 | | | $ | 243,904 | | | $ | 250,560 | |
| | | | | | | | | | | | | | | | |
85
Intangible assets acquired and intangible liabilities assumed for 1515 Market Street, Summit Pointe Apartments and Luxury Residential consisted of the following (in thousands):
| | | | | | | | |
| | | Carrying
Value | | | Weighted
Average
Amortization
Period (years) | |
Intangible assets: | | | | | | | | |
In place lease intangibles | | $ | 9,435 | | | | 4.4 | |
Above market lease intangibles | | | 2,916 | | | | 6.0 | |
Tenant relationship value | | | 7,388 | | | | 13.3 | |
Lease commissions, legal and marketing fees | | | 1,263 | | | | 4.4 | |
| | | | | | | | |
| | |
Total | | $ | 21,002 | | | | 7.0 | |
| | | | | | | | |
Intangible liabilities: | | | | | | | | |
Below market lease intangibles | | $ | (1,003 | ) | | | 4.0 | |
| | | | | | | | |
1515 Market Street contributed approximately $9,488,000 of revenue and a loss of approximately $3,805,000 for the period from February 1, 2013 through December 31, 2013. Summit Pointe Apartments contributed approximately $335,000 of revenue and a loss from continuing operations of approximately $474,000 for the period from October 25, 2013 through December 31, 2013. Luxury Residential contributed approximately $3,874,000 of revenue and a loss of approximately $2,097,000 for the period from October 31, 2013 through December 31, 2013.
The accompanying unaudited pro forma information for the years ended December 31, 2013, 2012 and 2011 is presented as if the acquisition of (i) 1515 Market Street on February 1, 2013, (ii) Summit Pointe Apartments on October 25, 2013 and (iii) Luxury Residential on October 31, 2013, had occurred on January 1, 2012 and the acquisition of (i) Waterford Place on April 17, 2012, (ii) Cerritos on October 4, 2012 and (iii) Lake Brandt on November 2, 2012 had occurred on January 1, 2011. This unaudited pro forma information is based upon the historical consolidated financial statements and should be read in conjunction with the consolidated financial statements and notes thereto. This unaudited pro forma information does not purport to represent what the actual results of operations of the Trust would have been had the above occurred, nor do they purport to predict the results of operations of future periods.
| | | | | | | | | | | | |
| (In thousands, except for per share data) | | For the year ended
December 31, | | | | |
| | | 2013 | | | 2012 | | | 2011 | |
| | | |
Total revenue | | $ | 101,465 | | | $ | 112,694 | | | $ | 76,049 | |
Income from continuing operations | | | 8,890 | | | | 10,610 | | | | 8,299 | |
Net income attributable to Winthrop Realty Trust | | | 24,419 | | | | 17,519 | | | | 8,140 | |
Per common share data - basic | | | 0.72 | | | | 0.53 | | | | 0.23 | |
Per common share data - diluted | | | 0.72 | | | | 0.53 | | | | 0.23 | |
Amherst, New York –During 2013 the Trust acquired four residential parcels adjacent to its Amherst, New York office property for an aggregate purchase price of $896,000. The Trust is in the process of leveling the acquired parcels and expanding the parking area for the office property. Development of this property is expected to be completed during the second quarter of 2014. The total estimated cost to complete the development is $1,625,000, of which $482,000 has been incurred as of December 31, 2013.
Houston, Texas – Non Controlling Interest –During 2013 the Trust acquired two additional 1⁄4 limited partner units in 5400 Westheimer Holder LP (“Westheimer”) for an aggregate price of $150,000. As a result of these transactions, the Trust now owns 32% of Westheimer.
Churchill, Pennsylvania – financing - On June 28, 2013 the Trust obtained a $5,100,000 first mortgage on its Churchill, Pennsylvania property. The loan bears interest at a rate of 3.5% per annum, requires monthly payments of principal and interest and matures on August 1, 2024. After closing costs, the Trust received net proceeds of approximately $4,922,000.
86
Operating Property Activity through Equity Investments
WRT-Elad Lender/Equity (Sullivan Center) – loan modification, equity investment and refinancing - On February 18, 2013, WRT-Elad One South State Lender LP (“Lender LP”), the entity in which the Trust held a 50% interest and which holds the mezzanine loan indirectly secured by the property located at One South State Street, Chicago, Illinois known as the Sullivan Center (“Sullivan Center”), entered into a forbearance agreement with the borrower (the “Sullivan Borrower”). WRT-Elad One South State Equity LP (“Equity LP”), a venture in which the Trust holds a 50% interest, held a 65% indirect future interest in Sullivan Borrower. Pursuant to the forbearance agreement, Lender LP agreed to forbear from exercising any remedies as a result of Sullivan Borrower’s failure to pay debt service for the period from December 2012 through October 2013. In exchange for the forbearance, Equity LP’s indirect future interest in Sullivan Borrower increased by 11% (5% in February 2013 and an additional 6% in November 2013) to 76%, with a corresponding decrease in Sullivan Borrower’s general partner’s interest.
On August 21, 2013 the Trust acquired the 50% joint venture interest (the “Elad Interest”) in Lender LP that was held by Elad for $30,000,000 (“Acquisition Price”). The mezzanine loan had an outstanding balance of principal and accrued interest of approximately $56,150,000 at the time the Elad Interest was acquired. Concurrently with the acquisition of the Elad Interest, the Trust entered into an option agreement (the “Elad Option”) which grants Elad the option, but not the obligation, to repurchase the Elad Interest in Lender LP for the Acquisition Price adjusted for the pro-rata portion of any accrued and unpaid interest and principal payments made by the borrower. Per the terms of the agreements, the Elad Interest and Elad Option cannot be transferred to parties other than the Trust and Elad. The term of the Elad Option corresponds with Lender LP’s mezzanine loan. Given the nature of the Elad Option and the specific rights of Elad, the transaction is accounted for as a secured financing arrangement underASC 860-Transfers and Servicing. The Trust will recognize interest income on the secured financing receivable in accordance with GAAP, at an annual interest rate of 15%, and will continue to recognize equity income on its previously held 50% interest in the venture.
On October 18, 2013, Sullivan Center, which is wholly-owned by Sullivan Borrower, obtained a new $113,500,000 first mortgage loan. The loan bears interest at a rate of 3.95% per annum, requires monthly payments of interest only and matures on November 6, 2018. The proceeds from the loan were used to repay the existing $110,550,000 first mortgage loan which bore interest at a rate of 11.0% per annum.
Atrium Mall LLC – Equity Investment - On June 20, 2013 the Trust invested in a newly formed 50-50 joint venture with Marc Realty that acquired a non-performing $10,650,000 mortgage loan for $6,625,000. In addition, the joint venture paid $1,137,000 to fund escrows at the closing. The Trust invested a total of $3,935,000 in this joint venture during 2013. The loan was in maturity default at the time of acquisition and was acquired with the intention of foreclosing or working out a consensual assignment with the borrower. The loan was collateralized by a leasehold interest in the Atrium Mall in Chicago, Illinois. The leasehold interest is for 71,000 square feet of commercial/retail space that comprises the bottom three floors of an office building known as the James R. Thompson building of which the lease expires in September 2014 with six automatic five-year extensions which are exercisable at the lessee’s option. The building is owned by the State of Illinois.
On July 26, 2013 the joint venture entered into an agreement with the borrower pursuant to which the borrower conveyed the leasehold interest to the venture in lieu of foreclosure. Accordingly, the venture now holds the leasehold interest in the property. The conveyance of the leasehold interest does not change the ownership structure of Atrium Mall LLC or alter any of the members’ rights. The Trust will continue to account for its investment in Atrium Mall LLC under the equity method.
701 Seventh Avenue, New York, New York – Equity Investment – During 2013, with respect to the joint venture that indirectly owns the property located at 701 Seventh Avenue, New York, New York the Trust elected to participate in the future hotel development and during 2013, the Trust made additional cash contributions to the venture totaling $24,465,000. The Trust has contributed an additional $33,419,000 in 2014 bringing its total capital contributed to date to $86,855,000 against its total commitment of $125,000,000.
WRT-Fenway Wateridge – Mortgage Loan – On October 15, 2013, the Trust’s venture that holds this property obtained a $7,000,000 first mortgage loan on its San Diego, California property. The loan bears interest at the greater of 6%, or LIBOR plus 4.5% per annum, requires monthly payments of interest only and matures on November 1, 2016. The venture purchased an interest rate cap which caps LIBOR at 2.5%. In connection with the financing, the Trust received a distribution of $6,255,000 in partial redemption of its preferred equity investment. The Trust retains the balance of its preferred equity interest as well as a 50% equity interest in the venture.
87
Operating Property Disposition Activity
Andover, Massachusetts - property sale - On March 28, 2013 the Trust sold its Andover, Massachusetts office property to an independent third party for gross sale proceeds of $12,000,000. After costs and pro-rations, the Trust received net proceeds of approximately $11,425,000 and recorded a gain of $2,775,000 on the sale of the property.
Deer Valley, Arizona – property sale - On June 11, 2013 the Trust sold its Deer Valley, Arizona office property to an independent third party for gross sale proceeds of $20,500,000. After costs and pro-rations, the Trust received net proceeds of approximately $19,585,000 and recorded a gain of $6,745,000 on the sale of the property.
Denton, Texas – property sale - On July 2, 2013 the Trust sold its Denton, Texas retail property to an independent third party for gross sale proceeds of $1,850,000. After costs and pro-rations, the Trust received net proceeds of approximately $1,703,000. No gain or loss was recognized on the sale of the property.
Seabrook, Texas – property sale- On August 1, 2013 the Trust sold its Seabrook, Texas retail property to an independent third party for gross sale proceeds of $3,300,000. After costs and pro-rations, the Trust received net proceeds of approximately $3,202,000 and recorded a gain of $1,428,000 on the sale of the property.
Lisle, Illinois – property sale –On December 17, 2013 the Trust sold its Lisle, Illinois office property known as 701 Arboretum to an independent third party for gross sale proceeds of $2,500,000. After costs and pro-rations the Trust received net proceeds of approximately $2,351,000 and recorded a gain of $58,000 on the sale of the property.
Operating Property Dispositions through Equity Investments
Sealy Airpark – Nashville, Tennessee – foreclosure – On October 7, 2013 the lender foreclosed on the loan that was collateralized by this property. The Trust held its interest in this property through a venture that was managed by its partner and had previously written down its investment to zero. Accordingly, for financial reporting purposes the Trust did not recognize a gain or loss in connection with the foreclosure.
Sealy Newmarket – Atlanta, Georgia – foreclosure – On December 2, 2013 the lender foreclosed on the loan that was collateralized by this property. The Trust held its interest in this property through a venture that was managed by its partner and had previously written down its investment to zero. Accordingly, for financial reporting purposes the Trust did not recognize a gain or loss in connection with the foreclosure.
Operating Property Leasing Activity
Amherst, New York –On July 29, 2013 the Trust entered into a lease amendment with the existing tenant, Ingram Micro Inc., which leases the entire 200,000 square foot premises. The initial lease was signed in 1988 and was scheduled to expire October 31, 2013 (subject to two five-year extensions). The new lease extends the term through October 31, 2023 with one ten-year or two five-year renewal options. Lease payments under the amendment remained unchanged through the expiration of the original lease. Annual rents under the original lease were $2,016,000. Annual rents under the amended lease are $1,802,000 for the period November 1, 2013 through October 31, 2018 and $2,002,000 for the period November 1, 2018 through October 31, 2023. The base rent is subject to increase upon the delivery of additional parking area to the tenant.
Loans
Loan Asset Originations
Playa Vista, California – loan origination - On January 24, 2013 the Trust originated a $20,500,000 mezzanine loan collateralized by a 260,000 square foot office campus in the Los Angeles, California area. The loan is subordinate to an $80,300,000 mortgage loan, matures January 23, 2015, bears interest at LIBOR plus 14.25% per annum, with a 0.5% LIBOR floor and requires payments of interest only at a rate of 8.25% with the remaining interest being accrued and added to principal. In connection with the origination, the borrower paid the Trust an origination fee of $205,000. On March 1, 2013 the Trust sold a 50% pari passu participation interest in the loan to an independent third party for $10,250,000 and gave the transferee a credit of $100,000 from the initial loan origination.
88
Loan Asset Repayment Activity
Disney B Note – sale of participation - On January 25, 2013 the Trust sold for $9,000,000 a 100% participation interest in the $10,000,000 B Note collateralized by an office building located in Burbank, California. The selling price was equal to the Trust’s carrying value of the B Note.
127 West 25th Street – loan payoff - On March 1, 2013 the $8,583,000 loan collateralized by the property located at 127 West 25th Street, New York, New York was paid off in full at par.
180 N Michigan – loan payoff - On March 28, 2013 the $5,200,000 loan collateralized by the property located at 180 North Michigan Avenue, Chicago, Illinois was paid off in full at par.
Fenway Shea – loan payoff -On June 14, 2013 the $2,250,000 loan collateralized by the property located at Shea Blvd in Phoenix, Arizona was paid off in full at par.
Renaissance Walk – loan payoff –On October 31, 2013 the $3,000,000 loan collateralized by the property known as Renaissance Walk located in Atlanta, Georgia was paid off in full at par.
Queensridge Tower – loan payments –During 2013, several of the condominium units collateralizing the Queensridge Tower loan receivable were sold resulting in payments to the Trust of approximately $35,863,000. The Trust made corresponding pay downs of $23,770,000 in full satisfaction of its recourse debt with KeyBank which was collateralized by the Queensridge Tower loan receivable.
Loan Asset Activity through Equity Investments
RE CDO Management – asset sales - On February 20, 2013, RE CDO Management (“RE CDO”), an entity in which the Trust holds a 50% interest, sold its subordinated interests in, and collateral management agreement with respect to, Sorin CDO III for $2,750,000. On March 8, 2013 RE CDO sold its C Tranche subordinated interests in Sorin CDO IV for $6,240,000. As a result of the sales, the Trust received distributions of approximately $4,416,000 in the aggregate. The Trust’s share of the gain has been recorded as equity in earnings of this equity investment. RE CDO had originally acquired the sold assets and its interest in Sorin CDO IV, which it still retains, for $2,500,000.
CDH CDO LLC – sale of interest - On February 25, 2013 the Trust sold for $25,000 a 17% interest in the equity of CDH CDO, exclusive of the interest in the entity that holds the collateral management agreement of CDH CDO, to Inland American. As a result of the sale, the Trust now holds a 49.67% interest in CDH CDO. The Trust maintains 100% of CDH CDO’s interest in WRP Management. The sale of the interest did not affect the voting rights within CDH CDO and did not result in a change in control. The Trust will continue to account for its investment in CDH CDO under the equity method.
10 Metrotech Loan LLC – equity investment repayment – On July 30, 2013 the $40,000,000 loan collateralized by the property at 10 Metrotech Center, Brooklyn, New York and held by a venture in which the Trust held a one-third interest was paid off at par. The venture had acquired the loan in August 2012 for $32,500,000. As a result of the payoff, the Trust received a distribution from the venture of $13,333,000 and recorded equity in earnings of $2,676,000 in connection with its 33.33% ownership interest in the venture.
Concord Debt Holdings and CDH CDO – loan payoffs - Two of the underlying loans held by the Trust’s Concord ventures paid off during the third quarter of 2013. In July 2013 the loan collateralized by the property commonly referred to as Thanksgiving Tower located in Dallas, Texas was satisfied. In August 2013 the loan collateralized by the property referred to as One Riverwalk located in San Antonio, Texas was satisfied. As a result of the loan payoffs the Trust received an aggregate distribution of $6,470,000.
REIT Securities Activity
During 2013 the Trust liquidated all of its holdings of REIT Securities. In particular, the Trust sold 3,000,716 shares of common stock in Cedar Realty Trust, Inc. which it had acquired for an aggregate cost of $12,891,000 for aggregate sales proceeds of $16,292,000. The Trust also sold 1,250,000 of MPG Office Trust, Inc., which it had acquired for an aggregate cost of $2,980,000, for aggregate proceeds of $3,626,000.
89
The Trust’s loans receivable at December 31, 2013 and 2012 are as follows (in thousands):
| | | | | | | | | | | | | | | | | | |
| | | Loan Position | | Stated
Interest Rate | | | Carrying Amount | | | Contractual
Maturity
Date | |
Description | | | | December 31,
2013 | | | December 31,
2012 | | |
| | | | | |
Hotel Wales (5) | | Whole Loan | | | LIBOR + 4.0 | % (2) | | $ | 20,101 | | | $ | 20,101 | | | | 10/05/14 | |
The Shops at Wailea | | B-Note | | | 6.15 | % | | | 6,292 | | | | 5,376 | | | | 10/06/14 | |
Legacy Orchard (1) (5) | | Corporate Loan | | | 15.0 | % | | | 9,750 | | | | 9,750 | | | | 10/31/14 | |
Queensridge (6) | | Whole Loan | | | LIBOR + 11.5 | % (3) | | | 2,942 | | | | 39,170 | | | | 11/15/14 | |
San Marbeya (5) | | Whole Loan | | | 5.88 | % | | | 28,546 | | | | 27,149 | | | | 01/01/15 | |
Churchill (1) | | Whole Loan | | | LIBOR + 3.75 | % | | | 683 | | | | 683 | | | | 06/01/15 | |
1515 Market | | Whole Loan | | | | (4) | | | — | | | | 58,650 | | | | | (4) |
Playa Vista / Water’s Edge | | Mezzanine | | | LIBOR + 14.25 | % (3) | | | 10,327 | | | | — | | | | 01/23/15 | |
Rockwell (7) | | Mezzanine | | | 12.0 | % | | | — | | | | 323 | | | | 05/01/16 | |
500-512 7th Ave (5) | | B-Note | | | 7.19 | % | | | 10,250 | | | | 10,009 | | | | 07/11/16 | |
Pinnacle II | | B-Note | | | 6.31 | % | | | 4,648 | | | | 4,652 | | | | 09/06/16 | |
Popiu Shopping Village | | B-Note | | | 6.62 | % | | | 2,058 | | | | 1,948 | | | | 01/06/17 | |
Wellington Tower (5) | | Mezzanine | | | 6.79 | % | | | 2,991 | | | | 2,687 | | | | 07/11/17 | |
Mentor Building | | Whole Loan | | | 10.0 | % | | | 2,512 | | | | 2,512 | | | | 09/10/17 | |
Renaissance Walk (8) | | Mezzanine | | | — | | | | — | | | | 3,000 | | | | — | |
Fenway Shea (1) (8) | | Whole Loan | | | — | | | | — | | | | 2,273 | | | | — | |
127 West 25th Street (8) | | Mezzanine | | | — | | | | — | | | | 8,687 | | | | — | |
180 N. Michigan (8) | | Mezzanine | | | — | | | | — | | | | 5,237 | | | | — | |
The Disney Building (9) | | B-Note | | | — | | | | — | | | | 9,043 | | | | — | |
| | | | | | | | | | | | | | | | | | |
| | | | | | | | $ | 101,100 | | | $ | 211,250 | | | | | |
| | | | | | | | | | | | | | | | | | |
| (1) | The Trust determined that certain loans receivable are variable interests in VIEs primarily based on the fact that the underlying entities do not have sufficient equity at risk to permit the entity to finance its activities without additional subordinated financial support. The Trust does not have the power to direct the activities of the entity that most significantly impact the entity’s economic performance and is not required to consolidate the underlying entity. |
| (4) | This loan was in maturity default at the time of acquisition. The loan was modified on February 1, 2013. The Trust consolidates the operations of the borrower entity and the loan receivable is eliminated in consolidation. |
| (5) | These loans were sold to an independent third party in February 2014. See Note 26 - Subsequent Events for details on the sale. |
| (6) | This loan was paid off at par in January 2014. See Note 26 - Subsequent Events for details on the payoff. |
| (7) | Loan defaulted in December 2013. Carrying amount at December 31, 2013 reflects a $348 loan loss reserve. |
| (8) | The loans were satisfied during the year ended December 31, 2013. |
| (9) | Loan was sold during 2013. |
90
The carrying amount of loans receivable includes accrued interest of $501,000 and $1,016,000 at December 31, 2013 and December 31, 2012, respectively, and cumulative accretion of $6,488,000 and $2,527,000 at December 31, 2013 and December 31, 2012, respectively.
At December 31, 2013, the Trust’s loan receivables have accretable discount yet to be recognized as income totaling $5,782,000. At December 31, 2012, the Trust’s loan receivables had accretable discount yet to be recognized as income totaling $9,865,000.
The weighted average coupon on the Trust’s loans receivable was 6.55% and the weighted average yield to maturity was 11.59% at December 31, 2013. The weighted average coupon on the Trust’s loans receivable was 7.65% and the weighted average yield to maturity was 11.43% at December 31, 2012.
With the exception of the San Marbeya, Hotel Wales and Queensridge Tower loans receivable, none of the loans receivable are directly financed.
On November 15, 2012 the Trust obtained a $25,000,000 loan from KeyBank collateralized by the Queensridge Towers loan. The loan bears interest at LIBOR plus 4%, requires monthly payments of interest only and is co-terminous with the Queensridge Towers loan with a maturity date of November 15, 2014, subject to one, twelve month extension. Principal payments are required to be made in accordance with principal payments received on the Queensridge Tower loan. The KeyBank loan payable is recourse to the Trust and the Operating Partnership. As of September 30, 2013 the Trust has fully repaid the recourse secured financing.
Loan Receivable Activity
Activity related to loans receivable is as follows (in thousands):
| | | | | | | | |
| | | Year Ended
December 31,
2013 | | | Year Ended
December 31,
2012 | |
Balance at beginning of year | | $ | 211,250 | | | $ | 114,333 | |
Purchase and advances | | | 22,314 | | | | 175,550 | |
Interest (received) accrued, net | | | (514 | ) | | | 516 | |
Repayments / sale proceeds | | | (75,407 | ) | | | (68,824 | ) |
Elimination of 1515 Market Street in consolidation | | | (60,279 | ) | | | — | |
Loan accretion | | | 4,121 | | | | 8,333 | |
Discount accretion received in cash | | | (37 | ) | | | (15,720 | ) |
Provision for loss on loans receivable | | | (348 | ) | | | — | |
Conversion of 180 North Michigan loan to equity investments | | | — | | | | (2,938 | ) |
| | | | | | | | |
Balance at end of year | | $ | 101,100 | | | $ | 211,250 | |
| | | | | | | | |
The following table summarizes the Trust’s interest and dividend income for the years ended December 31, 2013, 2012 and 2011 (in thousands):
| | | | | | | | | | | | |
| | | 2013 | | | 2012 | | | 2011 | |
Interest and dividends detail: | | | | | | | | | | | | |
Interest on loan assets | | $ | 14,334 | | | $ | 11,736 | | | $ | 11,073 | |
Accretion of loan discount | | | 4,121 | | | | 8,333 | | | | 13,401 | |
Interest and dividends on REIT securities | | | — | | | | 1,054 | | | | 984 | |
| | | | | | | | | | | | |
Total interest and dividends | | $ | 18,455 | | | $ | 21,123 | | | $ | 25,458 | |
| | | | | | | | | | | | |
The San Marbeya loan and the Queensridge loan, each representing more than 10% of interest income, contributed approximately 34% of interest income of the Trust for the year ended December 31, 2013.
91
The 160 Spear loan and the San Marbeya loan, each representing more than 10% of interest income, contributed approximately 34% of interest income of the Trust for the year ended December 31, 2012. The 160 Spear loan and the Metropolitan Tower loan, each representing more than 10% of interest income, contributed approximately 48% of interest income of the Trust for the year ended December 31, 2011.
Credit Quality of Loans Receivable and Loan Losses
The Trust evaluates impairment on its loan portfolio on an individual basis and has developed a loan grading system for all of its outstanding loans that are collateralized directly or indirectly by real estate. Grading categories include debt yield, debt service coverage ratio, length of loan, property type, loan type, and other more subjective variables that include property or collateral location, market conditions, industry conditions, and sponsor’s financial stability. Management reviews each category and assigns an overall numeric grade for each loan to determine the loan’s risk of loss and to provide a determination as to whether an individual loan is impaired and whether a specific loan loss allowance is necessary. A loan’s grade of credit quality is determined quarterly.
All loans with a positive score do not require a loan loss allowance. Any loan graded with a neutral score or “zero” is subject to further review of the collectability of the interest and principal based on current conditions and qualitative factors to determine if impairment is warranted. Any loan with a negative score is deemed impaired and management then would measure the specific impairment of each loan separately using the fair value of the collateral less costs to sell.
Management estimates the loan loss allowance by calculating the estimated fair value less costs to sell of the underlying collateral securing the loan based on the fair value of the underlying collateral, and comparing the fair value to the loan’s net carrying value. If the fair value is less than the net carrying value of the loan, an allowance is created with a corresponding charge to the provision for loan losses. The allowance for each loan is maintained at a level the Trust believes is adequate to absorb losses.
The table below summarizes the Trust���s loans receivable by internal credit rating at December 31, 2013 (in thousands, except for number of loans).
| | | | | | | | | | | | | | | | | | | | | | | | | | | | | | | | |
Internal Credit Quality | | # of
Loans | | | Carrying
Value of
Loans
Receivable | | | # of
Loans | | | Whole
Loans | | | # of
Loans | | | B-Notes | | | # of
Loans | | | Mezzanine
Loans | |
| | | | | | | | |
Greater than zero | | | 11 | | | $ | 90,773 | | | | 6 | | | $ | 64,534 | | | | 4 | | | $ | 23,248 | | | | 1 | | | $ | 2,991 | |
Equal to zero | | | 1 | | | | 10,327 | | | | — | | | | — | | | | — | | | | — | | | | 1 | | | | 10,327 | |
Less than zero | | | 1 | | | | — | | | | — | | | | — | | | | — | | | | — | | | | 1 | | | | — | |
| | | | | | | | | | | | | | | | | | | | | | | | | | | | | | | | |
Subtotal | | | 13 | | | $ | 101,100 | | | | 6 | | | $ | 64,534 | | | | 4 | | | $ | 23,248 | | | | 3 | | | $ | 13,318 | |
| | | | | | | | | | | | | | | | | | | | | | | | | | | | | | | | |
The table below summarizes the Trust’s loans receivable by internal credit rating at December 31, 2012 (in thousands, except for number of loans).
| | | | | | | | | | | | | | | | | | | | | | | | | | | | | | | | |
Internal Credit Quality | | # of
Loans | | | Carrying
Value of
Loans
Receivable | | | # of
Loans | | | Whole
Loans | | | # of
Loans | | | B-Notes | | | # of
Loans | | | Mezzanine
Loans | |
| | | | | | | | |
Greater than zero | | | 18 | | | $ | 211,250 | | | | 8 | | | $ | 160,288 | | | | 5 | | | $ | 31,028 | | | | 5 | | | $ | 19,934 | |
Equal to zero | | | — | | | | — | | | | — | | | | — | | | | — | | | | — | | | | — | | | | — | |
Less than zero | | | — | | | | — | | | | — | | | | — | | | | — | | | | — | | | | — | | | | — | |
| | | | | | | | | | | | | | | | | | | | | | | | | | | | | | | | |
Subtotal | | | 18 | | | $ | 211,250 | | | | 8 | | | $ | 160,288 | | | | 5 | | | $ | 31,028 | | | | 5 | | | $ | 19,934 | |
| | | | | | | | | | | | | | | | | | | | | | | | | | | | | | | | |
92
Non Performing Loans
The Trust considers a loan to be non-performing and places loans on non-accrual status at such time as management determines it is probable that it will be unable to collect all amounts due according to the contractual terms of the loan. While on non-accrual status, based on the Trust’s judgment as to collectability of principal, loans are either accounted for on a cash basis, where interest income is recognized only upon actual receipt of cash, or on a cost-recovery basis, where all cash receipts reduce a loan’s carrying value. If and when a loan is brought back into compliance with its contractual terms, the Trust will resume accrual of interest.
As of December 31, 2013 there was one non-performing loan with past due payments. There was $348,000 of provision for loan loss recorded during the years ended December 31, 2013.
As of December 31, 2012 there were no non-performing loans and no past due payments. There was no provision for loan loss recorded during the years ended December 31, 2012 and 2011.
Secured Financing Receivable
In August 2013 the Trust closed on an agreement to acquire Elad’s 50% interest in Lender LP for $30,000,000. In connection with the transaction, the Trust entered into an option agreement with Elad granting Elad the right, but not obligation, to repurchase the interest in the venture. The option agreement provides Elad, as the transferor, the option to unilaterally cause the return of the asset at the earlier of two years from August 21, 2013 or an event of default on Lender LP’s mezzanine debt. As such, Elad is able to retain control of its interest in Lender LP for financial reporting purposes as the exercise of the option is unconditional other than for the passage of time. As a result, for financial reporting purposes, the transfer of the financial asset is accounted for as a secured financing rather than an acquisition. The $30,000,000 acquisition price is recorded as a secured financing receivable. The Trust will recognize interest income on the secured financing receivable on an accrual basis in accordance with GAAP, at an annual interest rate of 15%. The Trust recorded $1,386,000 of interest income during the year ended December 31, 2013.
| 6. | Securities and Loan Securities Carried at Fair Value |
Securities and loan securities carried at fair value are summarized in the table below (in thousands):
| | | | | | | | | | | | | | | | |
| | | 2013 | | | 2012 | |
| | | Cost | | | Fair Value | | | Cost | | | Fair Value | |
| | | | |
REIT Common shares | | $ | — | | | $ | — | | | $ | 15,876 | | | $ | 19,694 | |
| | | | | | | | | | | | | | | | |
| | $ | — | | | $ | — | | | $ | 15,876 | | | $ | 19,694 | |
| | | | | | | | | | | | | | | | |
| | | | |
Loan securities | | $ | 161 | | | $ | 226 | | | $ | 161 | | | $ | 11 | |
| | | | | | | | | | | | | | | | |
| | $ | 161 | | | $ | 226 | | | $ | 16,037 | | | $ | 19,705 | |
| | | | | | | | | | | | | | | | |
During the years ended December 31, 2013, 2012 and 2011 available for sale securities, securities carried at fair value and loan securities carried at fair value were sold or paid off for total proceeds of approximately $19,918,000, $28,133,000 and $35,156,000, respectively. The gross realized gains on these sales and payoffs totaled approximately $742,000, $655,000 and $123,000 in 2013, 2012 and 2011, respectively. For purpose of determining gross realized gains, the cost of securities is based on specific identification.
For the years ended December 31, 2013, 2012 and 2011, the Trust recognized net unrealized gains on available for sale securities, securities carried at fair value and loan securities carried at fair value of $73,000, $7,363,000 and $5,526,000, respectively, as the result of the change in fair value of the financial assets for which the fair value option was elected.
| 7. | Preferred Equity Investments |
On December 21, 2012 the Trust made a $6,000,000 preferred equity contribution to its WRT-Fenway Wateridge joint venture. The Trust is entitled to a 12% priority return which is to be paid 8% currently from operating cash flow and the remaining 4% is deferred. During 2013, the Trust received distributions, inclusive of its preferred return, totaling $6,378,000. The Trust still holds a $229,000 preferred equity investment at December 31, 2013.
93
During 2012 the Trust made preferred equity contributions of $4,750,000 to its Vintage Housing venture which entitles the Trust to a 12% return.
During 2012 the Trust converted its $1,500,000 loan to its Vintage Housing venture to preferred equity with a 12% return. During 2011 the loan bore interest at 12% with no payments due until there is operating cash flow from the property. No income was recognized in 2013, 2012 or 2011 on this investment.
The Trust recognized earnings from its Marc Realty preferred equity investments of $338,000 for the year ended December 31, 2011. On January 2, 2012 the Trust restructured its 180 North Michigan preferred equity investment of $3,923,000 and its loan receivable of $2,938,000 to an equity investment.
The Trust’s equity investments consist of the following at December 31, 2013 and December 31, 2012 (in thousands):
| | | | | | | | | | | | | | |
Venture Partner | | Equity Investment | | Nominal % Ownership
at December 31, 2013 | | | December 31,
2013 | | | December 31,
2012 | |
| | | | |
Gancar Trust (1) | | Vintage Housing Holdings LLC | | | 75.0 | % | | $ | 34,153 | | | $ | 30,534 | |
Elad Canada Ltd | | WRT-Elad One South State Equity LP | | | 50.0 | % | | | — | | | | 460 | |
Elad Canada Ltd | | WRT-One South State Lender LP | | | 50.0 | % | | | 23,661 | | | | 24,644 | |
Mack-Cali | | WRT-Stamford LLC | | | 20.0 | % | | | 9,064 | | | | 8,501 | |
Atrium/Northstar | | 10 Metrotech Loan LLC | | | 33.3 | % | | | 11 | | | | 10,845 | |
Atrium Holding | | RE CDO Management LLC | | | 50.0 | % | | | 992 | | | | 1,779 | |
Freed | | Mentor Retail LLC | | | 49.9 | % | | | 635 | | | | 551 | |
Inland/Lexington | | Concord Debt Holdings LLC | | | 33.3 | % | | | — | | | | — | |
Inland/Lexington | | CDH CDO LLC | | | 24.8 | % | | | — | | | | — | |
Inland (2) | | Concord Debt Holdings LLC | | | 33.3 | % | | | 966 | | | | 3,974 | |
Inland (2) | | CDH CDO LLC | | | 24.8 | % | | | 4,215 | | | | 322 | |
Sealy (1) | | Northwest Atlanta Partners LP | | | 60.0 | % | | | 7,635 | | | | 8,104 | |
Sealy (1) | | Newmarket GP LLC | | | 68.0 | % | | | — | | | | — | |
Sealy (1) | | Airpark Nashville GP | | | 50.0 | % | | | — | | | | — | |
Marc Realty (1) | | Brooks Building LLC | | | 50.0 | % | | | 6,551 | | | | 7,983 | |
Marc Realty (1) | | High Point Plaza LLC | | | 50.0 | % | | | — | | | | 2,241 | |
Marc Realty (1) | | 1701 Woodfield LLC | | | 50.0 | % | | | 150 | | | | 1,977 | |
Marc Realty (1) | | Enterprise Center LLC | | | 50.0 | % | | | 50 | | | | 2,679 | |
Marc Realty (1) | | Atrium Mall | | | 50.0 | % | | | 3,845 | | | | — | |
ROIC | | WRT-ROIC Lakeside Eagle LLC | | | 50.0 | % | | | — | | | | — | |
New Valley/Starwood (3) | | Socal Office Portfolio Loan LLC | | | 73.0 | % | | | — | | | | 8 | |
New Valley/Witkoff | | 701 7th WRT Investors LLC | | | 70.5 | % | | | 55,259 | | | | 28,735 | |
Fenway | | WRT-Fenway Wateridge LLC | | | 50.0 | % | | | 1,898 | | | | 1,522 | |
| | | | | | | | | | | | | | |
| | | | | | | | $ | 149,085 | | | $ | 134,859 | |
| | | | | | | | | | | | | | |
| (1) | The Trust has determined that these equity investments are investments in VIEs. The Trust has determined that it is not the primary beneficiary of these VIEs since the Trust does not have the power to direct the activities that most significantly impact the VIEs economic performance. |
| (2) | Represents the interests acquired from Lexington Realty Trust on May 1, 2012. |
| (3) | The underlying loan investment was satisfied at par in September 2012. |
94
The following table reflects the activity of the Trust’s equity investments for the year ended December 31, 2013 (in thousands):
| | | | | | | | | | | | | | | | | | | | | | | | |
Investment | | Balance at
December 31,
2012 | | | Contributions | | | Equity
Income
(loss) | | | Distributions | | | Sales Price | | | Balance at
December 31,
2013 | |
| | | | | | |
Vintage Housing Holdings, LLC (2) | | $ | 30,534 | | | $ | — | | | $ | 9,174 | | | $ | (5,555 | ) | | $ | — | | | $ | 34,153 | |
WRT-Elad One South State Equity LP (2) | | | 460 | | | | 2,358 | | | | (2,818 | ) | | | — | | | | — | | | | — | |
WRT-One South State Lender LP (2) | | | 24,644 | | | | — | | | | 4,133 | | | | (5,116 | ) | | | — | | | | 23,661 | |
WRT-Stamford LLC | | | 8,501 | | | | — | | | | 930 | | | | (367 | ) | | | — | | | | 9,064 | |
10 Metrotech Loan LLC | | | 10,845 | | | | — | | | | 3,284 | | | | (14,118 | ) | | | — | | | | 11 | |
RE CDO Management LLC | | | 1,779 | | | | — | | | | 3,709 | | | | (4,496 | ) | | | — | | | | 992 | |
Concord Debt Holdings LLC | | | — | | | | — | | | | 3,072 | | | | (3,072 | ) | | | — | | | | — | |
CDH CDO LLC | | | — | | | | — | | | | 1,033 | | | | (1,020 | ) | | | (13 | ) | | | — | |
Concord Debt Holdings LLC (1) | | | 3,974 | | | | — | | | | 64 | | | | (3,072 | ) | | | — | | | | 966 | |
CDH CDO LLC (1) | | | 322 | | | | — | | | | 4,926 | | | | (1,020 | ) | | | (13 | ) | | | 4,215 | |
Mentor Retail LLC | | | 551 | | | | — | | | | 84 | | | | — | | | | — | | | | 635 | |
701 7th WRT Investors LLC (3) | | | 28,735 | | | | 25,913 | | | | 3,424 | | | | (2,813 | ) | | | — | | | | 55,259 | |
WRT-Fenway Wateridge LLC (2) | | | 1,522 | | | | 193 | | | | 183 | | | | — | | | | — | | | | 1,898 | |
Sealy | | | 8,104 | | | | — | | | | (469 | ) | | | — | | | | — | | | | 7,635 | |
Marc Realty | | | 14,880 | | | | — | | | | (7,971 | ) | | | (158 | ) | | | — | | | | 6,751 | |
WRT-ROIC Lakeside Eagle LLC | | | — | | | | 25 | | | | (25 | ) | | | — | | | | — | | | | — | |
SoCal Office Portfolio Loan LLC | | | 8 | | | | — | | | | (2 | ) | | | (6 | ) | | | — | | | | — | |
Atrium Mall | | | — | | | | 3,935 | | | | (90 | ) | | | — | | | | — | | | | 3,845 | |
| | | | | | | | | | | | | | | | | | | | | | | | |
| | | | | | |
Total | | $ | 134,859 | | | $ | 32,424 | | | $ | 22,641 | | | $ | (40,813 | ) | | $ | (26 | ) | | $ | 149,085 | |
| | | | | | | | | | | | | | | | | | | | | | | | |
| (1) | Represents the interests acquired from Lexington Realty Trust on May 1, 2012. |
| (2) | The Trust has elected to report its share of earnings on a one month lag period. |
| (3) | The Trust has elected to report its share of earnings on a three month lag. |
95
The following table reflects the activity of the Trust’s equity investments for the year ended December 31, 2012 (in thousands):
| | | | | | | | | | | | | | | | | | | | | | | | |
Investment | | Balance at
December 31,
2011 | | | Contributions | | | Equity
Income
(loss) | | | Distributions | | | Sales Price | | | Balance at
December 31,
2012 | |
| | | | | | |
Vintage Housing Holdings LLC (2) | | $ | 29,887 | | | $ | 2,067 | | | $ | 4,603 | | | $ | (6,023 | ) | | $ | — | | | $ | 30,534 | |
WRT-Elad One South State Equity LP (2) | | | — | | | | 2,838 | | | | (2,378 | ) | | | — | | | | — | | | | 460 | |
WRT-One South State Lender LP (2) | | | 10,150 | | | | 11,213 | | | | 3,281 | | | | — | | | | — | | | | 24,644 | |
WRT-Stamford LLC | | | — | | | | 8,036 | | | | 769 | | | | (304 | ) | | | — | | | | 8,501 | |
10 Metrotech Loan LLC | | | — | | | | 10,915 | | | | 335 | | | | (405 | ) | | | — | | | | 10,845 | |
RE CDO Management LLC | | | 1,296 | | | | 550 | | | | 67 | | | | (134 | ) | | | — | | | | 1,779 | |
Mentor Retail LLC | | | — | | | | 505 | | | | 46 | | | | — | | | | — | | | | 551 | |
Concord Debt Holdings LLC | | | — | | | | — | | | | 422 | | | | (422 | ) | | | — | | | | — | |
CDH CDO LLC | | | — | | | | — | | | | 1,715 | | | | (1,715 | ) | | | — | | | | — | |
701 7th WRT Investors LLC (3) | | | — | | | | 29,025 | | | | — | | | | (290 | ) | | | — | | | | 28,735 | |
WRT-Fenway Wateridge LLC (2) | | | — | | | | 1,522 | | | | — | | | | — | | | | — | | | | 1,522 | |
CDH CDO LLC (1) | | | — | | | | 2,500 | | | | (997 | ) | | | (1,181 | ) | | | — | | | | 322 | |
Sealy | | | 11,348 | | | | — | | | | (3,199 | ) | | | (45 | ) | | | — | | | | 8,104 | |
Marc Realty | | | 27,145 | | | | 11,833 | | | | 33 | | | | (4,116 | ) | | | 20,015 | | | | 14,880 | |
WRT-ROIC Lakeside Eagle LLC | | | 7 | | | | 35 | | | | (42 | ) | | | — | | | | — | | | | — | |
WRT-ROIC Riverside LLC | | | 7,883 | | | | — | | | | 706 | | | | (8,589 | ) | | | | | | | — | |
SoCal Office Portfolio Loan LLC | | | 72,626 | | | | — | | | | 9,706 | | | | (82,324 | ) | | | 2,032 | | | | 8 | |
FII Co-invest LLC | | | 1,800 | | | | — | | | | 232 | | | | — | | | | | | | | — | |
Concord Debt Holdings (1) | | | — | | | | 4,501 | | | | (456 | ) | | | (71 | ) | | | — | | | | 3,974 | |
| | | | | | | | | | | | | | | | | | | | | | | | |
| | | | | | |
Total | | $ | 162,142 | | | $ | 85,540 | | | $ | 14,843 | | | $ | (105,619 | ) | | $ | 22,047 | | | $ | 134,859 | |
| | | | | | | | | | | | | | | | | | | | | | | | |
| (1) | Represents the interests acquired from Lexington Realty Trust on May 1, 2012. |
| (2) | The Trust has elected to report its share of earnings on a one month lag period. |
| (3) | The Trust has elected to report its share of earnings on a three month lag period. |
See Note 4 for information relating to 2013 activity with respect to equity investments.
Sullivan Center - There is a basis differential of $11,196,000 between the Trust’s carrying value of its investments in Sullivan Center and the basis reflected at the joint venture level, which is amortized over the life of the related assets. The basis differential primarily relates to a bargain purchase gain recognized at the joint venture level upon acquisition.
Concord - During the years ended December 31, 2013 and 2012, the Trust received cash distributions from Concord Debt Holdings LLC of $3,072,000 and $422,000, respectively. The Trust recognized equity income for the full amount of the distributions. The Trust has suspended losses of $40,493,000 to offset against future equity income from Concord at December 31, 2013.
During the years ended December 31, 2013 and 2012, the Trust received cash distributions from CDH CDO LLC of $1,020,000 and $1,715,000, respectively. The Trust recognized equity income for the full amount of the distribution. The Trust has suspended losses of $19,605,000 to offset against future equity income from CDH CDO LLC at December 31, 2013.
Sealy -On May 30, 2013 the Trust contributed its interest in Newmarket GP and its interest in Airpark Nashville GP to TRS. The Trust’s carrying value of both investments was zero at the time of the contributions and the transaction had no effect on the financial statements of the Trust. On October 7, 2013 the lender foreclosed on the loan that was collateralized by Sealy Airpark Property. On December 2, 2013 the lender foreclosed on the loan that was collateralized by the Sealy Newmarket Property. These transactions had no effect on the financial statements of the Trust.
96
Sealy Impairments
During 2011 the Trust determined that, as a result of current market conditions, including current occupancy levels, current rental rates and an increase in terminal capitalization rates, the fair value of its equity investments in Sealy were below the carrying values. Accordingly, the Trust assessed whether this decline in value was other-than-temporary. In making this determination, the Trust considered the length of time which the decline has occurred, the length of time before an expected recovery and the lack of any comparable in the market. The Trust determined the fair value of its investments utilizing an unleveraged cash flow methodology and an estimated terminal capitalization rate. The cash flows were then discounted using an estimated market rate. Based on the foregoing, all of which requires significant judgment, the Trust concluded that the declines in value were other-than-temporary, and during 2011 the Trust recorded other-than-temporary impairment charges of $2,900,000, $900,000 and $1,494,000 on its investments in Sealy Northwest Atlanta, Sealy Newmarket, and Sealy Nashville, respectively.
The Trust has determined that the fair value of certain of its equity investments each marginally exceed their carrying values. While the ventures continue to aggressively market available space for lease and work with existing tenants for lease renewal, declines in occupancy could cause impairment of these ventures that could be material to the Trust’s future results of operations.
Marc Realty - On January 1, 2012, the Trust restructured one of its investments (180 North Michigan) and converted its investment from loans receivable ($2,938,000) and preferred equity ($3,923,000) to equity investments ($6,861,000) which is included in contributions in the above table.
On March 1, 2012, the Trust sold to Marc Realty its interest in 3701 Algonquin for $250,000. On May 31, 2012, the Trust sold to Marc Realty its interests in Salt Creek, River Road and Ridgebrook for $0, $1,000,000 and $1,100,000, respectively.
On May 31, 2012, the Trust sold to Marc Realty its interest in the 30 North Michigan property for $10,300,000. The purchase was financed with a $6,550,000 secured promissory note. The note was fully satisfied on August 3, 2012.
Marc Realty Impairments
During the fourth quarter of 2013, the Trust’s equity investments in the Brooks Building, LLC (“223 West Jackson”), High Point Plaza, LLC (“High Point”), 1701 Woodfield, LLC (“1701 Woodfield”), and Enterprise Center, LLC ( individually “Enterprise” and the aforementioned investments collectively the “Marc Investments”) suffered declines in occupancy, increasing competition for tenants, and increasing costs to operate the investments. Additionally, recent discussions related to marketing available space to potential tenants, along with lease renewals with existing tenants, indicated a capital infusion from the Trust would be necessary to upgrade the investments to achieve rental rates in-line with the suburban Chicago, Illinois office market. The factors above along with increasing capital demands and rising cost of capital caused the Trust to reassess its business plan associated with the Marc Investments in the fourth quarter of 2013.
Subsequent to year end the Trust entered into an agreement with Marc Realty, its joint venture partner in these equity investments, to sell its interests in High Point, 1701 Woodfield, Enterprise Center along with its controlling interest in the River City property, located in Chicago, Illinois, which is consolidated, for a gross sales price of $6,000,000. The Trust considered the underlying investment characteristics and negotiations with Marc Realty in allocating the purchase price to the specific assets included in the transaction. Additionally, the Trust granted Marc Realty an option exercisable within two years to acquire its interest in 223 West Jackson for a purchase price ranging from $5,000,000 to $6,600,000. The purchase price for 223 West Jackson is dependent upon when the option is exercised and certain operating characteristics of the investment at the time of exercise.
Based on the factors noted above, the Trust concluded that each of the Marc Investments were other-than-temporarily impaired in the aggregate by $7,687,000 at December 31, 2013, when comparing each of their carrying values of $14,438,000 in the aggregate to each of their fair values of $6,751,000 in the aggregate and a corresponding impairment charge has been included in Equity in income (loss) of equity investments in the Consolidated Statement of Operations and Comprehensive Income (Loss) for the year then ended. The Trust separately tested the River City property for impairment and determined that the carrying value of River City was recoverable at December 31, 2013 when comparing the portion of the gross sales price attributable to the River City property to its carrying value.
SoCal Office Portfolio Loan– On September 28, 2012, the loan held by SoCal Office Portfolio Loan (“SoCal”) was paid off at par. The Trust’s joint venture WRT-SoCal Lender LLC (“SoCal Lender”) which held the equity investment on SoCal received
97
a return of capital distribution of $44,224,000 on its investment from this transaction. The Trust’s allocable share of the distribution was $38,407,000. SoCal acquired the loan on November 4, 2011. Earlier in 2012, SoCal obtained a recourse repurchase facility and received net proceeds of approximately $38,100,000 which was distributed entirely to the Trust in partial redemption of its interest. The SoCal balance sheet consisted of total assets of $13,000 and $97,989,000 at December 31, 2012 and 2011, respectively and total liabilities of $0 and $269,000 as of December 31, 2012 and 2011, respectively. SoCal had net income of $16,892,000 and $366,000 for the years ended December 31, 2012 and 2011, respectively. A majority of the proceeds from the payoff of the loan were distributed in 2012. Remaining funds were utilized to wind up and dissolve SoCal in 2013.
Vintage Housing Holdings LLC - The Trust has made additional investments in the aggregate of $6,779,000 to the Vintage platform during 2012. The venture’s new investments included a $5,500,000 contribution to a planned 345 unit multi-family project in Lynnwood, Washington, a $750,000 contribution to a planned 204-unit multi-family property in Marysville, Washington and $529,000 contribution to complete the acquisition of interests in the general partners of two multifamily properties comprising approximately 490 units located in California and Nevada.
ROIC – Riverside Loan– On September 18, 2012, the loan was paid off at par. The joint venture received a return of capital distribution of $15,600,000 on its investment. The Trust’s allocable share of the distribution was $7,800,000.
Separate Financial Statements for Unconsolidated Subsidiaries
The Trust has determined that for the periods presented in the Trust’s financial statements, certain of its unconsolidated subsidiaries have met the conditions of a significant subsidiary under Rule 1-02(w) of Regulation S-X for which the Trust is required, pursuant to Rule 3-09 of Regulation S-X, to attach separate financial statements as exhibits to its Annual Report on Form 10-K as follows:
| | | | |
Entity | | Year(s) determined
significant | | Exhibit |
| | |
Concord Debt Holdings LLC | | 2011 | | 99.1 |
| | |
CDH CDO LLC | | 2013 | | 99.2 |
| | |
Sealy Northwest Atlanta Partners LP | | 2011 | | 99.3 |
| | |
Sealy Newmarket General Partnership | | 2011 | | 99.4 |
Combined Financial Statements for Unconsolidated Subsidiaries
Pursuant to Rule 4-08(g), the following summarized financial data for unconsolidated subsidiaries includes information for the following entities: Vintage Housing Holdings, LLC, WRT-Elad One South State Equity LP, WRT-Stamford LLC, 10 Metrotech Loan LLC, Mentor Retail LLC, 701 Seventh WRT Investors LLC, WRT-Fenway Wateridge LLC, Brooks Building LLC, High Point Plaza LLC, 1701 Woodfield LLC, Enterprise Center LLC, Atrium Mall LLC and WRT-ROIC Lakeside Eagle LLC.
| | | | | | | | | | | | |
| | | For the Year Ended
December 31, 2013 | | | For the Year Ended
December 31, 2012 | | | For the Year Ended
December 31, 2011 | |
| | | |
Income Statements | | | | | | | | | | | | |
Rental Revenue | | | 57,890 | | | | 70,686 | | | | 54,600 | |
Interest, dividends and discount accretion | | | 14,538 | | | | 6,513 | | | | 3,745 | |
Expenses | | | 43,672 | | | | 68,286 | | | | 59,190 | |
Income from continuing operations | | | 28,756 | | | | 8,913 | | | | (845 | ) |
| | | |
Trust’s share of net income | | | 16,679 | | | | 6,472 | | | | (35 | ) |
| | | | | | | | |
| | | As of December 31,
2013 | | | As of December 31,
2012 | |
Balance Sheets | | | | | | | | |
Investment in real estate | | | 913,894 | | | | 542,124 | |
Total assets | | | 1,022,352 | | | | 631,481 | |
| | |
Total debt | | | 734,856 | | | | 401,040 | |
Total liabilities | | | 799,949 | | | | 463,218 | |
Non controlling interests | | | 34,071 | | | | 15,997 | |
Trust share of equity | | | 119,304 | | | | 65,311 | |
The Trust was granted a waiver of the requirements to provide S-X 3-09 financial statements for its equity method joint venture investee WRT – One South State Lender LP (“Lender LP”) by the U.S. Securities and Exchange Commission. Lender LP met the conditions of a significant subsidiary under Rule 1-02(w) of Regulation S-X for 2013 solely due to the transaction as discussed in Note 4.
Lender LP holds a single loan receivable with a face amount of $51,716,000 at December 31, 2013. The loan bears interest at a rate of 15% per annum, requires payments of interest only and matures December 2017. The loan was acquired at a discount to face and the discount is being accreted into income over the life of the loan.
98
The balance sheets of Lender LP are as follows (in thousands):
| | | | | | | | |
| | | December 31 | |
| | | 2013 | | | 2012 | |
Assets | | | | | | | | |
Loan Receivable | | $ | 42,173 | | | $ | 41,519 | |
Other assets, net | | | 5,028 | | | | 7,784 | |
| | | | | | | | |
Total Assets | | $ | 47,201 | | | $ | 49,303 | |
| | | | | | | | |
| | |
Liabilities and Equity | | | | | | | | |
Accounts payable and accrued expenses | | $ | 23 | | | $ | 427 | |
Other liabilities | | | — | | | | — | |
| | | | | | | | |
Total Liabilities | | | 23 | | | | 427 | |
| | | | | | | | |
Equity | | | 47,178 | | | | 48,876 | |
| | | | | | | | |
Total Liabilities and Equity | | $ | 47,201 | | | $ | 49,303 | |
| | | | | | | | |
The statements of operations for Lender LP are as follows (in thousands):
| | | | | | | | | | | | |
| | | Year Ended December 31 | |
| | | 2013 | | | 2012 | | | 2011 (1) | |
Revenue | | | | | | | | | | | | |
Interest Income | | $ | 8,506 | | | $ | 7,378 | | | $ | — | |
Management Fee Income | | | — | | | | — | | | | — | |
| | | | | | | | | | | | |
| | | 8,506 | | | | 7,378 | | | | — | |
| | | | | | | | | | | | |
Expenses | | | | | | | | | | | | |
General and Administrative | | | 86 | | | | 127 | | | | — | |
Other expenses | | | — | | | | — | | | | — | |
| | | | | | | | | | | | |
| | | 86 | | | | 127 | | | | — | |
| | | | | | | | | | | | |
Other Income and Expense | | | | | | | | | | | | |
Other Income | | | — | | | | — | | | | — | |
| | | | | | | | | | | | |
Net Income | | $ | 8,420 | | | $ | 7,251 | | | $ | — | |
| | | | | | | | | | | | |
Statement of Cash Flows (in thousands)
| | | | | | | | | | | | |
| | | Year Ended December 31 | |
| | | 2013 | | | 2012 | | | 2011 (1) | |
Net cash provided by (used in) operating activities | | $ | 879 | | | $ | 4,967 | | | $ | — | |
Net cash provided by (used in) investment | | $ | — | | | $ | (21,369 | ) | | $ | (20,150 | ) |
Net cash provided by (used in) financing activities | | $ | (5,952 | ) | | $ | 21,475 | | | $ | 20,150 | |
Cash and cash equivalents, end of year | | $ | — | | | $ | 5,073 | | | $ | — | |
Non cash investing and financing activity | | | | | | | | | | | | |
Distribution to partners | | $ | (4,166 | ) | | $ | — | | | $ | — | |
| (1) | The year ended December 31, 2011 represents the period December 23, 2011 through December 31, 2011, the period of our ownership. |
99
The Trust was granted a waiver of the requirements to provide S-X 3-09 financial statements for its equity method joint venture investee RE CDO Management LLC (“RE CDO”) by the U.S. Securities and Exchange Commission. RE CDO met the conditions of a significant subsidiary under Rule 1-02(w) of Regulation S-X for 2013 solely due to the transactions as discussed in Note 4.
RE CDO holds a 5.52% interest in (i) a first priority mortgage loan collateralized by land located in Las Vegas, Nevada (the “Land”), which loan bears interest at LIBOR plus 40% with a current pay rate of 7.5% and the balance accruing and compounding and which had an outstanding balance of $21,227,000 at December 31, 2013, and (ii) a second priority mortgage loan collateralized by the Land which bears interest at 10% per annum, all of which accrues, and which had an outstanding balance of $30,401,000 at December 31, 2013. The interest in the loan was acquired for $1,093,000 and RE CDO accounts for this investment on the cost recovery method.
RE CDO also holds the collateral management agreement for a collateralized debt obligation entity that holds loans and loan securities.
The balance sheets of RE CDO are as follows (in thousands):
| | | | | | | | |
| | | December 31 | |
| | | 2013 | | | 2012 | |
Assets | | | | | | | | |
Loan Receivable | | $ | 1,033 | | | $ | 1,070 | |
Other assets, net | | | 965 | | | | 2,523 | |
| | | | | | | | |
Total Assets | | $ | 1,998 | | | $ | 3,593 | |
| | | | | | | | |
| | |
Liabilities and Equity | | | | | | | | |
Accounts payable and accrued expenses | | $ | 16 | | | $ | 36 | |
Other liabilities | | | — | | | | — | |
| | | | | | | | |
Total Liabilities | | | 16 | | | | 36 | |
| | | | | | | | |
Equity | | | 1,982 | | | | 3,557 | |
| | | | | | | | |
Total Liabilities and Equity | | $ | 1,998 | | | $ | 3,593 | |
| | | | | | | | |
The statements of operations for RE CDO are as follows (in thousands) :
| | | | | | | | | | | | |
| | | Year Ended December 31 | |
| | | 2013 | | | 2012 | | | 2011 (1) | |
Revenue | | | | | | | | | | | | |
Management Fee Income | | $ | 226 | | | $ | 618 | | | $ | 324 | |
Interest Income | | | — | | | | — | | | | — | |
| | | | | | | | | | | | |
| | | 226 | | | | 618 | | | | 324 | |
| | | | | | | | | | | | |
Expenses | | | | | | | | | | | | |
General and Administrative | | | 290 | | | | 354 | | | | 164 | |
Other expenses | | | 1,459 | | | | 129 | | | | 67 | |
| | | | | | | | | | | | |
| | | 1,749 | | | | 483 | | | | 231 | |
| | | | | | | | | | | | |
Other Income and Expense | | | | | | | | | | | | |
Gain on sale of assets | | | 8,940 | | | | — | | | | — | |
| | | | | | | | | | | | |
Net Income | | $ | 7,417 | | | $ | 135 | | | $ | 93 | |
| | | | | | | | | | | | |
Statement of Cash Flows (in thousands)
| | | | | | | | | | | | |
| | | Year Ended December 31 | |
| | | 2013 | | | 2012 | | | 2011 (1) | |
Net cash provided by (used in) operating activities | | $ | (7 | ) | | $ | 292 | | | $ | 119 | |
Net cash provided by (used in) investment | | $ | 8,940 | | | $ | (1,093 | ) | | $ | (2,525 | ) |
Net cash provided by (used in) financing activities | | $ | (8,993 | ) | | $ | 830 | | | $ | 2,500 | |
Cash and cash equivalents, end of year | | $ | 63 | | | $ | 123 | | | $ | 94 | |
| (1) | The year ended December 31, 2011 represents the period from June 28, 2011 through December 31, 2011, the period of our ownership. |
100
The Trust was granted a waiver of the requirements to provide S-X 3-09 financial statements for its equity method joint venture investee SoCal by the U.S. Securities and Exchange Commission. SoCal met the conditions of a significant subsidiary under Rule 1-02(w) of Regulation S-X for 2012 solely due to the early payoff of its sole investment in a loan asset. The proceeds from the loan payoff have been distributed, and SoCal was dissolved in 2013.
The balance sheets of SoCal are as follows (in thousands):
| | | | |
| | | December 31, 2012 | |
ASSETS | | | | |
Cash and cash equivalents | | $ | 11 | |
Real estate debt investments | | | — | |
Receivables and other assets | | | 2 | |
| | | | |
Total Assets | | $ | 13 | |
| | | | |
| |
LIABILITIES AND MEMBERS’ CAPITAL | | | | |
Other current liabilities | | $ | — | |
Members’ Capital | | | 13 | |
| | | | |
Total Liabilities and Members’ Capital | | $ | 13 | |
| | | | |
| |
Carrying value of the Trust’s investments in the equity investments | | $ | 8 | |
| | | | |
The statements of operations for SoCal are as follows (in thousands):
| | | | |
| | | For the Year Ended | |
| | | December 31, 2012 | |
Interest, dividends and discount accretion | | $ | 25,122 | |
| | | | |
Expenses | | | | |
Interest | | | 7,794 | |
General and administrative | | | 424 | |
Other expenses | | | 12 | |
| | | | |
Total expenses | | | 8,230 | |
| | | | |
| |
Net income | | $ | 16,892 | |
| | | | |
| |
Trust’s share of net income | | $ | 9,706 | |
| | | | |
101
Lease intangibles consisted of the following at December 31, 2013 and 2012 (in thousands):
| | | | | | | | |
| | | December 31,
2013 | | | December 31,
2012 | |
Lease intangibles | | $ | 75,753 | | | $ | 65,224 | |
Less: Accumulated amortization | | | (25,887 | ) | | | (27,480 | ) |
| | | | | | | | |
Lease intangibles, net | | $ | 49,866 | | | $ | 37,744 | |
| | | | | | | | |
| | |
Below market leases | | $ | 4,159 | | | $ | 7,808 | |
Less: Accumulated amortization | | | (1,760 | ) | | | (5,553 | ) |
| | | | | | | | |
Below market leases, net | | $ | 2,399 | | | $ | 2,255 | |
| | | | | | | | |
Amortization related to deferred leasing costs over the next five years is a follows (in thousands):
| | | | | | | | |
| | | Estimated Net Amortization of
In-Place Leases, Leasing
Commissions and
Tenant Relationships | | | Net Decrease (Increase) to Rental
Income Related to Above and Below
Market Leases | |
2014 | | $ | 8,956 | | | $ | 34 | |
2015 | | | 6,776 | | | | 369 | |
2016 | | | 6,625 | | | | 402 | |
2017 | | | 6,390 | | | | 464 | |
2018 | | | 4,550 | | | | 452 | |
102
Mortgage Loans Payable
The Trust had outstanding mortgage loans payable of $444,933,000 and $280,576,000 at December 31, 2013 and 2012, respectively. The mortgage loan payments of principal and interest are generally due monthly, quarterly or semi-annually and are collateralized by applicable real estate of the Trust.
The Trust’s mortgage loans payable at December 31, 2013 and 2012 are summarized as follows (in thousands):
| | | | | | | | | | | | | | | | | | |
Location of Collateral | | Maturity | | Spread Over
LIBOR/Prime (1) | | | Interest Rate at
December 31, 2013 | | | December 31,
2013 | | | December 31,
2012 | |
| | | | | |
Memphis, TN | | Aug 2014 | | | Libor + 2.5 | % (2) | | | 3.00 | % | | $ | 13,125 | | | $ | 13,408 | |
Lisle, IL (3) | | Oct 2014 | | | Libor + 2.5 | % (4) | | | 2.67 | % | | | 5,752 | | | | 5,752 | |
Chicago, IL | | Apr 2015 | | | — | | | | 5.50 | % | | | 8,579 | | | | 8,700 | |
Chicago, IL | | Mar 2016 | | | — | | | | 5.75 | % | | | 19,856 | | | | 20,200 | |
Houston, TX | | Apr 2016 | | | — | | | | 6.01 | % | | | 47,201 | | | | 52,052 | |
New York, NY | | May 2016 | | | Libor + 2.5 | % (5) | | | 3.50 | % | | | 51,950 | | | | 51,982 | |
Philadelphia, PA | | May 2016 | | | Libor + 2.0 | % (6) | | | 2.50 | % | | | 42,440 | | | | — | |
Greensboro, NC | | Aug 2016 | | | — | | | | 6.22 | % | | | 14,735 | | | | 15,139 | |
Phoenix, AZ | | Oct 2016 | | | Libor + 2.0 | % (7) | | | 2.69 | % | | | 24,390 | | | | — | |
San Pedro, CA | | Oct 2016 | | | Libor + 2.0 | % (7) | | | 2.69 | % | | | 12,195 | | | | — | |
Stamford, CT | | Oct 2016 | | | Libor + 2.0 | % (7) | | | 2.69 | % | | | 48,780 | | | | — | |
Houston, TX | | Oct 2016 | | | Libor + 2.0 | % (7) | | | 2.69 | % | | | 64,635 | | | | — | |
Cerritos, CA | | Jan 2017 | | | — | | | | 5.07 | % | | | 23,142 | | | | 23,184 | |
Lisle, IL | | Mar 2017 | | | — | | | | 5.55 | % | | | 5,470 | | | | 5,543 | |
Orlando, FL | | Jul 2017 | | | — | | | | 6.40 | % | | | 36,983 | | | | 37,580 | |
Plantation, FL | | Apr 2018 | | | — | | | | 6.48 | % | | | 10,684 | | | | 10,811 | |
Oklahoma City, OK | | Feb 2021 | | | — | | | | 5.70 | % | | | 9,967 | | | | — | |
Meriden, CT (8) | | Oct 2022 | | | — | | | | 3.95 | % | | | — | | | | 21,000 | |
Churchill, PA | | Aug 2024 | | | — | | | | 3.50 | % | | | 5,049 | | | | — | |
Amherst, NY (9) | | N/A | | | — | | | | N/A | | | | — | | | | 15,225 | |
| | | | | | | | | | | | | | | | | | |
| | | | | | | | | | | | $ | 444,933 | | | $ | 280,576 | |
| | | | | | | | | | | | | | | | | | |
| (1) | The one-month LIBOR rate at December 31, 2013 was 0.1677%. The one-month LIBOR rate at December 31, 2012 was 0.2087%. |
| (2) | The loan has a LIBOR floor of 0.5% and an interest rate cap which caps LIBOR at 0.5%. |
| (3) | The loan was previously collateralized by three properties. Two of the properties were released from the mortgage upon partial repayment in October 2012. |
| (4) | The loan has an interest rate cap which caps LIBOR at 1%. |
| (5) | The loan has a LIBOR floor of 1% and an interest rate cap which caps LIBOR at 1.75% through May 15, 2014. |
| (6) | The loan has an interest rate swap which effectively fixes LIBOR at 0.5%. |
| (7) | The loan has an interest rate swap which effectively fixes LIBOR at 0.69%. |
| (8) | The loan is classified as liabilities of assets held for sale at December 31, 2013. |
| (9) | The loan was fully satisfied on July 26, 2013. |
103
Non-Recourse Secured Financings
The Trust’s non-recourse secured financings at December 31, 2013 and December 31, 2012 are summarized as follows (in thousands):
| | | | | | | | | | | | | | | | | | |
Collateral | | Maturity | | Spread Over
LIBOR/Prime | | | Interest Rate at
December 31,
2013 | | | December 31,
2013 | | | December 31,
2012 | |
| | | | | |
Hotel Wales Loan | | Oct 2014 | | | LIBOR plus 1.25 | % (1) | | | 4.25 | % | | $ | 14,000 | | | $ | 14,000 | |
| | | | | |
San Marbeya Loan | | Jan 2015 | | | — | | | | 4.85 | % | | | 15,150 | | | | 15,150 | |
| | | | | | | | | | | | | | | | | | |
| | | | | | | | | | | | $ | 29,150 | | | $ | 29,150 | |
| | | | | | | | | | | | | | | | | | |
| (1) | The loan has a LIBOR floor of 3%. |
Recourse Secured Financings
In November 2012, the Trust obtained a $25,000,000 loan which is secured by the Queensridge loan receivable. As of December 31, 2013 and 2012, the recourse secured financing has a carrying value of $0 and $23,770,000, respectively, bears interest at a rate of LIBOR plus 4.0% and matures on November 15, 2014.
Notes Payable
In conjunction with the loan modification on the property located in Cerritos, California the Trust assumed a $14,500,000 B Note that bears interest at 6.6996% per annum and requires monthly payments of approximately $12,000 with the balance of the interest accruing. The loan modification agreement provides for a participation feature whereby the B Note can be fully satisfied with proceeds from the sale of the property after the Trust receives its 9.0% priority return of capital, during a specified time period as defined in the loan modification document. As of December 31, 2013 and 2012, the carrying value of the participating B Note was $942,000 and $876,000, respectively, which approximates fair value. The inputs used in determining the estimated fair value of the Trust’s Notes Payable are categorized as Level 3 in the fair value hierarchy.
On October 15, 2012, 5400 Westheimer LP, an entity in which the Trust holds an indirect interest executed a note payable in the amount of $1,600,000. The note bears interest at 15% per annum and matures on October 15, 2022. In the consolidation of the Trust, $800,000 of the note payable and the corresponding interest expense is eliminated for accounting purposes. The balance of the note as of December 31, 2013 and 2012 was $800,000 which approximates fair value.
| 11. | Revolving Line of Credit |
The Trust has a revolving line of credit in the principal amount of $50,000,000 which bears interest at LIBOR plus 3% and has a maturity date of March 3, 2014 with a one year option to extend the maturity date to March 3, 2015. The Trust has elected not to exercise its option to extend. The Trust must comply with financial covenants on an ongoing basis. The covenants are tested as of the end of each quarter based upon results for the most recently ended quarter. The Trust was in compliance with its financial covenants under its revolving line of credit as of December 31, 2013 and 2012.
The revolving credit line is recourse and as such is effectively collateralized by all of the Trust’s assets. The Trust has directly pledged certain unencumbered consolidated operating properties and loans receivable as the borrowing base for the revolving line of credit. The revolving credit line requires monthly payments of interest only. To the extent that the amounts outstanding under the facility are in excess of the borrowing base (as calculated), the Trust is required to make a principal payment to reduce such excess. The Trust may prepay from time to time without premium or penalty and re-borrow amounts prepaid.
The outstanding balance under the facility was $0 at December 31, 2013 and 2012. The Trust is required to pay a commitment fee on the unused portion of the line, which amounted to approximately $175,000 and $150,000 for years ended December 31, 2013 and 2012, respectively.
104
In August 2012 the Trust issued a total $86,250,000 of its 7.75% Senior Notes due August 2022 (the “Senior Notes”) at an issue price of 100% of par value. The Trust received net proceeds of approximately $83,228,000, after deducting the underwriting discounts, commissions and offering expenses of $3,022,000.
The Senior Notes mature on August 15, 2022 and bear interest at the rate of 7.75% per year, payable quarterly in arrears commencing November 15, 2012. The Trust may redeem the Senior Notes, in whole or in part, at any time or from time to time on or after August 15, 2015 at a redemption price in cash equal to 100% of the principal amount redeemed plus accrued and unpaid interest.
The Senior Notes rank senior to all of the Trust’s future indebtedness that by its terms is expressly subordinate to the Senior Notes; except as discussed below, pari passu to all of the existing and future liabilities of the Trust’s subsidiaries, including the Operating Partnership. However, the Senior Notes will have priority with respect to a security interest in a promissory note issued by the Operating Partnership with a principal balance equal to the outstanding balance of the Senior Notes, which will be pari passu with all existing and future unsecured senior indebtedness of the Operating Partnership.
The indenture relating to the Senior Notes contains certain restrictions and requirements, including a consolidated leverage ratio of 60%, covenants to preserve corporate existence and comply with laws, and default provisions, including defaults for non-payment, breach of representations and warranties, insolvency, and non-performance of covenants. At December 31, 2013 and 2012, the Trust was in compliance with all restrictions and requirements.
The following table summarizes future principal repayments of mortgage loans payable, senior notes payable, notes payable and secured financings (not including fair market value adjustments) as of December 31, 2013 (in thousands):
| | | | |
Year | | Amount | |
2014 | | $ | 40,898 | |
2015 | | | 32,070 | |
2016 | | | 312,240 | |
2017 | | | 63,646 | |
2018 | | | 10,416 | |
Thereafter | | | 99,845 | |
| | | | |
| | $ | 559,115 | |
| | | | |
| 13. | Derivative Financial Instruments |
The Trust has exposure to fluctuations in market interest rates. The Trust seeks to limit its risk to interest rate fluctuations through match financing on its assets as well as through hedging transactions. The Trust’s derivative financial instruments are classified as other assets on the balance sheet.
The Trust’s objective in using interest rate derivatives is to add stability to interest expense and to manage its exposure to interest rate movements. To accomplish this objective, the Trust primarily uses interest rate caps and interest rate swaps as part of its interest rate risk management strategy relating to certain of its variable rate debt instruments.
The effective portion of changes in fair value of derivatives designated and that qualify as cash flow hedges is recorded in accumulated other comprehensive income and is subsequently reclassified into earnings in the period that the hedged forecasted transaction affects earnings. The ineffective portion of the change, if any, in fair value of the derivatives is recognized directly in earnings. During the twelve months ended December 31, 2013, interest rate caps were used to hedge the variable cash flows associated with existing variable-rate debt. The Trust also assesses, both at its inception and on an ongoing basis, whether the hedging instrument is highly effective in achieving offsetting changes in the cash flows attributable to the hedged item. The Trust has recorded changes in fair value related to the effective portion of its interest rate hedges designated and qualifying as cash flow hedges totaling $(74,000) and $42,000 of comprehensive (loss) income for the years ended December 31, 2013 and December 31, 2012, respectively. The Trust did not record any hedge ineffectiveness during the years ended December 31, 2013 and 2012.
105
The table below presents information about the Trust’s interest rate caps and swaps that are included on the consolidated balance sheet that were designated as cash flow hedges of interest rate risk at December 31, 2013 (dollars in thousands):
| | | | | | | | | | | | | | | | | | | | |
Maturity | | Strike Rate | | | Notional
Amount
of Hedge | | | Cost of
Hedge | | | Estimated Fair
Value of Hedge | | | Change in Hedge
Valuations
Included in Other
Comprehensive Income
for the Year Ended
December 31, 2013 | |
| | | | | |
Aug 2014 | | | 0.5 | % | | $ | 13,408 | | | $ | 22 | | | $ | (4 | ) | | $ | (4 | ) |
May 2016 | | | 0.5 | % | | | 42,440 | | | | — | | | $ | (33 | ) | | | (33 | ) |
Oct 2016 | | | 0.69 | % | | | 150,000 | | | | — | | | $ | (86 | ) | | | (86 | ) |
Nov 2017 | | | 4.00 | % | | | 50,000 | | | | 165 | | | $ | 186 | | | | 21 | |
Nov 2018 | | | 5.00 | % | | | 50,000 | | | | 220 | | | $ | 248 | | | | 28 | |
The table below presents information about the Trust’s interest rate caps and swaps that were not designated as cash flow hedges at December 31, 2013 (in thousands):
| | | | | | | | | | | | | | | | | | | | |
Maturity | | Strike Rate | | | Notional
Amount
of Hedge | | | Cost of
Hedge | | | Estimated Fair
Value | | | Change in Cap
Valuations Included
in Interest Expense
for the Year Ended
December 31, 2013 | |
Oct 2014 | | | 1.00 | % | | $ | 5,753 | | | $ | 174 | | | $ | — | | | $ | 1 | |
May 2013 | | | 1.25 | % | | | — | | | | 196 | | | | — | | | | — | |
May 2014 | | | 1.75 | % | | | 51,982 | | | | 434 | | | | — | | | | — | |
| 14. | Non-controlling Interests |
Deer Valley Operating Property – On March 29, 2012 the Trust purchased the 3.5% non-controlling ownership interest of its consolidated joint venture, WRT-DV LLC, for $400,000. The Trust accounted for this purchase as an equity transaction recording the difference in the $192,000 carrying value of the acquired non-controlling interest and the purchase price as a $208,000 reduction in paid-in capital.
One East Erie/Ontario Operating Property – On June 1, 2012, the Trust purchased from Marc Realty its 20% non-controlling interest in FT-Ontario Holdings LLC (“Ontario”) for $5,850,000. The Trust accounted for this purchase as an equity transaction recording the difference in the $363,000 carrying value of the acquired non-controlling interest and the purchase price as a $5,487,000 reduction in paid-in capital.
Houston, Texas Operating Property– During the first quarter of 2013, a wholly-owned subsidiary of the Trust acquired a quarter-unit limited partner interest, representing 1% of Westheimer, for a purchase price of $75,000. The Trust accounted for this purchase as an equity transaction recording the difference in the $127,000 carrying value of the acquired non-controlling interest and the purchase price as a $52,000 increase in paid-in capital. During the second quarter of 2013, the wholly-owned subsidiary acquired an additional 1% interest in Westheimer for a purchase price of $75,000. The Trust accounted for this purchase as an equity transaction recording the difference in the $126,000 carrying value of the acquired non-controlling interest and the purchase price as a $51,000 increase in paid-in capital.
During the fourth quarter of 2012, a wholly-owned subsidiary of the Trust conducted a tender offer to acquire additional limited partner units in 5400 Westheimer Holding LP. The Trust acquired an additional 5.5 limited partnership units resulting from the offer, representing 22% of Westheimer for a purchase price of $1,650,000. The Trust accounted for this purchase as an equity transaction recording the difference in the $2,812,000 carrying value of the acquired non-controlling interest and the purchase price as a $1,162,000 increase in paid-in capital.
106
As of December 31, 2013 the Trust owns 32% of Westheimer.
The changes in the Trust’s ownership interest in the subsidiaries impacted consolidated equity during the period shown as follows:
| | | | | | | | | | | | |
| | | For the Years Ended | |
| | | | | | December 31, | | | | |
| | | 2013 | | | 2012 | | | 2011 | |
| | | |
Net income attributable to Winthrop Realty Trust | | $ | 28,778 | | | $ | 24,631 | | | $ | 10,933 | |
| | | |
Decrease in Winthop Realty Trust paid in capital adjustments from non-controlling interests | | | 103 | | | | (4,533 | ) | | | — | |
| | | | | | | | | | | | |
| | | |
Changes from net income attributable to Winthrop Realty Trust and transfers from non-controlling interests | | $ | 28,881 | | | $ | 20,098 | | | $ | 10,933 | |
| | | | | | | | | | | | |
The following table sets forth information relating to sales of Common Shares during the years ended December 31, 2009, 2010, 2011, 2012 and 2013:
| | | | | | | | | | |
Date of Issuance / Repurchase | | Number of Shares Issued /
Repurchased | | | Price per Share | | | Type of Offering |
January 15, 2009 | | | 61,292 | | | $ | 10.85 | | | DRIP (1) |
April 15, 2009 | | | 7,462 | | | $ | 8.27 | | | DRIP |
July 15, 2009 | | | 37,982 | | | $ | 8.72 | | | DRIP |
October 15, 2009 | | | 63,471 | | | $ | 8.96 | | | DRIP |
November 27, 2009 | | | 4,450,781 | | | $ | 9.05 | | | Rights Offering (2) |
January 15, 2010 | | | 47,385 | | | $ | 12.73 | | | DRIP |
April 15, 2010 | | | 44,181 | | | $ | 13.75 | | | DRIP |
July 15, 2010 | | | 50,439 | | | $ | 12.15 | | | DRIP |
September 27, 2010 | | | 5,750,000 | | | $ | 12.25 | (3) | | Public Offering |
October 15, 2010 | | | 48,398 | | | $ | 12.53 | | | DRIP |
January 15, 2011 | | | 58,161 | | | $ | 11.70 | | | DRIP |
April 6, 2011 | | | 5,750,000 | | | $ | 11.25 | (3) | | Public Offering |
April 15, 2011 | | | 59,207 | | | $ | 11.63 | | | DRIP |
July 15, 2011 | | | 61,224 | | | $ | 11.35 | | | DRIP |
October 17, 2011 | | | 82,256 | | | $ | 8.46 | | | DRIP |
January 17, 2012 | | | 12,468 | | | $ | 10.67 | | | DRIP |
April 16, 2012 | | | 12,778 | | | $ | 10.60 | | | DRIP |
July 16, 2012 | | | 10,767 | | | $ | 11.96 | | | DRIP |
October 15, 2012 | | | 11,704 | | | $ | 10.24 | | | DRIP |
December 1, 2012 | | | (70,040 | ) | | $ | 10.60 | | | Share Repurchase |
January 13, 2013 | | | 10,142 | | | $ | 11.30 | | | DRIP |
April 17, 2013 | | | 9,904 | | | $ | 12.09 | | | DRIP |
July 16, 2013 | | | 9,192 | | | $ | 12.96 | | | DRIP |
September 26, 2013 | | | 2,750,000 | | | $ | 11.45 | (3) | | Public Offering |
October 16, 2013 | | | 10,069 | | | $ | 10.97 | | | DRIP |
November 11, 2013 | | | 920 | | | $ | 11.69 | | | Option Exercised |
| (1) | The Trust’s Dividend Reinvestment and Stock Purchase Plan. |
| (2) | Rights offering pursuant to which each holder of Common Shares and Series B-1 Preferred Shares received one basic subscription right for every three and one-half Common Shares owned, or in the case of Series B-1 Preferred Shares, one basic subscription right for every three and one-half Common Shares issuable upon conversion of such Series B-1 Preferred Shares. |
| (3) | Before underwriting discount. |
107
In May 2007 the Trust’s shareholders approved the Winthrop Realty Trust 2007 Long Term Incentive Plan (the “2007 Plan”) pursuant to which the Trust can issue options to acquire Common Shares and restricted share awards to its Trustees, directors and consultants. In May 2013 the Trust’s shareholders approved an amendment to the 2007 Plan increasing the number of shares issuable under the plan to 1,000,000. During 2013 the Trust 600,000 Restricted Shares pursuant to the plan amendment. There are 400,000 Common Shares reserved for issuance under the 2007 Plan as of December 31, 2013. No stock options have been issued.
In December 2003 the Board of Trustees granted 20,000 options under a Long Term Incentive Performance Plan to a Trustee who was Interim Chief Executive Officer and Interim Chief Financial Officer. The options had an exercise price of $11.15 and expired on December 16, 2013. The options were exercised on November 11, 2013 and 920 Common Shares were issued. There were no other options granted, cancelled or expired and in March 2005 the plan terminated.
| 17. | Discontinued Operations |
The Trust’s properties in Deer Valley, Arizona; Meriden, Connecticut; Lisle, Illinois; Indianapolis, Indiana; Lafayette, Louisiana; Andover, Massachusetts; St. Louis, Missouri; Knoxville, Tennessee; Memphis, Tennessee; Denton, Texas; and Seabrook, Texas are classified as discontinued operations.
The Knoxville, Tennessee location was classified as discontinued operations as of September 30, 2010. In August 2011 the Trust sold its Knoxville, Tennessee property for net proceeds of $2,151,000 and recorded a $58,000 loss of the sale of the property.
In January 2011 the Trust classified the St. Louis, Missouri property into discontinued operations. In February 2011 the Trust entered into an agreement to sell this property, and in December 2011 the property was sold for net proceeds of $1,485,000. The Trust recorded a $450,000 gain on the sale of the property.
In September 2012, the Indianapolis, Indiana and Memphis, Tennessee properties were classified as discontinued operations and sold. The Indianapolis, Indiana property was sold for net proceeds of $1,071,000 after satisfaction of the debt. The Trust recorded a $945,000 gain on the sale of the property. The Memphis, Tennessee property was sold on September 28, 2012, and the Trust recorded a $698,000 impairment charge, offset by $592,000 of settlement income which is included in discontinued operations for the year ended December 31, 2012.
In March 2013 the Andover, Massachusetts property was classified as discontinued operations and sold. The property was sold for net proceeds of $11,538,000 and the Trust recorded a $2,775,000 gain on the sale of the property.
In June 2013 the Deer Valley, Arizona and Denton, Texas properties were classified as discontinued operations. The Deer Valley, Arizona property was sold in June 2013 for net proceeds of $19,585,000 and the Trust recorded a $6,745,000 gain on the sale of the property.
The Trust recorded an $824,000 impairment charge on the Denton, Texas property in 2012 as a result of a change to the anticipated holding period of this property. The Trust recorded an additional $154,000 impairment charge for this property in June 2013 as a result of the purchase contract. The property was sold in July 2013 and the Trust received net proceeds of $1,703,000.
In August 2013, the Seabrook, Texas property was classified as discontinued operations. The property was sold in August 2013 for net proceeds of $3,202,000 and the Trust recorded a $1,428,000 gain on the sale of the property.
In September 2013, the Trust’s 701 Arboretum property located in Lisle, Illinois was classified as discontinued operations. The Trust had previously recorded a $3,000,000 impairment charge on this property in 2011 as a result of continued declines in occupancy. The Trust recorded an additional $2,750,000 impairment charge in 2013 as a result of the purchase contract. The property was sold in December 2013 for net proceeds of $2,351,000 and the Trust recorded a $58,000 gain on the sale.
The Meriden, Connecticut property was classified as discontinued operations as of December 31, 2013. A purchase and sale contract was signed for a gross sales price of $27,500,000 and the Trust received a non-refundable deposit of $500,000. The sale of the property was consummated on February 26, 2014. After transfer of the debt, the Trust received net proceeds of $5,106,000 on the sale of the property.
108
Results for discontinued operations for the years ended December 31, 2013, 2012 and 2011 are as follows (in thousands):
| | | | | | | | | | | | |
| | | 2013 | | | 2012 | | | 2011 | |
| | | |
Revenues | | $ | 4,552 | | | $ | 8,222 | | | $ | 9,058 | |
Operating expenses | | | (2,655 | ) | | | (3,945 | ) | | | (4,150 | ) |
Depreciation and amortization | | | (1,463 | ) | | | (2,947 | ) | | | (2,850 | ) |
Interest expense | | | (868 | ) | | | (1,463 | ) | | | (2,020 | ) |
Impairment loss | | | (2,904 | ) | | | (1,522 | ) | | | (3,000 | ) |
Gain on sale of assets | | | 11,005 | | | | 945 | | | | 392 | |
Settlement income | | | — | | | | 592 | | | | — | |
Gain on extinguishment of debt | | | — | | | | — | | | | 2,919 | |
| | | | | | | | | | | | |
Income (loss) from discontinued operations | | $ | 7,667 | | | $ | (118 | ) | | $ | 349 | |
| | | | | | | | | | | | |
| 18. | Federal and State Income Taxes |
The Trust has made no provision for regular current or deferred federal income taxes and no deferred state income taxes have been provided for on the basis that the Trust operates in a manner intended to enable it to continue to qualify as a real estate investment trust under Sections 856-860 of the Code. In order to qualify as a REIT, the Trust is generally required each year to distribute to its shareholders at least 90% of its taxable income (excluding any net capital gain). The Trust intends to comply with the foregoing minimum dividend requirements. As of December 31, 2012, the Trust has net operating loss carryforwards of approximately $4,830,000 which will expire in 2023. The Trust does not expect to utilize any of the net operating loss carryforwards to offset 2013 taxable income. The Trust treats certain items of income and expense differently in determining net income reported for financial and tax purposes.
The Trust’s capital loss carryforwards of $31,697,000 are not available in certain states and localities where the Trust has an obligation to pay income taxes. The Trust’s capital loss carryforwards will expire from 2014 through 2015. In addition, certain states and localities disallow state income taxes as a deduction and exclude interest income from United States obligations when calculating taxable income. Federal and state tax calculations can differ due to differing recognition of net operating losses. Accordingly, the Trust has recorded $247,000, $234,000 and $379,000 in state and local taxes for the years ended December 31, 2013, 2012 and 2011, respectively.
Both of the Series B-1 Preferred Shares and Series C Preferred Shares were fully redeemed in 2011.
The 2011 cash dividends per Series B-1 Preferred Share for an individual shareholder’s income tax purposes were as follows:
| | | | | | | | | | | | | | | | |
| | | Ordinary Dividends | | | Capital Gains
15% Rate | | | Nontaxable
Distribution | | | Total Dividends
Paid | |
| | | | |
2011 | | $ | 1.30 | | | $ | — | | | $ | — | | | $ | 1.30 | |
The 2011 cash dividends per Series C Preferred Share for an individual shareholder’s income tax purposes were as follows:
| | | | | | | | | | | | | | | | |
| | | Ordinary Dividends | | | Capital Gains
15% Rate | | | Nontaxable
Distribution | | | Total Dividends
Paid | |
| | | | |
2011 | | $ | 1.30 | | | $ | — | | | $ | — | | | $ | 1.30 | |
109
The 2013 and 2012 cash dividends per Series D Preferred Share for an individual shareholder’s income tax purposes were as follows:
| | | | | | | | | | | | | | | | |
| | | Ordinary Dividends | | | Capital Gains
15% Rate | | | Nontaxable
Distribution | | | Total Dividends
Paid | |
| | | | |
2013 | | $ | 2.31 | | | $ | — | | | $ | — | | | $ | 2.31 | |
2012 | | | 2.31 | | | | — | | | | — | | | | 2.31 | |
The 2013, 2012 and 2011 cash dividends per Common Share for an individual shareholder’s income tax purposes were as follows:
| | | | | | | | | | | | | | | | |
| | | Ordinary Dividends | | | Capital Gains
15% Rate | | | Nontaxable
Distribution | | | Total Dividends
Paid | |
| | | | |
2013 | | $ | 0.65 | | | $ | — | | | $ | — | | | $ | 0.65 | |
2012 | | | 0.49 | | | | — | | | | — | | | | 0.49 | |
2011 | | | 0.69 | | | | — | | | | — | | | | 0.69 | |
The following table reconciles GAAP net income attributable to the Trust to taxable income (in thousands):
| | | | | | | | | | | | |
| | | For the Years Ended December 31, | |
| | | 2013 | | | 2012 | | | 2011 | |
| | | |
Net income(loss) attributable to Winthrop Realty Trust | | $ | 28,778 | | | $ | 24,631 | | | $ | 10,933 | |
| | | |
Book/Tax differences from depreciation and amortization expense | | | 9,563 | | | | 5,297 | | | | 4,588 | |
Book/Tax differences of accretion of discount | | | (4,121 | ) | | | (8,333 | ) | | | (13,401 | ) |
Book/Tax differences of unrealized gains | | | (73 | ) | | | (6,923 | ) | | | (2,788 | ) |
Book/Tax differences on gains/losses from capital transactions | | | (14,848 | ) | | | (1,876 | ) | | | (5,842 | ) |
Book/Tax differences on Preferred Shares | | | — | | | | — | | | | 1,428 | |
Book/Tax differences for impairment losses | | | 2,904 | | | | 3,260 | | | | 7,600 | |
Book/Tax differences on investments in unconsolidated joint ventures | | | (17,880 | ) | | | 4,131 | | | | 31,634 | |
Other book/tax differences, net | | | 4,194 | | | | (8,781 | ) | | | (766 | ) |
Book/Tax differences on dividend income | | | — | | | | (452 | ) | | | (371 | ) |
Book/Tax differences of market discount | | | — | | | | 14,065 | | | | 13,250 | |
| | | | | | | | | | | | |
| | | |
Taxable income | | $ | 8,517 | | | $ | 25,019 | | | $ | 46,265 | |
| | | | | | | | | | | | |
| 19. | Commitments and Contingencies |
The Trust is involved from time to time in litigation on various matters, including disputes with tenants and disputes arising out of agreements to purchase or sell properties. Given the nature of the Trust’s business activities, these lawsuits are considered routine to the conduct of its business. The result of any particular lawsuit cannot be predicted because of the very nature of litigation, the litigation process and its adversarial nature, and the jury system. The Trust does not expect that the liabilities, if any, that may ultimately result from such legal actions will have a material adverse effect on its financial condition or results of operations.
In addition to the initial purchase price of certain loans and operating properties and initial investments in equity investments, the Trust has future funding commitments which total approximately $71,092,000 at December 31, 2013. The Trust also has ground lease commitments of $1,405,000, $1,463,000, $1,592,000, $1,656,000, $1,791,000 and $107,627,000 for the years ended December 31, 2014, 2015, 2016, 2017, 2018 and thereafter, respectively.
See Note 20 – related-party transactions for details on potential fees payable to our Advisor.
110
In 2011 the Trust was conveyed title to the land underlying the Churchill, Pennsylvania property. Prior to the conveyance of the land, a Phase II environmental study was performed. The study found that there were certain contaminants at the property all of which were within permitted ranges. In addition, given the nature and use of the property currently and in the past, it is possible that additional contamination could occur which could require remediation. The Trust believes that based on applicable law and existing agreements any such remediation costs would be the responsibility of a prior owner or tenant.
| 20. | Related-Party Transactions |
FUR Advisors
The activities of the Trust are administered by FUR Advisors LLC (“FUR Advisors”) pursuant to the terms of the Advisory Agreement between the Trust and FUR Advisors. FUR Advisors is controlled by and partially owned by the executive officers of the Trust. Pursuant to the terms of the Advisory Agreement, FUR Advisors is responsible for providing asset management services to the Trust and coordinating with the Trust’s shareholder transfer agent and property managers. FUR Advisors is entitled to receive a base management fee. In addition, FUR Advisors or its affiliate is also entitled to receive property and construction management fees subject to the approval of the Independent Trustees of the Trust.
The following table sets forth the fees and reimbursements paid by the Trust for the years ended December 31, 2013, 2012 and 2011 to FUR Advisors and Winthrop Management (in thousands):
| | | | | | | | | | | | |
| | | For the Years Ended | |
| | | December 31, 2013 | | | December 31, 2012 | | | December 31, 2011 | |
Base Asset Management Fee (1) | | $ | 9,289 | | | $ | 8,953 | | | $ | 7,690 | |
Property Management Fee | | | 1,226 | | | | 724 | | | | 537 | |
Construction Management Fee | | | 397 | | | | 128 | | | | 1 | |
| | | | | | | | | | | | |
| | $ | 10,912 | | | $ | 9,805 | | | $ | 8,228 | |
| | | | | | | | | | | | |
| (1) | The base asset management fee paid by the Trust for third party equity contributions amounted to $100,000, $139,000 and $49,000 for the years ended December 31, 2013, 2012 and 2011, respectively. |
At December 31, 2013, $2,423,000 payable to FUR Advisors and $408,000 payable to Winthrop Management were included in related party fees payable.
Base Asset Management Fee – FUR Advisors is entitled to receive a base management fee of 1.5% of equity as defined in the Advisory Agreement and in certain instances, a termination fee and/or an incentive fee in accordance with the terms of the Advisory Agreement. Additionally, FUR Advisors receives a fee equal to 0.25% of any equity contributions by unaffiliated third parties to a venture managed by the Trust.
Incentive Fee / Supplemental Fee –In certain circumstances, FUR Advisors is entitled to receive an incentive fee and/or a supplemental fee.
The incentive fee is equal to 20% of any amounts available for distribution in excess of the threshold amount and is only payable at such time, if at all, (i) when holders of our Common Shares receive aggregate dividends above the threshold amount or (ii) upon termination of the Advisory Agreement if the net value of our assets exceeds the threshold amount based on then current market values and appraisals. That is, the incentive fee is not payable annually but only at such time, if at all, as shareholders have received dividends in excess of the threshold amount (set at $534,224,000 on December 31, 2012 plus the issuance price for any equity interests in the Trust issued from and after January 1, 2013 plus an annual return thereon equal to the greater of (x) 4% or (y) the 5 year U.S. Treasury Yield plus 2.5% (such return, the “Growth Factor”) less any dividends paid from and after January 1, 2013). The incentive fee will also be payable if the Advisory Agreement is terminated, other than for cause (as defined) by us or with cause by our Advisor, and if on the date of termination the net value of the Trust’s assets exceeds the threshold amount. At December 31, 2013 the threshold amount required to be distributed before any incentive fee would be payable to FUR Advisors was $563,966,000, which was equivalent to $15.75 per diluted Common Share.
With respect to the supplemental fee, it is only payable if there is (i) a termination of the Advisory Agreement for any reason other than for cause (as defined) by us or with cause by our Advisor, (ii) a disposition of all or substantially all of our assets, or (iii) an election by us to orderly liquidate our assets. The supplemental fee, if payable, is equal to the lesser of (i) the base
111
management fee paid to our Advisor for the prior twelve month period or (ii) either (x) in the case of a termination of the Advisory Agreement, 20% of the positive difference, if any between (A) the appraised net asset value of our assets at the date of termination and (B) the threshold amount less $104,980,000, or (y) in the case of a disposition or liquidation, 20% of any dividends paid on account of our Common Shares at such time as the threshold amount is reduced to $104,980,000, which will be achieved at such time as aggregate distributions of approximately $12.82 per Common Share in excess of the Growth Factor have been paid. For example, if the Trust had been liquidated at January 1, 2014, the supplemental fee would only have been payable if total dividends of approximately $12.82 per Common Share had been paid, and then only until the total supplemental fee paid would have equaled $9,289,000 (the base management fee for calendar 2013), which amount would be achieved when total dividends paid per Common Share equaled approximately $14.12.
Property Management and Construction Management -Winthrop Management, an affiliate of FUR Advisors and the Trust’s executive officers, assumed property management responsibilities for various properties owned by the Trust. Winthrop Management receives a property management fee and construction management fee pursuant to the terms of individual property management agreements. Construction management fees are capitalized in accordance with GAAP.
Winthrop Management
Winthrop Management, an affiliate of FUR Advisors and the Trust’s executive officers, assumed property management responsibilities for various properties owned by the Trust pursuant to the terms of individual property management agreements.
Other Transactions
On October 4, 2012 the Trust purchased from an affiliate of FUR Advisors for $75,000 a 100% membership interest in the entity that holds fee simple title to a Class B office building located in Cerritos, California.
| 21. | Restricted Share Grants |
On February 1, 2013 the Board approved the issuance of 600,000 shares of Restricted Common Shares (“Restricted Shares”) to the Trust’s Advisor, 500,000 of which were subject to the approval of the shareholders to the increase in the number of shares issuable under the 2007 Plan. The initial 100,000 Restricted Shares were issued on February 28, 2013. At the May 21, 2013 annual shareholders meeting the increase in shares issuable under the SOP from 100,000 to 1,000,000 was approved by the requisite number of shareholders and the remaining 500,000 shares were issued on May 28, 2013. The Restricted Shares are subject to forfeiture through December 31, 2017. Except in limited circumstances, if the holder of the Restricted Shares does not remain in continuous employment with FUR Advisors or its affiliate through December 31, 2017 (the “Forfeiture Period”), all of their rights to the Restricted Shares and the associated dividends held in escrow will be forfeited. Dividends will be paid on the issued Restricted Shares in conjunction with dividends on Common Shares not issued under the 2007 Plan. However, the recipients of the Restricted Shares will only receive dividends as if the shares vested quarterly over the Forfeiture Period, with the remaining dividends to be placed into escrow and paid to the holders at the expiration of the Forfeiture Period.
Until the awards are no longer subject to forfeiture, the Trust measures stock-based compensation expense at each reporting date for any changes in fair value and recognizes the expense prorated for the portion of the requisite service period completed. Accordingly, the Trust recognized $899,000 in non-cash compensation expense for the year ended December 31, 2013. As of December 31, 2013 7,500 Restricted Shares had been forfeited. As of December 31, 2013 there was $5,648,000 of unrecognized compensation cost associated with the 592,500 shares subject to forfeiture.
112
| 22. | Future Minimum Lease Payments |
Future minimum lease payments scheduled to be received under non-cancellable operating leases are as follows (amounts in thousands):
| | | | |
Year | | Amount | |
2014 | | $ | 49,680 | |
2015 | | | 46,993 | |
2016 | | | 42,425 | |
2017 | | | 39,740 | |
2018 | | | 33,099 | |
Thereafter | | | 127,496 | |
| | | | |
| | $ | 339,433 | |
| | | | |
Spectra Energy represented more than 10% of the base rental revenues of the Trust for the year ended December 31, 2013 contributing approximately 12.1%. This tenant represented approximately 16.7% of the total rentable square footage of the consolidated operating portfolio.
Spectra Energy represented more than 10% of the base rental revenues of the Trust for the year ended December 31, 2012 contributing approximately 19.7%. This tenant represented approximately 17.5% of the total rentable square footage of the consolidated operating portfolio.
Spectra Energy represented more than 10% of the base rental revenues of the Trust for the year ended December 31, 2011 contributing approximately 21.8%. This tenant represented approximately 14.5% of the total rentable square footage of the consolidated operating portfolio.
These revenues are reported in the operating properties business segment.
The Financial Accounting Standards Board (“FASB”) guidance on segment reporting establishes standards for the way that public business enterprises report information about reportable segments in financial statements and requires that those enterprises report selected financial information about reportable segments in financial reports issued to shareholders.
Based on the Trust’s method of internal reporting, management determined that is has three reportable segments: (i) the ownership of operating properties; (ii) the origination and acquisition of loans and debt securities secured directly or indirectly by commercial and multi-family real property – collectively, loan assets; and (iii) the ownership of equity and debt securities in other REITs – REIT securities. The accounting policies of the segments are identical to those described in Note 2.
The operating properties segment includes all of the Trust’s wholly and partially owned operating properties. The loan assets segment includes all of the Trust’s activities related to real estate loans including loans receivable, loan securities and equity investments in loan related entities. The REIT securities segment includes all of the Trust’s activities related to the ownership of securities in other publicly traded real estate companies. In addition to its three business segments, the Trust reports non-segment specific income and expense under corporate income (expense).
113
The following table summarizes the Trust’s assets by reportable segment and capital expenditures incurred for the Trust’s operating properties for the years ended December 31, 2013 and 2012 (in thousands):
| | | | | | | | |
| | | December 31, 2013 | | | December 31, 2012 | |
| | |
Assets | | | | | | | | |
Operating properties | | $ | 845,698 | | | $ | 562,822 | |
Loan assets | | | 147,702 | | | | 239,534 | |
REIT securities | | | — | | | | 19,694 | |
Corporate | | | | | | | | |
Cash and cash equivalents | | | 112,512 | | | | 97,682 | |
Restricted cash | | | 186 | | | | — | |
Accounts receivable and prepaids | | | 543 | | | | 336 | |
Deferred financing costs | | | 2,645 | | | | 3,095 | |
Discontinued operations | | | 23,038 | | | | — | |
| | | | | | | | |
Total Assets | | $ | 1,132,324 | | | $ | 923,163 | |
| | | | | | | | |
| | |
Capital Expenditures | | | | | | | | |
Operating Properties | | $ | 3,892 | | | $ | 12,417 | |
| | | | | | | | |
114
The Trust defines net operating income for each segment presented as all items of income and expense directly derived from or incurred by each business segment before depreciation, amortization and interest expense. Interest on cash reserves, general and administrative expenses and other non-segment specific income and expense items are reported under corporate income (expense). The following table presents a summary of revenues from operating properties, loan assets and REIT securities and expenses incurred by each segment for the years ended December 31, 2013, 2012, and 2011 (in thousands):
| | | | | | | | | | | | |
| | | 2013 | | | 2012 | | | 2011 | |
Operating Properties | | | | | | | | | | | | |
Rents and reimbursements | | $ | 61,103 | | | $ | 44,213 | | | $ | 35,848 | |
Operating expenses | | | (20,724 | ) | | | (13,614 | ) | | | (12,437 | ) |
Real estate taxes | | | (5,876 | ) | | | (3,672 | ) | | | (3,541 | ) |
Equity in earnings of preferred equity investment in Fenway - Wateridge | | | 613 | | | | — | | | | — | |
Equity in (loss) income of Marc Realty investments | | | (284 | ) | | | 33 | | | | (775 | ) |
Equity in (loss) income of Sealy Northwest Atlanta | | | (469 | ) | | | (388 | ) | | | 4,308 | |
Equity in loss of Sealy Airpark Nashville | | | — | | | | — | | | | (1,034 | ) |
Equity in loss of Sealy Newmarket | | | — | | | | (2,811 | ) | | | (2,936 | ) |
Equity in income of Vintage | | | 9,174 | | | | 4,603 | | | | 113 | |
Equity in income of WRT-Elad | | | 1,315 | | | | 903 | | | | — | |
Equity in income of Mentor | | | 84 | | | | 46 | | | | — | |
Equity in income of 701 Seventh Avenue | | | 3,424 | | | | — | | | | — | |
Equity in income of Fenway - Wateridge | | | 183 | | | | — | | | | — | |
Equity of loss in Atrium Mall | | | (90 | ) | | | — | | | | — | |
Equity in income of F-II Co-invest | | | — | | | | 232 | | | | — | |
| | | | | | | | | | | | |
Operating properties operating income | | | 48,453 | | | | 29,545 | | | | 19,546 | |
Depreciation and amortization expense | | | 20,443 | | | | (15,119 | ) | | | (10,692 | ) |
Interest expense | | | (14,204 | ) | | | (12,348 | ) | | | (11,057 | ) |
Impairment loss on investments in real estate | | | — | | | | (1,738 | ) | | | (4,600 | ) |
Impairment loss on Marc Realty equity investments | | | (7,687 | ) | | | — | | | | (15,764 | ) |
Impairment loss on Sealy equity investments | | | — | | | | — | | | | (5,294 | ) |
(Loss) gain on extinguishment of debt | | | — | | | | (121 | ) | | | 6,439 | |
Settlement (expense) income | | | (411 | ) | | | — | | | | 5,868 | |
Gain on consolidation of property | | | — | | | | — | | | | 818 | |
| | | | | | | | | | | | |
Operating properties net income (loss) | | | 46,594 | | | | 219 | | | | (14,736 | ) |
| | | | | | | | | | | | |
Loan Assets | | | | | | | | | | | | |
Interest income | | | 14,334 | | | | 11,736 | | | | 11,073 | |
Discount accretion | | | 4,121 | | | | 8,333 | | | | 13,401 | |
Equity in earnings of preferred equity investment in Marc Realty | | | — | | | | — | | | | 338 | |
Equity in earnings of Lex-Win Concord | | | — | | | | — | | | | 258 | |
Equity in earnings of Concord Debt Holdings | | | 3,072 | | | | 422 | | | | 3,216 | |
Equity in earnings of CDH CDO | | | 1,033 | | | | 1,715 | | | | 480 | |
Equity in earnings (loss) of Concord Debt Holdings (1) | | | 64 | | | | (456 | ) | | | — | |
Equity in earnings (loss) of CDH CDO (1) | | | 4,926 | | | | (997 | ) | | | — | |
Equity in earnings of ROIC Riverside | | | — | | | | 706 | | | | 936 | |
Equity in (loss) earnings of ROIC Lakeside Eagle | | | (25 | ) | | | (42 | ) | | | 664 | |
Equity in earnings of 46th Street Gotham | | | — | | | | — | | | | 621 | |
Equity in earnings of Sofitel | | | �� | | | | — | | | | 2,177 | |
Equity in earnings of RE CDO Management | | | 3,709 | | | | 67 | | | | 46 | |
Equity in (loss) earnings of Socal Office Loan Portfolio | | | (2 | ) | | | 9,706 | | | | 272 | |
Equity in earnings of WRT-Stamford | | | 930 | | | | 769 | | | | — | |
Equity in earnings of 10 Metrotech | | | 3,284 | | | | 335 | | | | — | |
Realized gain on sale of loan securities carried at fair value | | | — | | | | 614 | | | | — | |
Unrealized gain on loan securities carried at fair value | | | 215 | | | | 447 | | | | 2,738 | |
| | | | | | | | | | | | |
Loan assets operating income | | | 35,661 | | | | 33,355 | | | | 36,220 | |
General and administrative expense | | | (46 | ) | | | (121 | ) | | | (75 | ) |
Interest expense | | | (1,898 | ) | | | (1,494 | ) | | | (850 | ) |
Provision for loss on loans receivable | | | (348 | ) | | | — | | | | — | |
| | | | | | | | | | | | |
Loan assets net income | | | 33,369 | | | | 31,740 | | | | 35,295 | |
| | | | | | | | | | | | |
REIT Securities | | | | | | | | | | | | |
Dividends | | | — | | | | 1,054 | | | | 984 | |
Gain on sale of securities carried at fair value | | | 742 | | | | 41 | | | | 123 | |
Unrealized gain on securities carried at fair value | | | (142 | ) | | | 6,916 | | | | 2,788 | |
| | | | | | | | | | | | |
REIT securities net income | | | 600 | | | | 8,011 | | | | 3,895 | |
| | | | | | | | | | | | |
Net Income from segments before corporate income (expense) | | | 80,563 | | | | 39,970 | | | | 24,454 | |
Reconciliations to GAAP Net Income: | | | | | | | | | | | | |
Corporate Income (Expense) | | | | | | | | | | | | |
Interest and other income | | | 375 | | | | 699 | | | | 1,175 | |
General and administrative | | | (4,317 | ) | | | (3,408 | ) | | | (3,452 | ) |
Related Party Fees | | | (9,289 | ) | | | (8,953 | ) | | | (7,690 | ) |
Transaction costs | | | (1,885 | ) | | | (421 | ) | | | (519 | ) |
Interest expense | | | (7,310 | ) | | | (3,153 | ) | | | (2,094 | ) |
Loss on redemption of Series B-1 Preferred Shares | | | — | | | | — | | | | (100 | ) |
Federal, state and local taxes | | | (430 | ) | | | (232 | ) | | | (376 | ) |
| | | | | | | | | | | | |
Income from continuing operations before non-controlling interest | | | 16,821 | | | | 24,502 | | | | 11,398 | |
Non-controlling interest | | | 4,290 | | | | 247 | | | | (814 | ) |
| | | | | | | | | | | | |
Income from continuing operations attributable to Winthrop Realty Trust | | $ | 21,111 | | | $ | 24,749 | | | $ | 10,584 | |
| | | | | | | | | | | | |
115
| 24. | Variable Interest Entities |
Consolidated Variable Interest Entities
Consolidated variable interest entities are those where the Trust is the primary beneficiary of a variable interest entity. The primary beneficiary is the party that has a controlling financial interest in the VIE, which is defined by the entity having both of the following characteristics: 1) the power to direct the activities that, when taken together, most significantly impact the VIE’s economic performance, and 2) the obligation to absorb losses or the right to receive the returns from the VIE that could potentially be significant to the VIE. The Trust’s office properties in Cerritos, California and Philadelphia, Pennsylvania are consolidated VIEs. The Trust has no future funding obligation to these entities, and the Trust’s maximum exposure to loss is limited to its invested capital.
Variable Interest Entities Not Consolidated
Equity Method and Preferred Equity Investments - The Trust has reviewed its various equity method and preferred equity investments and identified nine investments for which the Trust holds a variable interest in a VIE. Of these nine interests there are five investments for which the underlying entities do not have sufficient equity at risk to permit them to finance their activities without additional subordinated financial support. There are four additional entities for which the VIE assessment was primarily based on the fact that the voting rights of the entity holders are not proportional to their obligations to absorb expected losses and rights to receive residual returns of the legal entities. These unconsolidated joint ventures are those where the Trust is not the primary beneficiary of a VIE.
Loans Receivable and Loan Securities -The Trust has reviewed its loans receivable and loan securities and four of these assets have been identified as variable interests in a VIE. Of these four assets there are three investments for which the equity investment at risk at the borrowing entity level is not considered sufficient for the entity to finance its activities without additional subordinated financial support. There is one loan asset for which the VIE assessment was made primarily based on the fact that the equity holders or the underlying investment lack the right to receive returns due to the lender’s participation interest.
Certain loans receivable and loan securities which have been determined to be VIEs are performing assets, meeting their debt service requirements, and the borrowers hold title to the collateral. In these cases the borrower holds legal title to the real estate collateral and has the power to direct the activities that most significantly impact the economic performance of the VIE, including management and leasing activities. In the event of default under these loans the Trust only has protective rights and has the risk to absorb losses only to the extent of its loan investment. The borrower has been determined to be the primary beneficiary for these performing assets.
The Trust has determined that it does not currently have the power to direct the activities of the ventures collateralizing any of its loans receivable and loan securities. For this reason, management believes that it does not control, nor is it the primary beneficiary of these ventures. Accordingly, the Trust accounts for these investments under the guidance for loans receivable and real estate debt investments.
116
| 25. | Quarterly Results of Operations (Unaudited) |
The following is an unaudited condensed summary of the results of operations by quarter for the years ended December 31, 2013 and 2012. The Trust believes all adjustments (consisting of normal recurring accruals) necessary to present fairly such interim combined results in conformity with accounting principles generally accepted in the United States of America have been included.
| | | | | | | | | | | | | | | | |
| (In thousands, except per-share data) | | Quarters Ended | |
| | | March 31 | | | June 30 | | | September 30 | | | December 31 | |
2013 | | | | | | | | | | | | | | | | |
| | | | |
Revenues | | $ | 19,036 | | | $ | 19,040 | | | $ | 18,255 | | | $ | 23,227 | |
| | | | | | | | | | | | | | | | |
Net income (loss) attributable to Winthrop Realty Trust | | $ | 13,746 | | | $ | 8,374 | | | $ | 11,728 | | | $ | (5,070 | ) |
| | | | | | | | | | | | | | | | |
Net income (loss) applicable to Common Shares | | $ | 10,943 | | | $ | 5,490 | | | $ | 8,835 | | | $ | (7,946 | ) |
| | | | | | | | | | | | | | | | |
| | | | |
Per share | | | | | | | | | | | | | | | | |
Net income (loss) applicable to Common Shares, basic | | $ | 0.33 | | | $ | 0.17 | | | $ | 0.27 | | | $ | (0.22 | ) |
| | | | | | | | | | | | | | | | |
Net income (loss) applicable to Common Shares, diluted | | $ | 0.33 | | | $ | 0.17 | | | $ | 0.27 | | | $ | (0.22 | ) |
| | | | | | | | | | | | | | | | |
| | | | |
2012 | | | | | | | | | | | | | | | | |
| | | | |
Revenues | | $ | 15,827 | | | $ | 16,753 | | | $ | 15,204 | | | $ | 17,552 | |
| | | | | | | | | | | | | | | | |
Net income (loss) attributable to Winthrop Realty Trust | | $ | 8,253 | | | $ | 3,358 | | | $ | 15,108 | | | $ | (2,088 | ) |
| | | | | | | | | | | | | | | | |
Net income (loss) applicable to Common Shares | | $ | 7,328 | | | $ | 571 | | | $ | 12,322 | | | $ | (4,875 | ) |
| | | | | | | | | | | | | | | | |
| | | | |
Per share | | | | | | | | | | | | | | | | |
Net income (loss) applicable to Common Shares, basic | | $ | 0.22 | | | $ | 0.02 | | | $ | 0.37 | | | $ | (0.15 | ) |
| | | | | | | | | | | | | | | | |
Net income (loss) applicable to Common Shares, diluted | | $ | 0.22 | | | $ | 0.02 | | | $ | 0.37 | | | $ | (0.15 | ) |
| | | | | | | | | | | | | | | | |
All relevant events or transactions that occurred after the balance sheet date not otherwise disclosed and incorporated in the Notes to the Consolidated Financial Statements are described below.
Playa Vista Loan Modification -On January 10, 2014 the mezzanine loan agreement was amended to increase the principal balance by $4,000,000 and to increase the interest rate by 1.5% to a rate of 16.25% per annum. The Trust’s share of the increased loan amount was $2,000,000. To date, the Trust has funded $1,375,000.
Newbury Apartments Property Sale – On February 26, 2014 the Trust sold its interest in the Newbury Apartments property located in Meriden, Connecticut for gross sale proceeds of $27,500,000.
Freed Management Loan Origination- On March 5, 2014 the Trust originated a $15,500,000 mezzanine loan secured by a majority of the limited partnership interests in entities controlled by Freed Management that indirectly hold Edens Plaza and Norridge Commons, two retail shopping centers in Chicago, Illinois. The Trust also acquired the general partnership interest in each of the above entities for an aggregate price of $500,000. The loan bears interest at LIBOR plus 12% per annum (increasing by 100 basis points in each extended term), requires payments of current interest at a rate of 10% per annum (increasing by 50 basis points each year) and has a three-year term, subject to two, one-year extensions. Upon satisfaction of the loan, the Trust will be entitled to a participation interest equal to the greater of (i) a 14.5% IRR (increasing to 15.5% IRR after the initial term) and (ii) 30% (increasing by 40% after the initial term and 50% after the first extended term) of the value of the properties in excess of $115,000,000. As additional collateral for the loan, the Trust acquired a pledge of the interests held by Freed Management and its affiliates in the Sullivan Center and Mentor Retail ventures.
117
ITEM 9 – CHANGES IN AND DISAGREEMENTS WITH ACCOUNTANTS ON ACCOUNTING AND FINANCIAL DISCLOSURE
None.
ITEM 9A – CONTROLS AND PROCEDURES
Evaluation of Disclosure Controls and Procedures
An evaluation was performed under the supervision and with the participation of our management, including our Chief Executive Officer and Chief Financial Officer, of the effectiveness of our disclosure controls and procedures (as defined in Rule 13a-15(e) under the Exchange Act) as of December 31, 2013. Based on such evaluation, the Trust’s Chief Executive Officer and Chief Financial Officer have concluded that, as of the end of such period, the Trust’s disclosure controls and procedures are effective.
Management’s Report on Internal Control Over Financial Reporting
The Trust’s management is responsible for establishing and maintaining adequate internal control over financial reporting. The Trust’s internal control over financial reporting is a process which was designed under the supervision of the Trust’s principal executives and principal financial officers to provide reasonable assurance regarding the reliability of financial reporting and the preparation of the Trust’s financial statements for external reporting purposes in accordance with U.S. generally accepted accounting principles.
Our internal control over financial reporting includes policies and procedures that pertain to the maintenance of records that, in reasonable detail, accurately and fairly reflect transactions and dispositions of assets; provide reasonable assurances that transactions are recorded as necessary to permit preparation of financial statements in accordance with U.S. generally accepted accounting principles, and that receipts and expenditures are being made only in accordance with authorizations of management and the Trustees of the Trust; and provide reasonable assurance regarding prevention or timely detection of unauthorized acquisition, use or disposition of the Trust’s assets that could have a material affect on our financial statements.
As of December 31, 2013 the Trust’s management conducted an assessment of the effectiveness of the Trust’s internal control over financial reporting. The Trust’s management used the criteria set forth by the Committee of Sponsoring Organizations of the Treadway Commission (COSO) (1992) in “Internal Control - Integrated Framework.” Based on that assessment and those criteria, we concluded that our internal control over financial reporting is effective as of December 31, 2013.
The effectiveness of the Trust’s internal control over financial reporting as of December 31, 2013 has been audited by PricewaterhouseCoopers LLP, an independent registered public accounting firm, as stated in their report appearing in this Form 10-K.
Changes in Internal Controls Over Financial Reporting
There has been no change in our internal control over financial reporting during our last fiscal quarter ended December 31, 2013 that has materially affected, or is reasonably likely to materially affect, our internal control over financial reporting.
ITEM 9B – OTHER INFORMATION
None
118
PART III
ITEM 10 – DIRECTORS, EXECUTIVE OFFICERS AND CORPORATE GOVERNANCE
Information about Trustees of the Trust may be found under the caption “Election of Trustees” presented in our Proxy Statement for the Annual Meeting of Shareholders, expected to be held in May 2014, which we refer to as the Proxy Statement. That information is incorporated herein by reference.
The information in the Proxy Statement under the captions “Executive Officers” “Section 16(a) Beneficial Ownership Reporting Compliance”, “Audit Committee Financial Expert” and “Code of Ethics” presented in the Proxy Statement is incorporated herein by reference.
ITEM 11 – EXECUTIVE COMPENSATION
The information in the Proxy Statement under the captions “Compensation of Trustees” and “Executive Compensation” presented in the Proxy Statement is incorporated herein by reference.
ITEM 12 – SECURITY OWNERSHIP OF CERTAIN BENEFICIAL OWNERS AND MANAGEMENT AND RELATED STOCKHOLDER MATTERS
The information in the Proxy Statement under the caption “Security Ownership of Trustees, Officers and Others” presented in the Proxy Statement is incorporated herein by reference.
ITEM 13 – CERTAIN RELATIONSHIPS AND RELATED TRANSACTIONS, AND DIRECTOR INDEPENDENCE
The information in the Proxy Statement under the caption “Certain Transactions and Relationships” and “Independence of Trustees” presented in the Proxy Statement is incorporated herein by reference.
ITEM 14 – PRINCIPAL ACCOUNTANT FEES AND SERVICES
The information in the Proxy Statement under the captions “Compensation of Trustees” and “Principal Accountant Fees and Services” presented in the Proxy Statement is incorporated herein by reference.
119
PART IV
ITEM 15 – EXHIBITS AND FINANCIAL STATEMENT SCHEDULES
(a) Financial Statements and Financial Statement Schedules.
(1) Financial Statements:
Report of Independent Registered Public Accounting Firm on page 64 of Item 8.
Management’s Report on Internal Controls over Financial Reporting on page 118 of Item 9A.
Consolidated Balance Sheets - December 31, 2013 and 2012 on page 66 of Item 8.
Consolidated Statements of Operations and Comprehensive Income - For the Years Ended December 31, 2013, 2012 and 2011 on page 67 of Item 8.
Consolidated Statements of Shareholders’ Equity - For the Years Ended December 31, 2013, 2012 and 2011 on page 68 of Item 8.
Consolidated Statements of Cash Flows - For the Years Ended December 31, 2013, 2012 and 2011 on pages 70 and 71 of Item 8.
Notes to Consolidated Financial Statements on pages 72 through 117 of Item 8.
(2) Financial Statement Schedules:
Schedule III - Real Estate and Accumulated Depreciation.
Schedule IV – Mortgage Loans on Real Estate
All Schedules, other than III and IV, are omitted, as the information is not required or is otherwise furnished.
The Trust’s unconsolidated joint ventures, 701 Seventh WRT Investors LLC and Vintage Housing Holdings LLC, meet the definition of a significant subsidiary under S-X 210.1-02(w) and financial statements for these entities will be filed as an amendment to this Form 10-K.
(b) Exhibits.
The exhibits listed on the Exhibit Index on page 125 are filed as a part of this Report or incorporated by reference.
120
SIGNATURES
Pursuant to the requirements of Section 13 or 15(d) of the Securities Exchange Act of 1934, as amended, the Trust has duly caused this report to be signed on its behalf by the undersigned, thereunto duly authorized.
| | | | | | |
| | | | WINTHROP REALTY TRUST |
| | | |
| Dated: March 17, 2014 | | | | By: | | /s/ Michael L. Ashner |
| | | | | | Michael L. Ashner |
| | | | | | Chief Executive Officer |
| | | |
| Dated: March 17, 2014 | | | | By: | | /s/ John A. Garilli |
| | | | | | John A. Garilli |
| | | | | | Chief Financial Officer |
| | | | | | (Principal Financial Officer and Principal Accounting Officer) |
Pursuant to the requirements of the Securities Exchange Act of 1934, this report has been signed below by the following persons on behalf of the Registrant and in the capacities and on the dates indicated.
| | | | |
| Name | | Title | | Date |
| | |
/s/ Michael L. Ashner | | Trustee | | March 17, 2014 |
| | |
/s/ Carolyn Tiffany | | Trustee | | March 17, 2014 |
| | |
| Arthur Blasberg, Jr. | | | | |
| Howard Goldberg | | | | |
| Thomas McWilliams | | | | |
| Lee Seidler | | | | |
| Steven Zalkind | | Trustee | | March 17, 2014 |
| | |
| By: | | /s/ Carolyn Tiffany |
| | Carolyn Tiffany, as attorney-in fact |
121
WINTHROP REALTY TRUST
SCHEDULE III
REAL ESTATE AND ACCUMULATED DEPRECIATION
At December 31, 2013
(amounts in thousands)
| | | | | | | | | | | | | | | | | | | | | | | | | | | | | | | | | | | | | | | | | | | | |
| | | | | | | | | | Initial Cost to Registrant | | | Cost
capitalized/(impaired)
subsequent to
acquisition | | | | | | As of December 31, 2013 | | | | | | | | | | |
Description | | Location | | Location | | Mortgage
Encumbrances | | | Land | | | Building and
Improvements | | | Land/Building and
Improvements | | | Land | | | Building and
Improvements | | | Total | | | Accumulated
Depreciation | | | Date
Acquired | | | Life | |
| | | | | | | | | | | | |
Office | | Orlando | | FL | | $ | 36,983 | | | $ | — | | | $ | 17,248 | | | $ | 42 | | | $ | — | | | $ | 17,290 | | | $ | 17,290 | | | $ | 3,944 | | | | 11/2004 | | | | (1) | |
Office | | Plantation | | FL | | | 10,684 | | | | — | | | | 8,915 | | | | 4,020 | | | | 4,000 | | | | 8,935 | | | | 12,935 | | | | 2,038 | | | | 11/2004 | | | | (1) | |
Office | | Chicago | | IL | | | 19,856 | | | | — | | | | 23,635 | | | | 2,875 | | | | — | | | | 26,510 | | | | 26,510 | | | | 5,792 | | | | 10/2005 | | | | (1) | |
Office | | Amherst | | NY | | | — | | | | 1,591 | | | | 18,027 | | | | 1,377 | | | | 2,573 | | | | 18,422 | | | | 20,995 | | | | 3,887 | | | | 5/2005 | | | | (1) | |
Office | | South Burlington | | VT | | | — | | | | — | | | | 3,099 | | | | 309 | | | | — | | | | 3,408 | | | | 3,408 | | | | 671 | | | | 12/2005 | | | | (1) | |
Office | | Chicago | | IL | | | 8,579 | | | | 1,149 | | | | 9,989 | | | | 5,631 | | | | 1,149 | | | | 15,620 | | | | 16,769 | | | | 2,517 | | | | 10/2007 | | | | (1) | |
Office | | Houston | | TX | | | 47,201 | | | | 7,075 | | | | 62,468 | | | | — | | | | 7,075 | | | | 62,468 | | | | 69,543 | | | | 14,185 | | | | 1/2005 | | | | (1) | |
Office | | Lisle | | IL | | | 5,752 | | | | 3,774 | | | | 16,371 | | | | 2,461 | | | | 3,774 | | | | 18,832 | | | | 22,606 | | | | 3,779 | | | | 2/2006 | | | | (1) | |
Office | | Lisle | | IL | | | 5,470 | | | | 780 | | | | 2,803 | | | | 689 | | | | 780 | | | | 3,492 | | | | 4,272 | | | | 635 | | | | 2/2006 | | | | (1) | |
Office | | Englew ood | | CO | | | — | | | | 2,580 | | | | 5,403 | | | | 3,347 | | | | 2,580 | | | | 8,750 | | | | 11,330 | | | | 1,341 | | | | 11/2010 | | | | (1) | |
Office | | Englew ood | | CO | | | — | | | | 1,829 | | | | 5,612 | | | | 717 | | | | 1,829 | | | | 6,329 | | | | 8,158 | | | | 875 | | | | 12/2010 | | | | (1) | |
Office | | New York | | NY | | | 51,950 | | | | — | | | | 52,778 | | | | 7,469 | | | | — | | | | 60,247 | | | | 60,247 | | | | 3,740 | | | | 11/2011 | | | | (1) | |
Office | | Cerritos | | CA | | | 23,142 | | | | 4,114 | | | | 16,190 | | | | 3,419 | | | | 4,114 | | | | 18,681 | | | | 22,795 | | | | 911 | | | | 10/2012 | | | | (1) | |
Office | | Philadelphia | | PA | | | 42,440 | | | | 18,627 | | | | 23,340 | | | | 2,212 | | | | 18,627 | | | | 25,552 | | | | 44,179 | | | | 788 | | | | 2/2013 | | | | (1) | |
| | | | | | | | | | | | | | | | | | | | | | | | | | | | | | | | | | | | | | | | | | | | |
| | | | | | | 252,057 | | | | 41,519 | | | | 265,878 | | | | 34,568 | | | | 46,501 | | | | 294,536 | | | | 341,037 | | | | 45,103 | | | | | | | | | |
| | | | | | | | | | | | | | | | | | | | | | | | | | | | | | | | | | | | | | | | | | | | |
| | | | | | | | | | | | |
Retail | | Atlanta | | GA | | | — | | | | — | | | | 4,633 | | | | (2,675 | ) | | | — | | | | 1,958 | | | | 1,958 | | | | 142 | | | | 11/2004 | | | | (1) | |
Retail | | Louisville | | KY | | | — | | | | — | | | | 2,722 | | | | 377 | | | | 373 | | | | 2,726 | | | | 3,099 | | | | 622 | | | | 11/2004 | | | | (1) | |
Retail | | Greensboro | | NC | | | — | | | | — | | | | 3,797 | | | | 4 | | | | — | | | | 3,801 | | | | 3,801 | | | | 867 | | | | 11/2004 | | | | (1) | |
| | | | | | | | | | | | | | | | | | | | | | | | | | | | | | | | | | | | | | | | | | | | |
| | | | | | | — | | | | — | | | | 11,152 | | | | (2,294 | ) | | | 373 | | | | 8,485 | | | | 8,858 | | | | 1,631 | | | | | | | | | |
| | | | | | | | | | | | | | | | | | | | | | | | | | | | | | | | | | | | | | | | | | | | |
| | | | | | | | | | | | |
Other | | Jacksonville | | FL | | | — | | | | 2,166 | | | | 8,684 | | | | 2,241 | | | | 2,166 | | | | 10,925 | | | | 13,091 | | | | 2,541 | | | | 11/2004 | | | | (1) | |
Other | | Churchill | | PA | | | 5,049 | | | | — | | | | 23,834 | | | | (14,129 | ) | | | — | | | | 9,705 | | | | 9,705 | | | | 4,176 | | | | 11/2004 | | | | (1) | |
Other | | Memphis | | TN | | | 13,125 | | | | 3,080 | | | | 17,485 | | | | 883 | | | | 3,080 | | | | 18,368 | | | | 21,448 | | | | 1,150 | | | | 4/2012 | | | | (1) | |
Other | | Greensboro | | NC | | | 14,735 | | | | 1,961 | | | | 16,482 | | | | 132 | | | | 1,961 | | | | 16,614 | | | | 18,575 | | | | 766 | | | | 11/2012 | | | | (1) | |
Other | | Oklahoma City | | OK | | | 9,967 | | | | 1,328 | | | | 13,351 | | | | — | | | | 1,328 | | | | 13,351 | | | | 14,679 | | | | 70 | | | | 10/2013 | | | | (1) | |
Other | | Phoenix | | AZ | | | 24,390 | | | | 1,053 | | | | 38,488 | | | | — | | | | 1,053 | | | | 38,488 | | | | 39,541 | | | | 181 | | | | 10/2013 | | | | (1) | |
Other | | San Pedro | | CA | | | 12,195 | | | | 3,879 | | | | 15,952 | | | | — | | | | 3,879 | | | | 15,952 | | | | 19,831 | | | | 98 | | | | 10/2013 | | | | (1) | |
Other | | Stamford | | CT | | | 48,780 | | | | 5,707 | | | | 73,460 | | | | — | | | | 5,707 | | | | 73,460 | | | | 79,167 | | | | 315 | | | | 10/2013 | | | | (1) | |
Other | | Houston | | TX | | | 64,635 | | | | 16,167 | | | | 88,769 | | | | — | | | | 16,167 | | | | 88,769 | | | | 104,936 | | | | 417 | | | | 10/2013 | | | | (1) | |
| | | | | | | | | | | | | | | | | | | | | | | | | | | | | | | | | | | | | | | | | | | | |
| | | | | | | 192,876 | | | | 35,341 | | | | 296,505 | | | | (10,873 | ) | | | 35,341 | | | | 285,632 | | | | 320,973 | | | | 9,714 | | | | | | | | | |
| | | | | | | | | | | | | | | | | | | | | | | | | | | | | | | | | | | | | | | | | | | | |
| | | | | | | | | | | | | | | | | | | | | | | | | | | | | | | | | | | | | | | | | | | | |
| | | | | | | | | | | | | | | | | | | | | | | | | | | | | | | | | | | | | | | | | | | | |
Total | | | | | | $ | 444,933 | | | $ | 76,860 | | | $ | 573,535 | | | $ | 21,401 | | | $ | 82,215 | | | $ | 588,653 | | | $ | 670,868 | | | $ | 56,448 | | | | | | | | | |
| | | | | | | | | | | | | | | | | | | | | | | | | | | | | | | | | | | | | | | | | | | | |
(1) Buildings are depreciated over 30-40 years. Building improvements are depreciated over 5-20 years. Tenant improvements are depreciated over the shorter of the useful life or the term of the related lease. | | | | | |
| | | | | | | |
The aggregate cost in the properties for federal income tax purposes was approximately | | | $ | 576,496 | | | | | | | | | | | | | | | | | | | | | | | | | |
122
SCHEDULE III
REAL ESTATE AND ACCUMULATED DEPRECIATION
(amounts in thousands)
The following is a reconciliation of real estate assets and accumulated depreciation:
| | | | | | | | | | | | |
| | | Year Ended December 31, | |
| | | 2013 | | | 2012 | | | 2011 | |
| | | |
Real Estate | | | | | | | | | | | | |
Balance at beginning of period | | $ | 421,989 | | | $ | 363,832 | | | $ | 308,499 | |
Additions during the period: | | | | | | | | | | | | |
Other acquisitions | | | 258,153 | | | | 59,312 | | | | — | |
Improvements, etc. | | | 6,165 | | | | 12,417 | | | | 11,962 | |
Other additions | | | 41,967 | | | | — | | | | 52,778 | |
Deductions during this period: | | | | | | | | | | | | |
Cost of real estate sold | | | (27,974 | ) | | | (629 | ) | | | — | |
Other deductions | | | — | | | | (26 | ) | | | — | |
Asset impairments | | | (2,799 | ) | | | (2,562 | ) | | | (7,600 | ) |
Disposal of fully amortized assets | | | (1,082 | ) | | | (297 | ) | | | (168 | ) |
Transfer of discontinued operations | | | (25,551 | ) | | | (10,058 | ) | | | (1,639 | ) |
| | | | | | | | | | | | |
Balance at end of period | | $ | 670,868 | | | $ | 421,989 | | | $ | 363,832 | |
| | | | | | | | | | | | |
| | | |
Accumulated Depreciation | | | | | | | | | | | | |
Balance at beginning of period | | $ | 51,553 | | | $ | 44,556 | | | $ | 36,232 | |
Additions charged to operating expenses | | | 13,671 | | | | 11,207 | | | | 8,644 | |
Disposal of properties | | | (4,946 | ) | | | — | | | | — | |
Transfer (to) from discontinued operations, net (1) | | | (2,748 | ) | | | (3,913 | ) | | | (152 | ) |
Disposal of fully amortized assets | | | (1,082 | ) | | | (297 | ) | | | (168 | ) |
| | | | | | | | | | | | |
Balance at end of period | | $ | 56,448 | | | $ | 51,553 | | | $ | 44,556 | |
| | | | | | | | | | | | |
| (1) | In 2013, the Deer Valley, Arizona; Meriden, Connecticut; Lisle, Illinois; Andover, Massachusetts; Denton, Texas and Seabrook, Texas properties were placed in discontinued operations. In 2012, the Indianapolis, Indiana and Memphis, Tennessee properties were placed into discontinued operations. In 2011, the St. Louis, Missouri property was placed into discontinued operations. |
123
Schedule IV
Mortgage Loans on Real Estate
December 31, 2013
(Amounts in thousands)
| | | | | | | | | | | | | | | | | | | | | | | | |
Type of Loan | | Location | | Interest Rate | | Contractual
Maturity Date | | Periodic
Payment Terms | | Senior
Liens | | | Face Value | | | Outstanding
Principal | | | Carrying
Amount (1) | |
Whole Loan | | New York, NY | | LIBOR + 4.0% | | 10/05/14 | | Interest Only | | $ | — | | | $ | 20,000 | | | $ | 20,000 | | | $ | 20,101 | |
Whole Loan | | Tempe, AZ | | 5.88% | | 01/01/15 | | Amortizing | | | — | | | | 29,035 | | | | 28,403 | | | | 28,547 | |
Whole Loan (6) | | Philadelphia, PA | | 7.7% | | 02/01/16 | | Interest Only | | | 42,440 | | | | 36,171 | | | | 24,821 | | | | — | |
Whole Loan (2) | | Various | | Various | | Various | | Interest Only | | | — | | | | 6,088 | | | | 6,088 | | | | 6,136 | |
B-Note | | New York, NY | | 7.19% | | 07/11/16 | | Amortizing | | | 243,370 | | | | 10,871 | | | | 10,205 | | | | 10,250 | |
B-Note Other (3) | | Various | | Various | | Various | | Amortizing | | | 218,366 | | | | 15,478 | | | | 12,927 | | | | 12,997 | |
Mezzanine Other (4) (5) | | Various | | Various | | Various | | Interest Only | | | 38,883 | | | | 4,988 | | | | 3,326 | | | | 2,992 | |
Mezzanine | | Playa Vista, CA | | LIBOR 4.25% | | 01/23/15 | | Interest Only | | | 80,300 | | | | 10,250 | | | | 10,250 | | | | 10,327 | |
Corporate Loan | | n/a | | 15.00% | | 10/31/14 | | Interest Only | | | — | | | | 9,750 | | | | 9,750 | | | | 9,750 | |
| | | | | | | | | | | | | | | | | | | | | | | | |
| | | | | | | | | | | | | | $ | 142,631 | | | $ | 125,770 | | | $ | 101,100 | |
| | | | | | | | | | | | | | | | | | | | | | | | |
| (1) | Carrying amount of loans receivable includes accrued interest of $501 at December 31, 2013. |
| (2) | Line item includes whole loans each of which represent less than 3% of the total Loan Assets. |
| (3) | Line item includes three B-Notes each of which represent less than 3% of the total Loan Assets. |
| (4) | Line item includes four mezzanine loans each of which represent less than 3% of the total Loan Assets. |
| (5) | Line item includes one loan with a face value of $1,486 which is on non-accrual status. The total principal amount of loans subject to delinquent payments is $348. |
| (6) | This loan is eliminated in consolidation. |
Reconciliation of Mortgage Loans on Real Estate:
The following table reconciles Mortgage Loans for the years ended December 31, 2013, 2012 and 2011.
| | | | | | | | | | | | |
| | | 2013 | | | 2012 | | | 2011 | |
Balance at January 1 | | $ | 211,250 | | | $ | 114,333 | | | $ | 110,395 | |
Purchase and advances | | | 22,314 | | | | 175,550 | | | | 67,619 | |
Interest (received) accrued, net | | | (514 | ) | | | 516 | | | | (37 | ) |
Repayments / Sale Proceeds | | | (75,407 | ) | | | (68,824 | ) | | | (70,289 | ) |
Loan accretion | | | 4,121 | | | | 8,333 | | | | 13,401 | |
Discount accretion received in cash | | | (37 | ) | | | (15,720 | ) | | | (13,290 | ) |
Reclass from loan securities | | | — | | | | — | | | | 662 | |
Reclass from equity investments | | | — | | | | — | | | | 12,544 | |
Reclass to equity investments | | | — | | | | (2,938 | ) | | | (4,650 | ) |
Elimination of 1515 Market Street in consolidation | | | (60,279 | ) | | | — | | | | — | |
Reclass to preferred investments | | | — | | | | — | | | | (2,022 | ) |
Provision for loss on loans receivable | | | (348 | ) | | | — | | | | — | |
| | | | | | | | | | | | |
Balance at December 31 | | $ | 101,100 | | | $ | 211,250 | | | $ | 114,333 | |
| | | | | | | | | | | | |
124
| | | | | | |
Exhibit | | Description | | Page
Number | |
| | |
| 3.1 | | Second Amended and Restated Declaration of Trust as of May 21, 2009 - Incorporated by reference to Exhibit 3.1 to the Trust’s Quarterly Report on Form 10-Q for the period ended June 30, 2009. | | | - | |
| | |
| 3.2 | | By-laws of Winthrop Realty Trust as amended and restated on November 3, 2009 - Incorporated by reference to Exhibit 3.1 to the Trust’s Current Report on Form 8-K filed November 6, 2009. | | | - | |
| | |
| 3.3 | | Amendment to By-laws - Incorporated by reference to Exhibit 3.1 to the Trust’s Current Report on Form 8-K filed March 6, 2010. | | | - | |
| | |
| 4.1 | | Form of certificate for Common Shares of Beneficial Interest. Incorporated by reference to Exhibit 4.1 to the Trust’s Annual Report on Form 10-K for the year ended December 31, 2008. | | | - | |
| | |
| 4.2 | | Agreement of Limited Partnership of WRT Realty L.P., dated as of January 1, 2005 - Incorporated by reference to Exhibit 4.1 to the Trust’s Current Report on Form 8-K filed January 4, 2005. | | | - | |
| | |
| 4.3 | | Amendment No. 1 to Agreement of Limited Partnership of WRT Realty, L.P., dated as of December 1, 2005 incorporated by reference to Exhibit 4.4 to the Trust’s Form 10-K filed March 15, 2012. | | | - | |
| | |
| 4.4 | | Amendment No. 2 to Agreement of Limited Partnership of WRT Realty, L.P., dated as of November 28, 2011 – Incorporated by reference to the Trust’s Current Report on Form 8-K filed November 28, 2011. | | | - | |
| | |
| 4.5 | | Amendment No. 3 to Agreement of Limited Partnership of WRT Realty, L.P., dated as of March 23, 2012 – Incorporated by reference to the Trust’s Current Report on Form 8-K filed March 23, 2012. | | | - | |
| | |
| 4.6 | | Amended and Restated Certificate of Designations of 9.25% Series D Cumulative Redeemable Preferred Shares of Beneficial Interest - Incorporated by reference to the Trust’s Current Report on Form 8-K filed March 23, 2012. | | | - | |
| | |
| 4.7 | | Form of Specimen Certificate for the 9.25% Series D Cumulative Redeemable Preferred Shares of Beneficial Interest - Incorporated by reference to Exhibit 4.2 to Trust’s Form 8-A filed with the Securities and Exchange Commission on November 23, 2011. | | | - | |
| | |
| 4.8 | | Indenture, dated August 6, 2012 between the Trust and The Bank of New York Mellon, as trustee – Incorporated by reference to the Exhibit 4.1 to the Trust’s Current Report on Form 8-K filed August 9, 2012. | | | - | |
| | |
| 4.9 | | First Supplemental Indenture, dated August 15, 2012, between the Trust and the Bank of New York Mellon, as trustee and collateral agent – Incorporated by reference to Exhibit 4.1 of the Trust’s Current Report on Form 8-K filed August 15, 2012. | | | - | |
| | |
| 10.1 | | Stock Purchase Agreement between the Trust and FUR Investors, LLC, dated as of November 26, 2003, including Annex A thereto, being the list of Conditions to the Offer - Incorporated by reference to Exhibit 10.1 to the Trust’s Current Report on Form 8-K filed December 1, 2003. | | | - | |
125
| | | | | | |
| | |
| 10.2 | | Third Amended and Restated Advisory Agreement dated February 1, 2013, between the Trust, WRT Realty L.P. and FUR Advisors LLC - Incorporated by reference to Exhibit 10.1 to the Trust’s Current Report on Form 8-K filed February 4, 2013. | | | - | |
| | |
| 10.3 | | Exclusivity Services Agreement between the Trust and Michael L. Ashner - Incorporated by reference to Exhibit 10.4 to the Trust’s Current Report on Form 8-K filed December 1, 2003. | | | - | |
| | |
| 10.4 | | Amendment No. 1 to Exclusivity Agreement, dated November 7, 2005 - Incorporated by reference to Exhibit 10.7 to the Trust’s Current Report on Form 8-K filed November 10, 2005. | | | - | |
| | |
| 10.5 | | Amendment No. 2 to Exclusivity Agreement, dated February 1, 2013 - Incorporated by reference to Exhibit 10.2 to the Trust’s Current Report on Form 8-K filed February 4, 2013. | | | - | |
| | |
| 10.6 | | Covenant Agreement between the Trust and FUR Investors, LLC - Incorporated by reference to Exhibit 10.5 to the Trust’s Current Report on Form 8-K filed December 1, 2003. | | | - | |
| | |
| 10.7 | | Amendment No. 1 to Covenant Agreement, dated February 4, 2013 - Incorporated by reference to Exhibit 10.3 to the Trust’s Current Report on Form 8-K filed February 4, 2013. | | | - | |
| | |
| 10.8 | | Winthrop Realty Trust 2007 Long Term Stock Incentive Plan - Incorporated by reference to the Trust’s Definitive Proxy Statement on Schedule 14A filed with the Securities and Exchange Commission on March 30, 2007. | | | - | |
| | |
| 10.9 | | Amended and Restated Loan Agreement, dated as of March 3, 2011, between WRT Realty L.P. and KeyBank, National Association. Incorporated by reference to Exhibit 10.19 to the Trust’s Annual Report on Form 10-K for the year ended December 31, 2011. | | | - | |
| | |
| 10.10 | | Guaranty from Winthrop Realty Trust and certain of its Subsidiaries in favor of KeyBank, National Association. Incorporated by reference to Exhibit 10.20 to the Trust’s Annual Report on Form 10-K for the year ended December 31, 2011. | | | - | |
| | |
10.11
| | Restricted Share Award Agreement, dated February 1, 2013, between Winthrop Realty Trust and Michael L. Ashner - Incorporated by reference to Exhibit 10.4 to the Trust’s Current Report on Form 8-K filed February 4, 2013. | | | - | |
| | |
10.12
| | Restricted Share Award Agreement, dated February 1, 2013, between Winthrop Realty Trust and Carolyn Tiffany - Incorporated by reference to Exhibit 10.4 to the Trust’s Current Report on Form 8-K filed February 4, 2013. | | | - | |
| | |
| 21 | | List of Subsidiaries | | | * | |
| | |
| 23.1 | | Consent of Independent Registered Accounting Firm – PricewaterhouseCoopers LLP | | | * | |
| | |
| 23.2 | | Consent of Independent Registered Accounting Firm – KPMG LLP (Concord Debt Holdings LLC financials) | | | * | |
| | |
| 23.3 | | Consent of Independent Registered Accounting Firm - KPMG LLP (CDH CDO LLC financials) | | | * | |
| | |
| 23.4 | | Consent of Independent Registered Accounting Firm – Frazier & Deeter, LLC (Sealy Northwest Atlanta Partners LP financials) | | | * | |
| | |
| 23.5 | | Consent of Independent Registered Accounting Firm – Frazier & Deeter, LLC (Sealy Newmarket General Partnership financials) | | | * | |
| | |
| 24 | | Power of Attorney | | | * | |
126
| | | | | | |
| | |
| 31 | | Certifications Pursuant to Section 302 of the Sarbanes-Oxley Act of 2002. | | | * | |
| | |
| 32 | | Certification Pursuant to Section 906 of the Sarbanes-Oxley Act of 2002. | | | * | |
| | |
| 99.1 | | Consolidated Financial Statements of Concord Debt Holdings LLC | | | * | |
| | |
| 99.2 | | Consolidated Financial Statements of CDH CDO LLC | | | * | |
| | |
| 99.3 | | Consolidated Financial Statements of Sealy Northwest Atlanta Partners LP | | | * | |
| | |
| 99.4 | | Consolidated Financial Statements of Sealy Newmarket General Partnership | | | * | |
| | |
| 101.INS | | XBRL Report Instance Document | | | * | |
| | |
| 101.SCH | | XBRL Taxonomy Extension Schema Document | | | * | |
| | |
| 101.CAL | | XBRL Taxonomy Calculation Linkbase Document | | | * | |
| | |
| 101.LAB | | XBRL Taxonomy Label Linkbase Document | | | * | |
| | |
| 101.PRE | | XBRL Presentation Linkbase Document | | | * | |
| | |
| 101.DEF | | XBRL Taxonomy Extension Definition Linkbase Document | | | * | |
127