 1 Bear Stearns Global Credit Conference May 17, 2006 Katharine W. Kenny Vice President, Investor Relations Eric B. Tolbert Vice President & Chief Financial Officer Exhibit 99.1 |
 2 FORWARD-LOOKING STATEMENTS: Certain statements in this presentation are forward-looking as defined by the Private Securities Litigation Reform Act of 1995. Due to known and unknown risks, the Company’s actual results may differ materially from its expectations or projections. Factors potentially contributing to such differences are described in further detail at the conclusion of this presentation and in the Company’s Annual Reports on Form 10-K and Quarterly Reports on Form 10-Q. Safe Harbor Statement |
 3 Coal is the Fuel of Choice |
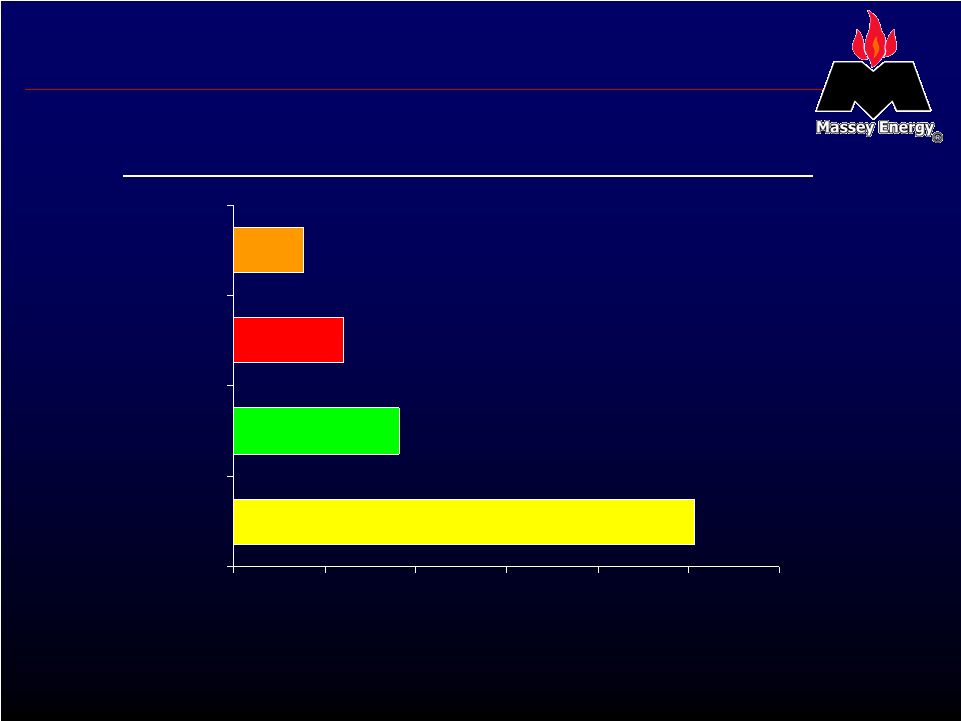 4 World Coal Demand Accelerating SOURCE: BP Statistical Review of World Energy 2005 World Energy Demand Growth from 2001 to 2004 25% 9% 6% 4% 0% 5% 10% 15% 20% 25% 30% Coal Natural Gas Oil Nuclear Growth in Btu Consumption |
 5 World Energy Demand SOURCE: U.S. Energy Information Administration Rest of World China U.S. % Change 2020E 1990 +59% 375 237 +262% 98 27 +48% 125 85 Annual Energy Consumption (Quadrillion Btu) The modernization of the world’s most populous country imposes huge burdens on an increasingly tight global energy supply |
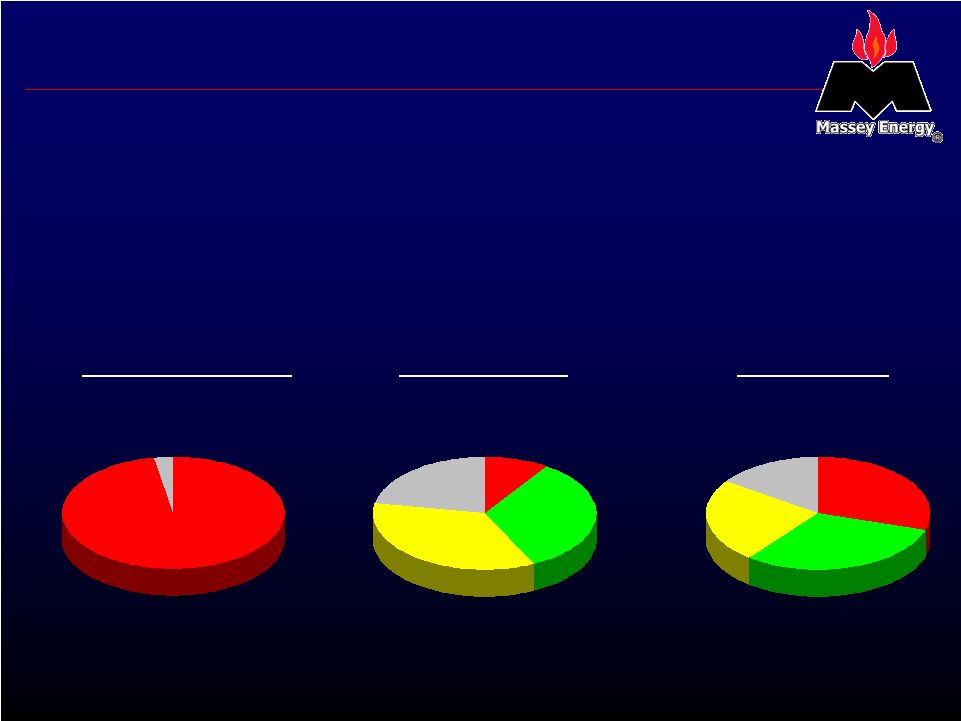 6 U.S. Energy Demand The U.S. is increasingly competing for expensive and uncertain foreign supplies to power our cars, homes and factories Transportation Residential* Industrial* * Electricity consumption allocated to primary fuels based on U.S. utility average consumption SOURCE: U.S. Energy Information Administration, 2004 data Oil 97% Other 3% Oil 9% Gas 33% Coal 36% Other 22% Other 15% Coal 24% Gas 31% Oil 30% |
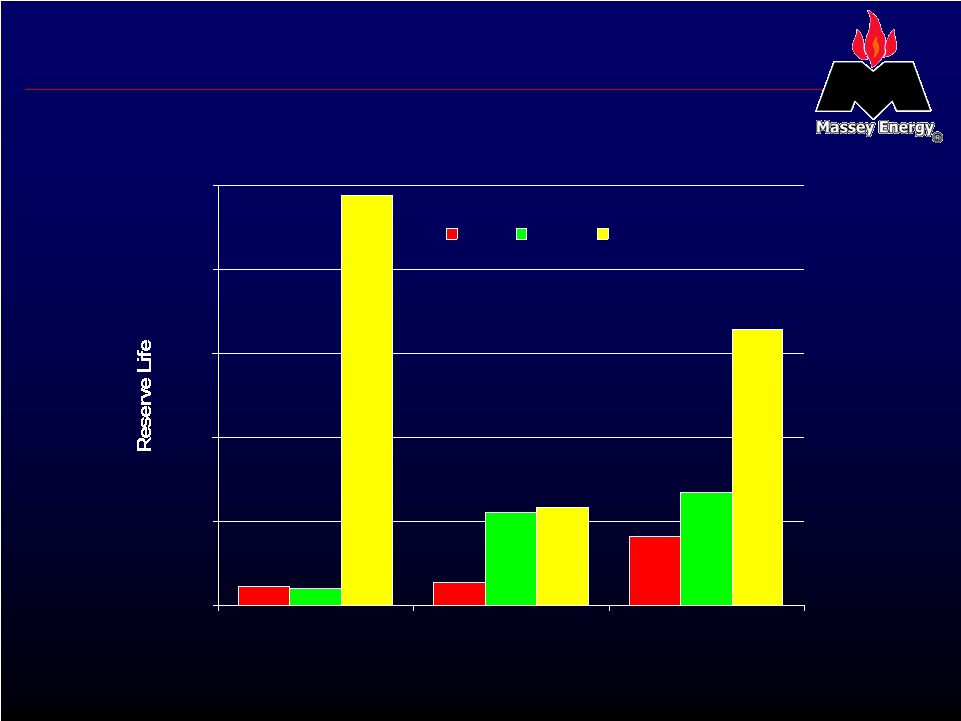 7 U.S. Coal - The Underutilized Energy Supply SOURCE: BP Statistical Review of World Energy 2005 (2004 reserves and production) 11 years 10 years 245 years 0 50 100 150 200 250 U.S. China World Oil Gas Coal |
 8 U.S. Growth in Coal Demand SOURCE: CSFB • High prices of alternative energy sources • 91 gigawatts of new coal-fired power plants in the U.S. have been proposed or are under development » If only 50% actually are built, they would require approximately 135 million additional tons of coal annually |
 9 Technology Driving Demand – Gasification/Liquefaction • Coal gasification enables economic and environmentally responsible coal power generation » Competitive with natural gas at $4.40/mmBtu » Natural Gas prices averaged $7.89/mmBtu in 2005 • Coal liquefaction provides a near-term solution to oil crisis » Competitive with conventional diesel at oil prices above $35/barrel using existing technology SOURCE: Lehman, Rentech, Inc., U.S. Energy Information Administration |
 10 Delivering Shareholder Value in Central Appalachia |
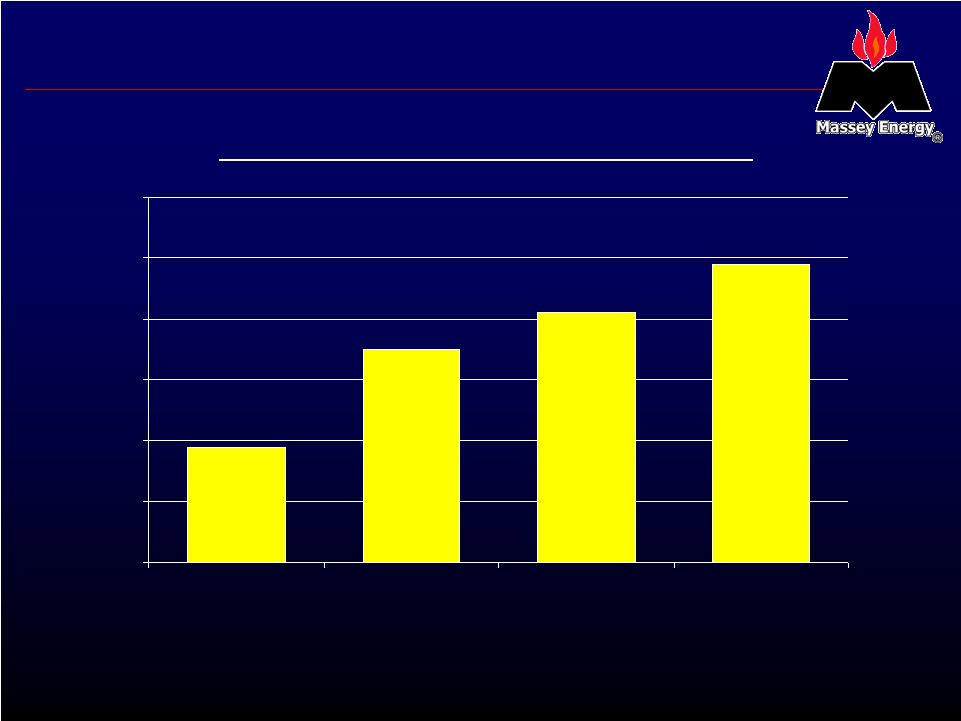
 11 Massey Production Growth Massey has delivered long-term growth, via organic expansion and opportunistic acquisitions (million tons) 0 10 20 30 40 50 1990 1992 1994 1996 1998 2000 2002 2004 2006E |
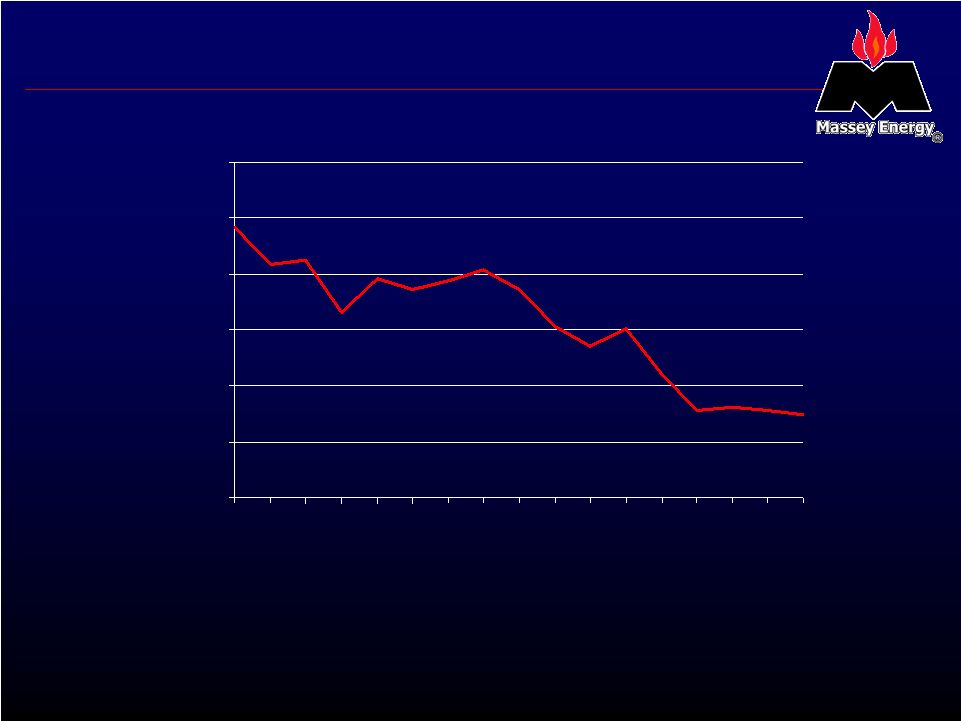 12 Other Central Appalachian Production Declines SOURCE: Energy Ventures Analysis, Inc. Central Appalachia competitors have had difficulty maintaining margins and growth (million tons) 150 175 200 225 250 275 300 1990 1992 1994 1996 1998 2000 2002 2004 2006E |
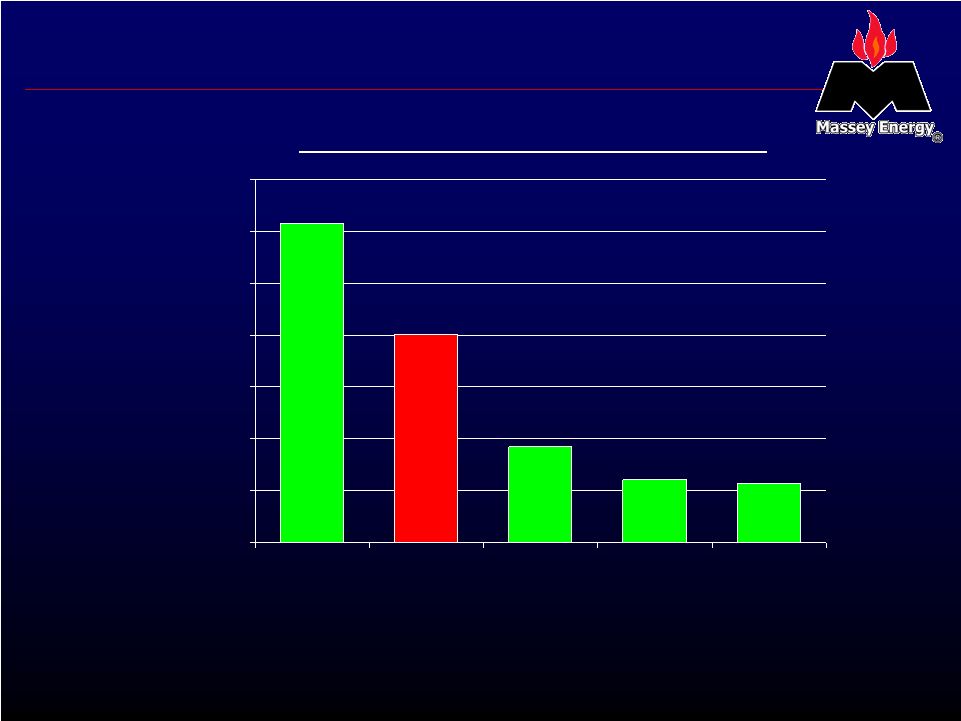 13 Leading Regional Reserve Position * 2005 Company reserves as % of estimated total 30 year forward regional production SOURCE: Energy Ventures Analysis, Inc., Company reports Reserve share in Primary Region* 62% 40% 12% 11% 18% 0% 10% 20% 30% 40% 50% 60% 70% CONSOL Massey Peabody Magnum Arch Primary Region NAPP CAPP PRB CAPP PRB |
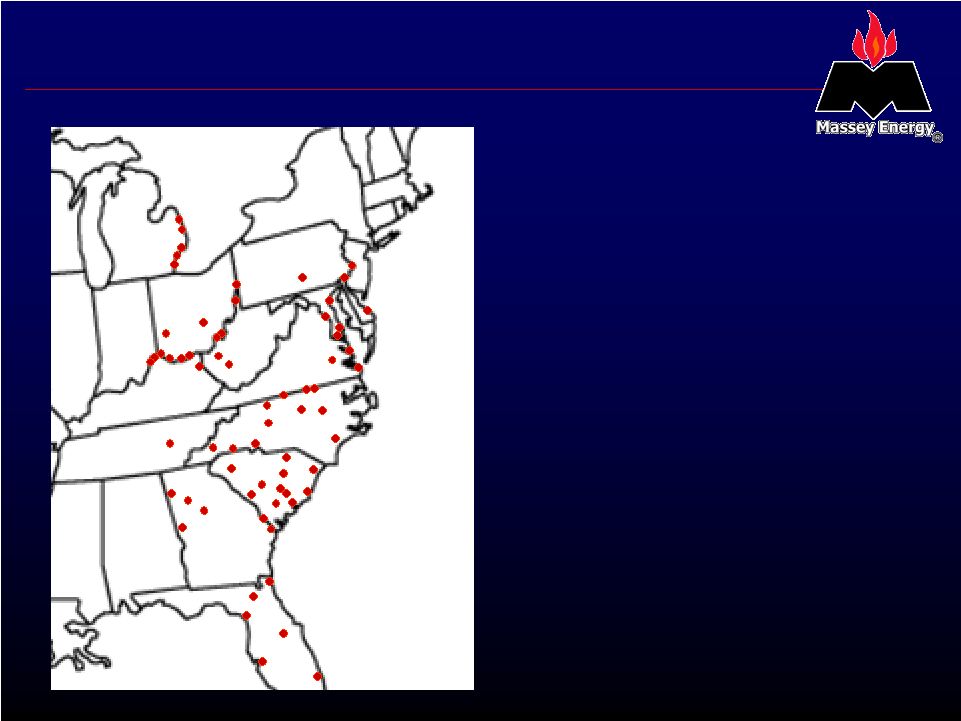 14 Geographically Advantaged • In 2005, Massey’s steam coal customers were focused in the Southeastern and Mid- Atlantic states • Central Appalachia enjoys tremendous transportation advantages in these markets, especially versus PRB low sulfur coals |
 15 Powder River Basin Challenges • Greater exposure to rising freight rates and delivery interruptions • Rail infrastructure capacity out of basin is constrained • Rail system interchange bottlenecks • Most advantaged markets have already switched • Utility switching costs to reconfigure boilers is high • Higher inventory requirements and shipment time delays |
 16 Challenges Facing Imports SOURCE: Energy Ventures Analysis, Inc. • Port infrastructure constrained • Source risk – not dependable for long-term secure supplies • Weaker US dollar increases cost • Imports remain a small fraction of overall U.S. coal consumption (2.7% in 2005) |
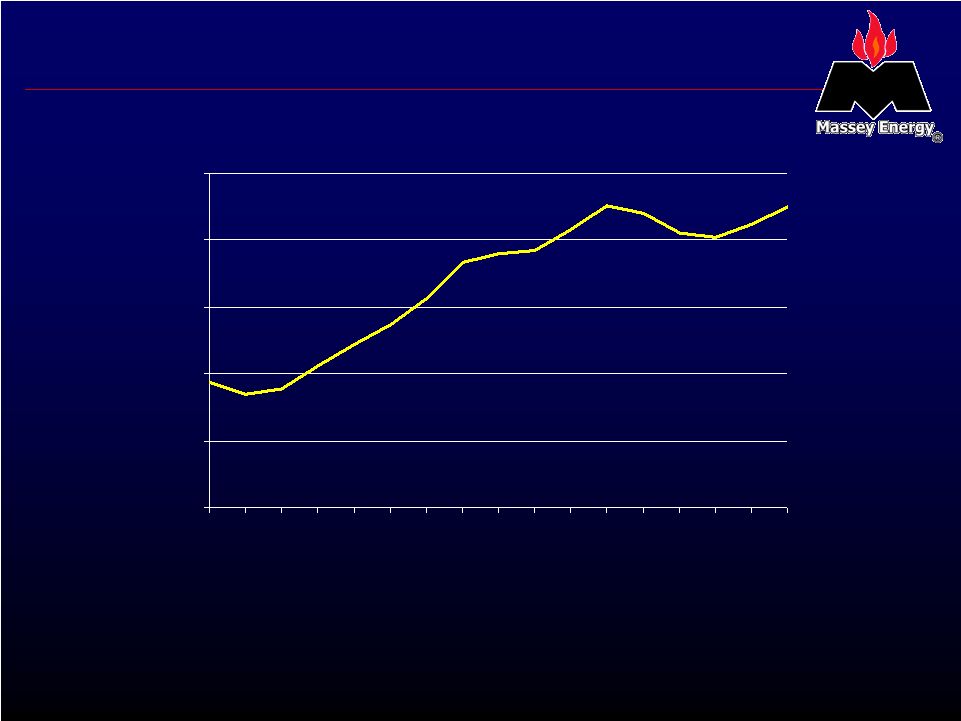
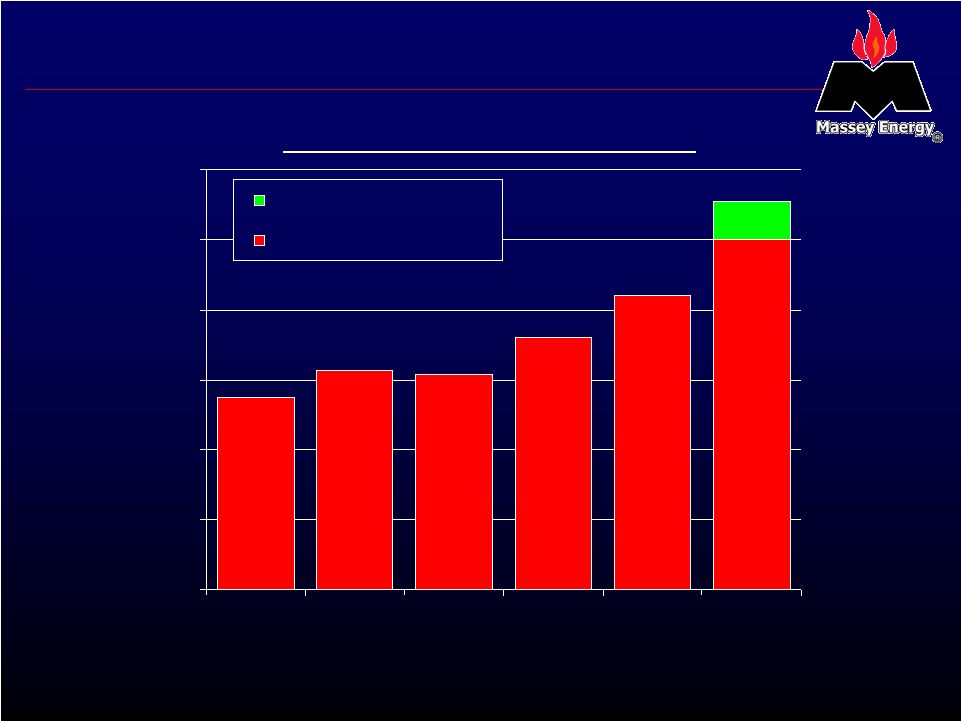 17 Growing Revenue per Ton 2001 – 2006E Revenue per ton $36.02 $30.79 $31.30 $27.51 $42.02 $50.00 $55.50 $0.00 $10.00 $20.00 $30.00 $40.00 $50.00 $60.00 2001* 2002 2003 2004 2005 2006E Estimated Market Value Revenue / Produced Ton * 2001 is for fiscal year ended October 31, 2001 |
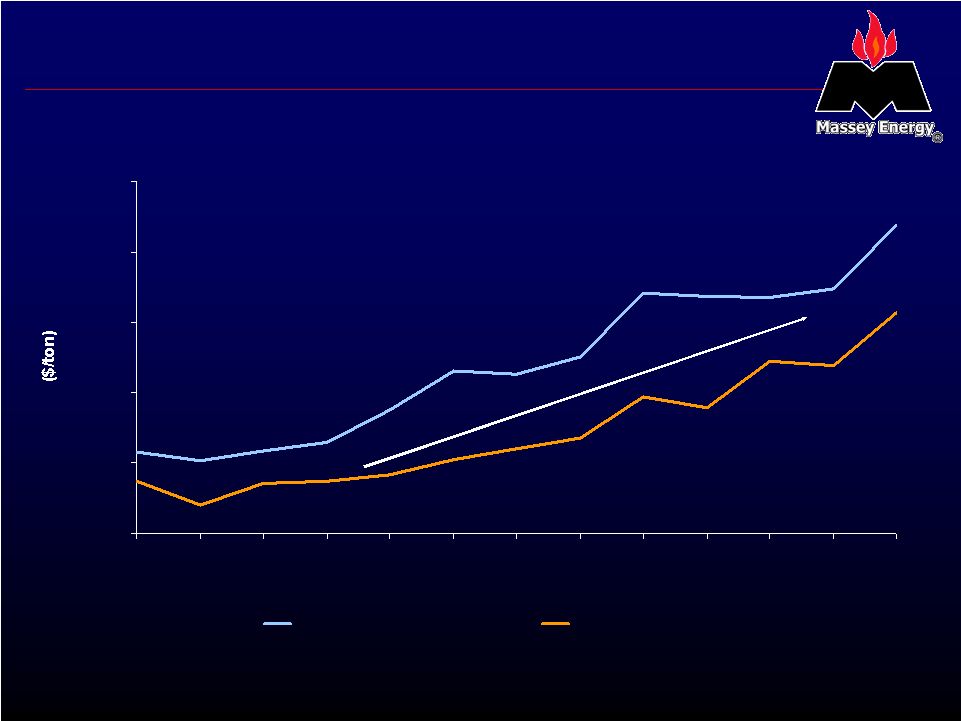 18 Proven Ability to Maintain Margin SOURCE: Company reports 30.85 31.44 33.74 36.52 36.33 37.57 42.07 41.88 41.75 42.39 46.90 30.14 30.74 40.69 37.20 33.95 34.73 31.76 30.99 30.20 29.14 28.66 28.56 26.97 28.66 36.90 $25.00 $30.00 $35.00 $40.00 $45.00 $50.00 Q1 2003 Q2 2003 Q3 2003 Q4 2003 Q1 2004 Q2 2004 Q3 2004 Q4 2004 Q1 2005 Q2 2005 Q3 2005 Q4 2005 Q1 2006 Produced Coal Revenue/Ton Average Cash Cost/Ton |
 19 Grow Surface Mine Capacity 19% 35% 49% 41% 0% 10% 20% 30% 40% 50% 60% 1996 2003 2004 2005 Surface Tons as % of Total Production |
 20 Massey Energy: Strengths and Challenges |
 21 Capital Discipline • Opportunistic Central Appalachia consolidator » Focus on asset purchases with minimal legacy liabilities » Synergistic targets with clear strategic value • Up to $270 million in capital investments projected for 2006 • Capital restructuring in late 2005 » Reduced fully diluted share count by 7.5% » Balanced a cash tender with an equity tender for two series of convertible debt » Extended maturity profile • Measured share buyback program » To be funded out of excess free cash flow and cash on hand |
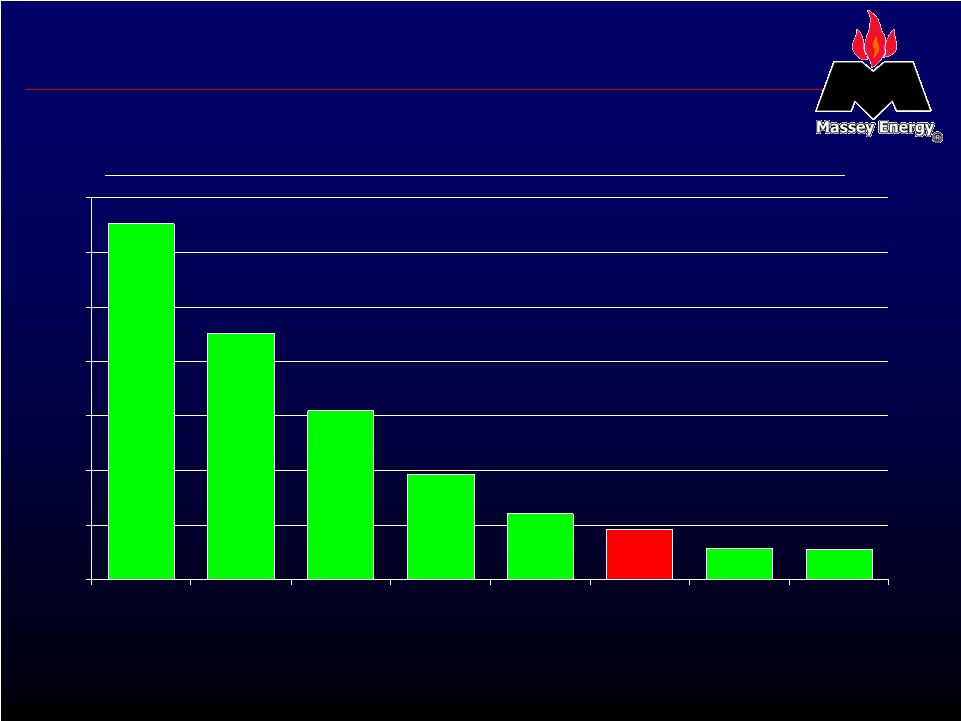 22 Low Legacy Liabilities 2005 Legacy Liabilities as a Percentage of Net Worth* * Net worth defined as shareholders equity less intangibles SOURCE: Company reports 326 226 97 60 46 29 28 155 0 50 100 150 200 250 300 350 CONSOL Foundation James River Peabody Alpha Massey ICG Arch |
 23 Labor Challenge • Generation of miners lost during 1980s and 1990s • Experienced labor key to past productivity • Skilled labor critical to underground mining productivity • Strong demand in current coal marketplace results in fierce competition for labor |
 24 Wage and Benefit Enhancements • Measured wage increases • Increased productivity and retention bonuses • Enhanced medical program benefits • Supplemental benefit programs to encourage longevity, such as auto and homeowners insurance • New medical facility established in 2005 |
 25 Comprehensive Training and Orientation • Extensive training and member development • Orientation and safety programs • Mentor program |
 26 Massey – Creating Long-term Value • Foremost producer in Central Appalachia with increasing market share • Leading Central Appalachian reserve base enables long- term organic growth • Capital discipline to optimize leverage and liquidity requirements • Safety, community and environmental stewardship programs that improve ‘Our Total Environment’ |
 27 Financial Statistics |
 28 Recent Results $130 $42.07 11.3 10.6 $448 1 st Qtr. 2005 $81 $426 * EBITDA $46.90 $42.02 Average per ton realization 10.5 43.1 Tons produced 10.1 42.3 Produced tons sold $476 $1,778 Produced coal revenue 1 st Qtr. 2006 Full Year 2005 *Excluding charges of $212 related to the Company’s debt repurchase and exchange offers (in millions, except per ton amounts) |
 29 Outstanding Debt Securities As of March 31, 2006 B1/BB- $ 760.0 6.785% senior notes due 2013 0.8 9.6 335.0 B2/B 4.75% convertible senior notes due 2023 B1/BB- 2.25% convertible senior notes due 2024 B1/BB- 6.625% senior notes due 2010 In millions Ratings |
 30 Capitalization ($ in millions - except %) 48.0% 48.9% Total net debt-to-book capitalization ratio 59.8% 59.6% Total debt-to-book capitalization ratio $ 688.9 $ 721.8 Total net debt 105.0 105.0 Less: Restricted cash 319.4 282.0 Less: Cash $ 1,860.5 $ 1,861.8 Total capitalization 747.2 753.0 Shareholder’s equity $ 1,113.3 $ 1,108.8 Total debt Pro forma 12/31/05* 3/31/06 *Presentation of December 31, 2005 amounts pro forma for the reduction to shareholders’ equity on January 1, 2006, for the cumulative effect of an accounting change required by EITF 04-6 in the after-tax amount of $93.8 million |
 31 Disclaimer FORWARD-LOOKING STATEMENTS: Certain statements in this presentation are forward-looking as defined by the Private Securities Litigation Reform Act of 1995. Such forward-looking statements are based on facts and conditions as they exist at the time such statements are made as well as predictions as to future facts and conditions the accurate prediction of which may be difficult and involve the assessment of events beyond the Company’s control. Caution must be exercised in relying on forward-looking statements. Due to known and unknown risks, the Company’s actual results may differ materially from its expectations or projections. Factors potentially contributing to such differences include, among others: market demand for coal, electricity and steel which could adversely affect the Company’s operating results and cash flows; future economic or capital market conditions; deregulation of the electric utility industry; competition in coal markets; inherent risks of coal mining beyond the Company’s control, including weather and geologic conditions; the Company’s ability to expand mining capacity; the Company’s production capabilities; the Company’s plan and objectives for future operations and expansion or consolidation; failure to receive anticipated new contracts; customer cancellations of, or breaches to, existing contracts; customer delays or defaults in making payments; the Company’s ability to manage production costs; the Company’s ability to timely obtain necessary supplies and equipment; the Company’s ability to attract, train and retain a skilled workforce; fluctuations in the demand for, price and availability of, coal due to labor and transportation costs and disruptions, governmental policies and regulatory actions, legal and administrative proceedings, settlements, investigations and claims, foreign currency changes and other factors; and greater than expected environmental and safety regulation, costs and liabilities. The forward- looking statements are also based on various operating assumptions regarding, among other things, overhead costs and employment levels that may not be realized. While most risks affect only future costs or revenues anticipated by the Company, some risks might relate to accruals that have already been reflected in earnings. The Company’s failure to receive payments of accrued amounts could result in a charge against future earnings. Information concerning those factors is available in the Company’s Annual Reports on Form 10-K and Quarterly Reports on Form 10-Q. NON-GAAP INFORMATION: Included in this presentation are EBITDA results, which is defined as income before interest and taxes, depreciation, depletion and amortization. Although EBITDA is not a measure of performance calculated in accordance with generally accepted accounting principles, management believes that it is useful to an investor in evaluating the Company because it is widely used in the coal industry as a measure to evaluate a company’s operating performance before debt expense and as a measure of its cash flow. EBITDA does not purport to represent operating income, net income or cash generated by operating activities and should not be considered in isolation or as a substitute for measures of performance in accordance with generally accepted accounting principles. In addition, because EBITDA is not calculated identically by all companies, the presentation here may not be comparable to other similarly titled measures of other companies. Reconciliations of adjusted EBITDA can be found in the Company’s earnings press release for the relevant periods. |
 32 with Energy Doing the Right Thing... |