Exhibit 99.1
FMC Corporation
D. Michael Wilson
President, Specialty Chemicals Group
KeyBanc Basic Materials Conference
Boston, MA
September 14, 2011
Disclaimer
These slides and the accompanying presentation contain “forward-looking statements” that represent management's best judgment as of the date hereof based on information currently available. Actual results of the Company may differ materially from those contained in the forward-looking statements.
Additional information concerning factors that may cause results to differ materially from those in the forward-looking statements is contained in the Company's periodic reports filed under the Securities Exchange Act of 1934, as amended.
The Company undertakes no obligation to update or revise these forward-looking statements to reflect new events or uncertainties.
| |
• | Non-GAAP Financial Terms |
These slides contain certain “non-GAAP financial terms” which are defined on our website at www.fmc.com. In addition, we have also provided on our website at www.fmc.com reconciliations of non-GAAP terms to the closest GAAP term.
Strong Operating Position Across Global Economic Scenarios
| |
• | Leading market positions serving diverse end markets - low correlation to economic cycles |
| |
• | Over 80% of sales in markets with low correlation to economic cycles |
| |
• | Agriculture, Food, Pharmaceuticals, Energy Storage, Environmental |
| |
• | Biasing growth toward Rapidly Developing Economies (RDEs) |
| |
• | 43% of 2010 sales in RDEs |
| |
• | Plan for 50% of sales by 2015 |
| |
• | Focus on faster-growing agriculture, food, pharmaceutical, energy storage markets in Asia, Latin America, CEETR |
| |
• | Diversified raw material structure and sourcing |
| |
• | Raw material costs represented only 25% of COGS in 2010 |
| |
• | No single raw material represented over 10% of total raw material costs in 2010 |
| |
• | Price increases currently offsetting or exceeding cost increases |
| |
• | Low energy requirements & exposure to petrochemicals |
| |
• | Energy costs represented only 9% of COGS in 2010 |
| |
• | Limited exposure to oil price fluctuations: +/- $10 per barrel oil equates to +/- $4MM EBIT to FMC |
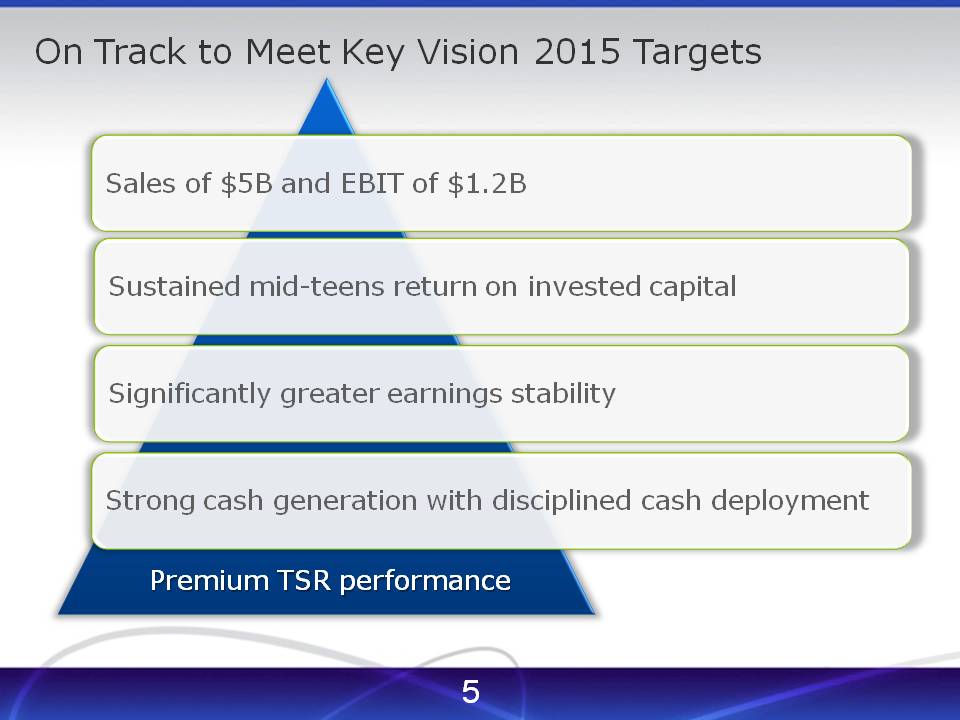
On Track to Meet Key Vision 2015 Targets
| |
• | Sales of $5B and EBIT of $1.2B |
| |
• | Sustained mid-teens return on invested capital |
| |
• | Significantly greater earnings stability |
| |
• | Strong cash generation with disciplined cash deployment |
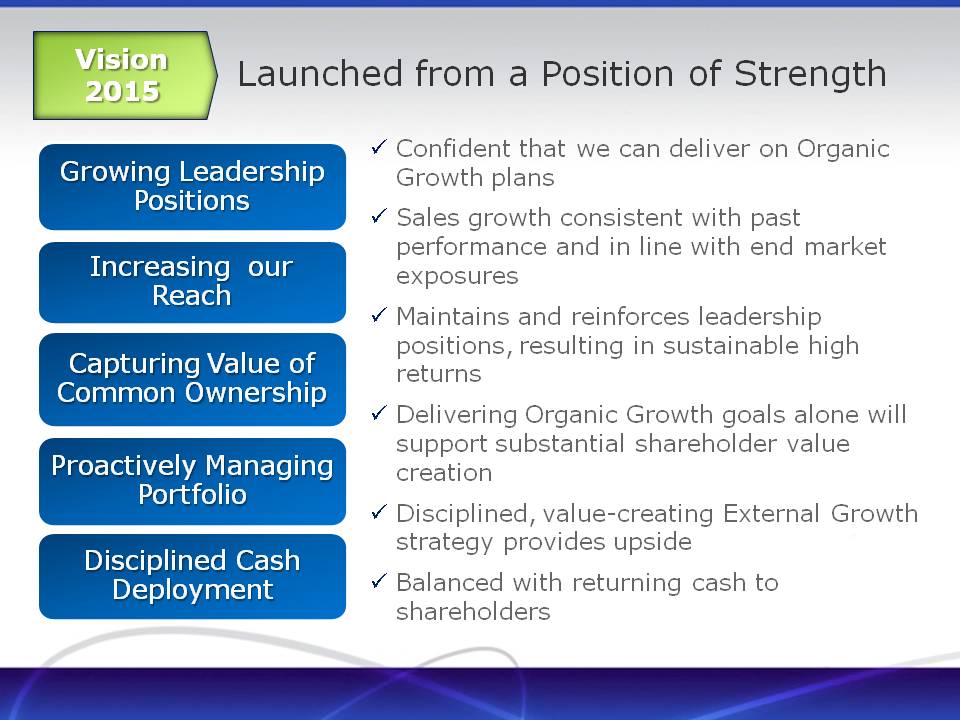
Vision 2015
Launched from a Position of Strength
Growing Leadership Positions
Increasing our Reach
Capturing Value of Common Ownership
Proactively Managing Portfolio
Disciplined Cash Deployment
| |
• | Confident that we can deliver on Organic Growth plans |
| |
• | Sales growth consistent with past performance and in line with end market exposures |
| |
• | Maintains and reinforces leadership positions, resulting in sustainable high returns |
| |
• | Delivering Organic Growth goals alone will support substantial shareholder value creation |
| |
• | Disciplined, value-creating External Growth strategy provides upside |
| |
• | Balanced with returning cash to shareholders |
Vision
2015
| |
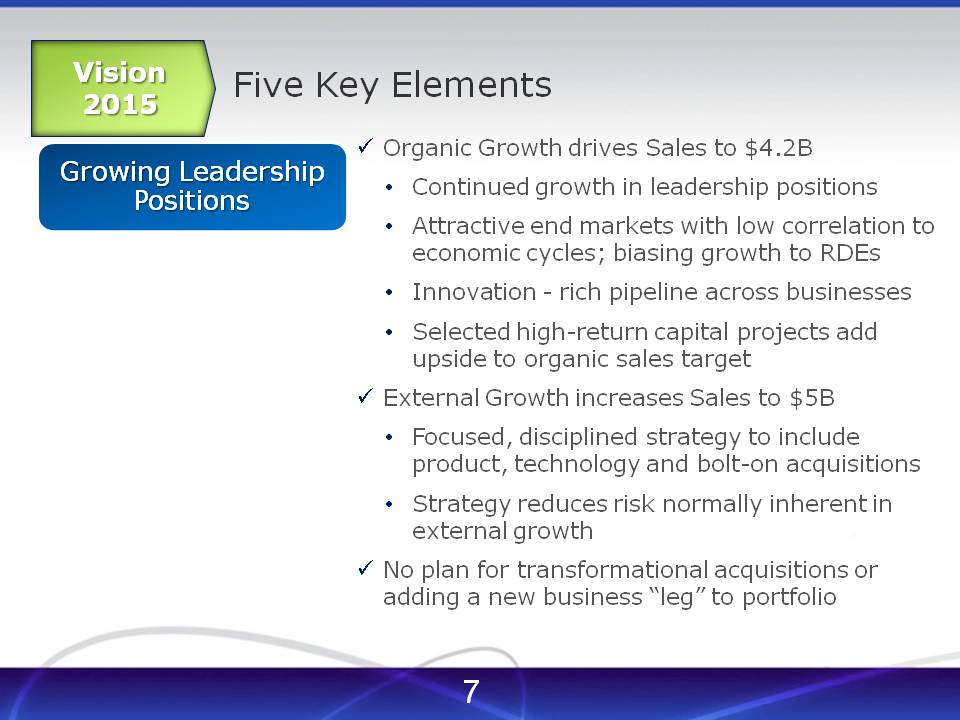
• | Five Key Elements Growing Leadership Positions Organic Growth drives Sales to $4.2B |
| |
• | Continued growth in leadership positions |
| |
• | Attractive end markets with low correlation to economic cycles; biasing growth to RDEs |
| |
• | Innovation - rich pipeline across businesses |
| |
• | Selected high-return capital projects add upside to organic sales target |
| |
• | External Growth increases Sales to $5B |
| |
• | Focused, disciplined strategy to include product, technology and bolt-on acquisitions |
| |
• | Strategy reduces risk normally inherent in external growth |
| |
• | No plan for transformational acquisitions or adding a new business “leg” to portfolio |
Vision 2015
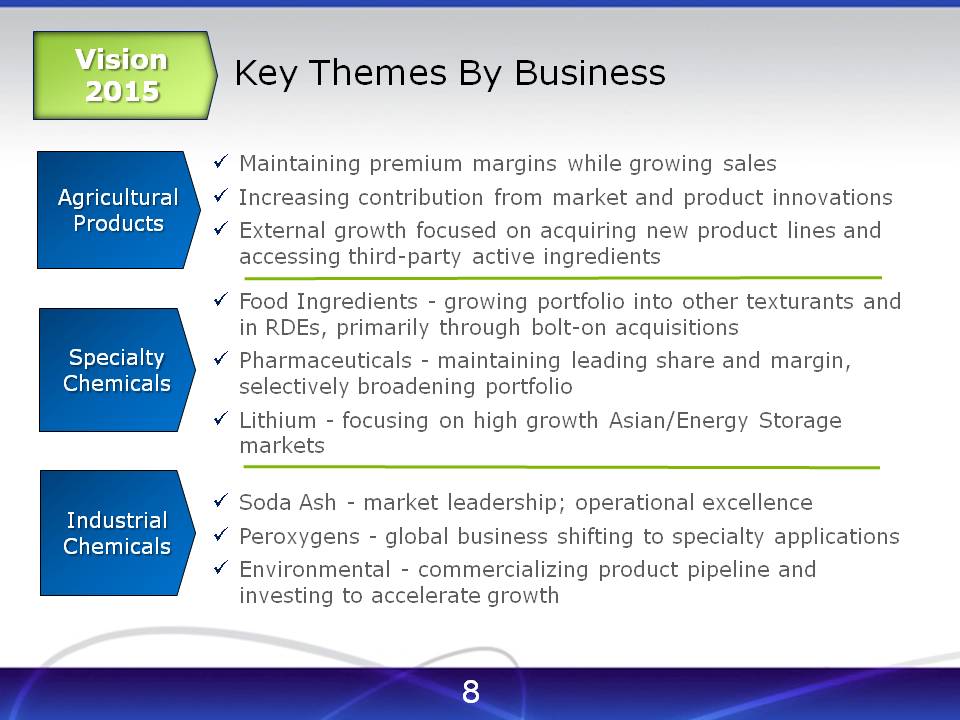
Key Themes By Business
Agricultural Products
| |
• | Maintaining premium margins while growing sales |
| |
• | Increasing contribution from market and product innovations |
| |
• | External growth focused on acquiring new product lines and accessing third-party active ingredients |
| |
• | Food Ingredients - growing portfolio into other texturants and in RDEs, primarily through bolt-on acquisitions |
| |
• | Pharmaceuticals - maintaining leading share and margin, selectively broadening portfolio |
| |
• | Lithium - focusing on high growth Asian/Energy Storage markets |
| |
• | Industrial Chemicals Soda Ash - market leadership; operational excellence |
| |
• | Peroxygens - global business shifting to specialty applications |
| |
• | Environmental - commercializing product pipeline and investing to accelerate growth |
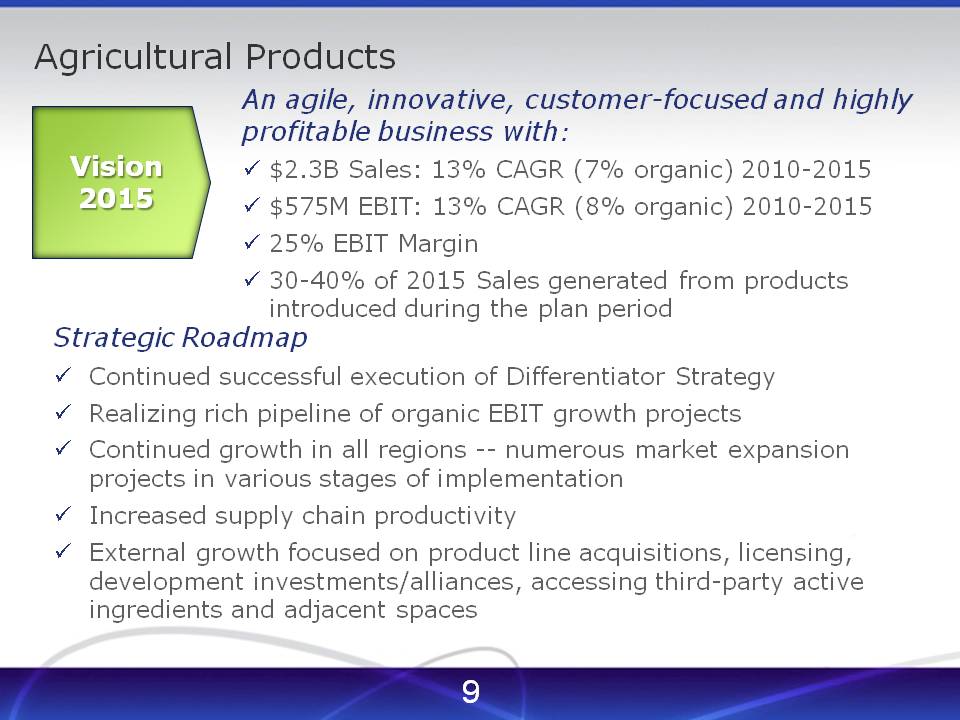
Agricultural Products Vision 2015
An agile, innovative, customer-focused and highly profitable business with:
| |
• | $2.3B Sales: 13% CAGR (7% organic) 2010-2015 |
| |
• | $575M EBIT: 13% CAGR (8% organic) 2010-2015 |
| |
• | 30-40% of 2015 Sales generated from products introduced during the plan period |
Strategic Roadmap
| |
• | Continued successful execution of Differentiator Strategy |
| |
• | Realizing rich pipeline of organic EBIT growth projects |
| |
• | Continued growth in all regions -- numerous market expansion projects in various stages of implementation |
| |
• | Increased supply chain productivity |
| |
• | External growth focused on product line acquisitions, licensing, development investments/alliances, accessing third-party active ingredients and adjacent spaces |
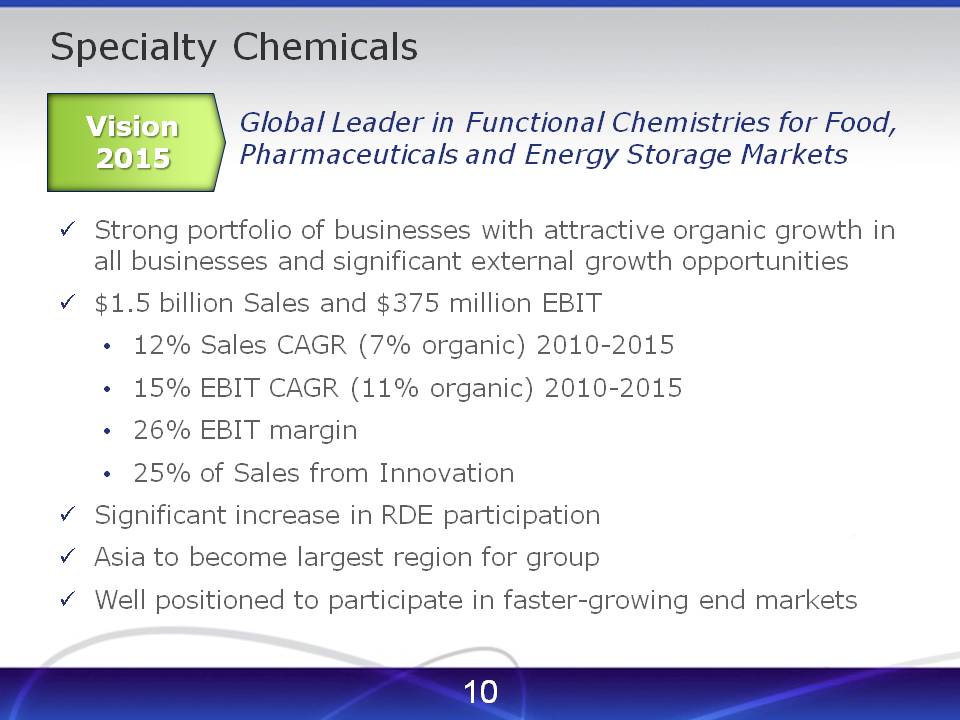
Specialty Chemicals Vision 2015
Global Leader in Functional Chemistries for Food, Pharmaceuticals and Energy Storage Markets
| |
• | Strong portfolio of businesses with attractive organic growth in all businesses and significant external growth opportunities |
| |
• | $1.5 billion Sales and $375 million EBIT |
| |
• | 12% Sales CAGR (7% organic) 2010-2015 |
| |
• | 15% EBIT CAGR (11% organic) 2010-2015 |
| |
• | 25% of Sales from Innovation |
| |
• | Significant increase in RDE participation |
| |
• | Asia to become largest region for group |
| |
• | Well positioned to participate in faster-growing end markets |
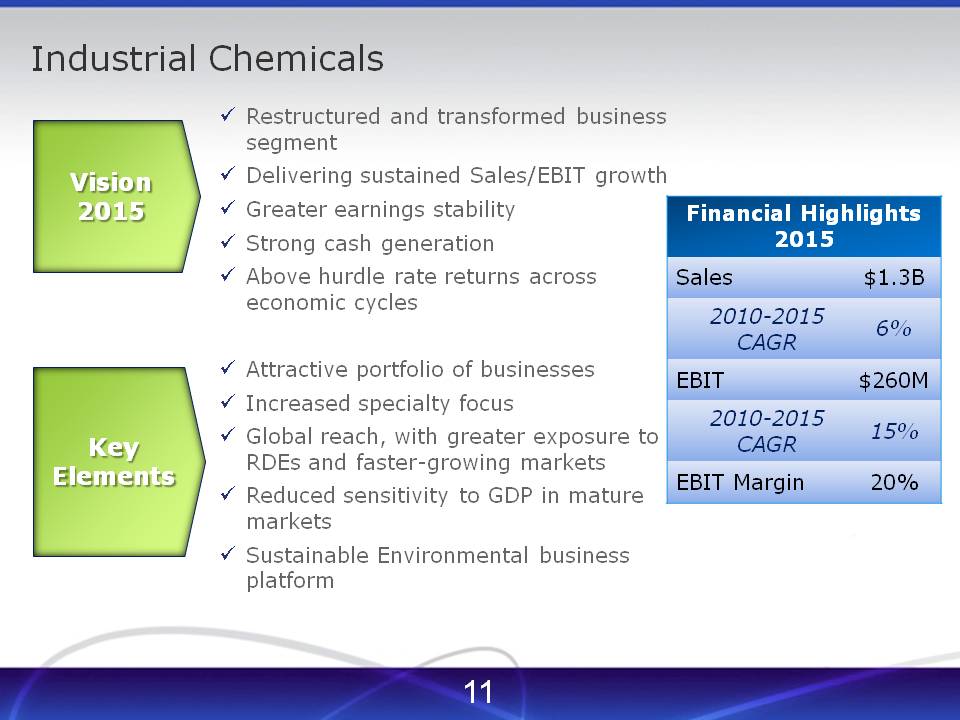
Industrial Chemicals Vision 2015
| |
• | Restructured and transformed business segment |
| |
• | Delivering sustained Sales/EBIT growth |
| |
• | Greater earnings stability |
| |
• | Above hurdle rate returns across economic cycles |
| |
• | Attractive portfolio of businesses |
| |
• | Increased specialty focus |
| |
• | Global reach, with greater exposure to RDEs and faster-growing markets |
| |
• | Reduced sensitivity to GDP in mature markets |
| |
• | Sustainable Environmental business platform |
| |
• | Financial Highlights 2015 |
| |
• | Sales $1.3B 2010-2015 CAGR 6% EBIT $260M 2010-2015 CAGR 15% EBIT Margin 20% |
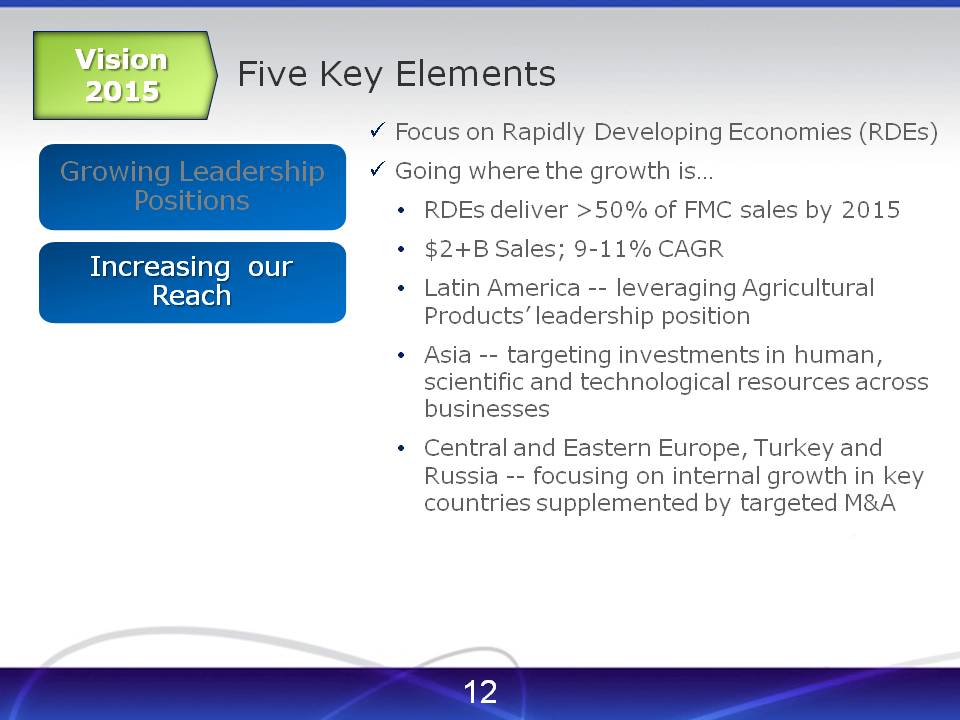
Five Key Elements Growing Leadership Positions Increasing our Reach Vision 2015
| |
• | Focus on Rapidly Developing Economies (RDEs) |
| |
• | Going where the growth is… |
| |
• | RDEs deliver >50% of FMC sales by 2015 |
| |
• | Latin America -- leveraging Agricultural Products' leadership position |
| |
• | Asia -- targeting investments in human, scientific and technological resources across businesses |
| |
• | Central and Eastern Europe, Turkey and Russia -- focusing on internal growth in key countries supplemented by targeted M&A |
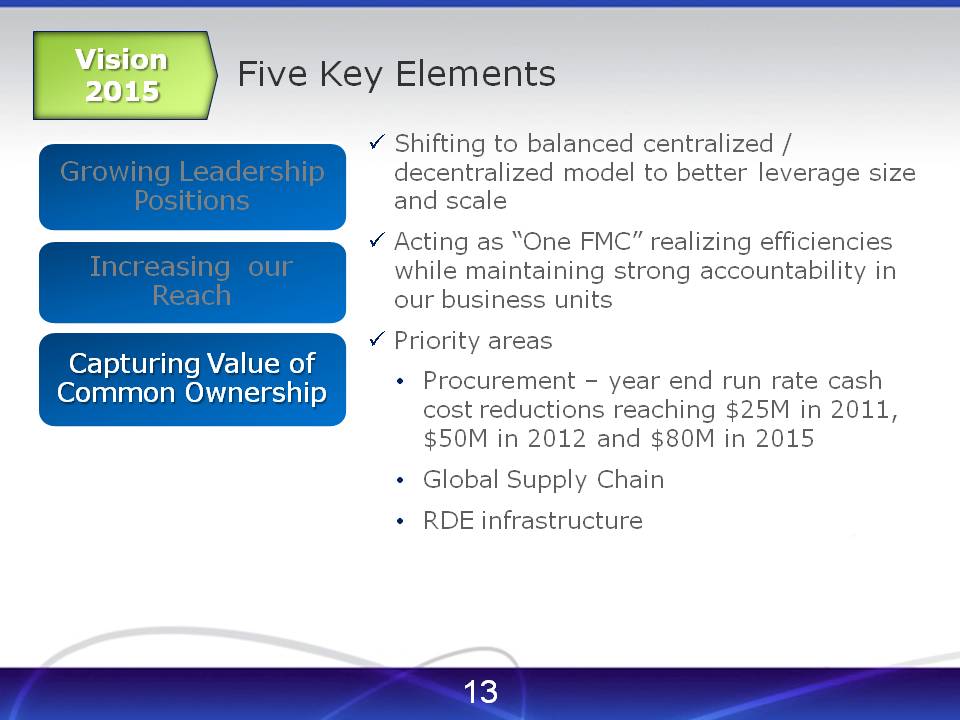
Five Key Elements Growing Leadership Positions Increasing our Reach Vision 2015 Capturing Value of Common Ownership
| |
• | hifting to balanced centralized / decentralized model to better leverage size and scale |
| |
• | Acting as “One FMC” realizing efficiencies while maintaining strong accountability in our business units |
| |
• | Procurement - year end run rate cash cost reductions reaching $25M in 2011, $50M in 2012 and $80M in 2015 |
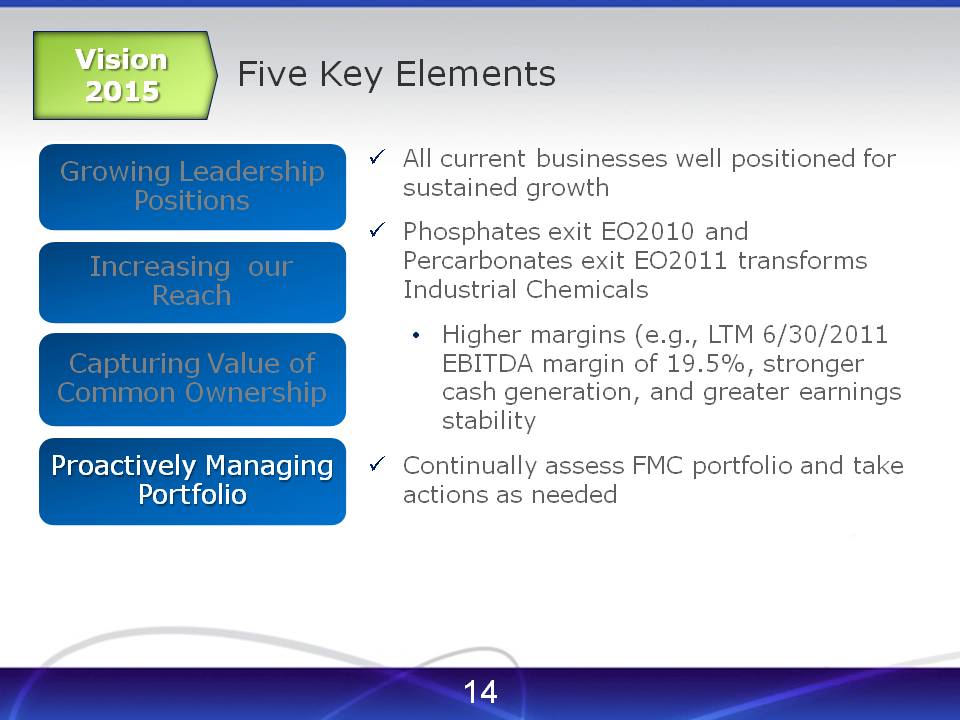
Five Key Elements Growing Leadership Positions Increasing our Reach Vision 2015 Capturing Value of Common Ownership Proactively Managing Portfolio
| |
• | All current businesses well positioned for sustained growth |
| |
• | Phosphates exit EO2010 and Percarbonates exit EO2011 transforms Industrial Chemicals |
| |
• | Higher margins (e.g., LTM 6/30/2011 EBITDA margin of 19.5%, stronger cash generation, and greater earnings stability |
| |
• | Continually assess FMC portfolio and take actions as needed |
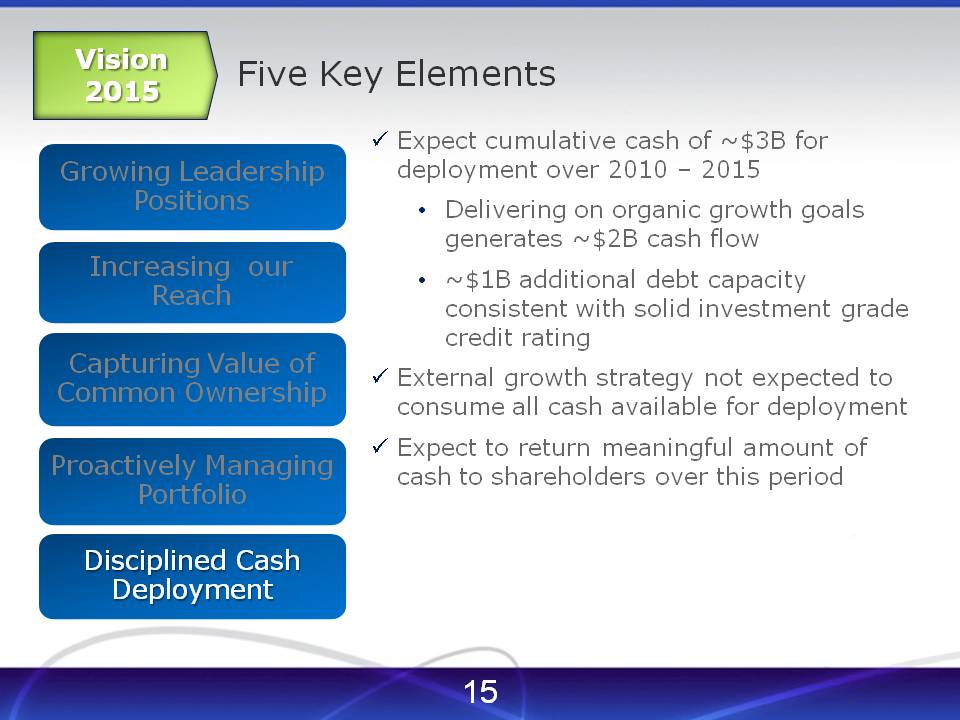
Five Key Elements Growing Leadership Positions Increasing our Reach Vision 2015 Capturing Value of Common Ownership Proactively Managing Portfolio Disciplined Cash Deployment
| |
• | Expect cumulative cash of ~$3B for deployment over 2010 - 2015 |
| |
• | Delivering on organic growth goals generates ~$2B cash flow |
| |
• | ~$1B additional debt capacity consistent with solid investment grade credit rating |
| |
• | External growth strategy not expected to consume all cash available for deployment |
| |
• | Expect to return meaningful amount of cash to shareholders over this period |
Vision 2015 FMC The right chemistry
Glossary of Financial Terms & Reconciliations of GAAP to Non-GAAP
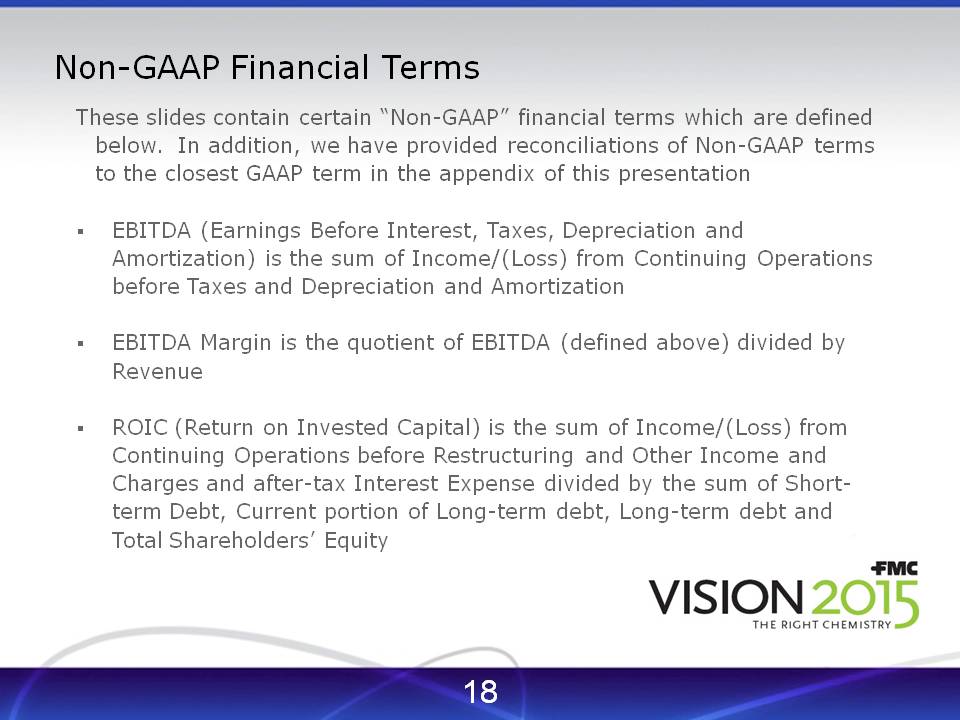
Non-GAAP Financial Terms
These slides contain certain “Non-GAAP” financial terms which are defined below. In addition, we have provided reconciliations of Non-GAAP terms to the closest GAAP term in the appendix of this presentation
| |
▪ | EBITDA (Earnings Before Interest, Taxes, Depreciation and Amortization) is the sum of Income/(Loss) from Continuing Operations before Taxes and Depreciation and Amortization |
| |
▪ | EBITDA Margin is the quotient of EBITDA (defined above) divided by Revenue |
| |
▪ | ROIC (Return on Invested Capital) is the sum of Income/(Loss) from Continuing Operations before Restructuring and Other Income and Charges and after-tax Interest Expense divided by the sum of Short-term Debt, Current portion of Long-term debt, Long-term debt and Total Shareholders' Equity |
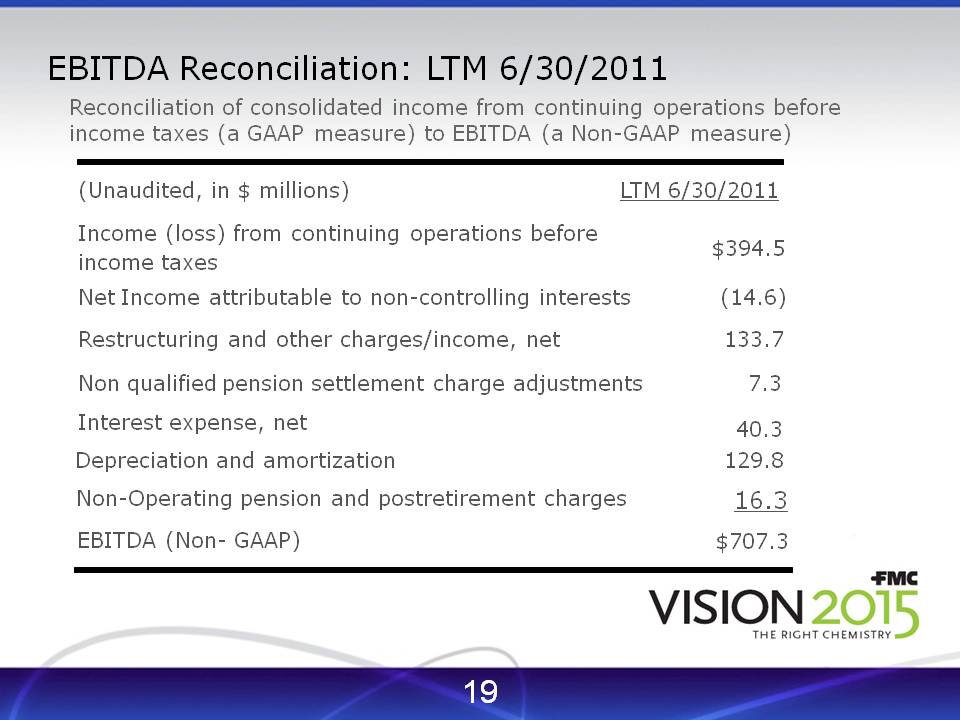
EBITDA Reconciliation: LTM 6/30/2011
Reconciliation of consolidated income from continuing operations before income taxes (a GAAP measure) to EBITDA (a Non-GAAP measure)
(Unaudited, in $ millions) LTM 6/30/2011
Income (loss) from continuing operations before income taxes $394.5
Net Income attributable to non-controlling interests (14.6)
Restructuring and other charges/income, net 133.7
Non qualified pension settlement charge adjustments 7.3
Interest expense, net 40.3
Depreciation and amortization 129.8
Non-Operating pension and postretirement charges 16.3
EBITDA (Non- GAAP) $707.3
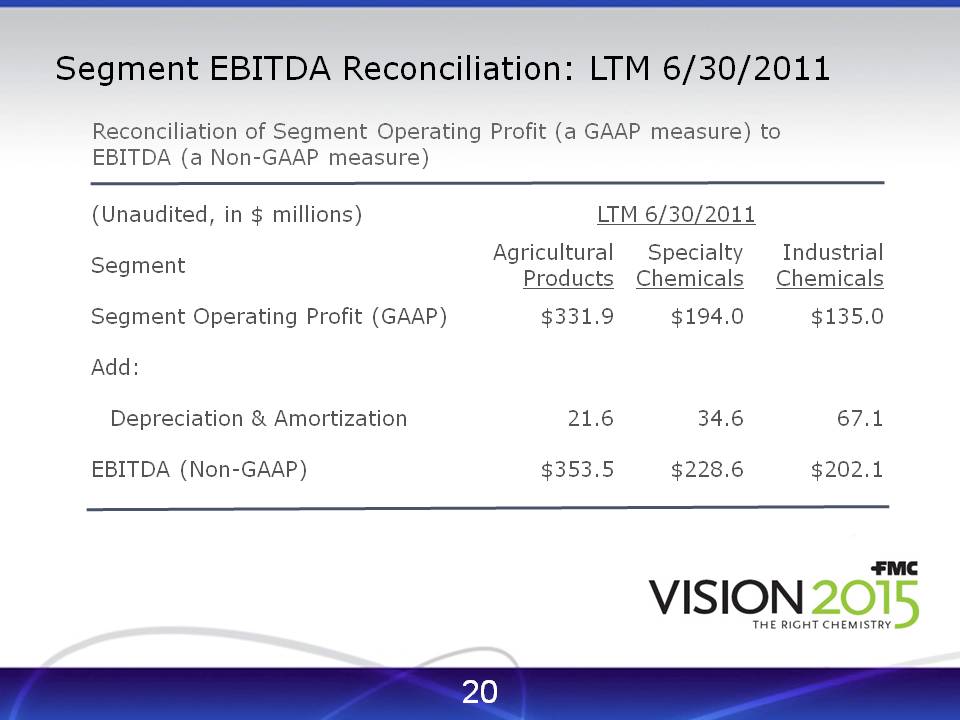
Segment EBITDA Reconciliation: LTM 6/30/2011
Reconciliation of Segment Operating Profit (a GAAP measure) to EBITDA (a Non-GAAP measure)
(Unaudited, in $ millions) LTM 6/30/2011
Segment
Agricultural Products
Specialty Chemicals
Industrial Chemicals
$331.9 $194.0 $135.0 21.6 34.6 67.1 $353.5 $228.6 $202.1
Segment Operating Profit (GAAP)
Add:
Depreciation & Amortization
EBITDA (Non-GAAP)
Vision 2015 FMC The right chemistry