Exhibit 99.1
[logo]
FMC Corporation
UBS Warburg Meetings
September 2nd– 4th, 2003
William G. Walter
Chairman, President and CEO
[LOGO] Disclaimer
Safe Harbor Statement under the Private Securities
Litigation Reform Act of 1995:
These slides and the accompanying presentation contain “forward-looking statements” that represent management’s best judgment as of the date hereof based on information currently available. Actual results of the Company may differ materially from those contained in the forward-looking statements.
Additional information concerning factors that may cause results to materially differ from those in the forward-looking statements is contained in the Company’s periodic reports filed under the Securities Exchange Act of 1934, as amended.
The Company undertakes no obligation to update or revise these forward-looking statements to reflect new events or uncertainties.
[LOGO] FMC Corporation
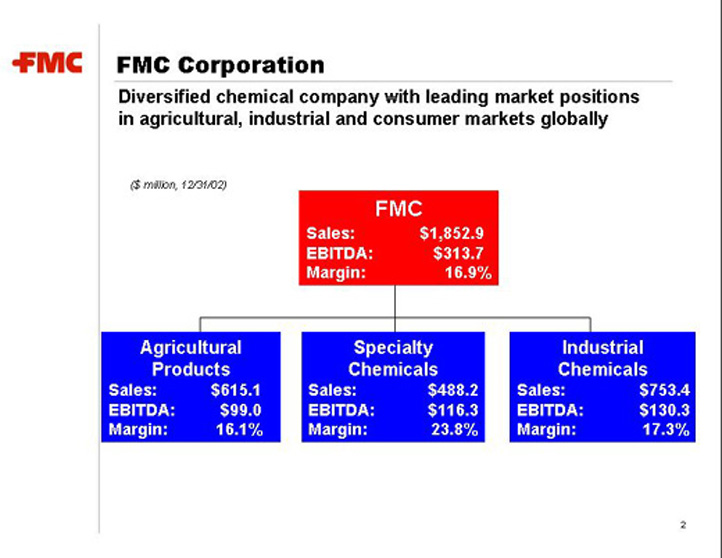
Diversified chemical company with leading market positions
in agricultural, industrial and consumer markets globally
($ million, 12/31/02)
| | | | | FMC | | | | |
| | | | | Sales: | | $1,852.9 | | | | |
| | | | | EBITDA: | | $313.7 | | | | |
| | | | | Margin: | | 16.9% | | | | |
| | |
Agricultural Products | | Specialty Chemicals | | Industrial Chemicals |
Sales: | | $615.1 | | Sales: | | $488.2 | | Sales: | | $753.4 |
EBITDA: | | $99.0 | | EBITDA: | | $116.3 | | EBITDA: | | $130.3 |
Margin: | | 16.1% | | Margin: | | 23.8% | | Margin: | | 17.3% |
[LOGO] Agricultural Products Group Overview
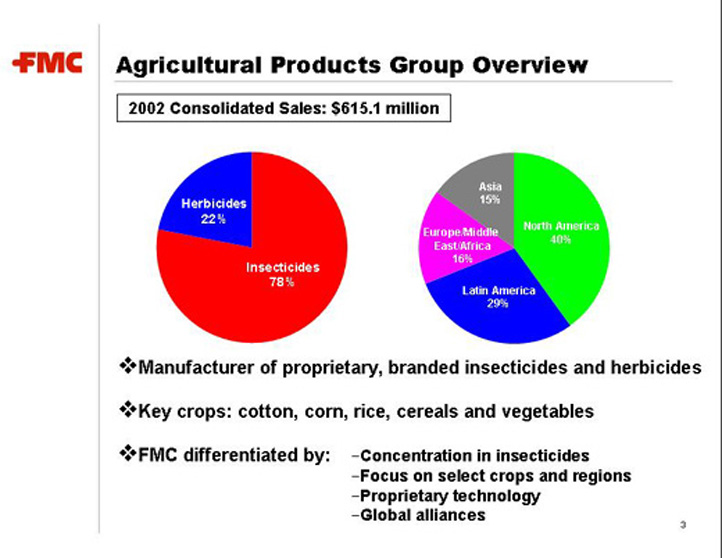
2002 Consolidated Sales: $615.1 million
| · | | Manufacturer of proprietary, branded insecticides and herbicides |
| · | | Key crops: cotton, corn, rice, cereals and vegetables |
—Concentration in insecticides
—Focus on select crops and regions
—Proprietary technology
—Global alliances
[LOGO] Agricultural Products Financial Performance
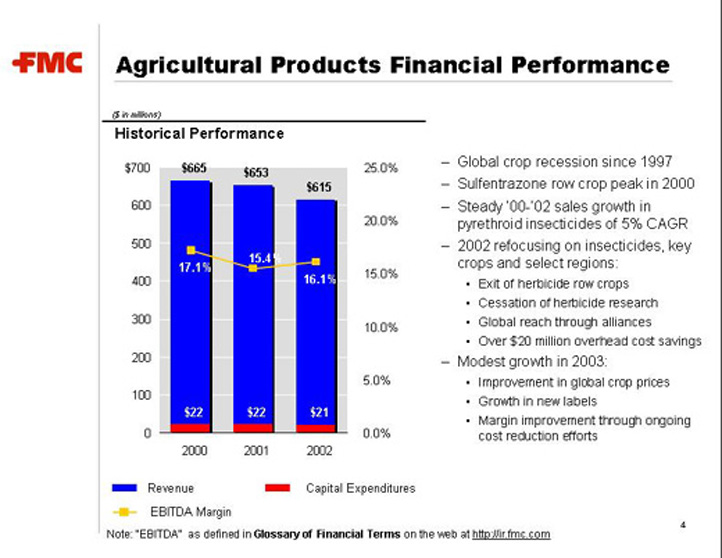
($ in millions)
Historical Performance
| [BAR CHART] |
—Global crop recession since 1997 —Sulfentrazone row crop peak in 2000 —Steady ‘00 -’02 sales growth in pyrethroid insecticides of 5% CAGR —2002 refocusing on insecticides, key crops and select regions: • Exit of herbicide row crops • Cessation of herbicide research • Global reach through alliances • Over $20 million overhead cost savings |
—Modest growth in 2003: • Improvement in global crop prices • Growth in new labels • Margin improvement through ongoing cost reduction efforts |
Note: “EBITDA” as defined in Glossary of Financial Terms on the web at http://ir.fmc.com
[LOGO] Growth in Agricultural Products
• Near-term growth is in our core, patented products representing nearly 45% of total sales:
| | — | | Bifenthrin insecticide driven predominately by corn |
| | — | | Zeta-cypermethrin insecticide driven by 9 new labels |
| | — | | Carfentrazone post-emergent herbicide driven by 4 new labels |
• Strong pipeline for growth in the intermediate term:
| | — | | Novel ISK chemistry targeting sucking pests to launch 2005 |
| | — | | In-licensing/accessing complementary chemistries |
• In the longer term, promising compounds identified through our genomics-based discovery efforts:
| | — | | 10 insect-active chemistries under evaluation |
| | — | | Several of these new-to-the-world chemistries are now in field testing |
| | — | | Commercial opportunity 5+ years away |
[LOGO] Specialty Chemicals Group Overview
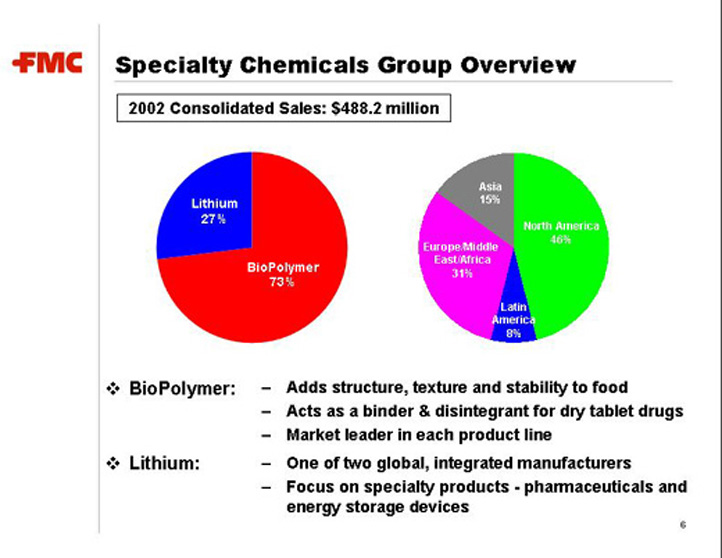
2002 Consolidated Sales: $488.2 million
| | — | | Adds structure, texture and stability to food |
| | — | | Acts as a binder & disintegrant for dry tablet drugs |
| | — | | Market leader in each product line |
| | — | | One of two global, integrated manufacturers |
| | — | | Focus on specialty products - pharmaceuticals and energy storage devices |
[LOGO] Specialty Chemicals Financial Performance
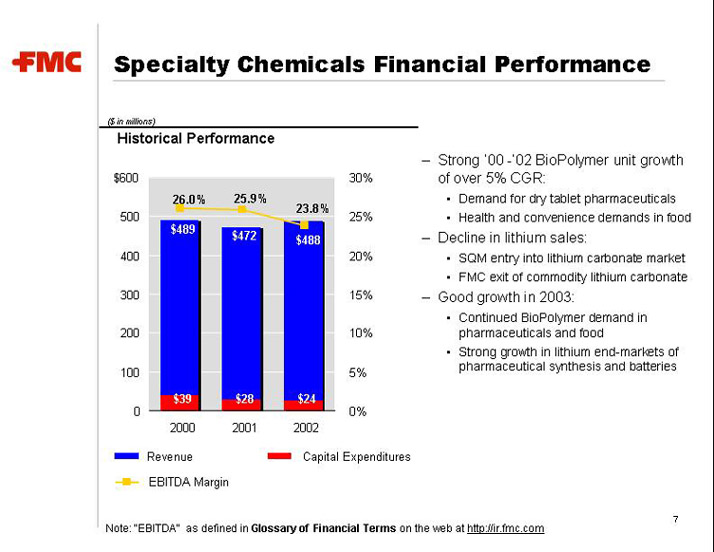
($ in millions)
Historical Performance
| [BAR CHART] | | — Strong ‘00 -’02 BioPolymer unit growth of over 5% CGR: • Demand for dry tablet pharmaceuticals • Health and convenience demands in food |
| | | — Decline in lithium sales: • SQM entry into lithium carbonate market • FMC exit of commodity lithium carbonate |
| | | — Good growth in 2003: • Continued BioPolymer demand in pharmaceuticals and food • Strong growth in lithium end-markets of pharmaceutical synthesis and batteries |
Note: “EBITDA” as defined in Glossary of Financial Terms on the web at http://ir.fmc.com
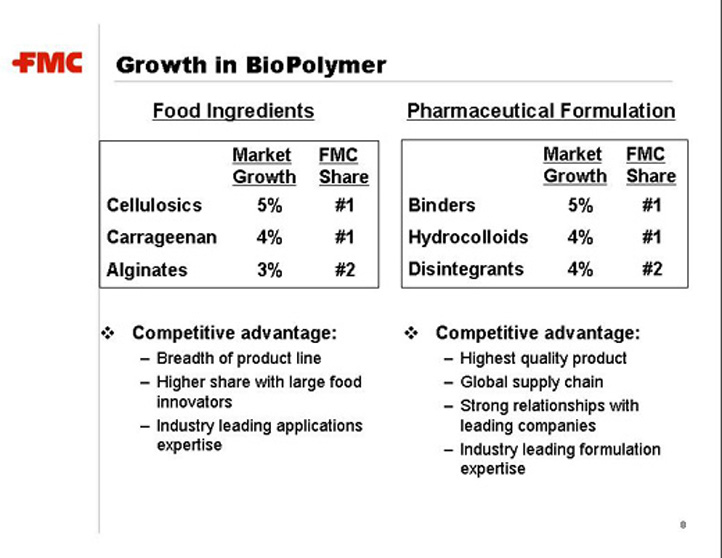
[LOGO] Growth in BioPolymer
Food Ingredients
| | Pharmaceutical Formulation
|
| | | Market Growth
| | | FMC Share
| | | | Market Growth
| | | FMC Share
|
Cellulosics | | 5 | % | | #1 | | Binders | | 5 | % | | #1 |
Carrageenan | | 4 | % | | #1 | | Hydrocolloids | | 4 | % | | #1 |
Alginates | | 3 | % | | #2 | | Disintegrants | | 4 | % | | #2 |
| | | | | | | | | | | | | |
| • Competitive advantage: | | • Competitive advantage: |
– Breadth of product line | | – Highest quality product |
– Higher share with large food innovators | | – Global supply chain |
– Industry leading applications expertise | | – Strong relationships with leading companies |
| | | – Industry leading formulation expertise |
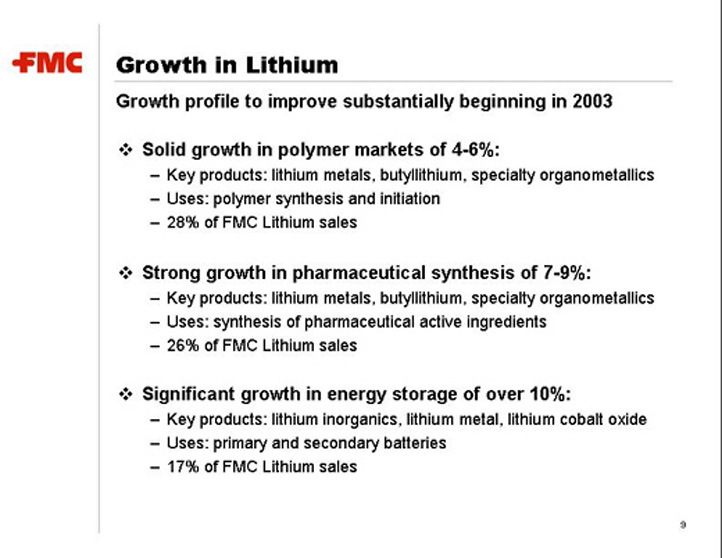
[LOGO] Growth in Lithium
Growth profile to improve substantially beginning in 2003
| · | | Solid growth in polymer markets of 4-6%: |
| | – | | Key products: lithium metals, butyllithium, specialty organometallics |
| | – | | Uses: polymer synthesis and initiation |
| | – | | 28% of FMC Lithium sales |
| · | | Strong growth in pharmaceutical synthesis of 7-9%: |
| | – | | Key products: lithium metals, butyllithium, specialty organometallics |
| | – | | Uses: synthesis of pharmaceutical active ingredients |
| | – | | 26% of FMC Lithium sales |
| · | | Significant growth in energy storage of over 10%: |
| | – | | Key products: lithium inorganics, lithium metal, lithium cobalt oxide |
| | – | | Uses: primary and secondary batteries |
| | – | | 17% of FMC Lithium sales |
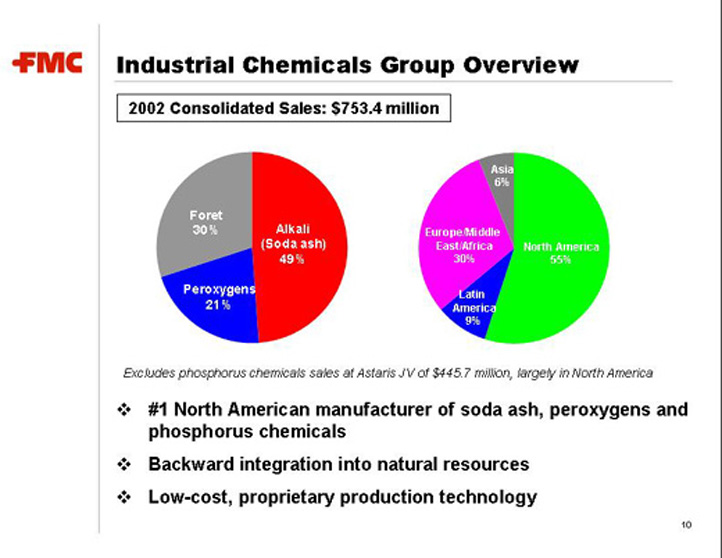
[LOGO] Industrial Chemicals Group Overview
2002 Consolidated Sales: $753.4 million
Excludes phosphorus chemicals sales at Astaris JV of $445.7 million, largely in North America
| | • | | #1 North American manufacturer of soda ash, peroxygens and phosphorus chemicals |
| | • | | Backward integration into natural resources |
| | • | | Low-cost, proprietary production technology |
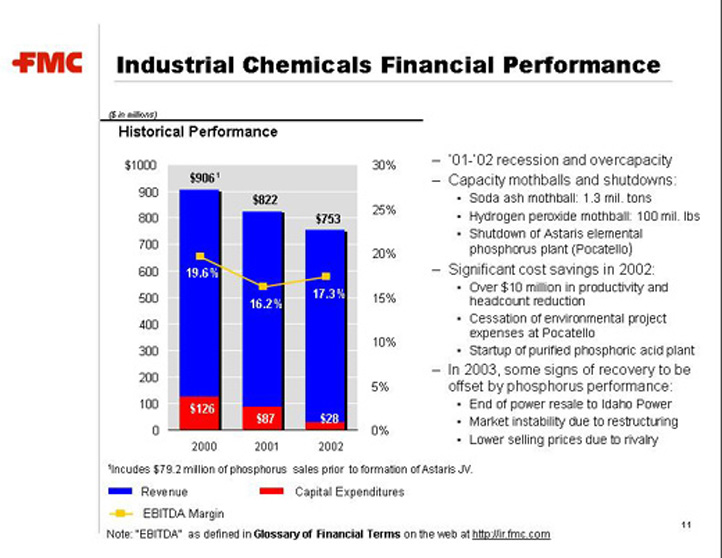
[LOGO] Industrial Chemicals Financial Performance
($ in millions)
Historical Performance
| [BAR CHART] | | — ‘01-’02 recession and overcapacity |
| | | — Capacity mothballs and shutdowns: • Soda ash mothball: 1.3 mil. tons • Hydrogen peroxide mothball: 100 mil. lbs • Shutdown of Astaris elemental phosphorus plant (Pocatello) |
| | | — Significant cost savings in 2002: • Over $10 million in productivity and headcount reduction • Cessation of environmental project expenses at Pocatello • Startup of purified phosphoric acid plant |
| | | — In 2003, some signs of recovery to be offset by phosphorus performance: • End of power resale to Idaho Power • Market instability due to restructuring • Lower selling prices due to rivalry |
1Incudes $79.2 million of phosphorus sales prior to formation of Astaris JV.
Note: “EBITDA” as defined in Glossary of Financial Terms on the web at http://ir.fmc.com
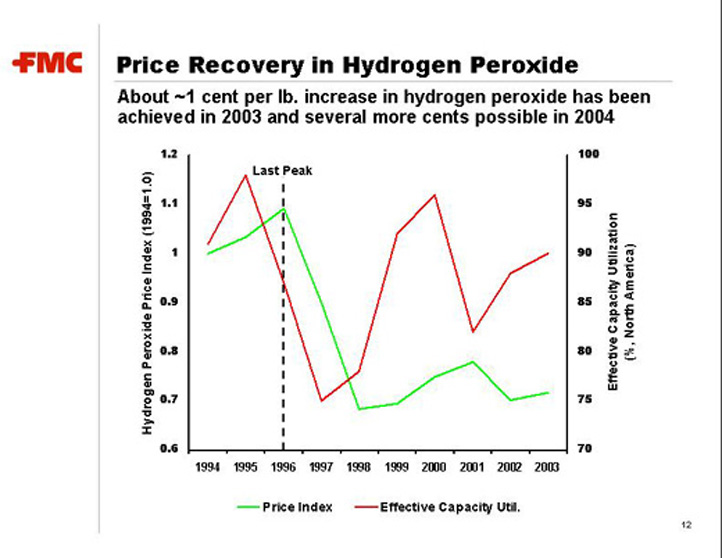
[logo] Price Recovery in Hydrogen Peroxide
About ~1 cent per lb. increase in hydrogen peroxide has been achieved in 2003 and several more cents possible in 2004
[LINE CHART]
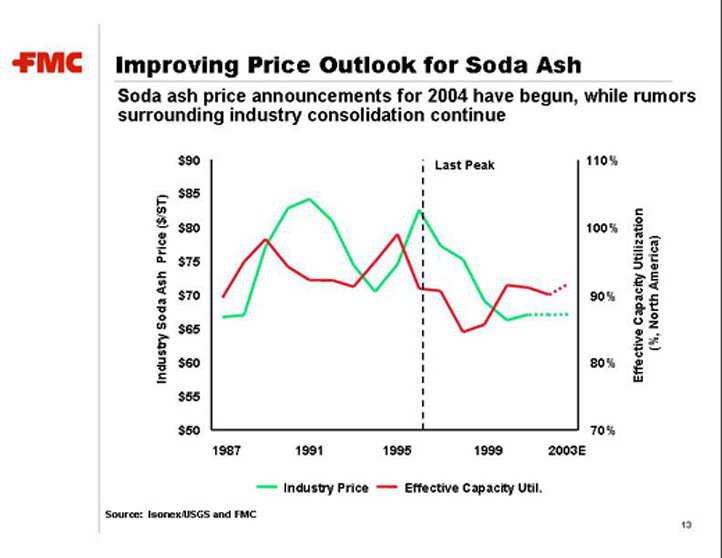
[LOGO] Improving Price Outlook for Soda Ash
Soda ash price announcements for 2004 have begun, while rumors surrounding industry consolidation continue
[LINE CHART]
Source: Isonex/USGS and FMC
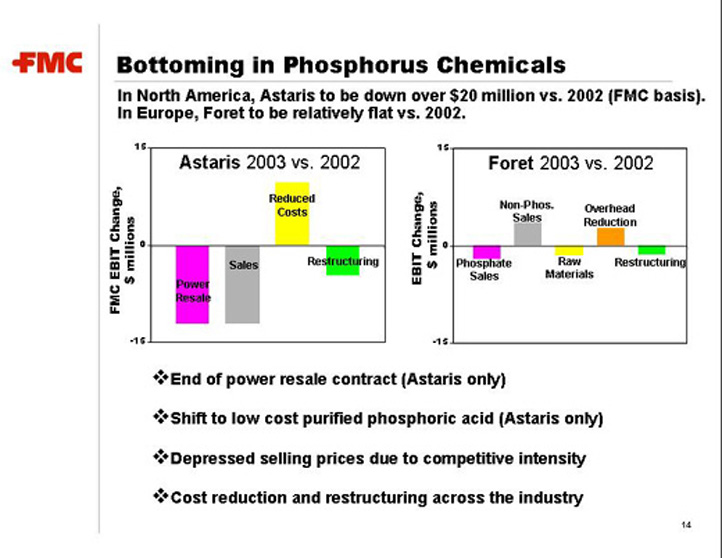
[LOGO] Bottoming in Phosphorus Chemicals
In North America, Astaris to be down over $20 million vs. 2002 (FMC basis). In Europe, Foret to be relatively flat vs. 2002.
| · | | End of power resale contract (Astaris only) |
| · | | Shift to low cost purified phosphoric acid (Astaris only) |
| · | | Depressed selling prices due to competitive intensity |
| · | | Cost reduction and restructuring across the industry |
[LOGO] FMC’s Strengths
Strong businesses in a diversified portfolio
| · | | Leading market positions |
| · | | Diversified business mix and high-quality customer base |
| · | | Diversified and integrated cost structure |
| · | | Focused R&D and strong applications expertise |
| · | | Proven management with extensive industry experience |
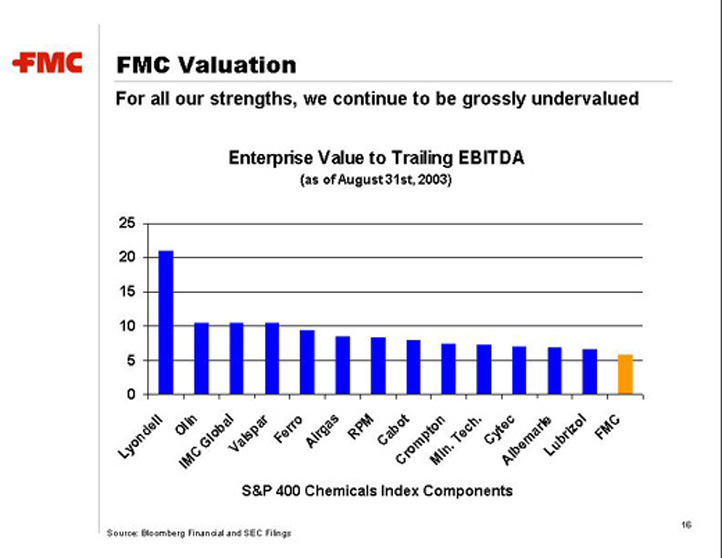
[LOGO] FMC Valuation
For all our strengths, we continue to be grossly undervalued
Enterprise Value to Trailing EBITDA
(as of August 31st, 2003)
[BAR CHART]
S&P 400 Chemicals Index Components
Source: Bloomberg Financial andSEC Filings

[LOGO] Unlocking Shareholder Value
| · | | Maximize and realize operating leverage |
| · | | Create greater financial flexibility |
| · | | Focus the portfolio on higher growth businesses |
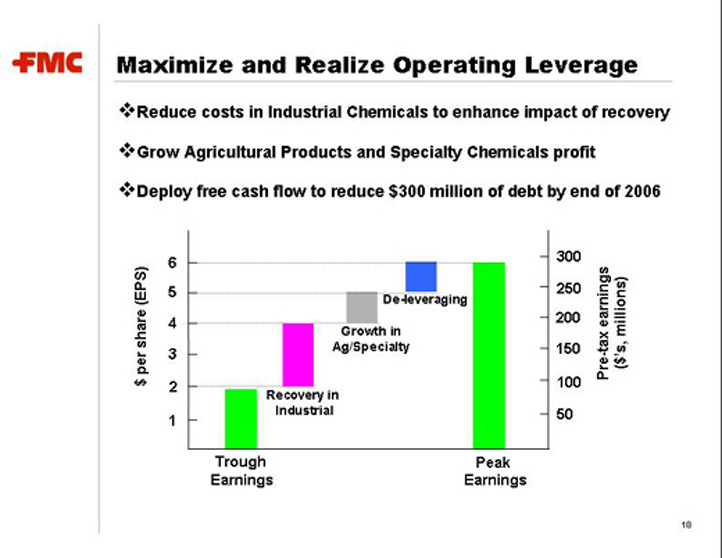
[LOGO] Maximize and Realize Operating Leverage
| · | | Reduce costs in Industrial Chemicals to enhance impact of recovery |
| · | | Grow Agricultural Products and Specialty Chemicals profit |
| · | | Deploy free cash flow to reduce $300 million of debt by end of 2006 |
[CHART]
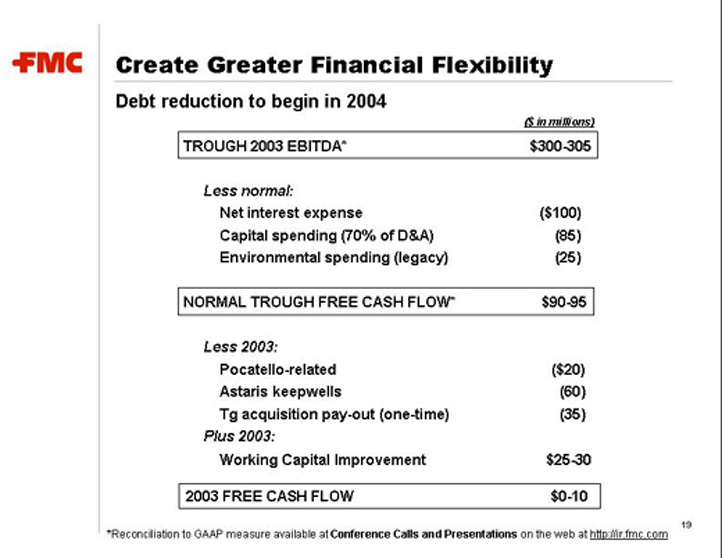
[LOGO] Create Greater Financial Flexibility
Debt reduction to begin in 2004
| | | ($ in millions)
| |
TROUGH 2003 EBITDA* | | $300-305 | |
Less normal: | | | |
Net interest expense | | ($100 | ) |
Capital spending (70% of D&A) | | (85 | ) |
Environmental spending (legacy) | | (25 | ) |
NORMAL TROUGH FREE CASH FLOW* | | $ 90-95 | |
Less 2003: | | | |
Pocatello-related | | ($20 | ) |
Astaris keepwells | | (60 | ) |
Tg acquisition pay-out (one-time) | | (35 | ) |
Plus 2003: | | | |
Working Capital Improvement | | $25-30 | |
2003 FREE CASH FLOW | | $0-10 | |
| * | | Reconciliation to GAAP measure available at Conference Calls and Presentations on the web at http://ir.fmc.com |
[LOGO] Focus Portfolio on Higher Growth Businesses
· | | Selectively grow our more attractive businesses, managing the balance of our portfolio for cash |
| | | – | | Leverage growth platforms in Specialty and Ag |
| | | – | | Manage Industrial Chemicals for cash |
| |
· | | Focus the portfolio on businesses in which FMC is the natural owner |
| | | – | | Maximize value to shareholders of FMC |
| | | – | | Divest those businesses in which another company places higher value |
[LOGO]
FMC Corporation