EXHIBIT 99.1
[LOGO OF FMC]
Credit Suisse First Boston
16thAnnual Chemical Conference
September 18th, 2003
William G. Walter
Chairman, President and CEO
[LOGO OF FMC]
Disclaimer
Safe Harbor Statement under the Private Securities
Litigation Reform Act of 1995:
These slides and the accompanying presentation contain “forward-looking statements” that represent management’s best judgment as of the date hereof based on information currently available. Actual results of the Company may differ materially from those contained in the forward-looking statements.
Additional information concerning factors that may cause results to materially differ from those in the forward-looking statements is contained in the Company’s periodic reports filed under the Securities Exchange Act of 1934, as amended.
The Company undertakes no obligation to update or revise these forward-looking statements to reflect new events or uncertainties.
1
[LOGO OF FMC]
FMC Corporation
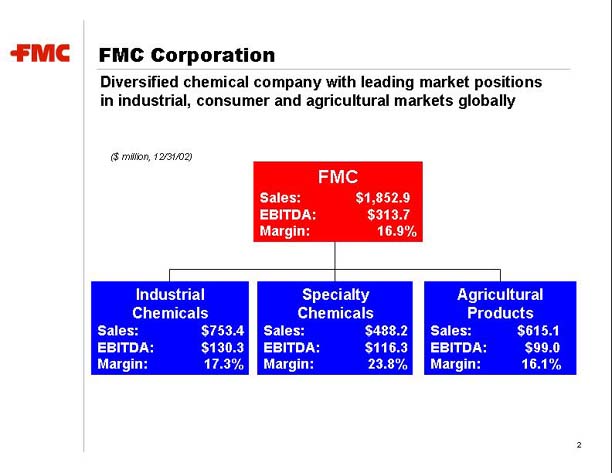
Diversified chemical company with leading market positions in industrial, consumer and agricultural markets globally
($ million, 12/31/02)
| FMC | ||||
Sales: | $ | 1,852.9 | ||
EBITDA: | $ | 313.7 | ||
Margin: | 16.9 | % | ||
Industrial Chemicals | Specialty Chemicals | Agricultural Products | ||||||||||||||
Sales: | $ | 753.4 | Sales: | $ | 488.2 | Sales: | $ | 615.1 | ||||||||
EBITDA: | $ | 130.3 | EBITDA: | $ | 116.3 | EBITDA: | $ | 99.0 | ||||||||
Margin: | 17.3 | % | Margin: | 23.8 | % | Margin: | 16.1 | % | ||||||||
2
[LOGO OF FMC]
Industrial Chemicals: Group Overview
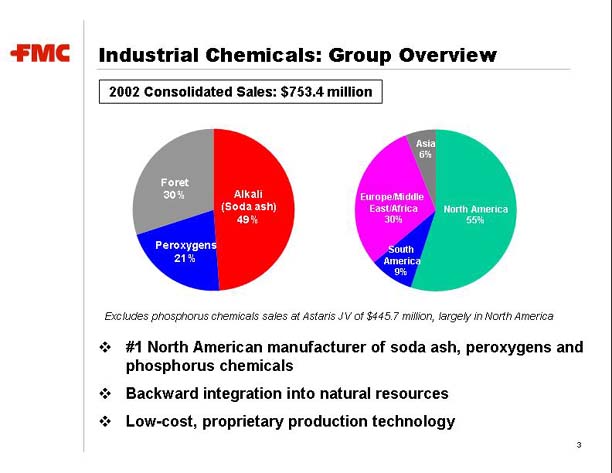
| 2002 Consolidated Sales: $753.4 million |
[GRAPHICS]
Excludes phosphorus chemicals sales at Astaris JV of $445.7 million, largely in North America
| v | #1 North American manufacturer of soda ash, peroxygens and phosphorus chemicals |
| v | Backward integration into natural resources |
| v | Low-cost, proprietary production technology |
3
[LOGO OF FMC]
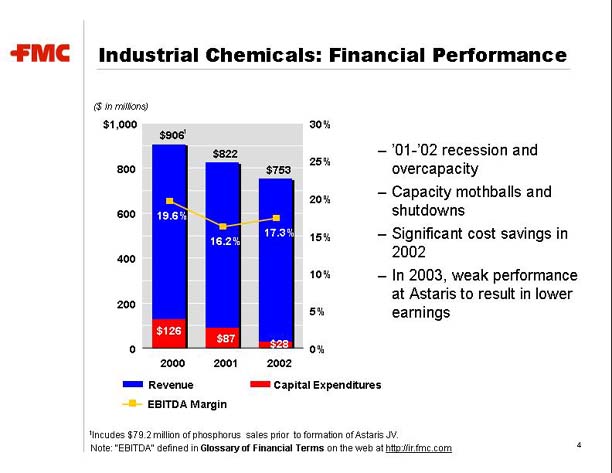
Industrial Chemicals: Financial Performance
($ in millions)
| [GRAPHIC] | – ’01-’02 recession and overcapacity
– Capacity mothballs and shutdowns
– Significant cost savings in 2002
– In 2003, weak performance at Astaris to result in lower earnings |
1Incudes $79.2 million of phosphorus sales prior to formation of Astaris JV.
Note: “EBITDA” defined inGlossary of Financial Terms on the web athttp://ir.fmc.com
4
[LOGO OF FMC]
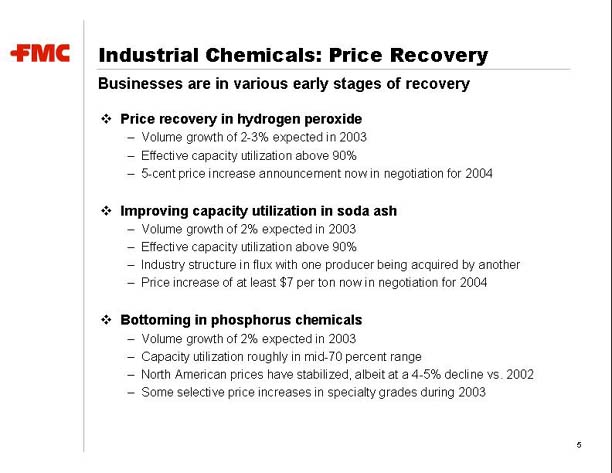
Industrial Chemicals: Price Recovery
Businesses are in various early stages of recovery
| v | Price recovery in hydrogen peroxide |
| – | Volume growth of 2-3% expected in 2003 |
| – | Effective capacity utilization above 90% |
| – | 5-cent price increase announcement now in negotiation for 2004 |
| v | Improving capacity utilization in soda ash |
| – | Volume growth of 2% expected in 2003 |
| – | Effective capacity utilization above 90% |
| – | Industry structure in flux with one producer being acquired by another |
| – | Price increase of at least $7 per ton now in negotiation for 2004 |
| v | Bottoming in phosphorus chemicals |
| – | Volume growth of 2% expected in 2003 |
| – | Capacity utilization roughly in mid-70 percent range |
| – | North American prices have stabilized, albeit at a 4-5% decline vs. 2002 |
| – | Some selective price increases in specialty grades during 2003 |
5
[LOGO OF FMC]
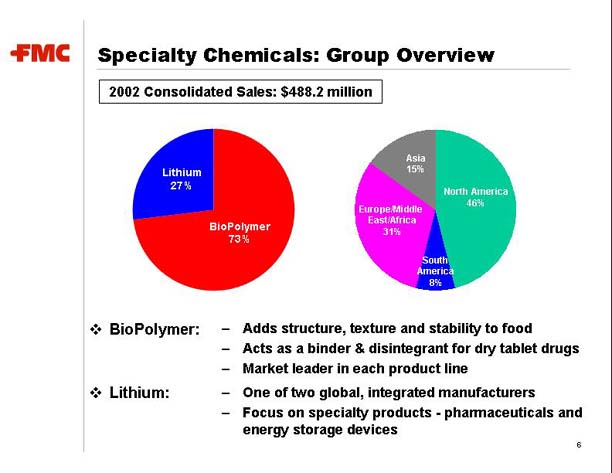
Specialty Chemicals: Group Overview
| 2002 Consolidated Sales: $488.2 million |
[GRAPHIC]
v BioPolymer: | – | Adds structure, texture and stability to food | ||
| – | Acts as a binder & disintegrant for dry tablet drugs | |||
| – | Market leader in each product line | |||
v Lithium: | – | One of two global, integrated manufacturers | ||
| – | Focus on specialty products – pharmaceuticals and energy storage devices | |||
6
[LOGO OF FMC]
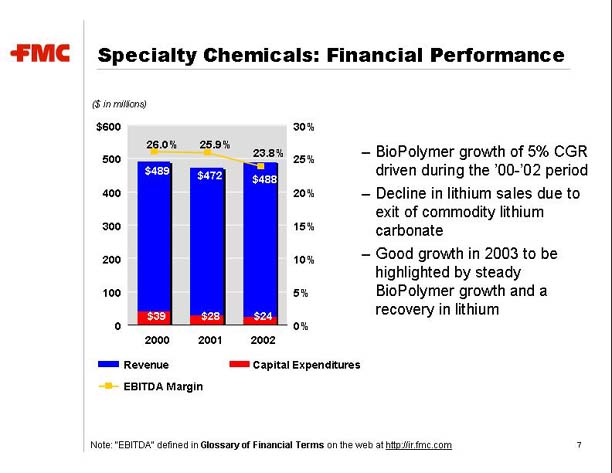
Specialty Chemicals: Financial Performance
($ in millions)
| [GRAPHIC] | – BioPolymer growth of 5% CGR driven during the ‘00-’02 period
– Decline in lithium sales due to exit of commodity lithium carbonate
– Good growth in 2003 to be highlighted by steady BioPolymer growth and a recovery in lithium |
Note: “EBITDA” defined inGlossary of Financial Terms on the web athttp://ir.fmc.com
7
[LOGO OF FMC]
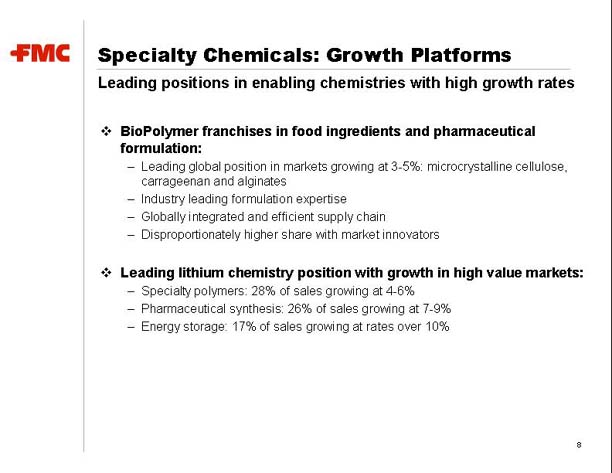
Specialty Chemicals: Growth Platforms
Leading positions in enabling chemistries with high growth rates
| v | BioPolymer franchises in food ingredients and pharmaceutical formulation: |
| – | Leading global position in markets growing at 3-5%: microcrystalline cellulose, carrageenan and alginates |
| – | Industry leading formulation expertise |
| – | Globally integrated and efficient supply chain |
| – | Disproportionately higher share with market innovators |
| v | Leading lithium chemistry position with growth in high value markets: |
| – | Specialty polymers: 28% of sales growing at 4-6% |
| – | Pharmaceutical synthesis: 26% of sales growing at 7-9% |
| – | Energy storage: 17% of sales growing at rates over 10% |
8
[LOGO OF FMC]
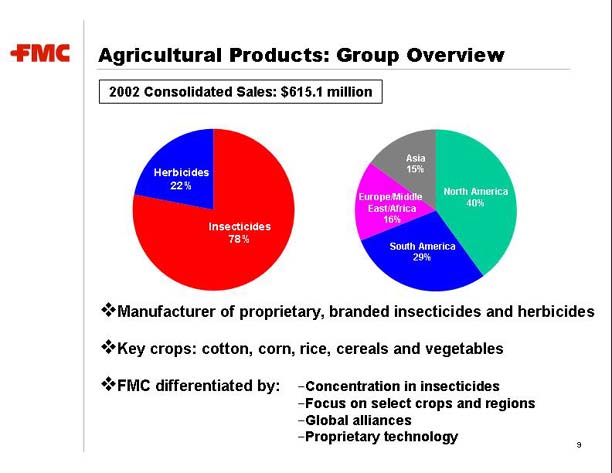
Agricultural Products: Group Overview
2002 Consolidated Sales: $615.1 million
| [GRAPHIC] |
| v | Manufacturer of proprietary, branded insecticides and herbicides |
| v | Key crops: cotton, corn, rice, cereals and vegetables |
v FMC differentiated by: | – Concentration in insecticides
– Focus on select crops and regions
– Global alliances
– Proprietary technology | |||||||
9
[LOGO OF FMC]
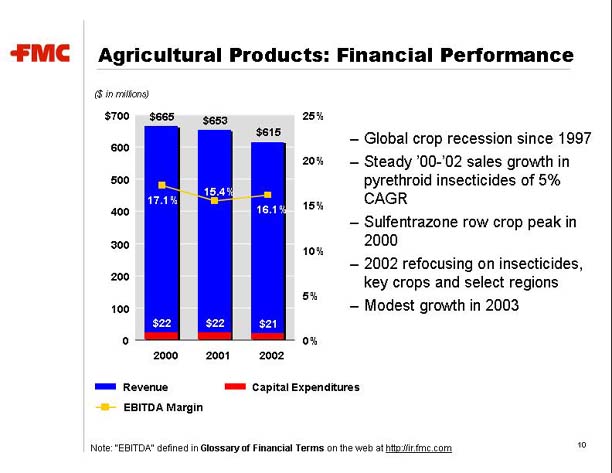
Agricultural Products: Financial Performance
($ in millions)
| [GRAPHIC] | – Global crop recession since 1997
– Steady ’00-’02 sales growth in pyrethroid insecticides of 5% CAGR
– Sulfentrazone row crop peak in 2000
– 2002 refocusing on insecticides, key crops and select regions
– Modest growth in 2003 |
Note: “EBITDA” defined inGlossary of Financial Terms on the web athttp:/ir.fmc.com
10
[LOGO OF FMC]
Agricultural Products: Productivity and Growth
Cost reduction and focused R&D to drive earnings growth
| v | Production outsourcing strategies to continue to result in significant cost savings |
| v | Nearer-term revenue growth to be driven by new labels and promising ISK chemistry: |
| – | New labels in core, patented products of bifenthrin, zeta-cypermethrin and carfentrazone |
| – | Novel ISK chemistry targeting sucking pests to launch 2005 |
| v | In the longer term, promising compounds identified through our genomics-based discovery efforts: |
| – | 10 insect-active chemistries under evaluation |
| – | Several of these new-to-the-world chemistries are now in field testing |
| – | Commercial opportunity 5+ years away |
11
[LOGO OF FMC]
FMC’s Strengths
| Great | businesses in a diverse portfolio |
| v | Leading market positions |
| v | Global presence |
| v | Diversified business mix and high-quality customer base |
| v | Diversified and integrated cost structure |
| v | Focused R&D and strong applications expertise |
| v | Proven management with extensive industry experience |
12

[LOGO OF FMC]
FMC Valuation
For all our strengths, we continue to be grossly undervalued
Enterprise Value to Trailing EBITDA*
(as of September 16th, 2003)
[GRAPHIC]
S&P 400 Chemicals Index Components
Source: Bloomberg Financial and SEC Filings
*Reconciliation to GAAP measure available atConference Calls and Presentations on the web athttp:/ir.fmc.com
13
[LOGO OF FMC]
Unlocking Shareholder Value
| v | Maximize and realize operating leverage |
| v | Create greater financial flexibility |
| v | Focus the portfolio on higher growth businesses |
14
[LOGO OF FMC]
Maximize and Realize Operating Leverage
Industrial Chemicals price recovery is only a matter of time
| v | Capacity utilizations continue to tighten following capacity mothballs and steady demand growth |
| v | Price recovery has begun in hydrogen peroxide, and price outlook in soda ash is improving |
| v | Recovery to be enhanced by significant cost reductions taken in both the U.S. and Europe (Foret) |
| v | Timing of recovery to take several years |
15
[LOGO OF FMC]
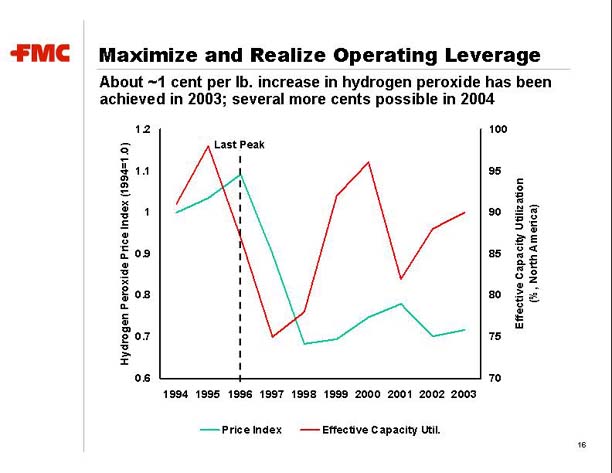
Maximize and Realize Operating Leverage
About ~1 cent per lb. increase in hydrogen peroxide has been achieved in 2003; several more cents possible in 2004
[GRAPHIC]
16
[LOGO OF FMC]
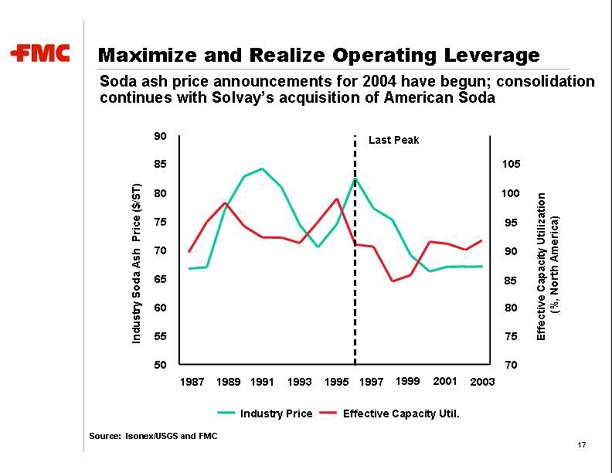
Maximize and Realize Operating Leverage
Soda ash price announcements for 2004 have begun; consolidation continues with Solvay’s acquisition of American Soda
[GRAPHIC]
Source: Isonex/USGS and FMC
17
[LOGO OF FMC]
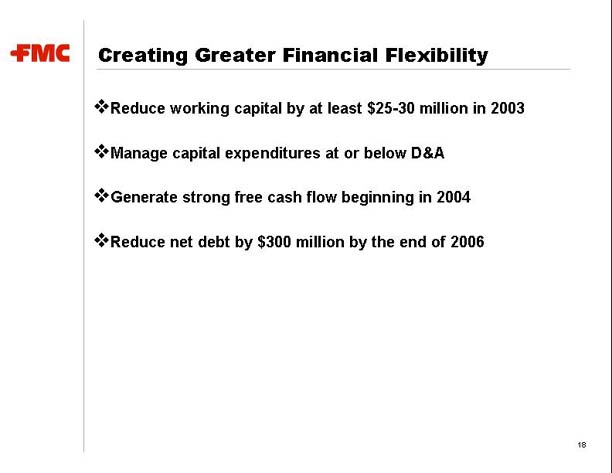
Creating Greater Financial Flexibility
| v | Reduce working capital by at least $25-30 million in 2003 |
| v | Manage capital expenditures at or below D&A |
| v | Generate strong free cash flow beginning in 2004 |
| v | Reduce net debt by $300 million by the end of 2006 |
18
[LOGO OF FMC]
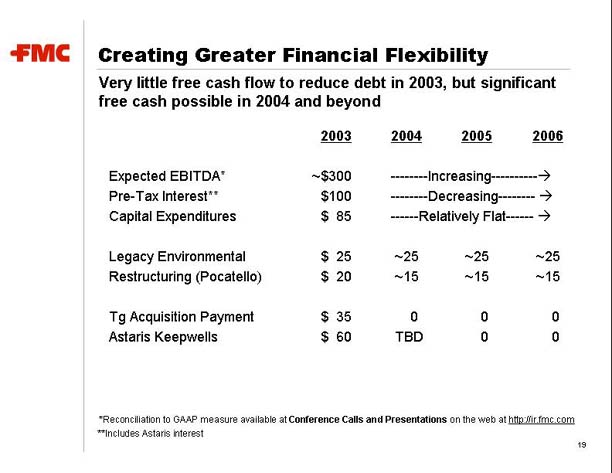
Creating Greater Financial Flexibility
Very little free cash flow to reduce debt in 2003, but significant free cash possible in 2004 and beyond
2003 | 2004 | 2005 | 2006 | |||||
Expected EBITDA* | ~$300 | --------Increasing------® | ||||||
Pre-Tax Interest** | $100 | -------Decreasing------® | ||||||
Capital Expenditures | $ 85 | -----Relatively Flat----® | ||||||
Legacy Environmental | $ 25 | ~25 | ~25 | ~25 | ||||
Restructuring (Pocatello) | $ 20 | ~15 | ~15 | ~15 | ||||
Tg Acquisition Payment | $ 35 | 0 | 0 | 0 | ||||
Astaris Keepwells | $ 60 | TBD | 0 | 0 | ||||
| * | Reconciliation to GAAP measure available atConference Calls and Presentationson the web athttp://ir.fmc.com |
| ** | Includes Astaris interest |
19
[LOGO OF FMC]
Creating Greater Financial Flexibility
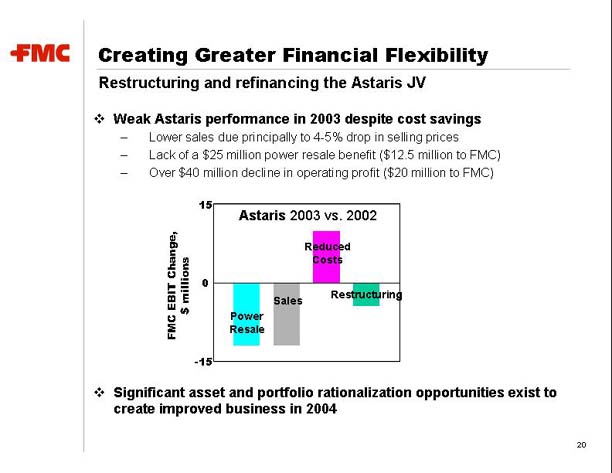
Restructuring and refinancing the Astaris JV
| v | Weak Astaris performance in 2003 despite cost savings |
| – | Lower sales due principally to 4-5% drop in selling prices |
| – | Lack of a $25 million power resale benefit ($12.5 million to FMC) |
| – | Over $40 million decline in operating profit ($20 million to FMC) |
[GRAPHIC]
| v | Significant asset and portfolio rationalization opportunities exist to create improved business in 2004 |
20
[LOGO OF FMC]
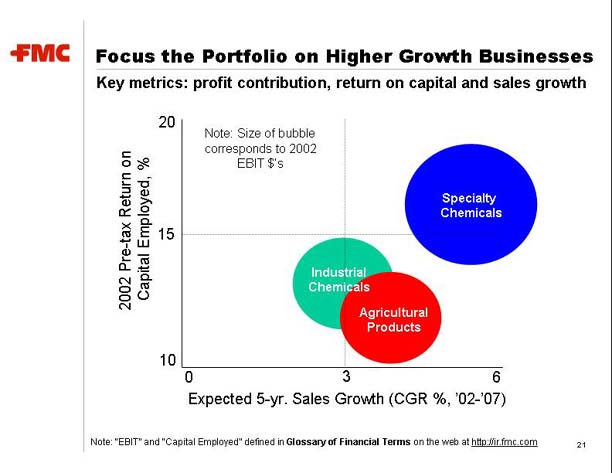
Focus the Portfolio on Higher Growth Businesses
Key metrics: profit contribution, return on capital and sales growth
[GRAPHIC]
Note: “EBIT” and “Capital Employed” defined inGlossary of Financial Termson the web athttp://ir.fmc.com
21
[LOGO OF FMC]
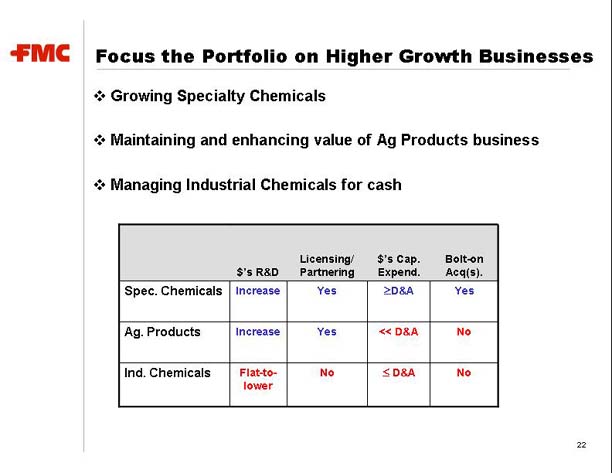
Focus the Portfolio on Higher Growth Businesses
| v | Growing Specialty Chemicals |
| v | Maintaining and enhancing value of Ag Products business |
| v | Managing Industrial Chemicals for cash |
$’s R&D | Licensing/ Partnering | $’s Cap. Expend. | Bolt-on Acq(s). | |||||
Spec. Chemicals | Increase | Yes | ³D&A | Yes | ||||
Ag. Products | Increase | Yes | << D&A | No | ||||
Ind. Chemicals | Flat-to-lower | No | £D&A | No |
22
[LOGO OF FMC]
Focus the Portfolio on Higher Growth Businesses
Opportunistically manage the portfolio to achieve focus
| v | Dispose of product lines, markets or divisions consistently performing below the cost of capital |
| v | Divest those businesses in which another company places a higher value |
23
[LOGO OF FMC]
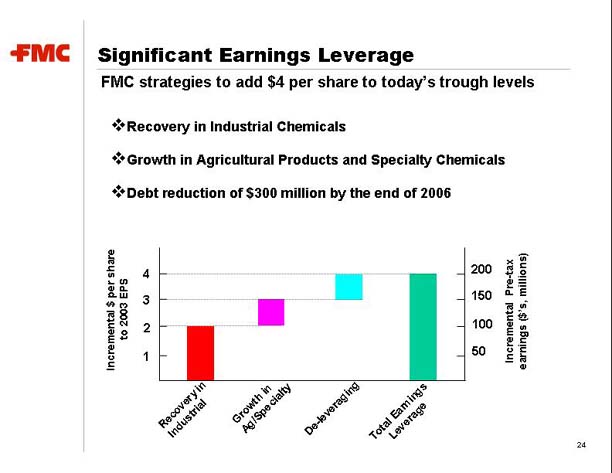
Significant Earnings Leverage
FMC strategies to add $4 per share to today’s trough levels
| v | Recovery in Industrial Chemicals |
| v | Growth in Agricultural Products and Specialty Chemicals |
| v | Debt reduction of $300 million by the end of 2006 |
[GRAPHIC]
24

[LOGO OF FMC]