
FMC Corporation
Credit Suisse First Boston
Meetings
November 13th, 2003
William G. Walter
Chairman, President and CEO
Exhibit 99.1

Safe Harbor Statement under the Private Securities
Litigation Reform Act of 1995:
These slides and the accompanying presentation contain
“forward-looking statements” that represent management’s
best judgment as of the date hereof based on information
currently available. Actual results of the Company may differ
materially from those contained in the forward-looking
statements.
Additional information concerning factors that may cause
results to materially differ from those in the forward-looking
statements is contained in the Company’s periodic reports
filed under the Securities Exchange Act of 1934, as
amended.
The Company undertakes no obligation to update or revise
these forward-looking statements to reflect new events or
uncertainties.
Disclaimer

These slides contain certain “non-GAAP financial terms” which are defined on FMC’s Investor
Relations web site (http://ir.fmc.com) in the Glossary of Financial Terms section. In addition, in
the Conference Calls and Presentations section, we have provided reconciliations of non-
GAAP terms to the closest GAAP term.
These slides also contain references to segment financial terms which are defined below in
reference to Note 18 of FMC’s 2002 Form 10-K:
Use of Non-GAAP Terms
EBITDA (Earnings Before Interest, Taxes, Depreciation and Amortization) for a segment is the
sum of Income (loss) from continuing operations before income taxes and cumulative effect of
change in accounting principle for that segment and Depreciation and Amortization for that
segment.
EBITDA Margin for segment is the quotient of EBITDA (defined above) and Revenue for that
segment.
OPAT (Operating Profit After Tax) for a segment is the after-tax value of Income (loss) from
continuing operations before income taxes and cumulative effect of change in accounting
principle for that segment.
ROCE (Return on Capital Employed) for segment is the quotient of OPAT (defined above) and
Operating capital employed for that segment.
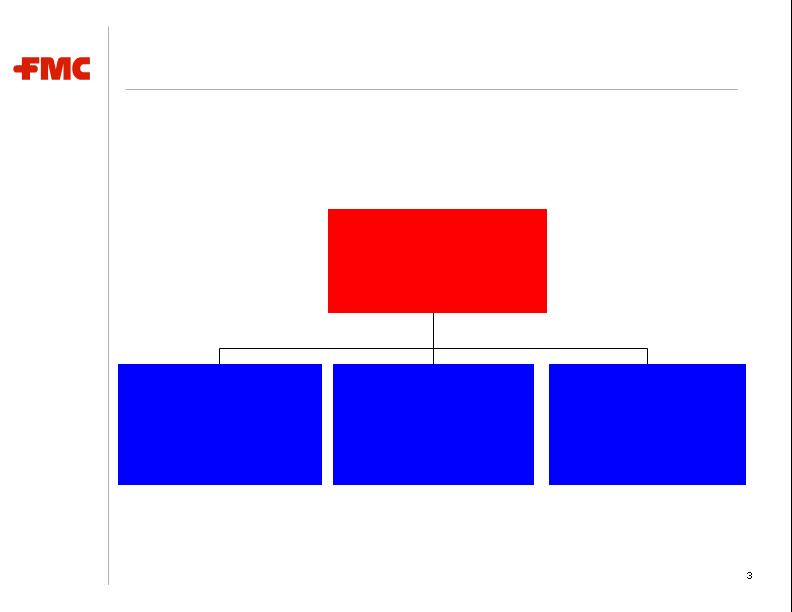
FMC Corporation
Diversified chemical company with leading market positions
in industrial, consumer and agricultural markets globally
($ million, 12/31/02)
FMC
Sales:
$1,852.9
EBITDA:
$313.7
Margin:
16.9%
Industrial
Chemicals
Sales:
$753.4
EBITDA:
$130.3
Margin:
17.3%
Agricultural
Products
Sales:
$615.1
EBITDA:
$99.0
Margin:
16.1%
Specialty
Chemicals
Sales:
$488.2
EBITDA:
$116.3
Margin:
23.8%

FMC’s Strengths
Leading market positions
Global presence
Diversified business mix and high-quality customer base
Diversified and integrated cost structure
Focused R&D and strong applications expertise
Proven management with extensive industry experience
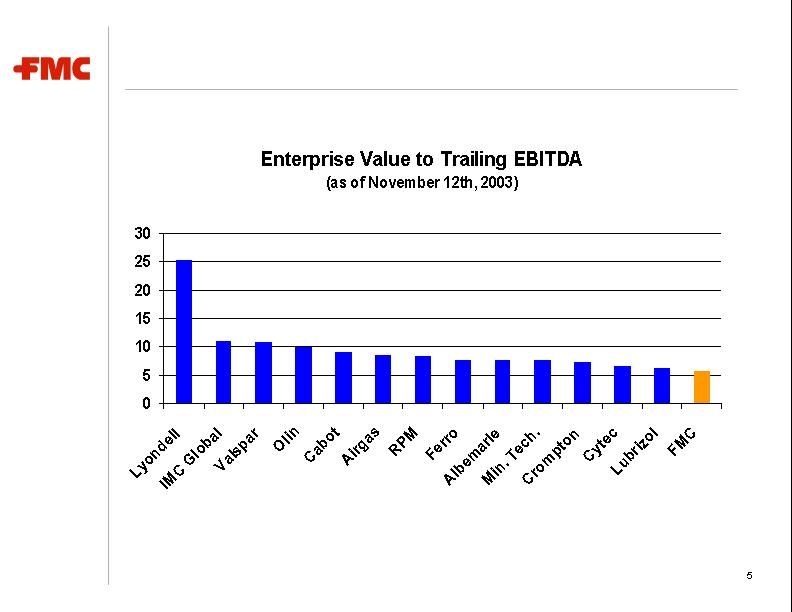
S&P 400 Chemicals Index Components
FMC Valuation
Source: Bloomberg Financial and SEC Filings
For all our strengths, we continue to be grossly undervalued

Unlocking Shareholder Value
Maximize and realize operating leverage
Create greater financial flexibility
Focus the portfolio on higher growth businesses

Maximize and Realize Operating Leverage
Capacity utilizations continue to tighten following capacity
mothballs and steady demand growth
Price recovery has begun in hydrogen peroxide, and price
outlook in soda ash is improving
Timing of selling price recovery to take several years
Recovery to be enhanced by significant restructuring at
Astaris
Industrial Chemicals price recovery is only a matter of time

Creating Greater Financial Flexibility
Expected 2003 Performance:
Working capital reductions of $30-35 million in 2003
Flat capital spending versus 2002, well below D&A
Astaris keepwells of $60 million in 2003
2003 free cash flow of $30-40 million
Outlook for 2004 and beyond:
Keepwells to cease in 2004 at a maximum of $40-50 million
Free cash flow to strengthen in 2004, and again in 2005
Net debt reduction of $300 million by the end of 2006
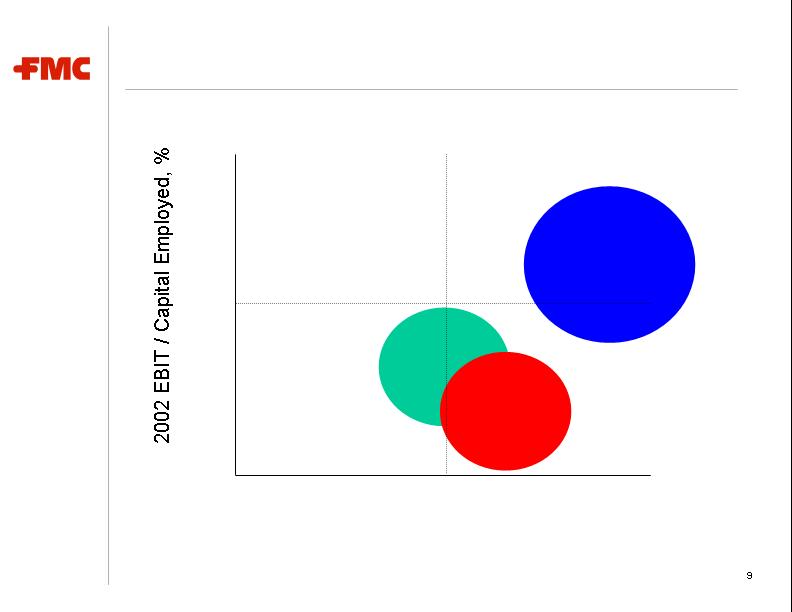
Expected 5-yr. Sales Growth (CGR %, ’02-’07)
15
10
20
3
6
0
Note: Size of bubble
corresponds to 2002
EBIT $’s
Note: For presentation purposes, EBIT is used as proxy for OPAT; sales growth is used as a proxy for OPAT
growth; and EBIT/Capital Employed is used as a proxy for ROCE.
Specialty
Chemicals
Agricultural
Products
Industrial
Chemicals
Focus the Portfolio on Higher Growth Businesses
Key metrics: return on capital and OPAT growth

No
Yes
Yes
Licensing/
Partnering
No
D&A
Flat-to-
lower
Ind. Chemicals
<< D&A
D&A
$’s Cap.
Expend.
Increase
Increase
$’s R&D
No
Yes
Bolt-on
Acq(s).
Ag. Products
Spec. Chemicals
Growing Specialty Chemicals
Maintaining and enhancing value of Ag Products business
Managing Industrial Chemicals for cash
Focus the Portfolio on Higher Growth Businesses

Dispose of product lines, markets or divisions consistently
performing below the cost of capital
Divest those businesses in which another company places a
higher value
Opportunistically manage the portfolio to achieve focus
Focus the Portfolio on Higher Growth Businesses
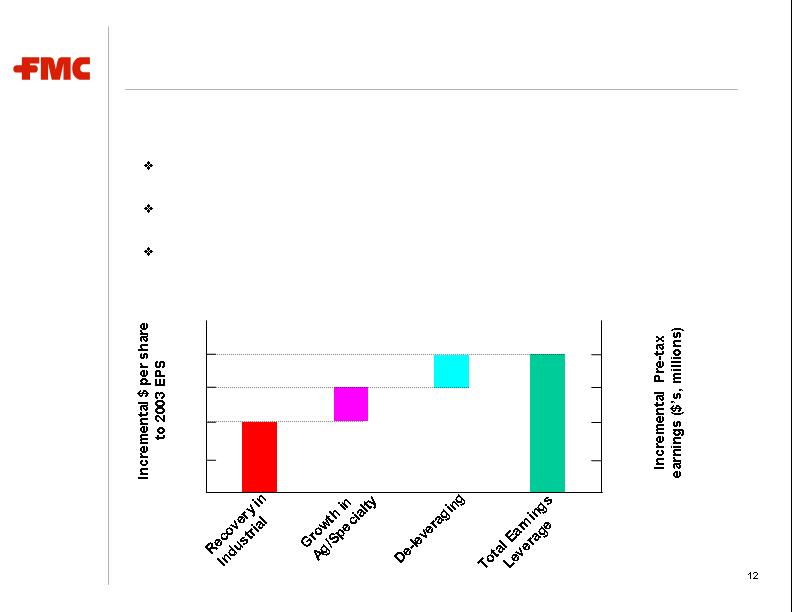
Significant Earnings Leverage
1
2
3
4
50
100
150
200
Recovery in Industrial Chemicals
Growth in Agricultural Products and Specialty Chemicals
Debt reduction of $300 million by the end of 2006
FMC strategies to add $4 per share to today’s trough levels

FMC Corporation
Credit Suisse First Boston
Meetings
November 13th, 2003
Michael Wilson
Vice President and Group Manager
Industrial Chemicals
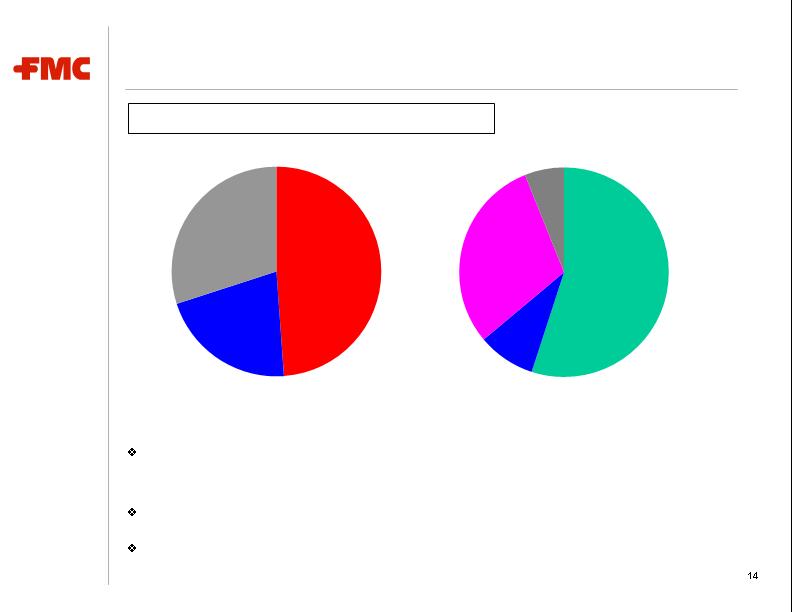
Industrial Chemicals: Group Overview
South
America
9%
North America
55%
Europe/Middle
East/Africa
30%
Asia
6%
Alkali
(Soda ash)
49%
Peroxygens
21%
Foret
30%
#1 North American manufacturer of soda ash, peroxygens and
phosphorus chemicals
Backward integration into natural resources
Low-cost, proprietary production technology
Excludes phosphorus chemicals sales at Astaris JV of $445.7 million, largely in North America
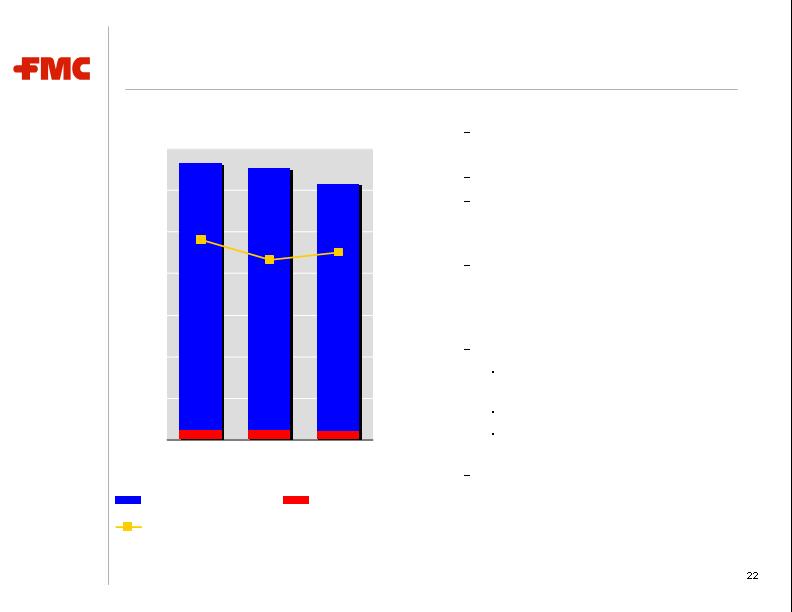
2002 Consolidated Sales: $753.4 million
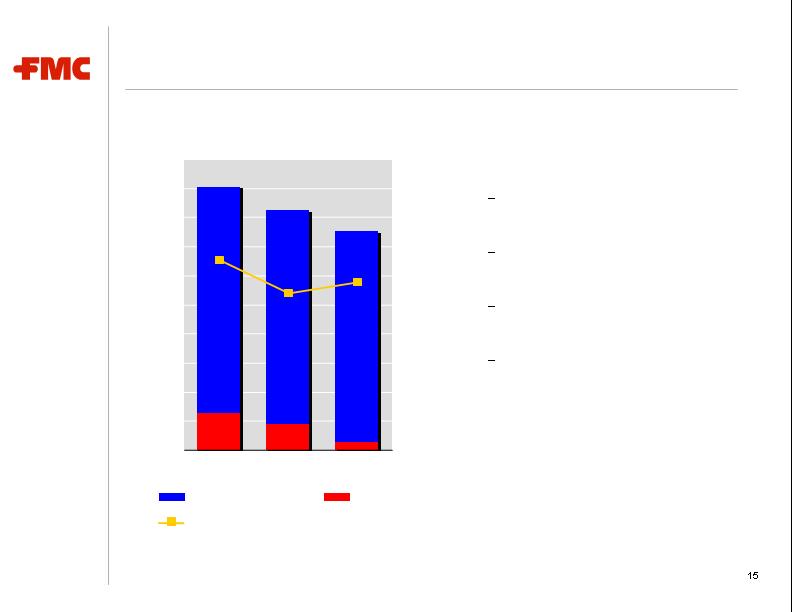
($ in millions)
$906
$822
$753
$126
$87
$28
19.6%
16.2%
17.3%
0
200
400
600
800
$1,000
2000
2001
2002
0%
5%
10%
15%
20%
25%
30%
Revenue
Capital Expenditures
EBITDA Margin
1
1Incudes $79.2 million of phosphorus sales prior to formation of Astaris JV.
’01-’02 recession and
overcapacity
Capacity mothballs and
shutdowns
Significant cost savings in
2002
In 2003, weak performance
at Astaris to result in
substantially lower earnings
Industrial Chemicals: Financial Performance

Industrial Chemicals: Outlook
Price recovery in hydrogen peroxide
Volume growth of 2% expected in 2003
Effective capacity utilization above 90%
Price increase announcements now in negotiation for 2004
Higher expected energy costs in 2004 as hedges roll over
Improving capacity utilization in soda ash
Volume growth of 2% expected in 2003
Effective capacity utilization above 90%
Industry structure in flux with one producer being acquired by another
Domestic price increase of $7 per ton now in negotiation for 2004
Continued risk of weaker selling prices in the export market (ANSAC)
Turnaround in phosphorus chemicals
Volume growth of 2% expected in 2003
North American prices have stabilized, albeit at a 4-5% decline vs. 2002
Some selective price increases in specialty grades during 2003
Significant restructuring and asset rationalization now underway at Astaris
Businesses are in various early stages of recovery
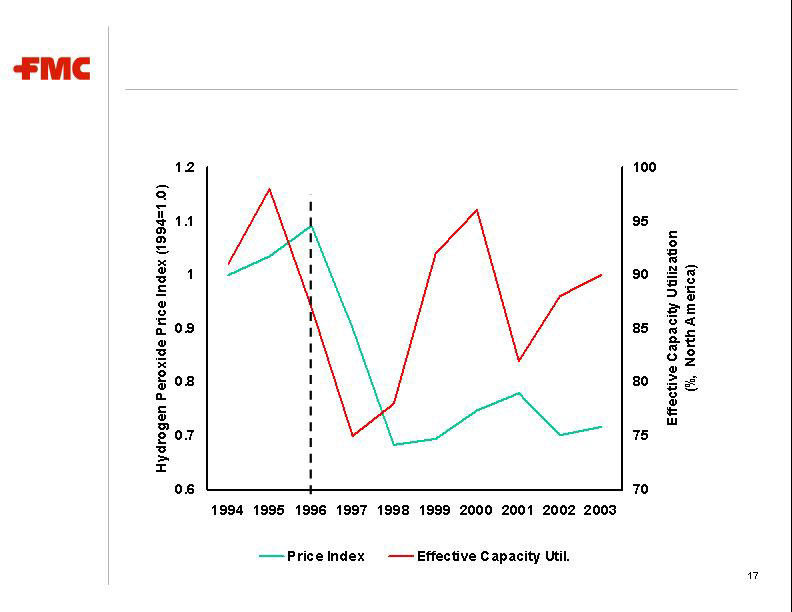
Last Peak
Price Recovery in Hydrogen Peroxide
In North America, about ~1 cent per lb. increase in hydrogen
peroxide has been achieved in 2003 with more expected in 2004
Source: Isonex/USGS and FMC
50
55
60
65
70
75
80
85
90
1987
1991
1995
1997
Industry Price
Effective Capacity Util.
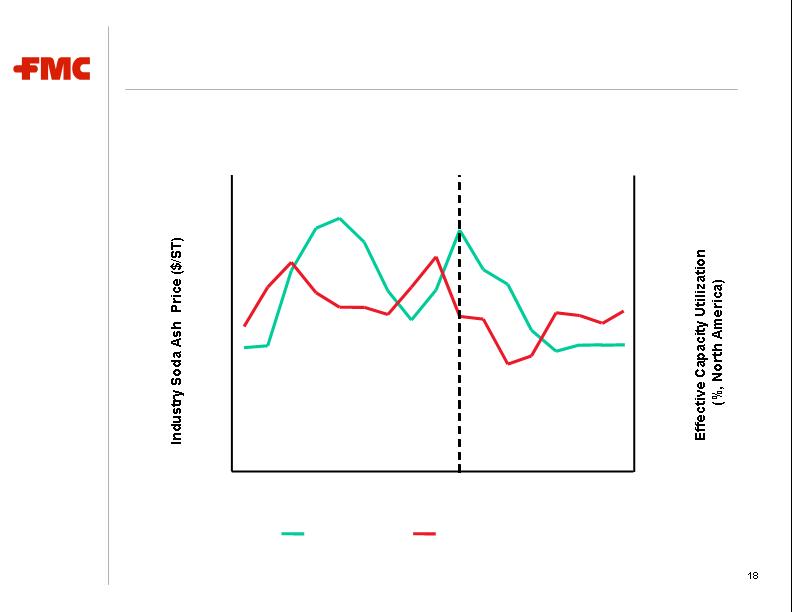
Last Peak
Improving Capacity Utilization in Soda Ash
Soda ash price increase of $7 per ton announced in North America;
acquisition of American Soda by Solvay
1993
2001
1989
1999
2003
70
80
90
100
75
85
95
105

Weak Astaris performance in 2003
Lower sales due principally to 4-5% drop in selling prices
Lack of a $25 million power resale benefit ($12.5 million to FMC)
Resulting, expected FMC keepwell obligation of over $60 million
Significant restructuring at Astaris during 2003-2004
Exit of commodity STPP
Closure of 4 facilities
Annualized savings of $40-50 million ($20-25 million to FMC) once restructuring
is complete in mid-2004
De-leveraging and refinancing Astaris in 2004
Expectation of $40-50 million in 2004 keepwells, which will end FMC’s obligation
Possibility of mid-2004 refinancing which could result in even lower keepwells
Turnaround in Phosphorus Chemicals
Restructuring and refinancing the Astaris JV

FMC Corporation
Credit Suisse First Boston
Meetings
November 13th, 2003
Milton Steele
Vice President and Group Manager
Agricultural Products

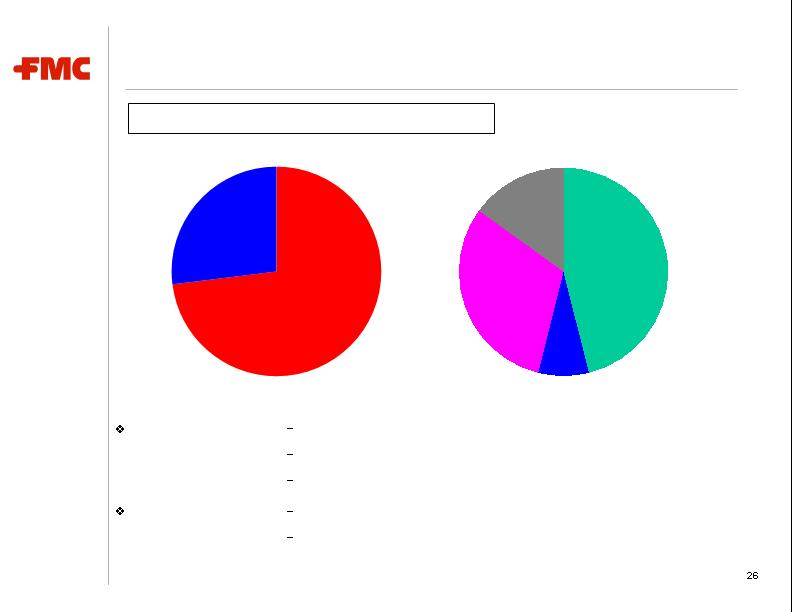
Insecticides
78%
Herbicides
22%
South America
29%
North America
40%
Europe/Middle
East/Africa
16%
Asia
15%
2002 Consolidated Sales: $615.1 million
Agricultural Products: Group Overview
Manufacturer of proprietary, branded insecticides and herbicides
Key crops: cotton, corn, rice, cereals, fruits and vegetables
Strong focused market positions in the Americas (crop & non-crop)
Key positions in Europe/Asia via alliances
Innovation -- ~10% of sales on R&D
FMC differentiated by:
Focus on insecticides
Virtualizing manufacturing
Depth and breadth of partnerships / alliances
($ in millions)
$653
$615
$22
$22
$21
$665
17.1%
16.1%
15.4%
0
100
200
300
400
500
600
$700
2000
2001
2002
0%
5%
10%
15%
20%
25%
Revenue
Capital Expenditures
EBITDA Margin
Agricultural Products: Financial Performance
Declining global chemical crop
protection market since 1996
Multi-faceted competitive rivalry
Steady 2000-02 sales growth in
pyrethroid insecticides of 5%
CAGR
Sulfentrazone row crop peak in
2000, followed by $20 million
profit protection payment from
DuPont in 2001
2002 refocus strategy:
Global cost competitiveness &
Supply Chain optimization
Leveraging SG&A
Focus on insecticides, key crops
and select regions
New alliances with ISK and
Belchim (EU distributor)

Agricultural Products: 2003 Performance
YTD EBIT up 11% compared with last year
Improved margins from manufacturing cost reductions and
favorable product mix
Strong non-crop sales
Significant (and fundamental) improvements in our Brazil business
Alliances in Europe exceeding expectations
Solid cash flow from higher profitability, lower capital spending,
and working capital reduction initiatives
Refocus strategy resulting in solid financial performance

Agricultural Products: Driving Earnings Growth
Focus on select products, regions and markets
Productivity to result in significant expected cost savings
Manufacturing outsourcing strategies continue
SG&A leverage across focused products and regions
Global supply chain efficiencies: reducing SKU’s and third party products
Near-term growth from new labels, alliances and new chemistries
New labels in core products: bifenthrin, zeta-cypermethrin and carfentrazone
Global alliance with ISK fundamental to building market access and scale (Asia
and Western Europe via Belchim)
Novel ISK chemistry targeting sucking pests to launch 2005
Pursuing access to several complementary chemistries
Long-term growth resulting from our target-based discovery efforts
Numerous chemistries under evaluation which look promising
Several of these novel chemistries are now entering field testing
Commercial opportunity 5+ years away
Building and leveraging the talent of our organization

FMC Corporation
Credit Suisse First Boston
Meetings
November 13th, 2003
Ted Butz
Vice President and Group Manager
Specialty Chemicals
BioPolymer
73%
Lithium
27%
South
America
8%
North America
46%
Europe/Middle
East/Africa
31%
Asia
15%
Specialty Chemicals: Group Overview
One of two global, integrated manufacturers
Focus on specialty products - pharmaceuticals and
energy storage devices
Lithium:
Adds structure, texture and stability to food
Acts as a binder & disintegrant for dry tablet drugs
Market leader in each product line
BioPolymer:
2002 Consolidated Sales: $488.2 million
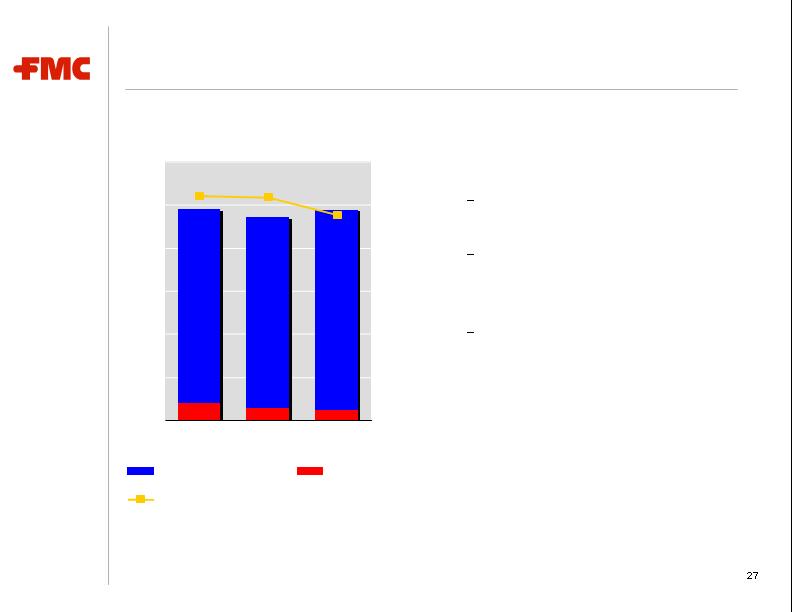
($ in millions)
$39
$28
$24
$488
$472
$489
23.8%
26.0%
25.9%
0
100
200
300
400
500
$600
2000
2001
2002
0%
5%
10%
15%
20%
25%
30%
Revenue
Capital Expenditures
EBITDA Margin
BioPolymer growth of 5% CGR
driven during the ’00-’02 period
Decline in lithium sales due to
exit of commodity lithium
carbonate
Good growth in 2003 to be
highlighted by steady
BioPolymer growth and a strong
recovery in lithium
Specialty Chemicals: Financial Performance

Specialty Chemicals: Strong 2003 Performance
YTD 2003 results highlight improved performance over 2002
Sales up 7.6%
Segment earnings up 17.7%
BioPolymer and Lithium show good earnings improvement
Strong Euro benefits earnings
4th Quarter, as expected, should be flat with prior year
Full year results expectations
5% growth in sales
Double digit growth in segment earnings
EBITDA margin above 25%
Capital Spending consistent with 2002 levels

Specialty Chemicals: BioPolymer Sales Mix
Estimated 2003 Sales: $370 Million
Mix by market
Mix by product

Specialty Chemicals: BioPolymer Growth
Continued drive for productivity improvements
Commercialization of new technology initiatives
In food ingredients:
Improvement following 2003 weakness in nutritional beverages
In pharmaceuticals:
Continuation of growth trend achieved over last several years
Increased investment in new technology initiatives
In personal care:
Increased sales and development across a broader customer base
Development of next generation products for oral care market
Expectation for continued sales growth in low-to-mid-single
digits, and higher earnings growth

New Process
technology
Industry thrives on
innovation
Alternative gum
systems
Narrow product /
customer mix
Strong position in oral
care
Dedicated sales and
technology teams
Excellent customer
relationships
Personal Care
Technology alliances to
expand beyond
traditional excipients
Good position with key
generic and innovators
Increased competitive
activity
Consolidation
Very strong market
positions
Customer relationships
QSR (Quality, Safety,
Reliability)
Pharmaceuticals
New applications for
microcrystalline
cellulose
Productivity
opportunities
Formulated solutions
Price pressure
Slowdown in N. America
Consolidation
Leading market
positions
Strong technology base
Good global coverage
Food Ingredients
Opportunities
Issues
BioPolymer
Franchise
Specialty Chemicals:
Strong BioPolymer Franchises

Specialty Chemicals: Lithium Sales Mix
Estimated 2003 Sales: $140 Million

Achieve above hurdle rate return on investment in 2004
In pharmaceutical synthesis:
High single-digit growth in specialty organics and butyllithium
Quarterly timing driven by campaign runs of our customers
In energy storage:
Double-digit growth foreseen in use of lithium
Improved profitability through sales of more proprietary technologies
Polymer market to grow in line with economy
Manage the balance of the business for cash
Expectation for continued sales growth in mid-single digits and
double digit earnings growth
Specialty Chemicals: Lithium Growth

FMC Corporation
Credit Suisse First Boston
Meetings
November 13th, 2003
Kim Foster
Senior Vice President and CFO

Financial Objectives
Maximize free cash generation through disciplined working
capital management and capital spending
Monetize assets for cash:
Real estate
Asset divestitures
Reduce debt $300 million of debt by the end of 2006

Creating Greater Financial Flexibility
*Includes Astaris interest
Free cash flow of $30-40 million in 2003; to be higher in 2004
2003
2004
2005
2006
Expected EBITDA
~$300
--------Increasing----------
Sale of Assets
$ 13
TBD
TBD
TBD
Working Capital Benefit
~$ 35
TBD
TBD
TBD
Pre-Tax Interest*
$100
--------Decreasing--------
Capital Expenditures
$ 85
------Relatively Flat------
Legacy Environmental
$ 25
~25
~25
~25
Restructuring (Pocatello)
$ 15
~35
~10
~10
Tg Acquisition Payment
$ 35
0
0
0
Astaris Keepwells
$ 63
~45
0
0

FMC Corporation