FMC Corporation Presentation to Senior Lenders December 9, 2003
1 Safe Harbor Statement under the Private Securities Litigation Reform Act of 1995: These slides and the accompanying presentation contain “forward-looking statements” that represent management’s best judgment as of the date hereof based on information currently available. Actual results of the Company may differ materially from those contained in the forward-looking Disclaimer statements. Additional information concerning factors that may cause results to materially differ from those in the forward-looking statements is contained in the Company’s periodic reports filed under the Securities Exchange Act of 1934, as amended. The Company undertakes no obligation to update or revise these forward-looking statements to reflect new events or uncertainties.
Financial Objectives and Outlook Kim Foster Senior Vice President and CFO
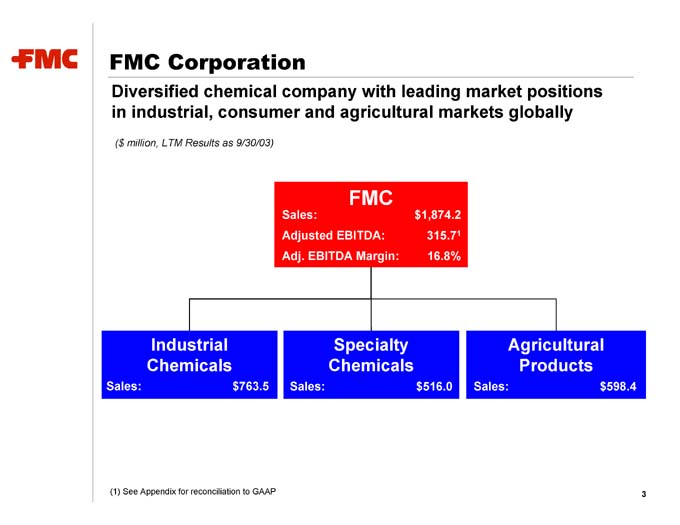
3 $598.4 Agricultural Products Sales: 1 16.8% $1,874.2 315.7 $516.0 FMC Specialty Chemicals Sales: Adjusted EBITDA: Adj. EBITDA Margin: Sales: $763.5 FMC Corporation Diversified chemical company with leading market positions in industrial, consumer and agricultural markets globally ($ million, LTM Results as 9/30/03) Industrial Chemicals (1) See Appendix for reconciliation to GAAP Sales:
• 4 • base experience customer expertise high-quality structure industry and cost applications extensive positions mix integrated strong with and Strengths market presence business and R&D management Leading Global Diversified Diversified Focused Proven • FMC’s . . . . .
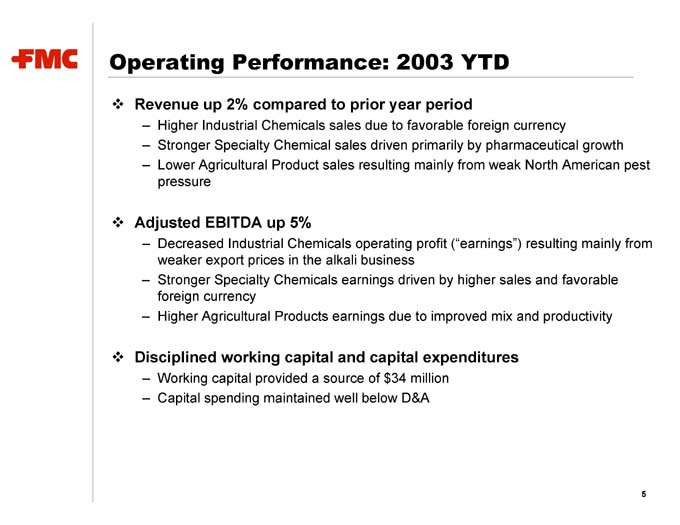
5 favorable Higher Industrial Chemicals sales due to favorable foreign currency Stronger Specialty Chemical sales driven primarily by pharmaceutical growth Lower Agricultural Product sales resulting mainly from weak North American pest pressure Decreased Industrial Chemicals operating profit (“earnings”) resulting mainly from weaker export prices in the alkali business Stronger Specialty Chemicals earnings driven by higher sales and foreign currency Higher Agricultural Products earnings due to improved mix and productivity Working capital provided a source of $34 million Capital spending maintained well below D&A Revenue up 2% compared to prior year period – – – Adjusted EBITDA up 5% – – – Disciplined working capital and capital expenditures – – Operating Performance: 2003 YTD . . .
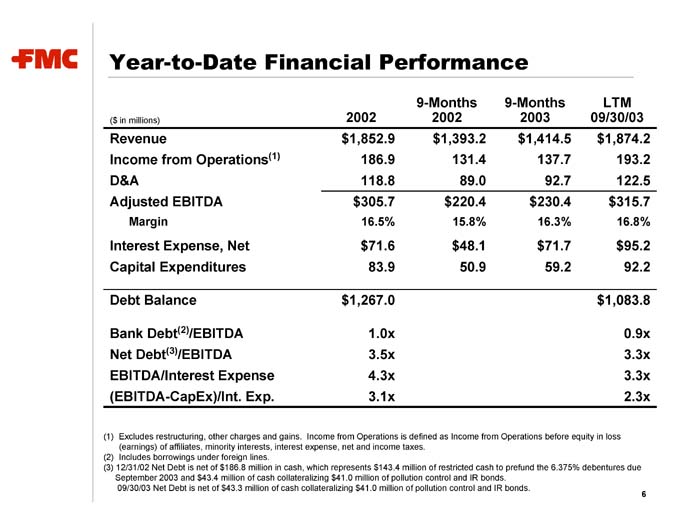
193.2 122.5 $315.7 16.8% $95.2 92.2 0.9x 3.3x 3.3x 2.3x 6 LTM 09/30/03 $1,874.2 $1,083.8 137.7 92.7 $230.4 16.3% $71.7 59.2 the 6.375% debentures due 9-Months 2003 $1,414.5 $1,393.2 131.4 89.0 $220.4 15.8% $48.1 50.9 9-Months 2002 186.9 118.8 $305.7 16.5% $71.6 83.9 1.0x 3.5x 4.3x 3.1x 2002 $1,852.9 $1,267.0 Income from Operations is defined as Income from Operations before equity in loss (1) /EBITDA /EBITDA (2) (3) ($ in millions) Revenue Income from Operations Margin Debt Balance Excludes restructuring, other charges and gains. (earnings) of affiliates, minority interests, interest expense, net and income taxes. Includes borrowings under foreign lines.
September 2003 and $43.4 million of cash collateralizing $41.0 million of pollution control and IR bonds. 09/30/03 Net Debt is net of $43.3 million of cash collateralizing $41.0 million of pollution control and IR bonds. Year-to-Date Financial Performance D&A Adjusted EBITDA Interest Expense, Net Capital Expenditures Bank Debt Net Debt EBITDA/Interest Expense (EBITDA-CapEx)/Int. Exp. (1) (2) (3) 12/31/02 Net Debt is net of $186.8 million in cash, which represents $143.4 million of restricted cash to prefund
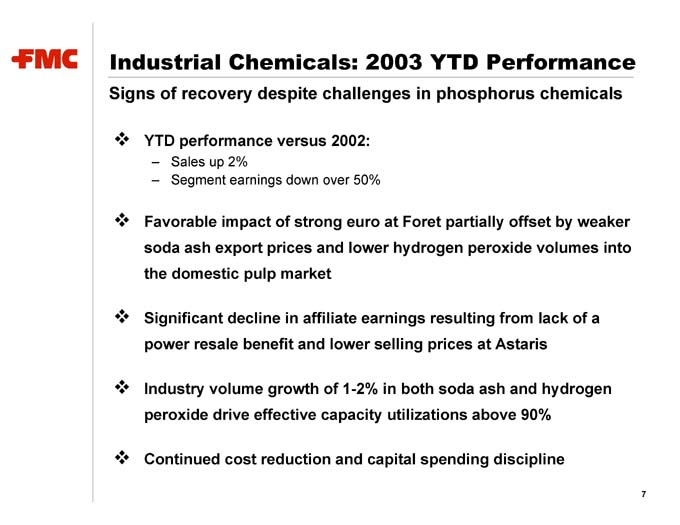
7 a partially offset by weaker Astaris Sales up 2% Segment earnings down over 50% YTD performance versus 2002: – – Favorable impact of strong euro at Foret soda ash export prices and lower hydrogen peroxide volumes into the domestic pulp market Significant decline in affiliate earnings resulting from lack of power resale benefit and lower selling prices at Industry volume growth of 1-2% in both soda ash and hydrogen peroxide drive effective capacity utilizations above 90% Continued cost reduction and capital spending discipline Industrial Chemicals: 2003 YTD Performance Signs of recovery despite challenges in phosphorus chemicals . . . . .
8 18% Sales up 8% Segment earnings up YTD 2003 results highlight strong growth compared with 2002: – – BioPolymer driven by continued growth in microcrystalline cellulose for pharmaceutical formulation market Lithium driven by good growth in pharmaceutical synthesis market and in energy storage applications Productivity enhancements result in margin improvement and relatively flat capital spending Specialty Chemicals: 2003 YTD Performance Growth strategies in key franchises deliver strong performance .. . . .
9 Sales down 4% Segment earnings up 11% YTD performance versus 2002: – – In North America, weak pest pressure in cotton and corn partially offset by strong non-crop sales into the professional, turf and ornamental markets Significant (and fundamental) improvements in Brazil Segment earnings growth driven by a more favorable mix and improved margins from manufacturing cost reductions Solid cash flow from higher profitability, lower capital spending, and working capital reduction initiatives Agricultural Products: 2003 YTD Performance Refocus strategy resulting in solid financial performance . . . . .
10 restructuring and eliminate further financial obligations and volume recovery Astaris Reduce net debt by $300 million (from FYE 2002 level) through FMC’s strong underlying free cash flow generation Grow key franchises in Specialty Chemicals Enhance the value of Agricultural Products through focus and innovation Recover peak Industrial Chemicals earnings through higher selling prices Continue to reduce costs throughout the portfolio Complete Continue to evaluate asset divestiture opportunities Regain a full investment grade credit rating Manage Industrial Chemicals for cash Strategic Objectives Maximize and realize operating leverage – – Create greater financial flexibility – – – – Focus the portfolio on higher growth businesses – – – . . .
11 Modest volume growth Improved capacity utilization keep-well obligation Pursue asset divestiture opportunities Key franchises to drive mid-single digit sales growth in
Specialty Chemicals in Agricultural Products Higher selling prices Complete Astaris restructuring End Astaris Complete last year of significant Pocatello spending New labels to drive low-single digit sales growth in Agricultural Products Better product mix and improved productivity to further drive earnings growth Initial steps to realizing operating leverage in Industrial Chemicals: – – – Steady progress toward greater financial flexibility: – – – – Continued growth in Specialty Chemicals and Agricultural Products: – – – Near-Term Outlook Continued progress on our strategic objectives in 2004 . . .

Financial Objectives and Outlook Tom Deas Vice President and Treasurer
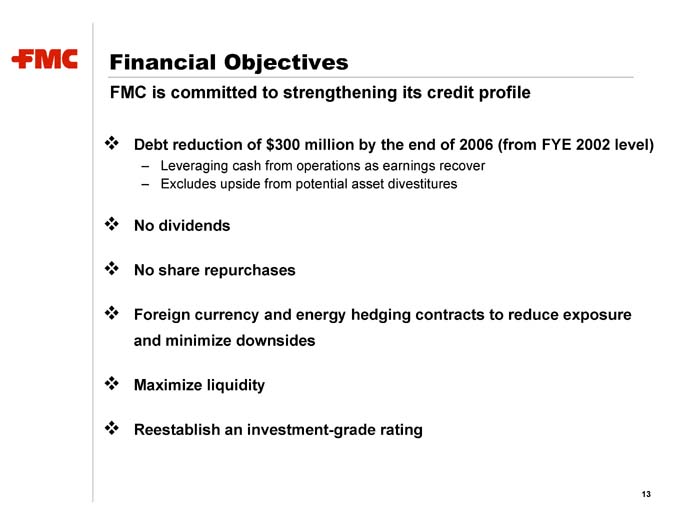
level) 13 Leveraging cash from operations as earnings recover Excludes upside from potential asset divestitures Financial Objectives FMC is committed to strengthening its credit profile Debt reduction of $300 million by the end of 2006 (from FYE 2002 – – No dividends No share repurchases Foreign currency and energy hedging contracts to reduce exposure and minimize downsides Maximize liquidity Reestablish an investment-grade rating . . . . . .
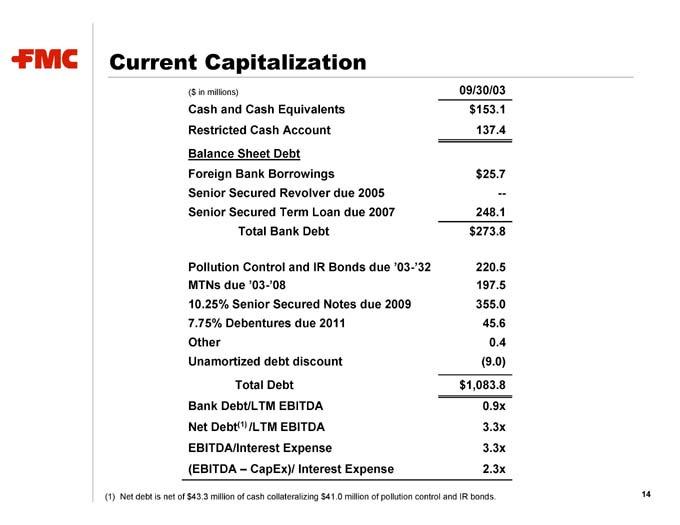
14 09/30/03 $153.1 137.4 $25.7 — 248.1 $273.8 220.5 197.5 355.0 45.6 0.4 (9.0) $1,083.8 0.9x 3.3x 3.3x 2.3x Debt Total Bank Debt /LTM EBITDA CapEx)/ Interest Expense Sheet Total Debt (1) ($ in millions) Cash and Cash Equivalents Restricted Cash Account Senior Secured Revolver due 2005 Pollution Control and IR Bonds due ‘03-’32 10.25% Senior Secured Notes due 2009 Unamortized debt discount Bank Debt/LTM EBITDA Net Debt EBITDA/Interest Expense (EBITDA – Current Capitalization Balance Foreign Bank Borrowings Senior Secured Term Loan due 2007 MTNs due ‘03-’08 7.75% Debentures due 2011 Other Net debt is net of $43.3 million of cash collateralizing $41.0 million of pollution control and IR bonds. (1)
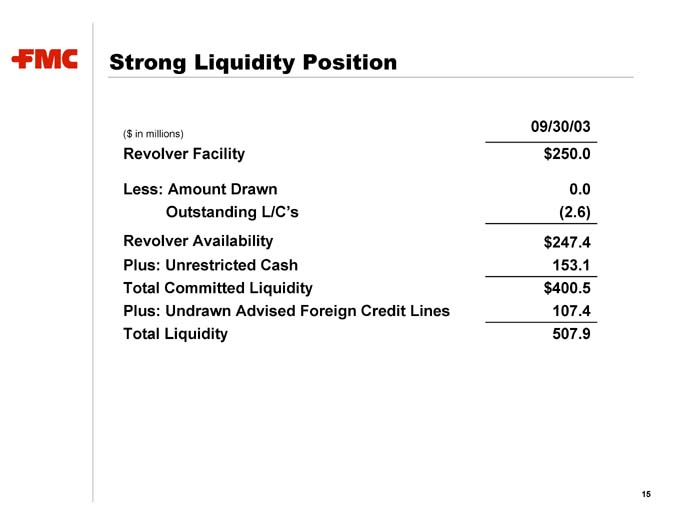
15 09/30/03 $250.0 0.0 (2.6) $247.4 153.1 $400.5 107.4 507.9 Advised Foreign Credit Lines Outstanding L/C’s Strong Liquidity Position ($ in millions) Revolver Facility Less: Amount Drawn Revolver Availability Plus: Unrestricted Cash Total Committed Liquidity Plus: Undrawn Total Liquidity
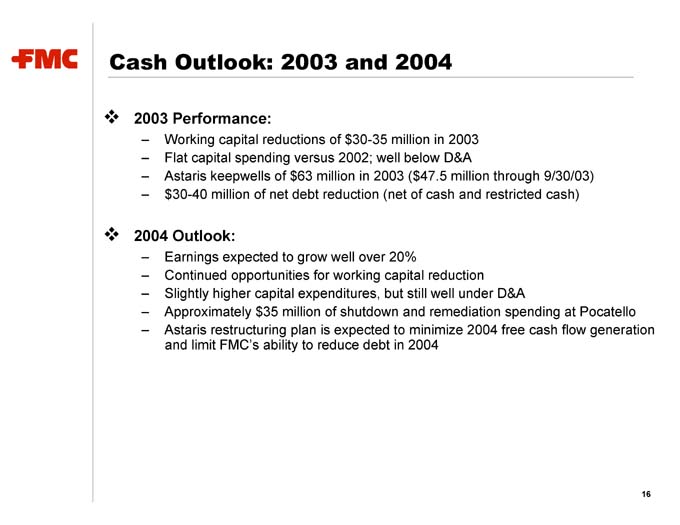
restructuring plan is expected to minimize 2004 free cash flow generation 16 Working capital reductions of $30-35 million in 2003 Flat capital spending versus 2002; well below D&A Astaris keepwells of $63 million in 2003 ($47.5 million through 9/30/03) $30-40 million of net debt reduction (net of cash and restricted cash) Earnings expected to grow well over 20% Continued opportunities for working capital reduction Slightly higher capital expenditures, but still well under D&A Approximately $35 million of shutdown and remediation spending at Pocatello Astaris and limit FMC’s ability to reduce debt in 2004 Cash Outlook: 2003 and 2004 2003 Performance: – – – – 2004 Outlook: – – – – – . .
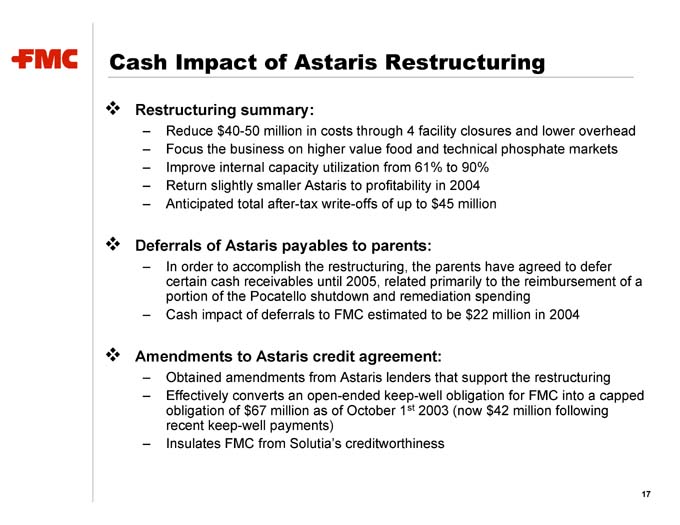
17 2003 (now $42 million following to profitability in 2004 credit agreement: st Reduce $40-50 million in costs through 4 facility closures and lower overhead Focus the business on higher value food and technical phosphate markets Improve internal capacity utilization from 61% to 90% Astaris Anticipated total after-tax write-offs of up to $45
million payables to parents: In order to accomplish the restructuring, the parents have agreed to defer certain cash receivables until 2005, related primarily to the reimbursement of a portion of the Pocatello shutdown and remediation spending Cash impact of deferrals to FMC estimated to be $22 million in 2004 Obtained amendments from Astaris lenders that support the restructuring Effectively converts an open-ended keep-well obligation for FMC into a capped obligation of $67 million as of October 1 recent keep-well payments) Return slightly smaller Insulates FMC from Solutia’s creditworthiness Cash Impact of Astaris Restructuring Restructuring summary: – – – – – Deferrals of Astaris – – Amendments to Astaris – – – . . .
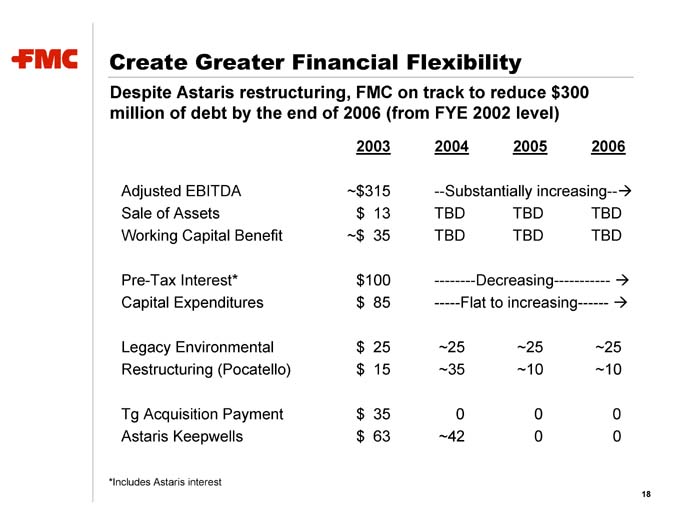
18 2006 TBD TBD ~25 ~10 0 0 2005 TBD TBD ~25 ~10 0 0 2004 —Substantially increasing— TBD TBD ————Decreasing—————- ——-Flat to increasing——— ~25 ~35 0 ~42 13 35 $100 85 25 15 35 63 2003 ~$315 $ ~$ $ $ $ $ $ Create Greater Financial Flexibility Despite Astaris restructuring, FMC on track to reduce $300 million of debt by the end of 2006 (from FYE 2002 level) Adjusted EBITDA Sale of Assets Working Capital Benefit Pre-Tax Interest* Capital Expenditures Legacy Environmental Restructuring (Pocatello) Tg Acquisition Payment Astaris Keepwells *Includes Astaris interest

Appendix
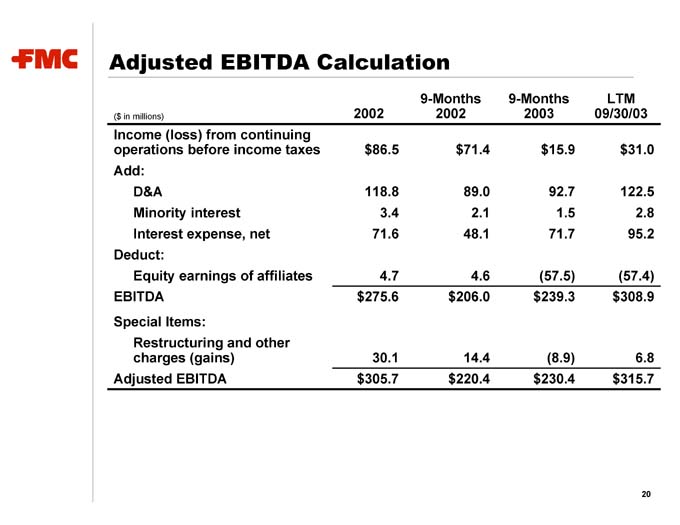
$31.0 122.5 2.8 95.2 (57.4) $308.9 6.8 $315.7 20 LTM 09/30/03 $15.9 92.7 1.5 71.7 (57.5) $239.3 (8.9) $230.4 9-Months 2003 $71.4 89.0 2.1 48.1 4.6 $206.0 14.4 $220.4 9-Months 2002 $86.5 118.8 3.4 71.6 4.7 $275.6 30.1 $305.7 2002 Income (loss) from continuing operations before income taxes D&A Minority interest Interest expense, net Deduct: Equity earnings of affiliates EBITDA Special Items: Restructuring and other charges (gains) Adjusted EBITDA Adjusted EBITDA Calculation ($ in millions) Add: