Exhibit 99.1
FMC Corporation
Citigroup 12th Annual High Yield /
Leveraged Finance Conference
February 9, 2004
Thomas C. Deas, Jr.
Vice President & Treasurer
Disclaimer
Safe Harbor Statement under the Private Securities Litigation Reform Act of 1995
These slides and the accompanying presentation contain “forward-looking statements” that represent management’s best judgment as of the date hereof based on information currently available. Actual results of the Company may differ materially from those contained in the forward-looking statements.
Additional information concerning factors that may cause results to differ materially from those in the forward-looking statements is contained in the Company’s periodic reports filed under the Securities Exchange Act of 1934, as amended.
The Company undertakes no obligation to update or revise these forward-looking statements to reflect new events or uncertainties.
Use of Non-GAAP Terms
These slides contain certain “non-GAAP financial terms” which are defined on FMC’s Investor Relations web site (http://ir.fmc.com) in the Glossary of Financial Terms section. In addition, in the Conference Calls and Presentations section, we have provided reconciliations of non-GAAP terms to the closest GAAP term.
Following is a list of some of these non-GAAP terms:
Adjusted EBITDA (Adjusted Earnings Before Interest, Taxes, Depreciation and Amortization) is the sum of Income from continuing operations before equity earnings in affiliates, minority interests, interest income and expense, income taxes and cumulative effect of change in accounting principle and Depreciation and Amortization less Restructuring and other charges (gains).
Adjusted EBITDA Margin is the quotient of Adjusted EBITDA (defined above) and Revenue.
Segment EBITDA is the sum of Income (loss) from continuing operations before income taxes and cumulative effect of change in accounting principle and Depreciation and Amortization for a segment.
Segment EBITDA Margin is the quotient of EBITDA (defined above) and Revenue for a segment.
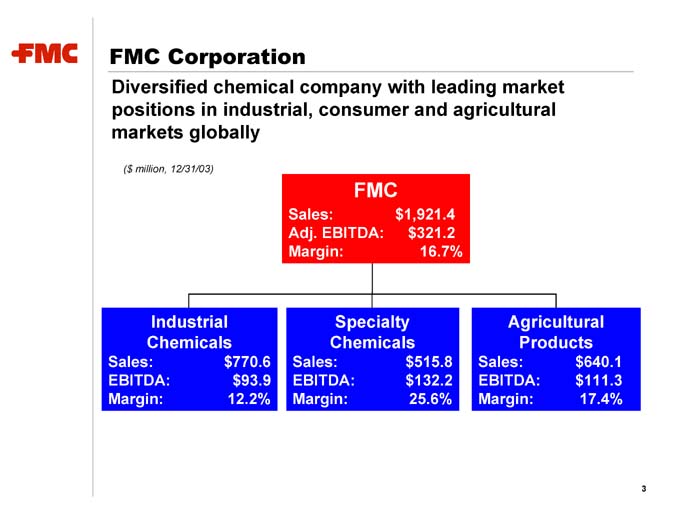
FMC Corporation
Diversified chemical company with leading market positions in industrial, consumer and agricultural markets globally
($ million, 12/31/03)
FMC
Sales: $1,921.4 Adj. EBITDA: $321.2 Margin: 16.7%
Industrial Chemicals
Sales: $770.6 EBITDA: $93.9 Margin: 12.2%
Specialty Chemicals
Sales: $515.8 EBITDA: $132.2 Margin: 25.6%
Agricultural Products
Sales: $640.1 EBITDA: $111.3 Margin: 17.4%
FMC Strengths
Leading market positions
Global presence
Diversified business mix and high-quality customer base
Diversified and integrated cost structure
Focused R&D and strong applications expertise
Strong credit profile
Proven management with extensive industry experience
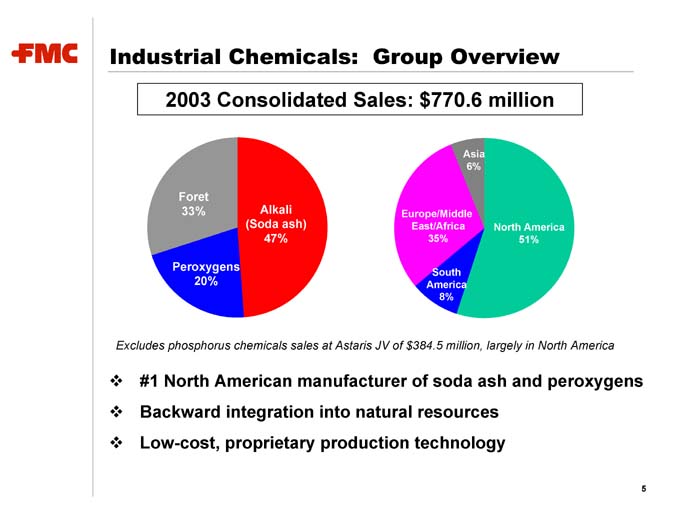
Industrial Chemicals: Group Overview
2003 Consolidated Sales: $770.6 million
Foret 33%
Alkali (Soda ash) 47%
Peroxygens 20%
Asia 6%
North America 51%
South America 8%
Europe/Middle East/Africa 35%
Excludes phosphorus chemicals sales at Astaris JV of $384.5 million, largely in North America
#1 North American manufacturer of soda ash and peroxygens
Backward integration into natural resources
Low-cost, proprietary production technology
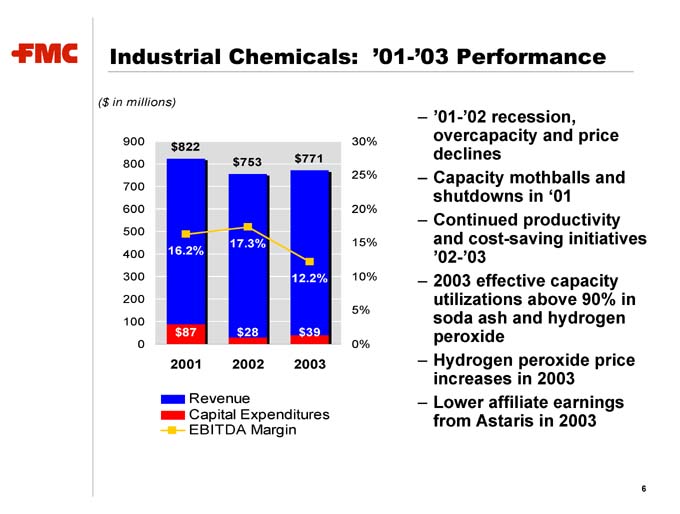
Industrial Chemicals: ‘01-’03 Performance
($ in millions) $822
16.2% $87 $753
17.3% $28 $771
12.2% $39
– ‘01-’02 recession, overcapacity and price declines
– Capacity mothballs and shutdowns in ‘01
– Continued productivity and cost-saving initiatives ‘02-’03
– 2003 effective capacity utilizations above 90% in soda ash and hydrogen peroxide
– Hydrogen peroxide price increases in 2003
– Lower affiliate earnings from Astaris in 2003
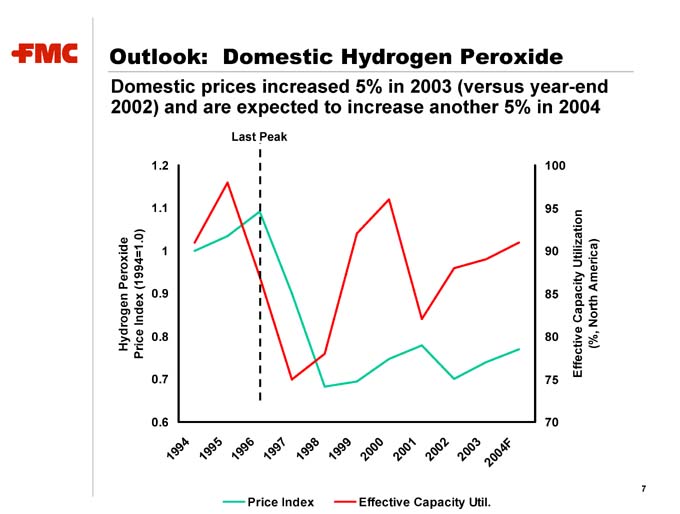
Outlook: Domestic Hydrogen Peroxide
Domestic prices increased 5% in 2003 (versus year-end 2002) and are expected to increase another 5% in 2004
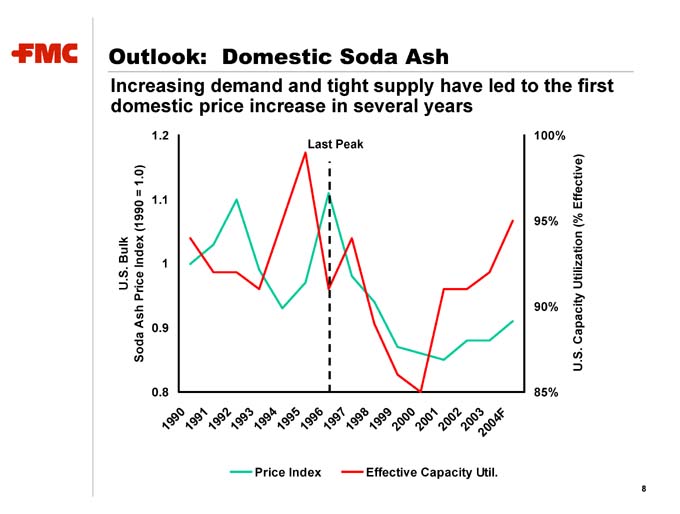
Outlook: Domestic Soda Ash
Increasing demand and tight supply have led to the first domestic price increase in several years
Outlook: Astaris
Gradual improvement underway due to restructuring
Significant restructuring at Astaris:
– Exit of commodity STPP and closure of 4 facilities to result in annualized savings of $40-50 million ($20-25 million to FMC)
– Product transfers and plant closures are on track
– Substantial improvement in operating profit expected by Q2 ‘04
– Possible improvement in selling prices during 2004
De-leveraging and refinancing Astaris:
– Solutia, our JV partner, provided a $67 million LC, effectively de-linking their financial condition from Astaris in 10/2003
– Expectation of $40 million in 2004 keepwells and no contributions in the 2nd Half
– Possible refinancing of Astaris in late 2004 or early 2005
Outlook: Foret –
European Industrial Chemicals
Steady recovery across all product lines
Phosphorus chemicals in a slow recovery driven by capacity reduction:
– Rhodia’s shutdown of STPP facility in Rhouen, France has improved capacity utilization
– Foret has recovered STPP volume that was lost in 2002
– Price recovery is beginning
After a strong 2003, peroxygens expected to continue to grow in 2004:
– Hydrogen peroxide demand growth of 4% per year driven by strength of Scandinavian pulp industry
– Peroxide price increase of 8% in 2003; another 5% expected during 2004
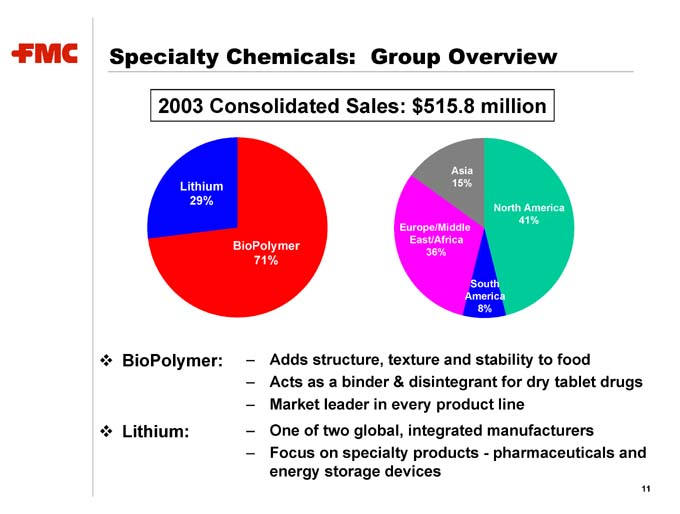
Specialty Chemicals: Group Overview
2003 Consolidated Sales: $515.8 million
Lithium 29%
BioPolymer 71%
Asia 15%
North America 41%
South America 8%
Europe/Middle East/Africa 36%
BioPolymer: – Adds structure, texture and stability to food
– Acts as a binder & disintegrant for dry tablet drugs
– Market leader in every product line
Lithium: – One of two global, integrated manufacturers
– Focus on specialty products—pharmaceuticals and energy storage devices
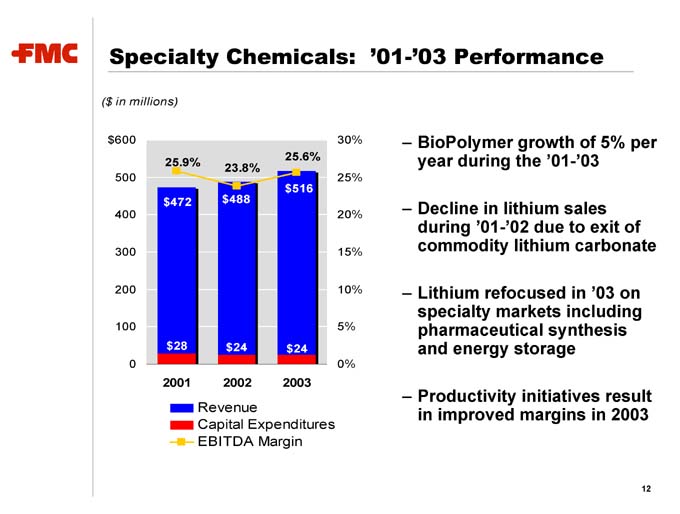
Specialty Chemicals: ‘01-’03 Performance
($ in millions)
25.9% $472 $28
23.8% $488 $24
25.6% $516 $24
– BioPolymer growth of 5% per year during the ‘01-’03
– Decline in lithium sales during ‘01-’02 due to exit of commodity lithium carbonate
– Lithium refocused in ‘03 on specialty markets including pharmaceutical synthesis and energy storage
– Productivity initiatives result in improved margins in 2003
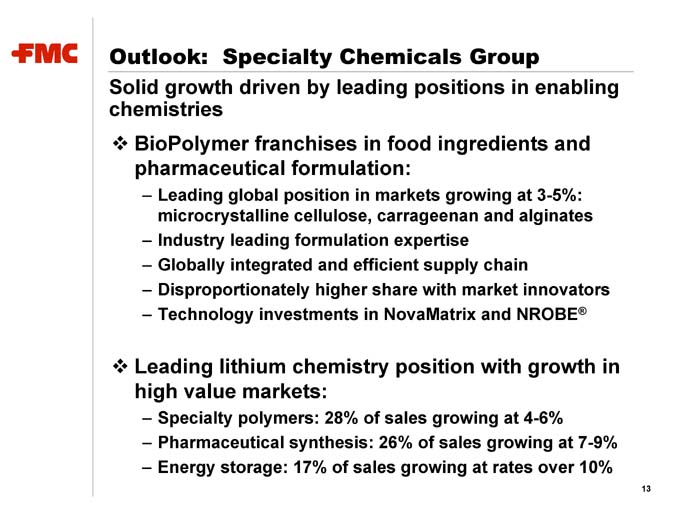
Outlook: Specialty Chemicals Group
Solid growth driven by leading positions in enabling chemistries
BioPolymer franchises in food ingredients and pharmaceutical formulation:
– Leading global position in markets growing at 3-5%: microcrystalline cellulose, carrageenan and alginates
– Industry leading formulation expertise
– Globally integrated and efficient supply chain
– Disproportionately higher share with market innovators
– Technology investments in NovaMatrix and NROBE®
Leading lithium chemistry position with growth in high value markets:
– Specialty polymers: 28% of sales growing at 4-6%
– Pharmaceutical synthesis: 26% of sales growing at 7-9%
– Energy storage: 17% of sales growing at rates over 10%
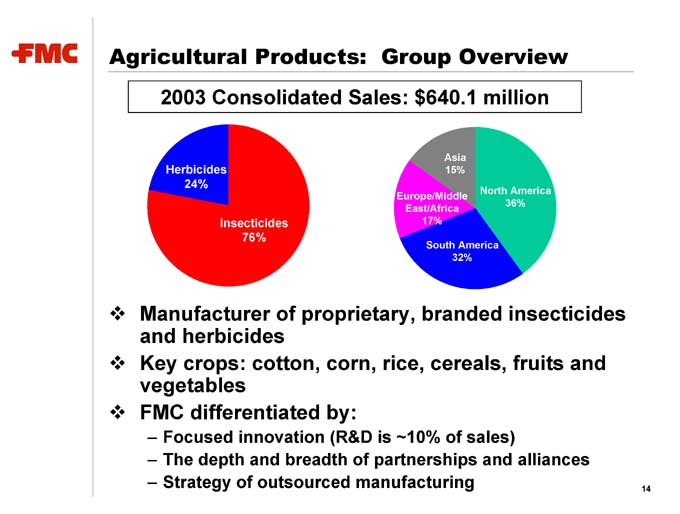
Agricultural Products: Group Overview
2003 Consolidated Sales: $640.1 million
Herbicides 24%
Insecticides 76%
Asia 15%
North America 36%
South America 32%
Europe/Middle East/Africa 17%
Manufacturer of proprietary, branded insecticides and herbicides
Key crops: cotton, corn, rice, cereals, fruits and vegetables
FMC differentiated by:
– Focused innovation (R&D is ~10% of sales)
– The depth and breadth of partnerships and alliances
– Strategy of outsourced manufacturing
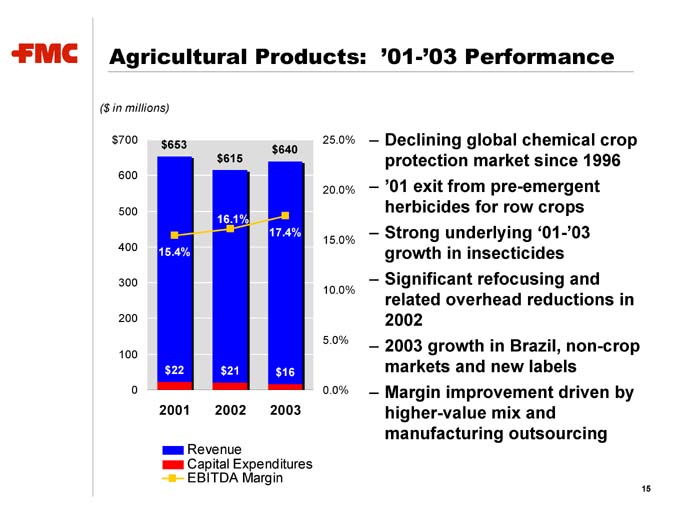
Agricultural Products: ‘01-’03 Performance
($ in millions) $653
15.4% $22 $615
16.1% $21 $640
17.4% $16
– Declining global chemical crop protection market since 1996
– ‘01 exit from pre-emergent herbicides for row crops
– Strong underlying ‘01-’03 growth in insecticides
– Significant refocusing and related overhead reductions in 2002
– 2003 growth in Brazil, non-crop markets and new labels
– Margin improvement driven by higher-value mix and manufacturing outsourcing

Outlook: Agricultural Products Group
Earnings growth through productivity and focused innovation
Productivity to result in significant expected cost savings:
– Manufacturing outsourcing strategies continue
– SG&A leverage across focused products and regions
– Global supply chain redesign to have possible benefit to working capital in 2004
Near-term growth from new labels, alliances and new chemistries:
– New labels in core products: bifenthrin, zeta-cypermethrin and carfentrazone
– Global alliance with ISK fundamental to building market access and scale (Asia and Western Europe via Belchim)
– Novel ISK chemistry targeting sucking pests to launch 2005
Long-term growth resulting from our target-based discovery efforts:
– Many chemistries under evaluation which look promising
– Several of these novel chemistries are now entering field testing
– Commercial opportunity 5+ years away
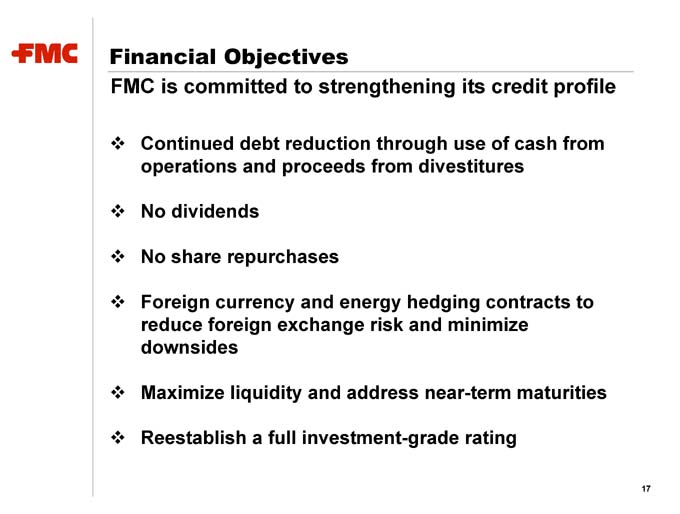
Financial Objectives
FMC is committed to strengthening its credit profile
Continued debt reduction through use of cash from operations and proceeds from divestitures
No dividends
No share repurchases
Foreign currency and energy hedging contracts to reduce foreign exchange risk and minimize downsides
Maximize liquidity and address near-term maturities
Reestablish a full investment-grade rating
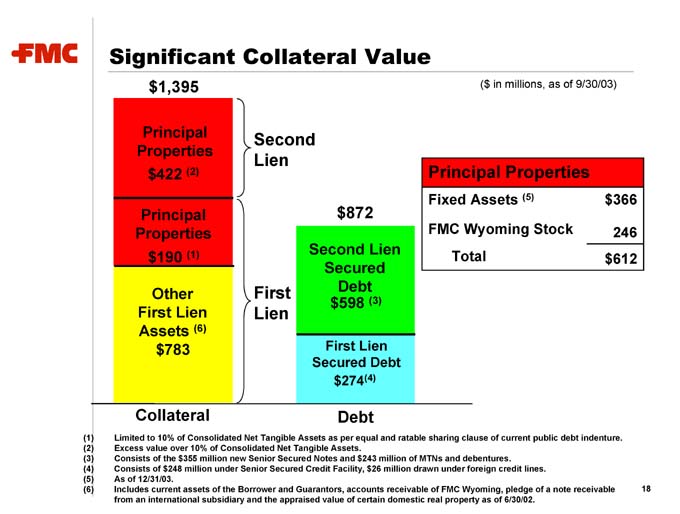
Significant Collateral Value
($ in millions, as of 9/30/03) $1,395
Second Lien
Principal Properties $422 (2)
First Lien
Principal Properties $190 (1)
Other First Lien Assets (6) $783
Collateral $872
Second Lien Secured Debt $598 (3)
First Lien Secured Debt $274(4)
Debt
Principal Properties
Fixed Assets (5) $ 366
FMC Wyoming Stock 246
Total $ 612
(1) Limited to 10% of Consolidated Net Tangible Assets as per equal and ratable sharing clause of current public debt indenture.
(2) Excess value over 10% of Consolidated Net Tangible Assets.
(3) Consists of the $355 million new Senior Secured Notes and $243 million of MTNs and debentures.
(4) Consists of $248 million under Senior Secured Credit Facility, $26 million drawn under foreign credit lines. (5) As of 12/31/03.
(6) Includes current assets of the Borrower and Guarantors, accounts receivable of FMC Wyoming, pledge of a note receivable from an international subsidiary and the appraised value of certain domestic real property as of 6/30/02.
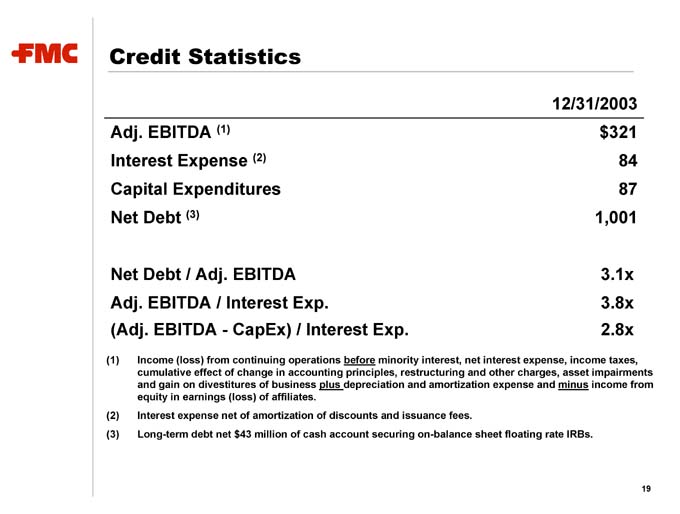
Credit Statistics
12/31/2003
Adj. EBITDA (1) $ 321
Interest Expense (2) 84
Capital Expenditures 87
Net Debt (3) 1,001
Net Debt / Adj. EBITDA 3.1x
Adj. EBITDA / Interest Exp. 3.8x
(Adj. EBITDA - CapEx) / Interest Exp. 2.8x
(1) Income (loss) from continuing operations before minority interest, net interest expense, income taxes, cumulative effect of change in accounting principles, restructuring and other charges, asset impairments and gain on divestitures of business plus depreciation and amortization expense and minus income from equity in earnings (loss) of affiliates.
(2) Interest expense net of amortization of discounts and issuance fees.
(3) Long-term debt net $43 million of cash account securing on-balance sheet floating rate IRBs.
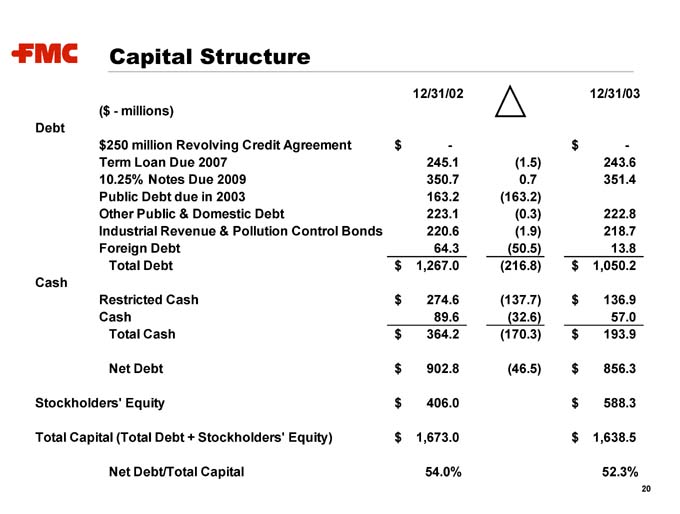
Capital Structure
Capital Structure
12/31/02 12/31/03
($ - millions)
Debt
$ 250 million Revolving Credit Agreement $ - $ -
Term Loan Due 2007 245.1 (1.5) 243.6
10.25% Notes Due 2009 350.7 0.7 351.4
Public Debt due in 2003 163.2 (163.2)
Other Public & Domestic Debt 223.1 (0.3) 222.8
Industrial Revenue & Pollution Control Bonds 220.6 (1.9) 218.7
Foreign Debt 64.3 (50.5) 13.8
Total Debt $ 1,267.0 (216.8) $ 1,050.2
Cash
Restricted Cash $ 274.6 (137.7) $ 136.9
Cash 89.6 (32.6) 57.0
Total Cash $ 364.2 (170.3) $ 193.9
Net Debt $ 902.8 (46.5) $ 856.3
Stockholders’ Equity $ 406.0 $ 588.3
Total Capital (Total Debt + Stockholders’ Equity) $ 1,673.0 $ 1,638.5
Net Debt/Total Capital 54.0% 52.3%
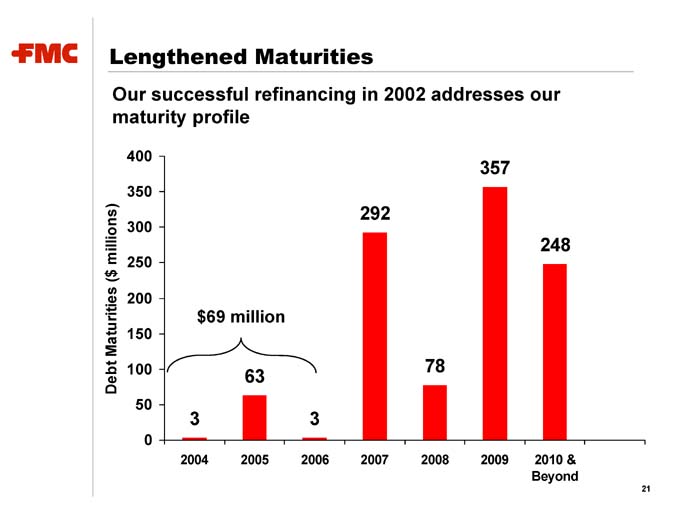
Lengthened Maturities
Our successful refinancing in 2002 addresses our maturity profile
$69 million
3
63
3
292
78
357
248
Strong Cash Flow
Free cash flow generation of $300 million expected over 2003-2006 timeframe, which will be used to reduce debt.
Trough adjusted EBITDA of over $320 million should grow with: – recovery in Industrial Chemicals and – continued growth in Specialty Chemicals and Agricultural Products.
Captial expenditures should be relatively flat from:
– Mothballed capacity
– De-bottlenecking
– Manufacturing outsourcing
Strong 2004 cash flow partially offset by
– Astaris keepwells of ~$40 million
– Last major component of Pocatello remediation
Strategic Objectives
Unlocking value and creating a faster growing FMC
Realize the operating leverage inherent within FMC
– Drive cost improvements and higher selling prices in Industrial
– Achieve peak Industrial earnings of over $100 million
Create greater financial flexibility
– Reduce net debt to $600 million by 2006
– Regain an investment grade credit rating
Focus the portfolio on higher growth businesses
– Grow Specialty Chemicals and Agricultural Products
– Manage Industrial Chemicals for cash
– Divest underperforming assets
FMC Corporation