Exhibit 99.1
FMC Corporation
West Coast Marketing Trip
March 23rd – 25th, 2004
William G. Walter Chairman, President and CEO

Disclaimer
Safe Harbor Statement under the Private Securities Litigation Reform Act of 1995
These slides and the accompanying presentation contain “forward-looking statements” that represent management’s best judgment as of the date hereof based on information currently available. Actual results of the Company may differ materially from those contained in the forward-looking statements.
Additional information concerning factors that may cause results to differ materially from those in the forward-looking statements is contained in the Company’s periodic reports filed under the Securities Exchange Act of 1934, as amended.
The Company undertakes no obligation to update or revise these forward-looking statements to reflect new events or uncertainties.
1
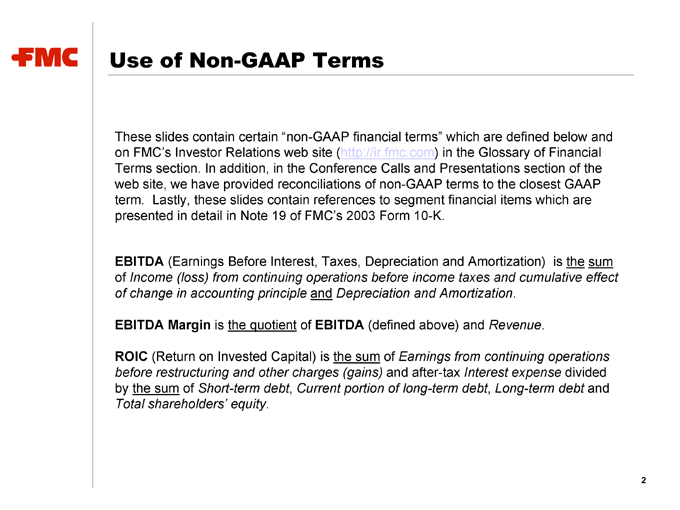
Use of Non-GAAP Terms
These slides contain certain “non-GAAP financial terms” which are defined below and on FMC’s Investor Relations web site (http://ir.fmc.com) in the Glossary of Financial Terms section. In addition, in the Conference Calls and Presentations section of the web site, we have provided reconciliations of non-GAAP terms to the closest GAAP term. Lastly, these slides contain references to segment financial items which are presented in detail in Note 19 of FMC’s 2003 Form 10-K.
EBITDA (Earnings Before Interest, Taxes, Depreciation and Amortization) is the sum of Income (loss) from continuing operations before income taxes and cumulative effect of change in accounting principle and Depreciation and Amortization.
EBITDA Margin is the quotient of EBITDA (defined above) and Revenue.
ROIC (Return on Invested Capital) is the sum of Earnings from continuing operations before restructuring and other charges (gains) and after-tax Interest expense divided by the sum of Short-term debt, Current portion of long-term debt, Long-term debt and Total shareholders’ equity.
2
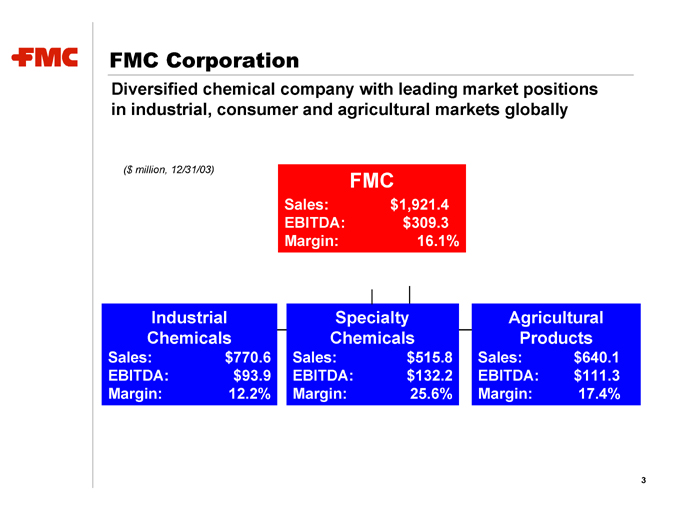
FMC Corporation
Diversified chemical company with leading market positions in industrial, consumer and agricultural markets globally
($ million, 12/31/03)
FMC
Sales: $1,921.4
EBITDA: $ 309.3
Margin: 16.1%
Industrial Specialty Agricultural
Chemicals Chemicals Products
Sales: $770.6 Sales: $515.8 Sales: $640.1
EBITDA: $93.9 EBITDA: $132.2 EBITDA: $111.3
Margin: 12.2% Margin: 25.6% Margin: 17.4%
3
FMC Strengths
Leading market positions
Global presence
Diversified business mix and high-quality customer base
Diversified and integrated cost structure
Focused R&D and strong applications expertise
Proven management with extensive industry experience
4
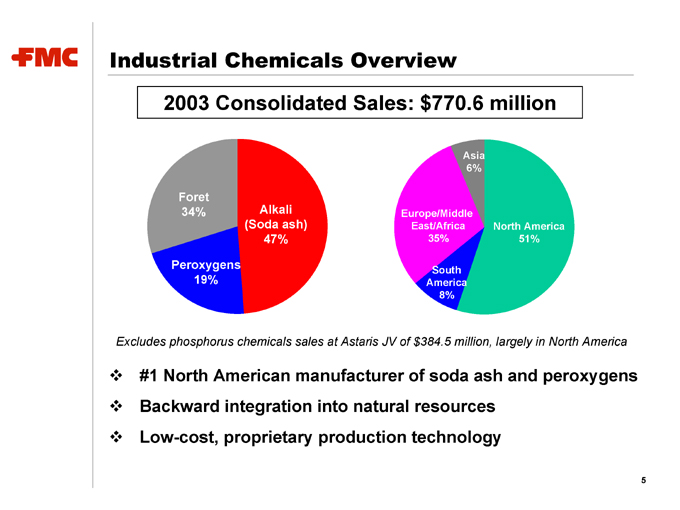
Industrial Chemicals Overview
2003 Consolidated Sales: $770.6 million
Alkali (Soda ash) 47%
Peroxygens 19%
Foret 34%
North America 51%
South America 8%
Europe/Middle East/Africa 35%
Asia 6%
Excludes phosphorus chemicals sales at Astaris JV of $384.5 million, largely in North America
#1 North American manufacturer of soda ash and peroxygens
Backward integration into natural resources
Low-cost, proprietary production technology
5
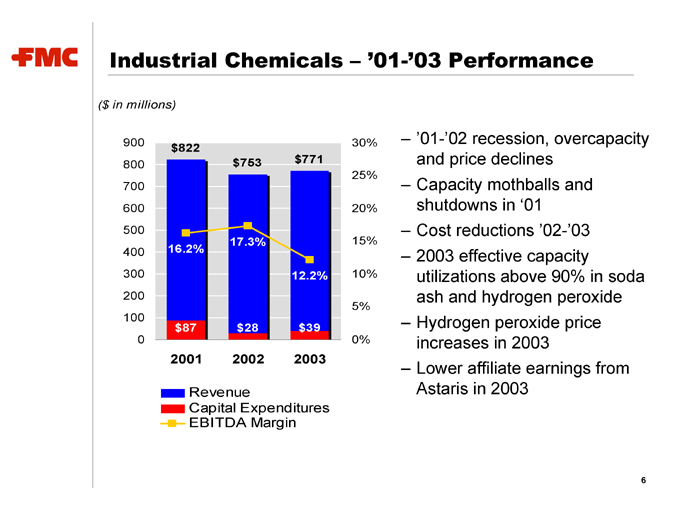
Industrial Chemicals – ‘01-’03 Performance
($ in millions)
$822 16.2% $87 2001
$753 17.3% $28 2002
$771 12.2% $39 2003
Revenue
Capital Expenditures
EBITDA Margin
– ‘01-’02 recession, overcapacity and price declines
– Capacity mothballs and shutdowns in ‘01
– Cost reductions ‘02-’03
– 2003 effective capacity utilizations above 90% in soda ash and hydrogen peroxide
– Hydrogen peroxide price increases in 2003
– Lower affiliate earnings from Astaris in 2003
6
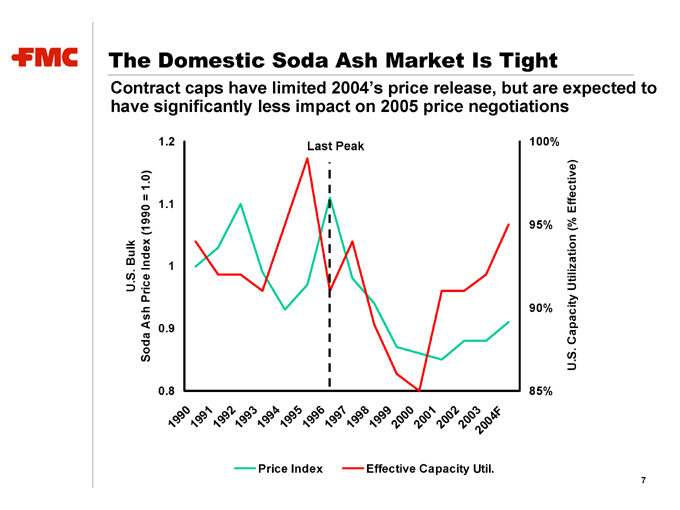
The Domestic Soda Ash Market Is Tight
Contract caps have limited 2004’s price release, but are expected to have significantly less impact on 2005 price negotiations
Last Peak
Price Index
Effective Capacity Util.
7
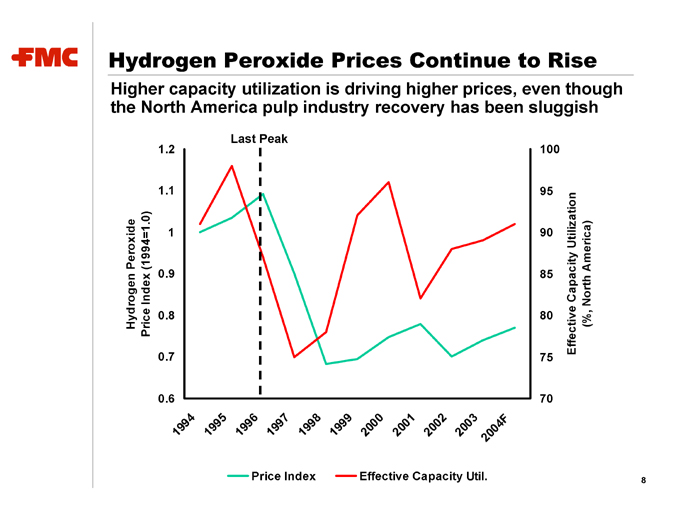
Hydrogen Peroxide Prices Continue to Rise
Higher capacity utilization is driving higher prices, even though the North America pulp industry recovery has been sluggish
Last Peak
Price Index
Effective Capacity Util.
8
Specialty Chemicals Overview
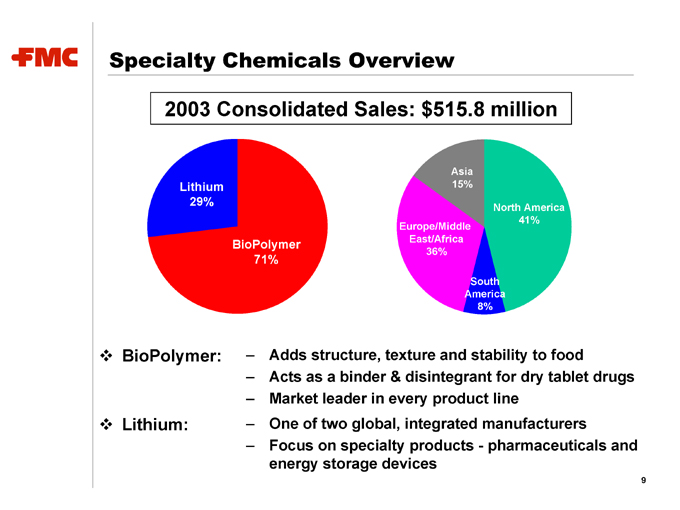
2003 Consolidated Sales: $515.8 million
BioPolymer 71%
Lithium 29%
North America 41%
South America 8%
Europe/Middle East/Africa 36%
Asia 15%
BioPolymer: – Adds structure, texture and stability to food
– Acts as a binder & disintegrant for dry tablet drugs
– Market leader in every product line
Lithium: – One of two global, integrated manufacturers
– Focus on specialty products—pharmaceuticals and energy storage devices
9
Specialty Chemicals – ‘01-’03 Performance
($ in millions)
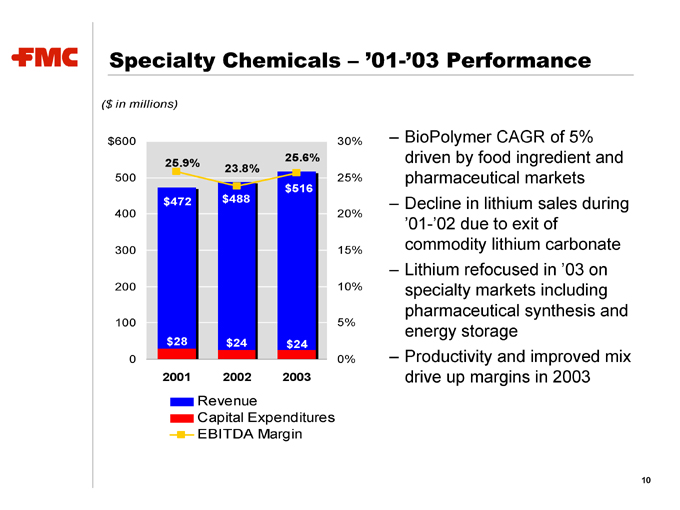
25.9% $472 $28 2001
23.8% $488 $24 2002
25.6% $516 $24 2003
Revenue
Capital Expenditures
EBITDA Margin
– BioPolymer CAGR of 5% driven by food ingredient and pharmaceutical markets
– Decline in lithium sales during ‘01-’02 due to exit of commodity lithium carbonate
– Lithium refocused in ‘03 on specialty markets including pharmaceutical synthesis and energy storage
– Productivity and improved mix drive up margins in 2003
10
Agricultural Products Overview
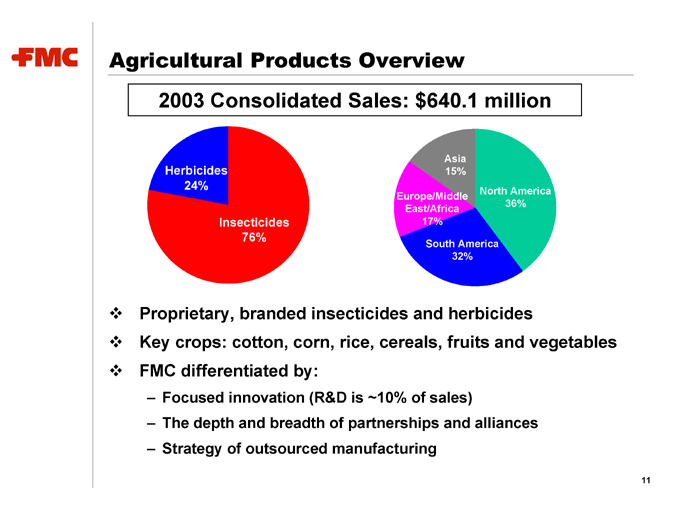
2003 Consolidated Sales: $640.1 million
Insecticides 76%
Herbicides 24%
North America 36%
South America 32%
Europe/Middle East/Africa 17%
Asia 15%
Proprietary, branded insecticides and herbicides
Key crops: cotton, corn, rice, cereals, fruits and vegetables
FMC differentiated by:
– Focused innovation (R&D is ~10% of sales)
– The depth and breadth of partnerships and alliances
– Strategy of outsourced manufacturing
11
Agricultural Products – ‘01-’03 Performance
($ in millions)
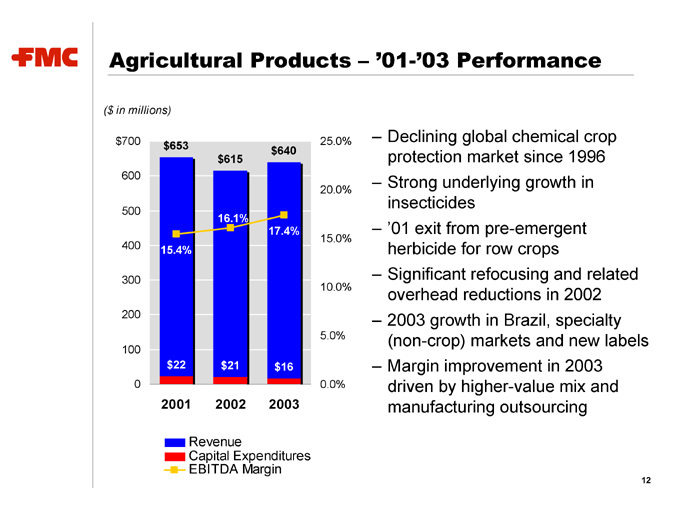
$653 15.4% $22 2001
$615 16.1% $21 2002
$640 17.4% $16 2003
Revenue
Capital Expenditures
EBITDA Margin
– Declining global chemical crop protection market since 1996
– Strong underlying growth in insecticides
– ‘01 exit from pre-emergent herbicide for row crops
– Significant refocusing and related overhead reductions in 2002
– 2003 growth in Brazil, specialty (non-crop) markets and new labels
– Margin improvement in 2003 driven by higher-value mix and manufacturing outsourcing
12
2003 Was On Plan
Despite challenges in Industrial Chemicals
We met our earnings expectations
Astaris commenced a significant restructuring
We exceeded our debt reduction expectations
13
Strategic Objectives
Unlocking value and creating a faster growing FMC
Realize the operating leverage inherent within FMC
– Double-digit growth in earnings before restructuring and other charges
– Industrial Chemicals recovery to add earnings of over $1 per share
Create greater financial flexibility
– Net debt reduction of $300 million by 2006
– Regaining an investment grade credit rating
Focus the portfolio on higher growth businesses
– Manage Specialty Chemicals and Agricultural Products for growth
– Manage Industrial Chemicals for cash
– Divest any business that cannot sustain our cost of capital
– Improve ROIC to 12 percent minimum by 2006
14
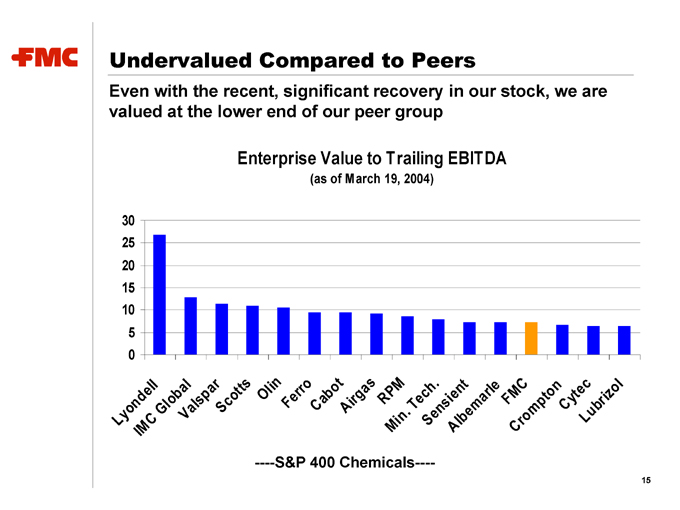
Undervalued Compared to Peers
Even with the recent, significant recovery in our stock, we are valued at the lower end of our peer group
Enterprise Value to Trailing EBITDA
(as of March 19, 2004)
——S&P 400 Chemicals——
15
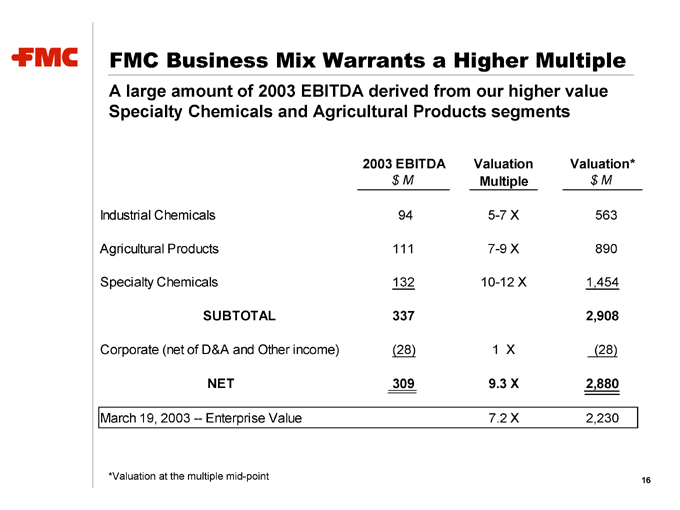
FMC Business Mix Warrants a Higher Multiple
A large amount of 2003 EBITDA derived from our higher value Specialty Chemicals and Agricultural Products segments
2003 EBITDA Valuation Valuation*
$ M Multiple $ M
Industrial Chemicals 94 5-7 X 563
Agricultural Products 111 7-9 X 890
Specialty Chemicals 132 10-12 X 1,454
SUBTOTAL 337 2,908
Corporate (net of D&A and Other income) (28) 1 X (28)
NET 309 9.3 X 2,880
March 19, 2003 — Enterprise Value 7.2 X 2,230
*Valuation at the multiple mid-point
16
Why is FMC Undervalued?
There are still some perceived risks
Successful completion of Astaris restructuring
Chinese impact on soda ash export prices
Timing of price recovery in North American soda ash and hydrogen peroxide businesses
Sustainability of Agricultural Products earnings
Legacy drains on free cash flow generation
17
Astaris Restructuring Is On Plan
Significant restructuring at Astaris:
– Plant closures and product line transitions on schedule
– Annualized savings of $40-50 million on track ($20-25 million for FMC)
– Substantial improvement in operating profit expected by Q3 ‘04
North American market dynamics are improving:
– Astaris capacity reductions have tightened domestic supply
– Strong euro has reduced import pressures from Europe
– Chinese P4 supply has greatly subsided due to energy constraints
– Broad-based price increases of 4-7 percent have been announced
De-leveraging and refinancing Astaris:
– Expectation of $40 million in 2004 keepwells, paid entirely in 1H ‘04, after which Astaris is expected to be debt free
– Possible refinancing of Astaris in late 2004 or early 2005
18
Chinese Impact On Soda Ash Export Prices
We expect the impact of excess Chinese capacity to be short-lived
Growth of the Chinese soda ash market:
– Demand of 11 million metric tons growing about 8-10 percent per year
– Excess supply of 2 million metric tons can be readily absorbed
Domestic Chinese pricing is at or below many producers’ costs:
– There are 47 soda ash producers, the majority of which are small
– With current market pricing of 900 RMB, many may have to shut down
Cost escalation is exacerbating the situation for the Chinese:
– Salt, a key ingredient in synthetic production, is in short supply
– Energy costs, particularly coal, have escalated substantially
– VAT drawback for exported soda ash has decreased
– Ocean freight for soda ash exports has risen significantly
19
Sustainability of Agricultural Products Earnings
Improving global farm economy:
– Rising global crop prices
– Improving U.S. farm income
– Increasing global competitiveness of Brazilian farmers
Significant cost savings from productivity initiatives:
– Manufacturing outsourcing strategies continue to produce savings
– Global supply chain redesign under evaluation
– Network of global partnerships provides low-cost marketing scale
Focused, successful innovation:
– Label expansions in both crop and specialty markets
– Novel ISK chemistry targeting sucking pests to launch 2005
– Discovery efforts have resulted in many promising chemistries, several of which are now entering global field trials
20
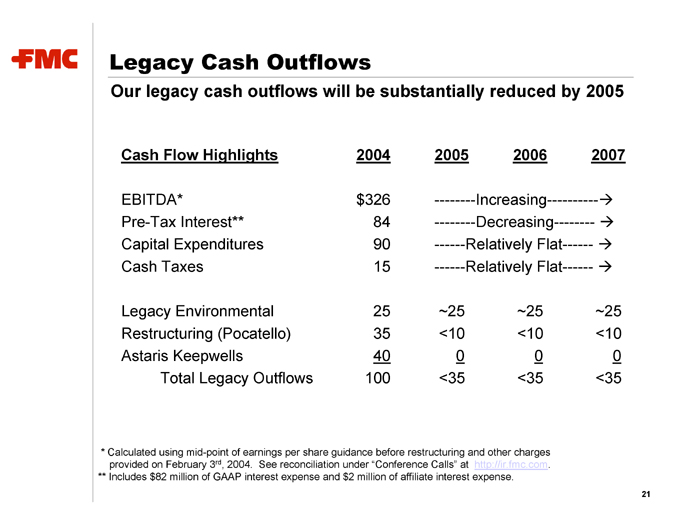
Legacy Cash Outflows
Our legacy cash outflows will be substantially reduced by 2005
Cash Flow Highlights 2004 2005 2006 2007
EBITDA* $ 326 --------Increasing----------Æ
Pre-Tax Interest** 84 - --------Decreasing-------- A
Capital Expenditures 90 ------Relatively Flat------ A
Cash Taxes 15 ------Relatively Flat------ A
Legacy Environmental 25 ~25 ~25 ~25
Restructuring (Pocatello) 35 <10 <10 <10
Astaris Keepwells 40 0 0 0
Total Legacy Outflows 100 <35 <35 <35
* Calculated using mid-point of earnings per share guidance before restructuring and other charges provided on February 3rd, 2004. See reconciliation under “Conference Calls” at http://ir.fmc.com. ** Includes $82 million of GAAP interest expense and $2 million of affiliate interest expense.
21

FMC Corporation