Exhibit 99.1
FMC Corporation
Bear Stearns 13th Annual Global Credit Conference
May 19, 2004
Thomas C. Deas, Jr. Vice President & Treasurer
Disclaimer
Safe Harbor Statement under the Private Securities Litigation Reform Act of 1995
These slides and the accompanying presentation contain “forward-looking statements” that represent management’s best judgment as of the date hereof based on information currently available. Actual results of the Company may differ materially from those contained in the forward-looking statements.
Additional information concerning factors that may cause results to differ materially from those in the forward-looking statements is contained in the Company’s periodic reports filed under the Securities Exchange Act of 1934, as amended.
The Company undertakes no obligation to update or revise these forward-looking statements to reflect new events or uncertainties.
1
Use of Non-GAAP Terms
These slides contain certain “non-GAAP financial terms” which are defined on FMC’s Investor Relations web site (http://ir.fmc.com) in the Glossary of Financial Terms section. In addition, in the Conference Calls and Presentations section, we have provided reconciliations of non-GAAP terms to the closest GAAP term.
Following is a list of some of these non-GAAP terms:
Adjusted EBITDA (Adjusted Earnings Before Interest, Taxes, Depreciation and Amortization) is the sum of Income from continuing operations before equity earnings in affiliates, minority interests, interest income and expense, income taxes and cumulative effect of change in accounting principle and Depreciation and Amortization less Restructuring and other charges (gains).
Adjusted EBITDA Margin is the quotient of Adjusted EBITDA (defined above) and Revenue.
Segment EBITDA is the sum of Income (loss) from continuing operations before income taxes and cumulative effect of change in accounting principle and Depreciation and Amortization for a segment.
Segment EBITDA Margin is the quotient of EBITDA (defined above) and Revenue for a segment.
ROIC (Return on Invested Capital) is the sum of Earnings from continuing operations before restructuring and other charges (gains) and after-tax Interest expense divided by the sum of Short-term debt, Current portion of long-term debt, Long-term debt and Total shareholders’ equity.
2
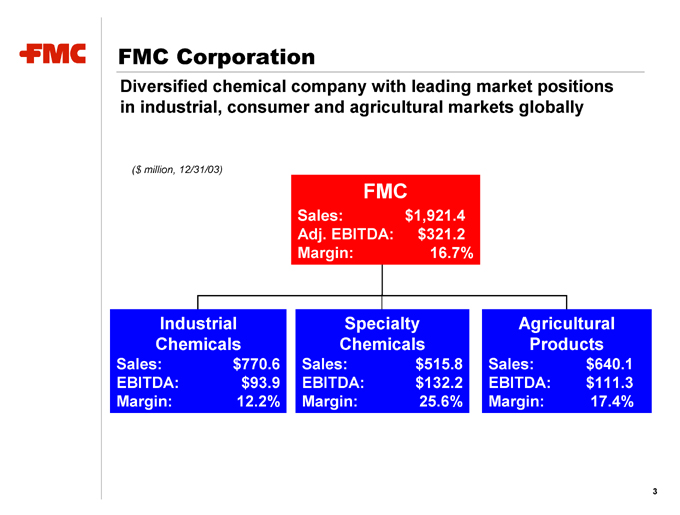
FMC Corporation
Diversified chemical company with leading market positions in industrial, consumer and agricultural markets globally
($ million, 12/31/03)
FMC
Sales: $1,921.4 Adj. EBITDA: $321.2 Margin: 16.7%
Industrial Chemicals
Sales: $770.6 EBITDA: $93.9 Margin: 12.2%
Specialty Chemicals
Sales: $515.8 EBITDA: $132.2 Margin: 25.6%
Agricultural Products
Sales: $640.1 EBITDA: $111.3 Margin: 17.4%
3
FMC Strengths
Leading market positions
Global presence
Diversified business mix and high-quality customer base Diversified and integrated cost structure Focused R&D and strong applications expertise Strong credit profile Proven management with extensive industry experience
4
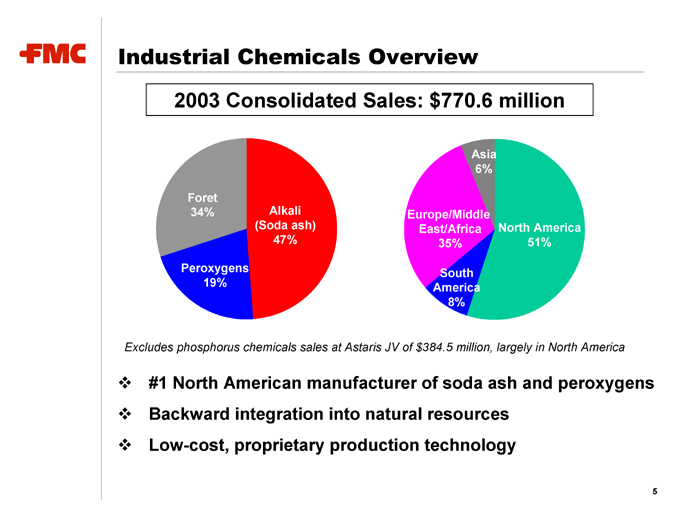
Industrial Chemicals Overview
2003 Consolidated Sales: $770.6 million
Foret 34%
Alkali (Soda ash) 47%
Peroxygens 19%
Asia 6%
Europe/Middle East/Africa 35%
North America 51%
South America 8%
Excludes phosphorus chemicals sales at Astaris JV of $384.5 million, largely in North America
#1 North American manufacturer of soda ash and peroxygens Backward integration into natural resources Low-cost, proprietary production technology
5
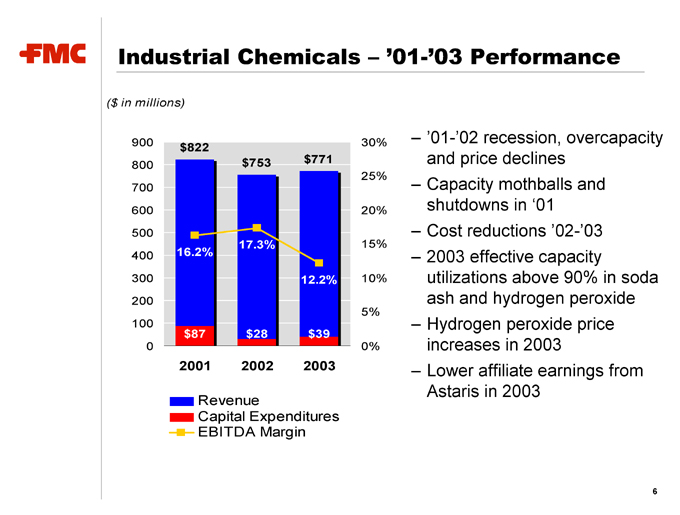
Industrial Chemicals – ‘01-’03 Performance
($ in millions)
900 800 700 600 500 400 300 200 100 0
2001 2002 2003 $822
16.2% $87 $753
17.3% $28 $771
12.2% $39
30% 25% 20% 15% 10% 5% 0%
Revenue
Capital Expenditures EBITDA Margin
‘01-’02 recession, overcapacity and price declines Capacity mothballs and shutdowns in ‘01 Cost reductions ‘02-’03 2003 effective capacity utilizations above 90% in soda ash and hydrogen peroxide Hydrogen peroxide price increases in 2003 Lower affiliate earnings from Astaris in 2003
6
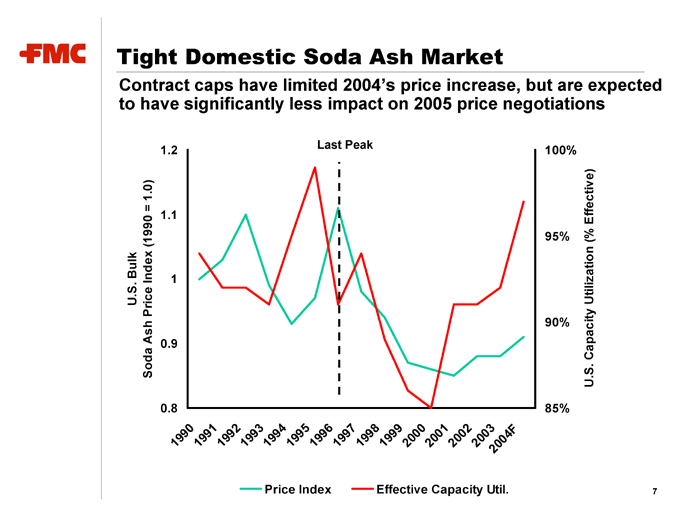
Tight Domestic Soda Ash Market
Contract caps have limited 2004’s price increase, but are expected to have significantly less impact on 2005 price negotiations
Last Peak
U.S. Bulk
Soda Ash Price Index (1990 = 1.0)
1.2 1.1 1 0.9 0.8
1990
1991
1992
1993
1994
1995
1996
1997
1998 1999
2000
2001
2002
2003 2004F
Price Index
Effective Capacity Util.
100% 95% 90% 85%
7
Stabilizing Export Soda Ash Market
We expect the impact of excess Chinese capacity to be short-lived
Growth of the Chinese soda ash market:
Demand of 11 million metric tons growing about 8-10 percent per year Excess supply of 2 million metric tons can be readily absorbed
Domestic Chinese pricing is at or below many producers’ costs:
There are 47 soda ash producers, the majority of which are small With market pricing near RMB 900, many may have to shut down
Higher costs are limiting Chinese soda ash production:
Salt, a key ingredient in synthetic production, is in short supply Energy costs, particularly coal, have escalated substantially VAT drawback for exported soda ash has decreased Ocean freight for soda ash exports has risen significantly
8
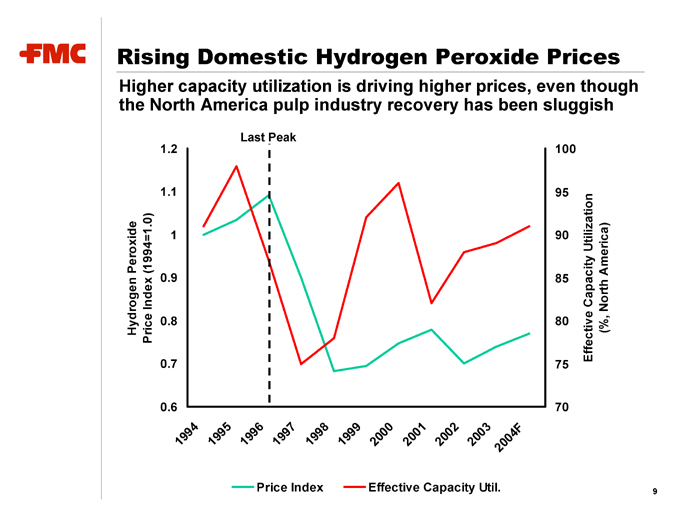
Rising Domestic Hydrogen Peroxide Prices
Higher capacity utilization is driving higher prices, even though the North America pulp industry recovery has been sluggish
Last Peak
Hydrogen Peroxide Price Index (1994=1.0)
1.2 1.1 1 0.9 0.8 0.7 0.6
1994 1995
1996 1997
1998
1999
2000 2001
2002
2003
2004F
Price Index
Effective Capacity Util.
100 95 90 85 80 75 70
Effective Capacity Utilization (%, North America)
9
Industrial Chemicals Improvement in Europe
Steady recovery across nearly all of Foret’s product lines
After a strong 2003, peroxygens expected to continue to grow:
Hydrogen peroxide demand growth of 4% per year driven by strength of Scandinavian pulp industry Peroxide price increase of 8% in 2003; another 5% expected during 2004
Phosphorus chemicals in a slow recovery driven by capacity reduction:
Rhodia’s shutdown of Rhouen STPP facility has improved industry capacity utilization Foret has recovered STPP volume that was lost in 2002 Price recovery is beginning
10

Turnaround In Domestic Phosphorus
Significant restructuring at Astaris:
Plant closures and product line transitions on schedule
Annualized savings of $40-50 million on track ($20-25 million for FMC) Substantial improvement in operating profit expected in 2004
North American market dynamics are improving:
Astaris capacity reductions have tightened domestic supply Strong euro has reduced import pressures from Europe
Chinese P4 supply has greatly subsided due to energy constraints
Broad-based price increases of 4-7 percent have been announced
De-leveraging and refinancing Astaris:
Expectation of $40 million in 2004 keepwells, paid entirely in 1H ‘04, after which Astaris is expected to be debt free Possible refinancing of Astaris in late 2004 or early 2005
11
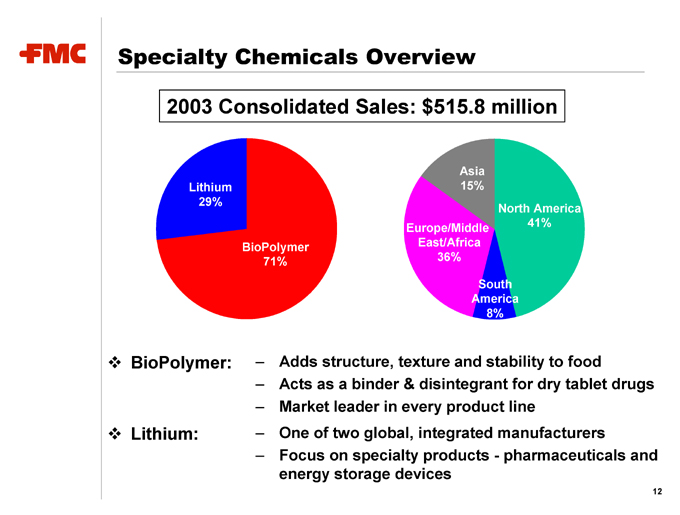
Specialty Chemicals Overview
2003 Consolidated Sales: $515.8 million
Lithium 29%
BioPolymer 71%
Asia 15%
North America 41%
Europe/Middle East/Africa 36%
South America 8%
BioPolymer:
Lithium:
Adds structure, texture and stability to food Acts as a binder & disintegrant for dry tablet drugs Market leader in every product line One of two global, integrated manufacturers Focus on specialty products—pharmaceuticals and energy storage devices
12
Specialty Chemicals – ‘01-’03 Performance
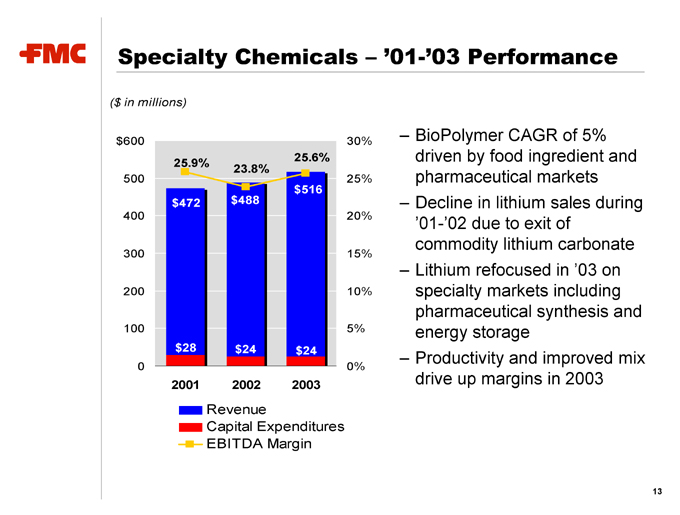
($ in millions) $600 500 400 300 200 100 0
2001 2002 2003
25.9% $472 $28
23.8% $488 $24
25.6% $516 $24
30% 25% 20% 15% 10% 5% 0%
Revenue
Capital Expenditures EBITDA Margin
BioPolymer CAGR of 5% driven by food ingredient and pharmaceutical markets Decline in lithium sales during ‘01-’02 due to exit of commodity lithium carbonate Lithium refocused in ‘03 on specialty markets including pharmaceutical synthesis and energy storage Productivity and improved mix drive up margins in 2003
13
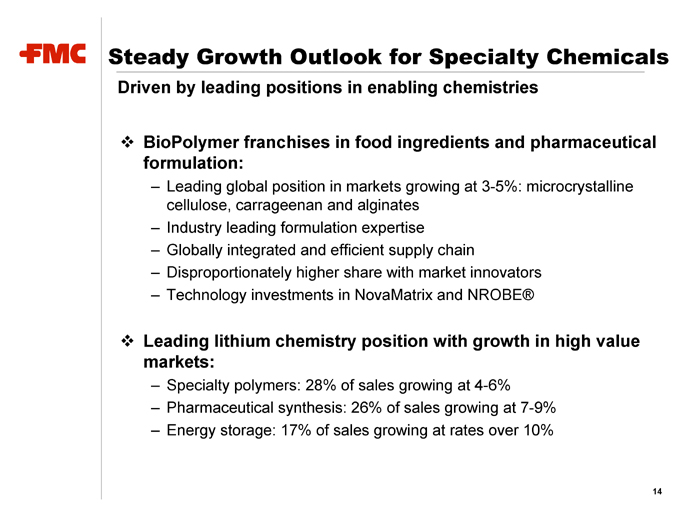
Steady Growth Outlook for Specialty Chemicals
Driven by leading positions in enabling chemistries
BioPolymer franchises in food ingredients and pharmaceutical formulation:
Leading global position in markets growing at 3-5%: microcrystalline cellulose, carrageenan and alginates Industry leading formulation expertise Globally integrated and efficient supply chain Disproportionately higher share with market innovators Technology investments in NovaMatrix and NROBE®
Leading lithium chemistry position with growth in high value markets:
Specialty polymers: 28% of sales growing at 4-6% Pharmaceutical synthesis: 26% of sales growing at 7-9% Energy storage: 17% of sales growing at rates over 10%
14
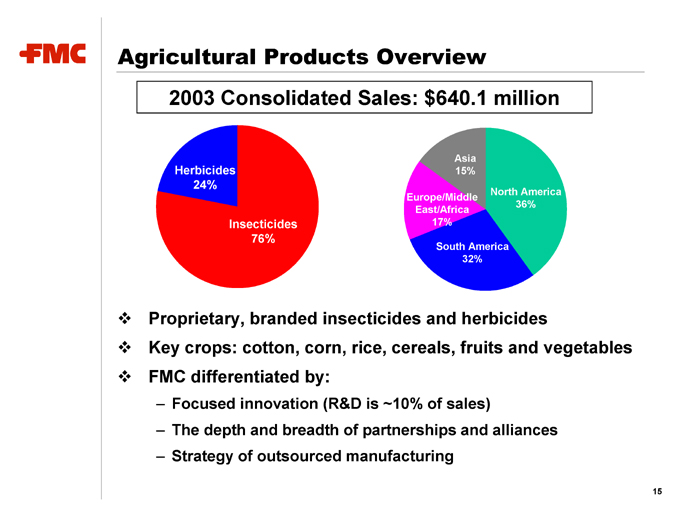
Agricultural Products Overview
2003 Consolidated Sales: $640.1 million
Herbicides 24%
Insecticides 76%
Asia 15%
Europe/Middle East/Africa 17%
North America 36%
South America 32%
Proprietary, branded insecticides and herbicides
Key crops: cotton, corn, rice, cereals, fruits and vegetables FMC differentiated by:
Focused innovation (R&D is ~10% of sales)
The depth and breadth of partnerships and alliances Strategy of outsourced manufacturing
15
Agricultural Products – ‘01-’03 Performance
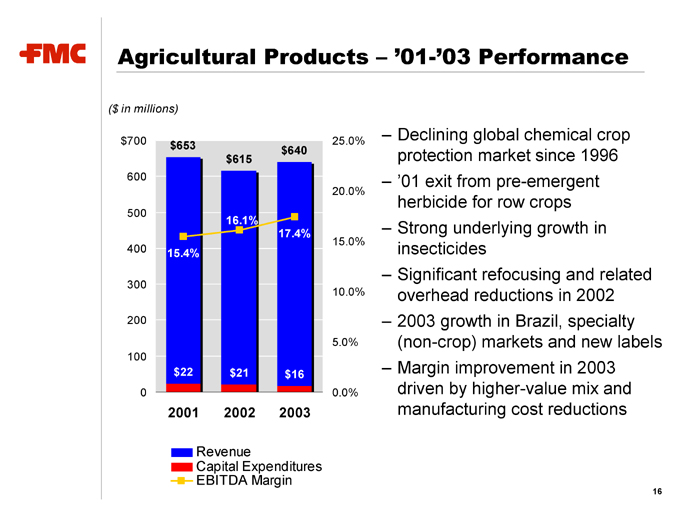
($ in millions) $700 600 500 400 300 200 100 0 $653
15.4% $22 $615
16.1% $21 $640
17.4% $16
2001 2002 2003
25.0% 20.0% 15.0% 10.0% 5.0% 0.0%
Declining global chemical crop protection market since 1996 ‘01 exit from pre-emergent herbicide for row crops Strong underlying growth in insecticides Significant refocusing and related overhead reductions in 2002 2003 growth in Brazil, specialty (non-crop) markets and new labels Margin improvement in 2003 driven by higher-value mix and manufacturing cost reductions
Revenue
Capital Expenditures EBITDA Margin
16

Very Strong Outlook for Ag Products in 2004
Driven by robust crop markets and our highly focused strategy
Improving global farm economy:
Rising global crop prices Improving U.S. farm income
Increasing global competitiveness of Brazilian farmers
Significant cost savings from productivity initiatives:
Manufacturing initiatives continue to produce savings Global supply chain redesign under evaluation
Network of global partnerships provides low-cost marketing scale
Focused, successful innovation:
Label expansions in both crop and specialty markets Novel ISK chemistry targeting sucking pests to launch 2005
Discovery efforts have resulted in many promising chemistries, several of which are now entering global field trials
17
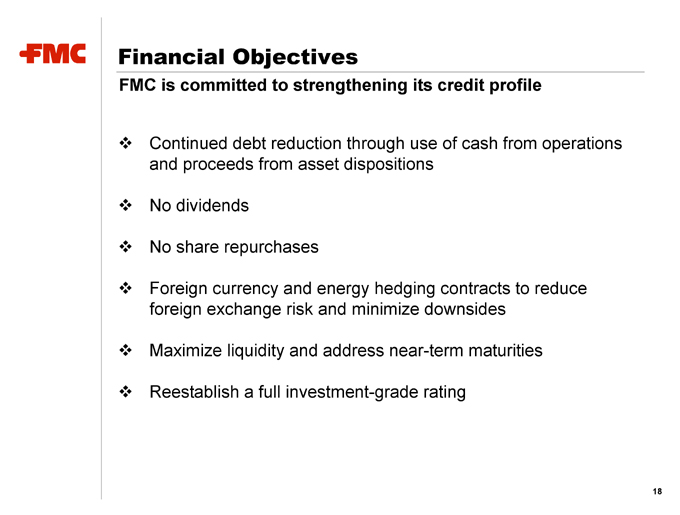
Financial Objectives
FMC is committed to strengthening its credit profile
Continued debt reduction through use of cash from operations and proceeds from asset dispositions
No dividends
No share repurchases
Foreign currency and energy hedging contracts to reduce foreign exchange risk and minimize downsides
Maximize liquidity and address near-term maturities
Reestablish a full investment-grade rating
18
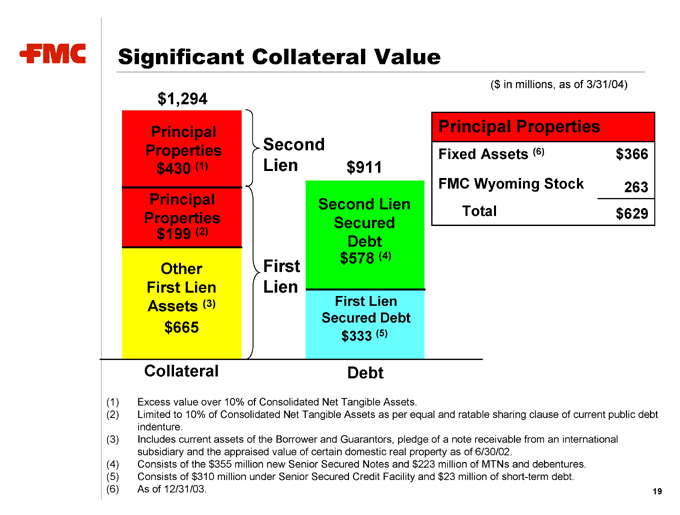
Significant Collateral Value
($ in millions, as of 3/31/04) $1,294
Principal Properties $430 (1)
Principal Properties $199 (2)
Other First Lien Assets (3) $665
Second Lien
First Lien $911
Second Lien Secured Debt $578 (4)
First Lien Secured Debt $333 (5)
Principal Properties
Fixed Assets (6) $366 FMC Wyoming Stock 263 Total $629
Collateral Debt
(1) Excess value over 10% of Consolidated Net Tangible Assets.
(2) Limited to 10% of Consolidated Net Tangible Assets as per equal and ratable sharing clause of current public debt indenture.
(3) Includes current assets of the Borrower and Guarantors, pledge of a note receivable from an international subsidiary and the appraised value of certain domestic real property as of 6/30/02.
(4) Consists of the $355 million new Senior Secured Notes and $223 million of MTNs and debentures. (5) Consists of $310 million under Senior Secured Credit Facility and $23 million of short-term debt.
(6) As of 12/31/03.
19
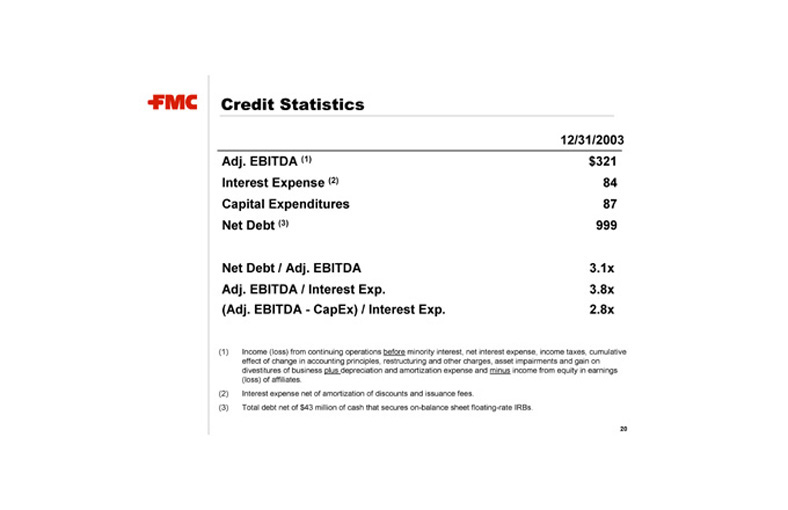
Credit Statistics
12/31/2003
Adj. EBITDA (1) $321 Interest Expense (2) 84 Capital Expenditures 87 Net Debt (3) 999
Net Debt / Adj. EBITDA 3.1x Adj. EBITDA / Interest Exp. 3.8x (Adj. EBITDA—CapEx) / Interest Exp. 2.8x
(1) Income (loss) from continuing operations before minority interest, net interest expense, income taxes, cumulative effect of change in accounting principles, restructuring and other charges, asset impairments and gain on divestitures of business plus depreciation and amortization expense and minus income from equity in earnings (loss) of affiliates.
(2) Interest expense net of amortization of discounts and issuance fees.
(3) Total debt net of $43 million of cash that secures on-balance sheet floating-rate IRBs.
20
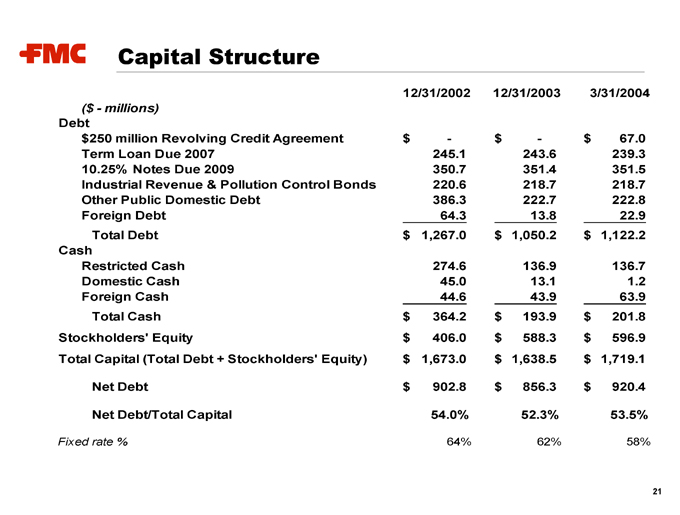
Capital Structure
12/31/2002 12/31/2003 3/31/2004
($ - millions)
Debt $250 million Revolving Credit Agreement $- $ - $ 67.0 Term Loan Due 2007 245.1 243.6 239.3 10.25% Notes Due 2009 350.7 351.4 351.5 Industrial Revenue & Pollution Control Bonds 220.6 218.7 218.7 Other Public Domestic Debt 386.3 222.7 222.8 Foreign Debt 64.3 13.8 22.9 Total Debt $1,267.0 $1,050.2 $1,122.2 Cash Restricted Cash 274.6 136.9 136.7 Domestic Cash 45.0 13.1 1.2 Foreign Cash 44.6 43.9 63.9 Total Cash $364.2 $193.9 $201.8 Stockholders’ Equity $406.0 $588.3 $596.9 Total Capital (Total Debt + Stockholders’ Equity) $1,673.0 $1,638.5 $1,719.1
Net Debt $902.8 $856.3 $920.4
Net Debt/Total Capital 54.0% 52.3% 53.5%
Fixed rate % 64% 62% 58%
21
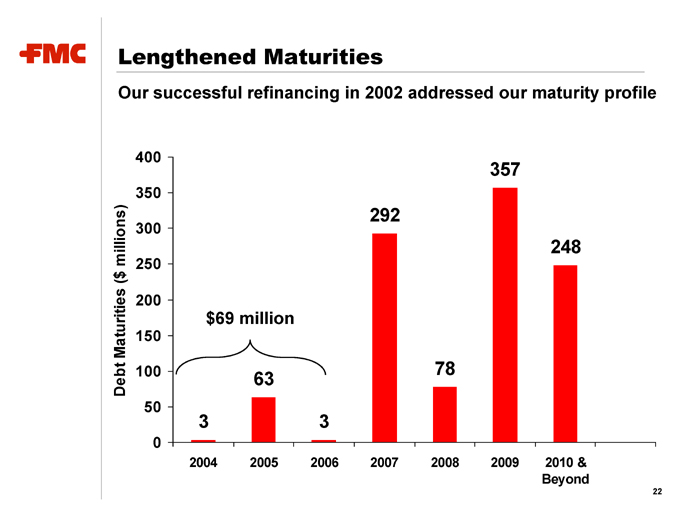
Lengthened Maturities
Our successful refinancing in 2002 addressed our maturity profile
Debt Maturities ($ millions)
400 350 300 250 200 150 100 50 0
2004 2005 2006 2007 2008 2009
2010 & Beyond $69 million
3
63
3
292
78
357
248
22
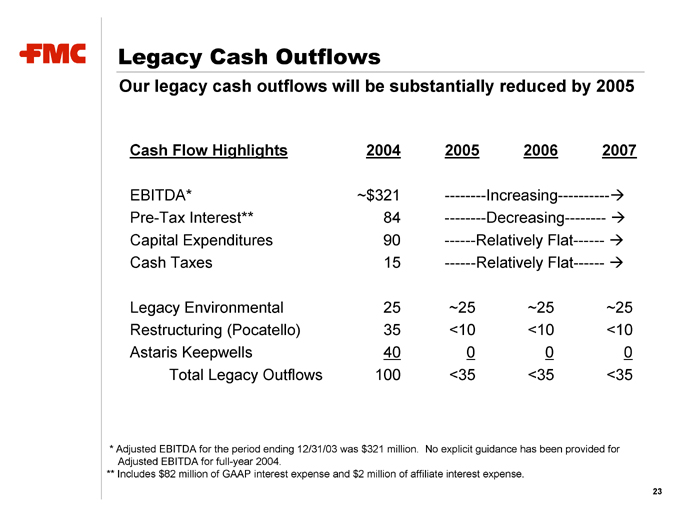
Legacy Cash Outflows
Our legacy cash outflows will be substantially reduced by 2005
Cash Flow Highlights 2004 2005 2006 2007
EBITDA* ~$321 Increasing Pre-Tax Interest** 84 Decreasing Capital Expenditures 90 Relatively Flat Cash Taxes 15 Relatively Flat
Legacy Environmental 25 ~25 ~25 ~25 Restructuring (Pocatello) 35 <10 <10 <10 Astaris Keepwells 40 0 0 0 Total Legacy Outflows 100 <35 <35 <35
* Adjusted EBITDA for the period ending 12/31/03 was $321 million. No explicit guidance has been provided for
Adjusted EBITDA for full-year 2004.
** Includes $82 million of GAAP interest expense and $2 million of affiliate interest expense.
23
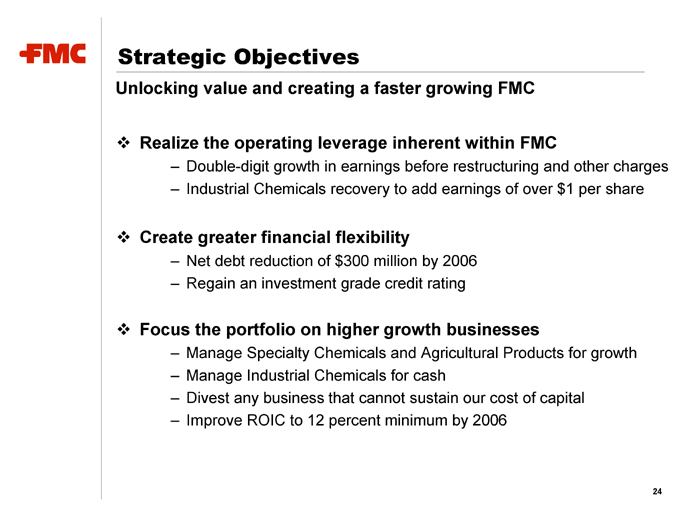
Strategic Objectives
Unlocking value and creating a faster growing FMC
Realize the operating leverage inherent within FMC
Double-digit growth in earnings before restructuring and other charges Industrial Chemicals recovery to add earnings of over $1 per share
Create greater financial flexibility
Net debt reduction of $300 million by 2006 Regain an investment grade credit rating
Focus the portfolio on higher growth businesses
Manage Specialty Chemicals and Agricultural Products for growth Manage Industrial Chemicals for cash Divest any business that cannot sustain our cost of capital Improve ROIC to 12 percent minimum by 2006
24
FMC Corporation