Exhibit 99.1
Exhibit 99.1
FMC Corporation
Presentation to Senior Lenders
June 8, 2004
PUBLIC VERSION

Agenda
Performance Update and Outlook
Transaction Overview
Public Q&A
Financial Projections
Private Q&A
1
Performance Update and Outlook
Thomas C. Deas, Jr. Vice President & Treasurer
Disclaimer
Safe Harbor Statement under the Private Securities Litigation Reform Act of 1995:
These slides and the accompanying presentation contain “forward-looking statements” that represent management’s best judgment as of the date hereof based on information currently available. Actual results of the Company may differ materially from those contained in the forward-looking statements.
Additional information concerning factors that may cause results to materially differ from those in the forward-looking statements is contained in the Company’s periodic reports filed under the Securities Exchange Act of 1934, as amended.
The Company undertakes no obligation to update or revise these forward-looking statements to reflect new events or uncertainties.
3
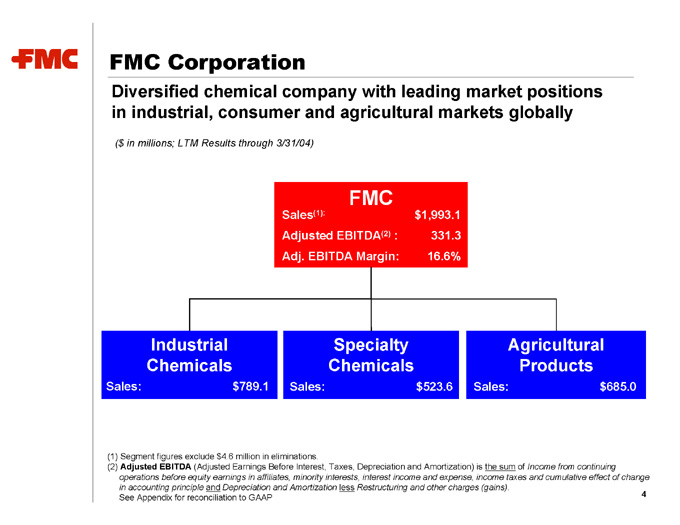
FMC Corporation
Diversified chemical company with leading market positions in industrial, consumer and agricultural markets globally
($ in millions; LTM Results through 3/31/04)
FMC
Sales(1): $ 1,993.1
Adjusted EBITDA(2) : 331.3
Adj. EBITDA Margin: 16.6%
Industrial Chemicals
Sales: $789.1
Specialty Chemicals
Sales: $523.6
Agricultural Products
Sales: $685.0
(1) Segment figures exclude $4.6 million in eliminations.
(2) Adjusted EBITDA (Adjusted Earnings Before Interest, Taxes, Depreciation and Amortization) is the sum of Income from continuing operations before equity earnings in affiliates, minority interests, interest income and expense, income taxes and cumulative effect of change in accounting principle and Depreciation and Amortization less Restructuring and other charges (gains).
See Appendix for reconciliation to GAAP 4
FMC’s Strengths
Leading market positions
Global presence
Diversified business mix and high-quality customer base
Diversified and integrated cost structure
Focused R&D and strong applications expertise
Proven management with extensive industry experience
5
Operating Performance: 1st Quarter 2004
Revenue up 17% *
– Higher revenue in all three business segments
Adjusted EBITDA up 16% *
– Agricultural Products up
– Specialty Chemicals flat
– Industrial Chemicals weaker
Free cash flow up $30 million *
– Working capital focus
– Capital spending less than D&A
* Compared to the 1st quarter of 2003.
6
Agricultural Products: 1Q 2004 Performance
Robust Brazilian crop market and focused strategy drives growth
Sales up 35%, segment earnings up four-fold
Sales increase driven by:
– Broad-based growth across insecticides and herbicides
– Two-thirds of the increase from strong performance in Latin America
– Improved Brazilian farm economy and heavy pest pressures
Segment earnings growth driven by:
– Higher sales
– Improved product mix
– Lower costs
Note: All comparisons are against the first quarter of 2003
7
Specialty Chemicals: 1Q 2004 Performance
Growth strategies in key franchises deliver strong performance
Sales up 6%, segment earnings essentially unchanged
BioPolymer businesses drive healthy sales increase
– Stronger microcrystalline cellulose sales for the pharmaceutical markets in Europe and the U.S.
– Higher carrageenan sales into the personal care and food ingredients markets
Strong lithium sales in the battery market as well as favorable currency translation
Segment earnings flat primarily due to higher raw materials costs
Note: All comparisons are against the first quarter of 2003
8
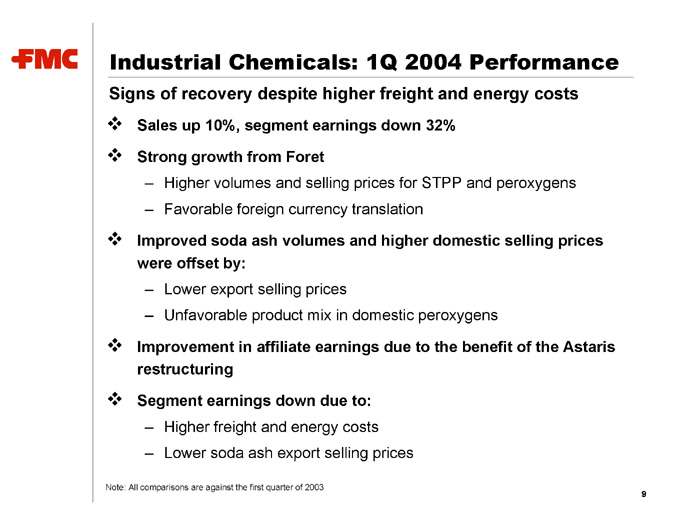
Industrial Chemicals: 1Q 2004 Performance
Signs of recovery despite higher freight and energy costs
Sales up 10%, segment earnings down 32%
Strong growth from Foret
– Higher volumes and selling prices for STPP and peroxygens
– Favorable foreign currency translation
Improved soda ash volumes and higher domestic selling prices
were offset by:
– Lower export selling prices
– Unfavorable product mix in domestic peroxygens
Improvement in affiliate earnings due to the benefit of the Astaris
restructuring
Segment earnings down due to:
– Higher freight and energy costs
– Lower soda ash export selling prices
Note: All comparisons are against the first quarter of 2003
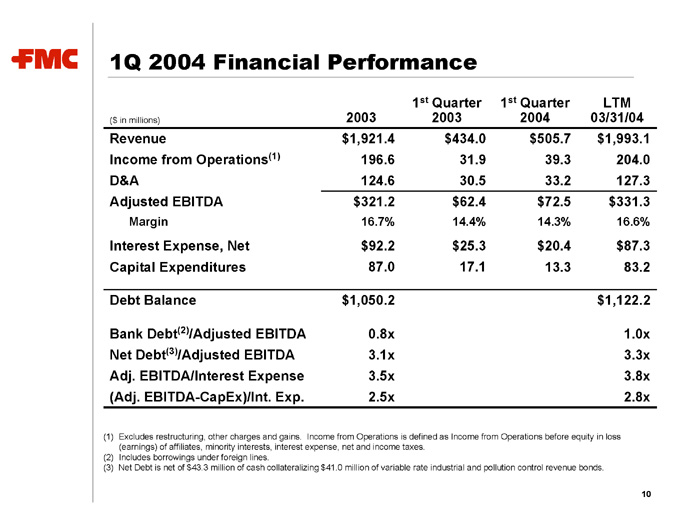
1Q 2004 Financial Performance
1st Quarter 1st Quarter LTM
($ in millions) 2003 2003 2004 03/31/04
Revenue $ 1,921.4 $ 434.0 $ 505.7 $ 1,993.1 Income from Operations(1) 196.6 31.9 39.3 204.0
D&A 124.6 30.5 33.2 127.3 Adjusted EBITDA $ 321.2 $ 62.4 $ 72.5 $ 331.3
Margin 16.7% 14.4% 14.3% 16.6% Interest Expense, Net $ 92.2 $ 25.3 $ 20.4 $ 87.3
Capital Expenditures 87.0 17.1 13.3 83.2
Debt Balance $ 1,050.2 $ 1,122.2
Bank Debt(2)/Adjusted EBITDA 0.8x 1.0x
Net Debt(3)/Adjusted EBITDA 3.1x 3.3x
Adj. EBITDA/Interest Expense 3.5x 3.8x
(Adj. EBITDA-CapEx)/Int. Exp. 2.5x 2.8x
(1) Excludes restructuring, other charges and gains. Income from Operations is defined as Income from Operations before equity in loss (earnings) of affiliates, minority interests, interest expense, net and income taxes.
(2) Includes borrowings under foreign lines.
(3) Net Debt is net of $43.3 million of cash collateralizing $41.0 million of variable rate industrial and pollution control revenue bonds.
10
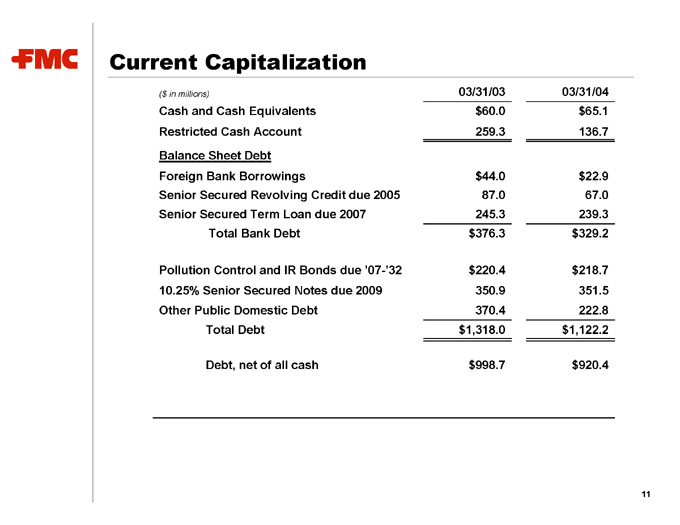
Current Capitalization
($ in millions) 03/31/03 03/31/04
Cash and Cash Equivalents $ 60.0 $ 65.1
Restricted Cash Account 259.3 136.7
Balance Sheet Debt
Foreign Bank Borrowings $ 44.0 $ 22.9
Senior Secured Revolving Credit due 2005 87.0 67.0
Senior Secured Term Loan due 2007 245.3 239.3
Total Bank Debt $ 376.3 $ 329.2
Pollution Control and IR Bonds due ‘07-’32 $ 220.4 $ 218.7
10.25% Senior Secured Notes due 2009 350.9 351.5
Other Public Domestic Debt 370.4 222.8
Total Debt $ 1,318.0 $ 1,122.2
Debt, net of all cash $ 998.7 $ 920.4
11
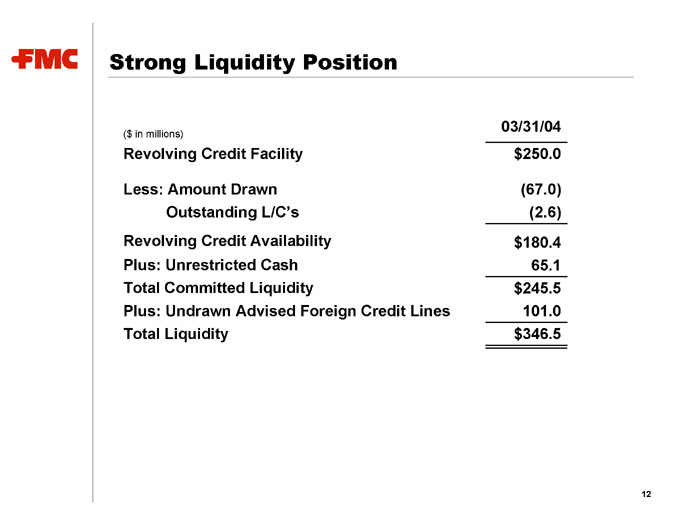
Strong Liquidity Position
03/31/04
($ in millions)
Revolving Credit Facility $ 250.0
Less: Amount Drawn (67.0)
Outstanding L/C’s (2.6)
Revolving Credit Availability $ 180.4
Plus: Unrestricted Cash 65.1
Total Committed Liquidity $ 245.5
Plus: Undrawn Advised Foreign Credit Lines 101.0
Total Liquidity $ 346.5
12
2004 Outlook
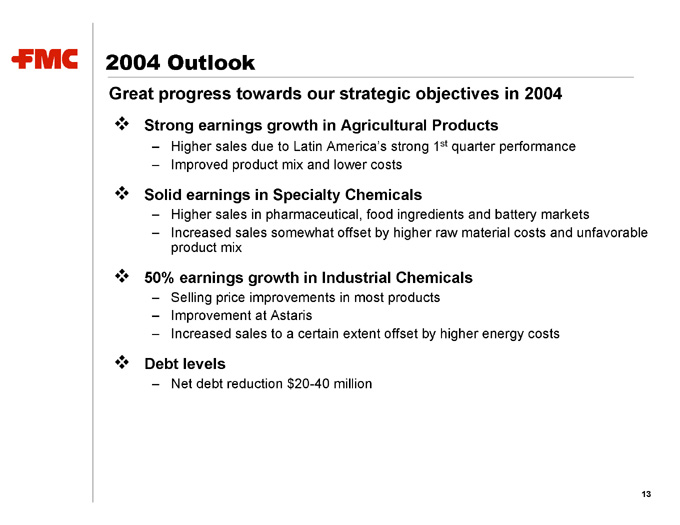
Great progress towards our strategic objectives in 2004
Strong earnings growth in Agricultural Products
– Higher sales due to Latin America’s strong 1st quarter performance
– Improved product mix and lower costs
Solid earnings in Specialty Chemicals
– Higher sales in pharmaceutical, food ingredients and battery markets
– Increased sales somewhat offset by higher raw material costs and unfavorable product mix
50% earnings growth in Industrial Chemicals
– Selling price improvements in most products
– Improvement at Astaris
– Increased sales to a certain extent offset by higher energy costs
Debt levels
– Net debt reduction $20-40 million
13
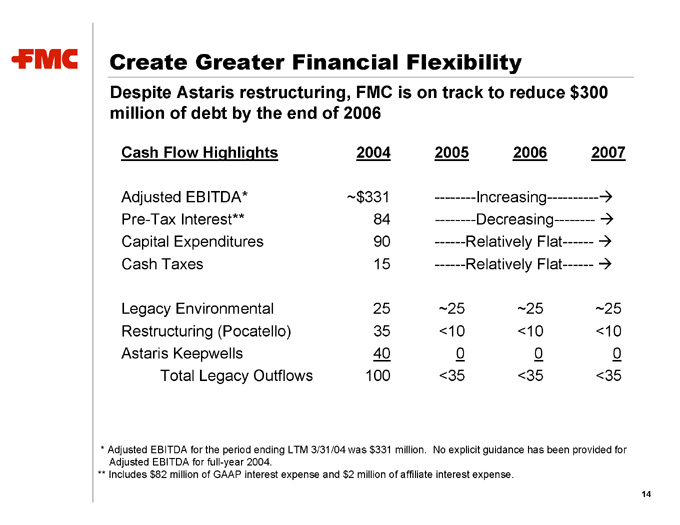
Create Greater Financial Flexibility
Despite Astaris restructuring, FMC is on track to reduce $300 million of debt by the end of 2006
Cash Flow Highlights 2004 2005 2006 2007
Adjusted EBITDA* ~$ 331 ————Increasing—————Æ
Pre-Tax Interest** 84 ————Decreasing———— A
Capital Expenditures 90 ———Relatively Flat——— A
Cash Taxes 15 ———Relatively Flat——— A
Legacy Environmental 25 ~25 ~25 ~25
Restructuring (Pocatello) 35 <10 <10 <10
Astaris Keepwells 40 0 0 0
Total Legacy Outflows 100 <35 <35 <35
* Adjusted EBITDA for the period ending LTM 3/31/04 was $331 million. No explicit guidance has been provided for
Adjusted EBITDA for full-year 2004.
** Includes $82 million of GAAP interest expense and $2 million of affiliate interest expense.
14
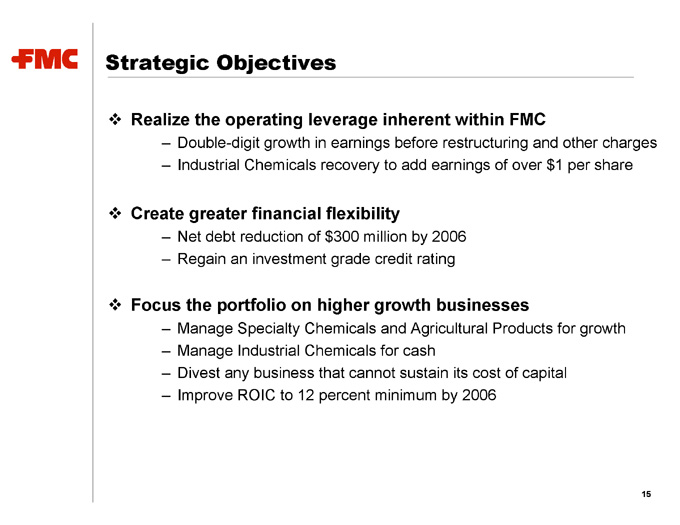
Strategic Objectives
Realize the operating leverage inherent within FMC
– Double-digit growth in earnings before restructuring and other charges
– Industrial Chemicals recovery to add earnings of over $1 per share
Create greater financial flexibility
– Net debt reduction of $300 million by 2006
– Regain an investment grade credit rating
Focus the portfolio on higher growth businesses
– Manage Specialty Chemicals and Agricultural Products for growth
– Manage Industrial Chemicals for cash
– Divest any business that cannot sustain its cost of capital
– Improve ROIC to 12 percent minimum by 2006
15
Transaction Overview
Michael Mauer
Managing Director, Citigroup
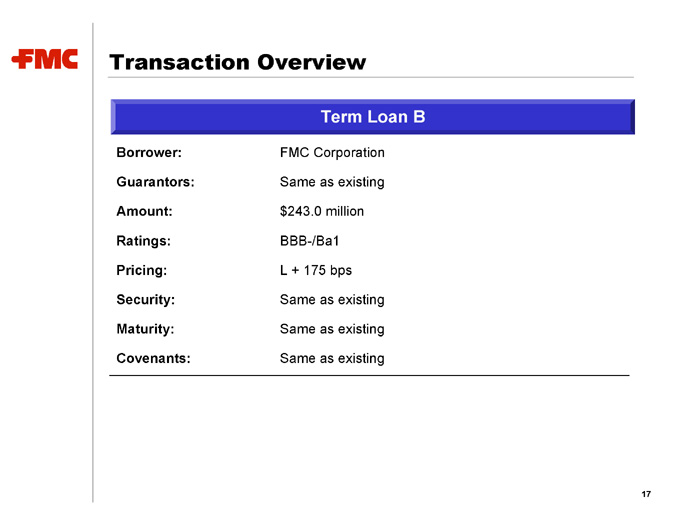
Transaction Overview
Term Loan B
Borrower: FMC Corporation
Guarantors: Same as existing
Amount: $243.0 million
Ratings: BBB-/Ba1
Pricing: L + 175 bps
Security: Same as existing
Maturity: Same as existing
Covenants: Same as existing
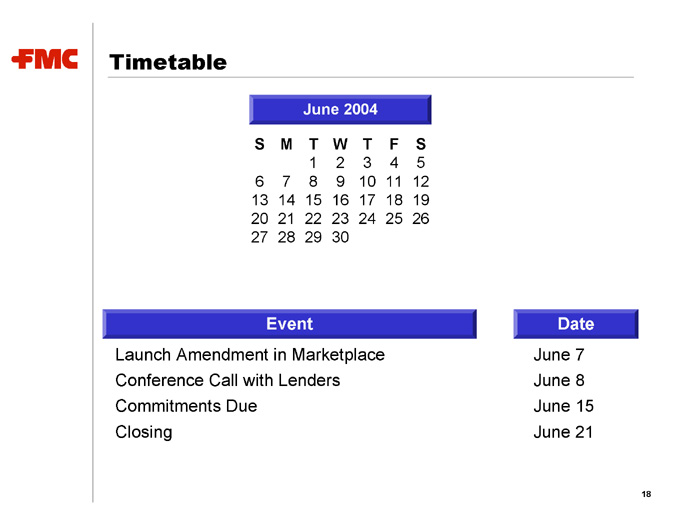
Timetable
June 2004
S M T W T F S
1 2 3 4 5
6 7 8 9 10 11 12
13 14 15 16 17 18 19
20 21 22 23 24 25 26
27 28 29 30
Event Date
Launch Amendment in Marketplace June 7
Conference Call with Lenders June 8
Commitments Due June 15
Closing June 21
18

FMC Corporation
Public Q&A

Appendix
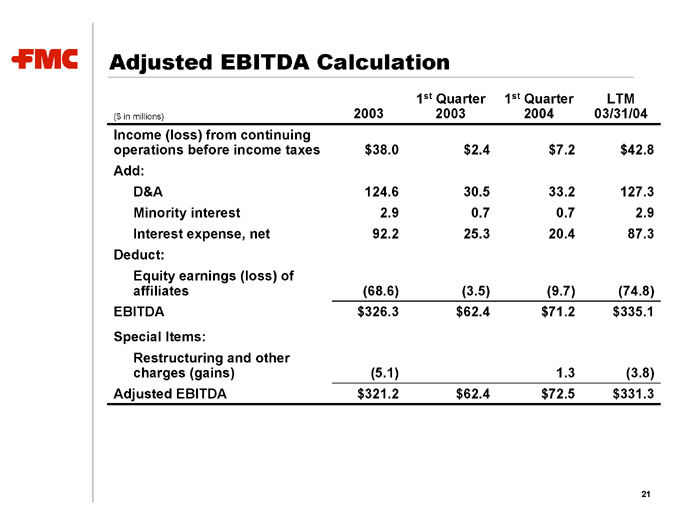
Adjusted EBITDA Calculation
1st Quarter 1st Quarter LTM ($ in millions) 2003 2003 2004 03/31/04 Income (loss) from continuing operations before income taxes $38.0 $2.4 $7.2 $42.8 Add: D&A 124.6 30.5 33.2 127.3 Minority interest 2.9 0.7 0.7 2.9 Interest expense, net 92.2 25.3 20.4 87.3 Deduct: Equity earnings (loss) of affiliates (68.6) (3.5) (9.7) (74.8) EBITDA $326.3 $62.4 $71.2 $335.1 Special Items: Restructuring and other charges (gains) (5.1) 1.3 (3.8) Adjusted EBITDA $321.2 $62.4 $72.5 $331.3
21