Exhibit 99.1
Exhibit 99.1
FMC Corporation
First Annual Chemical Industry Conference
The Chemical Heritage Foundation
June 22, 2004
W. Kim Foster
Senior Vice President and CFO
Disclaimer
Safe Harbor Statement under the Private Securities Litigation Reform Act of 1995
These slides and the accompanying presentation contain “forward-looking statements” that represent management’s best judgment as of the date hereof based on information currently available. Actual results of the Company may differ materially from those contained in the forward-looking statements.
Additional information concerning factors that may cause results to differ materially from those in the forward-looking statements is contained in the Company’s periodic reports filed under the Securities Exchange Act of 1934, as amended.
The Company undertakes no obligation to update or revise these forward-looking statements to reflect new events or uncertainties.
1
Use of Non-GAAP Terms
These slides contain certain “non-GAAP financial terms” which are defined below and on FMC’s Investor Relations web site (http://ir.fmc.com) in the Glossary of Financial Terms section. In addition, in the Conference Calls and Presentations section of the web site, we have provided reconciliations of non-GAAP terms to the closest GAAP term. Lastly, these slides contain references to segment financial items which are presented in detail in Note 19 of FMC’s 2003 Form 10-K.
EBITDA (Earnings Before Interest, Taxes, Depreciation and Amortization) is the sum of Income (loss) from continuing operations before income taxes and cumulative effect of change in accounting principle and Depreciation and Amortization.
EBITDA Margin is the quotient of EBITDA (defined above) and Revenue.
ROIC (Return on Invested Capital) is the sum of Earnings from continuing operations before restructuring and other charges (gains) and after-tax Interest expense divided by the sum of Short-term debt, Current portion of long-term debt, Long-term debt and Total shareholders’ equity.
2
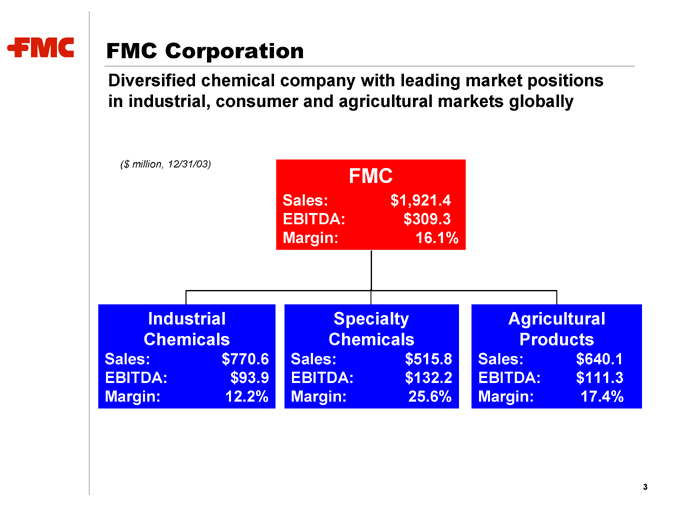
FMC Corporation
Diversified chemical company with leading market positions in industrial, consumer and agricultural markets globally
($ million, 12/31/03)
FMC
Sales: $1,921.4
EBITDA: $309.3
Margin: 16.1%
Industrial Chemicals
Sales: $770.6
EBITDA: $93.9
Margin: 12.2%
Specialty Chemicals
Sales: $515.8
EBITDA: $132.2
Margin: 25.6%
Agricultural Products
Sales: $640.1
EBITDA: $111.3
Margin: 17.4%
3
FMC Strengths
Leading market positions
Global presence
Diversified business mix and high-quality customer base
Diversified and integrated cost structure
Focused R&D and strong applications expertise
Proven management with extensive industry experience
4
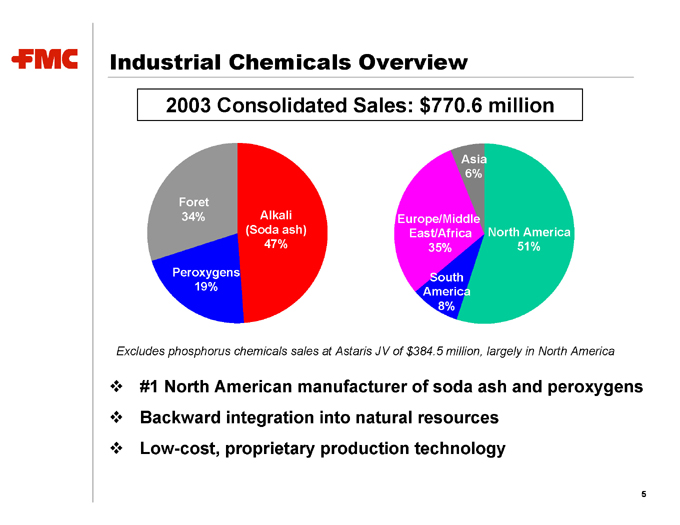
Industrial Chemicals Overview
2003 Consolidated Sales: $770.6 million
Foret 34%
Peroxygens 19%
Alkali (Soda ash) 47%
Asia 6%
Europe/Middle East/Africa 35%
South America 8%
North America 51%
Excludes phosphorus chemicals sales at Astaris JV of $384.5 million, largely in North America
#1 North American manufacturer of soda ash and peroxygens
Backward integration into natural resources
Low-cost, proprietary production technology
5
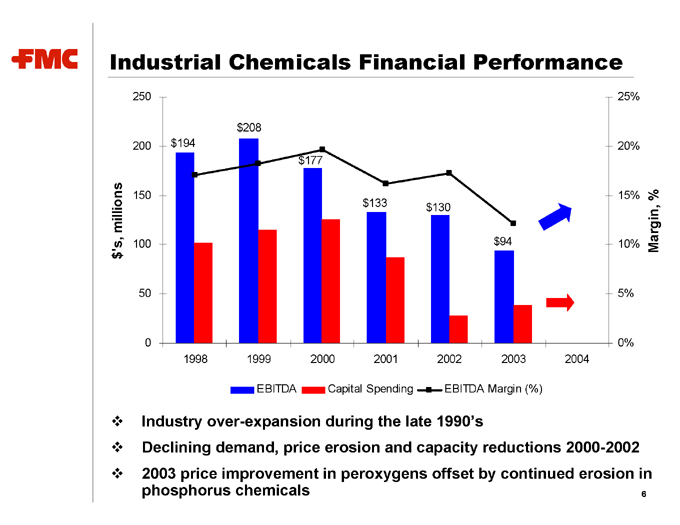
Industrial Chemicals Financial Performance
$’s, millions
250 200 150 100 50 0
Margin, %
25% 20% 15% 10% 5% 0%
1998 1999 2000 2001 2002 2003 2004
EBITDA
Capital Spending
EBITDA Margin (%)
$194 $208 $177 $133 $130 $94
Industry over-expansion during the late 1990’s
Declining demand, price erosion and capacity reductions 2000-2002
2003 price improvement in peroxygens offset by continued erosion in phosphorus chemicals
6
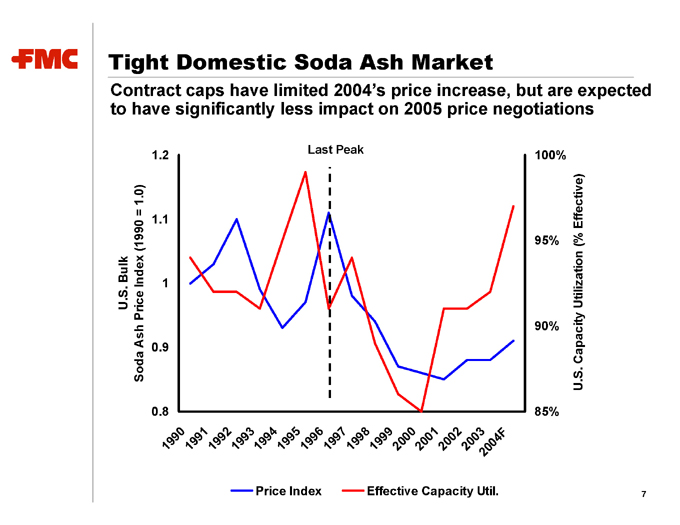
Tight Domestic Soda Ash Market
Contract caps have limited 2004’s price increase, but are expected to have significantly less impact on 2005 price negotiations
U.S. Bulk
Soda Ash Price Index (1990 = 1.0)
1.2 1.1 1 0.9 0.8
Last Peak
U.S. Capacity Utilization (% Effective)
100% 95% 90% 85%
1990 1991 1992 1993 1994 1995 1996 1997 1998 1999 2000 2001 2002 2003 2004F
Price Index Effective Capacity Util.
7
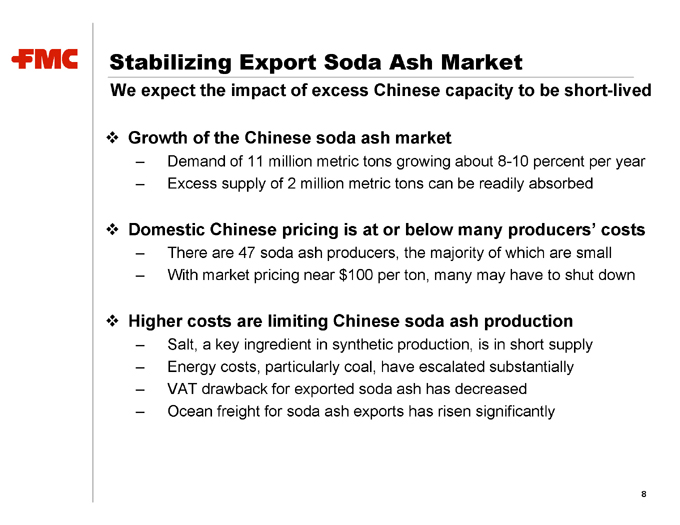
Stabilizing Export Soda Ash Market
We expect the impact of excess Chinese capacity to be short-lived
Growth of the Chinese soda ash market
Demand of 11 million metric tons growing about 8-10 percent per year
Excess supply of 2 million metric tons can be readily absorbed
Domestic Chinese pricing is at or below many producers’ costs
There are 47 soda ash producers, the majority of which are small
With market pricing near $100 per ton, many may have to shut down
Higher costs are limiting Chinese soda ash production
Salt, a key ingredient in synthetic production, is in short supply
Energy costs, particularly coal, have escalated substantially
VAT drawback for exported soda ash has decreased
Ocean freight for soda ash exports has risen significantly
8
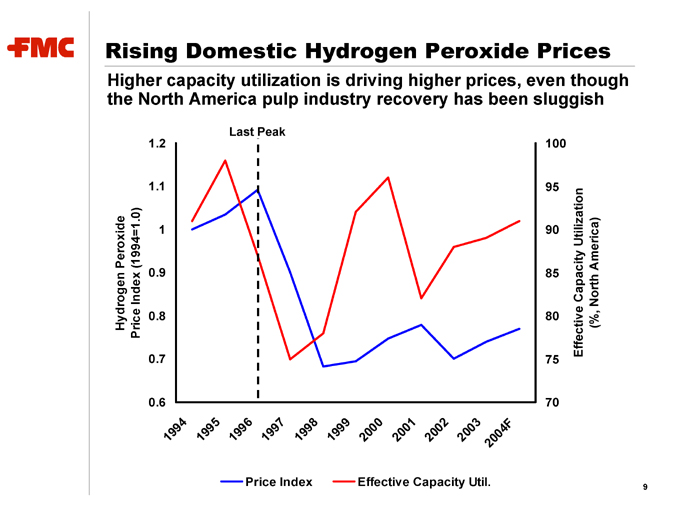
Rising Domestic Hydrogen Peroxide Prices
Higher capacity utilization is driving higher prices, even though the North America pulp industry recovery has been sluggish
Hydrogen Peroxide
Price Index (1994=1.0)
1.2 1.1 1 0.9 0.8 0.7 0.6
Last Peak
100 95 90 85 80 75 70
Effective Capacity Utilization
(%, North America)
1994 1995 1996 1997 1998 1999 2000 2001 2002 2003 2004F
Price Index Effective Capacity Util.
9

Industrial Chemicals Improvement in Europe
Steady recovery across nearly all of Foret’s product lines
After a strong 2003, peroxygens expected to continue to grow
Hydrogen peroxide demand growth of 4% per year driven by strength of Scandinavian pulp industry
Peroxide price increase of 8% in 2003; another 5% expected during 2004
Phosphorus chemicals in a slow recovery driven by capacity reduction
Rhodia’s shutdown of Rouen STPP facility has improved industry capacity utilization
Foret has recovered STPP volume that was lost in 2002
Price recovery is beginning
10
Turnaround In Domestic Phosphorus
Significant restructuring at Astaris
Plant closures and product line transitions on schedule
Annualized savings of $40-50 million on track ($20-25 million for FMC)
North American market dynamics are improving
Astaris capacity reductions have tightened domestic supply
Strong euro has reduced import pressures from Europe
Chinese P4 supply has greatly subsided due to energy constraints
Broad-based price increases of 4-7 percent have been announced
De-leveraging and refinancing Astaris
Expectation of $40 million in 2004 keepwells, paid entirely in 1H ‘04, after which Astaris is expected to be debt free
Possible refinancing of Astaris in late 2004 or early 2005
11
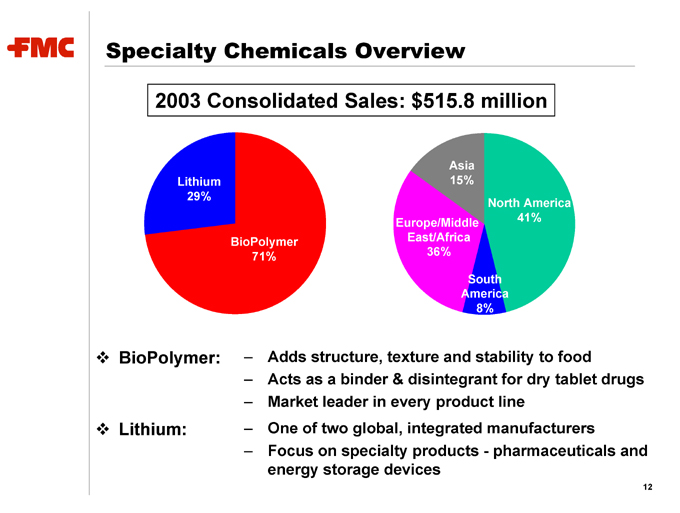
Specialty Chemicals Overview
2003 Consolidated Sales: $515.8 million
Lithium 29%
BioPolymer 71%
Asia 15%
Europe/Middle East/Africa 36%
South America 8%
North America 41%
BioPolymer:
Adds structure, texture and stability to food
Acts as a binder & disintegrant for dry tablet drugs
Market leader in every product line
Lithium:
One of two global, integrated manufacturers
Focus on specialty products—pharmaceuticals and energy storage devices
12
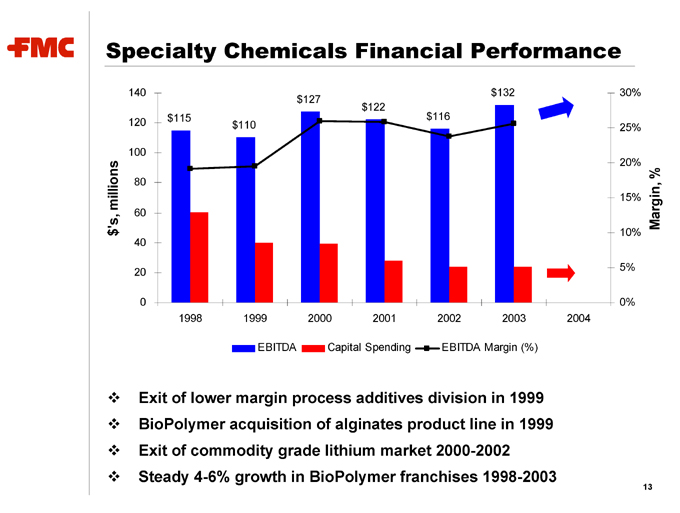
Specialty Chemicals Financial Performance
$’s, millions
140 120 100 80 60 40 20 0
30% 25% 20% 15% 10% 5% 0%
Margin, %
1998 1999 2000 2001 2002 2003 2004
EBITDA
Capital Spending
EBITDA Margin (%)
$115 $110 $127 $122 $116 $132
Exit of lower margin process additives division in 1999
BioPolymer acquisition of alginates product line in 1999
Exit of commodity grade lithium market 2000-2002
Steady 4-6% growth in BioPolymer franchises 1998-2003
13
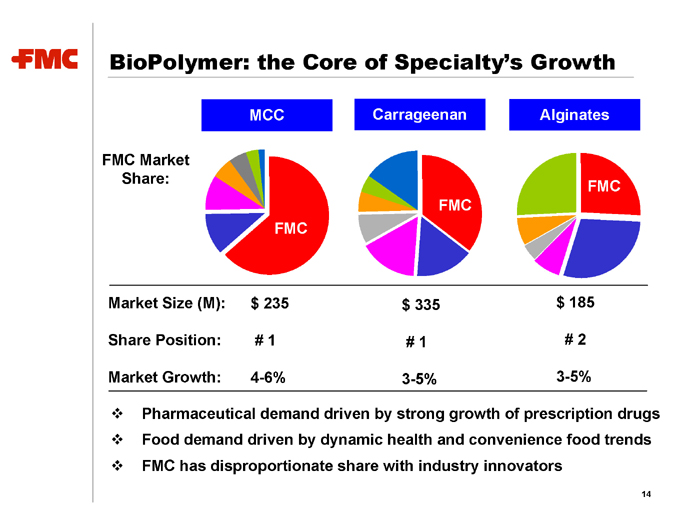
BioPolymer: the Core of Specialty’s Growth
FMC Market Share:
MCC Carrageenan Alginates
FMC FMC FMC
Market Size (M): $ 235 $ 335 $ 185
Share Position: # 1 # 1 # 2
Market Growth: 4-6% 3-5% 3-5%
Pharmaceutical demand driven by strong growth of prescription drugs
Food demand driven by dynamic health and convenience food trends
FMC has disproportionate share with industry innovators
14
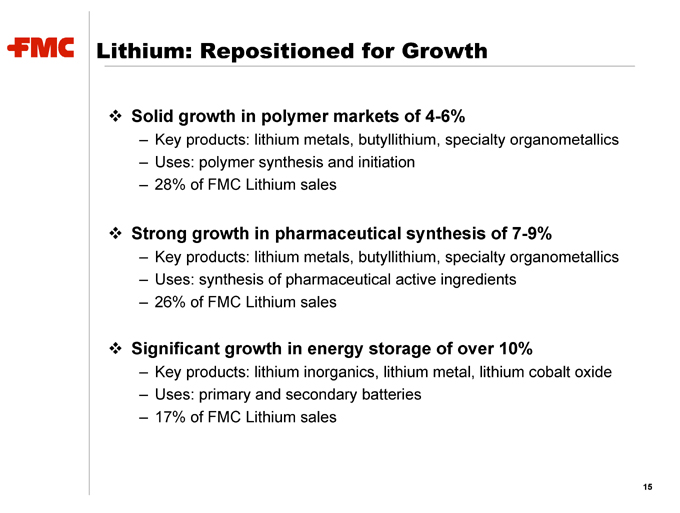
Lithium: Repositioned for Growth
Solid growth in polymer markets of 4-6%
Key products: lithium metals, butyllithium, specialty organometallics
Uses: polymer synthesis and initiation
28% of FMC Lithium sales
Strong growth in pharmaceutical synthesis of 7-9%
Key products: lithium metals, butyllithium, specialty organometallics
Uses: synthesis of pharmaceutical active ingredients
26% of FMC Lithium sales
Significant growth in energy storage of over 10%
Key products: lithium inorganics, lithium metal, lithium cobalt oxide
Uses: primary and secondary batteries
17% of FMC Lithium sales
15
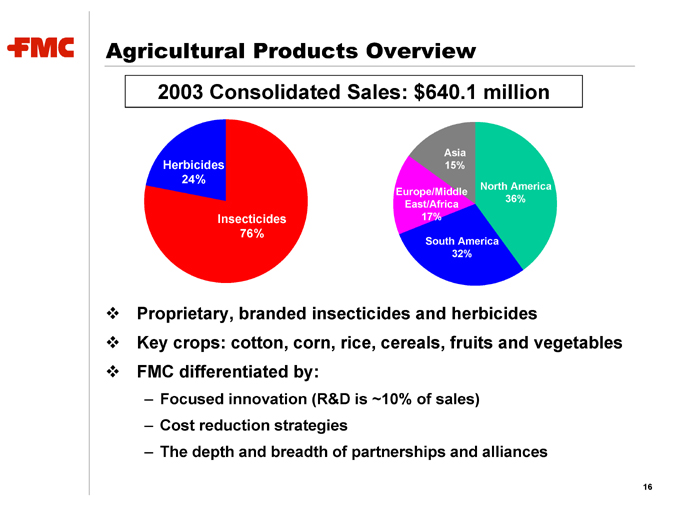
Agricultural Products Overview
2003 Consolidated Sales: $640.1 million
Herbicides 24%
Insecticides 76%
Asia 15%
Europe/Middle East/Africa 17%
South America 32%
North America 36%
Proprietary, branded insecticides and herbicides
Key crops: cotton, corn, rice, cereals, fruits and vegetables
FMC differentiated by:
Focused innovation (R&D is ~10% of sales)
Cost reduction strategies
The depth and breadth of partnerships and alliances
16
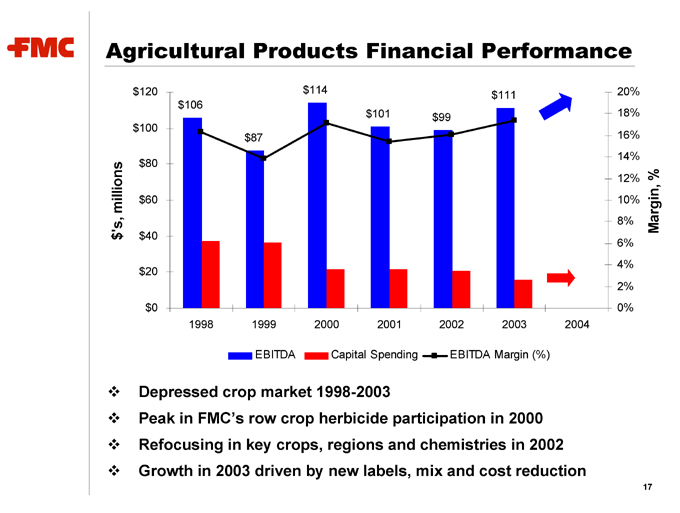
Agricultural Products Financial Performance
$’s, millions
$120 $100 $80 $60 $40 $20 $0
20% 18% 16% 14% 12% 10% 8% 6% 4% 2% 0%
Margin, %
1998 1999 2000 20012002 2003 2004
EBITDA Capital Spending EBITDA Margin (%)
$106 $87 $114 $101 $99 $111
Depressed crop market 1998-2003
Peak in FMC’s row crop herbicide participation in 2000
Refocusing in key crops, regions and chemistries in 2002
Growth in 2003 driven by new labels, mix and cost reduction
17
Positive Outlook for Ag Products
Driven by robust crop markets and our focused strategy
Improving global farm economy
Rising global crop prices
Significant cost savings from productivity initiatives
Manufacturing initiatives continue to produce savings
Global supply chain redesign being implemented
Success of market access strategies (alliances) in key markets
Focused product development
Label expansions in both crop and specialty markets
Novel ISK chemistry targeting sucking pests to launch 2005
Access to two new and complementary chemistries under negotiation
18
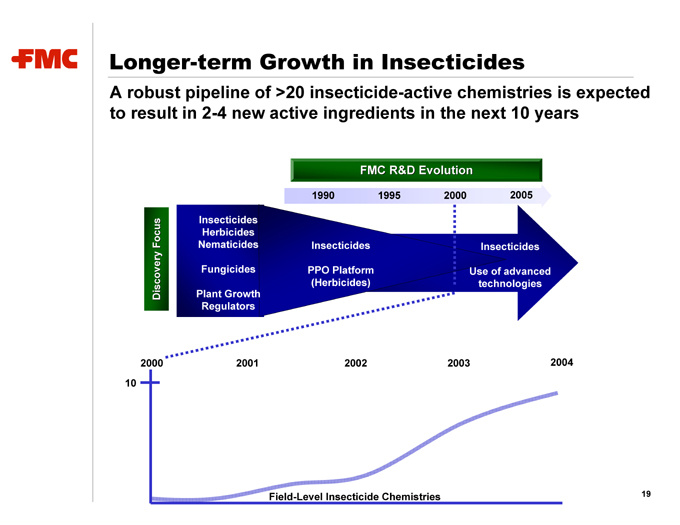
Longer-term Growth in Insecticides
A robust pipeline of >20 insecticide-active chemistries is expected to result in 2-4 new active ingredients in the next 10 years
FMC R&D Evolution
1990 1995 2000 2005
Discovery Focus
Insecticides Herbicides Nematicides
Fungicides
Plant Growth Regulators
Insecticides
PPO Platform (Herbicides)
Insecticides
Use of advanced technologies
2000 2001 2002 2003 2004
10
Field-Level Insecticide Chemistries
19
Summary: Great Businesses
Great businesses, each generating EBITDA of near $100 million
Industrial Chemicals earnings that are $50 million below normal
Steady growth in Specialty Chemicals and Ag Products
Low capital expenditure requirements
However, legacy items and restructuring have impaired free cash flow over the past three years
20
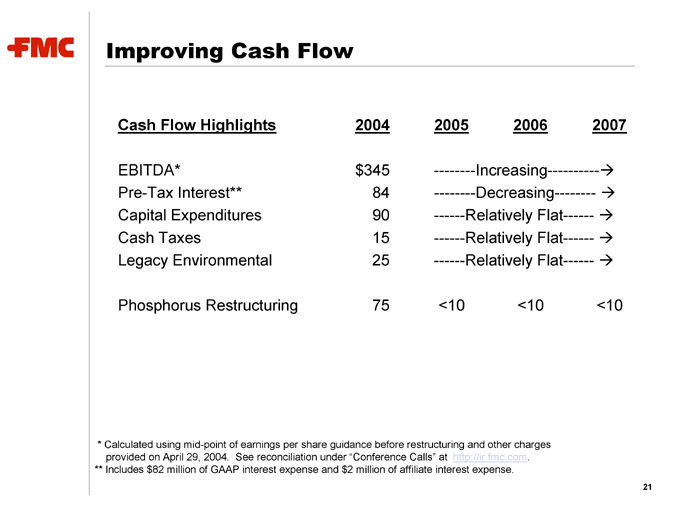
Improving Cash Flow
Cash Flow Highlights 2004 2005 2006 2007
EBITDA * $345 ————Increasing—————
Pre-Tax Interest ** 84 ————Decreasing————
Capital Expenditures 90 ———Relatively Flat———
Cash Taxes 15 ———Relatively Flat———
Legacy Environmental 25 ———Relatively Flat———
Phosphorus Restructuring 75 <10 <10 <10
* Calculated using mid-point of earnings per share guidance before restructuring and other charges provided on April 29, 2004. See reconciliation under “Conference Calls” at http://ir.fmc.com.
** Includes $82 million of GAAP interest expense and $2 million of affiliate interest expense.
21
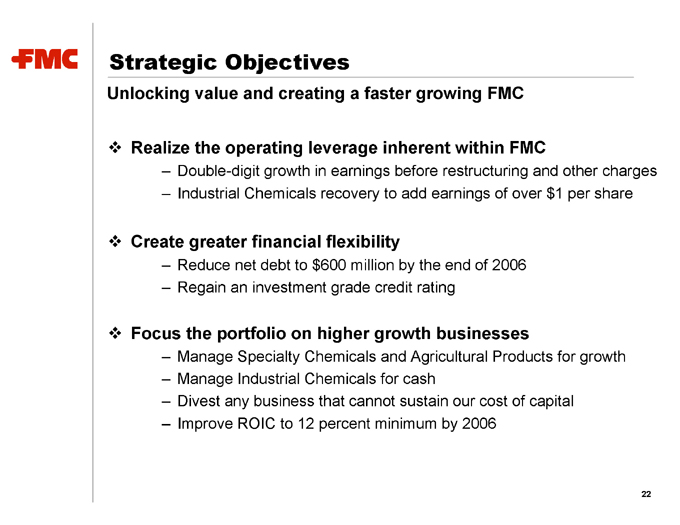
Strategic Objectives
Unlocking value and creating a faster growing FMC
Realize the operating leverage inherent within FMC
Double-digit growth in earnings before restructuring and other charges
Industrial Chemicals recovery to add earnings of over $1 per share
Create greater financial flexibility
Reduce net debt to $600 million by the end of 2006
Regain an investment grade credit rating
Focus the portfolio on higher growth businesses
Manage Specialty Chemicals and Agricultural Products for growth
Manage Industrial Chemicals for cash
Divest any business that cannot sustain our cost of capital
Improve ROIC to 12 percent minimum by 2006
22

FMC Corporation