Exhibit 99.1
FMC Corporation
Green River Analyst Meeting
July 14, 2004
Disclaimer
Safe Harbor Statement under the Private Securities Litigation Reform Act of 1995
These slides and the accompanying presentation contain “forward-looking statements” that represent management’s best judgment as of the date hereof based on information currently available. Actual results of the Company may differ materially from those contained in the forward-looking statements.
Additional information concerning factors that may cause results to differ materially from those in the forward-looking statements is contained in the Company’s periodic reports filed under the Securities Exchange Act of 1934, as amended.
The Company undertakes no obligation to update or revise these forward-looking statements to reflect new events or uncertainties.
1
Use of Non-GAAP Terms
These slides contain certain “non-GAAP financial terms” which are defined below and on FMC’s Investor Relations web site (http://ir.fmc.com) in the Glossary of Financial Terms section. In addition, in the Conference Calls and Presentations section of the web site, we have provided reconciliations of non-GAAP terms to the closest GAAP term. Lastly, these slides contain references to segment financial items which are presented in detail in Note 19 of FMC’s 2003 Form 10-K.
EBITDA (Earnings Before Interest, Taxes, Depreciation and Amortization) is the sum of Income (loss) from continuing operations before income taxes and cumulative effect of change in accounting principle and Depreciation and Amortization.
EBITDA Margin is the quotient of EBITDA (defined above) and Revenue.
ROIC (Return on Invested Capital) is the sum of Earnings from continuing operations before restructuring and other charges (gains) and after-tax Interest expense divided by the sum of Short-term debt, Current portion of long-term debt, Long-term debt and Total shareholders’ equity.
2
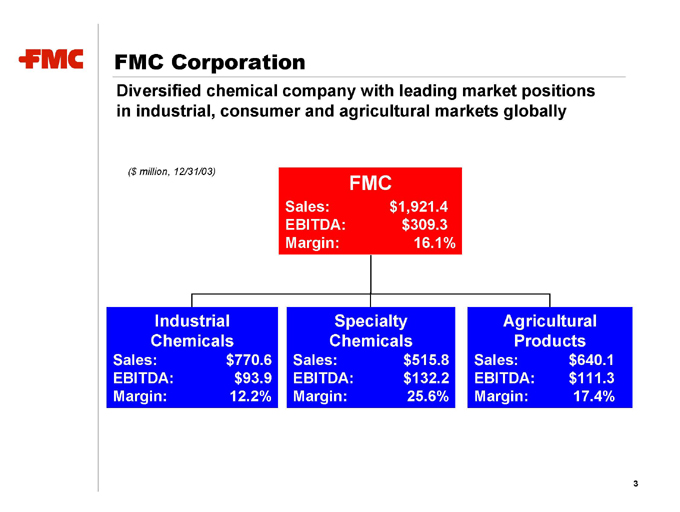
FMC Corporation
Diversified chemical company with leading market positions in industrial, consumer and agricultural markets globally
($ million, 12/31/03)
FMC
Sales: $1,921.4 EBITDA: $309.3 Margin: 16.1%
Industrial Chemicals
Sales: $770.6 EBITDA: $93.9 Margin: 12.2%
Specialty Chemicals
Sales: $515.8 EBITDA: $132.2 Margin: 25.6%
Agricultural Products
Sales: $640.1 EBITDA: $111.3 Margin: 17.4%
3
FMC Strengths
Leading market positions
Global presence
Diversified business mix and high-quality customer base
Diversified and integrated cost structure
Focused R&D and strong applications expertise
Proven management with extensive industry experience
4
Strategic Objectives
Unlocking value and creating a faster growing FMC
Realize the operating leverage inherent within FMC
Double-digit growth in earnings before restructuring and other charges
Industrial Chemicals recovery to add earnings of over $1 per share
Create greater financial flexibility
Reduce Net debt to $600M by end of 2006
Regain an investment grade credit rating
Focus the portfolio on higher growth businesses
Manage Specialty Chemicals and Agricultural Products for growth
Manage Industrial Chemicals for cash
Divest any business that cannot sustain our cost of capital
Improve ROIC to 12 percent minimum by 2006
5
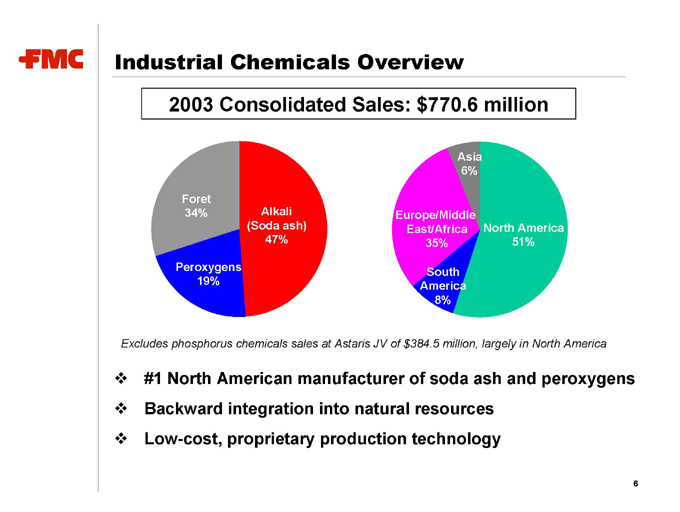
Industrial Chemicals Overview
2003 Consolidated Sales: $770.6 million
Foret 34%
Alkali (Soda ash) 47%
Peroxygens 19%
Asia 6%
Europe/Middle East/Africa 35%
North America 51%
South America 8%
Excludes phosphorus chemicals sales at Astaris JV of $384.5 million, largely in North America
#1 North American manufacturer of soda ash and peroxygens
Backward integration into natural resources
Low-cost, proprietary production technology
6
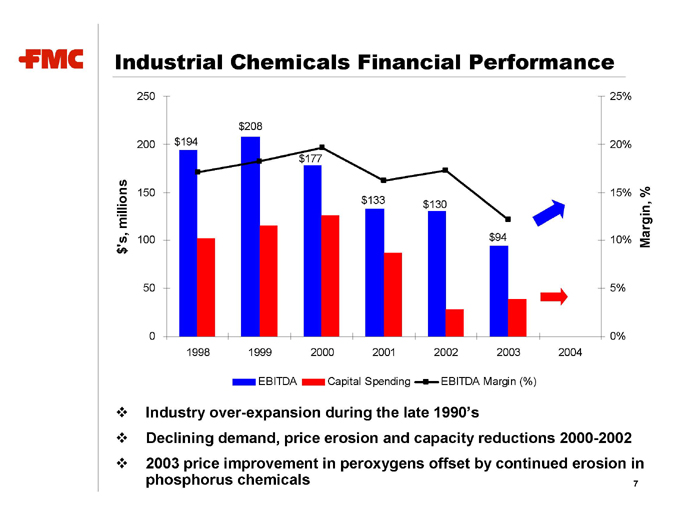
Industrial Chemicals Financial Performance
$’s, millions
250 200 150 100 50 0
$194 $208 $177 $133 $130 $94
1998 1999 2000 2001 2002 2003 2004
25% 20% 15% 10% 5% 0%
Margin, %
EBITDA Capital Spending EBITDA Margin (%)
Industry over-expansion during the late 1990’s
Declining demand, price erosion and capacity reductions 2000-2002
2003 price improvement in peroxygens offset by continued erosion in phosphorus chemicals
7
Alkali Chemicals Division
Agenda:
Background China Demand Supply Pricing FMC Strengths Summary
8
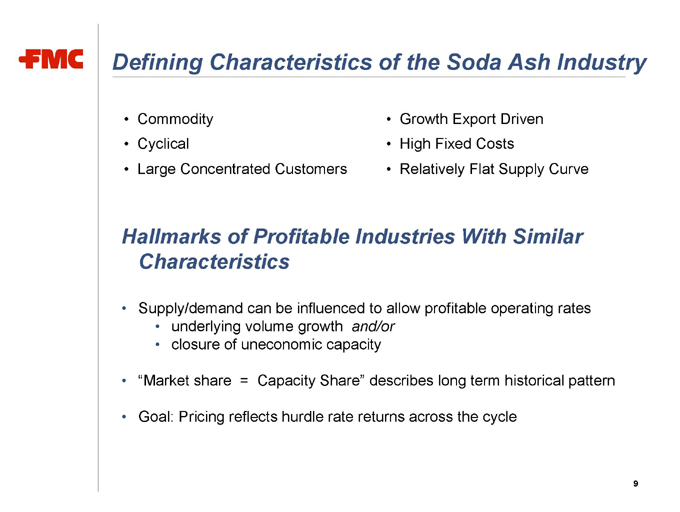
Defining Characteristics of the Soda Ash Industry
Commodity
Cyclical
Large Concentrated Customers
Growth Export Driven
High Fixed Costs
Relatively Flat Supply Curve
Hallmarks of Profitable Industries With Similar Characteristics
Supply/demand can be influenced to allow profitable operating rates
underlying volume growth and/or
closure of uneconomic capacity
“Market share = Capacity Share” describes long term historical pattern
Goal: Pricing reflects hurdle rate returns across the cycle
9
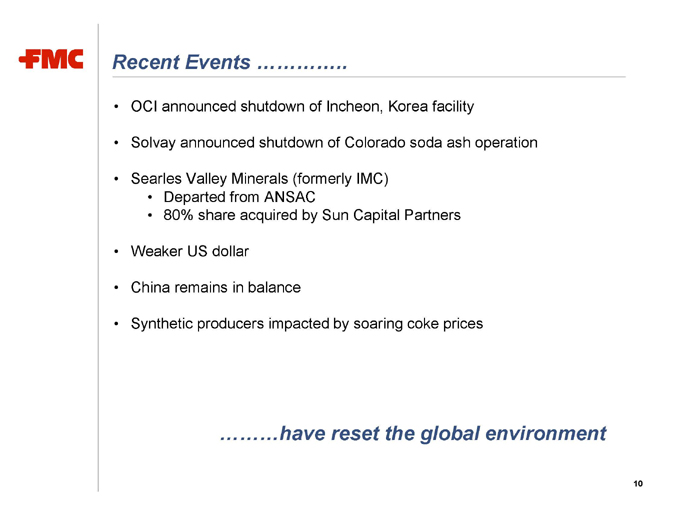
Recent Events ...............
OCI announced shutdown of Incheon, Korea facility
Solvay announced shutdown of Colorado soda ash operation
Searles Valley Minerals (formerly IMC)
Departed from ANSAC
80% share acquired by Sun Capital Partners
Weaker US dollar
China remains in balance
Synthetic producers impacted by soaring coke prices
......... have reset the global environment
10
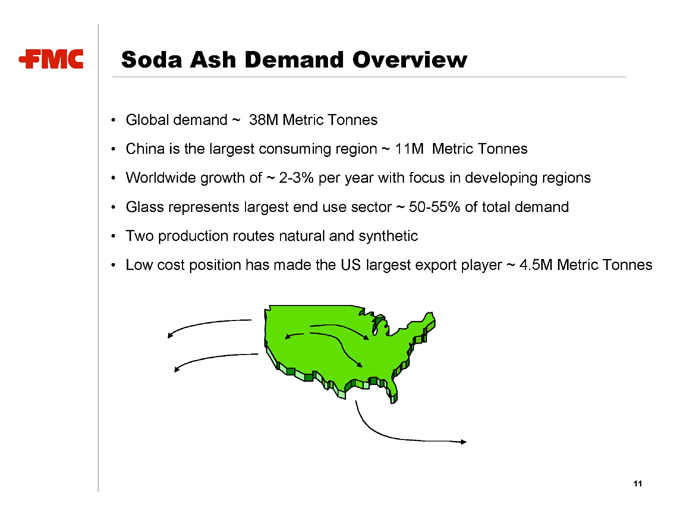
Soda Ash Demand Overview
Global demand ~ 38M Metric Tonnes
China is the largest consuming region ~ 11M Metric Tonnes
Worldwide growth of ~ 2-3% per year with focus in developing regions
Glass represents largest end use sector ~ 50-55% of total demand
Two production routes natural and synthetic
Low cost position has made the US largest export player ~ 4.5M Metric Tonnes
11
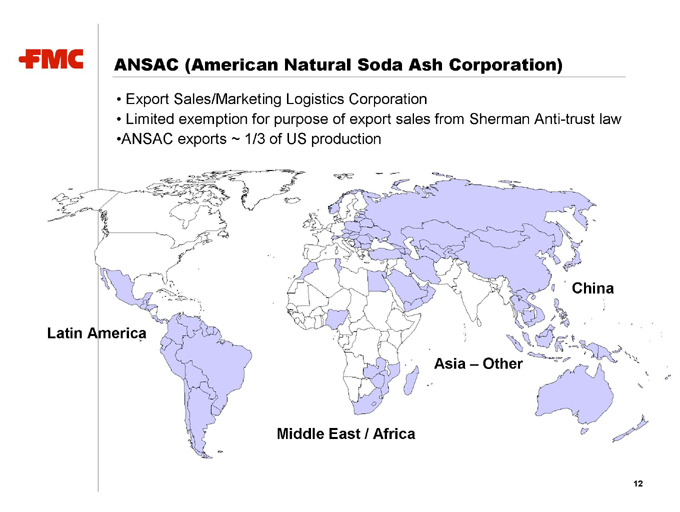
ANSAC (American Natural Soda Ash Corporation)
Export Sales/Marketing Logistics Corporation
Limited exemption for purpose of export sales from Sherman Anti-trust law
ANSAC exports ~ 1/3 of US production
Latin America
Middle East / Africa
Asia – Other
China
12
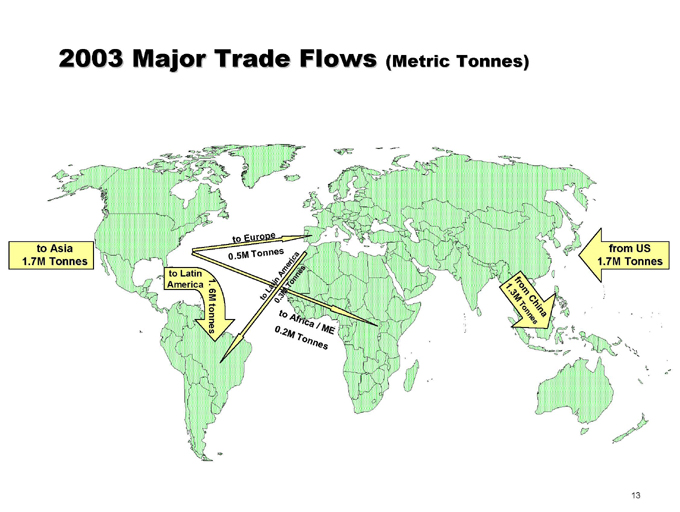
2003 Major Trade Flows (Metric Tonnes)
to Asia 1.7M Tonnes
to Latin America
1. 6M tonnes
to Europe
0.5M Tonnes
to Latin America
0.3M Tonnes
to Africa / ME
0.2M Tonnes
from China
1.3M Tonnes
from US
1.7M Tonnes
13

2003 Global Market Overview / Trade Flows
ANSAC – Land
North Western Asia Latin
America Europe China (ex. China) America
% of Global Demand 17% 17% 28% 10% 7%
Market Growth—% pa 0-1% 0-1% 7-8% 2-3% 2-3%
Net Exports/ 4.3 (0.6) 1.0 (2.8) (2.0)
(Imports) – MT
U.S. Share—% 100% 7% 3% 35% 64%
14
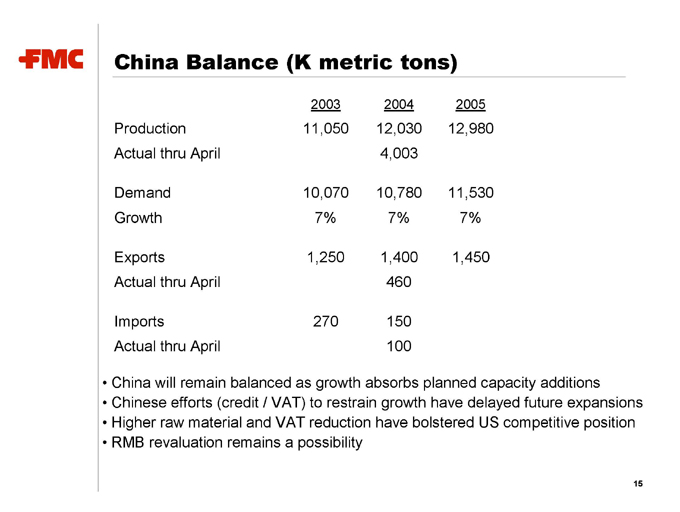
China Balance (K metric tons)
2003 2004 2005
Production 11,050 12,030 12,980
Actual thru April 4,003
Demand 10,070 10,780 11,530
Growth 7% 7% 7%
Exports 1,250 1,400 1,450
Actual thru April 460
Imports 270 150
Actual thru April 100
China will remain balanced as growth absorbs planned capacity additions Chinese efforts (credit / VAT) to restrain growth have delayed future expansions Higher raw material and VAT reduction have bolstered US competitive position RMB revaluation remains a possibility
15
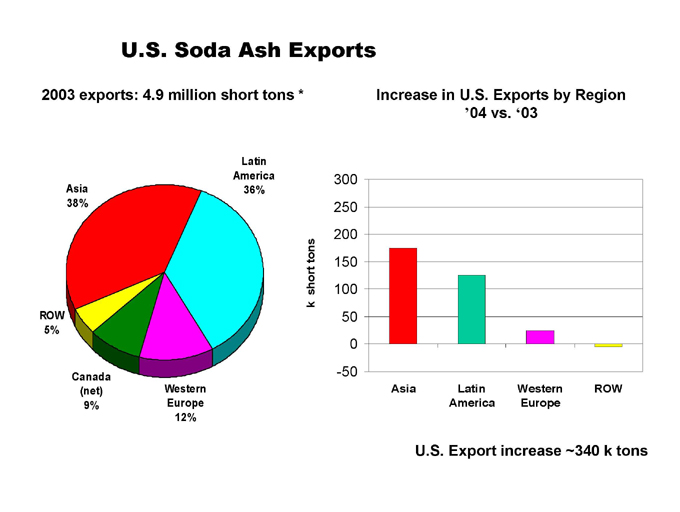
U.S. Soda Ash Exports
2003 exports: 4.9 million short tons *
Increase in U.S. Exports by Region ’04 vs. ‘03
Latin America 36%
Asia 38%
ROW 5%
Canada (net) 9%
Western Europe 12%
k short tons
300 250 200 150 100 50 0 -50
Asia Latin Western ROW
America Europe
U.S. Export increase ~340 k tons
Opportunity for Higher Export Prices and Volumes Exists
All synthetic producers facing higher costs due to soaring coke prices China supply/demand will remain in balance Higher ocean transport costs need to be recovered U.S. dollar relatively weak Global demand growth as:
Asian and Latin American economies recover
Functional substitution occurs as caustic soda price increases
17
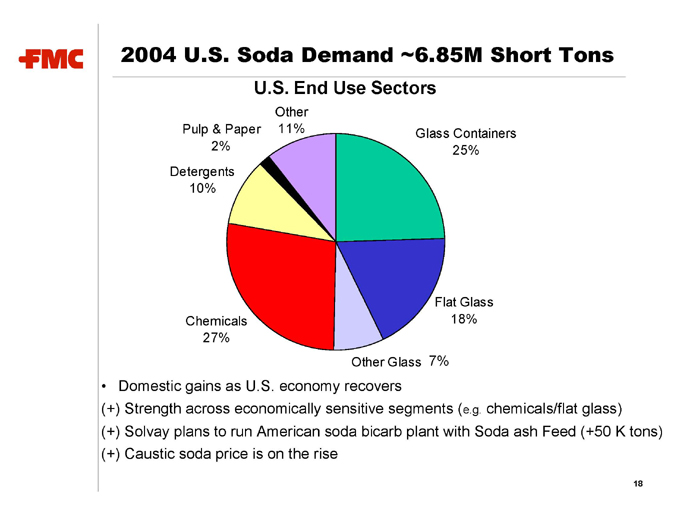
2004 U.S. Soda Demand ~6.85M Short Tons
U.S. End Use Sectors
Other Glass 7%
Pulp & Paper 2%
Other 11%
Glass Containers 25%
Detergents 10%
Chemicals 27%
Flat Glass 18%
Domestic gains as U.S. economy recovers
(+) Strength across economically sensitive segments (e.g. chemicals/flat glass) (+) Solvay plans to run American soda bicarb plant with Soda ash Feed (+50 K tons) (+) Caustic soda price is on the rise
18
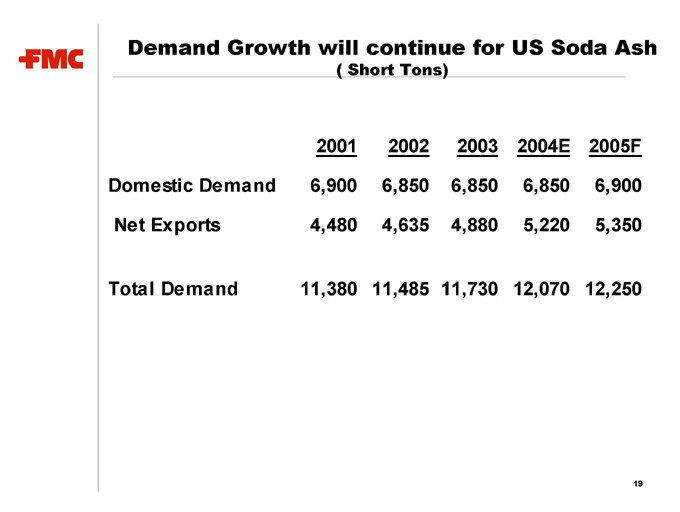
Demand Growth will continue for US Soda Ash
(Short Tons)
2001 2002 2003 2004E 2005F
Domestic Demand 6,900 6,850 6,850 6,850 6,900
Net Exports 4,480 4,635 4,880 5,220 5,350
Total Demand 11,380 11,485 11,730 12,070 12,250
19
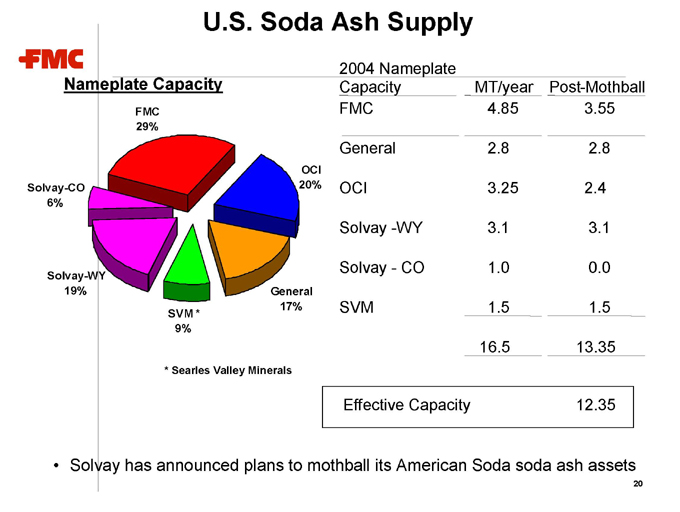
U.S. Soda Ash Supply
Nameplate Capacity
OCI 20%
FMC 29%
Solvay-CO
6%
Solvay-WY
19%
SVM * 9%
General 17%
* Searles Valley Minerals
2004 Nameplate
Capacity MT/year Post-Mothball
FMC 4.85 3.55
General 2.8 2.8
OCI 3.25 2.4
Solvay -WY 3.1 3.1
Solvay—CO 1.0 0.0
SVM 1.5 1.5
16.5 13.35
Effective Capacity 12.35
Solvay has announced plans to mothball its American Soda soda ash assets
20
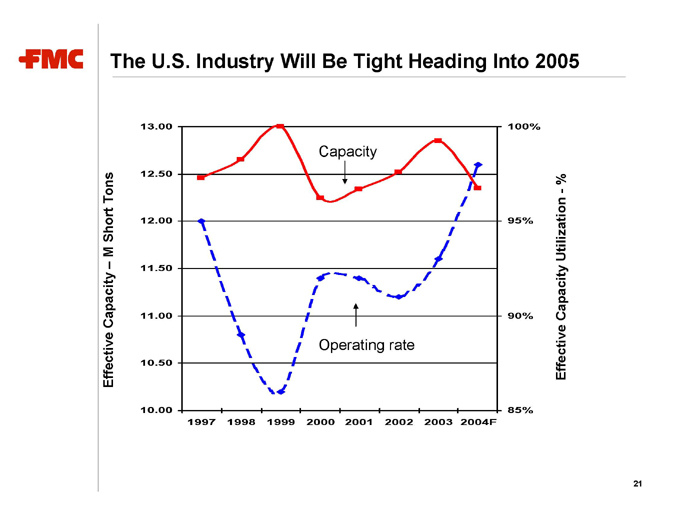
The U.S. Industry Will Be Tight Heading Into 2005
Effective Capacity – M Short Tons
13.00 12.50 12.00 11.50 11.00 10.50 10.00
1997 1998 1999 2000 2001 2002 2003 2004F
100% 95% 90% 85%
Effective Capacity Utilization—%
Capacity
Operating rate
21
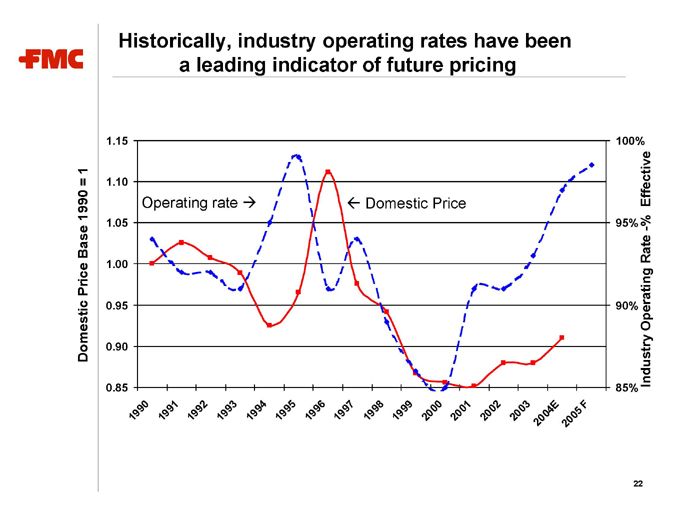
Historically, industry operating rates have been a leading indicator of future pricing
Domestic Price Base 1990 = 1
1.15 1.10 1.05 1.00 0.95 0.90 0.85
1990
1991
1992
1993
1994
1995
1996
1997
1998
1999
2000
2001
2002
2003
2004E
2005F
100%
95%
90%
85%
Industry Operating Rate -% Effective
Operating rate
Domestic Price
22
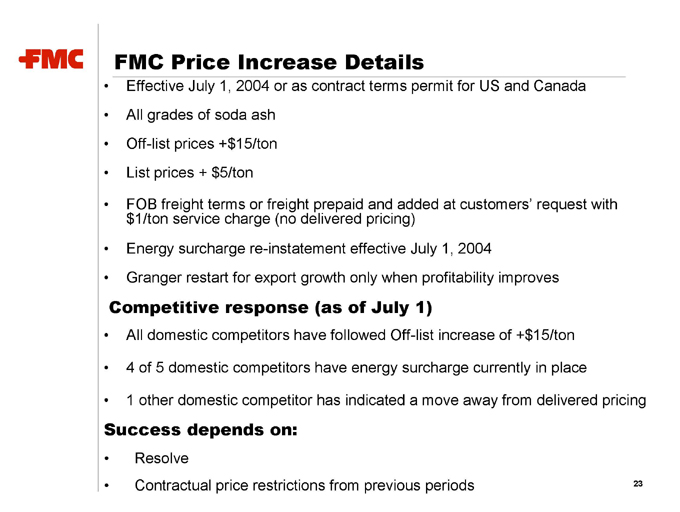
FMC Price Increase Details
Effective July 1, 2004 or as contract terms permit for US and Canada
All grades of soda ash
Off-list prices +$15/ton
List prices + $5/ton
FOB freight terms or freight prepaid and added at customers’ request with $1/ton service charge (no delivered pricing)
Energy surcharge re-instatement effective July 1, 2004
Granger restart for export growth only when profitability improves
Competitive response (as of July 1)
All domestic competitors have followed Off-list increase of +$15/ton 4 of 5 domestic competitors have energy surcharge currently in place 1 other domestic competitor has indicated a move away from delivered pricing
Success depends on:
Resolve
Contractual price restrictions from previous periods
23
Alkali Chemicals Division Key Product Offerings
High Volume
High Value (i.e. niche)
Other
Soda Ash
Sodium Sesquicarbonate Sodium Bicarbonate Light Density Soda Ash
Chemical Caustic Soda
24
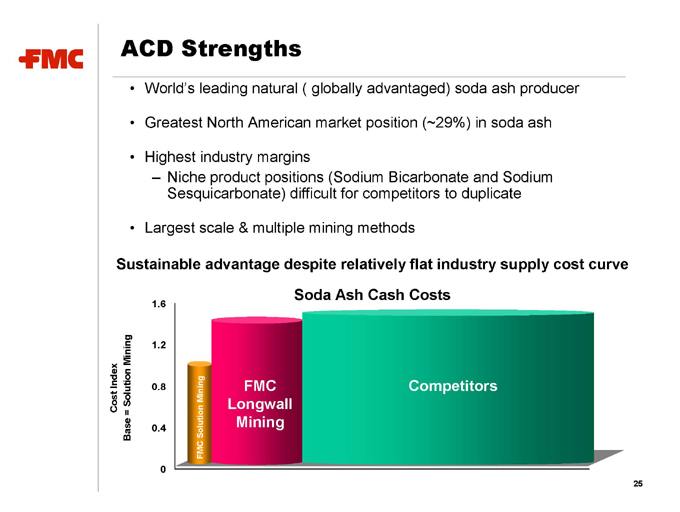
ACD Strengths
World’s leading natural ( globally advantaged) soda ash producer
Greatest North American market position (~29%) in soda ash
Highest industry margins
Niche product positions (Sodium Bicarbonate and Sodium Sesquicarbonate) difficult for competitors to duplicate
Largest scale & multiple mining methods
Sustainable advantage despite relatively flat industry supply cost curve
Soda Ash Cash Costs
Cost Index
Base = Solution Mining
1.6 1.2 0.8 0.4 0
FMC Solution Mining
FMC Longwall Mining
Competitors
25
Alkali Chemicals Division—Summary
U.S. industry operating at full effective capacity
7% growth in U.S. export demand
History shows operating rate is a leading indicator for price
Financial pressure worldwide is leading to a rising price environment
Raw material and energy costs
Freight (rail and/or ocean)
Chinese governmental influence (e.g. credit, VAT)
Global Utilization is rising
FMC is positioned to lead the industry to higher profitability
Low cost US producer
Domestic price increase
Export price recovery
Incremental capacity option exists at FMC Granger
Lowest cost, coal based, solution mined capacity expansion
Capacity variable for export growth
26