Exhibit 99.1
FMC Corporation
Marketing Trip
Cleveland, Ohio
November 10, 2004
W. Kim Foster
SVP and Chief Financial Officer
Disclaimer
Safe Harbor Statement under the Private Securities Litigation Reform Act of 1995
These slides and the accompanying presentation contain “forward-looking statements” that represent management’s best judgment as of the date hereof based on information currently available. Actual results of the Company may differ materially from those contained in the forward-looking statements.
Additional information concerning factors that may cause results to differ materially from those in the forward-looking statements is contained in the Company’s periodic reports filed under the Securities Exchange Act of 1934, as amended.
The Company undertakes no obligation to update or revise these forward-looking statements to reflect new events or uncertainties.
1
Use of Non-GAAP Terms
These slides contain certain “non-GAAP financial terms” which are defined below and on FMC’s Investor Relations web site (http://ir.fmc.com) in the Glossary of Financial Terms section. In addition, in the Conference Calls and Presentations section of the web site, we have provided reconciliations of non-GAAP terms to the closest GAAP term. Lastly, these slides contain references to segment financial items which are presented in detail in Note 19 of FMC’s 2003 Form 10-K.
EBITDA (Earnings Before Interest, Taxes, Depreciation and Amortization) is the sum of Income (loss) from continuing operations before income taxes and cumulative effect of change in accounting principle and Depreciation and Amortization.
EBITDA Margin is the quotient of EBITDA (defined above) and Revenue.
ROIC (Return on Invested Capital) is the sum of Earnings from continuing operations before restructuring and other charges (gains) and after-tax Interest expense divided by the sum of Short-term debt, Current portion of long-term debt, Long-term debt and Total shareholders’ equity.
Free Cash Flow is the sum of Cash provided (required) by operating activities and Cash required by discontinued operations less Cash required by investing activities.
2
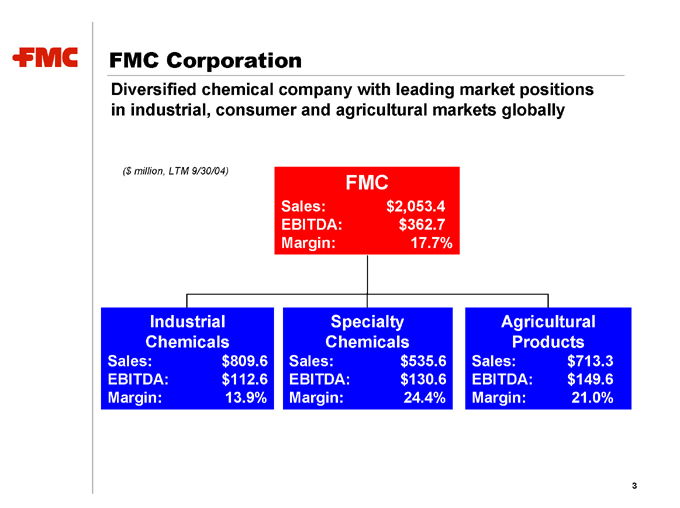
FMC Corporation
Diversified chemical company with leading market positions in industrial, consumer and agricultural markets globally
($ million, LTM 9/30/04)
FMC
Sales: $2,053.4
EBITDA: $362.7
Margin: 17.7%
Industrial Chemicals Specialty Chemicals Agricultural Products
Sales: $809.6
Sales: $535.6
Sales: $713.3
EBITDA: $112.6
EBITDA: $130.6
EBITDA: $149.6
Margin: 13.9%
Margin: 24.4%
Margin: 21.0%
3
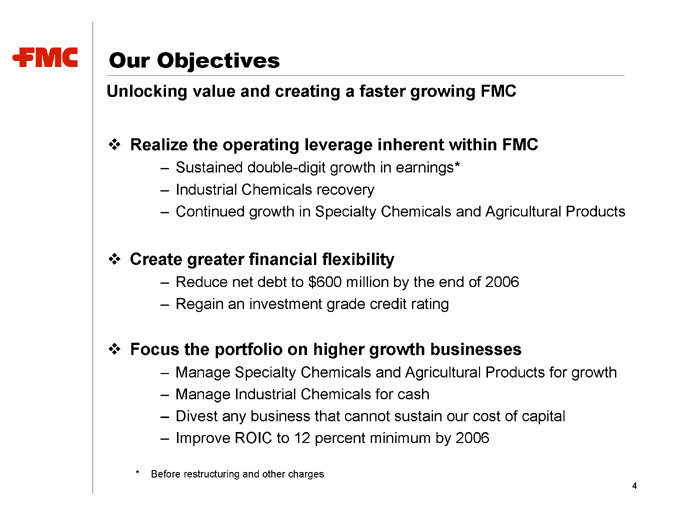
Our Objectives
Unlocking value and creating a faster growing FMC
Realize the operating leverage inherent within FMC
Sustained double-digit growth in earnings*
Industrial Chemicals recovery
Continued growth in Specialty Chemicals and Agricultural Products
Create greater financial flexibility
Reduce net debt to $600 million by the end of 2006
Regain an investment grade credit rating
Focus the portfolio on higher growth businesses
Manage Specialty Chemicals and Agricultural Products for growth
Manage Industrial Chemicals for cash
Divest any business that cannot sustain our cost of capital
Improve ROIC to 12 percent minimum by 2006
* Before restructuring and other charges
4
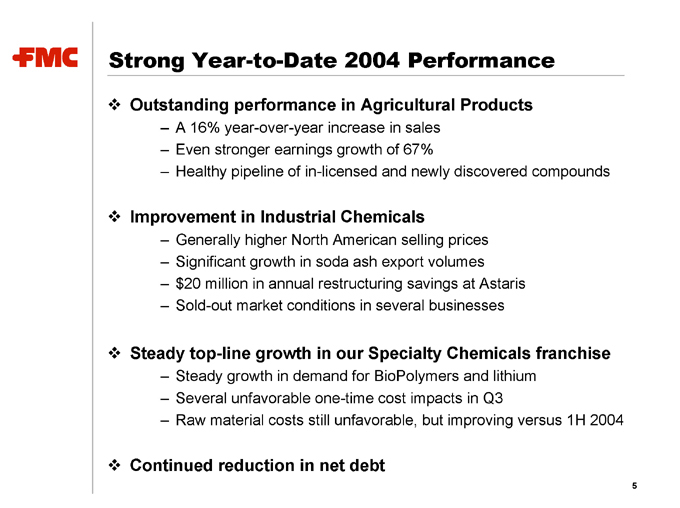
Strong Year-to-Date 2004 Performance
Outstanding performance in Agricultural Products
A 16% year-over-year increase in sales
Even stronger earnings growth of 67%
Healthy pipeline of in-licensed and newly discovered compounds
Improvement in Industrial Chemicals
Generally higher North American selling prices
Significant growth in soda ash export volumes
$20 million in annual restructuring savings at Astaris
Sold-out market conditions in several businesses
Steady top-line growth in our Specialty Chemicals franchise
Steady growth in demand for BioPolymers and lithium
Several unfavorable one-time cost impacts in Q3
Raw material costs still unfavorable, but improving versus 1H 2004
Continued reduction in net debt
5
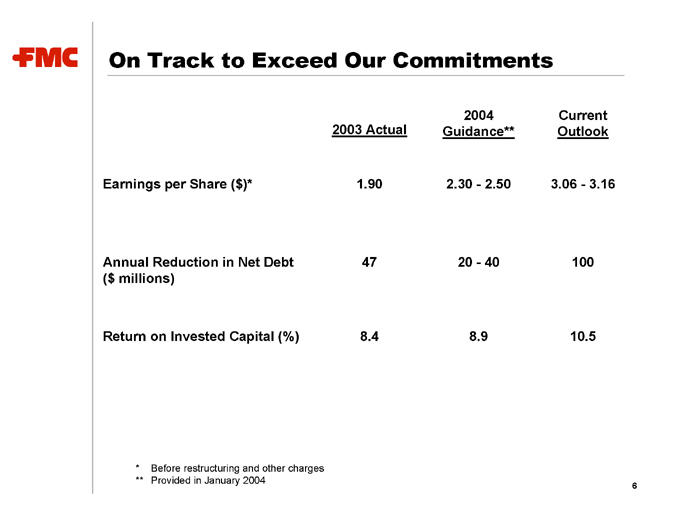
On Track to Exceed Our Commitments
2003 Actual 2004 Guidance** Current Outlook
Earnings per Share ($)* 1.90 2.30—2.50 3.06—3.16
Annual Reduction in Net Debt ($ millions) 47 20—40 100
Return on Invested Capital (%) 8.4 8.9 10.5
* Before restructuring and other charges
** Provided in January 2004
6
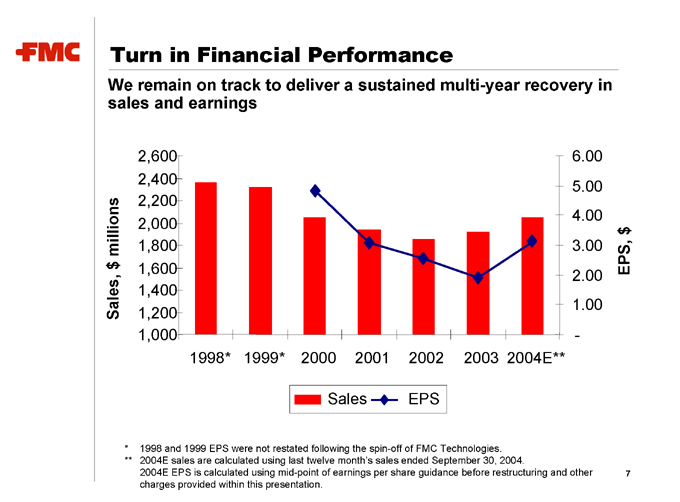
Turn in Financial Performance
We remain on track to deliver a sustained multi-year recovery in sales and earnings
Sales, $ millions
2,600 2,400 2,200 2,000 1,800 1,600 1,400 1,200 1,000
1998* 1999* 2000 2001 2002 2003 2004E**
6.00 5.00 4.00 3.00 2.00 1.00 -
EPS, $
Sales
EPS
* 1998 and 1999 EPS were not restated following the spin-off of FMC Technologies.
** 2004E sales are calculated using last twelve month’s sales ended September 30, 2004.
2004E EPS is calculated using mid-point of earnings per share guidance before restructuring and other charges provided within this presentation.
7
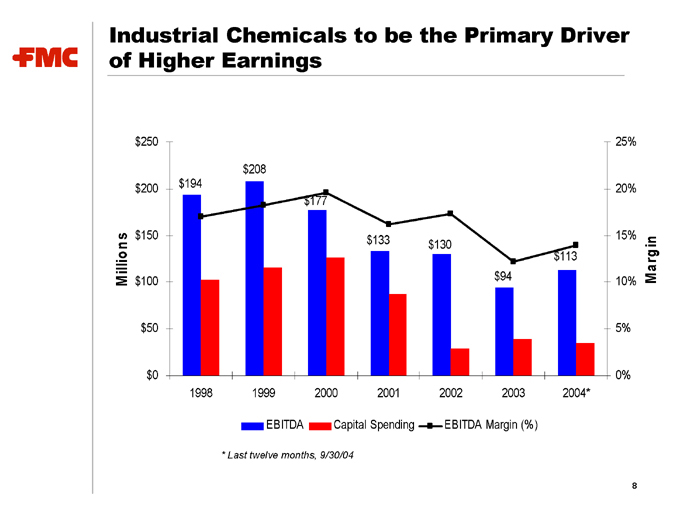
Industrial Chemicals to be the Primary Driver of Higher Earnings
Millions $250 $200 $150 $100 $50 $0
1998 1999 2000 2001 2002 2003 2004*
25% 20% 15% 10% 5% 0%
Margin
EBITDA Capital Spending EBITDA Margin (%)
* Last twelve months,
9/30/04 $194 $208 $177 $133 $130 $94 $113
8
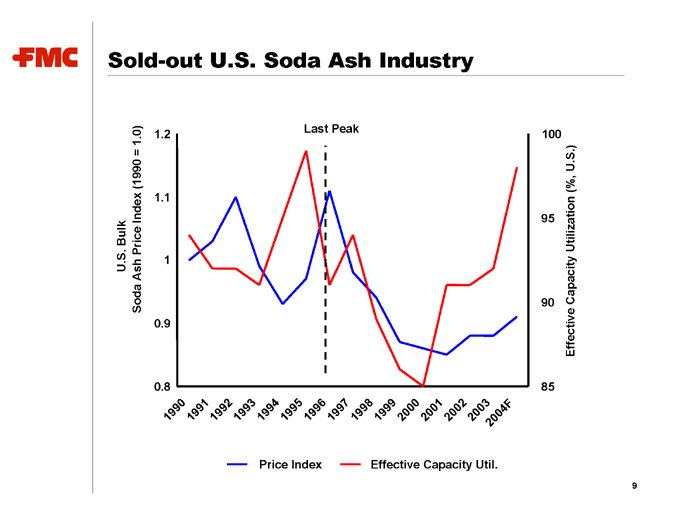
Sold-out U.S. Soda Ash Industry
U.S. Bulk
Soda Ash Price Index (1990 = 1.0)
1.2 1.1 1 0.9 0.8
Effective Capacity Utilization (%, U.S.)
100 95 90 85
1990 1991 1992 1993 1994 1995 1996 1997 1998 1999 2000 2001 2002 2003 2004F
Price Index
Effective Capacity Util.
Last Peak
9
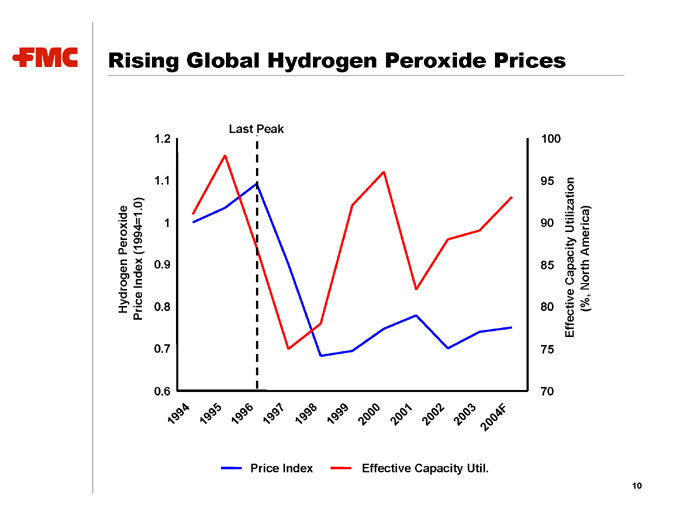
Rising Global Hydrogen Peroxide Prices
Hydrogen Peroxide Price Index (1994=1.0)
1.2 1.1 1 0.9 0.8 0.7 0.6
Last Peak
Effective Capacity Utilization (%, North America)
100 95 90 85 80 75 70
1994 1995 1996 1997 1998 1999 2000 2001 2002 2003 2004F
Price Index
Effective Capacity Util.
10
Turnaround In Phosphorus Chemicals
Domestic improvement resulting from Astaris restructuring
Annualized savings of $40 million are in place (a $20 million benefit to FMC’s operating profit)
Astaris capacity reductions have tightened domestic supply
Price increases of 4-7 percent are expected for 2005, which will be partially offset by higher input costs
Sold-out European STPP market
Driven by capacity closures and decreased Chinese imports
Prices at Foret have risen over 10 percent versus the prior year
Astaris deleveraging to impact cash flow favorably
Astaris is debt free, and keepwell payments are no longer anticipated
Refinancing of Astaris in late 2004 or 2005
Possible dividend of cash back to FMC post an Astaris refinancing
11
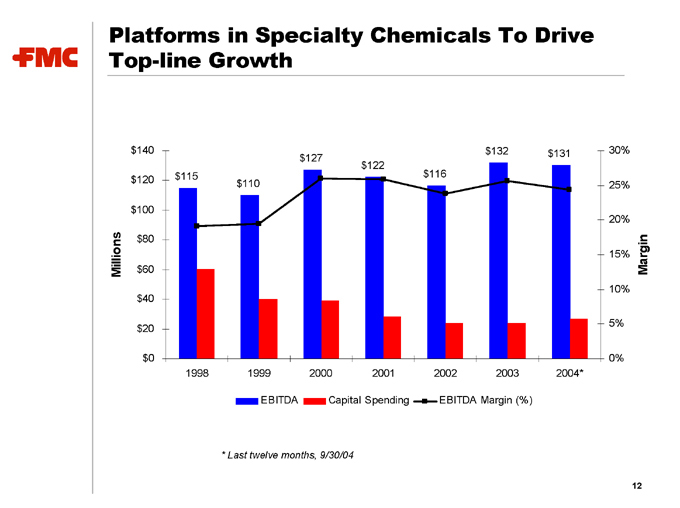
Platforms in Specialty Chemicals To Drive Top-line Growth
Millions $140 $120 $100 $80 $60 $40 $20 $0
1998 1999 2000 2001 2002 2003 2004*
Margin
30% 25% 20% 15% 10% 5% 0%
$115 $110 $127 $122 $116 $132 $131
EBITDA
Capital Spending
EBITDA Margin (%)
* Last twelve months, 9/30/04
12

Strong Market Positions In Growing Markets
Leading biopolymers supplier
Strong franchises in food ingredients and pharmaceutical formulation markets
End-market growth of 3-6 percent per year
Global leader in all three product lines
Leading lithium producer in high value markets
Specialty polymers: 27% of sales growing at 3-6%
Pharmaceutical synthesis: 25% of sales growing at 7-9%
Energy storage: 17% of sales growing at rates over 10%
13
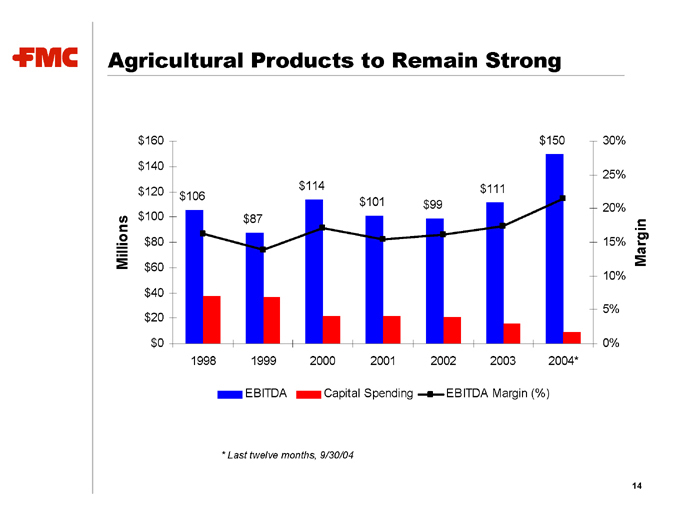
Agricultural Products to Remain Strong
Millions
$160 $140 $120 $100 $80 $60 $40 $20 $0
1998 1999 2000 2001 2002 2003 2004*
Margin
30% 25% 20% 15% 10% 5% 0%
$106 $87 $114 $101 $99 $111 $150
EBITDA
Capital Spending
EBITDA Margin (%)
* Last twelve months, 9/30/04
14
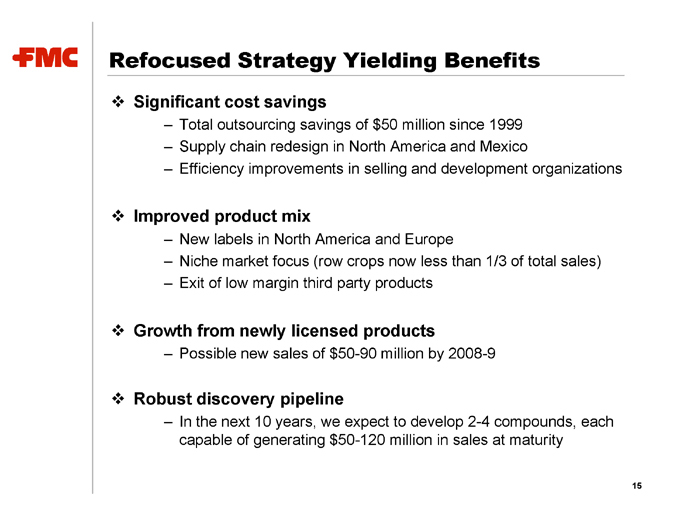
Refocused Strategy Yielding Benefits
Significant cost savings
Total outsourcing savings of $50 million since 1999
Supply chain redesign in North America and Mexico
Efficiency improvements in selling and development organizations
Improved product mix
New labels in North America and Europe
Niche market focus (row crops now less than 1/3 of total sales)
Exit of low margin third party products
Growth from newly licensed products
Possible new sales of $50-90 million by 2008-9
Robust discovery pipeline
In the next 10 years, we expect to develop 2-4 compounds, each capable of generating $50-120 million in sales at maturity
15
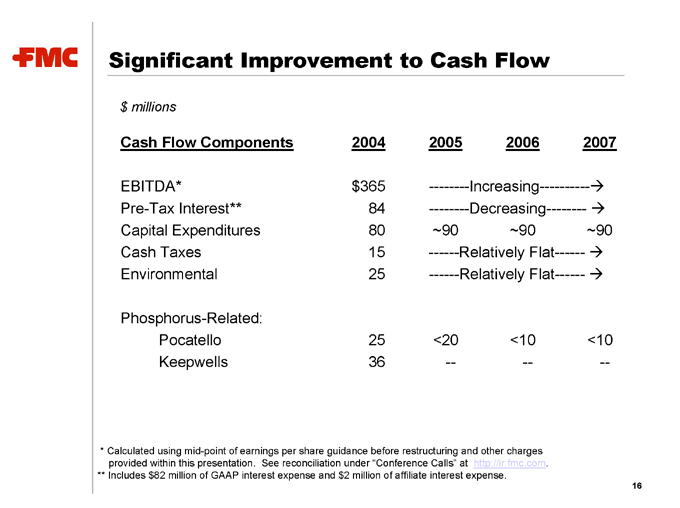
Significant Improvement to Cash Flow $ millions
Cash Flow Components 2004 2005 2006 2007
EBITDA* $365 Increasing
Pre-Tax Interest** 84 Decreasing
Capital Expenditures 80 ~90 ~90 ~90
Cash Taxes 15 Relatively Flat
Environmental 25 Relatively Flat
Phosphorus-Related:
Pocatello 25 <20 <10 <10
Keepwells 36 — — —
* Calculated using mid-point of earnings per share guidance before restructuring and other charges provided within this presentation. See reconciliation under “Conference Calls” at http://ir.fmc.com. ** Includes $82 million of GAAP interest expense and $2 million of affiliate interest expense.
16
In Summary
Great businesses, each generating EBITDA of over $100 million
Industrial Chemicals earnings are currently $50 million below mid-cycle and $100 million below peak
Steady growth in the balance of the portfolio
Low capital expenditure requirements Significantly improving free cash flow
17
FMC Corporation