Exhibit 99.1
FMC Corporation
Bank of America Conference Call
November 12, 2004
Ted Butz
Vice President and Group Manager, Specialty Chemicals
Disclaimer
Safe Harbor Statement under the Private Securities Litigation Reform Act of 1995
These slides and the accompanying presentation contain “forward-looking statements” that represent management’s best judgment as of the date hereof based on information currently available. Actual results of the Company may differ materially from those contained in the forward-looking statements.
Additional information concerning factors that may cause results to differ materially from those in the forward-looking statements is contained in the Company’s periodic reports filed under the Securities Exchange Act of 1934, as amended.
The Company undertakes no obligation to update or revise these forward-looking statements to reflect new events or uncertainties.
1
Use of Non-GAAP Terms
These slides contain certain “non-GAAP financial terms” which are defined below and on FMC’s Investor Relations web site (http://ir.fmc.com) in the Glossary of Financial Terms section. In addition, at the end of this presentation, we have provided reconciliations of non-GAAP terms to the closest GAAP term.
EBITDA (Earnings Before Interest, Taxes, Depreciation and Amortization) is the sum of Income (loss) from continuing operations before income taxes and cumulative effect of change in accounting principle and Depreciation and Amortization.
EBITDA Margin is the quotient of EBITDA (defined above) and Revenue.
Segment EBITDA (Earnings Before Interest, Taxes, Depreciation and Amortization) for a segment is the sum of Income (loss) from continuing operations before income taxes and cumulative effect of change in accounting principle for that segment and Depreciation and Amortization for that segment.
Segment EBITDA Margin is the quotient of Segment EBITDA (defined above) and Revenue for that segment.
2
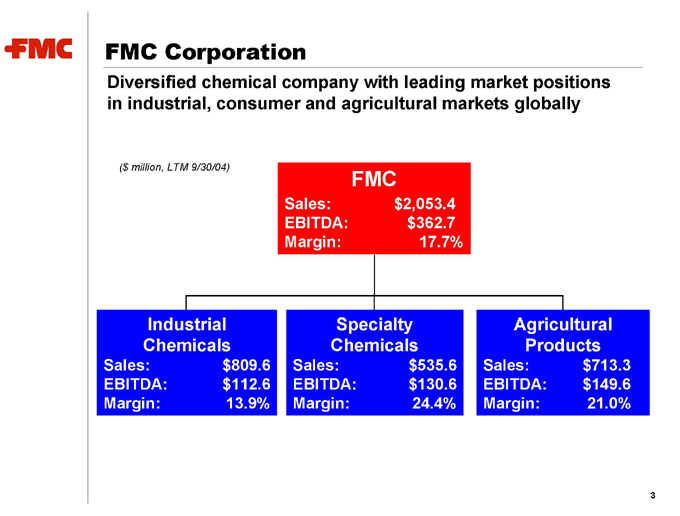
FMC Corporation
Diversified chemical company with leading market positions in industrial, consumer and agricultural markets globally
($ million, LTM 9/30/04)
FMC
Sales: $2,053.4
EBITDA: $362.7
Margin: 17.7%
Industrial Chemicals
Sales: $809.6
EBITDA: $112.6
Margin: 13.9%
Agricultural Products
Sales: $713.3
EBITDA: $149.6
Margin: 21.0%
Specialty Chemicals
Sales: $535.6
EBITDA: $130.6
Margin: 24.4%
3
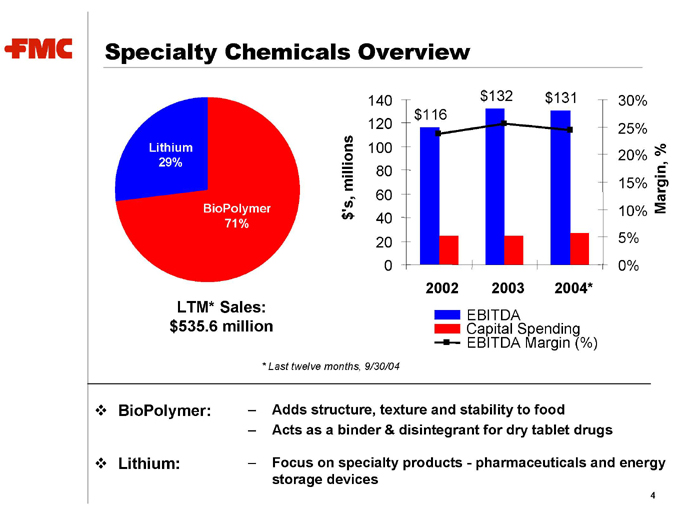
Specialty Chemicals Overview
LTM* Sales:
$535.6 million
2002
2003
2004*
$’s, millions
0%
5%
10%
15%
20%
25%
30%
Margin, %
EBITDA
Capital Spending
EBITDA Margin (%)
$116
$132
$131
0
20
40
60
80
100
120
140
BioPolymer
71%
Lithium
29%
* Last twelve months, 9/30/04
BioPolymer: — Adds structure, texture and stability to food
— Acts as a binder & disintegrant for dry tablet drugs
Lithium: — Focus on specialty products - pharmaceuticals and energy storage devices
4
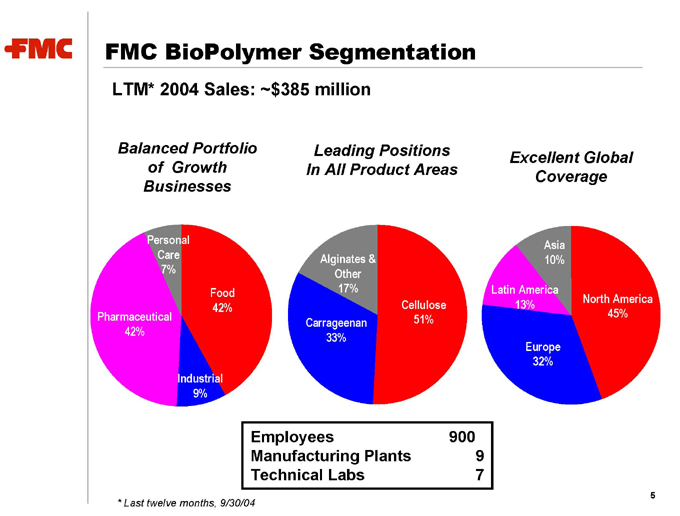
FMC BioPolymer Segmentation
LTM* 2004 Sales: ~$385 million
Balanced Portfolio of Growth Businesses
Personal Care
7%
Food
42%
Industrial
9%
Pharmaceutical
42%
Leading Positions In All Product Areas
Alginates & Other
17%
Carrageenan
33%
Cellulose
51%
Excellent Global Coverage
North America
45%
Europe
32%
Latin America
13%
Asia
10%
Employees 900
Manufacturing Plants 9
Technical Labs 7
* Last twelve months, 9/30/04
5
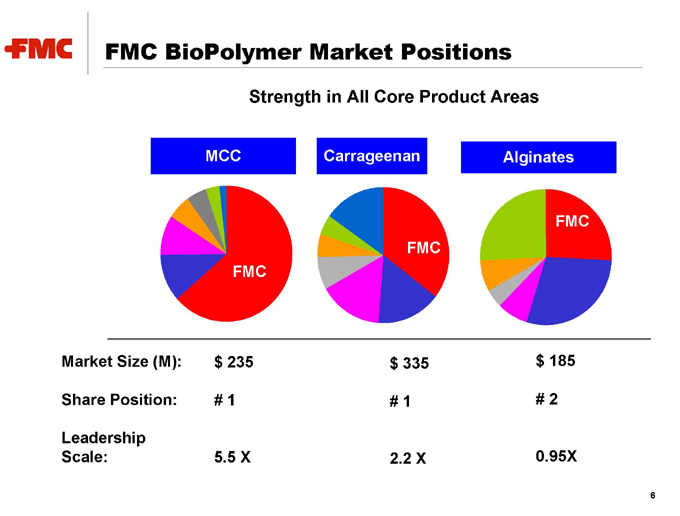
FMC BioPolymer Market Positions
Strength in All Core Product Areas
MCC
FMC
Carrageenan
FMC
Alginates
FMC
Market Size (M): $235 $335 $185
Share Position: # 1 # 1 # 2
Leadership Scale: 5.5 X 2.2 X 0.95X
6
FMC BioPolymer’s Outlook is Positive
Serving attractive end markets
Strong position with industry-driving customers
Leading product positions
Coordinated global capabilities
Proven track record of performance
7
FMC Corporation
Non-GAAP to GAAP Reconciliations
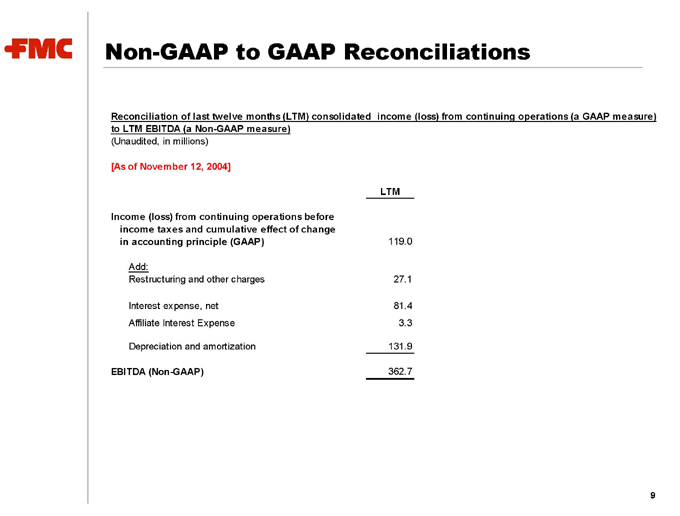
Reconciliation of last twelve months (LTM) consolidated income (loss) from continuing operations (a GAAP measure) to LTM EBITDA (a Non-GAAP measure)
(Unaudited, in millions)
[As of November 12, 2004]
LTM
Income (loss) from continuing operations before income taxes and cumulative effect of change in accounting principle (GAAP) 119.0
Add:
Restructuring and other charges 27.1
Interest expense, net 81.4
Affiliate Interest Expense 3.3
Depreciation and amortization 131.9
EBITDA (Non-GAAP) 362.7
9
Non-GAAP to GAAP Reconciliations (Cont.)
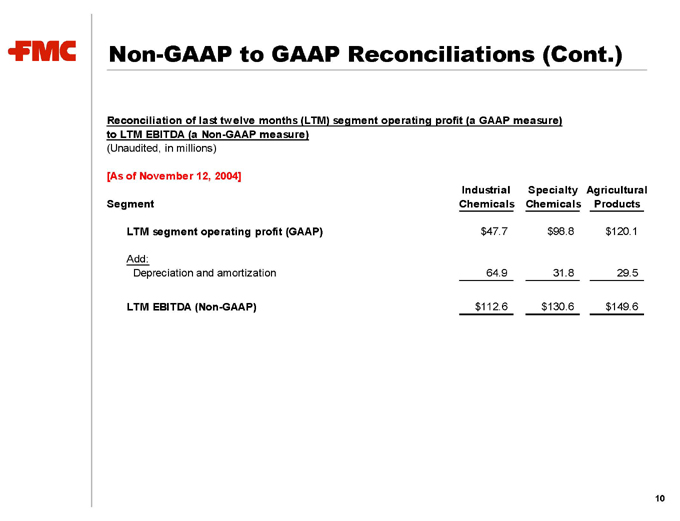
Reconciliation of last twelve months (LTM) segment operating profit (a GAAP measure) to LTM EBITDA (a Non-GAAP measure)
(Unaudited, in millions)
[As of November 12, 2004]
Segment Industrial Chemicals Specialty Chemicals Agricultural Products
LTM segment operating profit (GAAP) $47.7 $98.8 $120.1
Add:
Depreciation and amortization 64.9 31.8 29.5
LTM EBITDA (Non-GAAP) $112.6 $130.6 $149.6
10