Exhibit 99.1
FMC Corporation
Global Soda Ash Outlook E.T. Flynn
UBS Warburg
Grassroots Chemical Conference February 17, 2005
Disclaimer
Safe Harbor Statement under the Private Securities Litigation Reform Act of 1995
These slides and the accompanying presentation contain “forward-looking statements” that represent management’s best judgment as of the date hereof based on information currently available. Actual results of the Company may differ materially from those contained in the forward-looking statements.
Additional information concerning factors that may cause results to differ materially from those in the forward-looking statements is contained in the Company’s periodic reports filed under the Securities Exchange Act of 1934, as amended.
The Company undertakes no obligation to update or revise these forward-looking statements to reflect new events or uncertainties.
1
Non-GAAP Financial Terms
These slides contain certain “non-GAAP financial terms” which are defined below. In addition, we have provided reconciliations of non-GAAP terms to the closest GAAP term in the appendix of this presentation:
EBITDA (Earnings Before Interest, Taxes, Depreciation and Amortization) is the sum of Income (loss) from continuing operations before income taxes and Depreciation and Amortization.
EBITDA Margin is the quotient of EBITDA (defined above) divided by Revenue.
These slides also contain references to segment financial items which are presented in detail in Note 19 of FMC’s 2003 Form 10-K. Some of the segment financial terms are “non-GAAP financial terms” and are defined below. In addition, we have provided reconciliations of non-GAAP terms to the closest GAAP term in the appendix of this presentation:
EBITDA (Earnings Before Interest, Taxes, Depreciation and Amortization) for a segment is the sum of Income (loss) from continuing operations before income taxes for that segment and Depreciation and Amortization for that segment.
EBITDA Margin for a segment is the quotient of EBITDA (defined above) divided by Revenue for that segment.
2
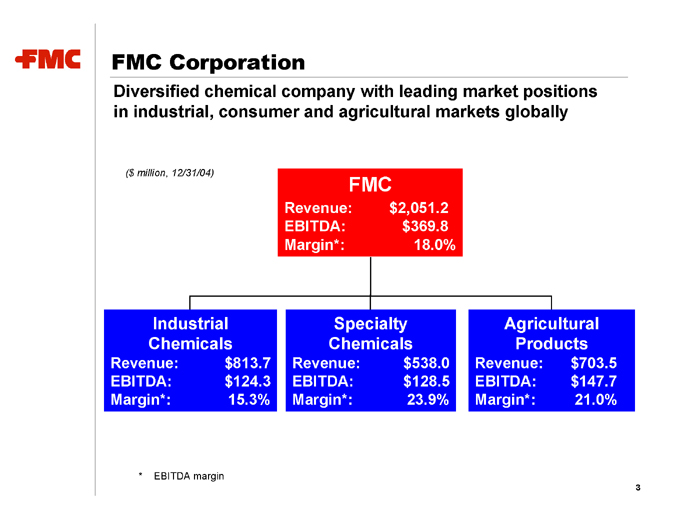
FMC Corporation
Diversified chemical company with leading market positions in industrial, consumer and agricultural markets globally
($ million, 12/31/04)
FMC
Revenue: $2,051.2 EBITDA: $369.8 Margin*: 18.0%
Industrial Chemicals
Revenue: $813.7 EBITDA: $124.3 Margin*: 15.3%
Specialty Chemicals
Revenue: $538.0 EBITDA: $128.5 Margin*: 23.9%
Agricultural Products
Revenue: $703.5 EBITDA: $147.7 Margin*: 21.0%
* EBITDA margin
3
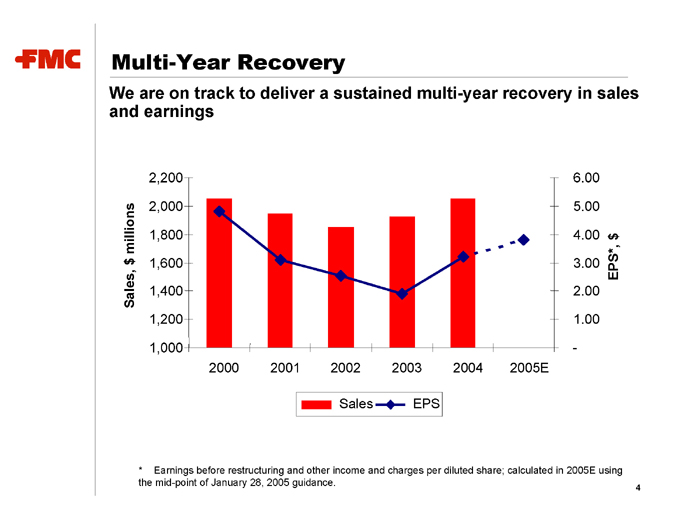
Multi-Year Recovery
We are on track to deliver a sustained multi-year recovery in sales and earnings
2,200
millions 2,000 1,800
$1,600
Sales, 1,400 1,200
1,000
2000 2001 2002 2003 2004 2005E
Sales EPS
6.00
5.00
4.00
$3.00 EPS*,
2.00
1.00
* Earnings before restructuring and other income and charges per diluted share; calculated in 2005E using the mid-point of January 28, 2005 guidance.
4
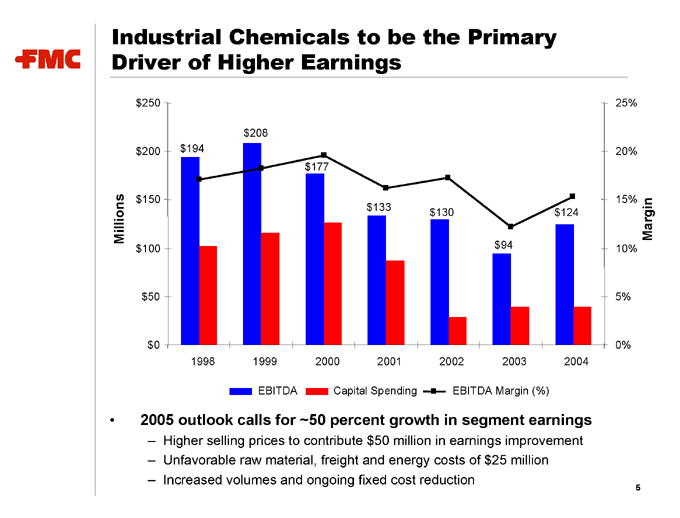
Industrial Chemicals to be the Primary Driver of Higher Earnings $250
$200
Millions $150
$100 $50 $0 $208 $194 $177
$133 $130 $124
$94
25%
20%
15% Margin
10%
5%
0%
1998 1999 2000 2001 2002 2003 2004
EBITDA Capital Spending EBITDA Margin (%)
2005 outlook calls for ~50 percent growth in segment earnings
Higher selling prices to contribute $50 million in earnings improvement Unfavorable raw material, freight and energy costs of $25 million Increased volumes and ongoing fixed cost reduction
5
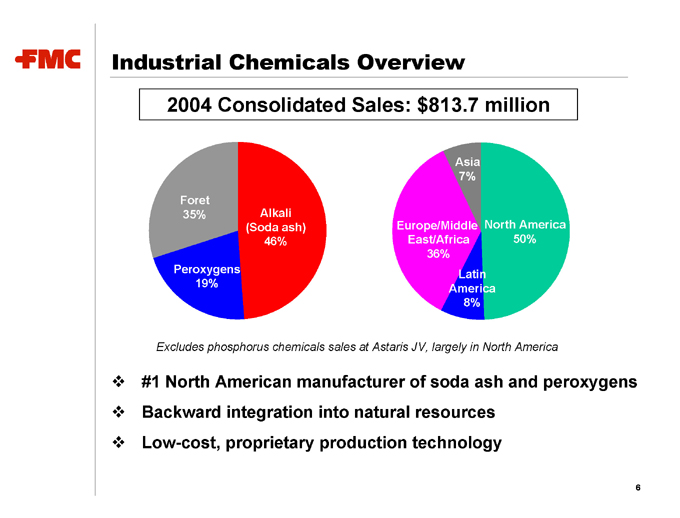
Industrial Chemicals Overview
2004 Consolidated Sales: $813.7 million
Asia 7%
Foret
35% Alkali
(Soda ash) Europe/Middle North America 46% East/Africa 50% 36% Peroxygens Latin 19% America 8%
Excludes phosphorus chemicals sales at Astaris JV, largely in North America
#1 North American manufacturer of soda ash and peroxygens Backward integration into natural resources Low-cost, proprietary production technology
6
Global Soda Ash Outlook
Agenda:
Background
China
Demand
Supply
Pricing
FMC Strengths
Summary
7
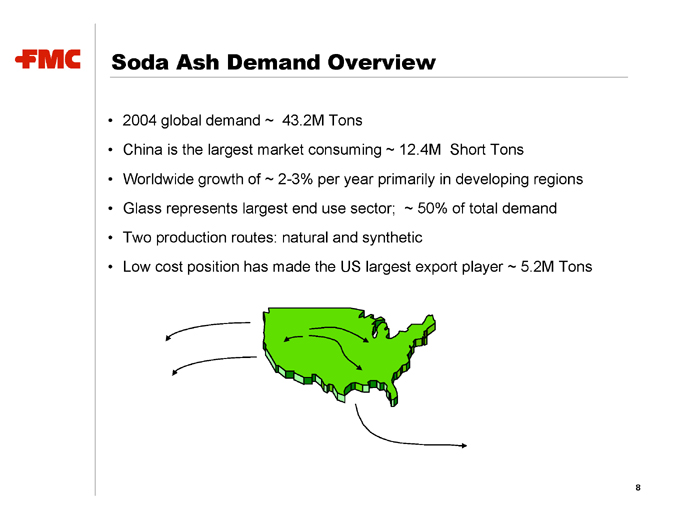
Soda Ash Demand Overview
2004 global demand ~ 43.2M Tons
China is the largest market consuming ~ 12.4M Short Tons
Worldwide growth of ~ 2-3% per year primarily in developing regions
Glass represents largest end use sector; ~ 50% of total demand
Two production routes: natural and synthetic
Low cost position has made the US largest export player ~ 5.2M Tons
8
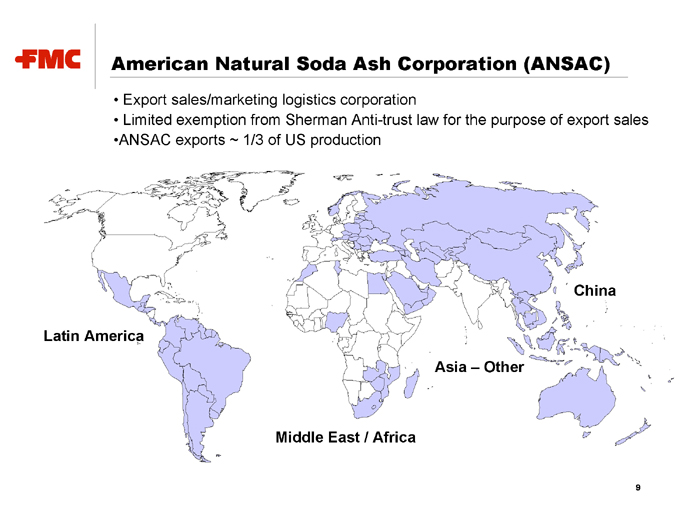
American Natural Soda Ash Corporation (ANSAC)
Export sales/marketing logistics corporation
Limited exemption from Sherman Anti-trust law for the purpose of export sales
ANSAC exports ~ 1/3 of US productionf
Latin America
China
Asia – Other
Middle East / Africa
9
Industry Events Have Reset The Global Environment
Financial
Weaker US dollar
Cost
Ocean freight rates have increased dramatically from historic levels
Synthetic producers impacted by higher coke prices
China is experiencing a salt shortage resulting in significant cost pressure
for Chinese soda ash producers
Capacity
OCI shutdown Incheon, Korea facility in Q1 2004
Solvay shutdown of Colorado soda ash operation in Q3 2004
Solvay announced shutdown of Austrian facility in 2005
China supply / demand remains in balance
FMC announced restart of 250K tons of Granger capacity
10
Upward Momentum for Export Pricing Continues
European producers worldwide facing higher costs due to coke availability
Chinese producers under additional cost pressure(s) due to salt, coal, power and VAT duty drawback reductions China supply/demand will remain in balance
Chinese domestic price has doubled in the last year
Higher ocean transport and energy costs need to be recovered
U.S. dollar relatively weak
Strong GDP growth in Asia and Latin America
Functional substitution occurs as caustic soda price increases
11
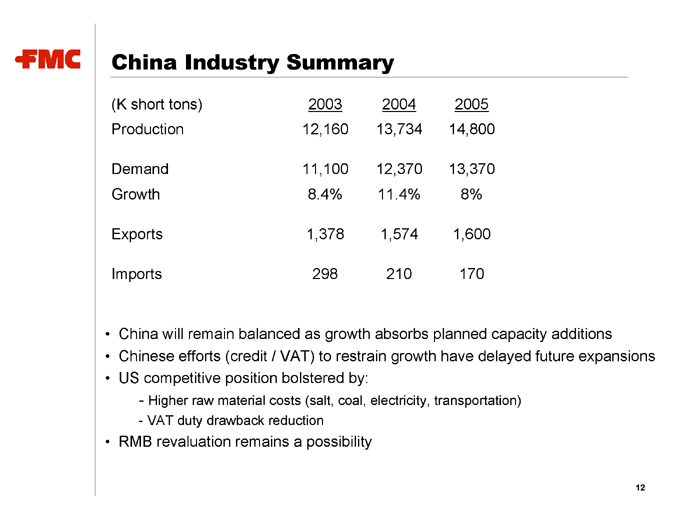
China Industry Summary
(K short tons) 2003 2004 2005
Production 12,160 13,734 14,800
Demand 11,100 12,370 13,370
Growth 8.4% 11.4% 8%
Exports 1,378 1,574 1,600
Imports 298 210 170
China will remain balanced as growth absorbs planned capacity additions Chinese efforts (credit / VAT) to restrain growth have delayed future expansions US competitive position bolstered by:
Higher raw material costs (salt, coal, electricity, transportation) VAT duty drawback reduction
RMB revaluation remains a possibility
12
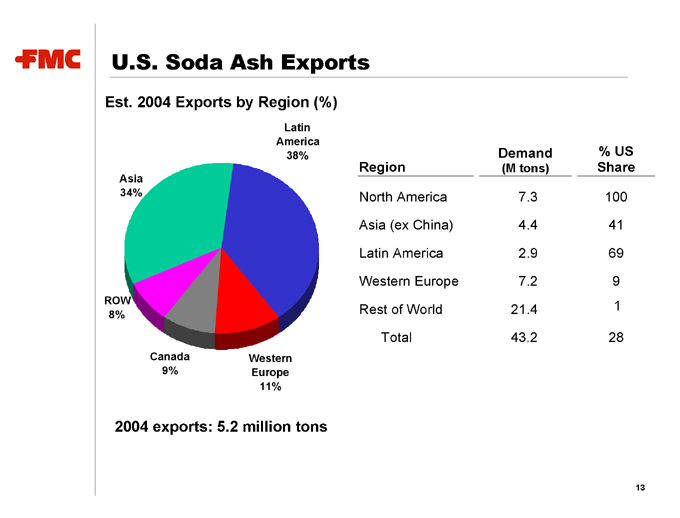
U.S. Soda Ash Exports
Est. 2004 Exports by Region (%)
Latin America 38%
Asia 34%
ROW 8%
Canada Western
9% Europe 11%
2004 exports: 5.2 million tons
U.S. Regional Share
Demand % US
Region (M tons) Share
North America 7.3 100
Asia (ex China) 4.4 41
Latin America 2.9 69
Western Europe 7.2 9
Rest of World 21.4
Total 43.2 28
13
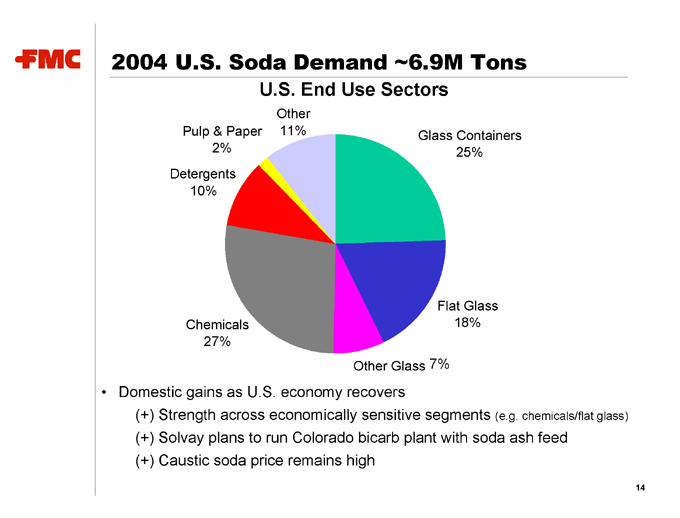
2004 U.S. Soda Demand ~6.9M Tons
U.S. End Use Sectors
Other
Pulp & Paper 11% Glass Containers
2% 25% Detergents 10%
Flat Glass Chemicals 18% 27% Other Glass 7%
Domestic gains as U.S. economy recovers
(+) Strength across economically sensitive segments (e.g. chemicals/flat glass) (+) Solvay plans to run Colorado bicarb plant with soda ash feed (+) Caustic soda price remains high
14
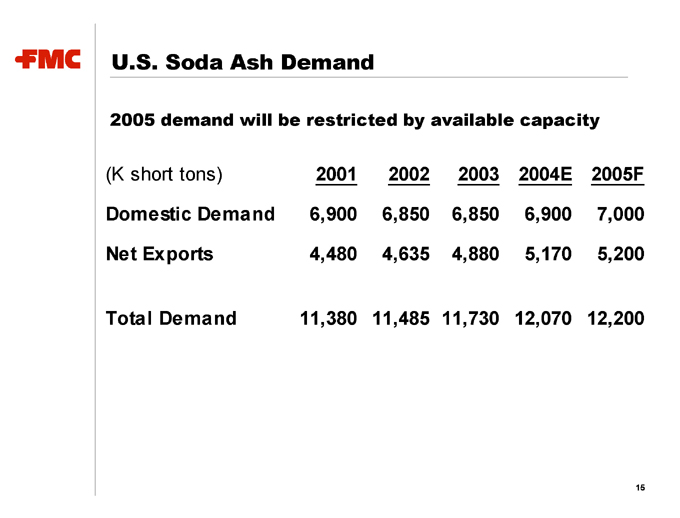
U.S. Soda Ash Demand
2005 demand will be restricted by available capacity
(K short tons) 2001 2002 2003 2004E 2005F
Domestic Demand 6,900 6,850 6,850 6,900 7,000
Net Exports 4,480 4,635 4,880 5,170 5,200
Total Demand 11,380 11,485 11,730 12,070 12,200
15
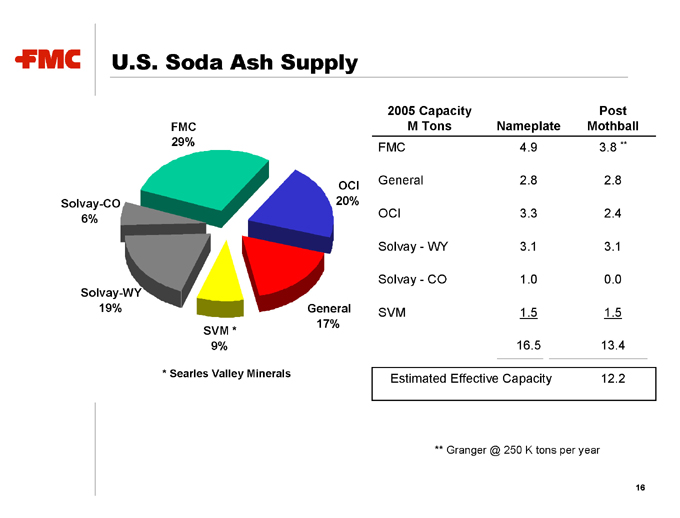
U.S. Soda Ash Supply
FMC 29%
OCI Solvay-CO 20% 6%
Solvay-WY
19% General 17% SVM * 9%
* Searles Valley Minerals
2005 Capacity Post
M Tons Nameplate Mothball
FMC 4.9 3.8 **
General 2.8 2.8
OCI 3.3 2.4
Solvay—WY 3.1 3.1
Solvay—CO 1.0 0.0
SVM 1.5 1.5
16.5 13.4
Estimated Effective Capacity 12.2
** Granger @ 250 K tons per year
16
FMC Granger Restart
In January FMC announced the recommission of 250K tons per year of production capacity at Granger
Supply strategic export customers/markets June 1, 2005 startup date Capacity will be based on: solution mined ore coal based energy minimal capital and start up costs
Future increments of total 1.3 M tons capacity will only be recommissioned as business conditions and profitability warrant
17
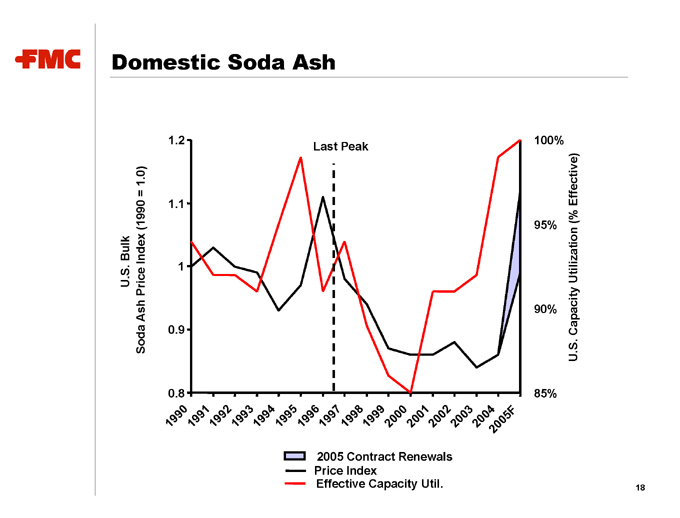
Domestic Soda Ash
U.S. Bulk
Soda Ash Price Index (1990 = 1.0)
1990 0.8 0.9 1 1.1 1.2
1991 1992 1993 1994 1995 1996 1997
Price Index 1998 Last Peak
1999
Effective Capacity Util. 2000 2001 2005 Contract Renewals 2002
2003 2004
2005F
85% 90% 95% 100% U.S. Capacity Utilization (% Effective)
18
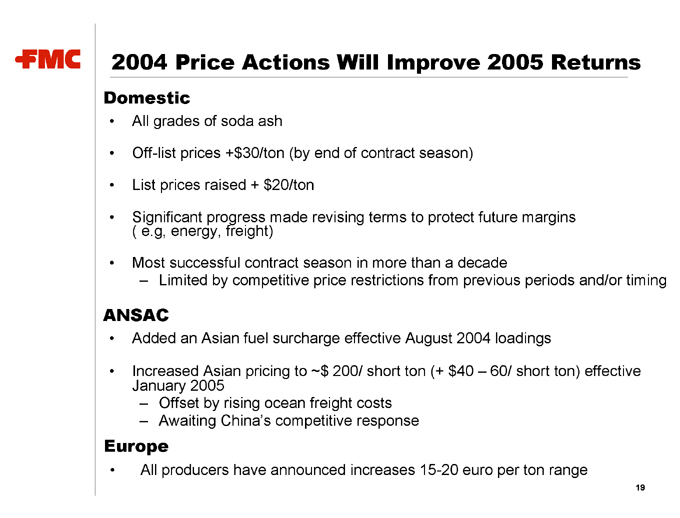
2004 Price Actions Will Improve 2005 Returns
Domestic
All grades of soda ash
Off-list prices +$30/ton (by end of contract season)
List prices raised + $20/ton
Significant progress made revising terms to protect future margins ( e.g, energy, freight)
Most successful contract season in more than a decade
Limited by competitive price restrictions from previous periods and/or timing
ANSAC
Added an Asian fuel surcharge effective August 2004 loadings
Increased Asian pricing to ~$ 200/ short ton (+ $40 – 60/ short ton) effective January 2005
Offset by rising ocean freight costs Awaiting China’s competitive response
Europe
All producers have announced increases 15-20 euro per ton range
19
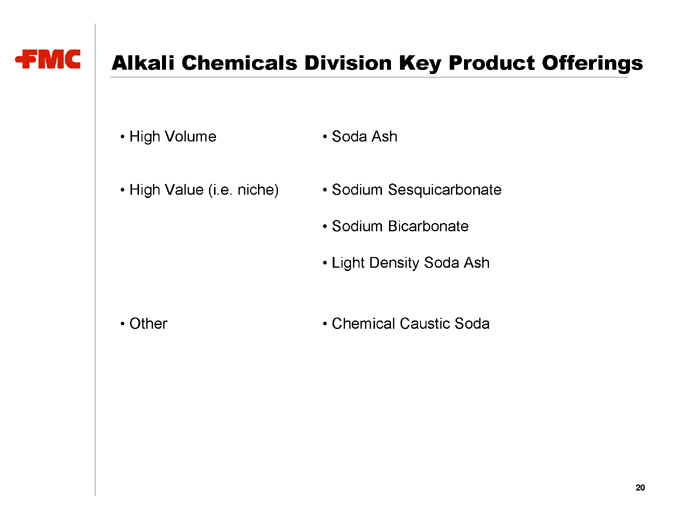
Alkali Chemicals Division Key Product Offerings
High Volume
High Value (i.e. niche)
Other
Soda Ash
Sodium Sesquicarbonate Sodium Bicarbonate Light Density Soda Ash
Chemical Caustic Soda
20

Alkali Chemicals Business Strengths
World’s largest and lowest cost natural soda ash producer Leading North American market position (~29%) in soda ash Highest industry margins
Niche product positions difficult for domestic competitors to duplicate
Largest scale & multiple mining methods
1.6
Mining 1.2
Solution
0.8 Mining FMC Competitors
Cost Index Longwall
Solution
Mining
Base = 0.4
FMC
0
21
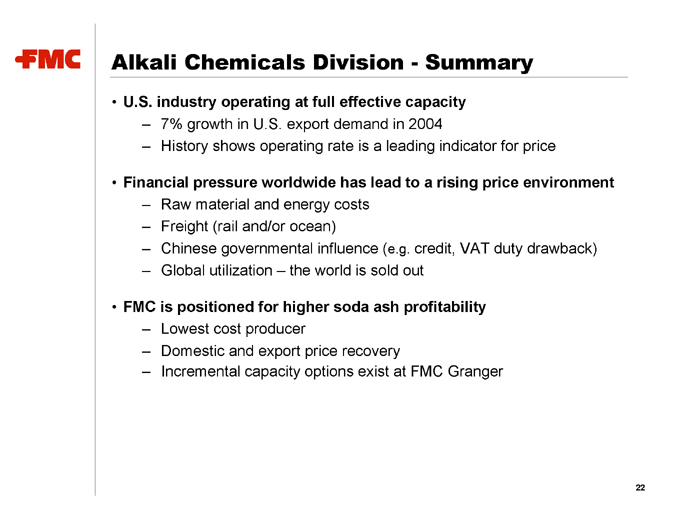
Alkali Chemicals Division—Summary
U.S. industry operating at full effective capacity
7% growth in U.S. export demand in 2004
History shows operating rate is a leading indicator for price
Financial pressure worldwide has lead to a rising price environment
Raw material and energy costs Freight (rail and/or ocean)
Chinese governmental influence (e.g. credit, VAT duty drawback) Global utilization – the world is sold out
FMC is positioned for higher soda ash profitability
Lowest cost producer
Domestic and export price recovery
Incremental capacity options exist at FMC Granger
22

FMC Corporation
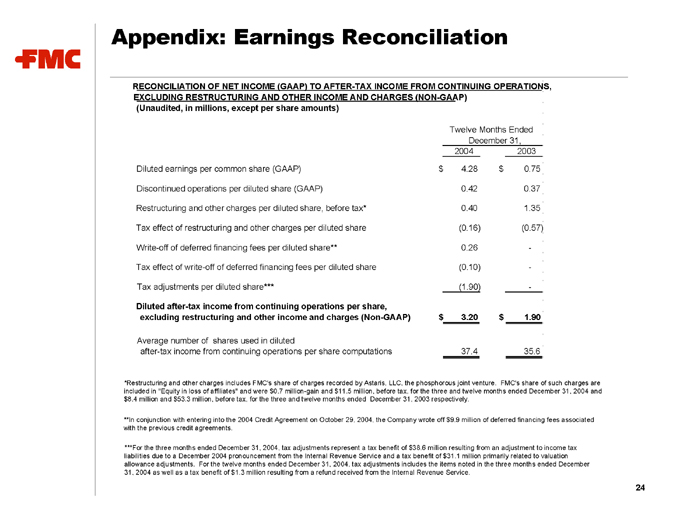
Appendix: Earnings Reconciliation
RECONCILIATION OF NET INCOME (GAAP) TO AFTER-TAX INCOME FROM CONTINUING OPERATIONS, EXCLUDING RESTRUCTURING AND OTHER INCOME AND CHARGES (NON-GAAP) (Unaudited, in millions, except per share amounts)
Twelve Months Ended
December 31, 2004 2003
Diluted earnings per common share (GAAP) $4.28 $0.75
Discontinued operations per diluted share (GAAP) 0.42 0.37
Restructuring and other charges per diluted share, before tax* 0.40 1.35
Tax effect of restructuring and other charges per diluted share (0.16) (0.57)
Write-off of deferred financing fees per diluted share** 0.26 -
Tax effect of write-off of deferred financing fees per diluted share (0.10) -
Tax adjustments per diluted share*** (1.90) -
Diluted after-tax income from continuing operations per share, excluding restructuring and other income and charges (Non-GAAP) $3.20 $1.90
Average number of shares used in diluted after-tax income from continuing operations per share computations 37.4 35.6
*Restructuring and other charges includes FMC’s share of charges recorded by Astaris, LLC, the phosphorous joint venture. FMC’s share of such charges are included in “Equity in loss of affiliates” and were $0.7 million-gain and $11.5 million, before tax, for the three and twelve months ended December 31, 2004 and $8.4 million and $53.3 million, before tax, for the three and twelve months ended December 31, 2003 respectively.
**In conjunction with entering into the 2004 Credit Agreement on October 29, 2004, the Company wrote off $9.9 million of deferred financing fees associated with the previous credit agreements.
***For the three months ended December 31, 2004, tax adjustments represent a tax benefit of $38.6 million resulting from an adjustment to income tax liabilities due to a December 2004 pronouncement from the Internal Revenue Service and a tax benefit of $31.1 million primarily related to valuation allowance adjustments. For the twelve months ended December 31, 2004, tax adjustments includes the items noted in the three months ended December 31, 2004 as well as a tax benefit of $1.3 million resulting from a refund received from the Internal Revenue Service.
24
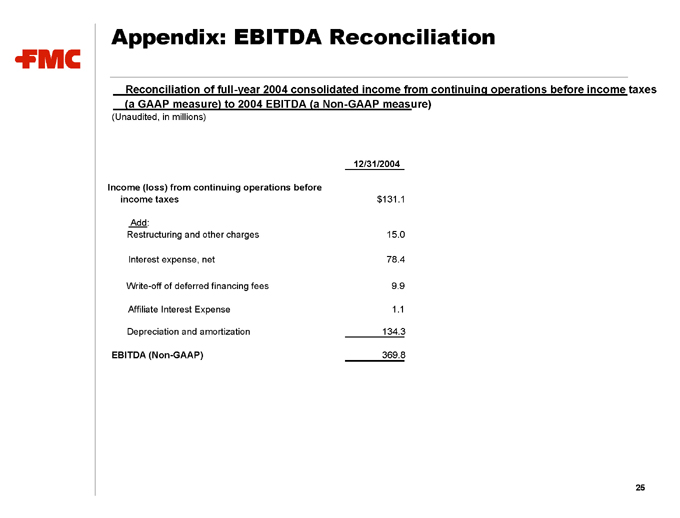
Appendix: EBITDA Reconciliation
Reconciliation of full-year 2004 consolidated income from continuing operations before income taxes (a GAAP measure) to 2004 EBITDA (a Non-GAAP measure)
(Unaudited, in millions)
12/31/2004
Income (loss) from continuing operations before income taxes $ 131.1
Add:
Restructuring and other charges 15.0
Interest expense, net 78.4
Write-off of deferred financing fees 9.9
Affiliate Interest Expense 1.1
Depreciation and amortization 134.3
EBITDA (Non-GAAP) 369.8
25
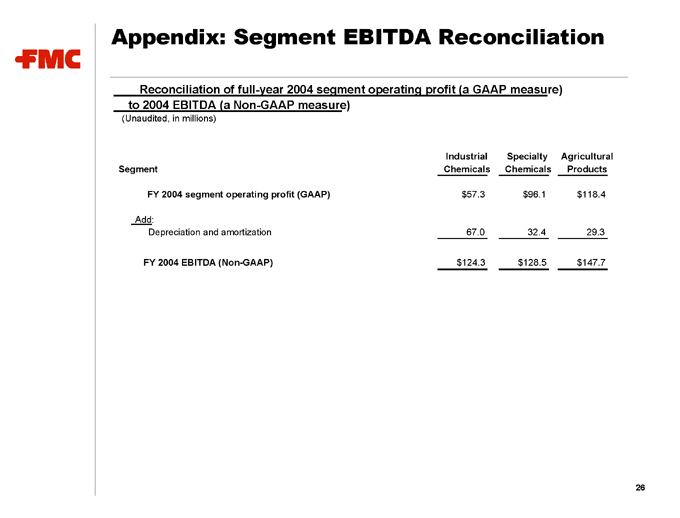
Appendix: Segment EBITDA Reconciliation
Reconciliation of full-year 2004 segment operating profit (a GAAP measure) to 2004 EBITDA (a Non-GAAP measure)
(Unaudited, in millions)
Industrial Specialty Agricultural
Segment Chemicals Chemicals Products
FY 2004 segment operating profit (GAAP) $57.3 $ 96.1 $ 118.4
Add:
Depreciation and amortization 67.0 32.4 29.3
FY 2004 EBITDA (Non-GAAP) $124.3 $128.5 $ 147.7
26
FMC Corporation