Exhibit 99.1
FMC Corporation
Morgan Stanley Basic Materials Conference
February 22, 2005
William G. Walter Chairman, President, CEO
Disclaimer
Safe Harbor Statement under the Private Securities Litigation Reform Act of 1995
These slides and the accompanying presentation contain “forward-looking statements” that represent management’s best judgment as of the date hereof based on information currently available. Actual results of the Company may differ materially from those contained in the forward-looking statements.
Additional information concerning factors that may cause results to differ materially from those in the forward-looking statements is contained in the Company’s periodic reports filed under the Securities Exchange Act of 1934, as amended.
The Company undertakes no obligation to update or revise these forward-looking statements to reflect new events or uncertainties.
1
Non-GAAP Financial Terms
These slides contain certain “non-GAAP financial terms” which are defined below. In addition, we have provided reconciliations of non-GAAP terms to the closest GAAP term in the appendix of this presentation.
EBITDA (Earnings Before Interest, Taxes, Depreciation and Amortization) is the sum of Income (loss) from continuing operations before income taxes and Depreciation and Amortization.
EBITDA Margin is the quotient of EBITDA (defined above) divided by Revenue.
ROIC (Return on Invested Capital) is the sum of Earnings from continuing operations before restructuring and other income and charges and after-tax Interest expense divided by the sum of Short-term debt, Current portion of long-term debt, Long-term debt and Total shareholders’ equity.
2
Segment Financial Terms
These slides contain references to segment financial items which are presented in detail in Note 19 of FMC’s 2003 Form 10-K. Some of the segment financial terms are “non-GAAP financial terms” and are defined below. In addition, we have provided reconciliations of non-GAAP terms to the closest GAAP term in the appendix of this presentation.
EBITDA (Earnings Before Interest, Taxes, Depreciation and Amortization) for a segment is the sum of Income (loss) from continuing operations before income taxes for that segment and Depreciation and Amortization for that segment.
EBITDA Margin for a segment is the quotient of EBITDA (defined above) divided by Revenue for that segment.
3
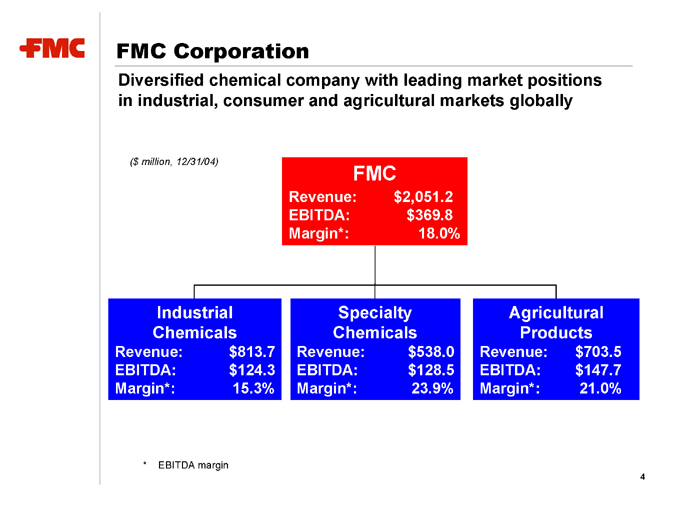
FMC Corporation
Diversified chemical company with leading market positions in industrial, consumer and agricultural markets globally
($ million, 12/31/04)
FMC
Revenue: $2,051.2 EBITDA: $369.8 Margin*: 18.0%
Industrial Chemicals
Revenue: $813.7 EBITDA: $124.3 Margin*: 15.3%
Specialty Chemicals
Revenue: $538.0 EBITDA: $128.5 Margin*: 23.9%
Agricultural Products
Revenue: $703.5 EBITDA: $147.7 Margin*: 21.0%
* EBITDA margin
4
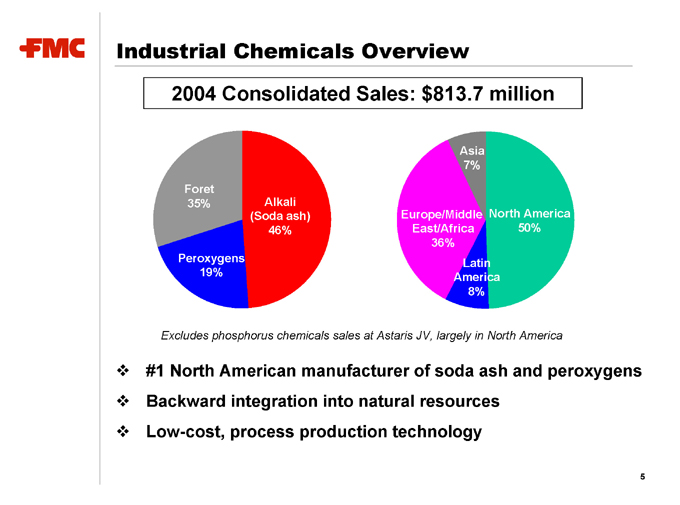
Industrial Chemicals Overview
2004 Consolidated Sales: $813.7 million
Foret
35% Alkali (Soda ash) 46%
Peroxygens 19%
Asia 7%
Europe/Middle East/Africa 36% North America 50% Latin America 8%
Excludes phosphorus chemicals sales at Astaris JV, largely in North America
#1 North American manufacturer of soda ash and peroxygens Backward integration into natural resources Low-cost, process production technology
5
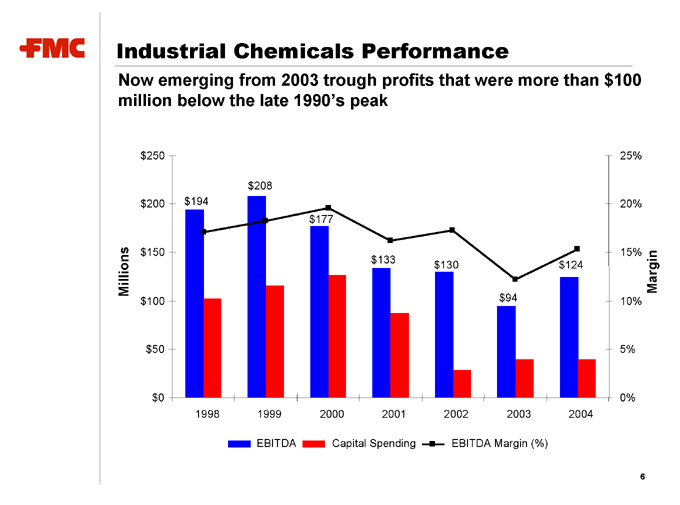
Industrial Chemicals Performance
Now emerging from 2003 trough profits that were more than $100 million below the late 1990’s peak $250
$200
Millions $150
$100 $50 $0 $208 $194 $177
$133 $130 $124
$94
1998 1999 2000 2001 2002 2003 2004
25%
20%
15% Margin
10% 5% 0%
EBITDA Capital Spending EBITDA Margin (%)
6
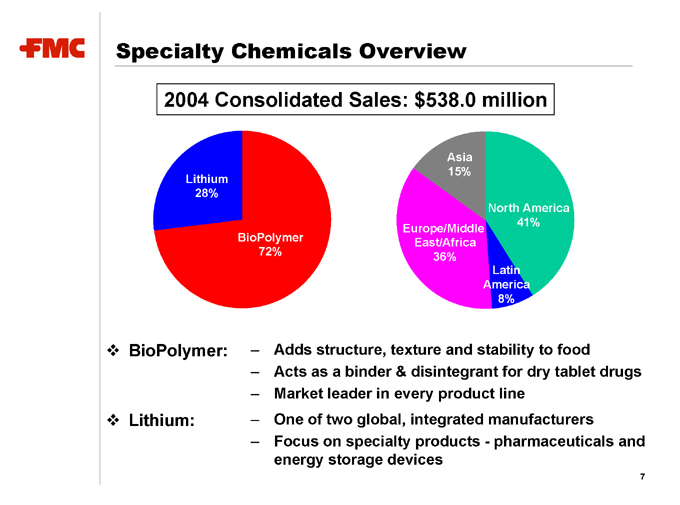
Specialty Chemicals Overview
2004 Consolidated Sales: $538.0 million
Lithium 28%
BioPolymer 72%
Asia 15%
North America 41% Europe/Middle East/Africa 36% Latin America 8%
BioPolymer: – Adds structure, texture and stability to food
– Acts as a binder & disintegrant for dry tablet drugs
– Market leader in every product line
Lithium: – One of two global, integrated manufacturers
– Focus on specialty products—pharmaceuticals and energy storage devices
7
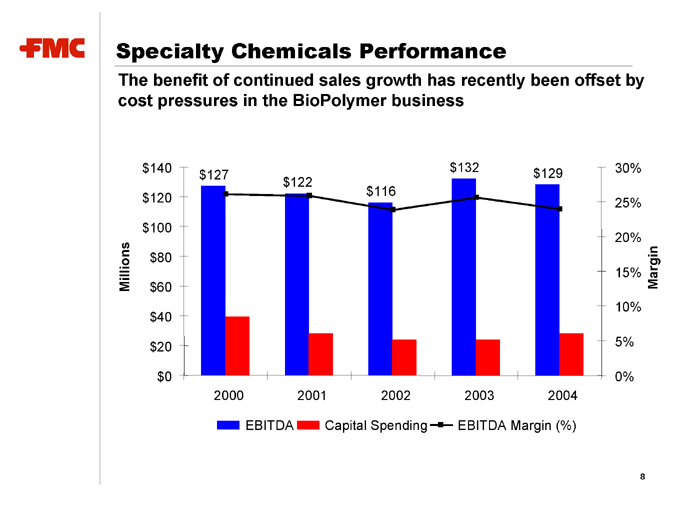
Specialty Chemicals Performance
The benefit of continued sales growth has recently been offset by cost pressures in the BioPolymer business $140
$120
$100
Millions $80
$60
$40 $20 $0 $132 $129 $127 $122 $116
2000 2001 2002 2003 2004
30%
25%
20%
Margin
15
% 10% 5% 0%
EBITDA Capital Spending EBITDA Margin (%)
8
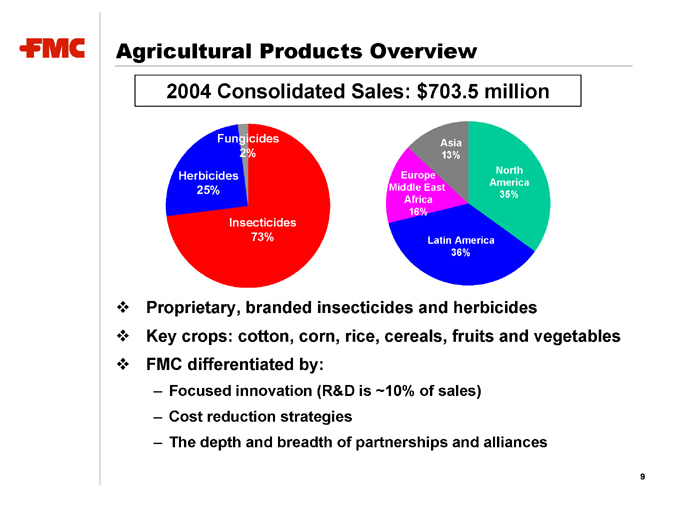
Agricultural Products Overview
2004 Consolidated Sales: $703.5 million
Fungicides 2% Herbicides 25%
Insecticides 73%
Asia 13%
North America 35% Europe Middle East Africa 16%
Latin America 36%
Proprietary, branded insecticides and herbicides
Key crops: cotton, corn, rice, cereals, fruits and vegetables FMC differentiated by:
– Focused innovation (R&D is ~10% of sales)
– Cost reduction strategies
– The depth and breadth of partnerships and alliances
9
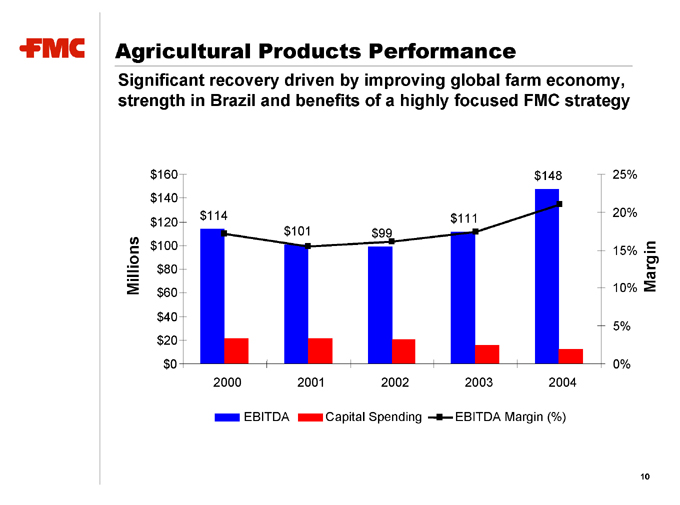
Agricultural Products Performance
Significant recovery driven by improving global farm economy, strength in Brazil and benefits of a highly focused FMC strategy $160 $140 $120
Millions $100
$80 $60 $40 $20 $0 $148
$114 $111 $101 $99
2000 2001 2002 2003 2004
25%
20%
15% Margin
10% 5% 0%
EBITDA Capital Spending EBITDA Margin (%)
10
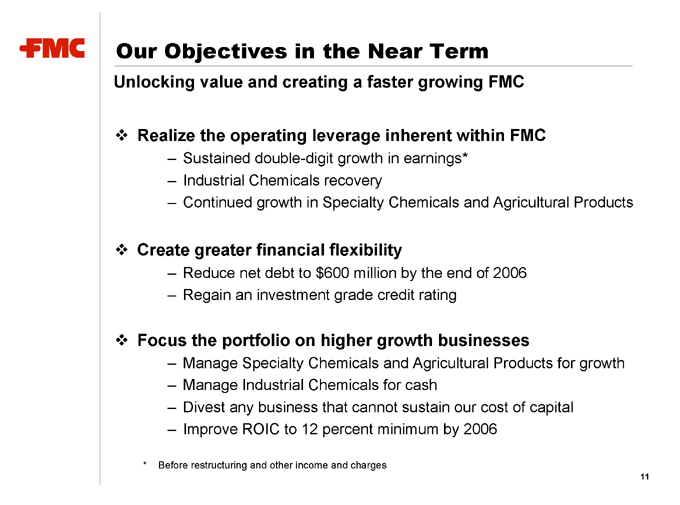
Our Objectives in the Near Term
Unlocking value and creating a faster growing FMC
Realize the operating leverage inherent within FMC
– Sustained double-digit growth in earnings*
– Industrial Chemicals recovery
– Continued growth in Specialty Chemicals and Agricultural Products
Create greater financial flexibility
– Reduce net debt to $600 million by the end of 2006
– Regain an investment grade credit rating
Focus the portfolio on higher growth
businesses
– Manage Specialty Chemicals and Agricultural Products for growth
– Manage Industrial Chemicals for cash
– Divest any business that cannot sustain our cost of capital
– Improve ROIC to 12 percent minimum by 2006
* Before restructuring and other income and charges
11
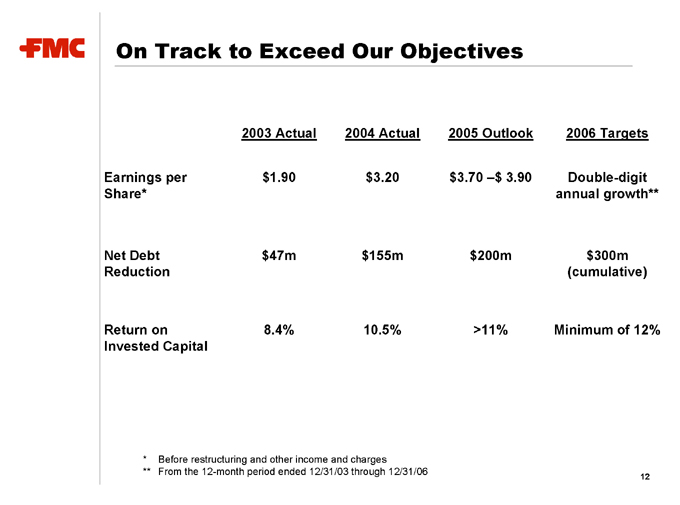
On Track to Exceed Our Objectives
2003 Actual 2004 Actual 2005 Outlook 2006 Targets
Earnings per Share* $1.90 $3.20 $3.70 –$3.90 Double-digit annual growth**
Net Debt Reduction $47m $155m $200m $300m (cumulative)
Return on Invested Capital 8.4% 10.5% >11% Minimum of 12%
* Before restructuring and other income and charges
** From the 12-month period ended 12/31/03 through 12/31/06
12
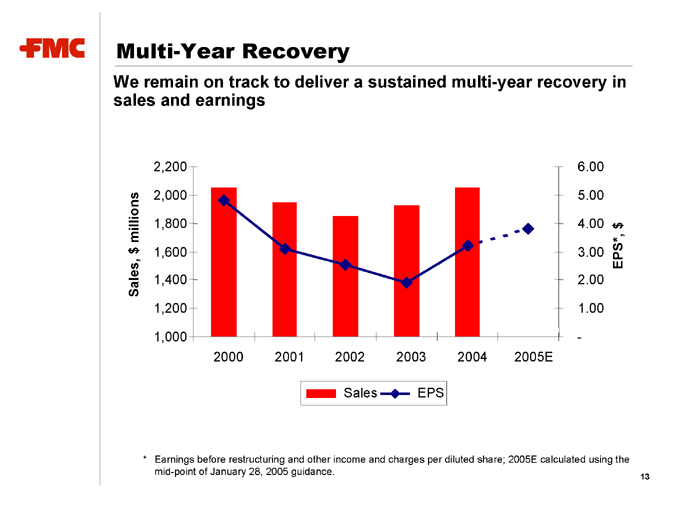
Multi-Year Recovery
We remain on track to deliver a sustained multi-year recovery in sales and earnings
2,200
Sales, $ millions
2,000
1,800
1,600
1,400
1,200
1,000
2000 2001 2002 2003 2004 2005E
6.00
5.00
4.00
3.00
2.00
1.00
EPS*, $
Sales EPS
* Earnings before restructuring and other income and charges per diluted share; 2005E calculated using the mid-point of January 28, 2005 guidance.
13
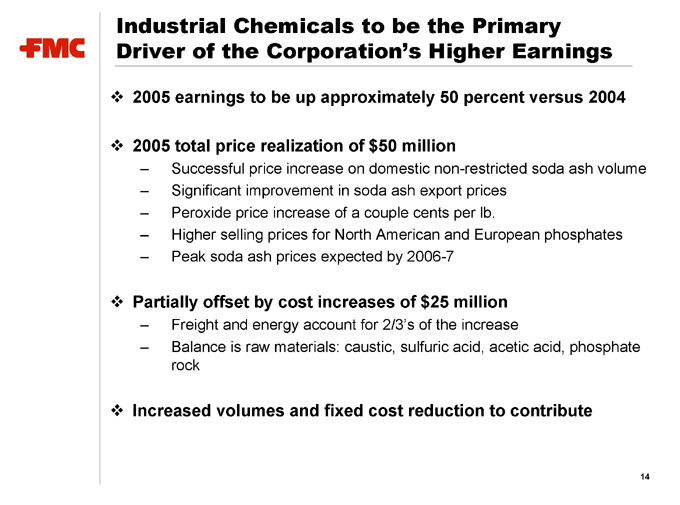
Industrial Chemicals to be the Primary Driver of the Corporation’s Higher Earnings
2005 earnings to be up approximately 50 percent versus 2004
2005 total price realization of $50 million
– Successful price increase on domestic non-restricted soda ash volume
– Significant improvement in soda ash export prices
– Peroxide price increase of a couple cents per lb.
– Higher selling prices for North American and European phosphates
– Peak soda ash prices expected by 2006-7
Partially offset by cost increases of $25 million
– Freight and energy account for 2/3’s of the increase
– Balance is raw materials: caustic, sulfuric acid, acetic acid, phosphate rock
Increased volumes and fixed cost reduction
to contribute
14
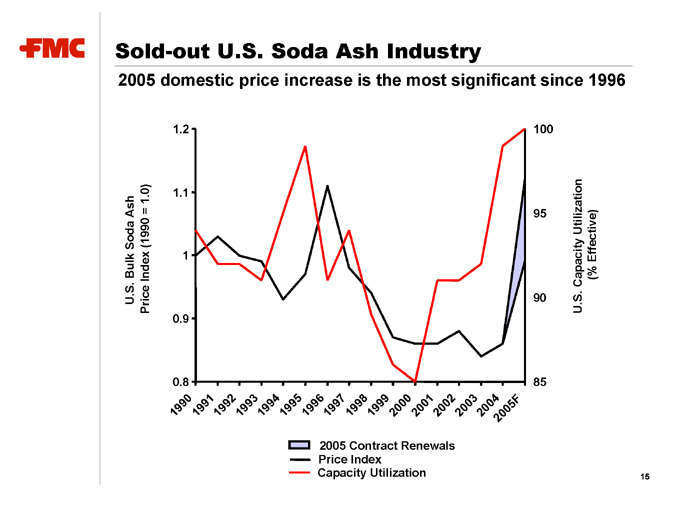
Sold-out U.S. Soda Ash Industry
2005 domestic price increase is the most significant since 1996
U.S. Bulk Soda Ash Price Index (1990 = 1.0)
0.8 0.9 1 1.1 1.2
1990 1991 1992
1993 1994 1995 1996 1997 1998 1999
2000 2001 2002 2003 2004
2005F
85 90 95 100 U.S. Capacity Utilization
(% Effective)
2005 Contract Renewals Price Index Capacity Utilization
15
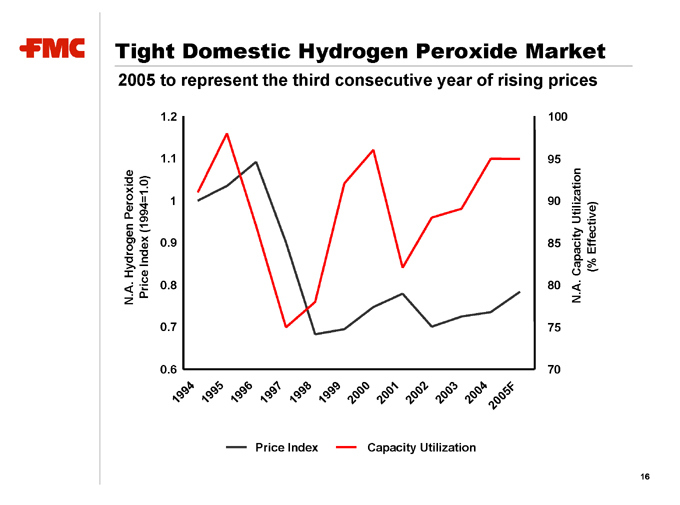
Tight Domestic Hydrogen Peroxide Market
2005 to represent the third consecutive year of rising prices
1.2
1.1 Peroxide .0) (1994=1 1 Hydrogen 0.9 N.A. Price Index 0.8 0.7
0.6
1994 1995 1996 1997 1998 1999 2000 2001 2002 2003 2004
2005F
70 75 80 85 90 95 100 N.A. Capacity Utilization
(% Effective)
Price Index Capacity Utilization
16
Platforms in Specialty Chemicals To Drive Top-line Growth
2005 revenue growth in mid-single digits
– Strong organic growth in BioPolymer end-markets of 3-6% per year
– Focus on lithium specialty markets growing at 4 to >10% per year
– Selective increases in selling prices
Earnings growth rate in excess of revenue growth
– Productivity improvements to drive margin expansion in 2005
– Raw materials to remain stable versus 2004 and improve thereafter
Promising new products for the future
– Oral dosage form technologies
– Functional food ingredients
– Fine chemistry applications of lithium
17
Agricultural Products to Remain Strong
Relatively flat revenue versus 2004
– Growth in new products and labels in the Americas and Europe
– Brazilian market to remain strong for at least another year
– Unfavorable impact of price pressure from generic producers in North American insecticides
Similar earnings in 2005 versus 2004
– Relatively flat sales
– Continued progress in reducing manufacturing costs via outsourcing
– Higher energy, raw material and freight costs
In-licensed products to contribute $50-90 million to sales by ‘09
18
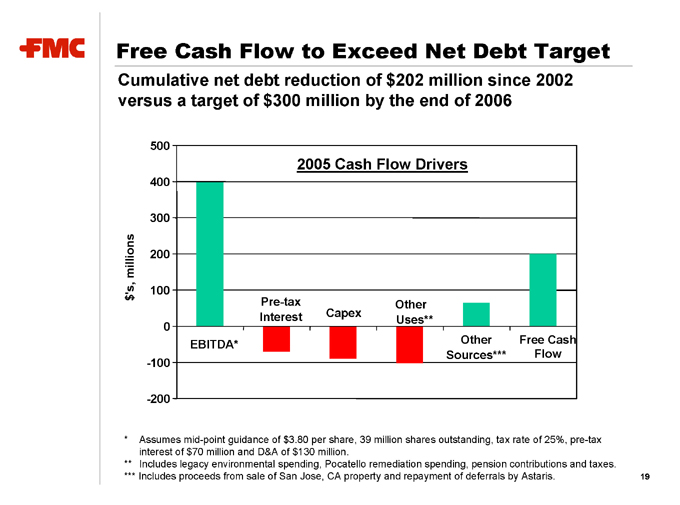
Free Cash Flow to Exceed Net Debt Target
Cumulative net debt reduction of $202 million since 2002 versus a target of $300 million by the end of 2006
500
400
300 millions 200
‘s, 100 $
0 -100
-200
2005 Cash Flow Drivers
Pre-tax Other Interest Capex Uses**
EBITDA* Other Free Cash Sources*** Flow
* Assumes mid-point guidance of $3.80 per share, 39 million shares outstanding, tax rate of 25%, pre-tax interest of $70 million and D&A of $130 million.
** Includes legacy environmental spending, Pocatello remediation spending, pension contributions and taxes.
*** Includes proceeds from sale of San Jose, CA property and repayment of deferrals by Astaris.
19
In Summary
Great businesses, each with EBITDA of at least $125 million Industrial Chemicals earnings still over $75 million below peak Steady growth in Specialty Chemicals and
Ag Products Low capital expenditure requirements Substantial decline in unusual demands on cash flow Significant balance sheet deleveraging
20
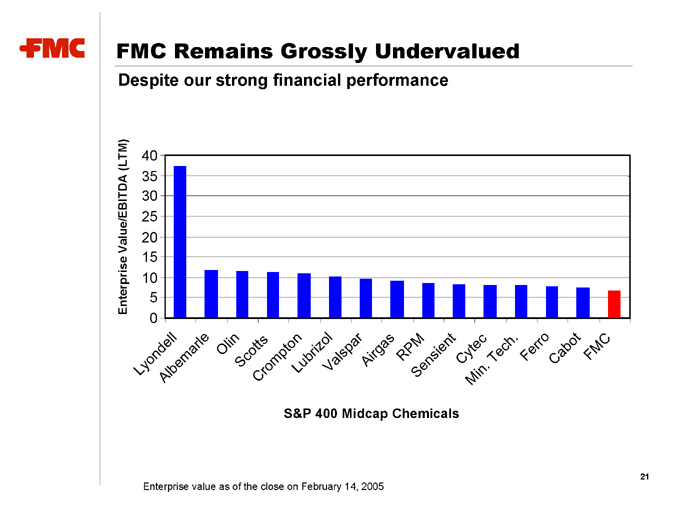
FMC Remains Grossly Undervalued
Despite our strong financial performance
(LTM) 40
35
Value/EBITDA
30 25 20 15
Enterprise
10 5
0
Lyondell
Albemarle
Olin
Scotts
Crompton
S&P 400 Midcap Lubrizol
Valspar
Airgas RPM
Sensient
Chemicals
Cytec
Min.
Tech.
Ferro
Cabot
FMC
Enterprise value as of the close on February 14, 2005
21
Disciplined Approach to
Unlocking Value
Our long term objectives are focused on proactively unlocking value once financial flexibility is achieved
Maintain strategic and financial flexibility to invest in growth
– Continued R&D investment in Agricultural Products
– Pursue acquisitions in BioPolymer business
– Employ stringent acquisition criteria:
–Highly complementary –Substantial synergies –Accretive to earnings
Actively manage the business portfolio to create value
Return capital to shareholders in most efficient manner
22

FMC Corporation
Appendix: Earnings
Reconciliation
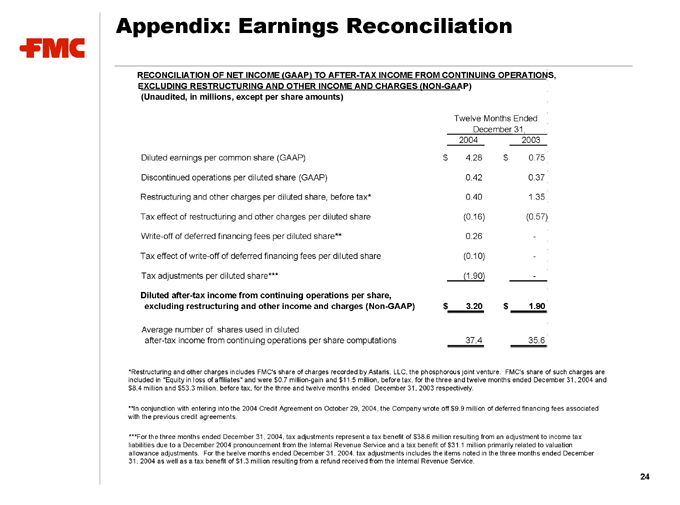
RECONCILIATION OF NET INCOME (GAAP) TO AFTER-TAX INCOME FROM CONTINUING OPERATIONS, EXCLUDING RESTRUCTURING AND OTHER INCOME AND CHARGES (NON-GAAP) (Unaudited, in millions, except per share amounts)
Twelve Months Ended December 31,
2004 2003
Diluted earnings per common share (GAAP) $4.28 $0.75
Discontinued operations per diluted share (GAAP) 0.42 0.37
Restructuring and other charges per diluted share, before tax* 0.40 1.35
Tax effect of restructuring and other charges per diluted share (0.16) (0.57)
Write-off of deferred financing fees per diluted share** 0.26 -
Tax effect of write-off of deferred financing fees per diluted share (0.10) -
Tax adjustments per diluted share*** (1.90) -
Diluted after-tax income from continuing operations per share, excluding restructuring and other income and charges (Non-GAAP) $3.20 $1.90
Average number of shares used in diluted
after-tax income from continuing operations per share computations 37.4 35.6
*Restructuring and other charges includes FMC’s share of charges recorded by Astaris, LLC, the phosphorous joint venture. FMC’s share of such charges are included in “Equity in loss of affiliates” and were $0.7 million-gain and $11.5 million, before tax, for the three and twelve months ended December 31, 2004 and $8.4 million and $53.3 million, before tax, for the three and twelve months ended December 31, 2003 respectively.
**In conjunction with entering into the 2004 Credit Agreement on October 29, 2004, the Company wrote off $9.9 million of deferred financing fees associated with the previous credit agreements.
***For the three months ended December 31, 2004, tax adjustments represent a tax benefit of $38.6 million resulting from an adjustment to income tax liabilities due to a December 2004 pronouncement from the Internal Revenue Service and a tax benefit of $31.1 million primarily related to valuation allowance adjustments. For the twelve months ended December 31, 2004, tax adjustments includes the items noted in the three months ended December 31, 2004 as well as a tax benefit of $1.3 million resulting from a refund received from the Internal Revenue Service.
24
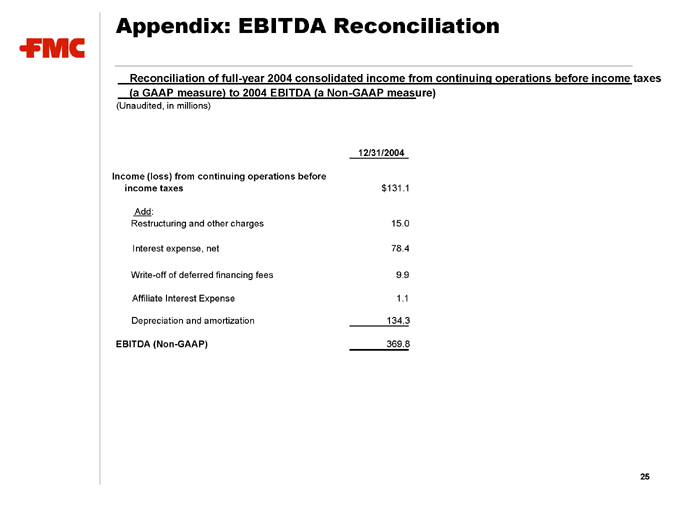
Appendix: EBITDA Reconciliation
Reconciliation of full-year 2004 consolidated income from continuing operations before income taxes (a GAAP measure) to 2004 EBITDA (a Non-GAAP measure)
(Unaudited, in millions)
12/31/2004
Income (loss) from continuing operations before
income taxes $131.1
Add:
Restructuring and other charges 15.0
Interest expense, net 78.4
Write-off of deferred financing fees 9.9
Affiliate Interest Expense 1.1
Depreciation and amortization 134.3
EBITDA (Non-GAAP) 369.8
25
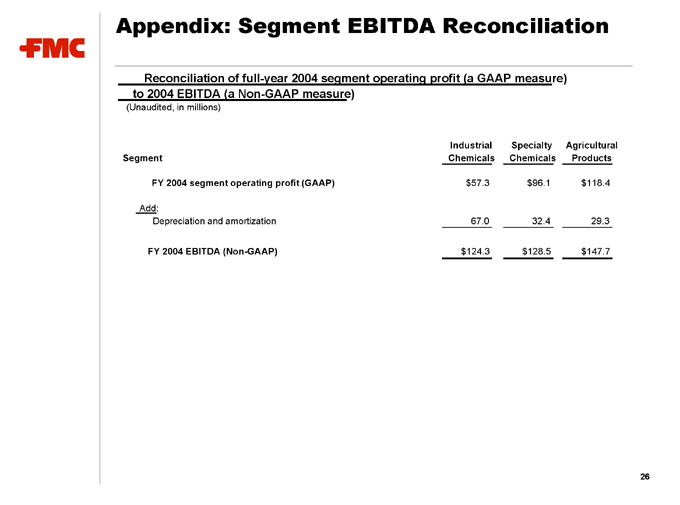
Appendix: Segment EBITDA Reconciliation
Reconciliation of full-year 2004 segment operating profit (a GAAP measure) to 2004 EBITDA (a Non-GAAP measure)
(Unaudited, in millions)
Segment Industrial Chemicals Specialty Chemicals Agricultural Products
FY 2004 segment operating profit (GAAP) $57.3 $96.1 $118.4
Add:
Depreciation and amortization 67.0 32.4 29.3
FY 2004 EBITDA (Non-GAAP) $124.3 $128.5 $147.7
26
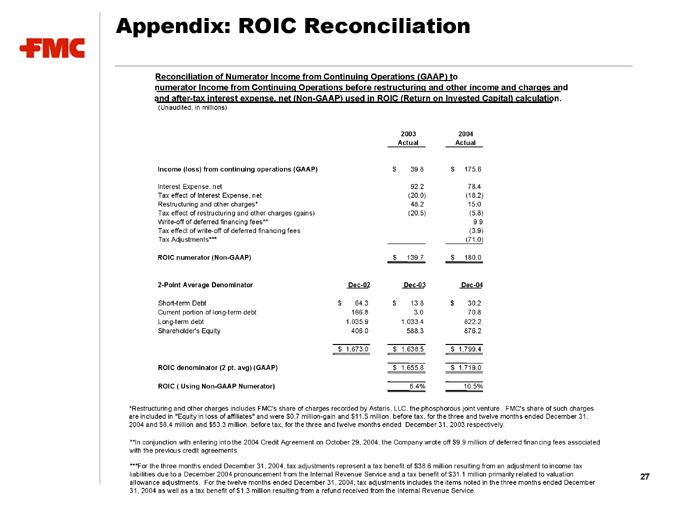
Appendix: ROIC Reconciliation
Reconciliation of Numerator Income from Continuing Operations (GAAP) to numerator Income from Continuing Operations before restructuring and other income and charges and and after-tax interest expense, net (Non-GAAP) used in ROIC (Return on Invested Capital) calculation.
(Unaudited, in millions)
2003 Actual 2004 Actual
Income (loss) from continuing operations (GAAP) $39.8 $175.6
Interest Expense, net 92.2 78.4
Tax effect of Interest Expense, net (20.0) (18.2)
Restructuring and other charges* 48.2 15.0
Tax effect of restructuring and other charges (gains) (20.5) (5.8)
Write-off of deferred financing fees** 9.9
Tax effect of write-off of deferred financing fees (3.9)
Tax Adjustments*** (71.0)
ROIC numerator (Non-GAAP) $139.7 $180.0
2-Point Average Denominator Dec-02 Dec-03 Dec-04
Short-term Debt $64.3 $13.8 $30.2
Current portion of long-term debt 166.8 3.0 70.8
Long-term debt 1,035.9 1,033.4 822.2
Shareholder’s Equity 406.0 588.3 876.2
$1,673.0 $1,638.5 $1,799.4
ROIC denominator (2 pt. avg) (GAAP) $1,655.8 $1,719.0
ROIC ( Using Non-GAAP Numerator) 8.4% 10.5%
*Restructuring and other charges includes FMC’s share of charges recorded by Astaris, LLC, the phosphorous joint venture. FMC’s share of such charges are included in “Equity in loss of affiliates” and were $0.7 million-gain and $11.5 million, before tax, for the three and twelve months ended December 31, 2004 and $8.4 million and $53.3 million, before tax, for the three and twelve months ended December 31, 2003 respectively.
**In conjunction with entering into the 2004 Credit Agreement on October 29, 2004, the Company wrote off $9.9 million of deferred financing fees associated with the previous credit agreements.
***For the three months ended December 31, 2004, tax adjustments represent a tax benefit of $38.6 million resulting from an adjustment to income tax liabilities due to a December 2004 pronouncement from the Internal Revenue Service and a tax benefit of $31.1 million primarily related to valuation allowance adjustments. For the twelve months ended December 31, 2004, tax adjustments includes the items noted in the three months ended December 31, 2004 as well as a tax benefit of $1.3 million resulting from a refund received from the Internal Revenue Service.
27
FMC Corporation