Exhibit 99.1
Soda Ash and Hydrogen Peroxide Update
Michael Wilson
Vice President, Industrial Chemicals Group
Bank of America Conference Call March 11, 2005
Disclaimer
Safe Harbor Statement under the Private Securities Litigation Reform Act of 1995
These slides and the accompanying presentation contain “forward-looking statements” that represent management’s best judgment as of the date hereof based on information currently available. Actual results of the Company may differ materially from those contained in the forward-looking statements.
Additional information concerning factors that may cause results to differ materially from those in the forward-looking statements is contained in the Company’s periodic reports filed under the Securities Exchange Act of 1934, as amended.
The Company undertakes no obligation to update or revise these forward-looking statements to reflect new events or uncertainties.
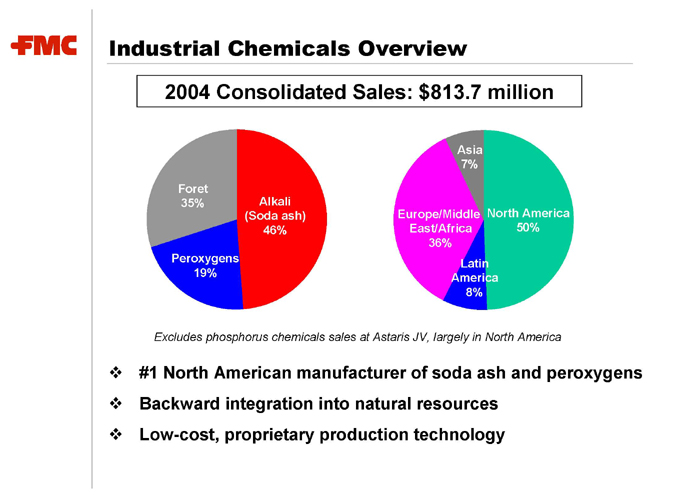
Industrial Chemicals Overview
2004 Consolidated Sales: $813.7 million
Foret 35%
Peroxygens 19%
Alkali (Soda ash) 46%
Asia 7%
Europe/Middle East/Africa 36%
Latin America 8%
North America 50%
Excludes phosphorus chemicals sales at Astaris JV, largely in North America
#1 North American manufacturer of soda ash and peroxygens Backward integration into natural resources
Low-cost, proprietary production technology
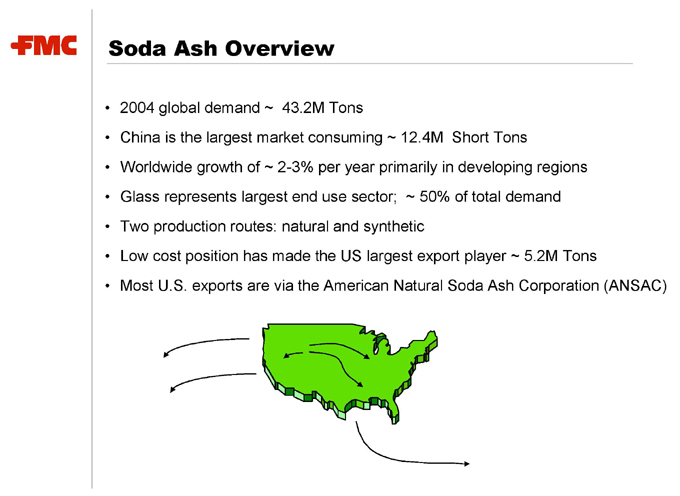
Soda Ash Overview
2004 global demand ~ 43.2M Tons
China is the largest market consuming ~ 12.4M Short Tons
Worldwide growth of ~ 2-3% per year primarily in developing regions
Glass represents largest end use sector; ~ 50% of total demand
Two production routes: natural and synthetic
Low cost position has made the US largest export player ~ 5.2M Tons
Most U.S. exports are via the American Natural Soda Ash Corporation (ANSAC)
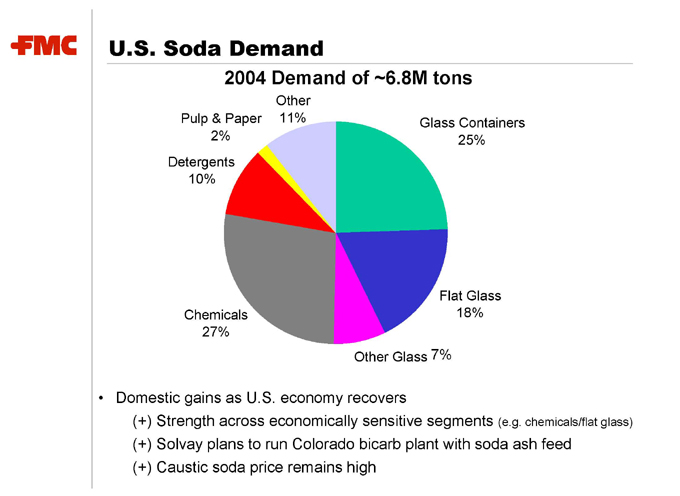
U.S. Soda Demand
2004 Demand of ~6.8M tons
Other 11%
Glass Containers 25%
Flat Glass 18%
Other Glass 7%
Chemicals 27%
Detergents 10%
Pulp & Paper 2%
Domestic gains as U.S. economy recovers
(+) Strength across economically sensitive segments (e.g. chemicals/flat glass) (+) Solvay plans to run Colorado bicarb plant with soda ash feed (+) Caustic soda price remains high
U.S. Soda Ash Exports
Est. 2004 Exports by Region (%)
Latin America 38%
Asia 34%
ROW 8%
Canada 9%
Western Europe 11%
~5.2 million tons
U.S. Regional Share
Region Demand (M tons)% US Share
North America 7.3 100
Asia (ex China) 4.4 41
Latin America 2.9 69
Western Europe 7.2 9
Rest of World 21.4 1
Total 43.2 28

U.S. Soda Ash Supply
FMC 29%
OCI 20%
General 17%
SVM * 9%
Solvay-WY
19%
Solvay-CO
6%
* Searles Valley Minerals
2005 Capacity M Tons Nameplate Post Mothball
FMC 4.9 3.8 **
General 2.8 2.8
OCI 3.3 2.4
Solvay—WY 3.1 3.1
Solvay—CO 1.0 0.0
SVM 1.5 1.5
16.5 13.4
Estimated Effective Capacity 12.2
** Granger @ 250 K tons per year
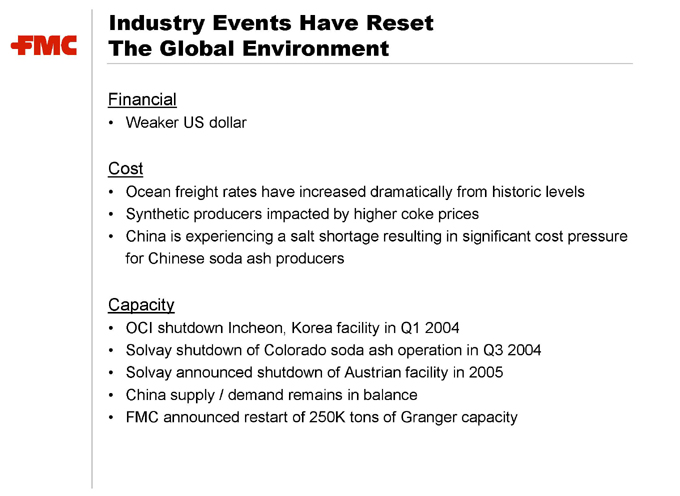
Industry Events Have Reset The Global Environment
Financial
Weaker US dollar
Cost
Ocean freight rates have increased dramatically from historic levels
Synthetic producers impacted by higher coke prices
China is experiencing a salt shortage resulting in significant cost pressure for Chinese soda ash producers
Capacity
OCI shutdown Incheon, Korea facility in Q1 2004
Solvay shutdown of Colorado soda ash operation in Q3 2004
Solvay announced shutdown of Austrian facility in 2005
China supply / demand remains in balance
FMC announced restart of 250K tons of Granger capacity
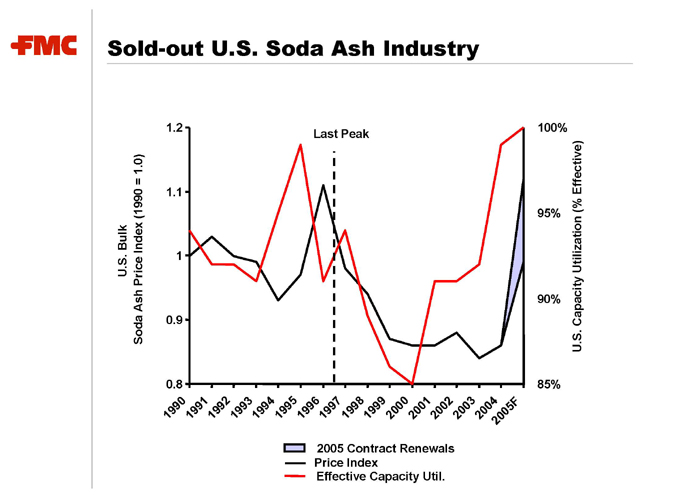
Sold-out U.S. Soda Ash Industry
U.S. Bulk
Soda Ash Price Index (1990 = 1.0)
1.2 1.1 1 0.9 0.8
Last Peak
100% 95% 90% 85%
U.S. Capacity Utilization (% Effective)
1990 1991 1992 1993 1994 1995 1996 1997 1998 1999 2000 2001 2002 2003 2004
2005F
2005 Contract Renewals Price Index Effective Capacity Util.
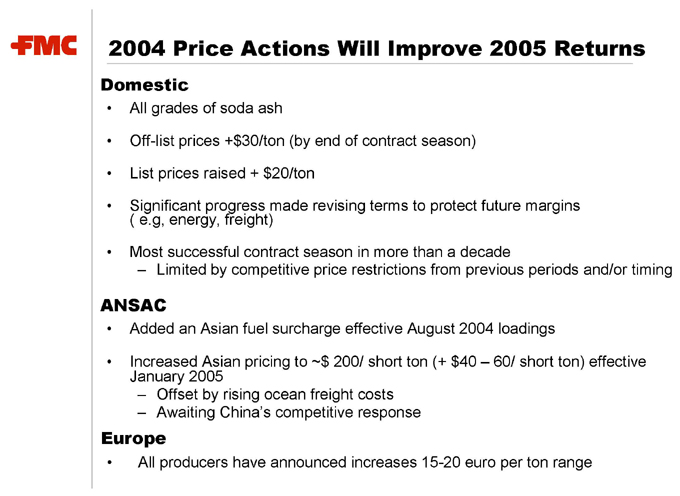
2004 Price Actions Will Improve 2005 Returns
Domestic
All grades of soda ash
Off-list prices +$30/ton (by end of contract season)
List prices raised + $20/ton
Significant progress made revising terms to protect future margins ( e.g, energy, freight)
Most successful contract season in more than a decade
Limited by competitive price restrictions from previous periods and/or timing
ANSAC
Added an Asian fuel surcharge effective August 2004 loadings
Increased Asian pricing to ~$ 200/ short ton (+ $40 – 60/ short ton) effective January 2005
Offset by rising ocean freight costs
Awaiting China’s competitive response
Europe
All producers have announced increases 15-20 euro per ton range
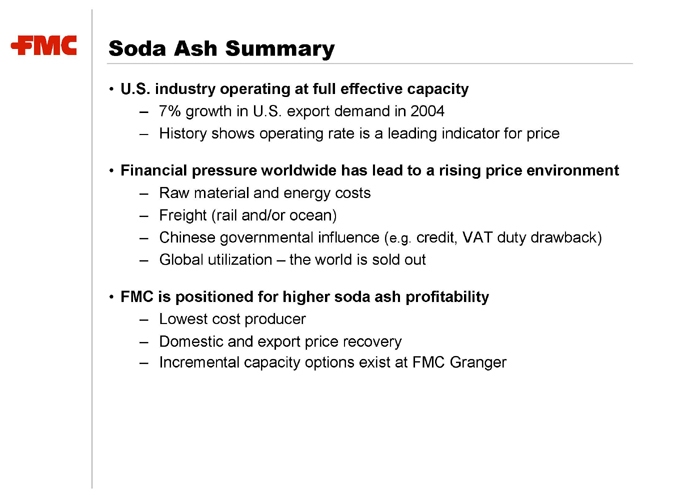
Soda Ash Summary
U.S. industry operating at full effective capacity
7% growth in U.S. export demand in 2004
History shows operating rate is a leading indicator for price
Financial pressure worldwide has lead to a rising price environment
Raw material and energy costs
Freight (rail and/or ocean)
Chinese governmental influence (e.g. credit, VAT duty drawback)
Global utilization – the world is sold out
FMC is positioned for higher soda ash profitability
Lowest cost producer
Domestic and export price recovery
Incremental capacity options exist at FMC Granger
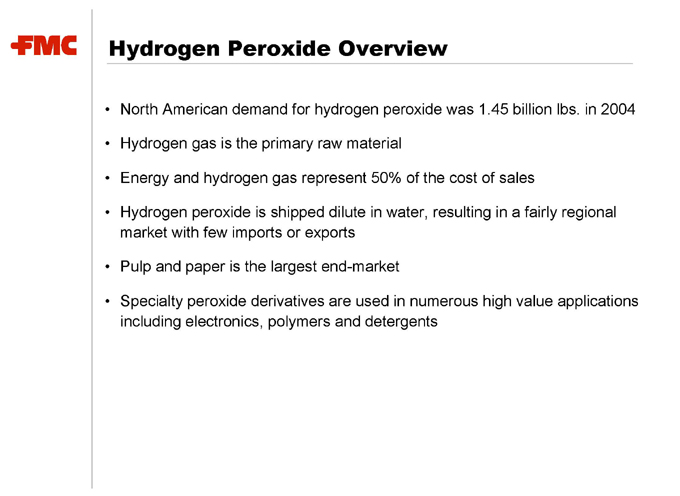
Hydrogen Peroxide Overview
North American demand for hydrogen peroxide was 1.45 billion lbs. in 2004
Hydrogen gas is the primary raw material
Energy and hydrogen gas represent 50% of the cost of sales
Hydrogen peroxide is shipped dilute in water, resulting in a fairly regional market with few imports or exports
Pulp and paper is the largest end-market
Specialty peroxide derivatives are used in numerous high value applications including electronics, polymers and detergents
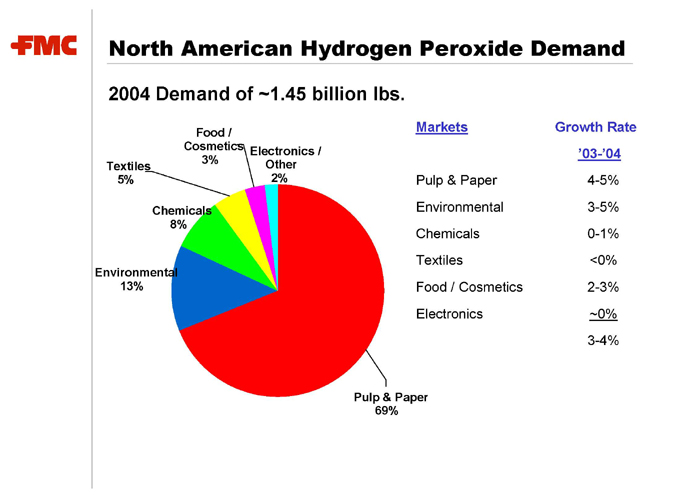
North American Hydrogen Peroxide Demand
2004 Demand of ~1.45 billion lbs.
Food/Cosmetics 3%
Electronics/Other 2%
Textiles 5%
Chemicals 8%
Environmental 13%
Pulp & Paper 69%
Markets Growth Rate ‘03-’04
Pulp & Paper 4-5%
Environmental 3-5%
Chemicals 0-1%
Textiles <0%
Food / Cosmetics 2-3%
Electronics 0%
3-4%
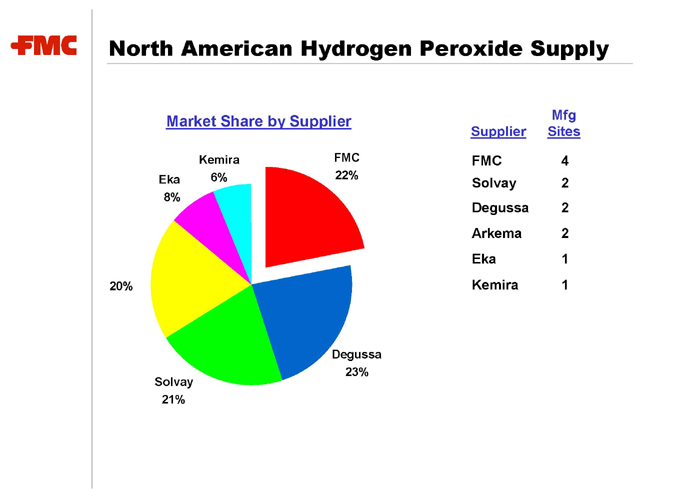
North American Hydrogen Peroxide Supply
Market Share by Supplier
Kemira 6%
FMC 22%
Eka 8%
20%
Solvay 21%
Degussa 23%
Supplier Mfg Sites
FMC 4
Solvay 2
Degussa 2
Arkema 2
Eka 1
Kemira 1
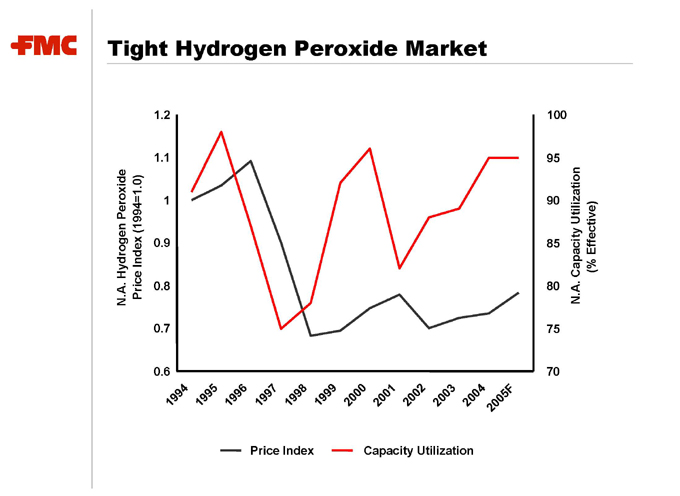
Tight Hydrogen Peroxide Market
N.A. Hydrogen Peroxide Price Index (1994=1.0)
1.2 1.1 1 0.9 0.8 0.7 0.6
100 95 90 85 80 75 70
N.A. Capacity Utilization
(% Effective)
1994 1995 1996 1997 1998 1999 2000 2001 2002 2003 2004
2005F
Price Index Capacity Utilization
Hydrogen Peroxide Summary
Tight operating conditions expected to continue
Capacity utilization now in the mid 90’s
Solvay capacity addition to come on in second half of 2005
Solvay increment (~4% increase to industry capacity) is expected to be absorbed by continued demand growth
Steadily rising prices
Prices started to improve in 2003 as capacity utilization rose above 90%
Higher energy costs drive need for higher prices
Prices are expected to increase a couple cents on average in 2005
FMC is positioned for higher profitability
Low cost producer
Broadest geographic coverage
Higher value mix
FMC Corporation