Exhibit 99.1

FMC Corporation
Banc of America Securities 2005 Basic Industries Conference
May 4, 2005
William G. Walter Chairman, President, CEO
Disclaimer
Safe Harbor Statement under the Private Securities Litigation Reform Act of 1995
These slides and the accompanying presentation contain “forward-looking statements” that represent management’s best judgment as of the date hereof based on information currently available. Actual results of the Company may differ materially from those contained in the forward-looking statements.
Additional information concerning factors that may cause results to differ materially from those in the forward-looking statements is contained in the Company’s periodic reports filed under the Securities Exchange Act of 1934, as amended.
The Company undertakes no obligation to update or revise these forward-looking statements to reflect new events or uncertainties.
Non-GAAP Financial Terms
These slides contain certain “non-GAAP financial terms” which are defined in the appendix. In addition, we have provided reconciliations of non-GAAP terms to the closest GAAP term in the appendix.
1
FMC Corporation
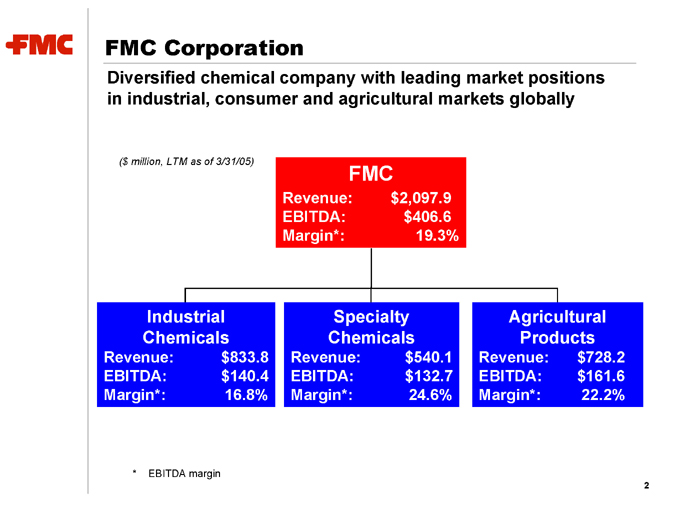
Diversified chemical company with leading market positions in industrial, consumer and agricultural markets globally
($ million, LTM as of 3/31/05)
FMC
Revenue: $2,097.9
EBITDA: $406.6
Margin*: 19.3%
Industrial
Chemicals
Revenue: $833.8
EBITDA: $140.4
Margin*: 16.8%
Specialty
Chemicals
Revenue: $540.1
EBITDA: $132.7
Margin*: 24.6%
Agricultural
Products
Revenue: $728.2
EBITDA: $161.6
Margin*: 22.2%
* EBITDA margin
2
Near-term Objectives
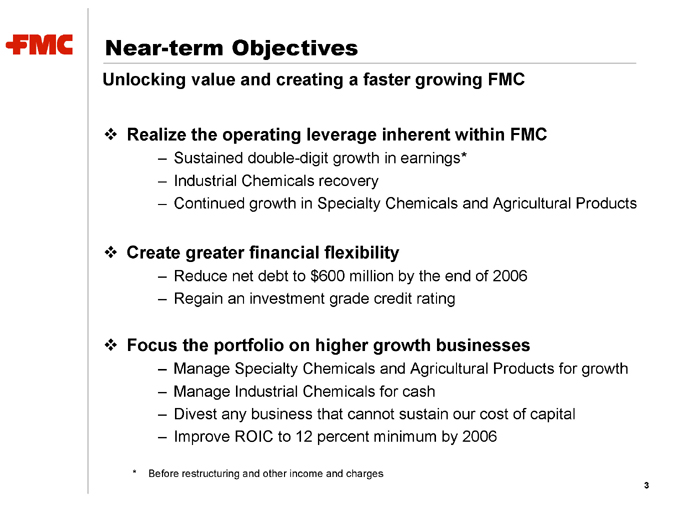
Unlocking value and creating a faster growing FMC
Realize the operating leverage inherent within FMC
Sustained double-digit growth in earnings*
Industrial Chemicals recovery
Continued growth in Specialty Chemicals and Agricultural Products
Create greater financial flexibility
Reduce net debt to $600 million by the end of 2006
Regain an investment grade credit rating
Focus the portfolio on higher growth businesses
Manage Specialty Chemicals and Agricultural Products for growth
Manage Industrial Chemicals for cash
Divest any business that cannot sustain our cost of capital
Improve ROIC to 12 percent minimum by 2006
* Before restructuring and other income and charges
3
On Track to Exceed Our Objectives
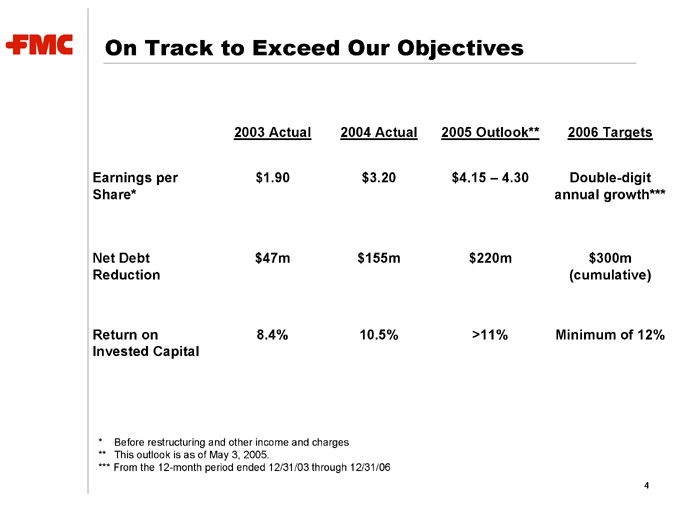
2003 Actual 2004 Actual 2005 Outlook** 2006 Targets
Earnings per $1.90 $ 3.20 $4.15 – 4.30 Double-digit
Share* annual growth***
Net Debt $47m $155m $220m $300m
Reduction (cumulative)
Return on 8.4% 10.5% >11% Minimum of 12%
Invested Capital
* Before restructuring and other income and charges
** This outlook is as of May 3, 2005.
*** From the 12-month period ended 12/31/03 through 12/31/06
4
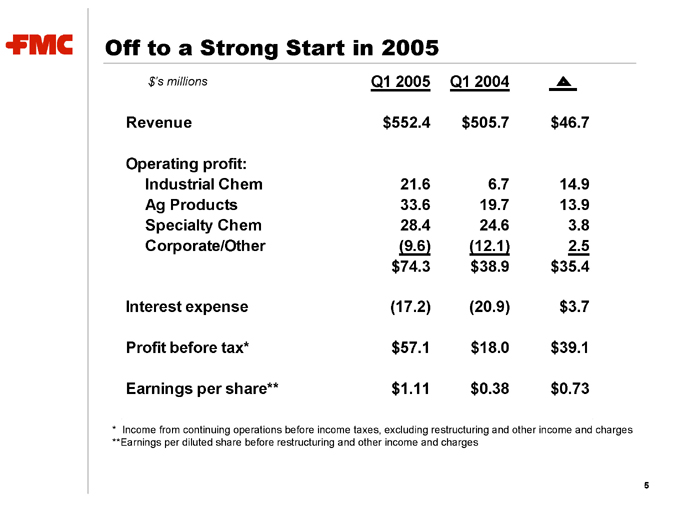
Off to a Strong Start in 2005
$’s millions Q1 2005 Q1 2004
Revenue $552.4 $ 505.7 $46.7
Operating profit:
Industrial Chem 21.6 6.7 14.9
Ag Products 33.6 19.7 13.9
Specialty Chem 28.4 24.6 3.8
Corporate/Other (9.6) (12.1) 2.5
$74.3 $38.9 $35.4
Interest expense (17.2) (20.9) $ 3.7
Profit before tax* $57.1 $18.0 $39.1
Earnings per share** $1.11 $ 0.38 $0.73
* Income from continuing operations before income taxes, excluding restructuring and other income and charges **Earnings per diluted share before restructuring and other income and charges
5
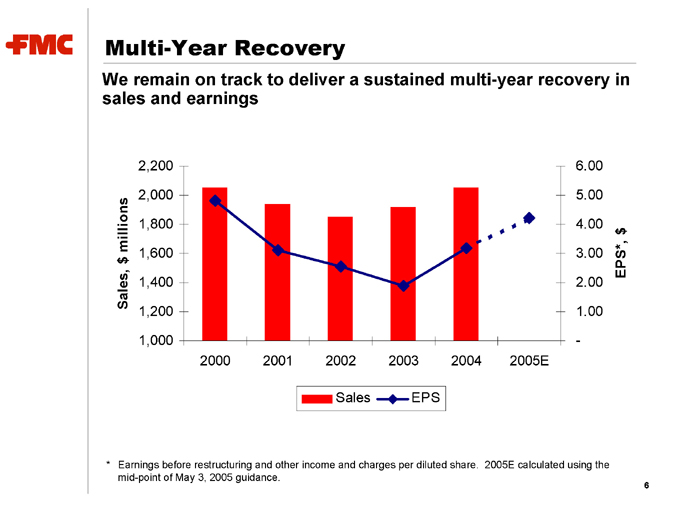
Multi-Year Recovery
We remain on track to deliver a sustained multi-year recovery in sales and earnings
Sales, $ millions
2,200
2,000
1,800
1,600 1,400 1,200
1,000
2000 2001 2002 2003 2004 2005E
6.00
5.00
4.00 3.00
2.00 1.00
EPS*, $
* Earnings before restructuring and other income and charges per diluted share. 2005E calculated using the mid-point of May 3, 2005 guidance.
6
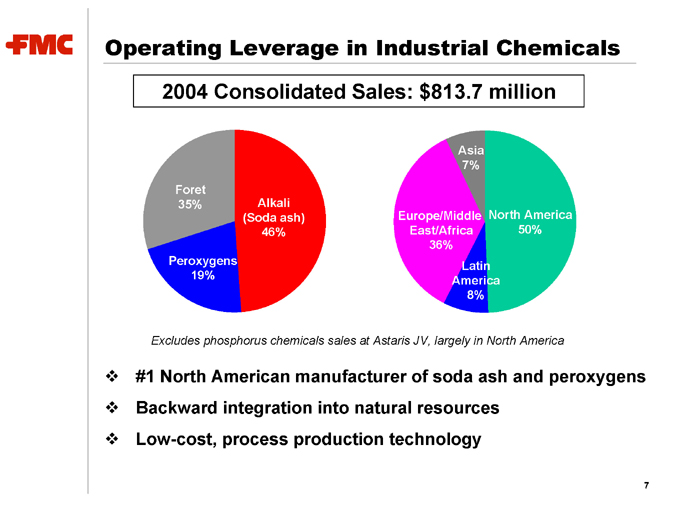
Operating Leverage in Industrial Chemicals
2004 Consolidated Sales: $813.7 million
Foret 35%
Peroxygens 19%
Alkali (Soda ash) 46%
Asia 7%
Europe/Middle East/Africa 36%
North America 50%
Latin America 8%
Excludes phosphorus chemicals sales at Astaris JV, largely in North America
#1 North American manufacturer of soda ash and peroxygens
Backward integration into natural resources
Low-cost, process production technology
7
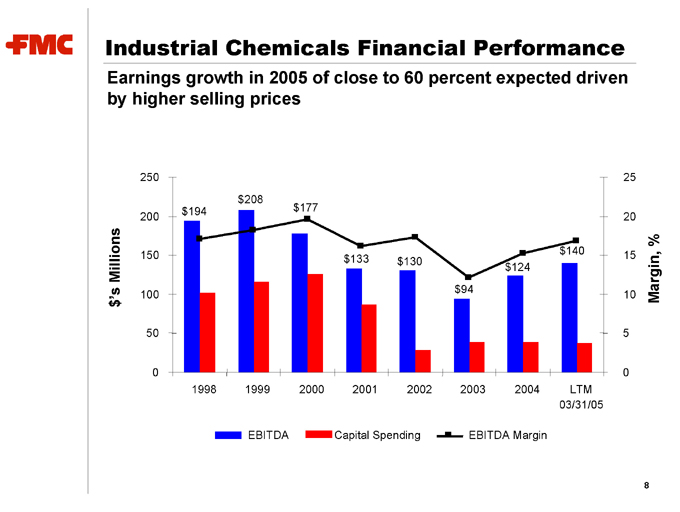
Industrial Chemicals Financial Performance
Earnings growth in 2005 of close to 60 percent expected driven by higher selling prices
$’s Millions
250
200
150
100
50
0
1998 1999 2000 2001 2002 2003 2004 LTM
03/31/05
EBITDA
Capital Spending
EBITDA Margin
Margin, %
25 20 15 10 5 0 $194 $208 $177 $133 $130 $94 $124 $140
8
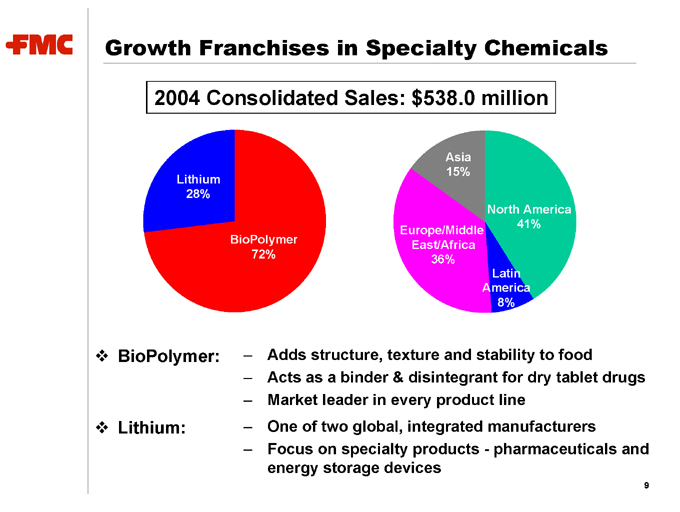
Growth Franchises in Specialty Chemicals
2004 Consolidated Sales: $538.0 million
Lithium 28%
BioPolymer 72%
Asia 15%
Europe/Middle East/Africa 36%
North America 41%
Latin America 8%
BioPolymer: Adds structure, texture and stability to food
Acts as a binder & disintegrant for dry tablet drugs
Market leader in every product line
Lithium: One of two global, integrated manufacturers
Focus on specialty products—pharmaceuticals and energy storage devices
9
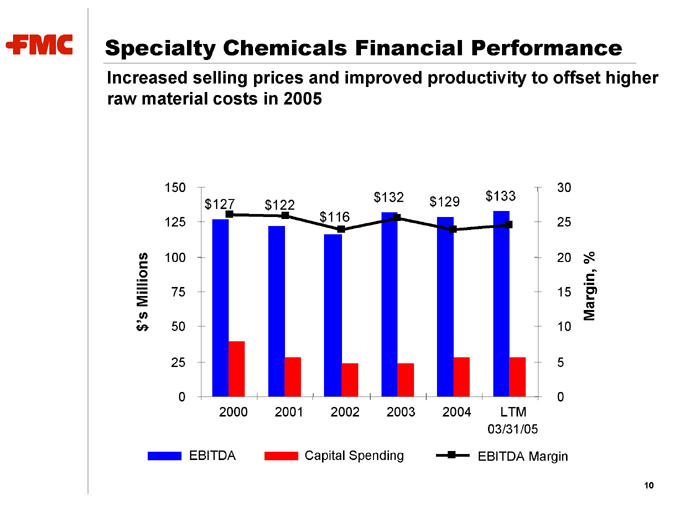
Specialty Chemicals Financial Performance
Increased selling prices and improved productivity to offset higher raw material costs in 2005
$’s Millions
150
125
100
75
50
25
0 $132 $129 $133 $127 $122 $116
2000 2001 2002 2003 2004 LTM
03/31/05
30
25
20 % Margin,
15
10
5
0
EBITDA
Capital Spending
EBITDA Margin
10
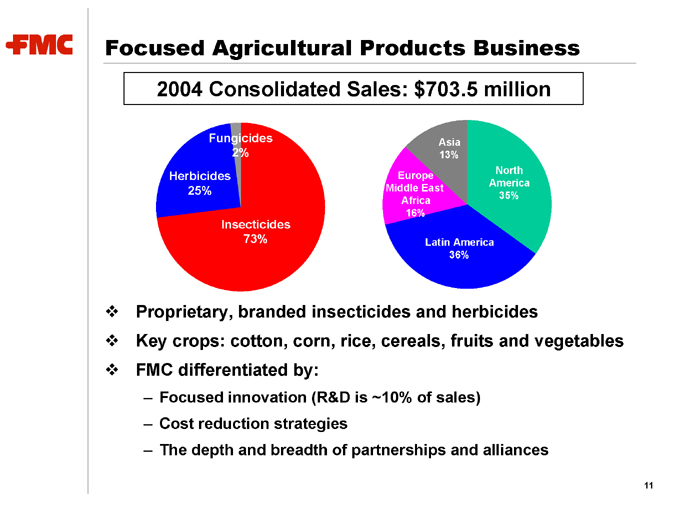
Focused Agricultural Products Business
2004 Consolidated Sales: $703.5 million
Fungicides 2%
Herbicides 25%
Insecticides 73%
Asia 13%
Europe Middle East Africa 16%
North America 35%
Latin America 36%
Proprietary, branded insecticides and herbicides
Key crops: cotton, corn, rice, cereals, fruits and vegetables FMC differentiated by:
Focused innovation (R&D is ~10% of sales)
Cost reduction strategies
The depth and breadth of partnerships and alliances
11
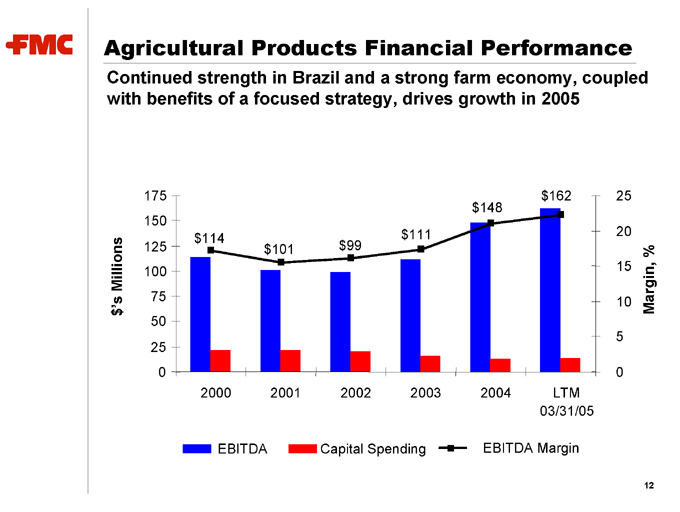
Agricultural Products Financial Performance
Continued strength in Brazil and a strong farm economy, coupled with benefits of a focused strategy, drives growth in 2005
$’s Millions
175
150
125
100
75
50 25 0 $114 $111 $101 $99 $162 $148
2000 2001 2002 2003 2004 LTM
03/31/05
25
20
15
Margin, %
10
5 0
EBITDA
Capital Spending
EBITDA Margin
12
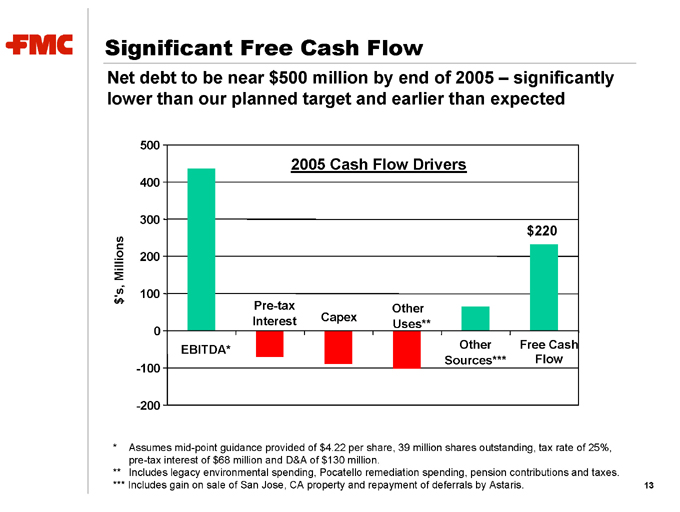
Significant Free Cash Flow
Net debt to be near $500 million by end of 2005 – significantly lower than our planned target and earlier than expected
$’s Millions
500
400
300
200
100
0 -100 -200
2005 Cash Flow Drivers
EBITDA*
Pre-tax Interest
Capex
Other Uses**
Other Sources*** Free Cash Flow
* Assumes mid-point guidance provided of $4.22 per share, 39 million shares outstanding, tax rate of 25%, pre-tax interest of $68 million and D&A of $130 million.
** Includes legacy environmental spending, Pocatello remediation spending, pension contributions and taxes.
*** Includes gain on sale of San Jose, CA property and repayment of deferrals by Astaris.
13
In Summary
Great businesses, each with EBITDA of at least $130 million Industrial Chemicals earnings only at mid-cycle in 2005 Steady growth in Specialty Chemicals and Ag Products Low capital expenditure requirements Substantial decline in unusual demands on cash flow Significant balance sheet deleveraging
14
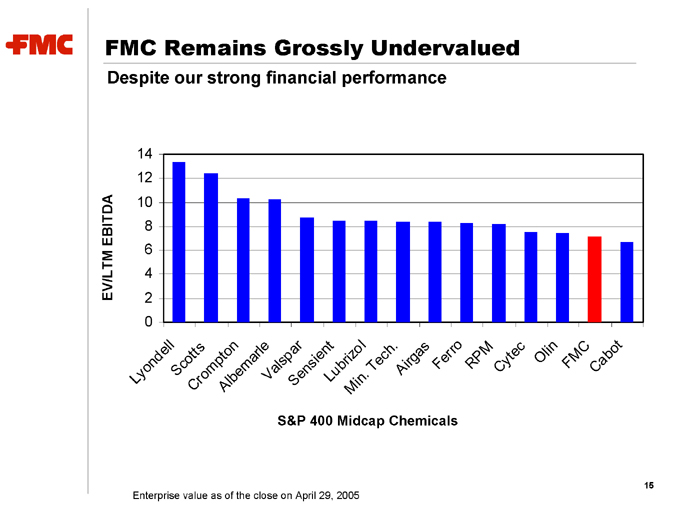
FMC Remains Grossly Undervalued
Despite our strong financial performance
14 12
10
8
6
4
2
0
EV/LTM EBITDA
Lyondell
Scotts
Crompton
Albemarle
Valspar
Sensient
Lubrizol
Min. Tech.
Airgas
Ferro RPM
Cytec
Olin
FMC
Cabot
S&P 400 Midcap Chemicals
Enterprise value as of the close on April 29, 2005
15
Disciplined Approach to Unlocking Value
Our long term objectives are focused on proactively unlocking value once financial flexibility is achieved
Maintain strategic and financial flexibility to invest in growth Actively manage the business portfolio to create value Return capital to shareholders in most efficient manner
16
FMC Corporation
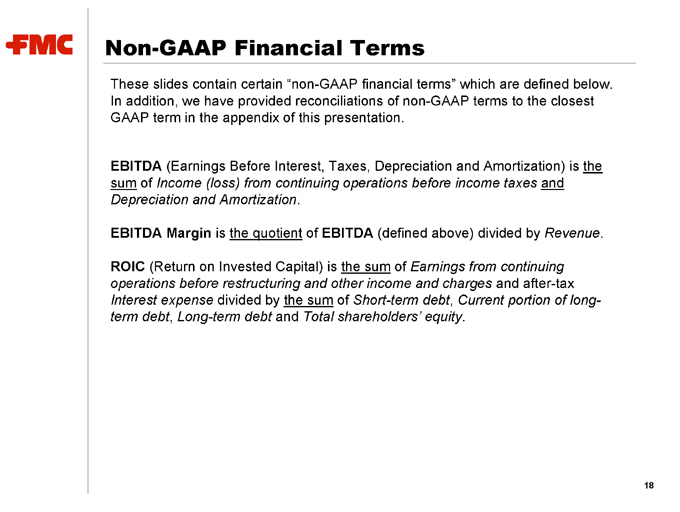
Non-GAAP Financial Terms
These slides contain certain “non-GAAP financial terms” which are defined below. In addition, we have provided reconciliations of non-GAAP terms to the closest GAAP term in the appendix of this presentation.
EBITDA (Earnings Before Interest, Taxes, Depreciation and Amortization) is the sum of Income (loss) from continuing operations before income taxes and Depreciation and Amortization.
EBITDA Margin is the quotient of EBITDA (defined above) divided by Revenue.
ROIC (Return on Invested Capital) is the sum of Earnings from continuing operations before restructuring and other income and charges and after-tax Interest expense divided by the sum of Short-term debt, Current portion of long-term debt, Long-term debt and Total shareholders’ equity.
18
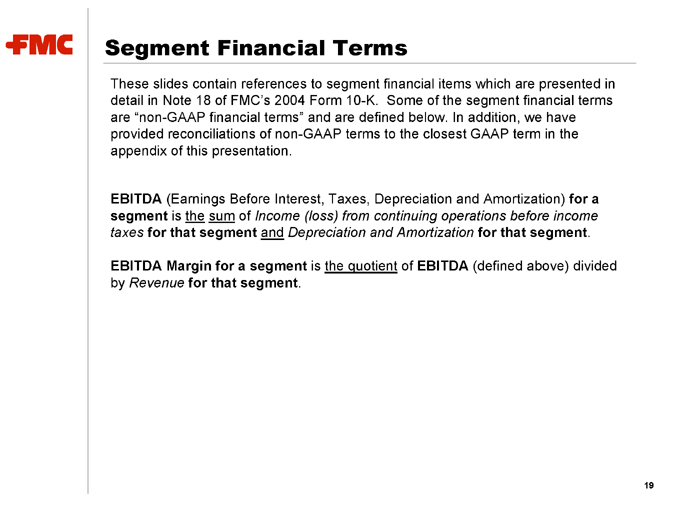
Segment Financial Terms
These slides contain references to segment financial items which are presented in detail in Note 18 of FMC’s 2004 Form 10-K. Some of the segment financial terms are “non-GAAP financial terms” and are defined below. In addition, we have provided reconciliations of non-GAAP terms to the closest GAAP term in the appendix of this presentation.
EBITDA (Earnings Before Interest, Taxes, Depreciation and Amortization) for a segment is the sum of Income (loss) from continuing operations before income taxes for that segment and Depreciation and Amortization for that segment.
EBITDA Margin for a segment is the quotient of EBITDA (defined above) divided by Revenue for that segment.
19
Appendix:
2003 and 2004 Earnings Reconciliation
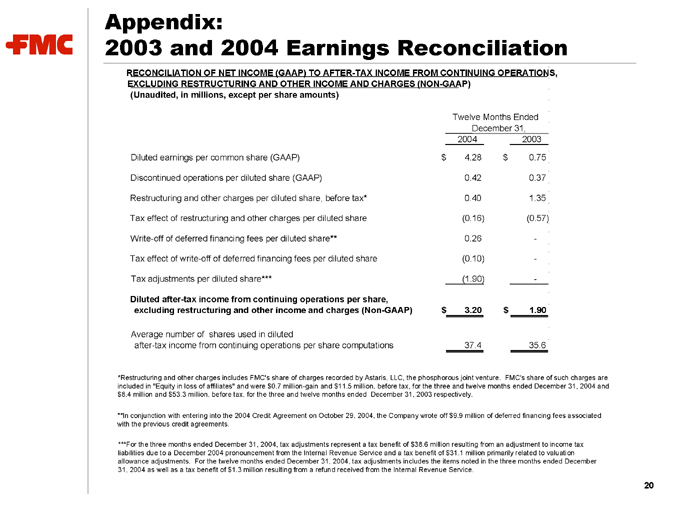
RECONCILIATION OF NET INCOME (GAAP) TO AFTER-TAX INCOME FROM CONTINUING OPERATIONS, EXCLUDING RESTRUCTURING AND OTHER INCOME AND CHARGES (NON-GAAP) (Unaudited, in millions, except per share amounts)
Twelve Months Ended December 31,
2004 2003
Diluted earnings per common share (GAAP) $4.28 $0.75
Discontinued operations per diluted share (GAAP) 0.42 0.37
Restructuring and other charges per diluted share, before tax* 0.40 1.35
Tax effect of restructuring and other charges per diluted share (0.16) (0.57)
Write-off of deferred financing fees per diluted share** 0.26 -
Tax effect of write-off of deferred financing fees per diluted share (0.10) -
Tax adjustments per diluted share*** (1.90) -
Diluted after-tax income from continuing operations per share,
excluding restructuring and other income and charges (Non-GAAP) $3.20 $1.90
Average number of shares used in diluted
after-tax income from continuing operations per share computations 37.4 35.6
*Restructuring and other charges includes FMC’s share of charges recorded by Astaris, LLC, the phosphorous joint venture. FMC’s share of such charges are included in “Equity in loss of affiliates” and were $0.7 million-gain and $11.5 million, before tax, for the three and twelve months ended December 31, 2004 and $8.4 million and $53.3 million, before tax, for the three and twelve months ended December 31, 2003 respectively.
**In conjunction with entering into the 2004 Credit Agreement on October 29, 2004, the Company wrote off $9.9 million of deferred financing fees associated with the previous credit agreements.
***For the three months ended December 31, 2004, tax adjustments represent a tax benefit of $38.6 million resulting from an adjustment to income tax liabilities due to a December 2004 pronouncement from the Internal Revenue Service and a tax benefit of $31.1 million primarily related to valuation allowance adjustments. For the twelve months ended December 31, 2004, tax adjustments includes the items noted in the three months ended December 31, 2004 as well as a tax benefit of $1.3 million resulting from a refund received from the Internal Revenue Service.
20
Appendix:
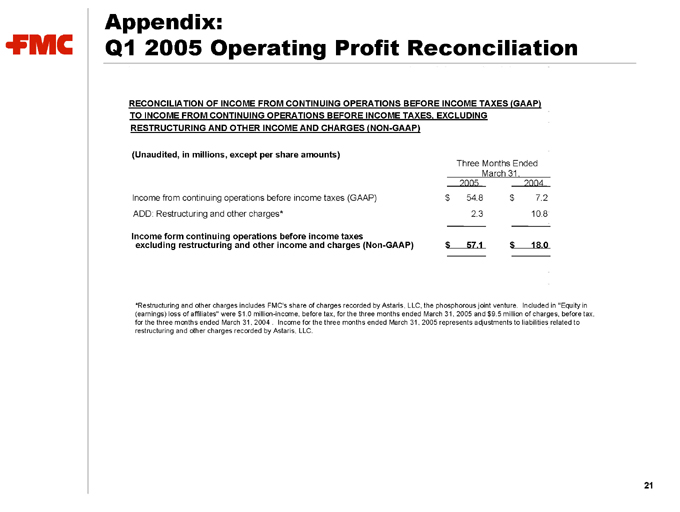
Q1 2005 Operating Profit Reconciliation
RECONCILIATION OF INCOME FROM CONTINUING OPERATIONS BEFORE INCOME TAXES (GAAP) TO INCOME FROM CONTINUING OPERATIONS BEFORE INCOME TAXES, EXCLUDING
RESTRUCTURING AND OTHER INCOME AND CHARGES (NON-GAAP)
(Unaudited, in millions, except per share amounts)
Three Months Ended
March 31,
2005 2004
Income from continuing operations before income taxes (GAAP) $ 54.8 $ 7.2
ADD: Restructuring and other charges* 2.3 10.8
Income form continuing operations before income taxes
excluding restructuring and other income and charges (Non-GAAP) $ 57.1 $ 18.0
*Restructuring and other charges includes FMC’s share of charges recorded by Astaris, LLC, the phosphorous joint venture. Included in “Equity in (earnings) loss of affiliates” were $1.0 million-income, before tax, for the three months ended March 31, 2005. and $9.5 million of charges, before tax, for the three months ended March 31, 2004 . Income for the three months ended March 31, 2005 represents adjustments to liabilities related to restructuring and other charges recorded by Astaris, LLC.
21
Appendix:
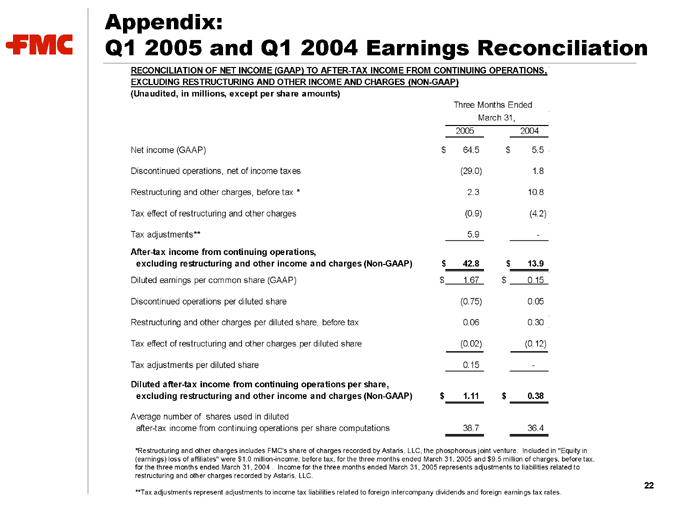
Q1 2005 and Q1 2004 Earnings Reconciliation
RECONCILIATION OF NET INCOME (GAAP) TO AFTER-TAX INCOME FROM CONTINUING OPERATIONS, EXCLUDING RESTRUCTURING AND OTHER INCOME AND CHARGES (NON-GAAP) (Unaudited, in millions, except per share amounts)
Three Months Ended
March 31,
2005 2004
Net income (GAAP) $64.5 $ 5.5
Discontinued operations, net of income taxes (29.0) 1.8
Restructuring and other charges, before tax * 2.3 10.8
Tax effect of restructuring and other charges (0.9) (4.2)
Tax adjustments** 5.9 -
After-tax income from continuing operations,
excluding restructuring and other income and charges (Non-GAAP) $42.8 $ 13.9
Diluted earnings per common share (GAAP) $1.67 $0.15
Discontinued operations per diluted share (0.75) 0.05
Restructuring and other charges per diluted share, before tax 0.06 0.30
Tax effect of restructuring and other charges per diluted share (0.02) (0.12)
Tax adjustments per diluted share 0.15 -
Diluted after-tax income from continuing operations per share,
excluding restructuring and other income and charges (Non-GAAP) $1.11 $0.38
Average number of shares used in diluted
after-tax income from continuing operations per share computations 38.7 36.4
*Restructuring and other charges includes FMC’s share of charges recorded by Astaris, LLC, the phosphorous joint venture. Included in “Equity in (earnings) loss of affiliates” were $1.0 million-income, before tax, for the three months ended March 31, 2005 and $9.5 million of charges, before tax, for the three months ended March 31, 2004 . Income for the three months ended March 31, 2005 represents adjustments to liabilities related to restructuring and other charges recorded by Astaris, LLC.
22
**Tax adjustments represent adjustments to income tax liabilities related to foreign intercompany dividends and foreign earnings tax rates.
Appendix:
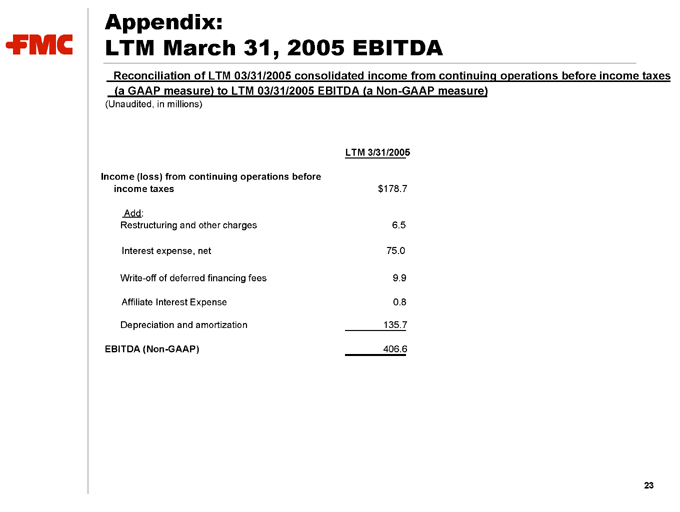
LTM March 31, 2005 EBITDA
Reconciliation of LTM 03/31/2005 consolidated income from continuing operations before income taxes (a GAAP measure) to LTM 03/31/2005 EBITDA (a Non-GAAP measure)
(Unaudited, in millions)
LTM 3/31/2005
Income (loss) from continuing operations before
income taxes $ 178.7
Add:
Restructuring and other charges 6.5
Interest expense, net 75.0
Write-off of deferred financing fees 9.9
Affiliate Interest Expense 0.8
Depreciation and amortization 135.7
EBITDA (Non-GAAP) 406.6
23
Appendix:
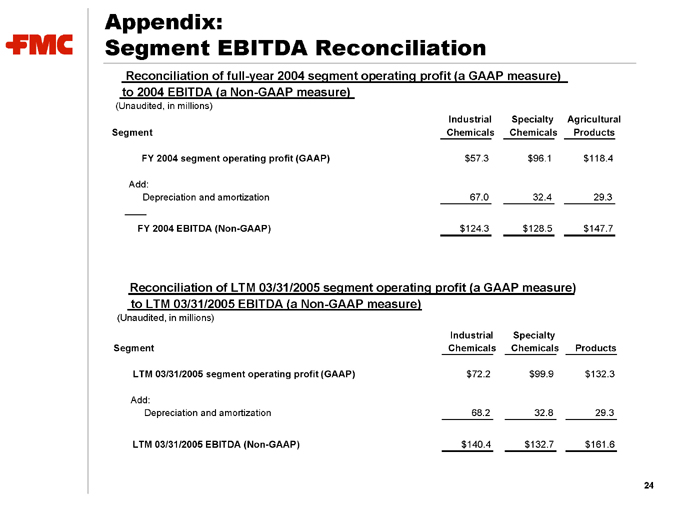
Segment EBITDA Reconciliation
Reconciliation of full-year 2004 segment operating profit (a GAAP measure) to 2004 EBITDA (a Non-GAAP measure)
(Unaudited, in millions)
Industrial Specialty Agricultural
Segment Chemicals Chemicals Products
FY 2004 segment operating profit (GAAP) $ 57.3 $ 96.1 $ 118.4
Add:
Depreciation and amortization 67.0 32.4 29.3
FY 2004 EBITDA (Non-GAAP) $ 124.3 $ 128.5 $ 147.7
Reconciliation of LTM 03/31/2005 segment operating profit (a GAAP measure) to LTM 03/31/2005 EBITDA (a Non-GAAP measure)
(Unaudited, in millions)
Industrial Specialty
Segment Chemicals Chemicals Products
LTM 03/31/2005 segment operating profit (GAAP) $ 72.2 $ 99.9 $ 132.3
Add:
Depreciation and amortization 68.2 32.8 29.3
LTM 03/31/2005 EBITDA (Non-GAAP) $ 140.4 $ 132.7 $ 161.6
24
Appendix:
ROIC Reconciliation
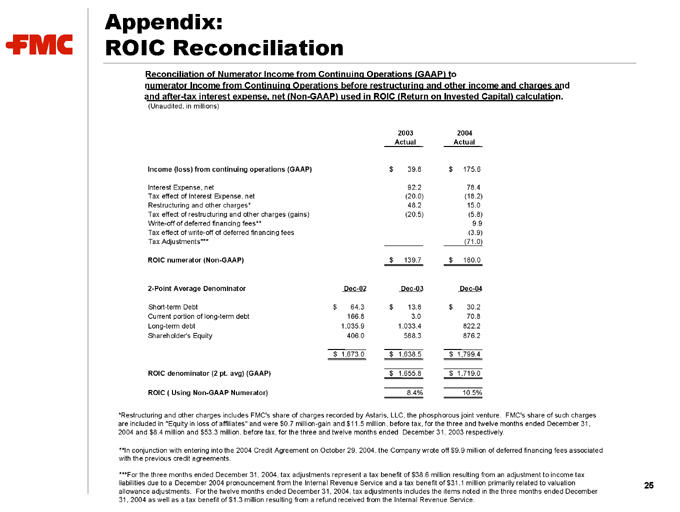
Reconciliation of Numerator Income from Continuing Operations (GAAP) to numerator Income from Continuing Operations before restructuring and other income and charges and and after-tax interest expense, net (Non-GAAP) used in ROIC (Return on Invested Capital) calculation.
(Unaudited, in millions)
2003 2004
Actual Actual
Income (loss) from continuing operations (GAAP) $ 39.8 $ 175.6
Interest Expense, net 92.2 78.4
Tax effect of Interest Expense, net (20.0) (18.2)
Restructuring and other charges* 48.2 15.0
Tax effect of restructuring and other charges (gains) (20.5) (5.8)
Write-off of deferred financing fees** 9.9
Tax effect of write-off of deferred financing fees (3.9)
Tax Adjustments*** (71.0)
ROIC numerator (Non-GAAP) $ 139.7 $ 180.0
2-Point Average Denominator Dec-02 Dec-03 Dec-04
Short-term Debt $ 64.3 $ 13.8 $ 30.2
Current portion of long-term debt 166.8 3.0 70.8
Long-term debt 1,035.9 1,033.4 822.2
Shareholder’s Equity 406.0 588.3 876.2
$ 1,673.0 $ 1,638.5 $ 1,799.4
ROIC denominator (2 pt. avg) (GAAP) $ 1,655.8 $ 1,719.0
ROIC ( Using Non-GAAP Numerator) 8.4% 10.5%
*Restructuring and other charges includes FMC’s share of charges recorded by Astaris, LLC, the phosphorous joint venture. FMC’s share of such charges are included in “Equity in loss of affiliates” and were $0.7 million-gain and $11.5 million, before tax, for the three and twelve months ended December 31, 2004 and $8.4 million and $53.3 million, before tax, for the three and twelve months ended December 31, 2003 respectively.
**In conjunction with entering into the 2004 Credit Agreement on October 29, 2004, the Company wrote off $9.9 million of deferred financing fees associated with the previous credit agreements.
***For the three months ended December 31, 2004, tax adjustments represent a tax benefit of $38.6 million resulting from an adjustment to income tax liabilities due to a December 2004 pronouncement from the Internal Revenue Service and a tax benefit of $31.1 million primarily related to valuation allowance adjustments. For the twelve months ended December 31, 2004, tax adjustments includes the items noted in the three months ended December 31, 2004 as well as a tax benefit of $1.3 million resulting from a refund received from the Internal Revenue Service.
25

FMC Corporation