Exhibit 99.1
FMC Corporation
Bear Stearns Fourteenth Annual Global Credit Conference
May 17, 2005
Thomas C. Deas, Jr. Vice President & Treasurer
Disclaimer
Safe Harbor Statement under the Private Securities Litigation Reform Act of 1995
These slides and the accompanying presentation contain “forward-looking statements” that represent management’s best judgment as of the date hereof based on information currently available. Actual results of the Company may differ materially from those contained in the forward-looking statements.
Additional information concerning factors that may cause results to differ materially from those in the forward-looking statements is contained in the Company’s periodic reports filed under the Securities Exchange Act of 1934, as amended.
The Company undertakes no obligation to update or revise these forward-looking statements to reflect new events or uncertainties.
Non-GAAP Financial Terms
These slides contain certain “non-GAAP financial terms” which are defined in the appendix. In addition, we have provided reconciliations of non-GAAP terms to the closest GAAP term in the appendix.
1
FMC Corporation
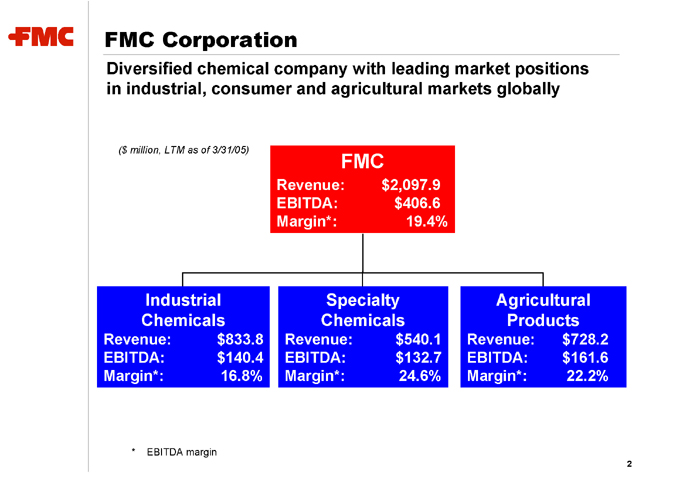
Diversified chemical company with leading market positions in industrial, consumer and agricultural markets globally
($ million, LTM as of 3/31/05)
FMC
Revenue: $2,097.9 EBITDA: $406.6 Margin*: 19.4%
Industrial Chemicals
Revenue: $833.8 EBITDA: $140.4 Margin*: 16.8%
Specialty Chemicals
Revenue: $540.1 EBITDA: $132.7 Margin*: 24.6%
Agricultural Products
Revenue: $728.2 EBITDA: $161.6 Margin*: 22.2%
* EBITDA margin
2
Company Strengths
Leading market positions
Global presence
Diversified business mix and high-quality customer base Diversified and integrated cost structure Focused R&D and strong applications expertise Commitment to strong credit profile
3
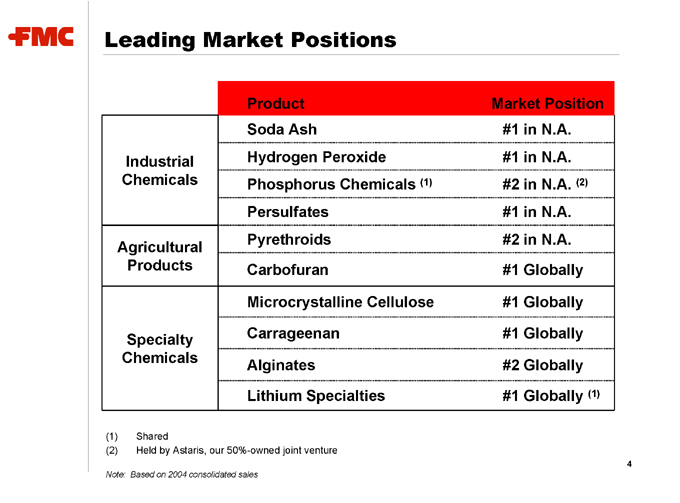
Leading Market Positions
Industrial Chemicals
Agricultural Products
Specialty Chemicals
Product Market Position
Soda Ash #1 in N.A.
Hydrogen Peroxide #1 in N.A.
Phosphorus Chemicals (1) #2 in N.A. (2)
Persulfates #1 in N.A.
Pyrethroids #2 in N.A.
Carbofuran #1 Globally
Microcrystalline Cellulose #1 Globally
Carrageenan #1 Globally
Alginates #2 Globally
Lithium Specialties #1 Globally (1)
(1) Shared
(2) Held by Astaris, our 50%-owned joint venture
Note: Based on 2004 consolidated sales
4
Leading Market Positions
Industrial Chemicals
Agricultural Products
Specialty Chemicals
Product Market Position
Soda Ash #1 in N.A.
Hydrogen Peroxide #1 in N.A.
Phosphorus Chemicals (1) #2 in N.A. (2)
Persulfates #1 in N.A.
Pyrethroids #2 in N.A.
Carbofuran #1 Globally
Microcrystalline Cellulose #1 Globally
Carrageenan #1 Globally
Alginates #2 Globally
Lithium Specialties #1 Globally (1)
(1) Shared
(2) Held by Astaris, our 50%-owned joint venture
Note: Based on 2004 consolidated sales
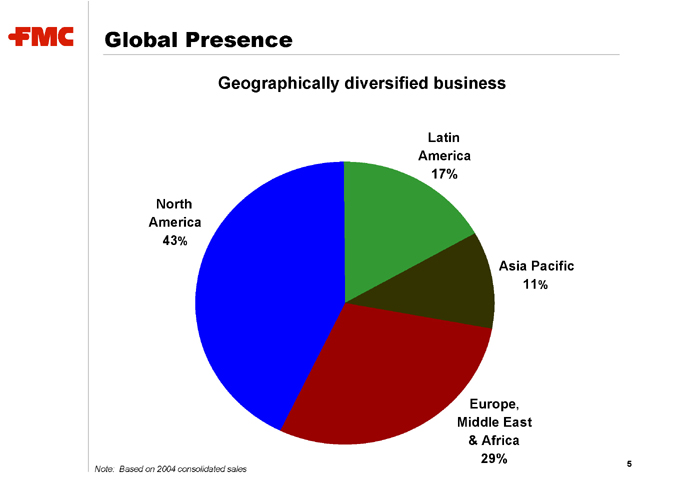
Global Presence
Geographically diversified business
North America
43 %
Latin America 17%
Asia Pacific
11 %
Europe, Middle East & Africa 29%
Note: Based on 2004 consolidated sales
5
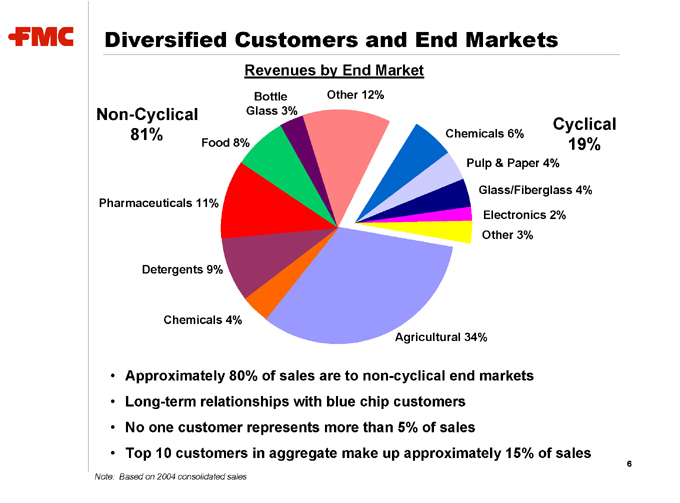
Diversified Customers and End Markets
Revenues by End Market
Non-Cyclical 81%
Other 12%
Bottle Glass 3%
Food 8%
Pharmaceuticals 11%
Detergents 9%
Chemicals 4%
Agricultural 34%
Other 3%
Electronics 2%
Glass/Fiberglass 4%
Pulp & Paper 4%
Chemicals 6%
Cyclical 19%
Approximately 80% of sales are to non-cyclical end markets Long-term relationships with blue chip customers No one customer represents more than 5% of sales
Top 10 customers in aggregate make up approximately 15% of sales
Note: Based on 2004 consolidated sales
6
Diversified and Integrated Cost Structure
Low-cost sourcing of raw materials
Backward integration: soda ash, lithium
Global sourcing of renewable resources: pulp, seaweed
Low reliance on purchased raw materials
Total raw materials represent approximately 25% of cost of sales
Limited use of petrochemical feedstock reduces volatility of raw material costs
No single raw material represents more than 7% of total raw material purchases
Low energy demand requirements
Energy costs represent approximately 10% of cost of sales
7
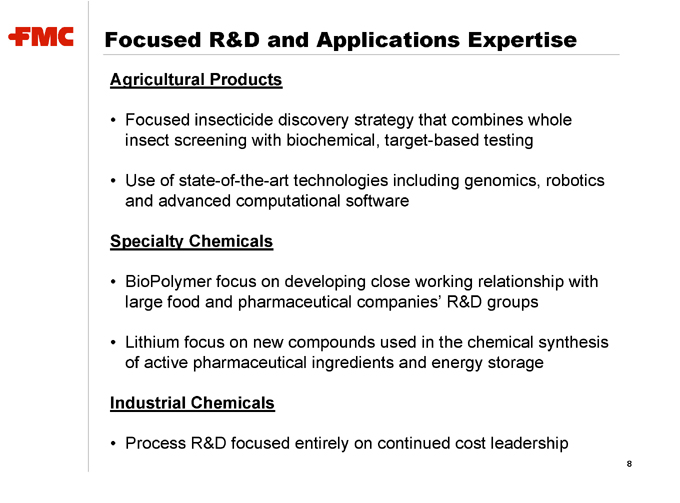
Focused R&D and Applications Expertise
Agricultural Products
Focused insecticide discovery strategy that combines whole insect screening with biochemical, target-based testing
Use of state-of-the-art technologies including genomics, robotics and advanced computational software
Specialty Chemicals
BioPolymer focus on developing close working relationship with large food and pharmaceutical companies’ R&D groups
Lithium focus on new compounds used in the chemical synthesis of active pharmaceutical ingredients and energy storage
Industrial Chemicals
Process R&D focused entirely on continued cost leadership
8
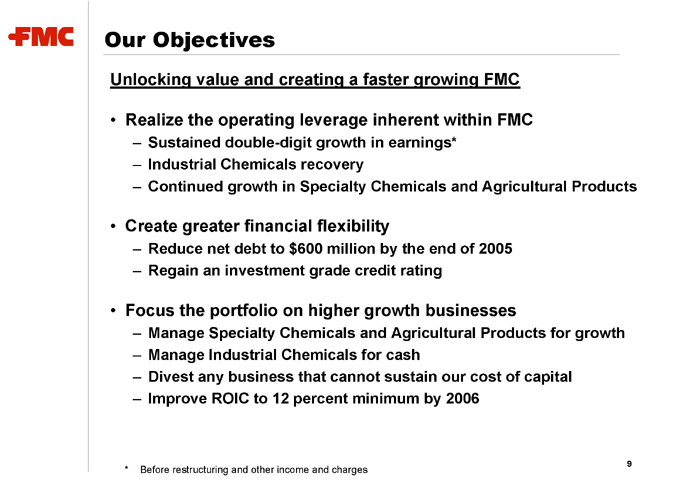
Our Objectives
Unlocking value and creating a faster growing FMC
Realize the operating leverage inherent within FMC
Sustained double-digit growth in earnings*
Industrial Chemicals recovery
Continued growth in Specialty Chemicals and Agricultural Products
Create greater financial flexibility
Reduce net debt to $600 million by the end of 2005
Regain an investment grade credit rating
Focus the portfolio on higher growth businesses
Manage Specialty Chemicals and Agricultural Products for growth
Manage Industrial Chemicals for cash
Divest any business that cannot sustain our cost of capital
Improve ROIC to 12 percent minimum by 2006
Before restructuring and other income and charges
9
Industrial Chemicals
10
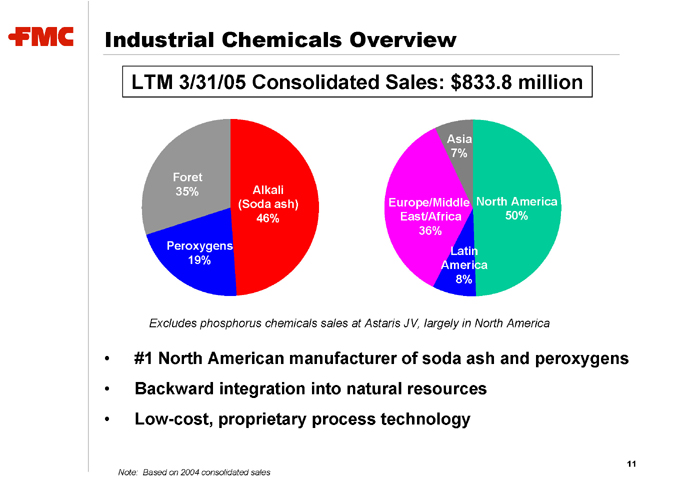
Industrial Chemicals Overview
LTM 3/31/05 Consolidated Sales: $833.8 million
Foret 35%
Peroxygens 19%
Alkali (Soda ash) 46%
Asia 7%
Europe/Middle East/Africa 36%
Latin America 8%
North America 50%
Excludes phosphorus chemicals sales at Astaris JV, largely in North America
#1 North American manufacturer of soda ash and peroxygens
Backward integration into natural resources
Low-cost, proprietary process technology
Note: Based on 2004 consolidated sales
11
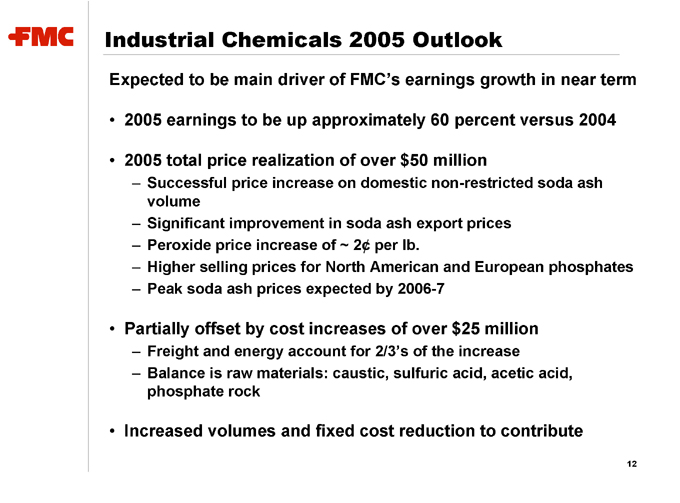
Industrial Chemicals 2005 Outlook
Expected to be main driver of FMC’s earnings growth in near term
2005 earnings to be up approximately 60 percent versus 2004
2005 total price realization of over $50 million
Successful price increase on domestic non-restricted soda ash volume
Significant improvement in soda ash export prices
Peroxide price increase of ~ 2¢ per lb.
Higher selling prices for North American and European phosphates
Peak soda ash prices expected by 2006-7
Partially offset by cost increases of over $25 million
Freight and energy account for 2/3’s of the increase
Balance is raw materials: caustic, sulfuric acid, acetic acid, phosphate rock
Increased volumes and fixed cost reduction to contribute
12
13
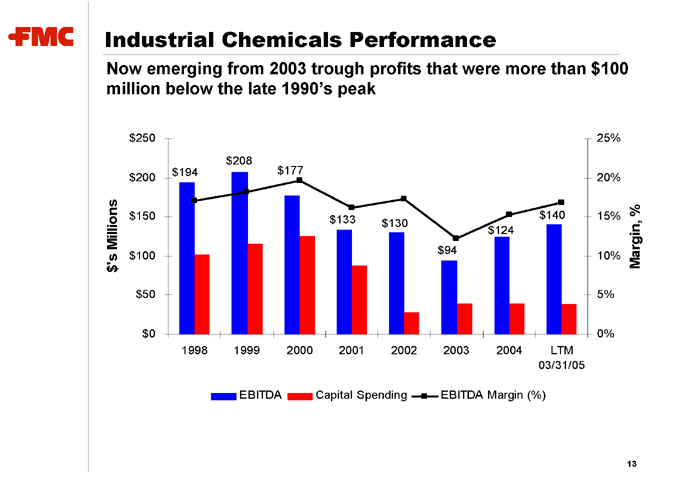
Industrial Chemicals Performance
Now emerging from 2003 trough profits that were more than $100 million below the late 1990’s peak
$’s Millions $250 $200 $150 $100 $50 $0 $194 $208 $177 $133 $130 $94 $124 $140
1998 1999 2000 2001 2002 2003 2004 LTM
03/31/05
EBITDA
Capital Spending
EBITDA Margin (%)
Margin, %
25% 20% 15% 10% 5% 0%
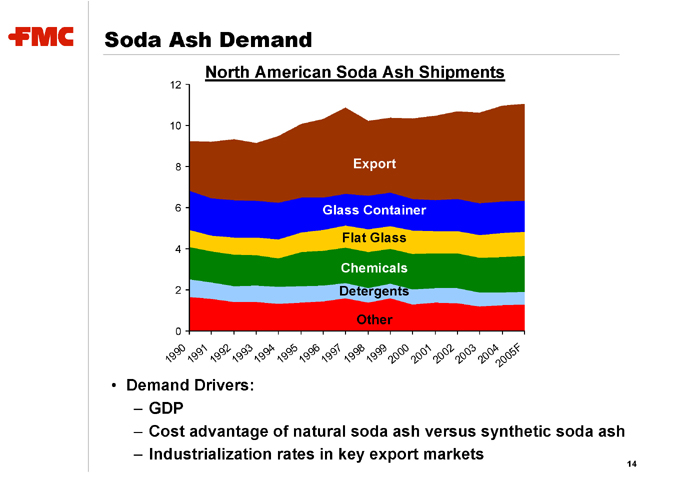
Soda Ash Demand
North American Soda Ash Shipments
Demand Drivers:
GDP
Cost advantage of natural soda ash versus synthetic soda ash
Industrialization rates in key export markets
14
Export
Glass Container
Flat Glass
Chemicals
Detergents
Other
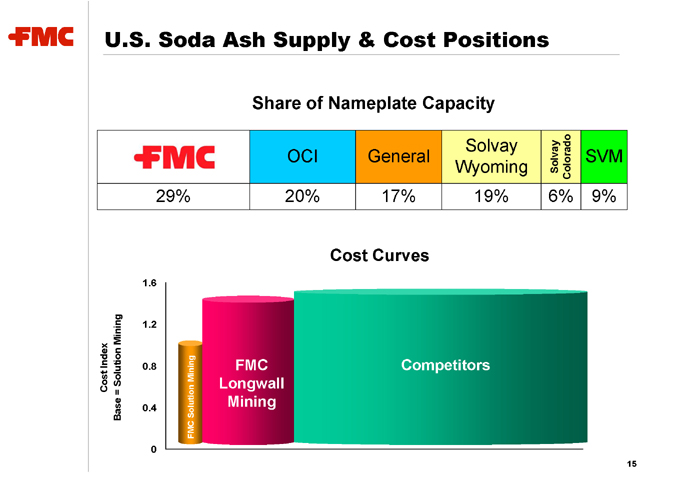
U.S. Soda Ash Supply & Cost Positions
Share of Nameplate Capacity
OCI
General
Solvay Wyoming
Solvay Colorado
SVM
29% 20% 17% 19% 6% 9%
Cost Curves
Cost Index Base = Solution Mining
1.6 1.2 0.8 0.4 0
FMC Solution Mining
FMC Longwall Mining
Competitors
15
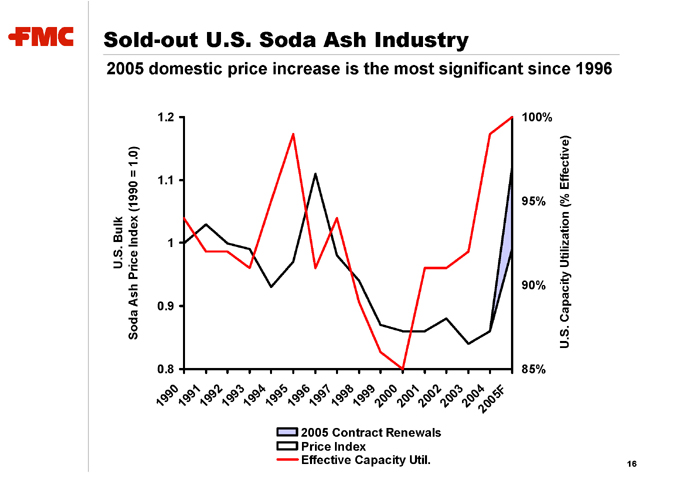
Sold-out U.S. Soda Ash Industry
2005 domestic price increase is the most significant since 1996
U.S. Bulk
Soda Ash Price Index (1990 = 1.0)
1.2 1.1 1 0.9 0.8
1990 19
91
1992 1993 1994 1995 1996 1997
1998 1999
2000
2001 2002
2003 2004
2005F
2005 Contract Renewals Price Index Effective Capacity Util.
100% 95% 90% 85%
U.S. Capacity Utilization (% Effective)
16
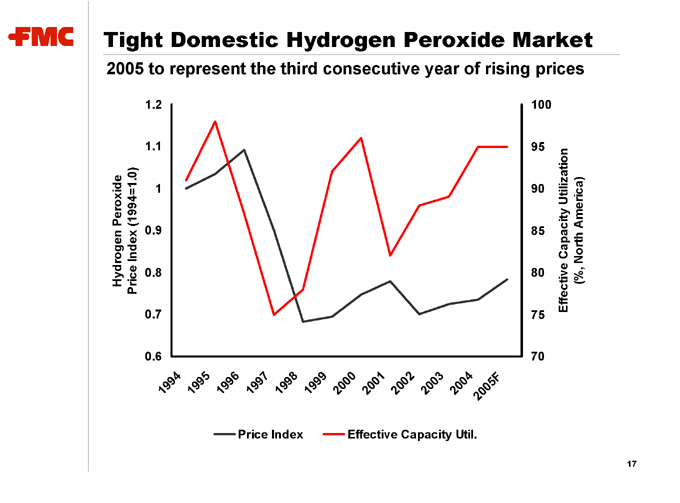
Tight Domestic Hydrogen Peroxide Market
2005 to represent the third consecutive year of rising prices
Hydrogen Peroxide Price Index (1994=1.0)
1.2 1.1 1 0.9 0.8 0.7 0.6
1994 1995
1996 1997
1998
1999
2000
2001
2002 2003
2004
2005F
Price Index
Effective Capacity Util.
100 95 90 85 80 75 70
Effective Capacity Utilization (%, North America)
17
Specialty Chemicals
18
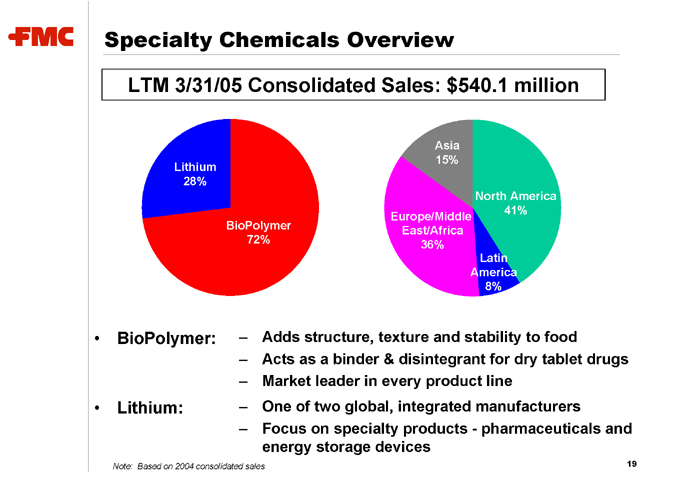
Specialty Chemicals Overview
LTM 3/31/05 Consolidated Sales: $540.1 million
Lithium 28%
BioPolymer 72%
Asia 15%
Europe/Middle East/Africa 36%
North America 41%
Latin America 8%
BioPolymer: – Adds structure, texture and stability to food
Acts as a binder & disintegrant for dry tablet drugs
Market leader in every product line
Lithium: – One of two global, integrated manufacturers
Focus on specialty products - pharmaceuticals and energy storage devices
Note: Based on 2004 consolidated sales
19

Specialty Chemicals Performance
The benefit of continued sales growth has recently been offset by cost pressures in BioPolymer
$’s Millions $150
$125 $100
$75
$50 $25
$0
2000 2001 2002 2003 2004 LTM
03/31/05
EBITDA Capital Spending EBITDA Margin (%)
$127 $122 $116 $132 $129 $133
30%
25% 20%
15%
10% 5%
0%
Margin, %
20
Specialty Chemicals 2005 Outlook
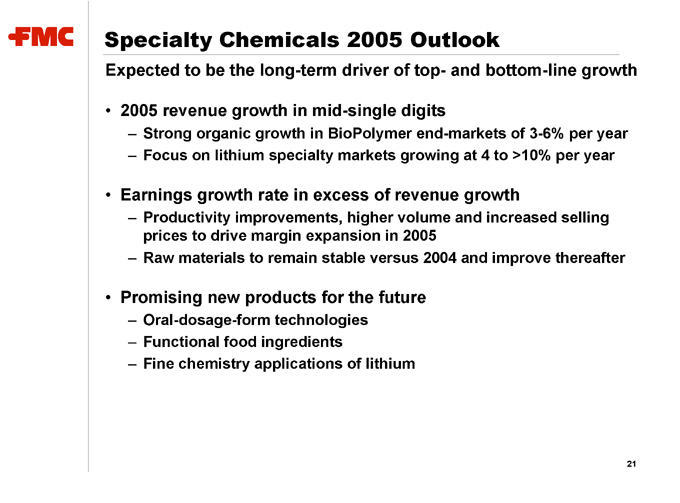
Expected to be the long-term driver of top- and bottom-line growth
2005 revenue growth in mid-single digits
Strong organic growth in BioPolymer end-markets of 3-6% per year
Focus on lithium specialty markets growing at 4 to >10% per year
Earnings growth rate in excess of revenue growth
Productivity improvements, higher volume and increased selling prices to drive margin expansion in 2005
Raw materials to remain stable versus 2004 and improve thereafter
Promising new products for the future
Oral-dosage-form technologies
Functional food ingredients
Fine chemistry applications of lithium
21
Agricultural Products
22
Agricultural Products Overview
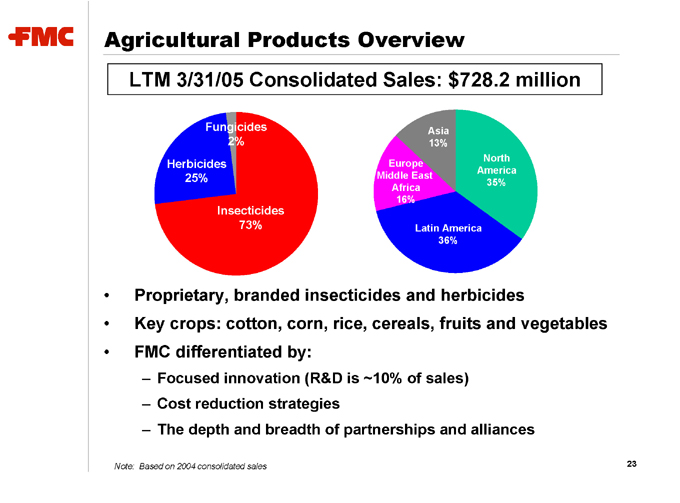
LTM 3/31/05 Consolidated Sales: $728.2 million
Fungicides 2%
Herbicides 25%
Insecticides 73%
Asia 13%
Europe Middle East Africa 16%
Latin America 36%
North America 35%
Proprietary, branded insecticides and herbicides
Key crops: cotton, corn, rice, cereals, fruits and vegetables
FMC differentiated by:
Focused innovation (R&D is ~10% of sales)
Cost reduction strategies
The depth and breadth of partnerships and alliances
Note: Based on 2004 consolidated sales
23
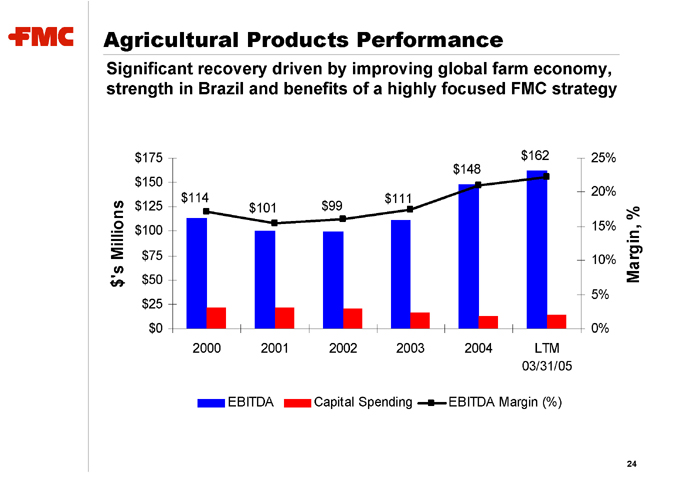
Agricultural Products Performance
Significant recovery driven by improving global farm economy, strength in Brazil and benefits of a highly focused FMC strategy
$’s Millions $175 $150 $125 $100 $75 $50 $25 $0
2000 2001 2002 2003 2004 LTM
03/31/05
Margin, %
25% 20% 15% 10% 5% 0% $114 $101 $99 $111 $148 $162
EBITDA
Capital Spending
EBITDA Margin (%)
24
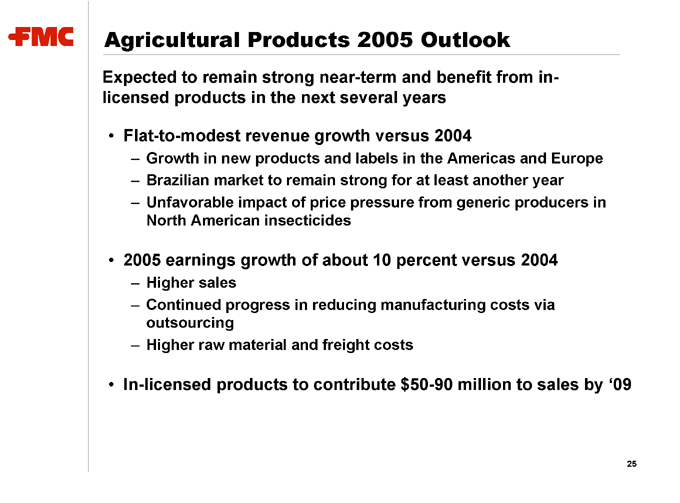
Agricultural Products 2005 Outlook
Expected to remain strong near-term and benefit from in-licensed products in the next several years
Flat-to-modest revenue growth versus 2004
Growth in new products and labels in the Americas and Europe
Brazilian market to remain strong for at least another year
Unfavorable impact of price pressure from generic producers in North American insecticides
2005 earnings growth of about 10 percent versus 2004
Higher sales
Continued progress in reducing manufacturing costs via outsourcing
Higher raw material and freight costs
In-licensed products to contribute $50-90 million to sales by ‘09
25

Financial Overview
26
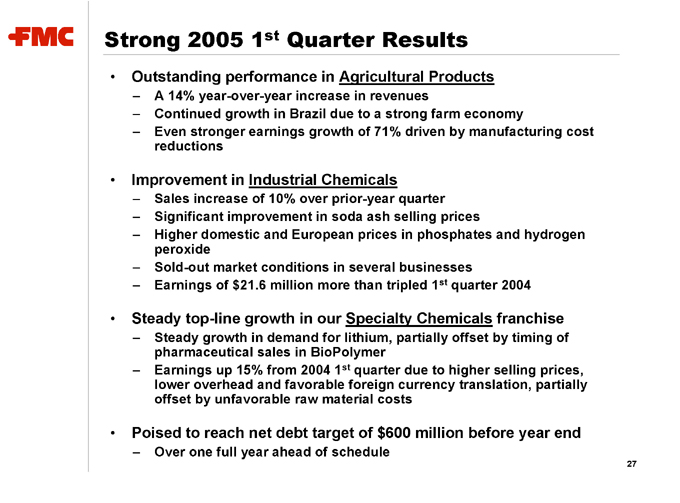
Strong 2005 1st Quarter Results
Outstanding performance in Agricultural Products
A 14% year-over-year increase in revenues
Continued growth in Brazil due to a strong farm economy
Even stronger earnings growth of 71% driven by manufacturing cost reductions
Improvement in Industrial Chemicals
Sales increase of 10% over prior-year quarter
Significant improvement in soda ash selling prices
Higher domestic and European prices in phosphates and hydrogen peroxide
Sold-out market conditions in several businesses
Earnings of $21.6 million more than tripled 1st quarter 2004
Steady top-line growth in our Specialty Chemicals franchise
Steady growth in demand for lithium, partially offset by timing of pharmaceutical sales in BioPolymer
Earnings up 15% from 2004 1st quarter due to higher selling prices, lower overhead and favorable foreign currency translation, partially offset by unfavorable raw material costs
Poised to reach net debt target of $600 million before year end
Over one full year ahead of schedule
27
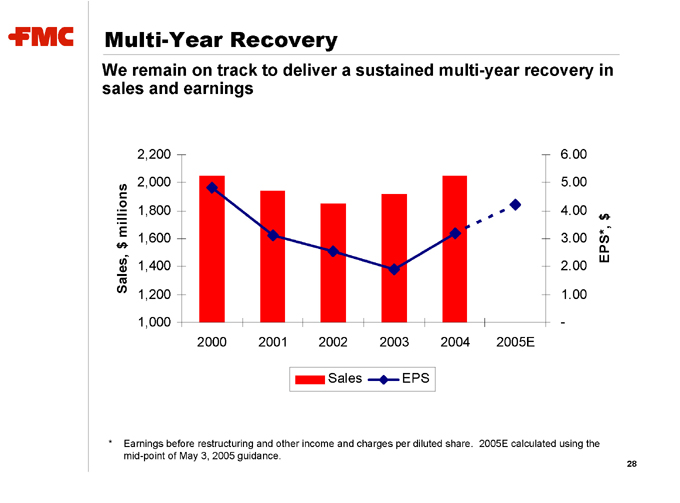
Multi-Year Recovery
We remain on track to deliver a sustained multi-year recovery in sales and earnings
Sales, $ millions
2,200 2,000
1,800 1,600 1,400
1,200 1,000
2000 2001 2002 2003 2004 2005E
Sales
EPS
6.00 5.00
4.00 3.00 2.00
1.00 -
EPS*, $
* Earnings before restructuring and other income and charges per diluted share. 2005E calculated using the mid-point of May 3, 2005 guidance.
28
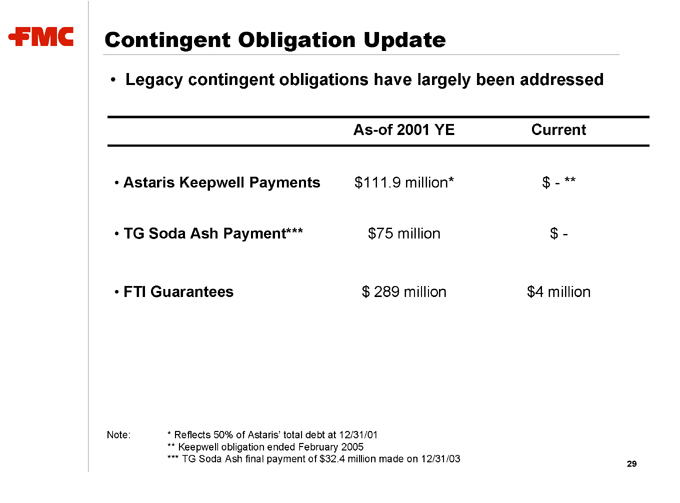
Contingent Obligation Update
Legacy contingent obligations have largely been addressed
As-of 2001 YE Current
Astaris Keepwell Payments $111.9 million* $—**
TG Soda Ash Payment*** $75 million $ -
FTI Guarantees $ 289 million $4 million
Note: * Reflects 50% of Astaris’ total debt at 12/31/01 ** Keepwell obligation ended February 2005
*** TG Soda Ash final payment of $32.4 million made on 12/31/03
29
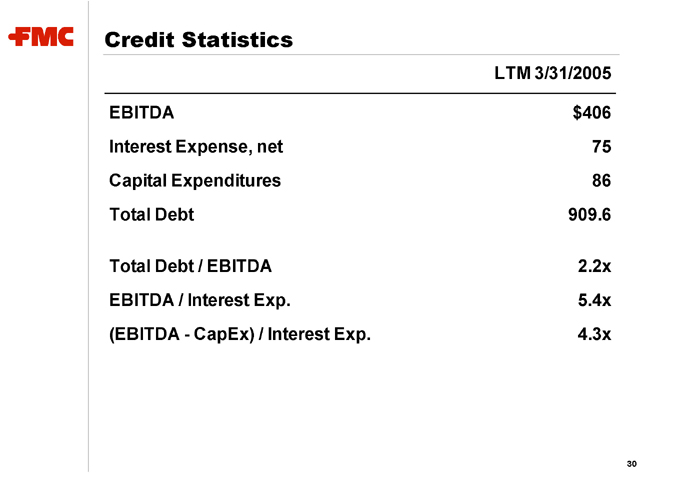
Credit Statistics
LTM 3/31/2005
EBITDA $406
Interest Expense, net 75
Capital Expenditures 86
Total Debt 909.6
Total Debt / EBITDA 2.2x
EBITDA / Interest Exp. 5.4x
(EBITDA - CapEx) / Interest Exp. 4.3x
30
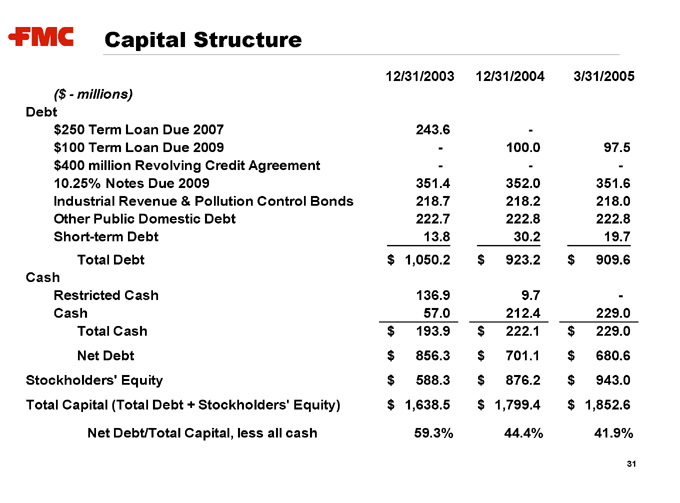
Capital Structure
12/31/2003 12/31/2004 3/31/2005
($ - millions)
Debt
$250 Term Loan Due 2007 243.6 -
$100 Term Loan Due 2009 - 100.0 97.5
$400 million Revolving Credit Agreement - - -
10.25% Notes Due 2009 351.4 352.0 351.6
Industrial Revenue & Pollution Control Bonds 218.7 218.2 218.0
Other Public Domestic Debt 222.7 222.8 222.8
Short-term Debt 13.8 30.2 19.7
Total Debt $1,050.2 $923.2 $909.6
Cash
Restricted Cash 136.9 9.7 -
Cash 57.0 212.4 229.0
Total Cash $193.9 $222.1 $229.0
Net Debt $856.3 $701.1 $680.6
Stockholders’ Equity $588.3 $876.2 $943.0
Total Capital (Total Debt + Stockholders’ Equity) $1,638.5 $1,799.4 $1,852.6
Net Debt/Total Capital, less all cash 59.3% 44.4% 41.9%
31
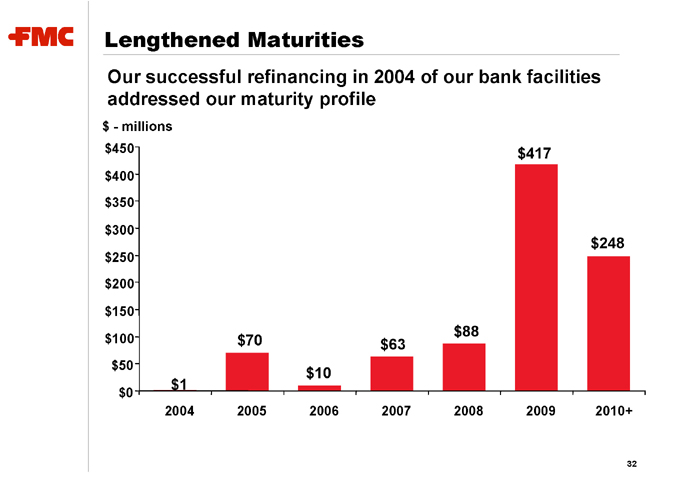
Lengthened Maturities
Our successful refinancing in 2004 of our bank facilities addressed our maturity profile $ - millions $450 $400 $350 $300 $250 $200 $150 $100 $50 $0
2004 2005 2006 2007 2008 2009 2010+ $1 $70 $10 $63 $88 $417 $248
32
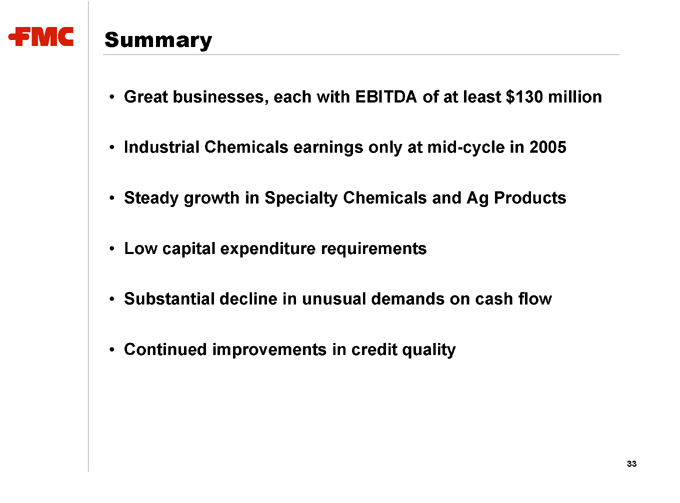
Summary
Great businesses, each with EBITDA of at least $130 million Industrial Chemicals earnings only at mid-cycle in 2005 Steady growth in Specialty Chemicals and Ag Products Low capital expenditure requirements Substantial decline in unusual demands on cash flow Continued improvements in credit quality
33
FMC Corporation
Non-GAAP Financial Terms
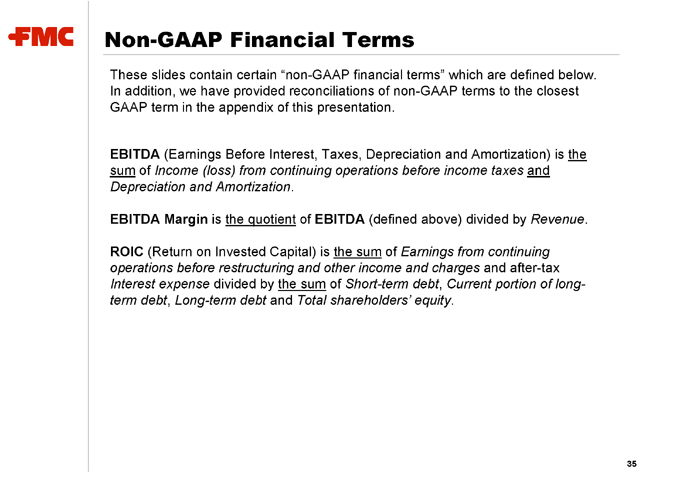
These slides contain certain “non-GAAP financial terms” which are defined below. In addition, we have provided reconciliations of non-GAAP terms to the closest GAAP term in the appendix of this presentation.
EBITDA (Earnings Before Interest, Taxes, Depreciation and Amortization) is the sum of Income (loss) from continuing operations before income taxes and Depreciation and Amortization.
EBITDA Margin is the quotient of EBITDA (defined above) divided by Revenue.
ROIC (Return on Invested Capital) is the sum of Earnings from continuing operations before restructuring and other income and charges and after-tax Interest expense divided by the sum of Short-term debt, Current portion of long-term debt, Long-term debt and Total shareholders’ equity.
35
Segment Financial Terms
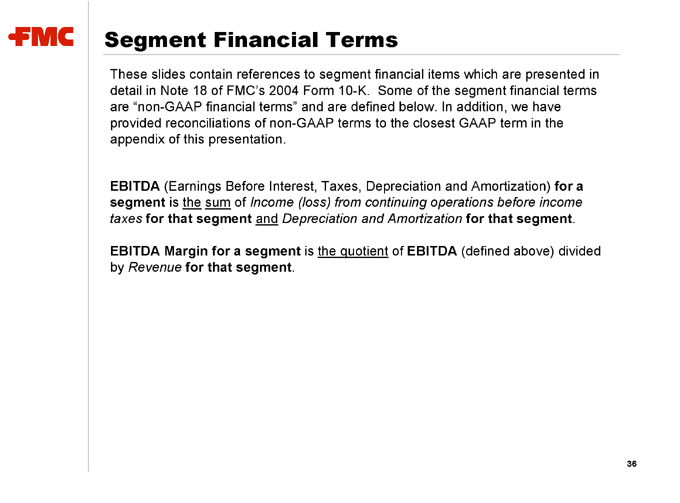
These slides contain references to segment financial items which are presented in detail in Note 18 of FMC’s 2004 Form 10-K. Some of the segment financial terms are “non-GAAP financial terms” and are defined below. In addition, we have provided reconciliations of non-GAAP terms to the closest GAAP term in the appendix of this presentation.
EBITDA (Earnings Before Interest, Taxes, Depreciation and Amortization) for a segment is the sum of Income (loss) from continuing operations before income taxes for that segment and Depreciation and Amortization for that segment.
EBITDA Margin for a segment is the quotient of EBITDA (defined above) divided by Revenue for that segment.
36
Appendix: Earnings Reconciliation
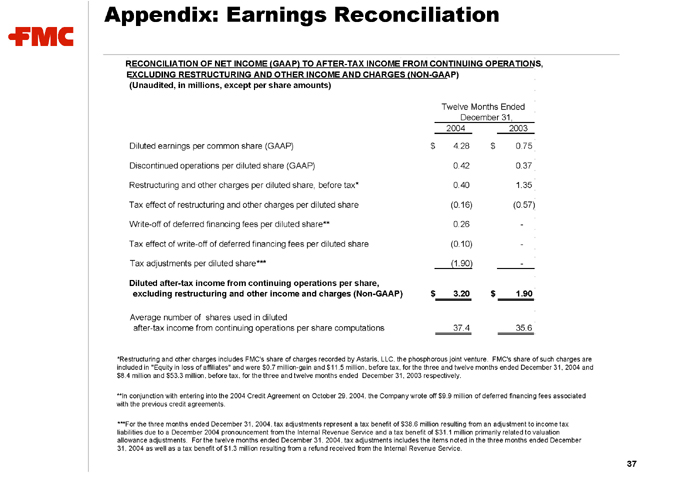
RECONCILIATION OF NET INCOME (GAAP) TO AFTER-TAX INCOME FROM CONTINUING OPERATIONS, EXCLUDING RESTRUCTURING AND OTHER INCOME AND CHARGES (NON-GAAP) (Unaudited, in millions, except per share amounts)
Twelve Months Ended
December 31,
2004 2003
Diluted earnings per common share (GAAP) $4.28 $0.75
Discontinued operations per diluted share (GAAP) 0.42 0.37
Restructuring and other charges per diluted share, before tax* 0.40 1.35
Tax effect of restructuring and other charges per diluted share (0.16) (0.57)
Write-off of deferred financing fees per diluted share** 0.26 -
Tax effect of write-off of deferred financing fees per diluted share (0.10) -
Tax adjustments per diluted share*** (1.90) -
Diluted after-tax income from continuing operations per share,
excluding restructuring and other income and charges (Non-GAAP) $3.20 $1.90
Average number of shares used in diluted
after-tax income from continuing operations per share computations 37.4 35.6
*Restructuring and other charges includes FMC’s share of charges recorded by Astaris, LLC, the phosphorous joint venture. FMC’s share of such charges are included in “Equity in loss of affiliates” and were $0.7 million-gain and $11.5 million, before tax, for the three and twelve months ended December 31, 2004 and $8.4 million and $53.3 million, before tax, for the three and twelve months ended December 31, 2003 respectively.
**In conjunction with entering into the 2004 Credit Agreement on October 29, 2004, the Company wrote off $9.9 million of deferred financing fees associated with the previous credit agreements.
***For the three months ended December 31, 2004, tax adjustments represent a tax benefit of $38.6 million resulting from an adjustment to income tax liabilities due to a December 2004 pronouncement from the Internal Revenue Service and a tax benefit of $31.1 million primarily related to valuation allowance adjustments. For the twelve months ended December 31, 2004, tax adjustments includes the items noted in the three months ended December 31, 2004 as well as a tax benefit of $1.3 million resulting from a refund received from the Internal Revenue Service.
37
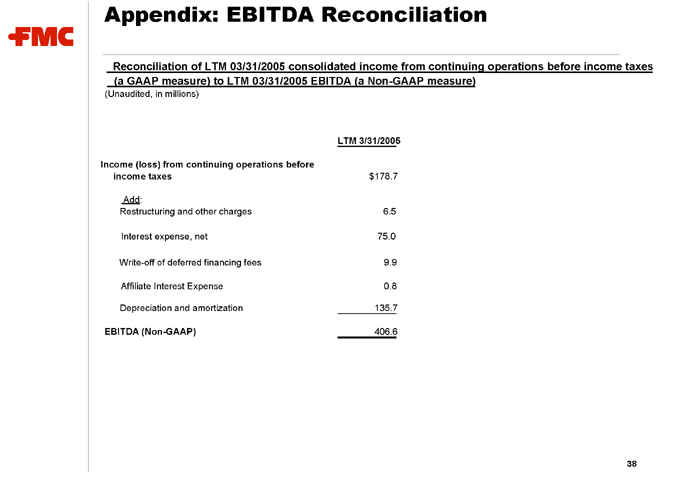
Appendix: EBITDA Reconciliation
Reconciliation of LTM 03/31/2005 consolidated income from continuing operations before income taxes (a GAAP measure) to LTM 03/31/2005 EBITDA (a Non-GAAP measure)
(Unaudited, in millions)
LTM 3/31/2005
Income (loss) from continuing operations before
income taxes $ 178.7
Add:
Restructuring and other charges 6.5
Interest expense, net 75.0
Write-off of deferred financing fees 9.9
Affiliate Interest Expense 0.8
Depreciation and amortization 135.7
EBITDA (Non-GAAP) 406.6
38

Appendix: Segment EBITDA Reconciliation
Reconciliation of LTM 03/31/2005 segment operating profit (a GAAP measure) to LTM 03/31/2005 EBITDA (a Non-GAAP measure)
(Unaudited, in millions)
Industrial Specialty Agricultural
Segment Chemicals Chemicals Products
LTM 03/31/2005 segment operating profit (GAAP) $72.2 $99.9 $132.3
Add:
Depreciation and amortization 68.2 32.8 29.3
LTM 03/31/2005 EBITDA (Non-GAAP) $140.4 $132.7 $161.6
39
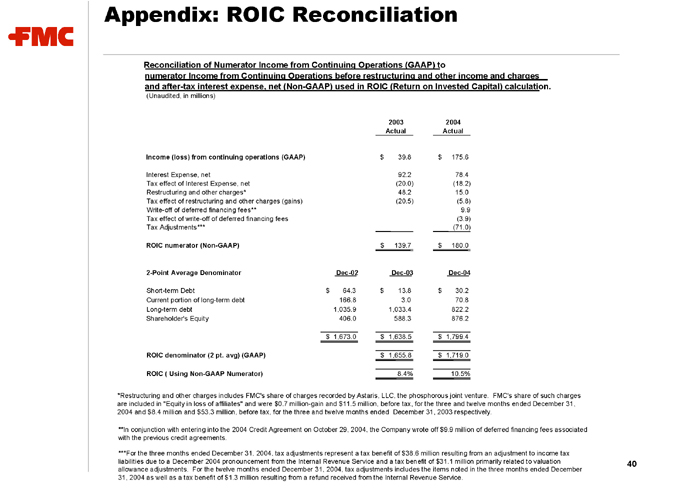
Appendix: ROIC Reconciliation
Reconciliation of Numerator Income from Continuing Operations (GAAP) to numerator Income from Continuing Operations before restructuring and other income and charges and after-tax interest expense, net (Non-GAAP) used in ROIC (Return on Invested Capital) calculation.
(Unaudited, in millions)
2003 2004
Actual Actual
Income (loss) from continuing operations (GAAP) $39.8 $175.6
Interest Expense, net 92.2 78.4
Tax effect of Interest Expense, net (20.0) (18.2)
Restructuring and other charges* 48.2 15.0
Tax effect of restructuring and other charges (gains) (20.5) (5.8)
Write-off of deferred financing fees** 9.9
Tax effect of write-off of deferred financing fees (3.9)
Tax Adjustments*** (71.0)
ROIC numerator (Non-GAAP) $139.7 $180.0
2-Point Average Denominator Dec-02 Dec-03 Dec-04
Short-term Debt $64.3 $13.8 $30.2
Current portion of long-term debt 166.8 3.0 70.8
Long-term debt 1,035.9 1,033.4 822.2
Shareholder’s Equity 406.0 588.3 876.2
$1,673.0 $1,638.5 $1,799.4
ROIC denominator (2 pt. avg) (GAAP) $1,655.8 $1,719.0
ROIC ( Using Non-GAAP Numerator) 8.4% 10.5%
*Restructuring and other charges includes FMC’s share of charges recorded by Astaris, LLC, the phosphorous joint venture. FMC’s share of such charges are included in “Equity in loss of affiliates” and were $0.7 million-gain and $11.5 million, before tax, for the three and twelve months ended December 31, 2004 and $8.4 million and $53.3 million, before tax, for the three and twelve months ended December 31, 2003 respectively.
**In conjunction with entering into the 2004 Credit Agreement on October 29, 2004, the Company wrote off $9.9 million of deferred financing fees associated with the previous credit agreements.
***For the three months ended December 31, 2004, tax adjustments represent a tax benefit of $38.6 million resulting from an adjustment to income tax liabilities due to a December 2004 pronouncement from the Internal Revenue Service and a tax benefit of $31.1 million primarily related to valuation allowance adjustments. For the twelve months ended December 31, 2004, tax adjustments includes the items noted in the three months ended December 31, 2004 as well as a tax benefit of $1.3 million resulting from a refund received from the Internal Revenue Service.
40

FMC Corporation