Exhibit 99.1
FMC Corporation
California Investor Meetings March 30-31, 2006
William G. Walter Chairman, President and CEO
Disclaimer
Safe Harbor Statement under the Private Securities Litigation Reform Act of 1995
These slides and the accompanying presentation contain “forward-looking statements” that represent management’s best judgment as of the date hereof based on information currently available. Actual results of the Company may differ materially from those contained in the forward-looking statements.
Additional information concerning factors that may cause results to differ materially from those in the forward-looking statements is contained in the Company’s periodic reports filed under the Securities Exchange Act of 1934, as amended.
The Company undertakes no obligation to update or revise these forward-looking statements to reflect new events or uncertainties.
Non-GAAP Financial Terms
These slides contain certain “non-GAAP financial terms” which are defined in the appendix. In addition, we have provided reconciliations of non-GAAP terms to the closest GAAP term in the appendix.
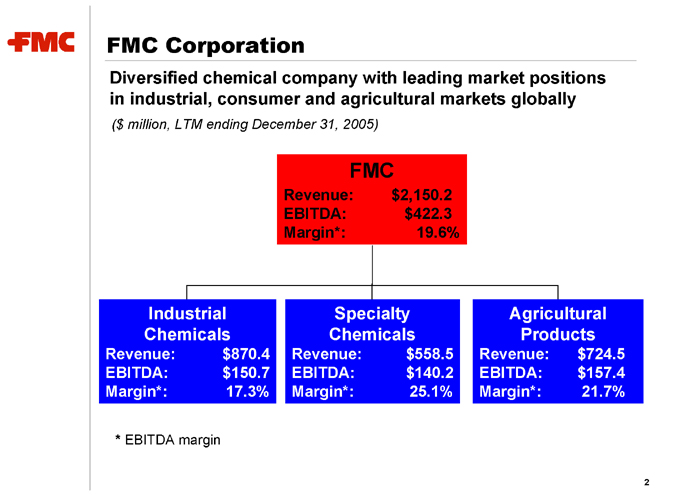
FMC Corporation
Diversified chemical company with leading market positions in industrial, consumer and agricultural markets globally
($ million, LTM ending December 31, 2005)
FMC
Industrial Chemicals
Specialty Chemicals
Agricultural Products
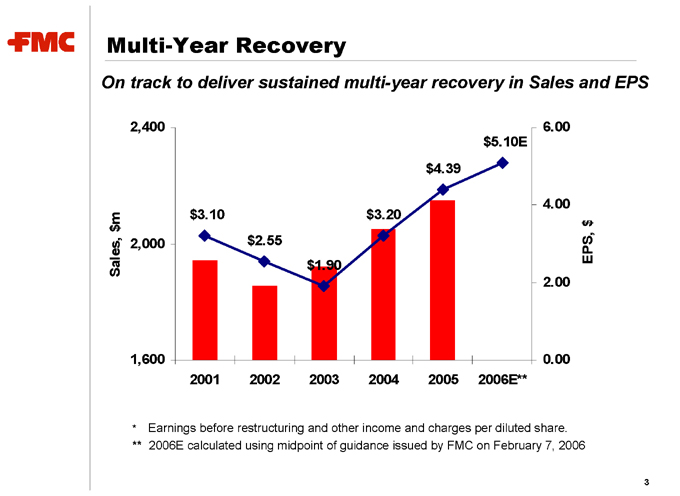
Multi-Year Recovery
On track to deliver sustained multi-year recovery in Sales and EPS
Sales, $m
2,400
2,000
1,600 $3.10 $2.55 $1.90 $3.20
$4.39 $5.10E
2001 2002 2003 2004 2005 2006E**
6.00
4.00
2.00
0.00
EPS, $
* | | Earnings before restructuring and other income and charges per diluted share. |
** 2006E calculated using midpoint of guidance issued by FMC on February 7, 2006
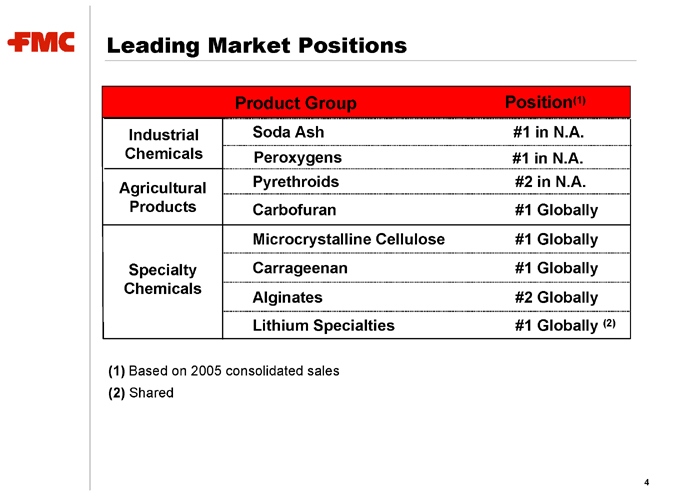
Leading Market Positions
Product | | Group Position(1) |
Industrial | | Soda Ash #1 in N.A. |
Chemicals | | Peroxygens #1 in N.A. |
Agricultural | | Pyrethroids #2 in N.A. |
Products | | Carbofuran #1 Globally |
Microcrystalline | | Cellulose #1 Globally |
Specialty | | Carrageenan #1 Globally |
Lithium | | Specialties #1 Globally (2) |
(1) | | Based on 2005 consolidated sales (2) Shared |
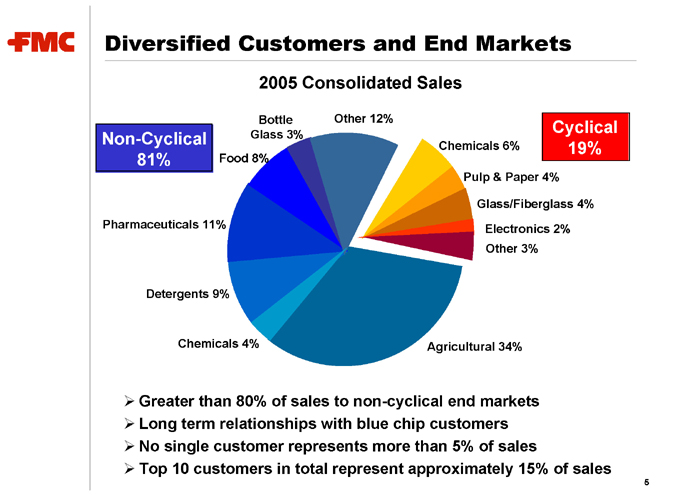
Diversified Customers and End Markets
2005 Consolidated Sales
Non-Cyclical 81%
Pharmaceuticals 11%
Food 8%
Bottle Glass 3%
Other 12%
Chemicals 6%
Pulp & Paper 4%
Glass/Fiberglass 4%
Electronics 2% Other 3%
Detergents 9%
Chemicals 4%
Agricultural 34%
Cyclical 19%
Greater than 80% of sales to non-cyclical end markets Long term relationships with blue chip customers No single customer represents more than 5% of sales
Top 10 customers in total represent approximately 15% of sales
Diversified and Integrated Cost Structure
Low cost sourcing of raw materials
Backward integration: soda ash, lithium
Global sourcing of renewable resources: wood pulp, seaweed
Low reliance on purchased raw materials
Total raw materials represent approximately 25% of cost of sales No single raw material accounts for more than 7% of total raw material purchases Reduced volatility from limited use of petrochemical feedstocks
Low energy demand requirements
Energy represents approximately 10% of cost of sales

Disciplined Approach to Unlocking Value
Realizing the inherent operating leverage within FMC
Sustained earnings growth >10% per year(1) Industrial Chemicals recovery in mid-cycle in 2006
Continued growth in Specialty Chemicals and Agricultural Products
Maintaining financial strength and flexibility
Investment grade capital policies
Initiated quarterly cash dividend of $0.18 per share Announced $150 million share repurchase program
Focusing the portfolio on higher growth businesses
Manage Specialty Chemicals and Agricultural Products for growth Manage Industrial Chemicals for cash
(1) | | Earnings before restructuring and other income and charges |
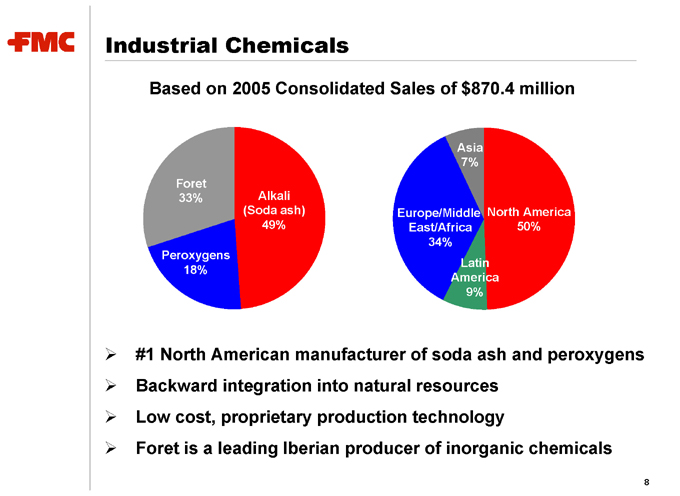
Industrial Chemicals
Based on 2005 Consolidated Sales of $870.4 million
Foret 33%
Peroxygens 18%
Alkali (Soda ash) 49%
Europe/Middle East/Africa 34%
Latin America 9%
Asia 7%
North America 50%
#1 North American manufacturer of soda ash and peroxygens Backward integration into natural resources Low cost, proprietary production technology Foret is a leading Iberian producer of inorganic chemicals
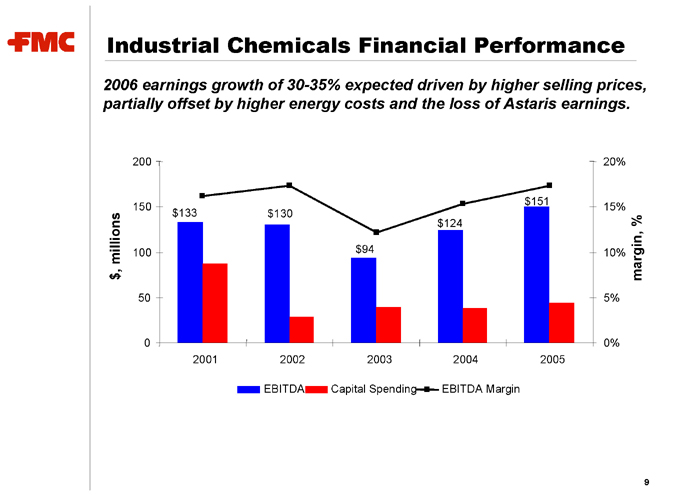
Industrial Chemicals Financial Performance
2006 earnings growth of 30-35% expected driven by higher selling prices, partially offset by higher energy costs and the loss of Astaris earnings.
$, millions
200 150 100 50 0 $133 $130 $94 $124 $151
2001 2002 2003 2004 2005
20% 15% 10% 5% 0% margin, %
EBITDA
Capital Spending
EBITDA Margin
9
Industrial Chemicals’ Focus
Managing for cash generation
Near-term sales growth
Higher soda ash selling prices
Considering re-commissioning another increment of soda ash capacity at Granger to support export demand growth Additional peroxide price increases in North America and Europe.
Margin expansion
Working to offset rising energy, raw material and transportation costs
10
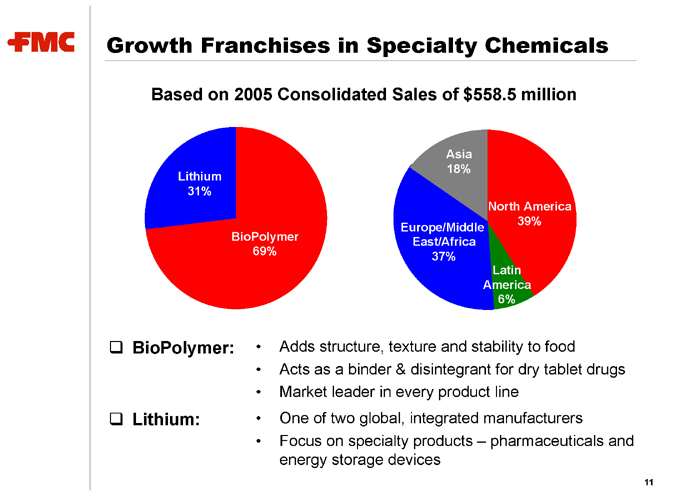
Growth Franchises in Specialty Chemicals
Based on 2005 Consolidated Sales of $558.5 million
Lithium 31%
BioPolymer 69%
Asia 18%
Europe/Middle East/Africa 37%
North America 39%
Latin America 6%
BioPolymer:
Lithium:
Adds structure, texture and stability to food Acts as a binder & disintegrant for dry tablet drugs Market leader in every product line One of two global, integrated manufacturers Focus on specialty products – pharmaceuticals and energy storage devices
11
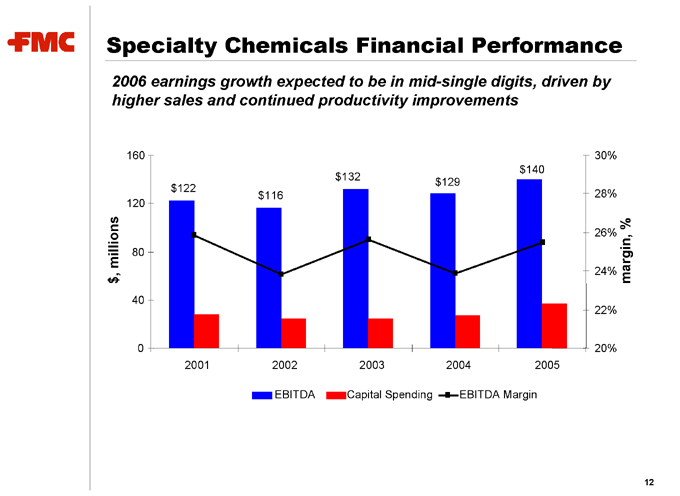
Specialty Chemicals Financial Performance
2006 earnings growth expected to be in mid-single digits, driven by higher sales and continued productivity improvements $, millions
160 120 80 40 0 $122 $116 $132 $129 $140
2001 2002 2003 2004 2005
30% 28% 26% 24% 22% 20% margin, %
EBITDA
Capital Spending
EBITDA Margin
12
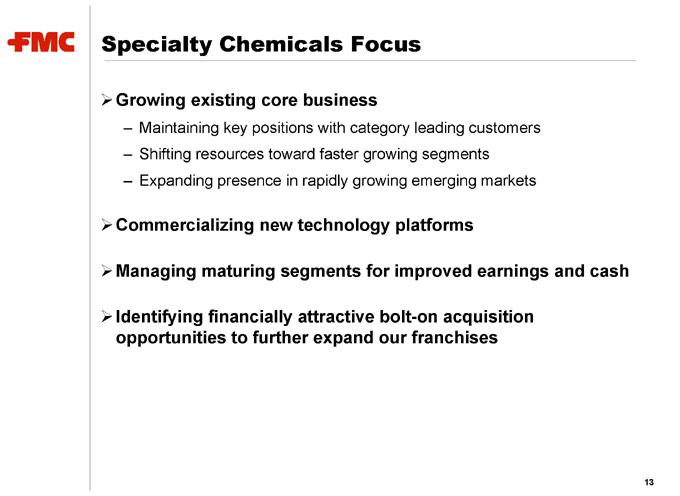
Specialty Chemicals Focus
Growing existing core business
Maintaining key positions with category leading customers Shifting resources toward faster growing segments Expanding presence in rapidly growing emerging markets
Commercializing new technology platforms
Managing maturing segments for improved earnings and cash
Identifying financially attractive bolt-on acquisition opportunities to further expand our franchises
13
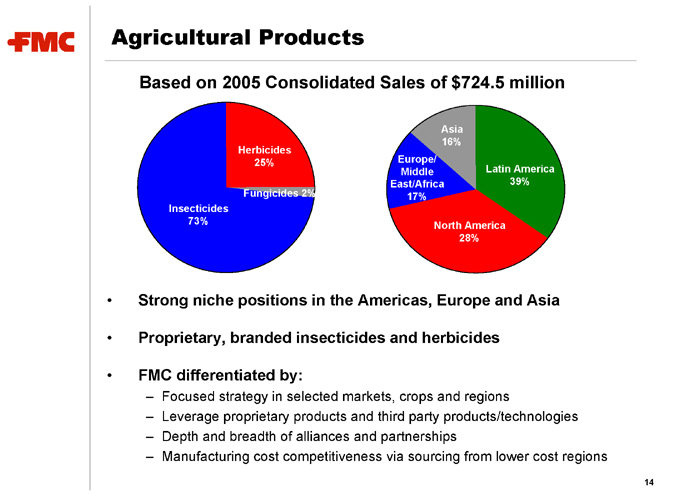
Agricultural Products
Based on 2005 Consolidated Sales of $724.5 million
Herbicides 25%
Insecticides 73%
Fungicides 2%
Europe/ Middle East/Africa 17%
Asia 16%
Latin America 39%
North America 28%
Strong niche positions in the Americas, Europe and Asia Proprietary, branded insecticides and herbicides FMC differentiated by:
Focused strategy in selected markets, crops and regions
Leverage proprietary products and third party products/technologies Depth and breadth of alliances and partnerships Manufacturing cost competitiveness via sourcing from lower cost regions
14
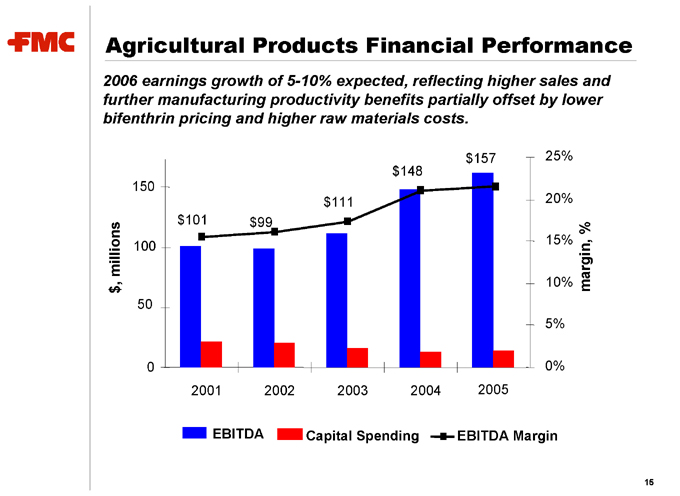
Agricultural Products Financial Performance
2006 earnings growth of 5-10% expected, reflecting higher sales and further manufacturing productivity benefits partially offset by lower bifenthrin pricing and higher raw materials costs.
$, millions
150 100 50 0 $101 $99 $111 $148 $157
2001 2002 2003 2004 2005
25% 20% 15% 10% 5% 0% margin, %
EBITDA
Capital Spending
EBITDA Margin
15
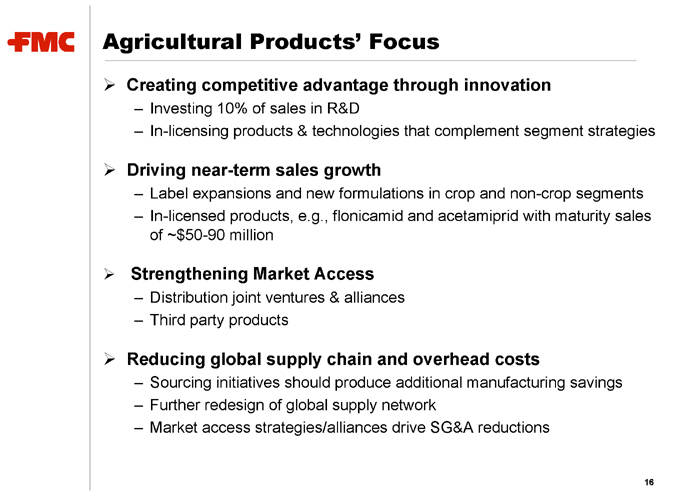
Agricultural Products’ Focus
Creating competitive advantage through innovation
Investing 10% of sales in R&D
In-licensing products & technologies that complement segment strategies
Driving near-term sales growth
Label expansions and new formulations in crop and non-crop segments In-licensed products, e.g., flonicamid and acetamiprid with maturity sales of ~$50-90 million
Strengthening Market Access
Distribution joint ventures & alliances Third party products
Reducing global supply chain and overhead costs
Sourcing initiatives should produce additional manufacturing savings Further redesign of global supply network Market access strategies/alliances drive SG&A reductions
16
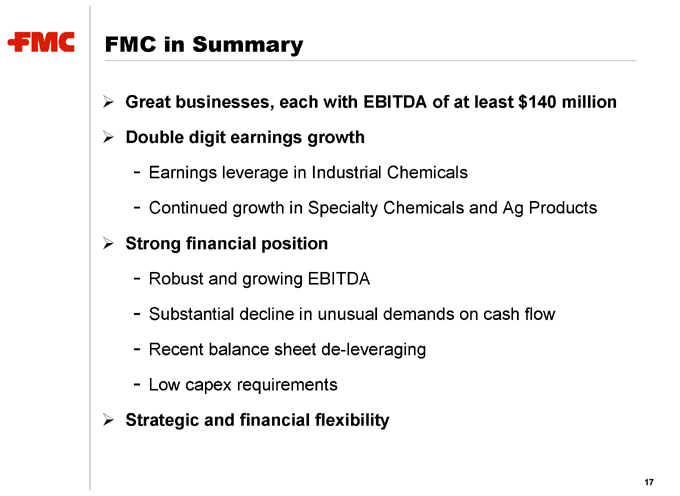
FMC in Summary
Great businesses, each with EBITDA of at least $140 million
Double digit earnings growth
Earnings leverage in Industrial Chemicals
Continued growth in Specialty Chemicals and Ag Products
Strong financial position
Robust and growing EBITDA
Substantial decline in unusual demands on cash flow Recent balance sheet de-leveraging Low capex requirements
Strategic and financial flexibility
17
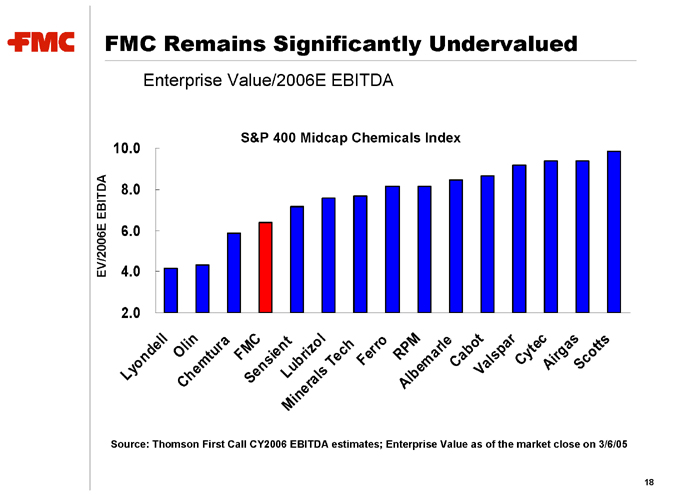
FMC Remains Significantly Undervalued
Enterprise Value/2006E EBITDA
S&P 400 Midcap Chemicals Index
EV/2006E EBITDA
10.0 8.0 6.0 4.0 2.0
Lyondell
Olin
Chemtura
FMC
Sensient
Lubrizol
Minerals Tech
Ferro
RPM
Albemarle Cabot
Valspar Cytec
Airgas
Scotts
Source: Thomson First Call CY2006 EBITDA estimates; Enterprise Value as of the market close on 3/6/05
18
FMC Corporation
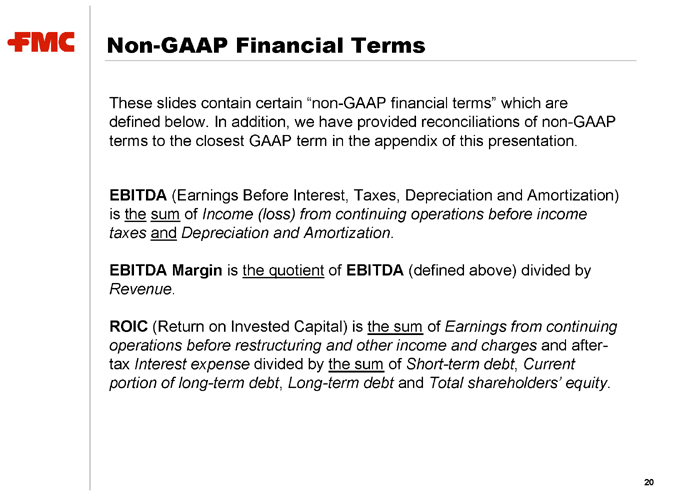
Non-GAAP Financial Terms
These slides contain certain “non-GAAP financial terms” which are defined below. In addition, we have provided reconciliations of non-GAAP terms to the closest GAAP term in the appendix of this presentation.
EBITDA (Earnings Before Interest, Taxes, Depreciation and Amortization) is the sum of Income (loss) from continuing operations before income taxes and Depreciation and Amortization.
EBITDA Margin is the quotient of EBITDA (defined above) divided by
Revenue.
ROIC (Return on Invested Capital) is the sum of Earnings from continuing operations before restructuring and other income and charges and after-tax Interest expense divided by the sum of Short-term debt, Current portion of long-term debt, Long-term debt and Total shareholders’ equity.
20
Segment Financial Terms
These slides contain references to segment financial items which are presented in detail in Note 18 of FMC’s 2005 Form 10-K. Some of the segment financial terms are “non-GAAP financial terms” and are defined below. In addition, we have provided reconciliations of non-GAAP terms to the closest GAAP term in the appendix of this presentation.
EBITDA (Earnings Before Interest, Taxes, Depreciation and Amortization) for a segment is the sum of Income (loss) from continuing operations before income taxes for that segment and Depreciation and Amortization for that segment.
EBITDA Margin for a segment is the quotient of EBITDA (defined above) divided by Revenue for that segment.
21
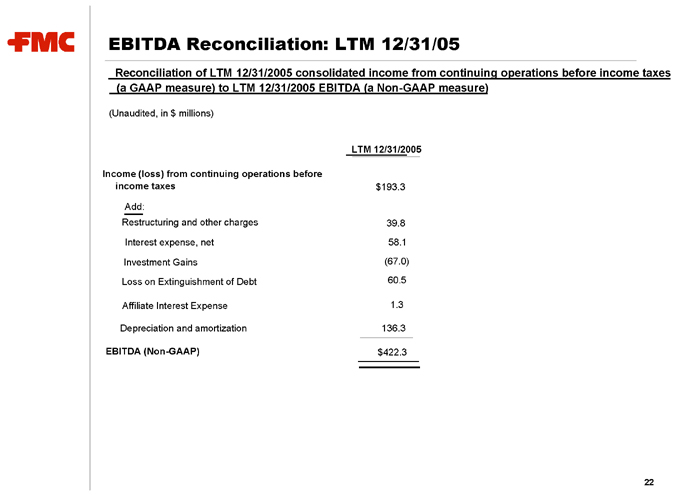
EBITDA Reconciliation: LTM 12/31/05
Reconciliation of LTM 12/31/2005 consolidated income from continuing operations before income taxes (a GAAP measure) to LTM 12/31/2005 EBITDA (a Non-GAAP measure)
(Unaudited, in $ millions)
LTM 12/31/2005
Income | | (loss) from continuing operations before |
Restructuring | | and other charges 39.8 |
Interest | | expense, net 58.1 |
Loss | | on Extinguishment of Debt 60.5 |
Affiliate | | Interest Expense 1.3 |
Depreciation | | and amortization 136.3 |
EBITDA | | (Non-GAAP) $ 422.3 |
22
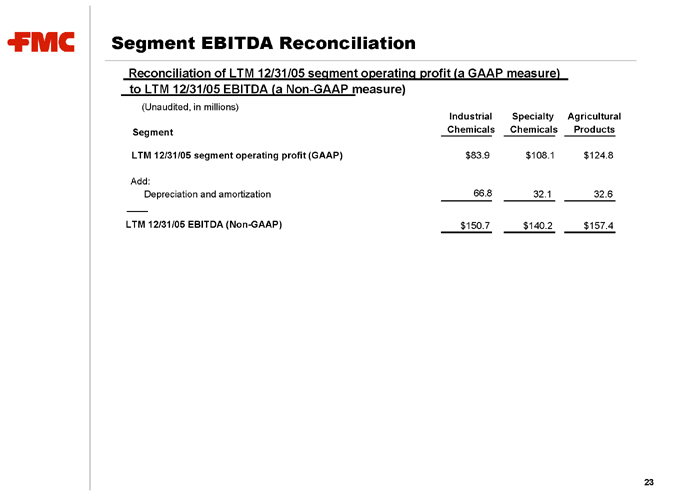
Segment EBITDA Reconciliation
Reconciliation of LTM 12/31/05 segment operating profit (a GAAP measure) to LTM 12/31/05 EBITDA (a Non-GAAP measure)
Industrial | | Specialty Agricultural |
Segment | | Chemicals Chemicals Products |
LTM | | 12/31/05 segment operating profit (GAAP) $ 83.9 $ 108.1 $ 124.8 |
Depreciation | | and amortization 66.8 32.1 32.6 |
LTM | | 12/31/05 EBITDA (Non-GAAP) $ 150.7 $ 140.2 $ 157.4 |
23