Exhibit 99.1
FMC Corporation
Bank of America Basic Industries Conference New York, NY
May 4, 2006
William G. Walter Chairman, President and CEO
Disclaimer
Safe Harbor Statement under the Private Securities Litigation Reform Act of 1995
These slides and the accompanying presentation contain “forward-looking statements” that represent management’s best judgment as of the date hereof based on information currently available. Actual results of the Company may differ materially from those contained in the forward-looking statements.
Additional information concerning factors that may cause results to differ materially from those in the forward-looking statements is contained in the Company’s periodic reports filed under the Securities Exchange Act of 1934, as amended.
The Company undertakes no obligation to update or revise these forward-looking statements to reflect new events or uncertainties.
Non-GAAP Financial Terms
These slides contain certain “non-GAAP financial terms” which are defined in the appendix. In addition, we have provided reconciliations of non-GAAP terms to the closest GAAP term in the appendix.
1
FMC Corporation
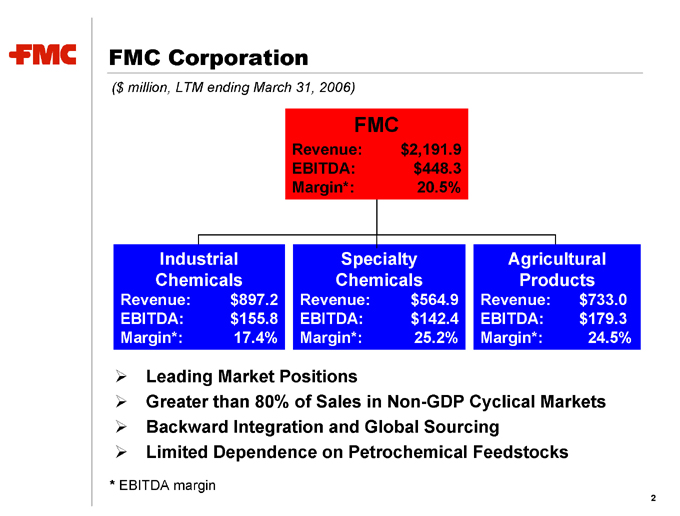
($ million, LTM ending March 31, 2006)
FMC
Revenue: $2,191.9 EBITDA: $448.3 Margin*: 20.5%
Industrial Chemicals
Revenue: $897.2 EBITDA: $155.8 Margin*: 17.4%
Specialty Chemicals
Revenue: $564.9 EBITDA: $142.4 Margin*: 25.2%
Agricultural Products
Revenue: $733.0 EBITDA: $179.3 Margin*: 24.5%
Leading Market Positions
Greater than 80% of Sales in Non-GDP Cyclical Markets Backward Integration and Global Sourcing Limited Dependence on Petrochemical Feedstocks
* EBITDA margin
2
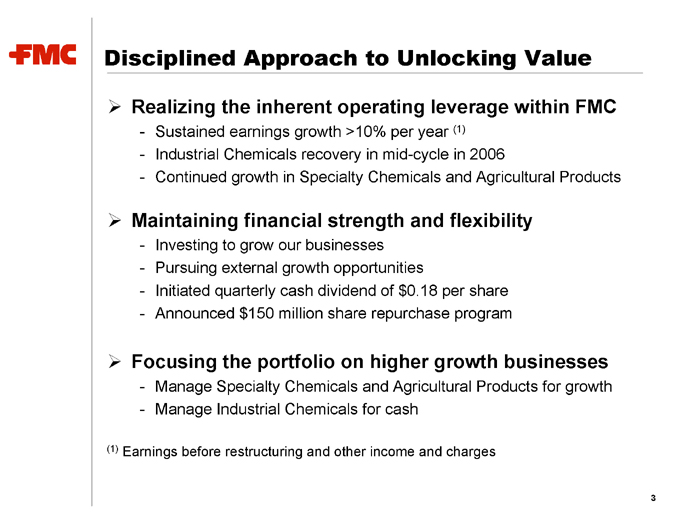
Disciplined Approach to Unlocking Value
Realizing the inherent operating leverage within FMC
- Sustained earnings growth >10% per year (1)
- Industrial Chemicals recovery in mid-cycle in 2006
- Continued growth in Specialty Chemicals and Agricultural Products
Maintaining financial strength and flexibility
- Investing to grow our businesses
- Pursuing external growth opportunities
- Initiated quarterly cash dividend of $0.18 per share
- Announced $150 million share repurchase program
Focusing the portfolio on higher growth businesses
- Manage Specialty Chemicals and Agricultural Products for growth
- Manage Industrial Chemicals for cash
(1) Earnings before restructuring and other income and charges
3
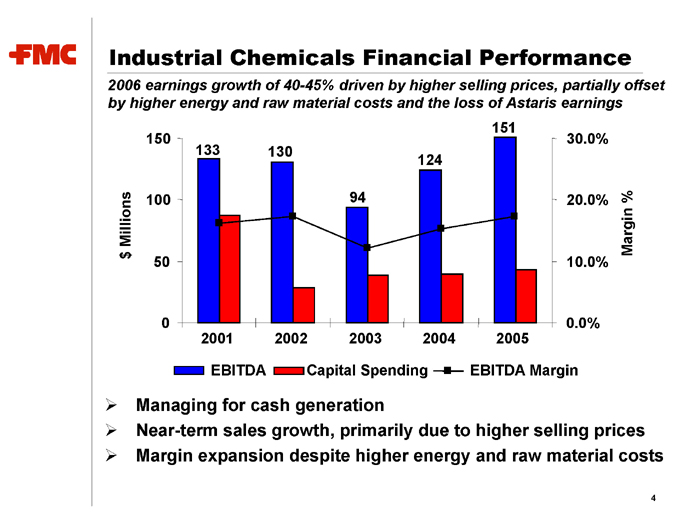
Industrial Chemicals Financial Performance
2006 earnings growth of 40-45% driven by higher selling prices, partially offset by higher energy and raw material costs and the loss of Astaris earnings $ Millions
150 100 50 0
151 133 130 124
94
2001 2002 2003 2004 2005
30.0% 20.0% 10.0% 0.0%
Margin %
EBITDA Capital Spending EBITDA Margin
Managing for cash generation
Near-term sales growth, primarily due to higher selling prices Margin expansion despite higher energy and raw material costs
4
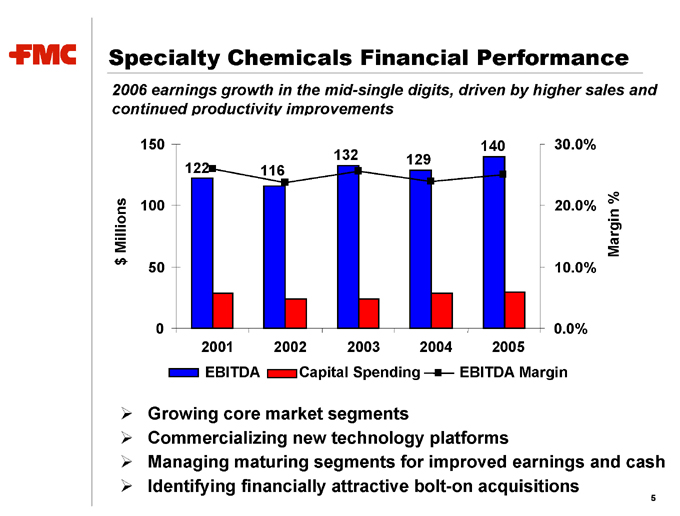
Specialty Chemicals Financial Performance
2006 earnings growth in the mid-single digits, driven by higher sales and continued productivity improvements $ Millions
150 100 50 0
140 132 129 122 116
2001 2002 2003 2004 2005
30.0% 20.0% 10.0% 0.0%
Margin %
EBITDA Capital Spending EBITDA Margin
Growing core market segments
Commercializing new technology platforms
Managing maturing segments for improved earnings and cash
Identifying financially attractive bolt-on acquisitions
5
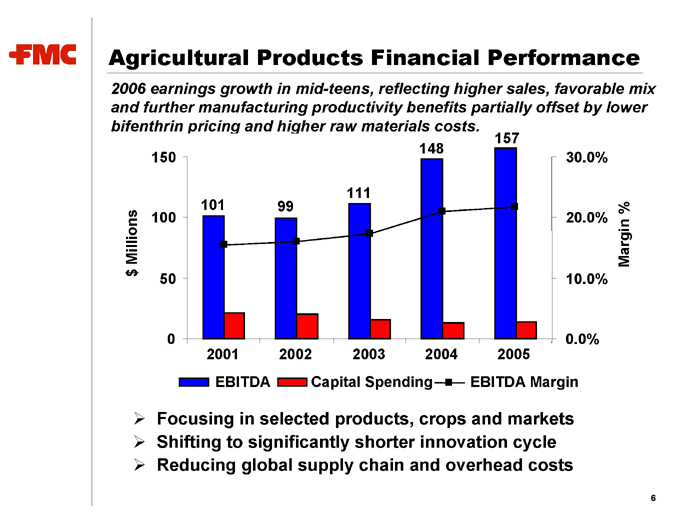
Agricultural Products Financial Performance
2006 earnings growth in mid-teens, reflecting higher sales, favorable mix and further manufacturing productivity benefits partially offset by lower bifenthrin pricing and higher raw materials costs.
$ Millions
150
100
50
0
157 148
111 101 99
2001 2002 2003 2004 2005
30.0%
20.0%
10.0%
0.0%
Margin %
EBITDA Capital Spending EBITDA Margin
Focusing in selected products, crops and markets Shifting to significantly shorter innovation cycle Reducing global supply chain and overhead costs
6
FMC in Summary
Great businesses, each with EBITDA of at least $140 million
Double digit earnings growth
- Earnings leverage in Industrial Chemicals
- Continued growth in Specialty Chemicals and Ag Products Meeting or exceeding strategic objectives
- Double-digit earnings growth
- Greater than 12% return on capital
Pursuing proactive, disciplined approach to unlocking value
7
FMC Corporation
Non-GAAP Financial Terms
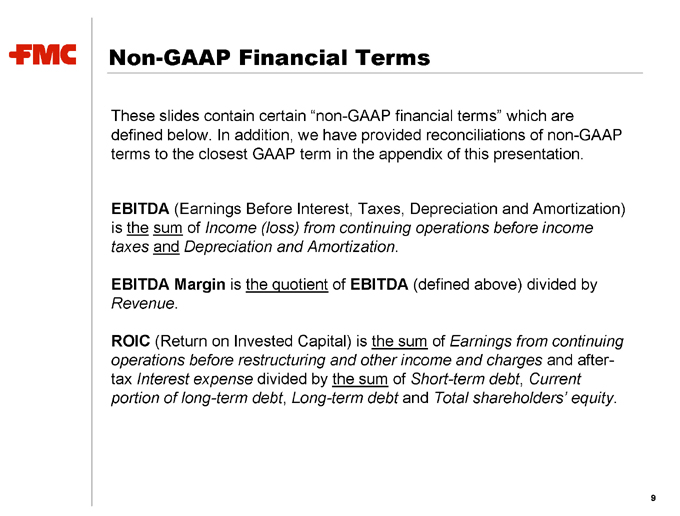
These slides contain certain “non-GAAP financial terms” which are defined below. In addition, we have provided reconciliations of non-GAAP terms to the closest GAAP term in the appendix of this presentation.
EBITDA (Earnings Before Interest, Taxes, Depreciation and Amortization) is the sum of Income (loss) from continuing operations before income taxes and Depreciation and Amortization.
EBITDA Margin is the quotient of EBITDA (defined above) divided by
Revenue.
ROIC (Return on Invested Capital) is the sum of Earnings from continuing operations before restructuring and other income and charges and after-tax Interest expense divided by the sum of Short-term debt, Current portion of long-term debt, Long-term debt and Total shareholders’ equity.
9
Segment Financial Terms
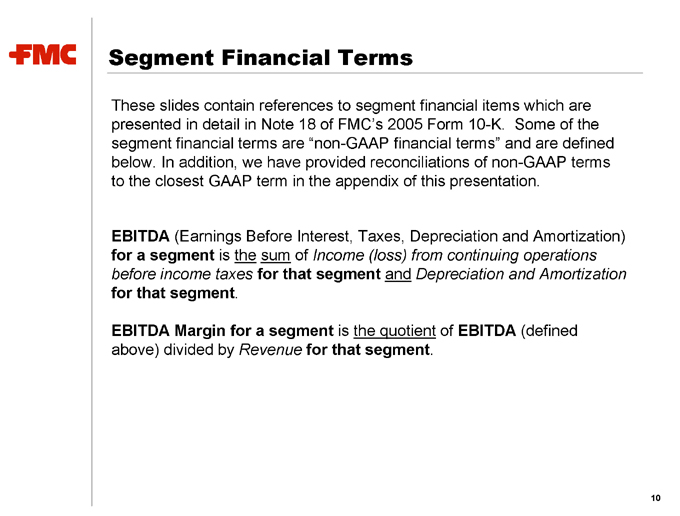
These slides contain references to segment financial items which are presented in detail in Note 18 of FMC’s 2005 Form 10-K. Some of the segment financial terms are “non-GAAP financial terms” and are defined below. In addition, we have provided reconciliations of non-GAAP terms to the closest GAAP term in the appendix of this presentation.
EBITDA (Earnings Before Interest, Taxes, Depreciation and Amortization) for a segment is the sum of Income (loss) from continuing operations before income taxes for that segment and Depreciation and Amortization for that segment.
EBITDA Margin for a segment is the quotient of EBITDA (defined above) divided by Revenue for that segment.
10
EBITDA Reconciliation: LTM 3/31/06
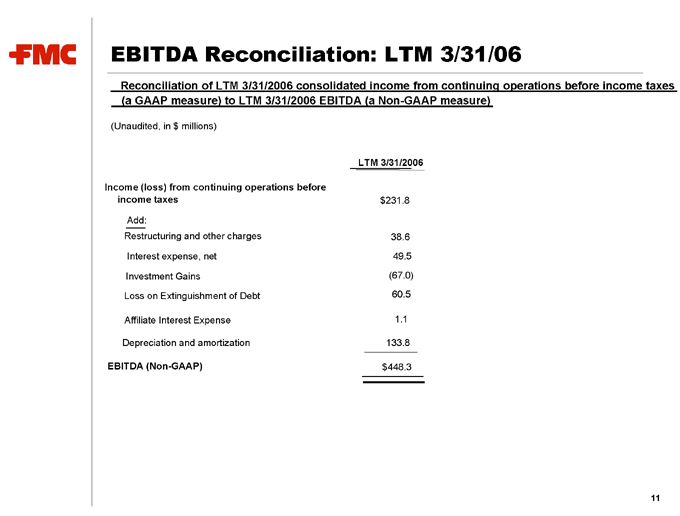
Reconciliation of LTM 3/31/2006 consolidated income from continuing operations before income taxes (a GAAP measure) to LTM 3/31/2006 EBITDA (a Non-GAAP measure)
(Unaudited, in $ millions)
LTM 3/31/2006
Income (loss) from continuing operations before income taxes $231.8
Add:
Restructuring and other charges 38.6
Interest expense, net 49.5
Investment Gains (67.0)
Loss on Extinguishment of Debt 60.5
Affiliate Interest Expense 1.1
Depreciation and amortization 133.8
EBITDA (Non-GAAP) $448.3
11
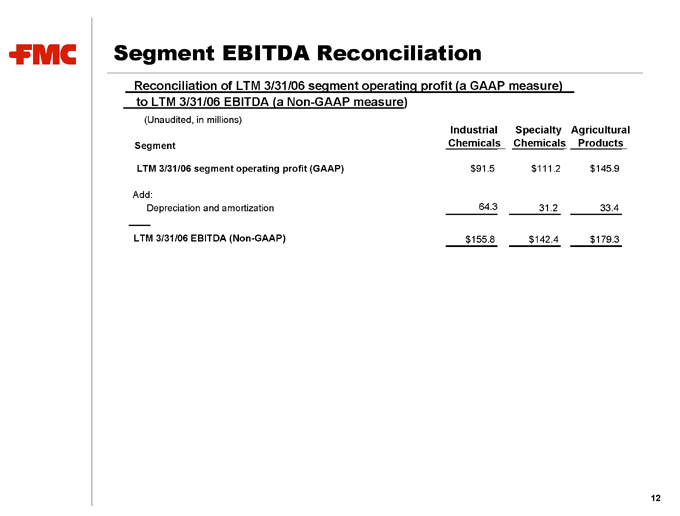
Segment EBITDA Reconciliation
Reconciliation of LTM 3/31/06 segment operating profit (a GAAP measure) to LTM 3/31/06 EBITDA (a Non-GAAP measure)
(Unaudited, in millions)
Segment Industrial Chemicals Specialty Chemicals Agricultural Products
LTM 3/31/06 segment operating profit (GAAP) $91.5 $111.2 $145.9
Add:
Depreciation and amortization 64.3 31.2 33.4
LTM 3/31/06 EBITDA (Non-GAAP) $155.8 $142.4 $179.3
12