 1 Disclaimer Safe Harbor Statement under the Private Securities Litigation Reform Act of 1995 • These slides and the accompanying presentation contain “forward-looking statements” that represent management’s best judgment as of the date hereof based on information currently available. Actual results of the Company may differ materially from those contained in the forward-looking statements. • Additional information concerning factors that may cause results to differ materially from those in the forward-looking statements is contained in the Company’s periodic reports filed under the Securities Exchange Act of 1934, as amended. • The Company undertakes no obligation to update or revise these forward- looking statements to reflect new events or uncertainties. Non-GAAP Financial Terms • These slides contain certain “non-GAAP financial terms” which are defined in the appendix. In addition, we have provided reconciliations of non-GAAP terms to the closest GAAP term in the appendix. Exhibit 99.1 |
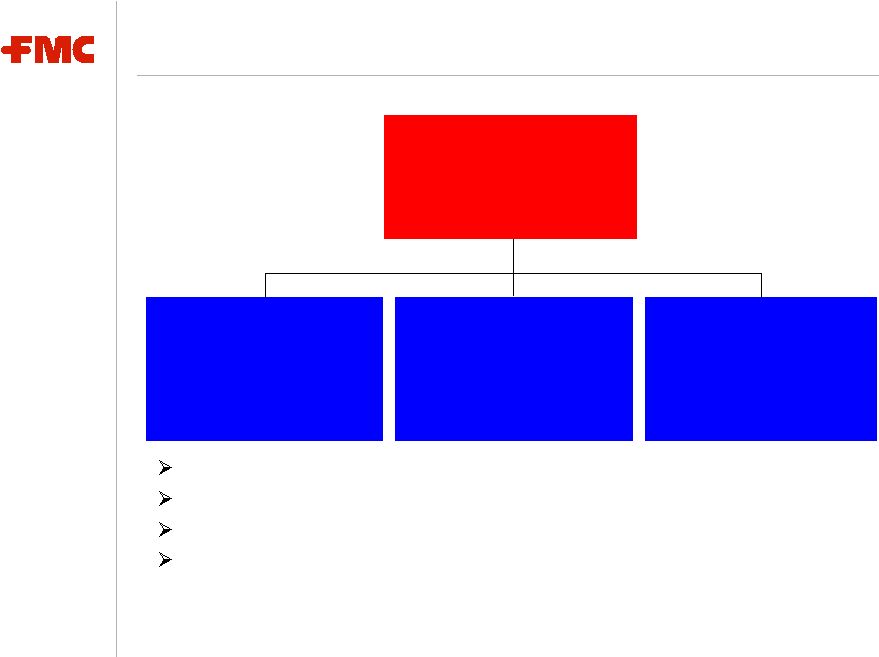 2 FMC Corporation LTM ending December 31, 2007 ($ millions) FMC Revenue: $2,632.9 EBITDA: $511.6 Margin*: 19.4% Industrial Chemicals Revenue: $1,087.1 EBITDA: $161.5 Margin*: 14.9% Agricultural Products Revenue: $889.7 EBITDA: $234.2 Margin*: 26.3% Specialty Chemicals Revenue: $659.5 EBITDA: $174.7 Margin*: 26.5% * EBITDA margin Leading Market Positions Greater than 80% of Sales in Non-GDP Cyclical Markets Diversified and Integrated Cost Structure Limited Dependence on Petrochemical Feedstocks |
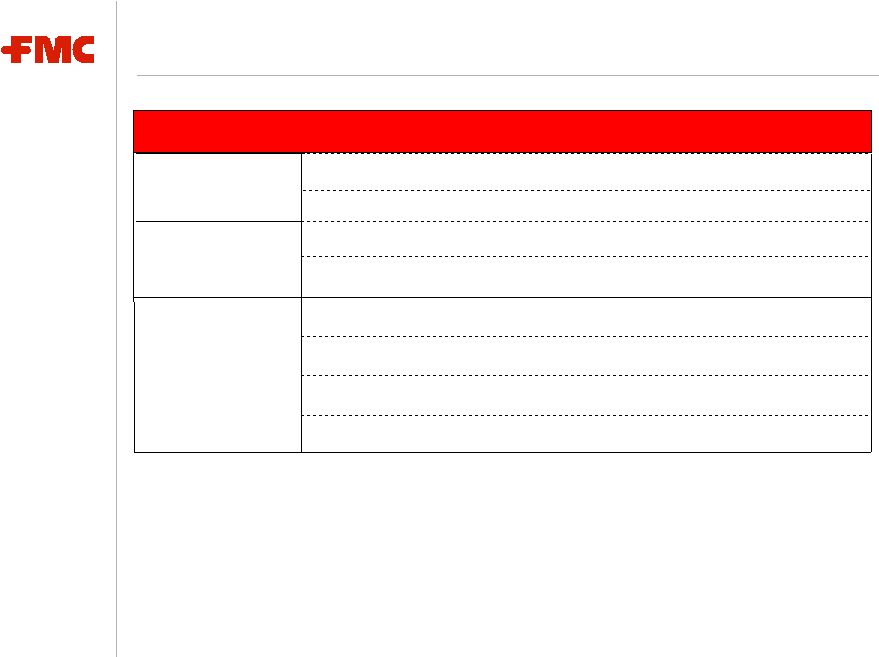 3 Leading Market Positions (1) Based on 2007 consolidated sales (2) Shared Industrial Chemicals #1 in N.A. Soda Ash #1 in N.A. (2) Peroxygens #1 Globally Carrageenan #1 Globally Carbofuran #2 in N.A. Pyrethroids Agricultural Products #2 Globally Alginates Specialty Chemicals #1 Globally (2) #1 Globally Lithium Specialties Microcrystalline Cellulose Product Group Position (1) |
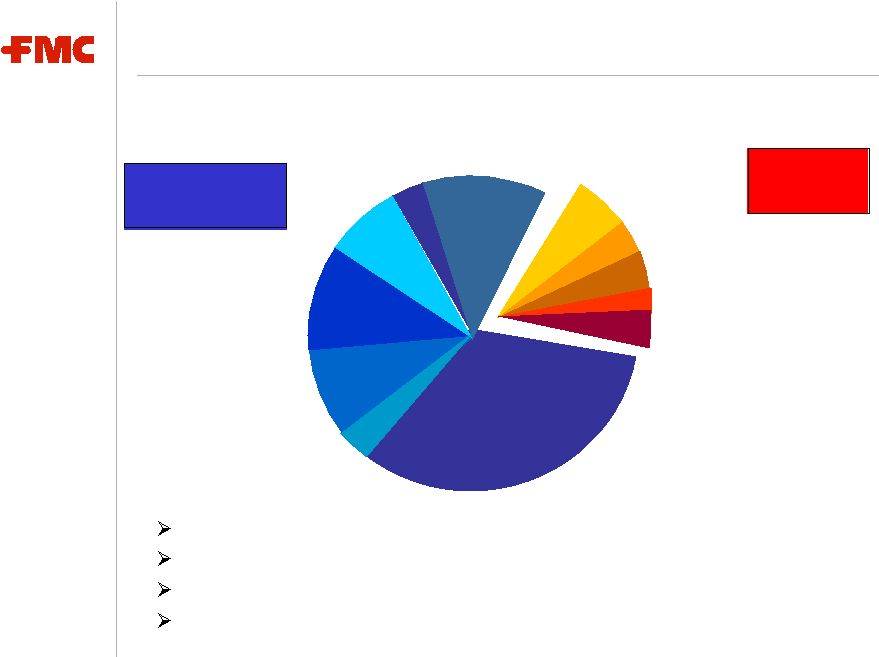 4 Diversified Customers and End Markets Greater than 80% of sales to non-cyclical end markets Long term relationships with blue chip customers No single customer represents more than 5% of sales Top 10 customers in total represent approximately 15% of sales 2007 Consolidated Sales Agricultural 34% Detergents 9% Pharmaceuticals 11% Food 8% Other 12% Glass/Fiberglass 4% Chemicals 6% Pulp & Paper 4% Electronics 2% Other 3% Bottle Glass 3% Non-Cyclical 81% Cyclical 19% Chemicals 4% |
 5 Diversified and Integrated Cost Structure Low cost sourcing of raw materials • Backward integration: soda ash, lithium • Global sourcing of renewable resources: hardwood pulp, seaweed Low reliance on purchased raw materials • Total raw materials represented approximately 28% of cost of sales in 2007 • No single raw material accounted for more than 8% of total raw material purchases in 2007 • Reduced volatility from limited use of petrochemical feedstocks Low energy demand requirements • Energy represents approximately 13% of cost of sales • Sourced from natural gas, electricity, coal and fuel oil |
 6 Realizing the inherent operating leverage within FMC • Sustained earnings growth >10% per year (1) • 2008 expected to be the fifth straight year of growth in Industrial Chemicals’ soda ash business • Continued growth in Specialty Chemicals and Agricultural Products Maintaining financial strength and flexibility • Investing in higher growth businesses • Pursuing external growth opportunities • Returning cash to shareholders – dividend and share repurchase Focusing the portfolio on higher growth businesses • Managing Specialty Chemicals and Agricultural Products for growth • Managing Industrial Chemicals for cash Disciplined Approach to Unlocking Value (1) Earnings before restructuring and other income and charges |
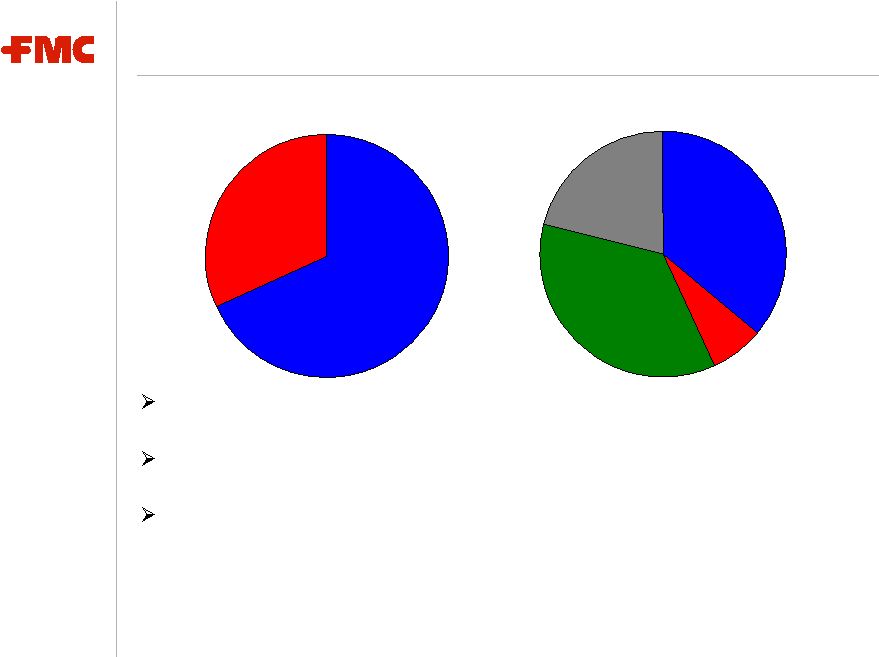
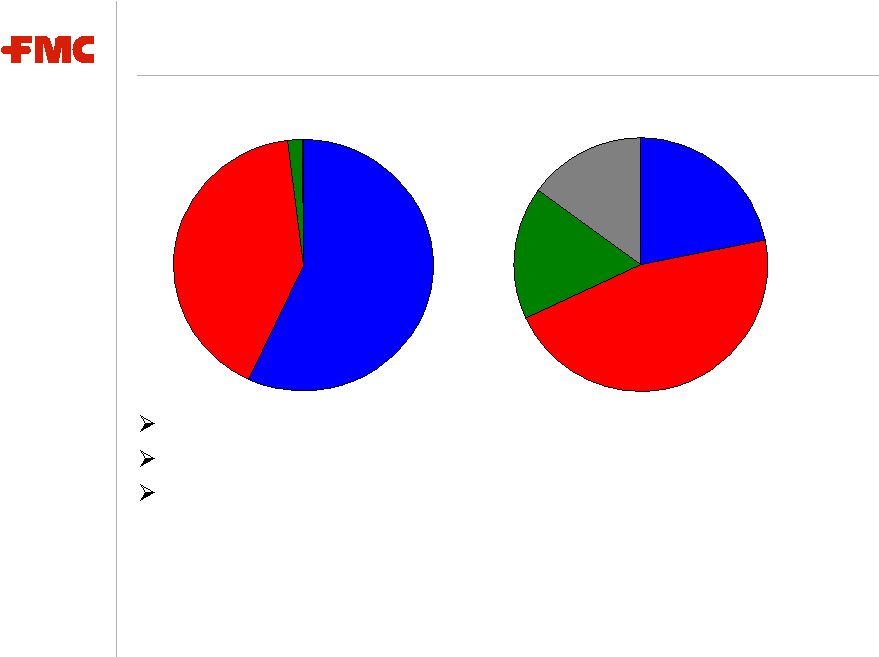 7 Insecticides 57% Herbicides 41% Fungicides 2% Agricultural Products Strong niche positions in the Americas, Europe and Asia Proprietary, branded insecticides and herbicides Strategic Focus: • Selected products, crops and regions • Shifting to significantly shorter innovation cycle • Reducing global supply chain and overhead costs Based on 2007 Consolidated Sales of $889.7 million North America 22% Asia Pacific 15% EMEA 17% Latin America 46% |
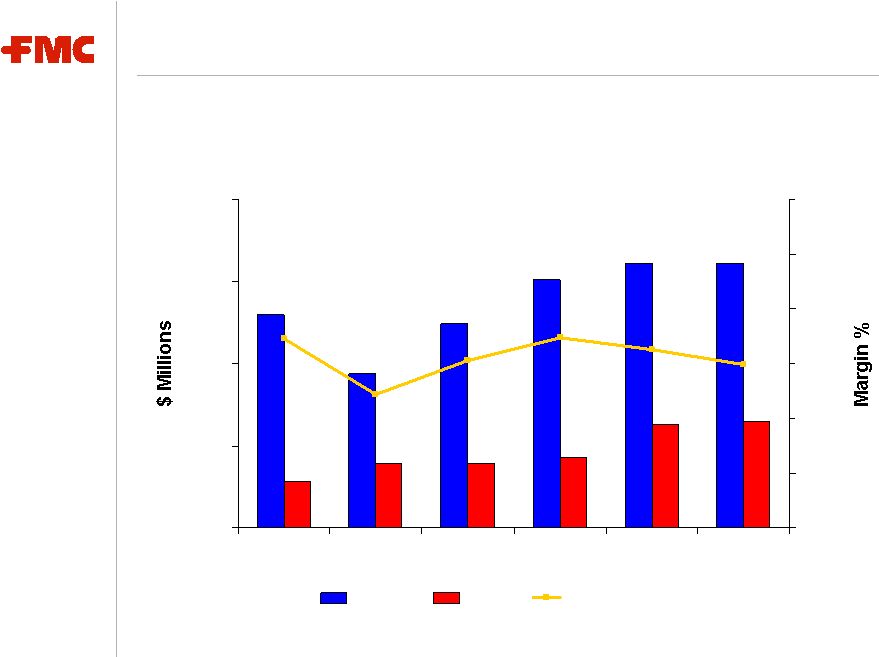
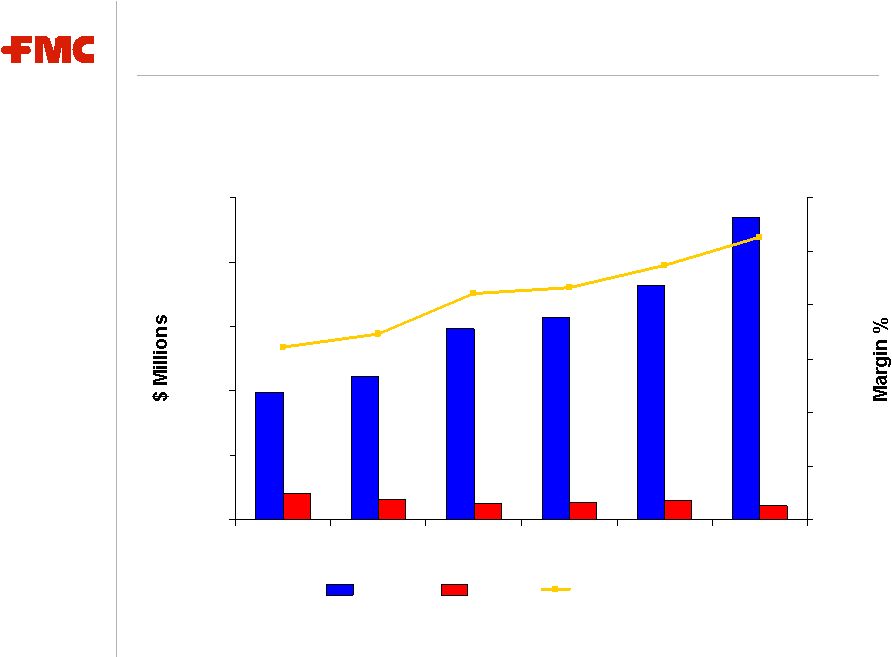 8 Agricultural Products 2008 segment earnings up 10 -15 percent driven by sales growth and further supply chain productivity improvements, partially offset by higher raw material costs 234 182 157 148 111 99 0 50 100 150 200 250 2002 2003 2004 2005 2006 2007 0% 5% 10% 15% 20% 25% 30% EBITDA Capex EBITDA Margin |
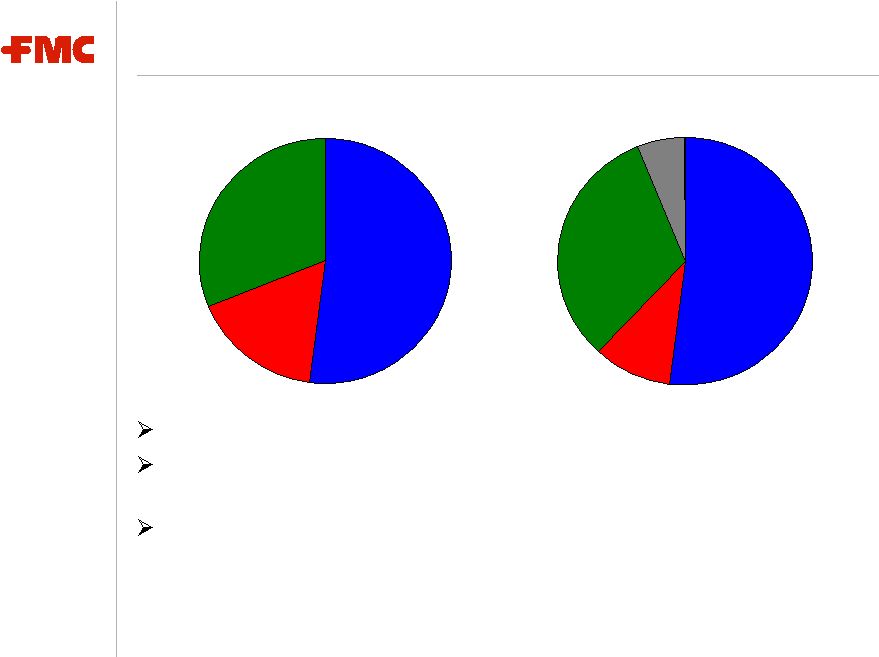
 9 Specialty Chemicals BioPolymers add structure, texture and stability to food and act as binders & disintegrants for dry tablet drugs Lithium focus on downstream specialty products - pharmaceuticals and energy storage devices Strategic Focus: • Growing core market segments • Commercializing new technology platforms • Managing mature segments for cash • Identifying financially attractive bolt-on acquisitions Based on 2007 Consolidated Sales of $659.5 million Latin America 7% Asia Pacific 21% EMEA 36% North America 36% Lithium 32% BioPolymer 68% |
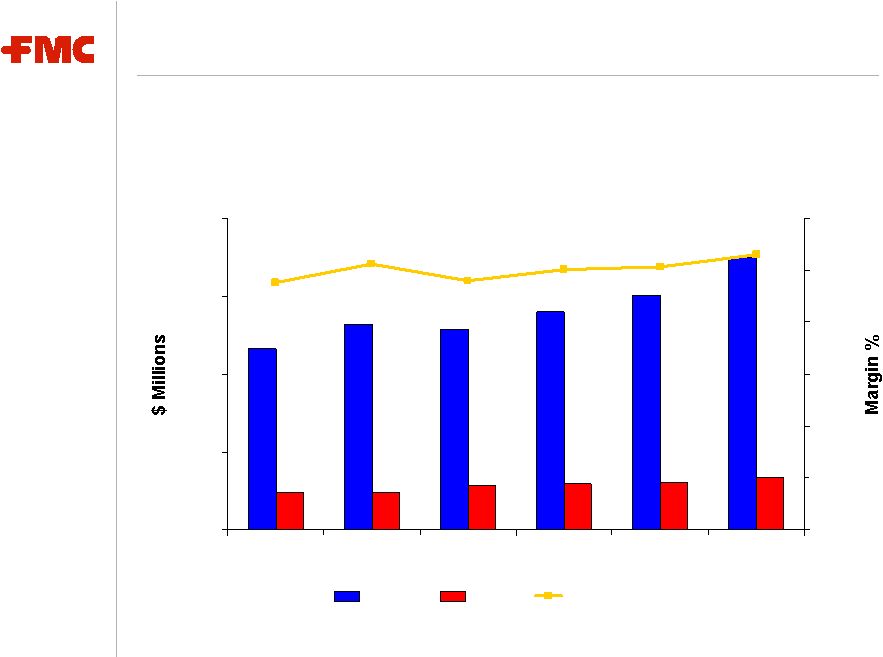 10 Specialty Chemicals 2008 segment earnings growth the low-single digits as strong commercial performance in BioPolymer and the benefit of continued productivity improvements are mitigated by lower selling prices for primary lithium compounds and higher export taxes in Argentina 116 132 129 140 150 175 0 50 100 150 200 2002 2003 2004 2005 2006 2007 0% 5% 10% 15% 20% 25% 30% EBITDA Capex EBITDA Margin |
 11 Industrial Chemicals #1 North American manufacturer of soda ash and peroxygens Backward integration into natural resources; low cost, proprietary production technologies Strategic Focus: • Managing for cash generation • Continued top line growth driven primarily by higher selling prices • Aggressive cost management Asia 7% Based on 2007 Consolidated Sales of $1,087.1 million Alkali (Soda Ash) 52% Peroxygens 16% Foret 32% North America 48% Latin America 11% EMEA 34% Asia Pacific 7% |
 12 Industrial Chemicals 2008 segment earnings up 55-60 percent as aggregate price and volume benefits and improved power market conditions in Spain more than offset higher raw material costs. 130 94 124 151 161 162 0 50 100 150 200 2002 2003 2004 2005 2006 2007 0% 5% 10% 15% 20% 25% 30% EBITDA Capex EBITDA Margin |
 13 FMC in Summary Great businesses, each with EBITDA greater than $160 million Sustained double-digit earnings growth (1) • Earnings leverage in Industrial Chemicals • Continued growth in Specialty Chemicals and Ag Products Strategic and financial flexibility • Robust and growing EBITDA • Balance sheet de-leveraged • Low capex requirements Disciplined approach to unlocking value (1) Earnings before restructuring and other income and charges |
 FMC Corporation Appendix Glossary of Financial Terms Reconciliations of GAAP to Non-GAAP |
 15 Non-GAAP Financial Terms These slides contain certain “non-GAAP financial terms” which are defined below. In addition, we have provided reconciliations of non-GAAP terms to the closest GAAP term in the appendix of this presentation. EBITDA (Earnings Before Interest, Taxes, Depreciation and Amortization) is the sum of Income (loss) from continuing operations before income taxes and Depreciation and Amortization. EBITDA Margin is the quotient of EBITDA (defined above) divided by Revenue. ROIC (Return on Invested Capital) is the sum of Earnings from continuing operations before restructuring and other income and charges and after- tax Interest expense divided by the sum of Short-term debt, Current portion of long-term debt, Long-term debt and Total shareholders’ equity. |
 16 Segment Financial Terms These slides contain references to segment financial items which are presented in detail in Note 19 of FMC’s 2007 Form 10-K. Some of the segment financial terms are “non-GAAP financial terms” and are defined below. In addition, we have provided reconciliations of non-GAAP terms to the closest GAAP term in the appendix of this presentation. EBITDA (Earnings Before Interest, Taxes, Depreciation and Amortization) for a segment is the sum of Income (loss) from continuing operations before income taxes for that segment and Depreciation and Amortization for that segment. EBITDA Margin for a segment is the quotient of EBITDA (defined above) divided by Revenue for that segment. |
 17 Reconciliation of LTM 12/31/2007 consolidated income from continuing operations before income taxes (a GAAP measure) to LTM 12/31/2007 EBITDA (a Non-GAAP measure) EBITDA Reconciliation: LTM 12/31/07 (Unaudited, in $ millions) LTM 12/31/2007 Income (loss) from continuing operations before income taxes $185.7 Add: Restructuring and other charges/(income), net 155.0 Interest expense, net 34.9 Depreciation and amortization 133.7 EBITDA (Non-GAAP) $511.6 Loss on Extinguishment of Debt 0.3 In-process research and development 2.0 |
 18 Reconciliation of LTM 12/31/07 segment operating profit (a GAAP measure) to LTM 12/31/07 EBITDA (a Non-GAAP measure) (Unaudited, in millions) Industrial Specialty Agricultural Segment Chemicals Chemicals Products LTM 12/31/07 segment operating profit (GAAP) $92.5 $142.7 $207.0 Add: Depreciation and amortization 69.0 32.0 27.2 LTM 12/31/07 EBITDA (Non-GAAP) $161.5 $174.7 $234.2 Segment EBITDA Reconciliation |
 FMC Corporation |