Free signup for more
- Track your favorite companies
- Receive email alerts for new filings
- Personalized dashboard of news and more
- Access all data and search results
Filing tables
Filing exhibits
FMC similar filings
- 30 Nov 10 FMC Corporation Announces Closure of Foret Phosphates Plant in Huelva, Spain
- 28 Oct 10 FMC Corporation Announces Third Quarter 2010 Results
- 15 Sep 10 Pierre Brondeau Elected Chairman of FMC Corporation
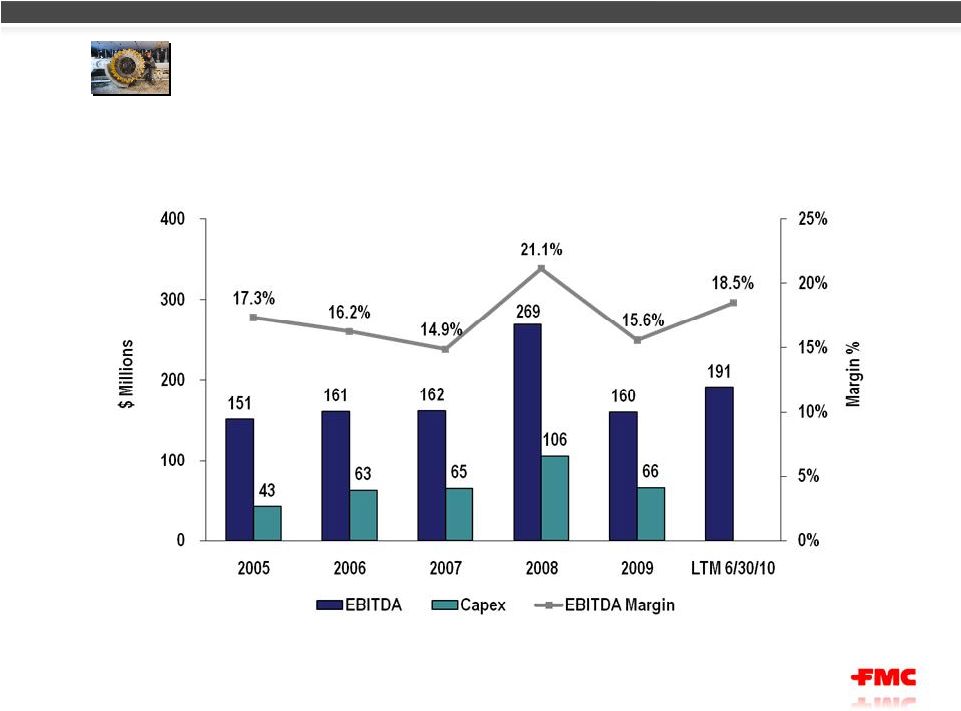
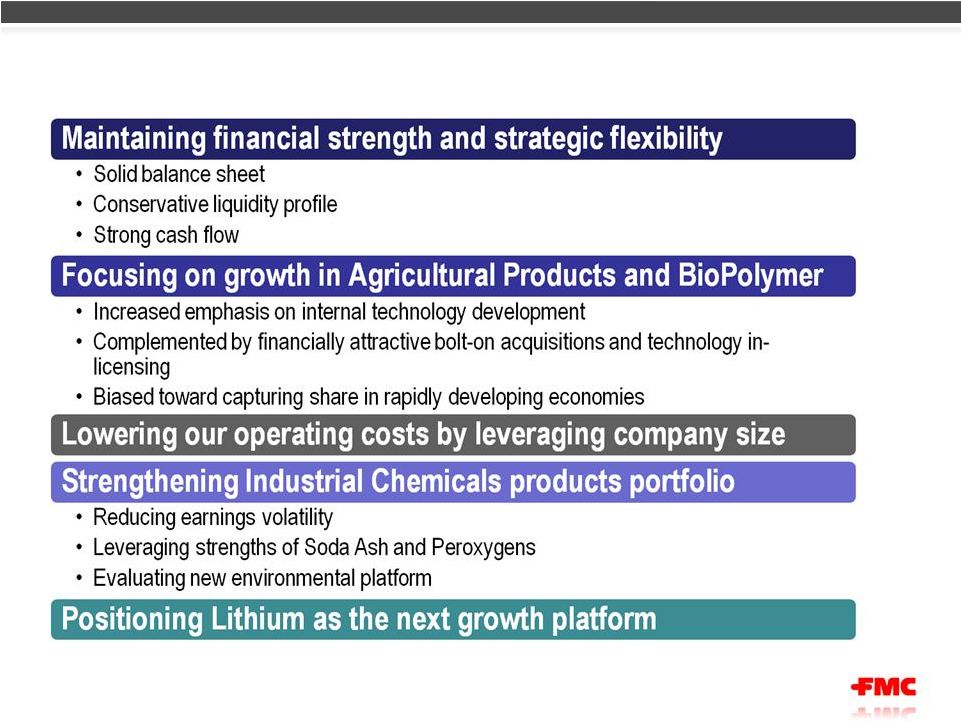
- 30 Aug 10 These slides and the accompanying presentation contain “forward-looking statements” that
- 13 Aug 10 Entry into a Material Definitive Agreement
- 29 Jul 10 FMC Corporation Announces Second Quarter 2010 Results
- 4 May 10 FMC Corporation Announces First Quarter 2010 Results
Filing view
External links