Exhibit 99.1
F.N.B. Corporation
Investor Presentation
Sterne Agee Financial Institutions Investor Conference
February 13, 2012
Vincent J. Delie, Jr.
President and Chief Executive Officer
Vincent J. Calabrese
Chief Financial Officer
F.N.B. Corporation
Cautionary Statement Regarding Forward-Looking Information and Non-GAAP Financial Information
This presentation and the reports F.N.B. Corporation files with the Securities and Exchange Commission often contain “forward-looking statements” relating to present or future trends or factors affecting the banking industry and, specifically, the financial operations, markets and products of F.N.B. Corporation. These forward-looking statements involve certain risks and uncertainties. There are a number of important factors that could cause F.N.B. Corporation’s future results to differ materially from historical performance or projected performance. These factors include, but are not limited to: (1) a significant increase in competitive pressures among financial institutions; (2) changes in the interest rate environment that may reduce interest margins; (3) changes in prepayment speeds, loan sale volumes, charge-offs and loan loss provisions; (4) general economic conditions; (5) various monetary and fiscal policies and regulations of the U.S. government that may adversely affect the businesses in which F.N.B. Corporation is engaged; (6) technological issues which may adversely affect F.N.B. Corporation’s financial operations or customers; (7) changes in the securities markets; (8) risk factors mentioned in the reports and registration statements F.N.B. Corporation files with the Securities and Exchange Commission; (9) housing prices; (10) job market; (11) consumer confidence and spending habits; (12) estimates of fair value of certain F.N.B. Corporation assets and liabilities or (13) the effects of current, pending and future legislation, regulation and regulatory actions. F.N.B. Corporation undertakes no obligation to revise these forward-looking statements or to reflect events or circumstances after the date of this presentation.
To supplement its consolidated financial statements presented in accordance with Generally Accepted Accounting Principles (GAAP), the Corporation provides additional measures of operating results, net income and earnings per share (EPS) adjusted to exclude certain costs, expenses, and gains and losses. The Corporation believes that these non-GAAP financial measures are appropriate to enhance the understanding of its past performance as well as prospects for its future performance. In the event of such a disclosure or release, the Securities and Exchange Commission’s Regulation G requires: (i) the presentation of the most directly comparable financial measure calculated and presented in accordance with GAAP and (ii) a reconciliation of the differences between the non-GAAP financial measure presented and the most directly comparable financial measure calculated and presented in accordance with GAAP. The required presentations and reconciliations are contained herein and can be found at our website, www.fnbcorporation.com, under “Shareholder and Investor Relations” by clicking on “Non-GAAP Reconciliation.”
The Appendix to this presentation contains non-GAAP financial measures used by the Corporation to provide information useful to investors in understanding the Corporation’s operating performance and trends, and facilitate comparisons with the performance of the Corporation’s peers. While the Corporation believes that these non-GAAP financial measures are useful in evaluating the Corporation, the information should be considered supplemental in nature and not as a substitute for or superior to the relevant financial information prepared in accordance with GAAP. The non-GAAP financial measures used by the Corporation may differ from the non-GAAP financial measures other financial institutions use to measure their results of operations. This information should be reviewed in conjunction with the Corporation’s financial results disclosed on January 24, 2012 and in its periodic filings with the Securities and Exchange Commission.
F.N.B. Corporation
2
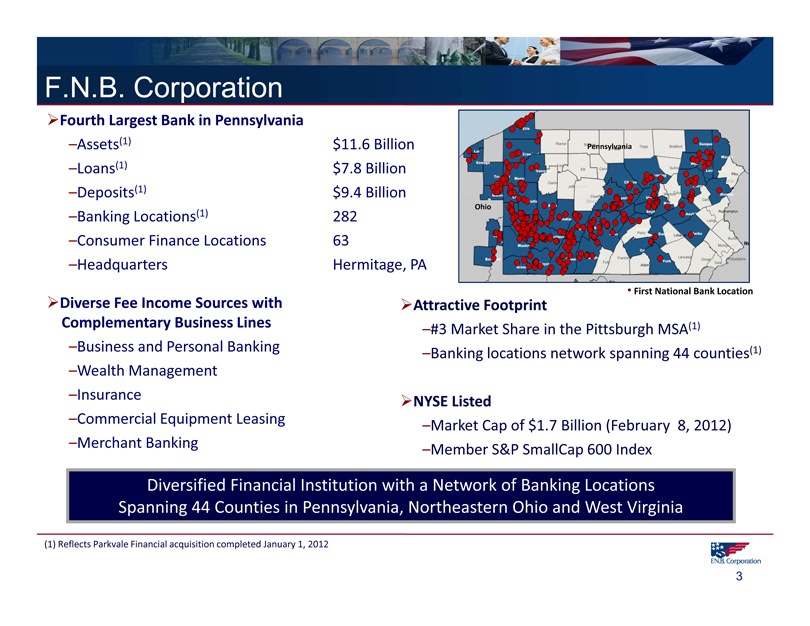
F.N.B. Corporation
Fourth Largest Bank in Pennsylvania
–Assets(1) $11.6 Billion Pennsylvania
–Loans(1) $7.8 Billion
–Deposits(1) $9.4 Billion
–Banking Locations(1) 282 Ohio
–Consumer Finance Locations 63
–Headquarters Hermitage, PA
Diverse Fee Income Sources with Complementary Business Lines
–Business and Personal Banking
–Wealth Management
–Insurance
–Commercial Equipment Leasing
–Merchant Banking
Attractive Footprint First National Bank Location
–#3 Market Share in the Pittsburgh MSA(1)
–Banking locations network spanning 44 counties(1)
NYSE Listed
–Market Cap of $1.7 Billion (February 8, 2012)
–Member S&P SmallCap 600 Index
Diversified Financial Institution with a Network of Banking Locations Spanning 44 Counties in Pennsylvania, Northeastern Ohio and West Virginia
(1) Reflects Parkvale Financial acquisition completed January 1, 2012
F.N.B. Corporation
3
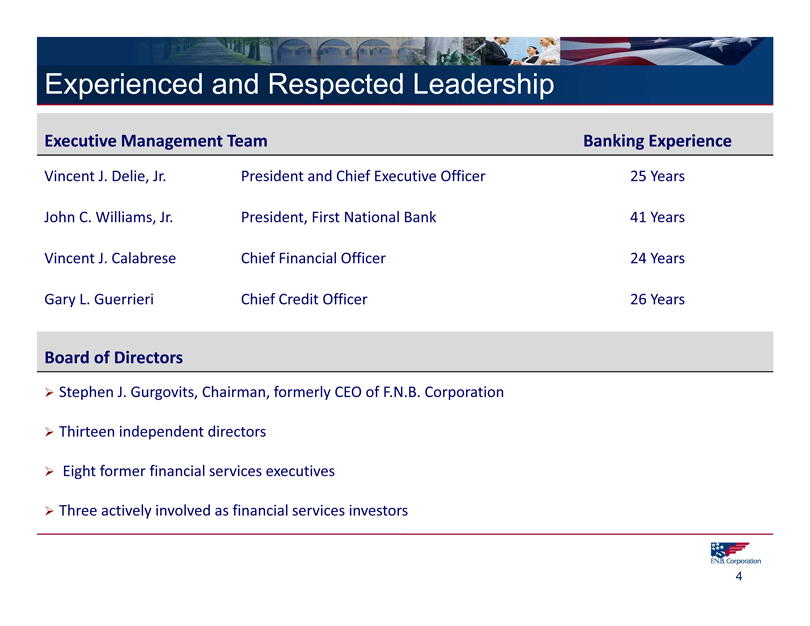
Experienced and Respected Leadership
Executive Management Team Banking Experience
Vincent J. Delie, Jr. President and Chief Executive Officer 25 Years
John C. Williams, Jr. President, First National Bank 41 Years
Vincent J. Calabrese Chief Financial Officer 24 Years
Gary L. Guerrieri Chief Credit Officer 26 Years
Board of Directors
Stephen J. Gurgovits, Chairman, formerly CEO of F.N.B. Corporation
Thirteen independent directors
Eight former financial services executives
Three actively involved as financial services investors
F.N.B. Corporation
4
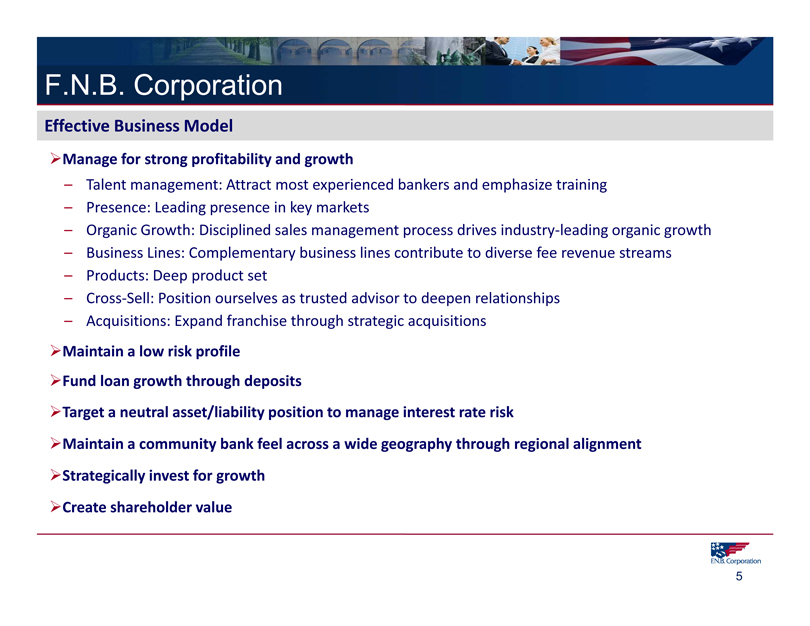
F.N.B. Corporation
Effective Business Model
Manage for strong profitability and growth
– Talent management: Attract most experienced bankers and emphasize training
– Presence: Leading presence in key markets
– Organic Growth: Disciplined sales management process drives industry-leading organic growth
– Business Lines: Complementary business lines contribute to diverse fee revenue streams
– Products: Deep product set
– Cross-Sell: Position ourselves as trusted advisor to deepen relationships
– Acquisitions: Expand franchise through strategic acquisitions
Maintain a low risk profile
Fund loan growth through deposits
Target a neutral asset/liability position to manage interest rate risk
Maintain a community bank feel across a wide geography through regional alignment
Strategically invest for growth
Create shareholder value
F.N.B. Corporation
5
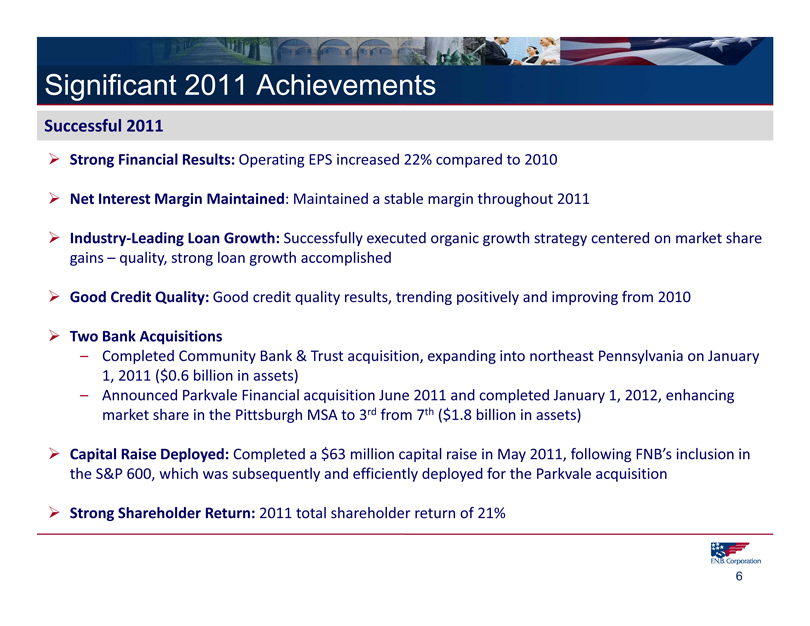
Significant 2011 Achievements
Successful 2011
Strong Financial Results: Operating EPS increased 22% compared to 2010
Net Interest Margin Maintained: Maintained a stable margin throughout 2011
Industry-Leading Loan Growth: Successfully executed organic growth strategy centered on market share gains – quality, strong loan growth accomplished
Good Credit Quality: Good credit quality results, trending positively and improving from 2010
Two Bank Acquisitions
– Completed Community Bank & Trust acquisition, expanding into northeast Pennsylvania on January 1, 2011 ($0.6 billion in assets)
– Announced Parkvale Financial acquisition June 2011 and completed January 1, 2012, enhancing market share in the Pittsburgh MSA to 3rd from 7th ($1.8 billion in assets)
Capital Raise Deployed: Completed a $63 million capital raise in May 2011, following FNB’s inclusion in the S&P 600, which was subsequently and efficiently deployed for the Parkvale acquisition
Strong Shareholder Return: 2011 total shareholder return of 21%
F.N.B. Corporation
6
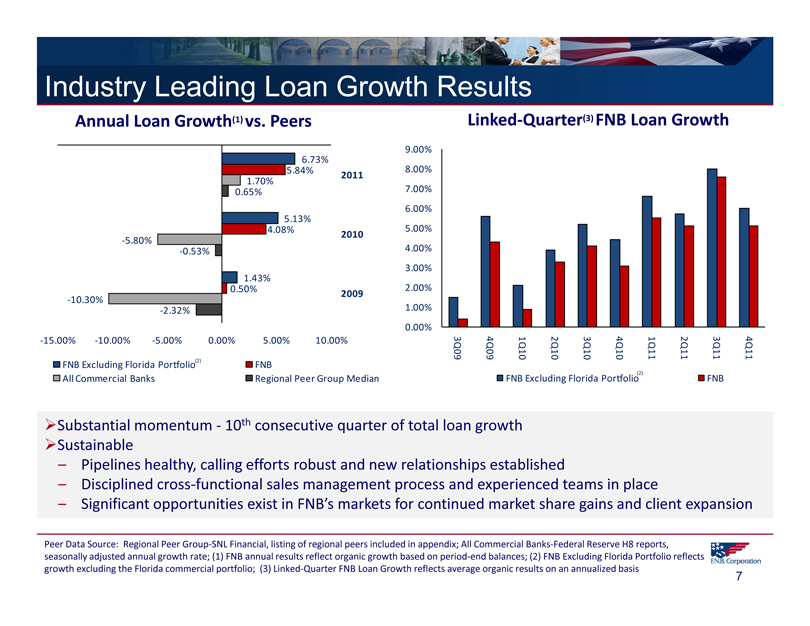
Industry Leading Loan Growth Results
Annual Loan Growth(1) vs. Peers
Linked-Quarter(3) FNB Loan Growth
6.73%
5.84%
1.70%
0.65%
5.13%
4.08%
-5.80%
-0.53%
1.43%
0.50%
-10.30%
-2.32%
2011
2010
2009
-15.00% -10.00% -5.00% 0.00% 5.00% 10.00%
FNB Excluding Florida Portfolio(2) FNB
All Commercial Banks Regional Peer Group Median
9.00% 8.00% 7.00% 6.00% 5.00% 4.00% 3.00% 2.00% 1.00% 0.00%
4Q11
3Q11
2Q11
1Q11
4Q10
3Q10
2Q10
1Q10
4Q09
3Q09
FNB Excluding Florida Portfolio (2)
FNB
Substantial momentum - 10th consecutive quarter of total loan growth
Sustainable
– Pipelines healthy, calling efforts robust and new relationships established
– Disciplined cross-functional sales management process and experienced teams in place
– Significant opportunities exist in FNB’s markets for continued market share gains and client expansion
Peer Data Source: Regional Peer Group-SNL Financial, listing of regional peers included in appendix; All Commercial Banks- Federal Reserve H8 reports, seasonally adjusted annual growth rate; (1) FNB annual results reflect organic growth based on period- end balances; (2) FNB Excluding Florida Portfolio reflects growth excluding the Florida commercial portfolio; (3) Linked-Quarter FNB Loan Growth reflects average organic results on an annualized basis
F.N.B. Corporation
7
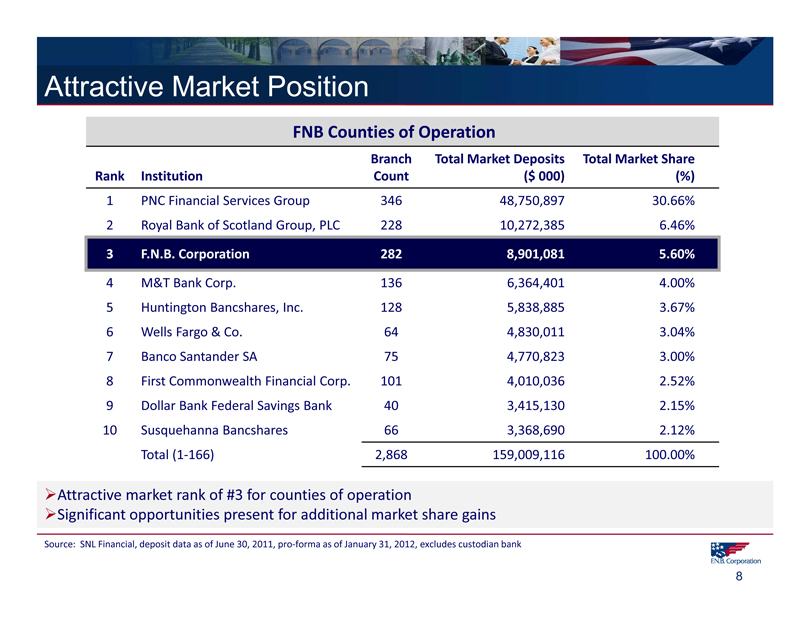
Attractive Market Position
FNB Counties of Operation
Branch Total Market Deposits Total Market Share
Rank Institution Count ($ 000) (%)
1 PNC Financial Services Group 346 48,750,897 30.66%
2 Royal Bank of Scotland Group, PLC 228 10,272,385 6.46%
3 F.N.B. Corporation 282 8,901,081 5.60%
4 M&T Bank Corp. 136 6,364,401 4.00%
5 Huntington Bancshares, Inc. 128 5,838,885 3.67%
6 Wells Fargo & Co. 64 4,830,011 3.04%
7 Banco Santander SA 75 4,770,823 3.00%
8 First Commonwealth Financial Corp. 101 4,010,036 2.52%
9 Dollar Bank Federal Savings Bank 40 3,415,130 2.15%
10 Susquehanna Bancshares 66 3,368,690 2.12%
Total (1-166) 2,868 159,009,116 100.00%
Attractive market rank of #3 for counties of operation
Significant opportunities present for additional market share gains
Source: SNL Financial, deposit data as of June 30, 2011, pro-forma as of January 31, 2012, excludes custodian bank
F.N.B. Corporation
8
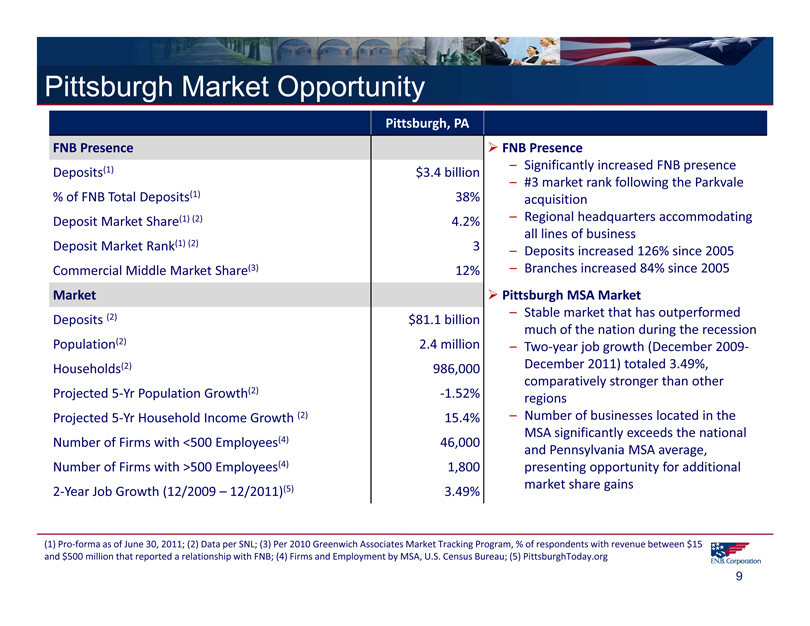
Pittsburgh Market Opportunity
Pittsburgh, PA
FNB Presence
Deposits(1) $3.4 billion
% of FNB Total Deposits(1) 38%
Deposit Market Share(1) (2) 4.2%
Deposit Market Rank(1) (2) 3
Commercial Middle Market Share(3) 12%
Market
Deposits (2) $81.1 billion
Population(2) 2.4 million
Households(2) 986,000
Projected 5-Yr Population Growth(2)-1.52%
Projected 5-Yr Household Income Growth (2) 15.4%
Number of Firms with <500 Employees(4) 46,000
Number of Firms with >500 Employees(4) 1,800
2-Year Job Growth (12/2009 – 12/2011)(5) 3.49%
FNB Presence
– Significantly increased FNB presence
– #3 market rank following the Parkvale acquisition
– Regional headquarters accommodating all lines of business
– Deposits increased 126% since 2005
– Branches increased 84% since 2005
Pittsburgh MSA Market
– Stable market that has outperformed much of the nation during the recession
– Two-year job growth (December 2009-December 2011) totaled 3.49%, comparatively stronger than other regions
– Number of businesses located in the
MSA significantly exceeds the national and Pennsylvania MSA average, presenting opportunity for additional market share gains
(1) Pro-forma as of June 30, 2011; (2) Data per SNL; (3) Per 2010 Greenwich Associates Market Tracking Program, % of respondents with revenue between $15 and $500 million that reported a relationship with FNB; (4) Firms and Employment by MSA, U.S. Census Bureau; (5) PittsburghToday.org
F.N.B. Corporation
9
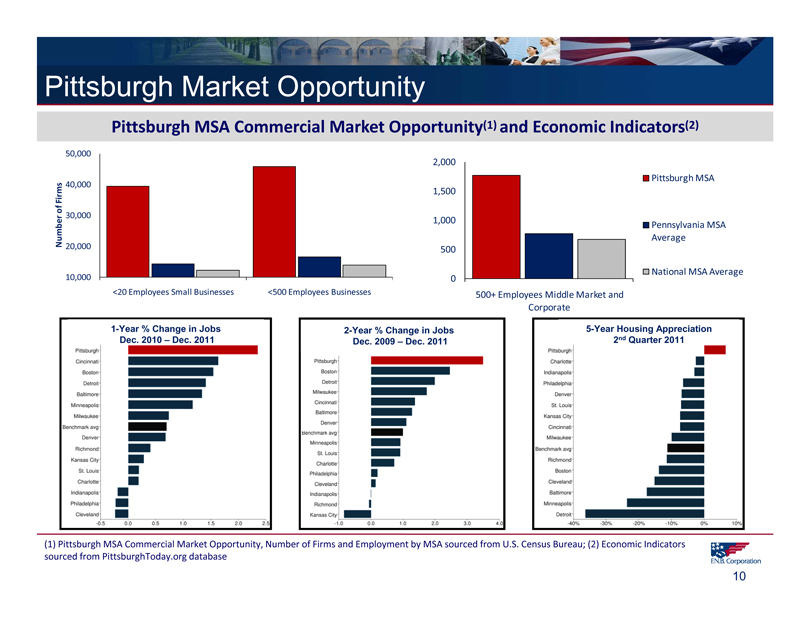
Pittsburgh Market Opportunity
Pittsburgh MSA Commercial Market Opportunity(1) and Economic Indicators(2)
Number of Firms
50,000 40,000 30,000 20,000 10,000
<20 Employees Small Businesses
<500 Employees Businesses
2,000 1,500 1,000 500 0
Pittsburgh MSA
Pennsylvania MSA Average
National MSA Average
500+ Employees Middle Market and Corporate
1-Year % Change in Jobs Dec. 2010 – Dec. 2011
2-Year % Change in Jobs Dec. 2009 – Dec. 2011
5-Year Housing Appreciation 2nd Quarter 2011
(1) Pittsburgh MSA Commercial Market Opportunity, Number of Firms and Employment by MSA sourced from U.S. Census Bureau; (2) Economic Indicators sourced from PittsburghToday.org database
F.N.B. Corporation
10
Banking Footprint
Pennsylvania
Ohio
West Virginia
FNB Banking Location
F.N.B. Corporation
11
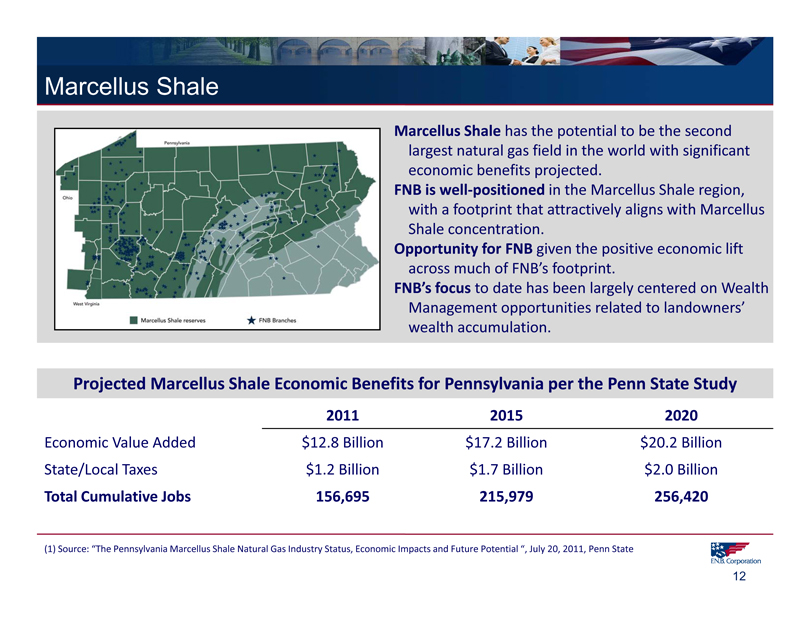
Marcellus Shale
Marcellus Shale has the potential to be the second largest natural gas field in the world with significant economic benefits projected.
FNB is well-positioned in the Marcellus Shale region, with a footprint that attractively aligns with Marcellus Shale concentration.
Opportunity for FNB given the positive economic lift across much of FNB’s footprint.
FNB’s focus to date has been largely centered on Wealth Management opportunities related to landowners’ wealth accumulation.
Projected Marcellus Shale Economic Benefits for Pennsylvania per the Penn State Study
2011 2015 2020
Economic Value Added $12.8 Billion $17.2 Billion $20.2 Billion
State/Local Taxes $1.2 Billion $1.7 Billion $2.0 Billion
Total Cumulative Jobs 156,695 215,979 256,420
(1) Source: “The Pennsylvania Marcellus Shale Natural Gas Industry Status, Economic Impacts and Future Potential “, July 20, 2011, Penn State
F.N.B. Corporation
12
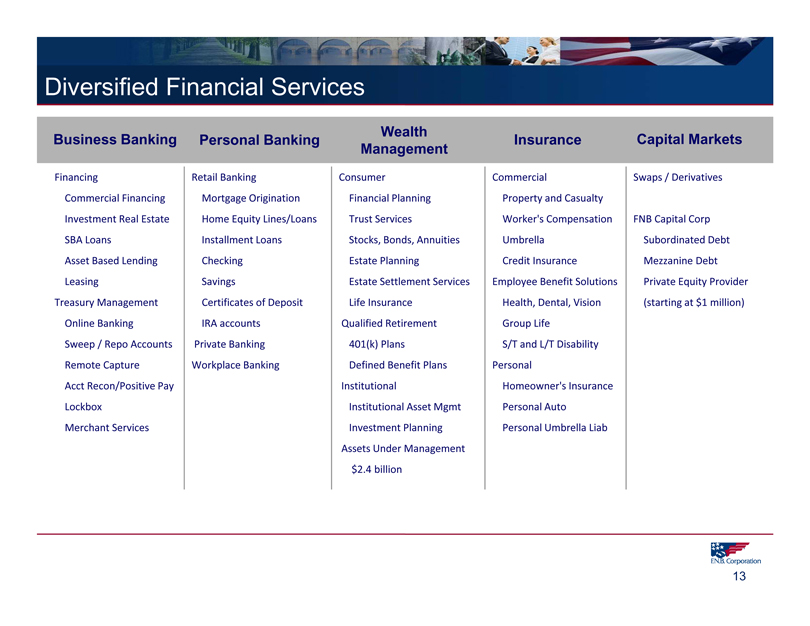
Diversified Financial Services
Wealth
Business Banking Personal Banking Insurance Capital Markets
Management
Financing Retail Banking Consumer Commercial Swaps / Derivatives
Commercial Financing Mortgage Origination Financial Planning Property and Casualty
Investment Real Estate Home Equity Lines/Loans Trust Services Worker’s Compensation FNB Capital Corp
SBA Loans Installment Loans Stocks, Bonds, Annuities Umbrella Subordinated Debt
Asset Based Lending Checking Estate Planning Credit Insurance Mezzanine Debt
Leasing Savings Estate Settlement Services Employee Benefit Solutions Private Equity Provider
Treasury Management Certificates of Deposit Life Insurance Health, Dental, Vision (starting at $1 million)
Online Banking IRA accounts Qualified Retirement Group Life
Sweep / Repo Accounts Private Banking 401(k) Plans S/T and L/T Disability
Remote Capture Workplace Banking Defined Benefit Plans Personal
Acct Recon/Positive Pay Institutional Homeowner’s Insurance
Lockbox Institutional Asset Mgmt Personal Auto
Merchant Services Investment Planning Personal Umbrella Liab
Assets Under Management
$2.4 billion
F.N.B. Corporation
13
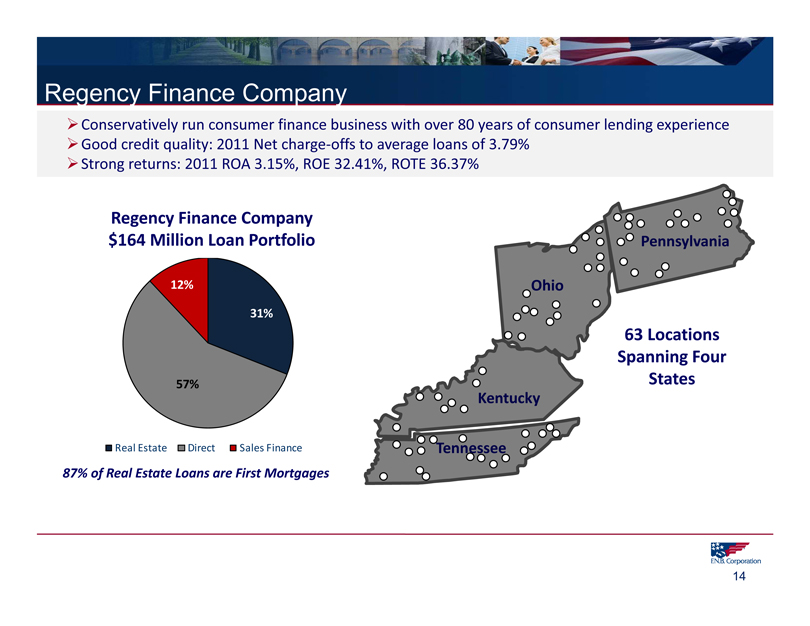
Regency Finance Company
Conservatively run consumer finance business with over 80 years of consumer lending experience Good credit quality: 2011 Net charge-offs to average loans of 3.79% Strong returns: 2011 ROA 3.15%, ROE 32.41%, ROTE 36.37%
Regency Finance Company $164 Million Loan Portfolio
12%
31%
57%
Real Estate Direct Sales Finance
87% of Real Estate Loans are First Mortgages
Ohio
Pennsylvania
Kentucky
Tennessee
63 Locations Spanning Four States
F.N.B. Corporation
14
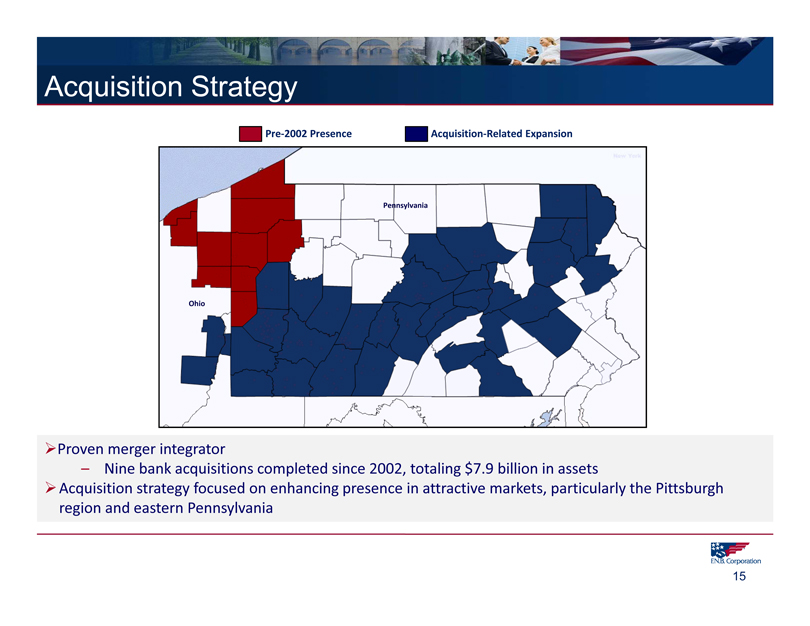
Acquisition Strategy
Pre-2002 Presence
Acquisition-Related Expansion
Ohio
Pennsylvania
Proven merger integrator
– Nine bank acquisitions completed since 2002, totaling $7.9 billion in assets
Acquisition strategy focused on enhancing presence in attractive markets, particularly the Pittsburgh region and eastern Pennsylvania
F.N.B. Corporation
15
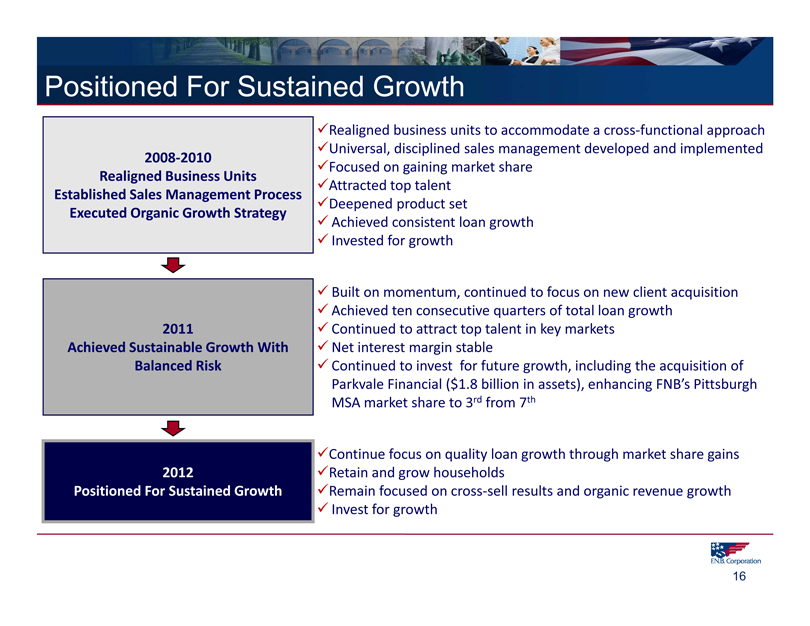
Positioned For Sustained Growth
2008-2010 Realigned Business Units Established Sales Management Process Executed Organic Growth Strategy
2011
Achieved Sustainable Growth With Balanced Risk
2012
Positioned For Sustained Growth
Realigned business units to accommodate a cross-functional approach
Universal, disciplined sales management developed and implemented
Focused on gaining market share
Attracted top talent
Deepened product set
Achieved consistent loan growth
Invested for growth
Built on momentum, continued to focus on new client acquisition
Achieved ten consecutive quarters of total loan growth
Continued to attract top talent in key markets
Net interest margin stable
Continued to invest for future growth, including the acquisition of
Parkvale Financial ($1.8 billion in assets), enhancing FNB’s Pittsburgh
MSA market share to 3rd from 7th
Continue focus on quality loan growth through market share gains
Retain and grow households
Remain focused on cross-sell results and organic revenue growth
Invest for growth
F.N.B. Corporation
16
Operating Results
F.N.B. Corporation
17
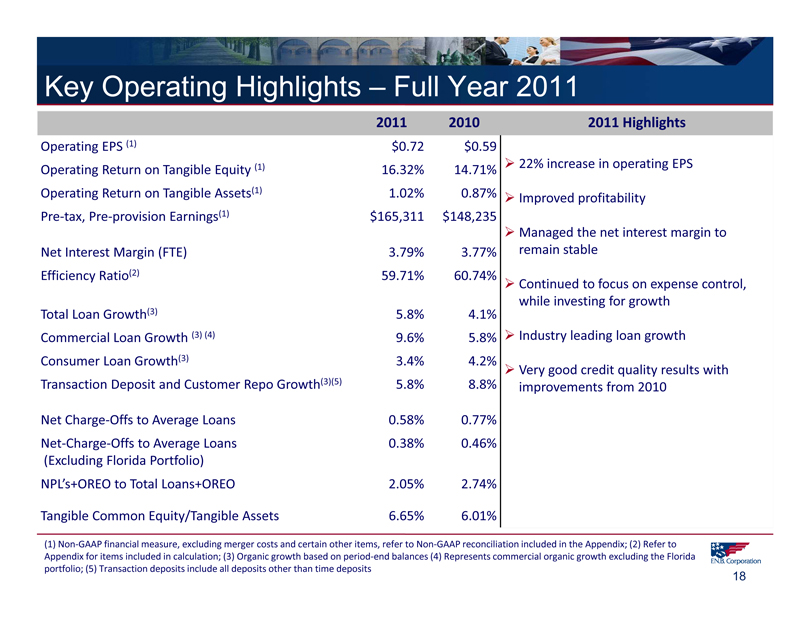
Key Operating Highlights – Full Year 2011
2011 2010
Operating EPS (1) $0.72 $0.59
Operating Return on Tangible Equity (1) 16.32% 14.71%
Operating Return on Tangible Assets(1) 1.02% 0.87%
Pre-tax, Pre-provision Earnings(1) $165,311 $148,235
Net Interest Margin (FTE) 3.79% 3.77%
Efficiency Ratio(2) 59.71% 60.74%
Total Loan Growth(3) 5.8% 4.1%
Commercial Loan Growth (3) (4) 9.6% 5.8%
Consumer Loan Growth(3) 3.4% 4.2%
Transaction Deposit and Customer Repo Growth(3)(5) 5.8% 8.8%
Net Charge-Offs to Average Loans 0.58% 0.77%
Net-Charge-Offs to Average Loans 0.38% 0.46%
(Excluding Florida Portfolio)
NPL’s+OREO to Total Loans+OREO 2.05% 2.74%
Tangible Common Equity/Tangible Assets 6.65% 6.01%
2011 Highlights
22% increase in operating EPS
Improved profitability
Managed the net interest margin to remain stable
Continued to focus on expense control, while investing for growth
Industry leading loan growth
Very good credit quality results with improvements from 2010
(1) Non-GAAP financial measure, excluding merger costs and certain other items, refer to Non-GAAP reconciliation included in the Appendix; (2) Refer to
Appendix for items included in calculation; (3) Organic growth based on period-end balances (4) Represents commercial organic growth excluding the Florida
portfolio; (5) Transaction deposits include all deposits other than time deposits
F.N.B. Corporation
18
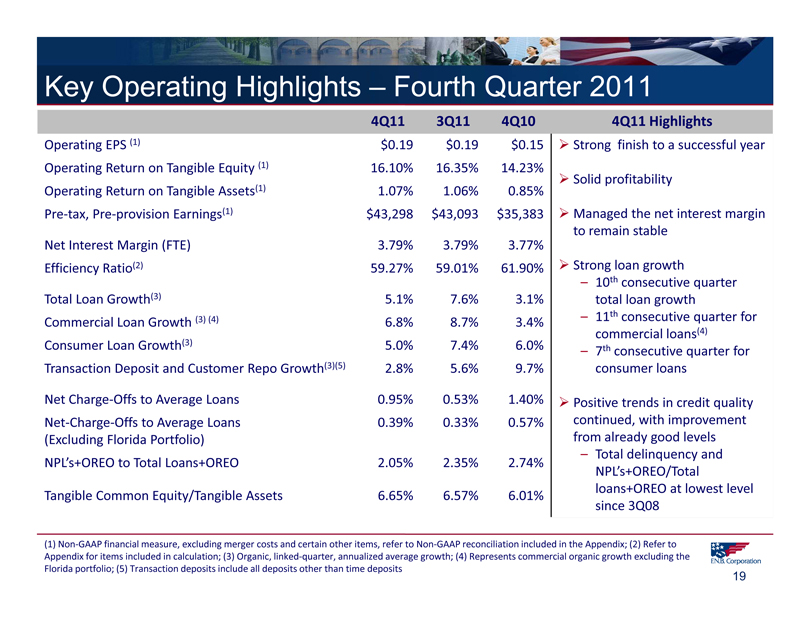
Key Operating Highlights – Fourth Quarter 2011
4Q11 3Q11 4Q10
Operating EPS (1) $0.19 $0.19 $0.15
Operating Return on Tangible Equity (1) 16.10% 16.35% 14.23%
Operating Return on Tangible Assets(1) 1.07% 1.06% 0.85%
Pre-tax, Pre-provision Earnings(1) $43,298 $43,093 $35,383
Net Interest Margin (FTE) 3.79% 3.79% 3.77%
Efficiency Ratio(2) 59.27% 59.01% 61.90%
Total Loan Growth(3) 5.1% 7.6% 3.1%
Commercial Loan Growth (3) (4) 6.8% 8.7% 3.4%
Consumer Loan Growth(3) 5.0% 7.4% 6.0%
Transaction Deposit and Customer Repo Growth(3)(5) 2.8% 5.6% 9.7%
Net Charge-Offs to Average Loans 0.95% 0.53% 1.40%
Net-Charge-Offs to Average Loans 0.39% 0.33% 0.57%
(Excluding Florida Portfolio)
NPL’s+OREO to Total Loans+OREO 2.05% 2.35% 2.74%
Tangible Common Equity/Tangible Assets 6.65% 6.57% 6.01%
4Q11 Highlights
Strong finish to a successful year
Solid profitability
Managed the net interest margin to remain stable
Strong loan growth
– 10th consecutive quarter total loan growth
– 11th consecutive quarter for commercial loans(4)
– 7th consecutive quarter for consumer loans
Positive trends in credit quality continued, with improvement from already good levels
– Total delinquency and NPL’s+OREO/Total loans+OREO at lowest level
(1) Non-GAAP financial measure, excluding merger costs and certain other items, refer to Non-GAAP reconciliation included in the Appendix; (2) Refer to
Appendix for items included in calculation; (3) Organic, linked-quarter, annualized average growth; (4) Represents commercial organic growth excluding the
Florida portfolio; (5) Transaction deposits include all deposits other than time deposits
F.N.B. Corporation
19
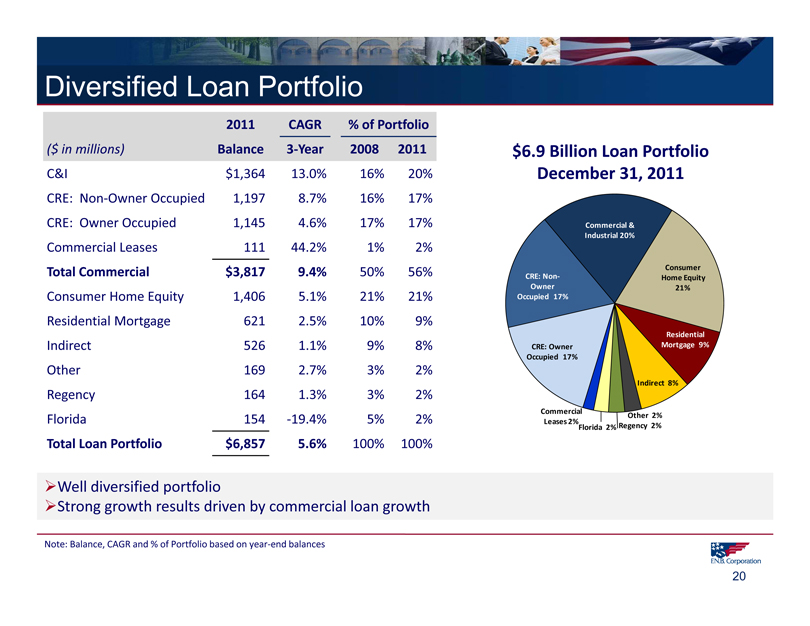
Diversified Loan Portfolio
2011 CAGR% of Portfolio
($ in millions) Balance 3-Year 2008 2011
C&I $1,364 13.0% 16% 20%
CRE: Non-Owner Occupied 1,197 8.7% 16% 17%
CRE: Owner Occupied 1,145 4.6% 17% 17%
Commercial Leases 111 44.2% 1% 2%
Total Commercial $3,817 9.4% 50% 56%
Consumer Home Equity 1,406 5.1% 21% 21%
Residential Mortgage 621 2.5% 10% 9%
Indirect 526 1.1% 9% 8%
Other 169 2.7% 3% 2%
Regency 164 1.3% 3% 2%
Florida 154 -19.4% 5% 2%
Total Loan Portfolio $6,857 5.6% 100% 100%
Well diversified portfolio
Strong growth results driven by commercial loan growth
$6.9 Billion Loan Portfolio December 31, 2011
Commercial & Industrial 20%
CRE: Non-Owner Occupied 17%
CRE: Owner
Occupied 17%
Indirect 8%
Consumer Home Equity 21%
Residential
Mortgage 9%
Commercial Leases 2%
Florida 2%
Other 2%
Regency 2%
Note: Balance, CAGR and % of Portfolio based on year-end balances
F.N.B. Corporation
20
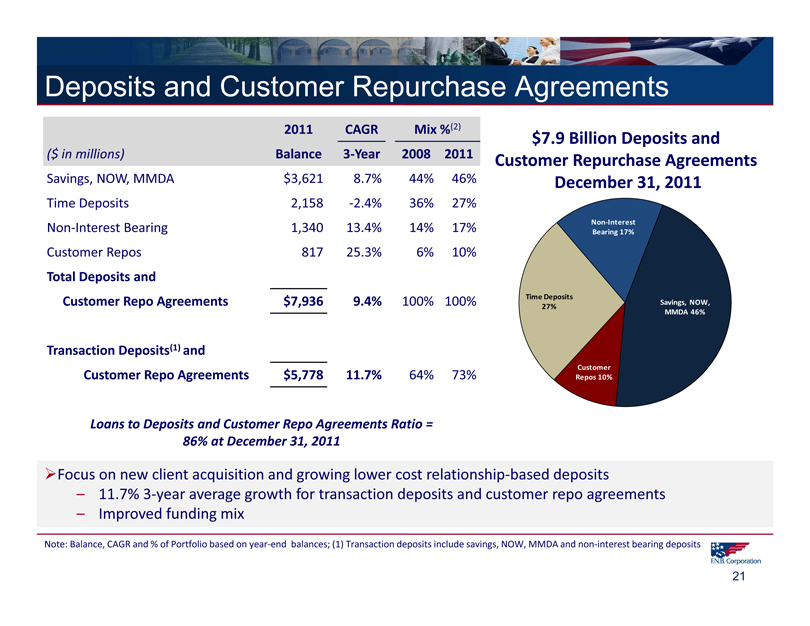
Deposits and Customer Repurchase Agreements
2011 CAGR Mix %(2)
($ in millions) Balance 3-Year 2008 2011
Savings, NOW, MMDA $3,621 8.7% 44% 46%
Time Deposits 2,158 -2.4% 36% 27%
Non-Interest Bearing 1,340 13.4% 14% 17%
Customer Repos 817 25.3% 6% 10%
Total Deposits and
Customer Repo Agreements $7,936 9.4% 100% 100%
Transaction Deposits(1) and
Customer Repo Agreements $5,778 11.7% 64% 73%
Loans to Deposits and Customer Repo Agreements Ratio = 86% at December 31, 2011
Focus on new client acquisition and growing lower cost relationship-based deposits
– 11.7% 3-year average growth for transaction deposits and customer repo agreements
– Improved funding mix
Note: Balance, CAGR and % of Portfolio based on year-end balances; (1) Transaction deposits include savings, NOW, MMDA and non-interest bearing deposits
$7.9 Billion Deposits and Customer Repurchase Agreements December 31, 2011
Time Deposits 27%
Non-Interest Bearing 17%
Savings, NOW, MMDA 46%
Customer Repos 10%
F.N.B. Corporation
21
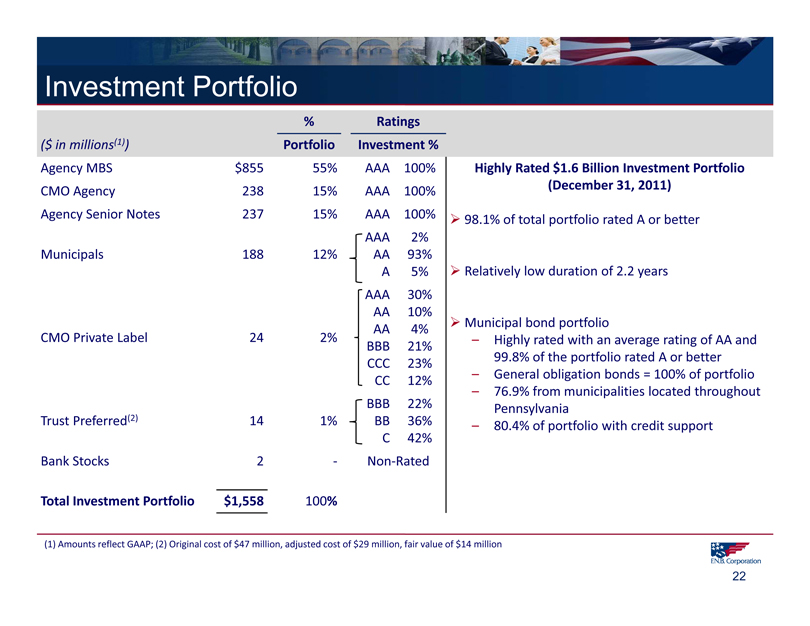
Investment Portfolio
% Ratings
($ in millions(1)) Portfolio Investment %
Agency MBS $855 55% AAA 100%
CMO Agency 238 15% AAA 100%
Agency Senior Notes 237 15% AAA 100%
AAA 2%
Municipals 188 12% AA 93%
A 5%
AAA 30%
AA 10%
AA 4%
CMO Private Label 24 2%
BBB 21%
CCC 23%
CC 12%
BBB 22%
Trust Preferred(2) 14 1% BB 36%
C 42%
Bank Stocks 2 - Non-Rated
Total Investment Portfolio $1,558 100%
Highly Rated $1.6 Billion Investment Portfolio (December 31, 2011)
98.1% of total portfolio rated A or better
Relatively low duration of 2.2 years
Municipal bond portfolio
– Highly rated with an average rating of AA and 99.8% of the portfolio rated A or better
– General obligation bonds = 100% of portfolio
– 76.9% from municipalities located throughout Pennsylvania
– 80.4% of portfolio with credit support
(1) Amounts reflect GAAP; (2) Original cost of $47 million, adjusted cost of $29 million, fair value of $14 million
F.N.B. Corporation
22
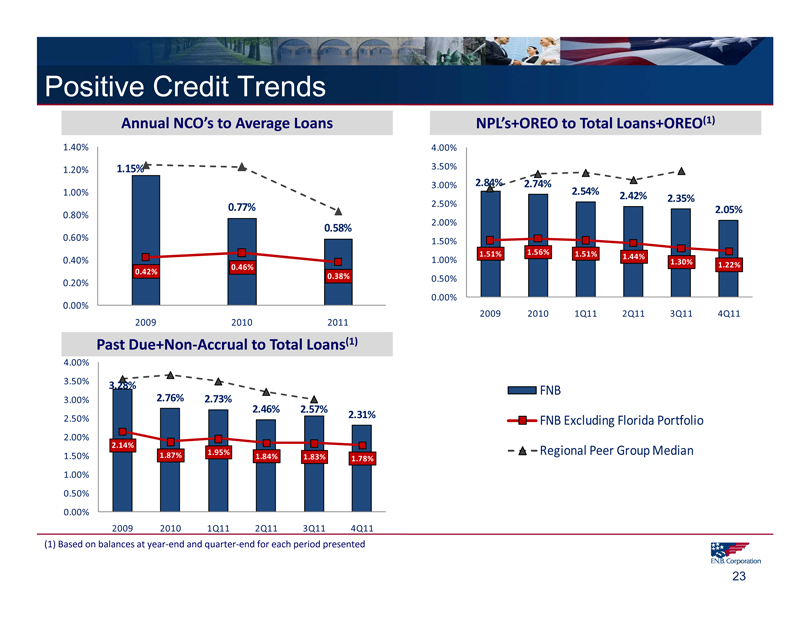
Positive Credit Trends
Annual NCO’s to Average Loans
1.40% 1.20% 1.00% 0.80% 0.60% 0.40% 0.20% 0.00%
1.15%
0.77%
0.58%
0.46%
0.42% 0.38%
2009 2010 2011
Past Due+Non-Accrual to Total Loans(1)
4.00% 3.50% 3.00% 2.50% 2.00% 1.50% 1.00% 0.50% 0.00%
3.28%
2.76% 2.73%
2.46% 2.57% 2.31%
2.14%
1.87% 1.95% 1.84% 1.83% 1.78%
2009 2010 1Q11 2Q11 3Q11 4Q11
NPL’s+OREO to Total Loans+OREO(1)
4.00% 3.50% 3.00% 2.50% 2.00% 1.50% 1.00% 0.50% 0.00%
2.84% 2.74%
2.54% 2.42% 2.35%
2.05%
1.51% 1.56% 1.51% 1.44%
1.30% 1.22%
2009 2010 1Q11 2Q11 3Q11 4Q11
(1) Based on balances at year-end and quarter-end for each period presented
FNB
FNB Excluding Florida Portfolio
Regional Peer Group Median
F.N.B. Corporation
23
Positive Credit Trends
Reserves to Total Loans(1)
2.50%
2.00%
1.50%
1.00%
0.50%
1.83% 1.79% 1.74% 1.47%
2009 2010 2011
FNB FNB Include Credit Mark (2)
Reserves to NPL’s(1)
100.00% 90.00% 80.00% 70.00% 60.00% 50.00% 40.00% 30.00% 20.00% 10.00% 0.00%
71.92% 78.44% 94.76%
2009 2010 2011
FNB Regional Peer Group Median
Credit quality results trended positively throughout 2011
– Better-than-peer results
– Improvements seen in delinquency, net charge-offs and non-performing loan levels reflect very good
results for the Pennsylvania and Regency portfolios and Florida portfolio reductions
Florida portfolio exposure reduced
– Total Florida loans represent only 2% of total loans at December 31, 2011, representing a year-over-year reduction of 21%
– Florida land-related exposure (loans+OREO) reduced 18%, year-over-year to $64 million at December 31, 2011
(1) Based on year-end balances for each period presented; (2) Non-GAAP measure, refer to Appendix
F.N.B. Corporation
24
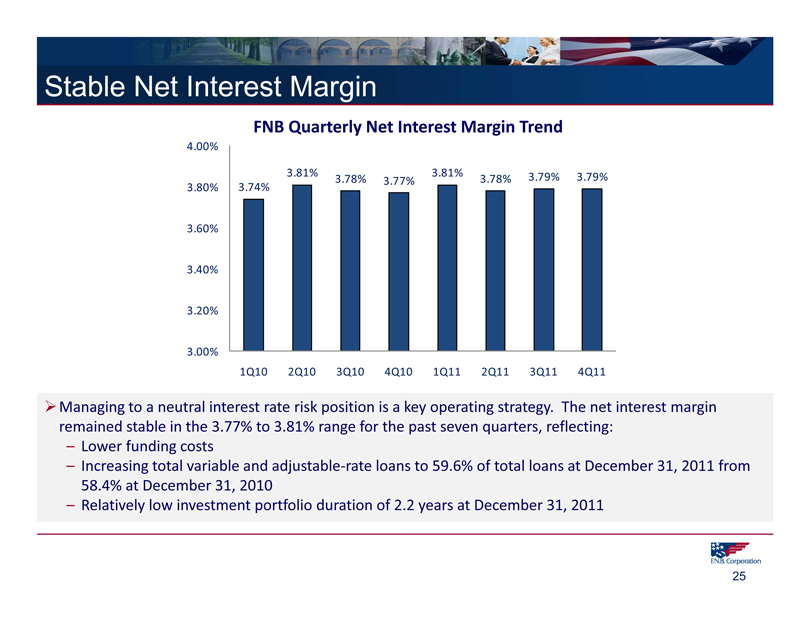
Stable Net Interest Margin
FNB Quarterly Net Interest Margin Trend
4.00% 3.80% 3.60% 3.40% 3.20% 3.00%
3.74% 3.81% 3.78% 3.77% 3.81% 3.78% 3.79% 3.79%
1Q10 2Q10 3Q10 4Q10 1Q11 2Q11 3Q11 4Q11
Managing to a neutral interest rate risk position is a key operating strategy. The net interest margin
remained stable in the 3.77% to 3.81% range for the past seven quarters, reflecting:
– Lower funding costs
– Increasing total variable and adjustable-rate loans to 59.6% of total loans at December 31, 2011 from
58.4% at December 31, 2010
– Relatively low investment portfolio duration of 2.2 years at December 31, 2011
F.N.B. Corporation
25
Well Capitalized
14.0% 12.0% 10.0% 8.0% 6.0% 4.0% 2.0% 0.0%
December 31, 2010 December 31, 2011(1)
12.9% 13.3% Regulatory “Well-Capitalized”
11.4% 11.7%
8.7% 9.2%
6.7%
6.0%
Total Risk-Based Tier One Leverage Tangible Common Equity
Consistent capital management strategy: Focus on the efficient use of capital and provide a reasonable return for our shareholders.
Dividend levels exceed peers: Dividend payout ratio:
2011 2010
FNB 69.7% 74.0%
Regional Peer Group Median 31.1% 40.0%
(1) Capital ratios at December 31, 2011 reflect the offering completed May 2011 of 6.0 million shares with net proceeds of $63 million
F.N.B. Corporation
26
Investment Thesis
F.N.B. Corporation
27
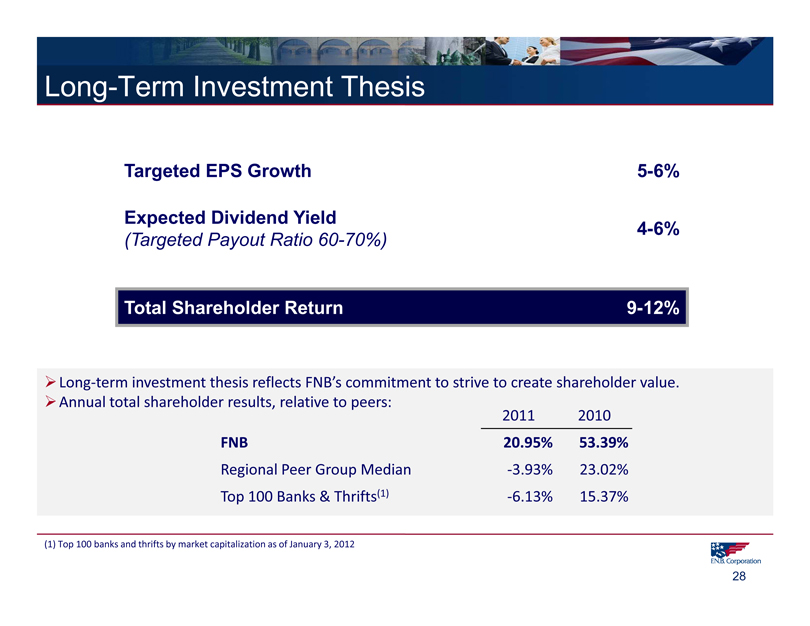
Long-Term Investment Thesis
Targeted EPS Growth 5-6%
Expected Dividend Yield 4-6%
(Targeted Payout Ratio 60-70%)
Total Shareholder Return 9-12%
Long-term investment thesis reflects FNB’s commitment to strive to create shareholder value. Annual total shareholder results, relative to peers:
2011 2010
FNB 20.95% 53.39%
Regional Peer Group Median -3.93% 23.02%
Top 100 Banks & Thrifts(1) -6.13% 15.37%
(1) Top 100 banks and thrifts by market capitalization as of January 3, 2012
F.N.B. Corporation
28
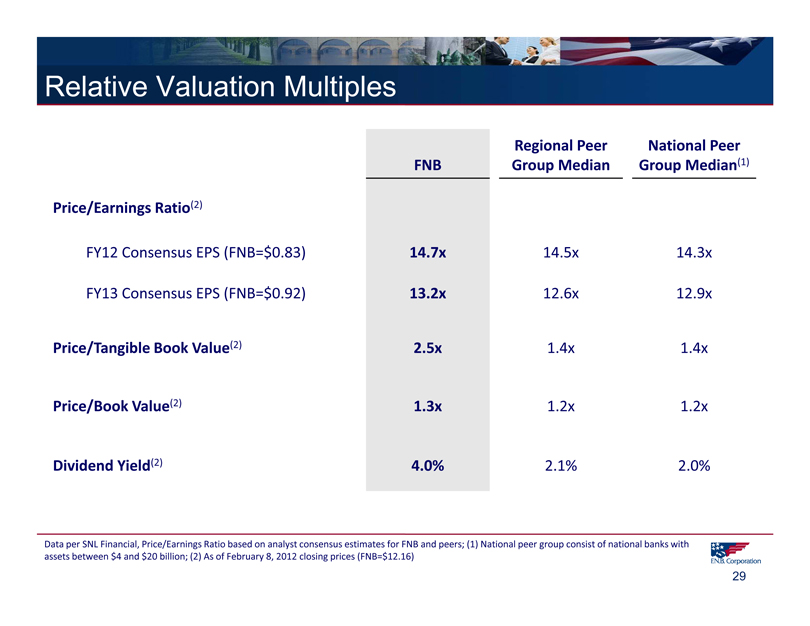
Relative Valuation Multiples
FNB Regional Peer Group Median
National Peer Group Median(1)
Price/Earnings Ratio(2)
FY12 Consensus EPS (FNB=$0.83) 14.7x 14.5x 14.3x
FY13 Consensus EPS (FNB=$0.92) 13.2x 12.6x 12.9x
Price/Tangible Book Value(2) 2.5x 1.4x 1.4x
Price/Book Value(2) 1.3x 1.2x 1.2x
Dividend Yield(2) 4.0% 2.1% 2.0%
Data per SNL Financial, Price/Earnings Ratio based on analyst consensus estimates for FNB and peers; (1) National peer group consist of national banks with assets between $4 and $20 billion; (2) As of February 8, 2012 closing prices (FNB=$12.16)
F.N.B. Corporation
29
2012 Outlook
Positive 2012 Outlook
Continued strong organic loan growth with market share growth expected for both commercial and consumer loans
– Full year average organic loan growth in the mid-single digits projected
Solid deposit growth
– Mid-single digit organic growth for transaction deposits and customer repurchase agreements projected
Net interest income growth in the mid-teens
– Full year net interest margin in the mid-370’s for core FNB and mid-360’s including the Parkvale acquisition
Non-interest income growth for core FNB in the mid-single digits
Continued focus on expense control with expected core non-interest expense growth in the low-single digits
– Full year 2012 efficiency ratio in the high 50% level projected
Continued gradual improvement in credit quality from the good 2011 results
Note: The 2012 Outlook above is consistent with guidance provided on F.N.B. Corporation’s Fourth Quarter and Full Year 2011 Earnings Call on January 24, 2012; The term “core” refers to FNB results excluding the addition of Parkvale
F.N.B. Corporation
30
Appendix
F.N.B. Corporation
31
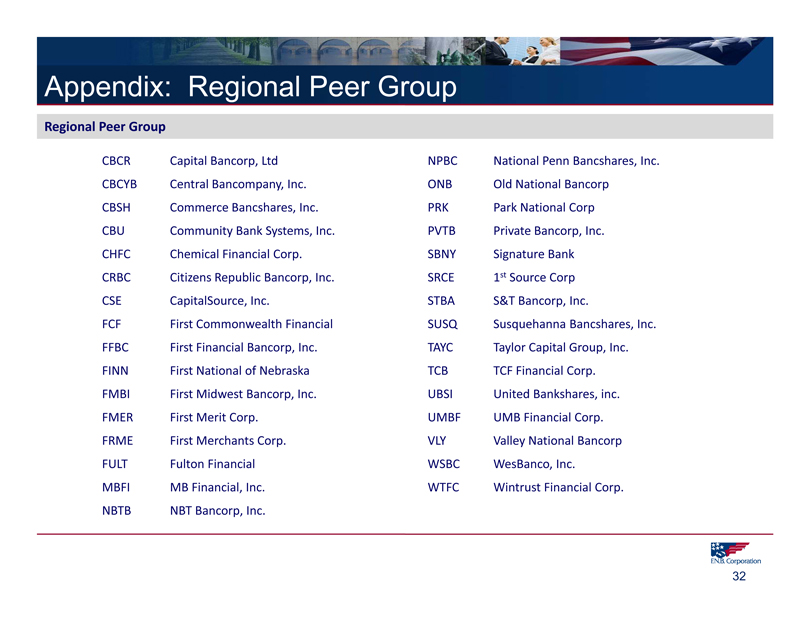
Appendix: Regional Peer Group
Regional Peer Group
CBCR Capital Bancorp, Ltd NPBC National Penn Bancshares, Inc.
CBCYB Central Bancompany, Inc. ONB Old National Bancorp
CBSH Commerce Bancshares, Inc. PRK Park National Corp
CBU Community Bank Systems, Inc. PVTB Private Bancorp, Inc.
CHFC Chemical Financial Corp. SBNY Signature Bank
CRBC Citizens Republic Bancorp, Inc. SRCE 1st Source Corp
CSE CapitalSource, Inc. STBA S&T Bancorp, Inc.
FCF First Commonwealth Financial SUSQ Susquehanna Bancshares, Inc.
FFBC First Financial Bancorp, Inc. TAYC Taylor Capital Group, Inc.
FINN First National of Nebraska TCB TCF Financial Corp.
FMBI First Midwest Bancorp, Inc. UBSI United Bankshares, inc.
FMER First Merit Corp. UMBF UMB Financial Corp.
FRME First Merchants Corp. VLY Valley National Bancorp
FULT Fulton Financial WSBC WesBanco, Inc.
MBFI MB Financial, Inc. WTFC Wintrust Financial Corp.
NBTB NBT Bancorp, Inc.
F.N.B. Corporation
32
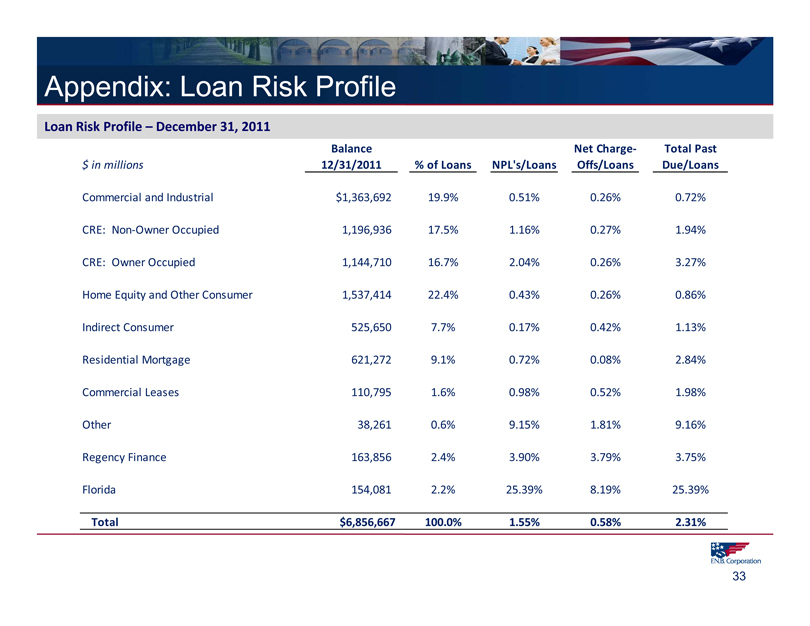
Appendix: Loan Risk Profile
Loan Risk Profile – December 31, 2011
$ in millions Balance 12/31/2011 % of Loans NPL’s/Loans Net Charge-Offs/Loans Total Past Due/Loans
Commercial and Industrial $1,363,692 19.9% 0.51% 0.26% 0.72%
CRE: Non-Owner Occupied 1,196,936 17.5% 1.16% 0.27% 1.94%
CRE: Owner Occupied 1,144,710 16.7% 2.04% 0.26% 3.27%
Home Equity and Other Consumer 1,537,414 22.4% 0.43% 0.26% 0.86%
Indirect Consumer 525,650 7.7% 0.17% 0.42% 1.13%
Residential Mortgage 621,272 9.1% 0.72% 0.08% 2.84%
Commercial Leases 110,795 1.6% 0.98% 0.52% 1.98%
Other 38,261 0.6% 9.15% 1.81% 9.16%
Regency Finance 163,856 2.4% 3.90% 3.79% 3.75%
Florida 154,081 2.2% 25.39% 8.19% 25.39%
Total $6,856,667 100.0% 1.55% 0.58% 2.31%
F.N.B. Corporation
33
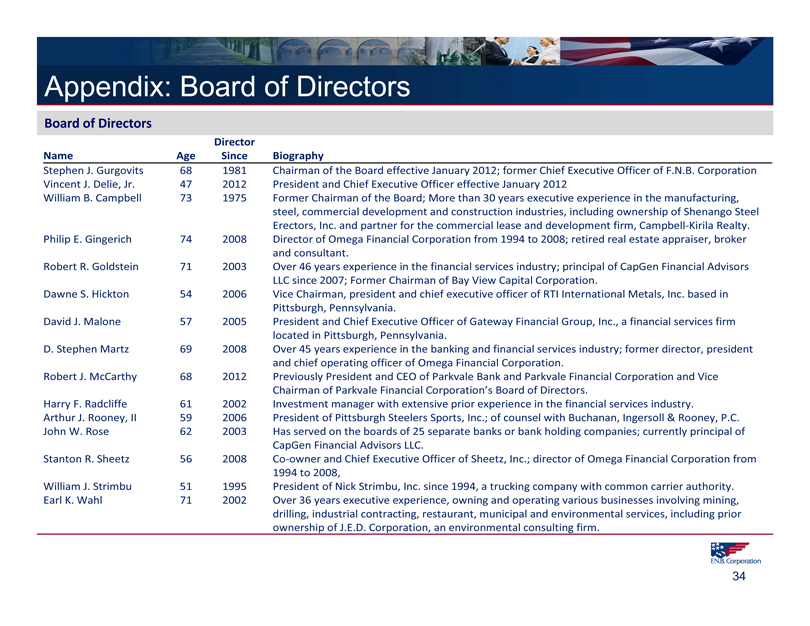
Appendix: Board of Directors
Board of Directors
Name Age Director Since Biography
Stephen J. Gurgovits 68 1981 Chairman of the Board effective January 2012; former Chief Executive Officer of F.N.B. Corporation
Vincent J. Delie, Jr. 47 2012 President and Chief Executive Officer effective January 2012
William B. Campbell 73 1975 Former Chairman of the Board; More than 30 years executive experience in the manufacturing, steel, commercial development and construction industries, including ownership of Shenango Steel Erectors, Inc. and partner for the commercial lease and development firm, Campbell-Kirila Realty.
Philip E. Gingerich 74 2008 Director of Omega Financial Corporation from 1994 to 2008; retired real estate appraiser, broker and consultant.
Robert R. Goldstein 71 2003 Over 46 years experience in the financial services industry; principal of CapGen Financial Advisors LLC since 2007; Former Chairman of Bay View Capital Corporation.
Dawne S. Hickton 54 2006 Vice Chairman, president and chief executive officer of RTI International Metals, Inc. based in Pittsburgh, Pennsylvania.
David J. Malone 57 2005 President and Chief Executive Officer of Gateway Financial Group, Inc., a financial services firm located in Pittsburgh, Pennsylvania.
D. Stephen Martz 69 2008 Over 45 years experience in the banking and financial services industry; former director, president and chief operating officer of Omega Financial Corporation.
Robert J. McCarthy 68 2012 Previously President and CEO of Parkvale Bank and Parkvale Financial Corporation and Vice Chairman of Parkvale Financial Corporation’s Board of Directors.
Harry F. Radcliffe 61 2002 Investment manager with extensive prior experience in the financial services industry.
Arthur J. Rooney, II 59 2006 President of Pittsburgh Steelers Sports, Inc.; of counsel with Buchanan, Ingersoll & Rooney, P.C.
John W. Rose 62 2003 Has served on the boards of 25 separate banks or bank holding companies; currently principal of
CapGen Financial Advisors LLC.
Stanton R. Sheetz 56 2008 Co-owner and Chief Executive Officer of Sheetz, Inc.; director of Omega Financial Corporation from
1994 to 2008,
William J. Strimbu 51 1995 President of Nick Strimbu, Inc. since 1994, a trucking company with common carrier authority.
Earl K. Wahl 71 2002 Over 36 years executive experience, owning and operating various businesses involving mining, drilling, industrial contracting, restaurant, municipal and environmental services, including prior ownership of J.E.D. Corporation, an environmental consulting firm.
F.N.B. Corporation
34
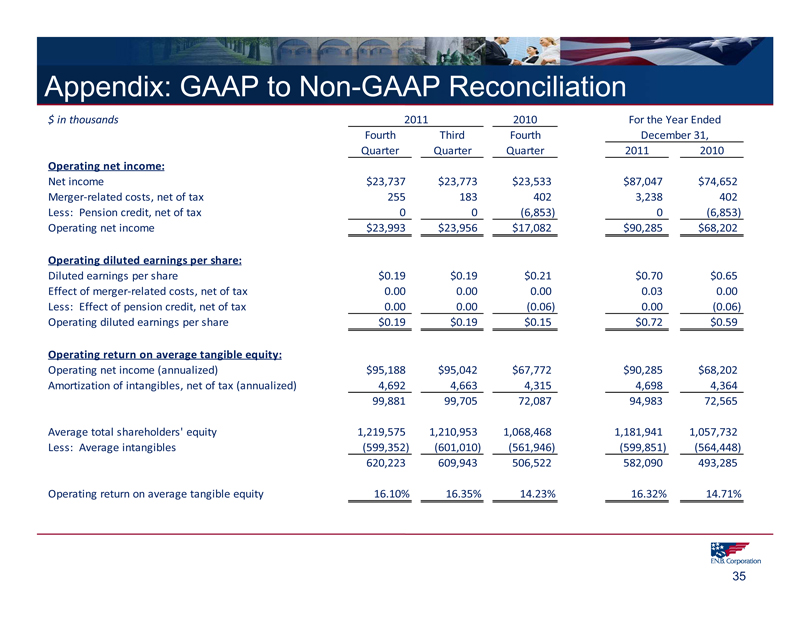
Appendix: GAAP to Non-GAAP Reconciliation
$ in thousands 2011 2010 For the Year Ended December 31,
Fourth Quarter Third Quarter Fourth Quarter 2011 2010
Operating net income:
Net income $23,737 $23,773 $23,533 $87,047 $74,652
Merger-related costs, net of tax 255 183 402 3,238 402
Less: Pension credit, net of tax 0 0 (6,853) 0 (6,853)
Operating net income $23,993 $23,956 $17,082 $90,285 $68,202
Operating diluted earnings per share:
Diluted earnings per share $0.19 $0.19 $0.21 $0.70 $0.65
Effect of merger-related costs, net of tax 0.00 0.00 0.00 0.03 0.00
Less: Effect of pension credit, net of tax 0.00 0.00 (0.06) 0.00 (0.06)
Operating diluted earnings per share $0.19 $0.19 $0.15 $0.72 $0.59
Operating return on average tangible equity:
Operating net income (annualized) $95,188 $95,042 $67,772 $90,285 $68,202
Amortization of intangibles, net of tax (annualized) 4,692 4,663 4,315 4,698 4,364
99,881 99,705 72,087 94,983 72,565
Average total shareholders’ equity 1,219,575 1,210,953 1,068,468 1,181,941 1,057,732
Less: Average intangibles (599,352) (601,010) (561,946) (599,851) (564,448)
620,223 609,943 506,522 582,090 493,285
Operating return on average tangible equity 16.10% 16.35% 14.23% 16.32% 14.71%
F.N.B. Corporation
35
Appendix: GAAP to Non-GAAP Reconciliation
$ in thousands 2011 2010 For the Year Ended December 31,
Fourth Quarter Third Quarter Fourth Quarter 2011 2010
Operating return on average tangible assets:
Operating net income (annualized) $95,188 $95,042 $67,772 $90,285 $68,202
Amortization of intangibles, net of tax (annualized) 4,692 4,663 4,315 4,698 4,364
99,881 99,705 72,087 94,983 72,565
Average total assets 9,947,884 9,971,847 9,044,812 9,871,164 8,906,734
Less: Average intangibles (599,352) (601,010) (561,946) (599,851) (564,448)
9,348,532 9,370,837 8,482,866 9,271,313 8,342,286
Operating return on average tangible assets 1.07% 1.06% 0.85% 1.02% 0.87%
Pre-tax, pre-provision earnings:
Net interest income (FTE) $82,051 $82,411 $74,528 $324,403 $291,642
Non-interest income (excl securities gains, OTTI) 32,598 29,630 29,500 119,918 115,972
Non-interest expense 71,591 69,217 58,329 283,734 251,103
Pre-tax, pre-provision earnings 43,059 42,824 45,698 160,587 156,511
Adjustments:
Net impairment losses on securities (29) (37) (51) (66) (2,339)
Gain on sale of securities 3,511 49 443 3,652 2,960
FHLB prepayment penalty 3,328 - -3,328 2,269
Merger costs 393 282 619 4,982 619
Pension credit 0 0 (10,543) 0 (10,543)
Pre-tax, pre-provision earnings $ 43,298 $ 43,093 $ 35,383 $ 165,311 $ 148,235
F.N.B. Corporation
36
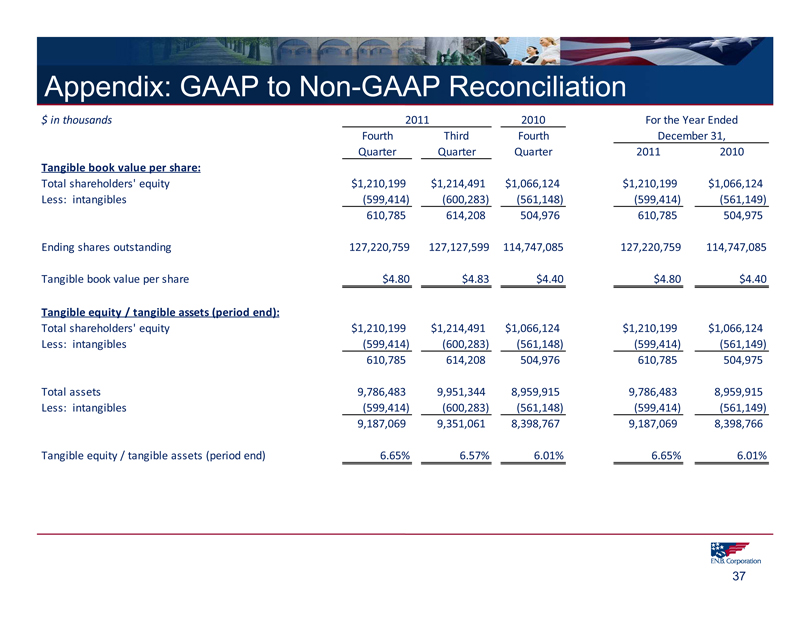
Appendix: GAAP to Non-GAAP Reconciliation
$ in thousands 2011 2010 For the Year Ended December 31,
Fourth Quarter Third Quarter Fourth Quarter 2011 2010
Tangible book value per share:
Total shareholders’ equity $1,210,199 $1,214,491 $1,066,124 $1,210,199 $1,066,124
Less: intangibles (599,414) (600,283) (561,148) (599,414) (561,149)
610,785 614,208 504,976 610,785 504,975
Ending shares outstanding 127,220,759 127,127,599 114,747,085 127,220,759 114,747,085
Tangible book value per share $4.80 $4.83 $4.40 $4.80 $4.40
Tangible equity / tangible assets (period end):
Total shareholders’ equity $1,210,199 $1,214,491 $1,066,124 $1,210,199 $1,066,124
Less: intangibles (599,414) (600,283) (561,148) (599,414) (561,149)
610,785 614,208 504,976 610,785 504,975
Total assets 9,786,483 9,951,344 8,959,915 9,786,483 8,959,915
Less: intangibles (599,414) (600,283) (561,148) (599,414) (561,149)
9,187,069 9,351,061 8,398,767 9,187,069 8,398,766
Tangible equity / tangible assets (period end) 6.65% 6.57% 6.01% 6.65% 6.01%
F.N.B. Corporation
37
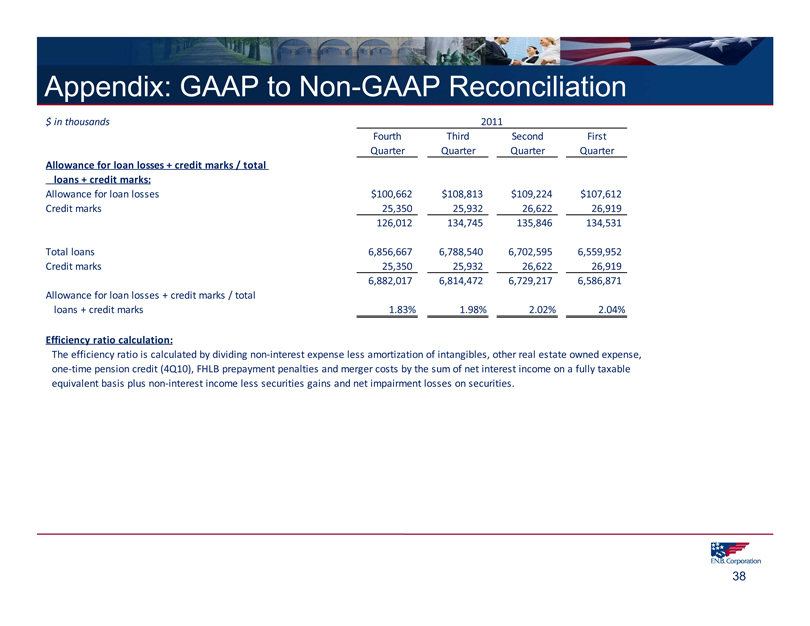
Appendix: GAAP to Non-GAAP Reconciliation
$ in thousands 2011
Fourth Quarter Third Quarter Second Quarter First Quarter
Allowance for loan losses + credit marks / total loans + credit marks:
Allowance for loan losses $100,662 $108,813 $109,224 $107,612
Credit marks 25,350 25,932 26,622 26,919
126,012 134,745 135,846 134,531
Total loans 6,856,667 6,788,540 6,702,595 6,559,952
Credit marks 25,350 25,932 26,622 26,919
6,882,017 6,814,472 6,729,217 6,586,871
Allowance for loan losses + credit marks / total
loans + credit marks 1.83% 1.98% 2.02% 2.04%
Efficiency ratio calculation:
The efficiency ratio is calculated by dividing non-interest expense less amortization of intangibles, other real estate owned expense, one-time pension credit (4Q10), FHLB prepayment penalties and merger costs by the sum of net interest income on a fully taxable equivalent basis plus non-interest income less securities gains and net impairment losses on securities.
F.N.B. Corporation
38