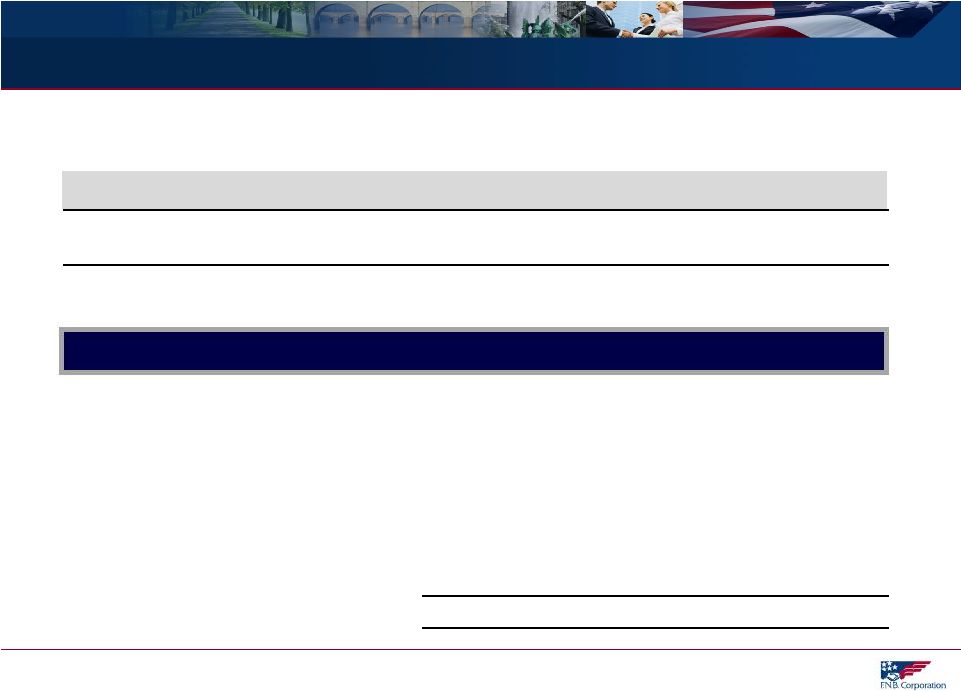
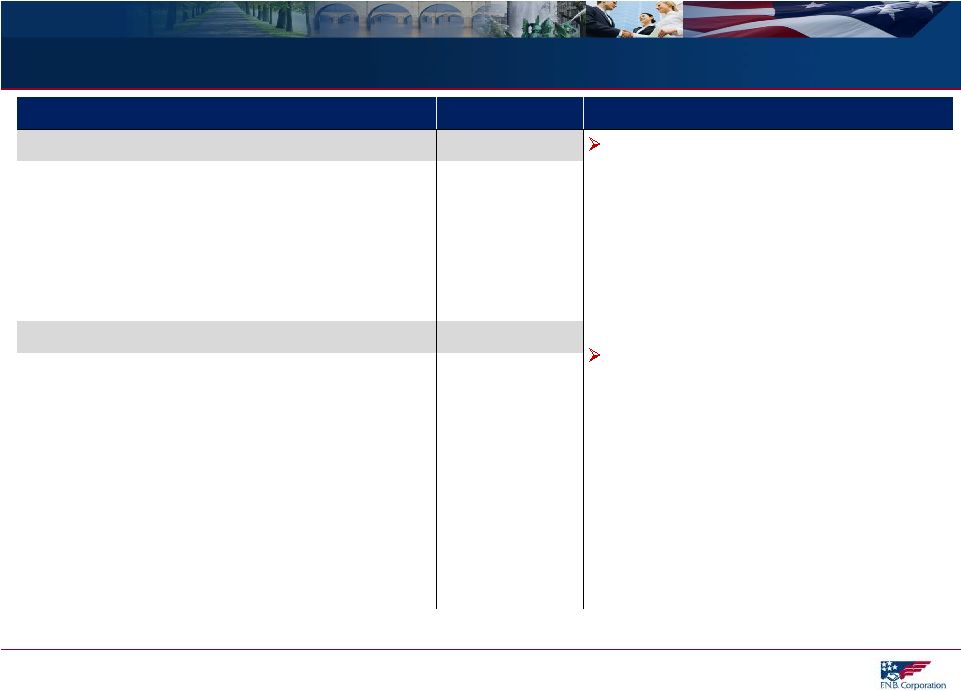
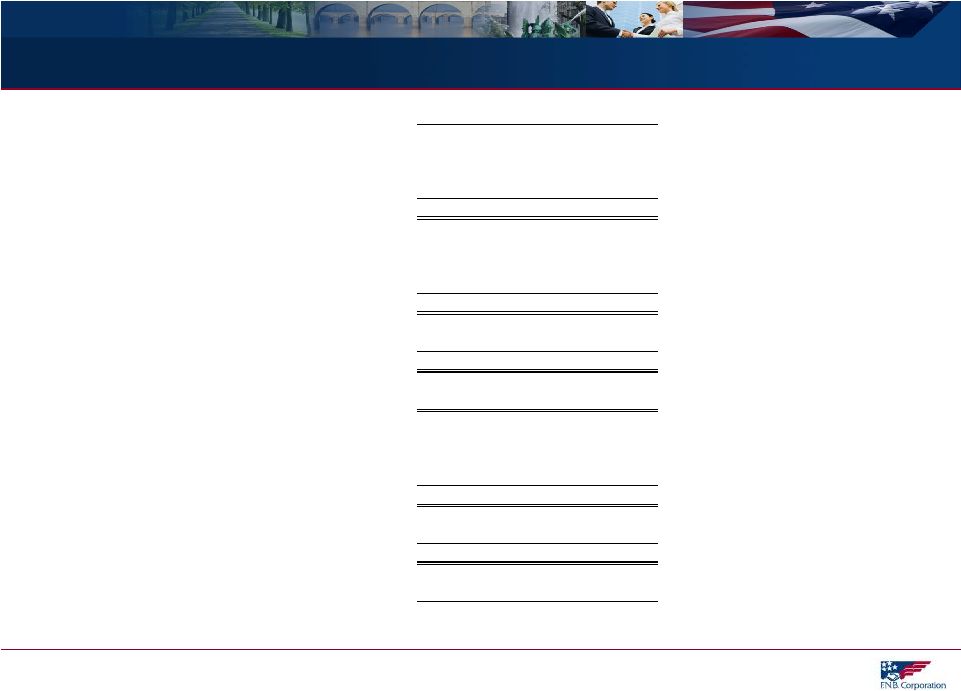
GAAP to Non-GAAP Reconciliation 47 June 30, 2012 March 31, 2012 June 30, 2011 2012 2011 Operating net income Net income $29,130 $21,582 $22,362 $50,712 $39,537 Merger and severance costs, net of tax 206 4,943 105 5,149 2,800 Operating net income $29,336 $26,524 $22,467 $55,861 $42,337 Operating diluted earnings per share Diluted earnings per share $0.21 $0.15 $0.18 $0.36 $0.32 Effect of merger and severance costs, net of tax 0.00 0.04 0.00 0.04 0.02 Operating diluted earnings per share $0.21 $0.19 $0.18 $0.40 $0.34 Operating return on average tangible equity Operating net income (annualized) $117,991 $106,681 $90,115 $112,336 $85,375 Amortization of intangibles, net of tax (annualized) 6,192 5,964 4,707 6,078 4,720 $124,182 $112,645 $94,822 $118,414 $90,096 Average shareholders' equity $1,367,333 $1,352,569 $1,166,305 $1,359,951 $1,148,065 Less: Average intangible assets 718,507 719,195 603,552 718,851 599,516 Average tangible equity $648,826 $633,375 $562,753 $641,100 $548,549 Operating return on average tangible equity 19.14% 17.78% 16.85% 18.47% 16.42% Operating return on average tangible assets Operating net income (annualized) $117,991 $106,681 $90,115 $112,336 $85,375 Amortization of intangibles, net of tax (annualized) 6,192 5,964 4,707 6,078 4,720 $124,182 $112,645 $94,822 $118,414 $90,096 Average total assets $11,734,221 $11,563,665 $9,866,025 $11,648,943 $9,780,993 Less: Average intangible assets 718,507 719,195 603,552 718,851 599,516 Average tangible assets 11,015,714 $ 10,844,470 $ 9,262,473 $ 10,930,092 $ 9,181,476 $ Operating return on average tangible assets 1.13% 1.04% 1.02% 1.08% 0.98% June 30 Year-to-Date For the Quarter Ended |


