 F.N.B. Corporation Investor Presentation SunTrust Robinson Humphrey 2013 Financial Services Unconference Dated: May 21, 2013 Vincent J. Calabrese, Jr. Chief Financial Officer Gary L. Guerrieri Chief Credit Officer Exhibit 99.1 |
 Cautionary Statement Regarding Forward-Looking Information and Non-GAAP Financial Information 2 This presentation and the reports F.N.B. Corporation files with the Securities and Exchange Commission often contain “forward-looking statements” relating to present or future trends or factors affecting the banking industry and, specifically, the financial operations, markets and products of F.N.B. Corporation. These forward-looking statements involve certain risks and uncertainties. There are a number of important factors that could cause F.N.B. Corporation’s future results to differ materially from historical performance or projected performance. These factors include, but are not limited to: (1) a significant increase in competitive pressures among financial institutions; (2) changes in the interest rate environment that may reduce interest margins; (3) changes in prepayment speeds, loan sale volumes, charge-offs and loan loss provisions; (4) general economic conditions; (5) various monetary and fiscal policies and regulations of the U.S. government that may adversely affect the businesses in which F.N.B. Corporation is engaged; (6) technological issues which may adversely affect F.N.B. Corporation’s financial operations or customers; (7) changes in the securities markets; (8) risk factors mentioned in the reports and registration statements F.N.B. Corporation files with the Securities and Exchange Commission; (9) housing prices; (10) job market; (11) consumer confidence and spending habits; (12) estimates of fair value of certain F.N.B. Corporation assets and liabilities; (13) transaction risks associated with the pending merger of PVF Capital Corp., and integration challenges related to the recently completed merger with Annapolis Bancorp, Inc. and the difficulties encountered in expanding into a new market; or (14) the effects of current, pending and future legislation, regulation and regulatory actions. F.N.B. Corporation undertakes no obligation to revise these forward-looking statements or to reflect events or circumstances after the date of this presentation. To supplement its consolidated financial statements presented in accordance with Generally Accepted Accounting Principles (GAAP), the Corporation provides additional measures of operating results, net income and earnings per share (EPS) adjusted to exclude certain costs, expenses, and gains and losses. The Corporation believes that these non-GAAP financial measures are appropriate to enhance the understanding of its past performance as well as prospects for its future performance. In the event of such a disclosure or release, the Securities and Exchange Commission’s Regulation G requires: (i) the presentation of the most directly comparable financial measure calculated and presented in accordance with GAAP and (ii) a reconciliation of the differences between the non-GAAP financial measure presented and the most directly comparable financial measure calculated and presented in accordance with GAAP. The required presentations and reconciliations are contained herein and can be found at our website, www.fnbcorporation.com, under “Shareholder and Investor Relations” by clicking on “Non-GAAP Reconciliation.” The Appendix to this presentation contains non-GAAP financial measures used by the Corporation to provide information useful to investors in understanding the Corporation's operating performance and trends, and facilitate comparisons with the performance of the Corporation's peers. While the Corporation believes that these non-GAAP financial measures are useful in evaluating the Corporation, the information should be considered supplemental in nature and not as a substitute for or superior to the relevant financial information prepared in accordance with GAAP. The non-GAAP financial measures used by the Corporation may differ from the non-GAAP financial measures other financial institutions use to measure their results of operations. This information should be reviewed in conjunction with the Corporation’s financial results disclosed on April 23, 2013 and in its periodic filings with the Securities and Exchange Commission. |
 Additional Information About the Merger 3 ADDITIONAL INFORMATION ABOUT THE MERGER F.N.B. Corporation and PVF Capital Corp. will file a proxy statement/prospectus and other relevant documents with the SEC in connection with the merger. SHAREHOLDERS OF PVF CAPITAL CORP. ARE ADVISED TO READ THE PROXY STATEMENT/PROSPECTUS WHEN IT BECOMES AVAILABLE AND ANY OTHER RELEVANT DOCUMENTS FILED WITH THE SEC, AS WELL AS ANY AMENDMENTS OR SUPPLEMENTS TO THOSE DOCUMENTS, BECAUSE THEY WILL CONTAIN IMPORTANT INFORMATION. The proxy statement/prospectus and other relevant materials (when they become available), and any other documents F.N.B. Corporation and PVF Capital Corp. have filed with the SEC, may be obtained free of charge at the SEC's website at www.sec.gov. In addition, investors and security holders may obtain free copies of the documents F.N.B. Corporation has filed with the SEC by contacting James Orie, Chief Legal Officer, F.N.B. Corporation, One F.N.B. Boulevard, Hermitage, PA 16148, telephone: (724) 983-3317; and free copies of the documents PVF Capital Corp. has filed with the SEC by contacting Jeffrey N. Male, Secretary, PVF Capital Corp., 30000 Aurora Road, Solon, OH 44139, telephone: (440) 248-7171. F.N.B. Corporation and PVF Capital Corp. and certain of their directors and executive officers may be deemed to be participants in the solicitation of proxies from shareholders of PVF Capital Corp. in connection with the proposed merger. Information concerning such participants' ownership of PVF Capital Corp. common shares will be set forth in the proxy statement/prospectus relating to the merger when it becomes available. This communication does not constitute an offer of any securities for sale. |
 4 F.N.B. Corporation |
 Key Investment Considerations 5 1. Experienced leadership 2. Sustainable business model 3. Attractive market position 4. Consistent, strong operating results and favorable trends 5. Proven, disciplined acquisition strategy 6. Investment thesis geared toward shareholder value creation Positioned to Achieve Long-Term Growth |
 F.N.B. Corporation 6 (1) Pro-forma for ANNB acquisition completed April 6, 2013, with assets of approximately $0.4 million, loans of $0.3 million, deposits of $0.4 million and 8 banking locations and pending acquisition of PVFC, expected to close October 2013 with assets of approximately $0.8 billion, loans of $0.6 billion, deposits of $0.6 billion and 16 banking locations; (2) SNL Financial, Pro-forma, excludes custodian bank; (3) As of May 16, 2013 Well-Positioned for Sustained Growth Strong Operating Results Consistent Operating Strategy • Assets:$13.2 billion (1) • Loans:$9.1 billion (1) • Deposits:$11.0 billion (1) • Banking locations:270 (1) • Consumer finance locations:71 Fourth Largest Pennsylvania-Based Bank • Top quartile profitability performance • Deliver consistent, solid results • Industry-leading loan growth • Strong performance:3-year total shareholder return of 46% (3) • Maintain low-risk profile: Enterprise-wide risk management • Position for sustained growth and profitability • Reposition and reinvest for growth • Disciplined expense control • Expanding market share potential and growth opportunities • Attractive footprint: Banking locations span 53 counties/four states (1) • Leading market position (2) • #3 market share in the Pittsburgh MSA • #3 overall market share in Pennsylvania based on counties of operation • #5 overall market position for all counties of operation |
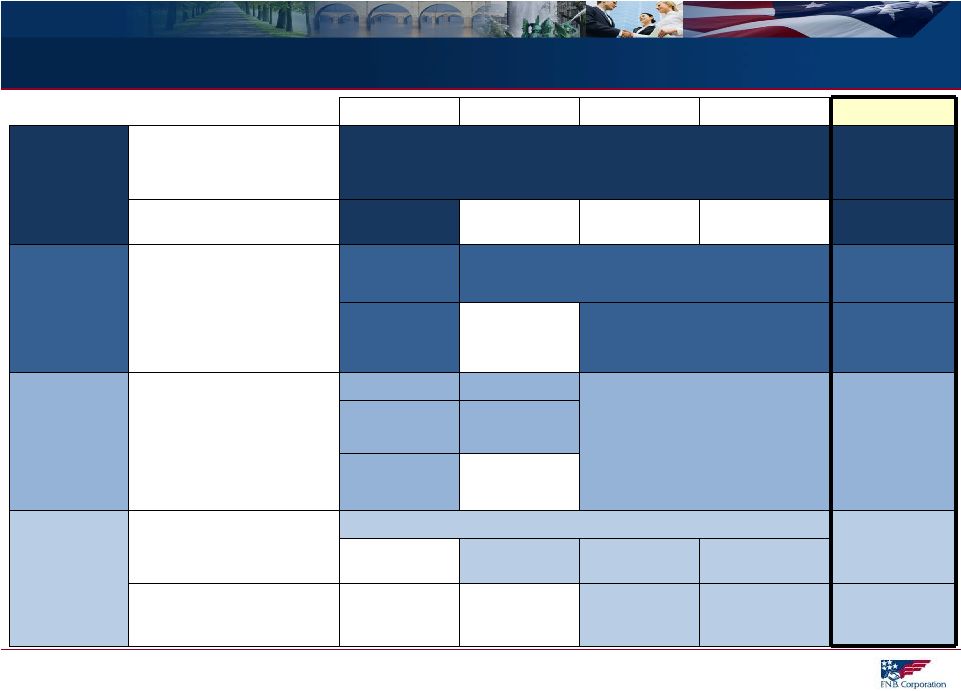
 President and CEO Vincent J. Delie, Jr. 26 2005 National City President, First National Bank John C. Williams, Jr. 42 2008 Huntington National City Mellon Bank Chief Financial Officer Vincent J. Calabrese, Jr. 25 2007 People’s United Chief Credit Officer Gary L. Guerrieri 27 2002 FNB Promistar Experienced Leadership 7 Experienced and respected executive management team Prior Experience Joined FNB Years of Banking Experience |
 Sustainable Business Model 8 Sustainable Business Model Maintain low risk profile Target neutral interest rate risk position Fund loan growth with deposits Adhere to consistent underwriting and pricing standards Maintain rigid expense control Efficient capital management Organic growth: Regional model Best-in-class, enterprise-wide sales management Deep product set Investments in people, product development, high-growth potential market segments Acquisition-related growth: Disciplined, strategic, accretive Attract, retain and develop top talent Strong cross-sell environment Holistic incentive compensation structure supports cross-functional focus Monitor external and internal service excellence, quality and satisfaction Recognize accomplishments and innovation Disciplined, growth oriented focus guided by commitment to shareholder value Long-term investment thesis centered on: Targeted EPS growth Strong dividend Risk Management Growth Culture Shareholder Value |
 9 Reposition and Reinvest Strategy |
 Reposition and Reinvest Strategy 10 Talent Management Geographic Segmentation Sales Management/Cross-Sell Product Development Branch Optimization Electronic Delivery Investment Expansion Through Acquisition Consistent, strong operating results Revenue growth Consistent organic loan growth Quality growth led by C&I portfolio Attractive market position Expanded market share potential via entry and expansion in attractive markets Strong 3-year total shareholder return Strategic Actions Drive Long-Term Growth and Performance Actions Results |
 Reposition and Reinvest – Actions Drive Long-Term Performance 11 2009 2010 2011 2012 1Q13 PEOPLE Talent Management Strengthened team through key hires; Continuous team development Attract, retain, develop best talent Continued Success Geographic Segmentation Regional model Regional Realignment 5 th Region Created PROCESS Sales Management/Cross Sell Proprietary sales management system developed and implemented: Balanced scorecards, cross-functional alignment Consumer Banking Scorecards Consumer Banking Refinement/Daily Monitoring Continued Utilization Commercial Banking Sales Management Expansion to additional lines of business Continued Expansion PRODUCT Product Development Deepened product set and niche areas allow FNB to successfully compete with larger banks and gain share Private Banking Capital Markets Online and mobile banking investment /implementation – Online banking enhancements, mobile banking and app Online/mobile banking infrastructure complete with mobile remote deposit capture and online budgeting tools Asset Based Lending Small Business Realignment Treasury Management PRODUCTIVITY Branch Optimization Continuous evolution of branch network to optimize profitability and growth prospects De-Novo Expansion 9 Locations Ongoing Evaluation Consolidate 2 Locations Consolidate 6 Locations Consolidate 37 Locations Acquisitions Opportunistically expand presence in attractive markets CB&T Parkvale ANNB Closed PVFC Announced |
 Strong Performance Relative to Peers 12 The above represents full-year 2010, 2011, 2012 and/or quarterly results where noted. Refer to Supplemental Information for peer group listing. (1) Operating results, refer to Supplemental Information for details |
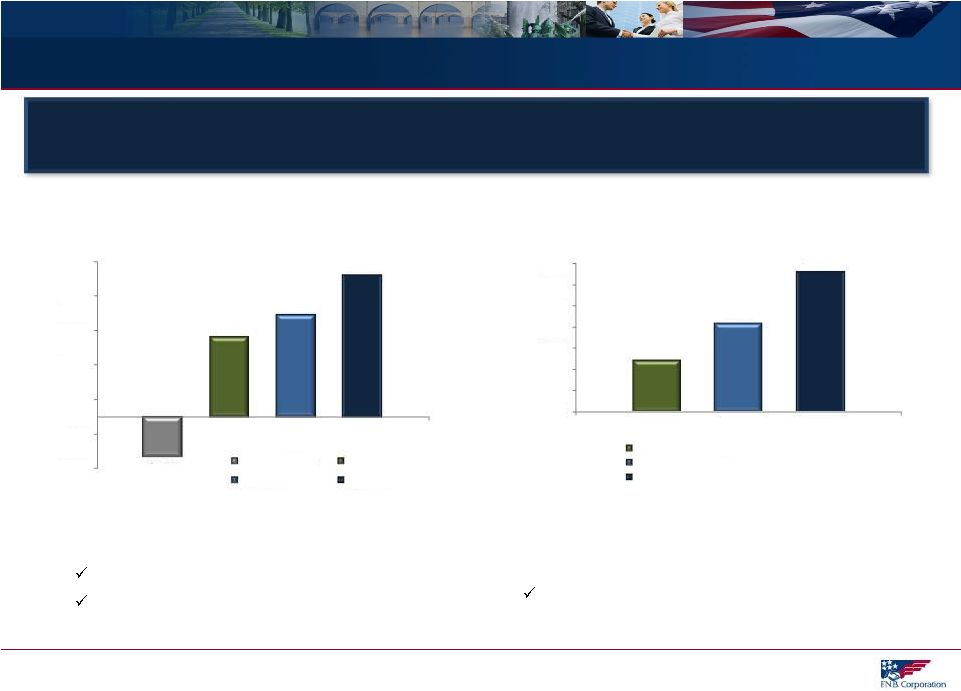 Relationship-Based Focus Drives Growth – 1Q13 Results 13 (1) Average year-over-year growth, 1Q13, $ in millions Year-over-Year Total Loan Growth Positive results in commercial and consumer Commercial growth driven by C&I portfolio growth of $249.1 million or 17.7% Year-over-Year Transaction Deposits and Customer Repo Growth Growth driven by DDA’s and Customer Repo growth of $416.5 million or 17.5% -$114.9 $231.2 $294.6 $410.9 -$150.0 -$50.0 $50.0 $150.0 $250.0 $350.0 $450.0 Residential/Other Consumer Commercial Total Loans $241.8 $416.5 $658.3 $0.0 $100.0 $200.0 $300.0 $400.0 $500.0 $600.0 $700.0 Other Transaction Deposits DDA's & Repos Total Transaction Deposits and Customer Repos Total Loans Transaction Deposits and Customer Repurchase Agreements Year-over-Year Loan and Transaction Deposit Growth Strong sales culture drives loan growth Relationship-based focus drives related growth in lower-cost transaction deposits and repos (1) |
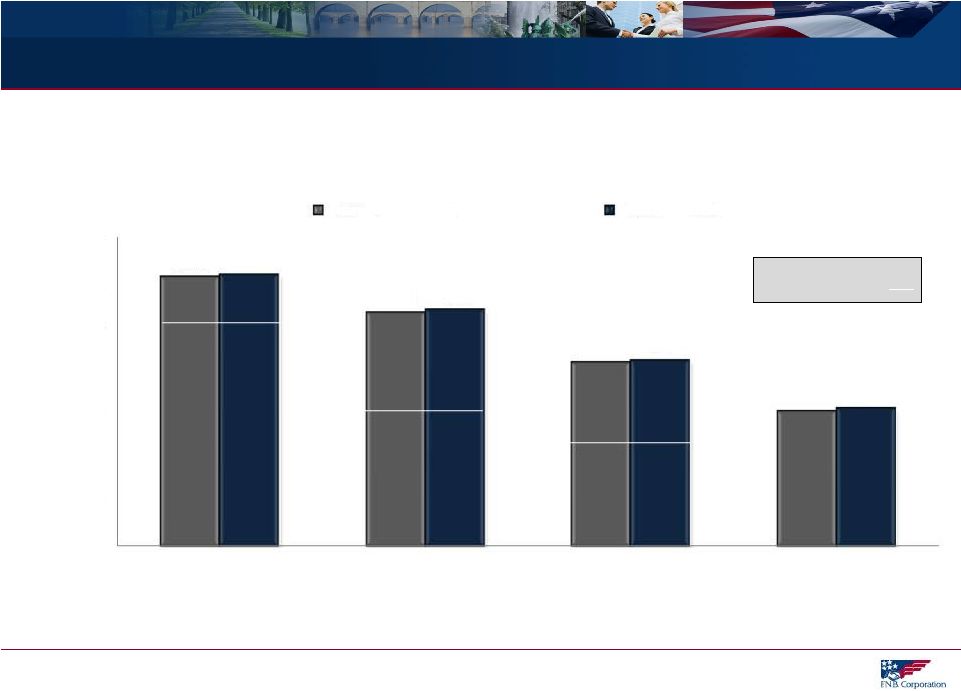
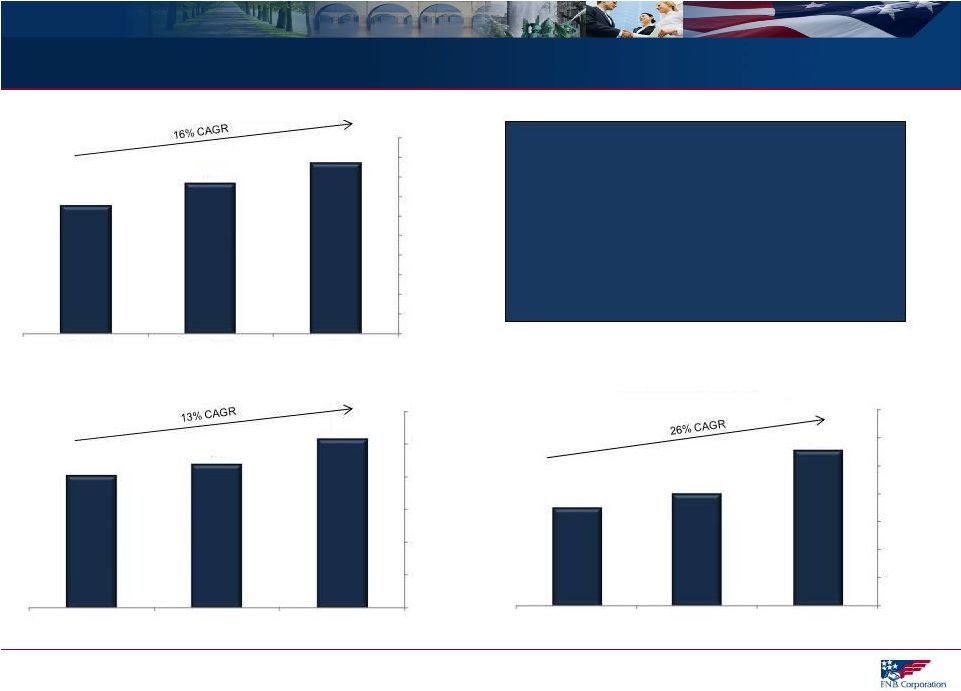 Relationship-Based Focus Drives Growth – Full-Year Trends 14 $4.4 $3.8 $3.3 12/31/2012 12/31/2011 12/31/2010 $2.6 $2.2 $2.0 12/31/2012 12/31/2011 12/31/2010 $2.8 $2.0 $1.7 12/31/2012 12/31/2011 12/31/2010 $0.0 $0.5 $1.0 $1.5 $2.0 $2.5 $3.0 $3.5 $4.0 $4.5 $5.0 $0.0 $0.5 $1.0 $1.5 $2.0 $2.5 $3.0 $0.0 $0.5 $1.0 $1.5 $2.0 $2.5 $3.0 $3.5 “What Gets Measured Gets Done” A cross-functional, disciplined sales management process drives loan growth and growth in lower- cost transaction deposits, supporting the net interest margin, delivering greater profitability and deepening the client relationship. Commercial Loan Portfolio DDA's and Customer Repos Consumer Loan Portfolio (1) (2) Balances shown are period-end balances, $ in billions. (1) Core commercial loan portfolio, excluding the Florida portfolio; (2) Consumer loans excludes the residential portfolio. |
 15 Market Position |
 Top Market Overall Position 16 Source: SNL Financial, deposit data as of June 30, 2012, pro-forma as of May 1, 2013, excludes custodial bank FNB Pennsylvania Counties of Operation Rank Institution Branch Count Total Market Deposits ($ 000) Total Market Share (%) 1 PNC Financial Services 307 51,112,184 34.1 2 Royal Bank of Scotland 209 9,814,813 6.5 4 M&T Bank Corp. 130 6,703,099 4.5 5 Wells Fargo & Co. 65 4,776,100 3.2 6 First Commonwealth 101 3,957,651 2.6 7 Banco Santander 75 3,854,650 2.6 8 Dollar Bank 37 3,453,494 2.3 9 First Niagara Financial 73 3,147,291 2.1 10 Susquehanna Bancshares 80 3,123,468 2.1 Total (1-138) 2,456 149,889,192 100.0 FNB All Counties of Operation Rank Institution Branch Count Total Market Deposits ($ 000) Total Market Share (%) 1 PNC Financial Services 461 60,155,071 25.9 2 Royal Bank of Scotland 298 14,949,617 6.4 3 KeyCorp 100 11,129,246 4.8 4 Huntington Bancshares 223 10,492,839 4.5 6 M&T Bank Corp. 151 8,603,725 3.7 7 FirstMerit Corp. 104 6,513,189 2.8 8 TFS Financial Corp 22 6,162,459 2.6 9 Wells Fargo & Co. 76 5,575,216 2.4 10 Dollar Bank 66 5,172,305 2.2 Total (1-213) 3,821 232,660,382 100.0 5.7 8,548,326 228 F.N.B. Corporation 3 4.4 10,135,228 270 F.N.B. Corporation 5 FNB holds the #3 overall retail market position for Pennsylvania counties of operation and #5 position for all counties |
 #3 Position in the Pittsburgh MSA 17 Source: MSA population per U.S. Census Bureau 2010 data; Deposit market share per SNL Financial as of June 30, 2012, pro-forma as of May 1, 2013 (1) Excludes custodial bank FNB is uniquely positioned as one of only very few community banks to hold a Top 3 deposit market rank in one of the nation’s 25 largest metropolitan statistical areas. Population Rank MSA (000's) #1 #2 #3 1 New York (1) 18,897 JPM BofA Citi 2 Los Angeles 12,829 BofA Wells Fargo Mitsubishi UFJ 3 Chicago 9,461 JPM BMO BofA 4 Dallas 6,372 BofA JPM Wells Fargo 5 Philadelphia 5,965 BofA Capital One TD 6 Houston 5,947 JPM Wells Fargo BofA 7 Washington 5,582 Capital One Wells Fargo BofA 8 Miami 5,565 Wells Fargo BofA Citi 9 Atlanta 5,269 SunTrust Wells Fargo BofA 10 Boston 4,552 BofA RBS Banco Santander 11 San Francisco 5,335 BofA Wells Fargo Citi 12 Detroit 4,296 JPM Comerica BofA 13 Riverside 4,225 BofA Wells Fargo JPM 14 Phoenix 4,193 Wells Fargo JPM BofA 15 Seattle 3,440 BofA Wells Fargo U.S. Bancorp 16 Minneapolis (1) 3,280 Wells Fargo U.S. Bancorp TCF 17 San Diego 3,095 Wells Fargo Mitsubishi UFJ BofA 18 St. Louis 2,813 U.S. Bancorp BofA Commerce 19 Tampa 2,783 BofA Wells Fargo SunTrust 20 Baltimore 2,710 BofA M&T PNC 21 Denver 2,543 Wells Fargo FirstBank U.S. Bancorp 22 Pittsburgh (1) 2,356 PNC RBS 23 Portland 2,226 BofA U.S. Bancorp Wells Fargo 24 Sacramento 2,149 Wells Fargo BofA U.S. Bancorp 25 San Antonio 2,143 Cullen/Frost BofA Wells Fargo Top 3 Banks in MSA by Deposit Market Share F.N.B. Corporation |
 Regional Footprint: Pro-Forma View 18 Source: SNL Financial, Pro-Forma Top 30 MSA Presence MSA Population Baltimore 2.7 million (#20 MSA) Pittsburgh 2.4 million (#22 MSA) Cleveland 2.1 million (#28 MSA) Cleveland MSA Pittsburgh MSA Baltimore MSA ANNB Acquisition Completed April 6, 2013 PVFC Acquisition Target Completion October 2013 FNB’s model utilizes six regions, including three in top 30 MSA markets, with each having a regional headquarters housing cross-functional teams. |
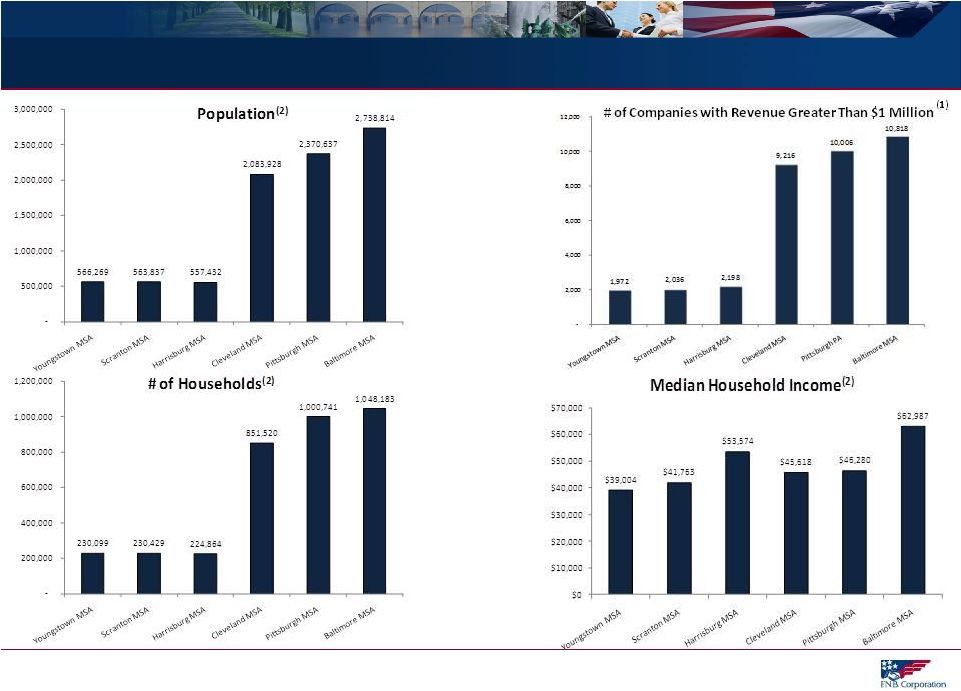
 ANNB and PVFC Acquisitions = Enhanced Growth Opportunities 19 Note: Above metrics at the MSA level (1) Data per U.S. Census Bureau (2) Data per Hoover’s as of May 1, 2013 Significant Commercial Prospects = Opportunity to Leverage Core Competency and Drive Sustained Organic Growth Over 175,000 Total Businesses (1) 1,972 2,036 2,198 9,216 10,006 10,818 12,851 13,345 13,410 52,149 59,240 65,169 Youngstown MSA Scranton MSA Harrisburg MSA Cleveland MSA Pittsburgh MSA Baltimore MSA # of Companies with Revenue Greater Than $1 Million Total Businesses (2) (1) |
 Market Opportunity 20 Note: Above metrics at the MSA level (1) Data per Hoover’s as of May 1, 2013 (2) Data per SNL Financial as of May 1, 2013 |
 21 Acquisition Strategy |
 Acquisition Strategy 22 Disciplined and Consistent Acquisition Strategy Strategy Disciplined identification and focus on markets that offer potential to leverage core competencies and growth opportunities Criteria Create shareholder value Meet strategic vision Fit culturally Evaluation Targeted financial and capital recoupment hurdles Proficient and experienced due diligence team Execution Superior post-acquisition execution Execute FNB’s proven, scalable, business model Proven success assimilating FNB’s strong sales culture Execution Strategy Criteria Evaluation |
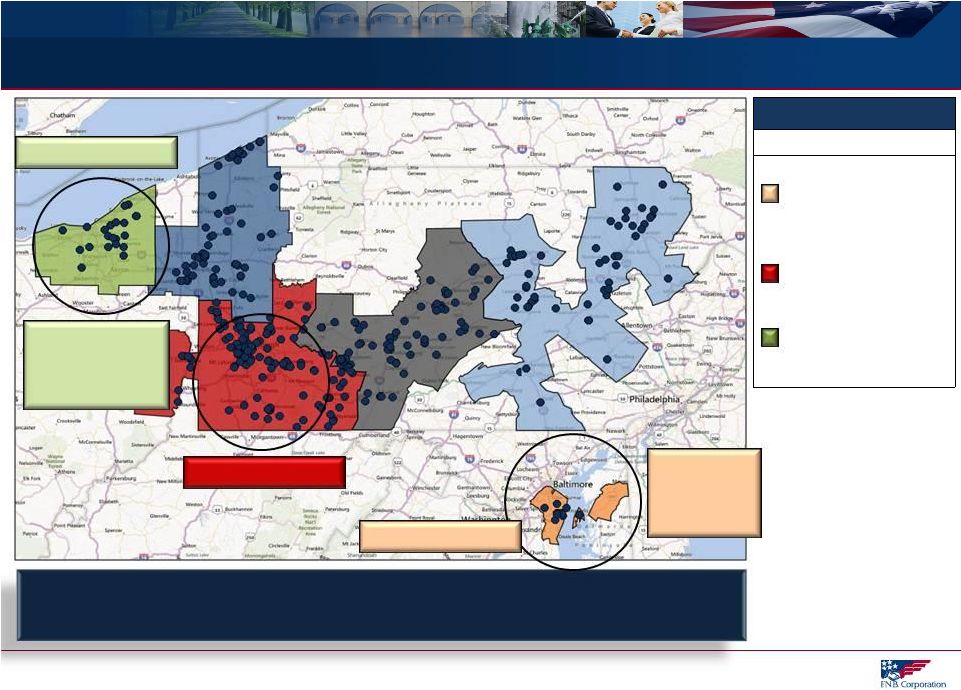
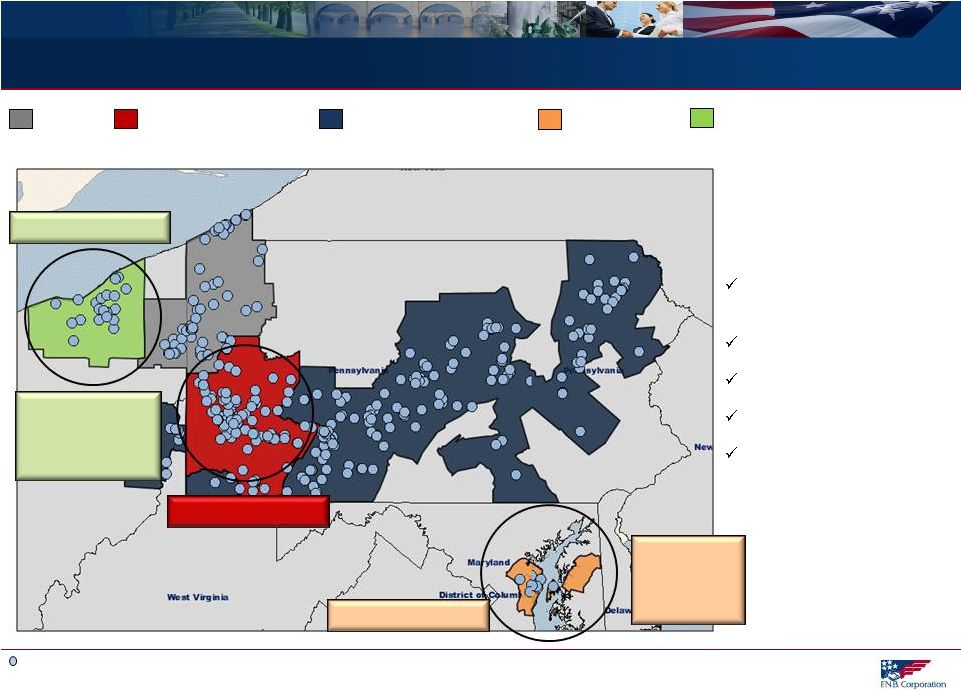 Acquisition-Related Expansion 23 FNB Banking Location (pro-forma) 11 bank acquisition since 2002 announced February 19, 2013 (PVFC) Third consecutive acquisition in a major MSA ANNB closed 4/6/2013 PVFC currently pending Four since 2010 Nine since 2005 Pre-2002 Presence Additional Acquisition-Related Expansion Pittsburgh MSA Acquisition Expansion ANNB Acquisition Pending PVFC Acquisition Pittsburgh Hermitage State College Harrisburg Cleveland Scranton Philadelphia Erie Baltimore Baltimore MSA Pittsburgh MSA Cleveland MSA ANNB Acquisition Completed April 6, 2013 PVFC Acquisition Target Completion October 2013 th |
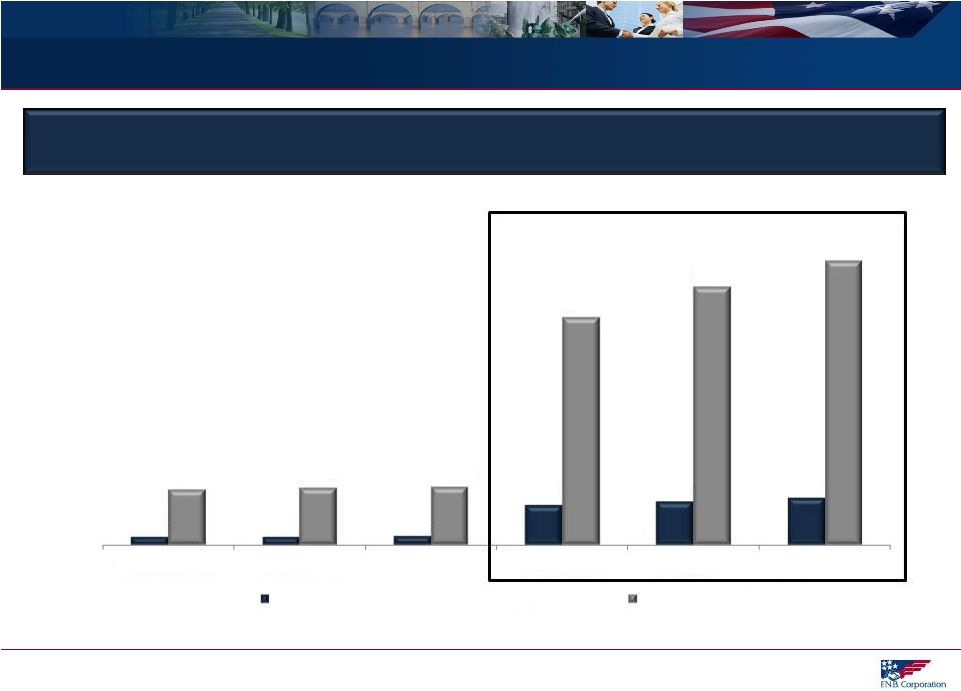
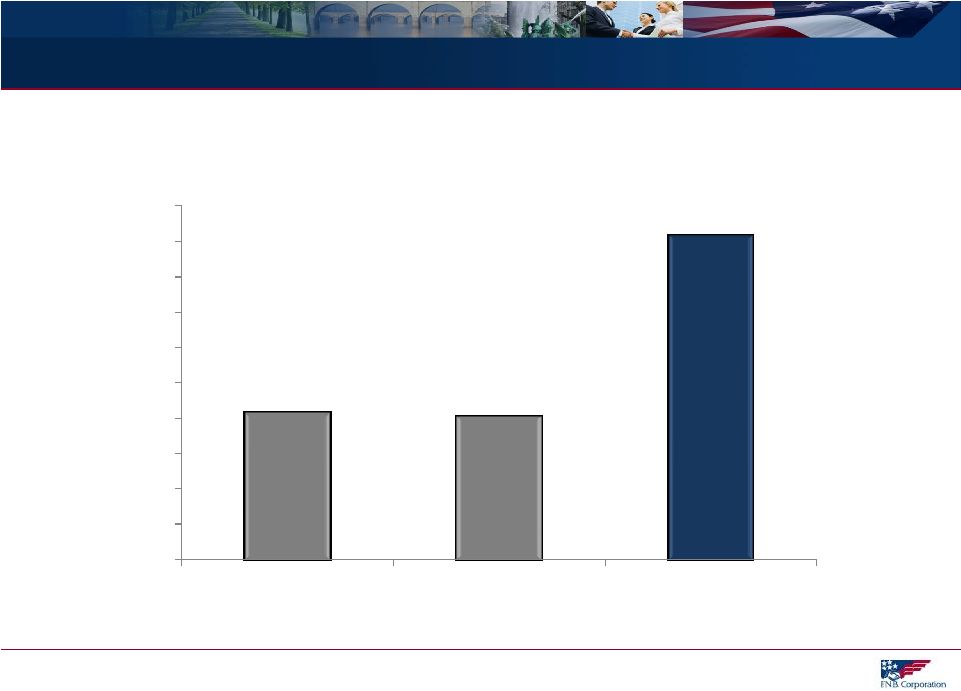
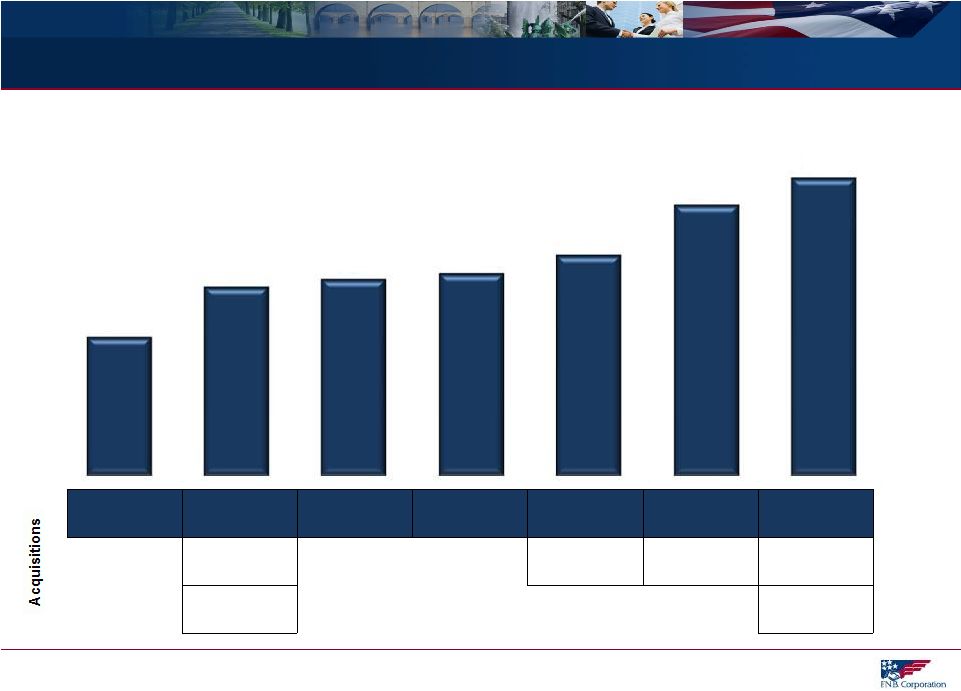 Acquisition History Since 2007 24 2007 2008 2009 2010 2011 2012 1Q13 Pro-Forma Omega $1.8 bn CBT $0.6 bn PVSA $1.8 bn ANNB $0.4 bn IGB $0.3 bn PVFC $0.8 bn FNB Total Assets $ in Billions Note : Total assets presented on period-end basis $13.2 $12.0 $9.8 $9.0 $8.7 $8.4 $6.1 |
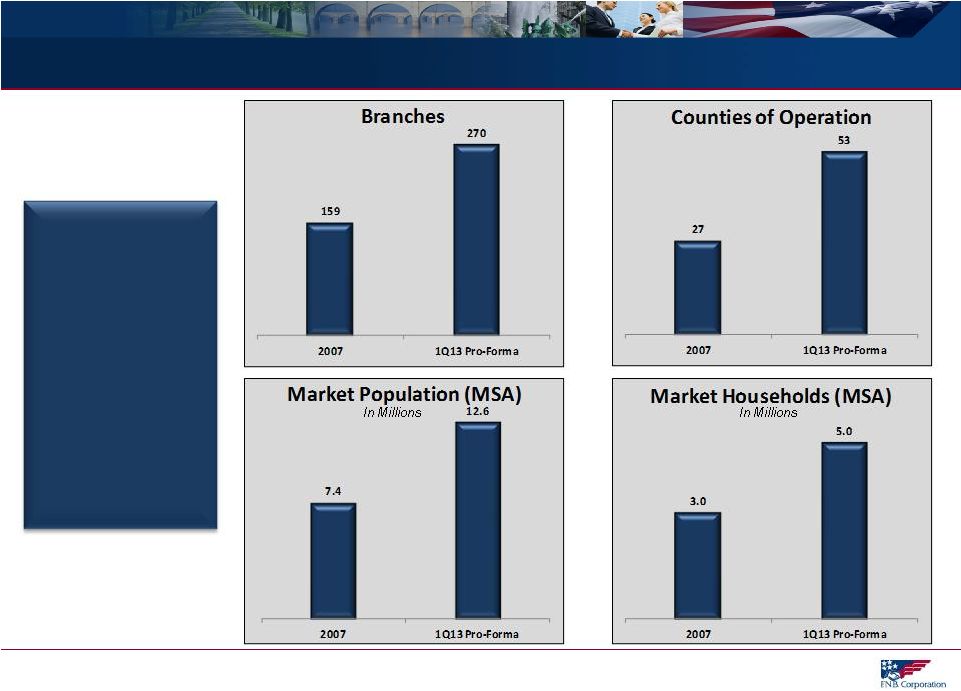 Enhanced Organic Growth Opportunities 25 Note: Market population and market households represent current metrics based on respective FNB MSA presence Data per FNB and/or SNL Financial Acquisition- Related Expansion in Higher Growth Markets Enhances Organic Growth Opportunities |
 26 Strong Operating Results |
 1Q13 Highlights – Great Start to 2013 27 Consistent Results Year-over-year EPS growth of 5% (1) Year-over-year revenue growth Consistent loan growth driven by C&I lending Stable net interest margin Good asset quality results Positive trends seen in fee-based businesses Electronic Delivery Strategy Completed infrastructure build-out of e-delivery strategy, now offer complete suite of electronic banking options Competitive Advantage: Aggressive pursuit of households, enhanced retention, lower delivery costs, enhanced cross-sell opportunities Expanded Footprint Seamless integration of Annapolis Bancorp Announced PVF Capital acquisition Significant opportunity to leverage strong commercial platform Deploy proven cross-functional sales management model Success attracting talent in new markets Solid Operating Results Continued Execution of Reposition and Reinvest Strategy (1)Operating basis, refer to Appendix for details |
 1Q13 Operating Highlights 28 Current Quarter 1Q13 Prior Quarter 4Q12 Prior Year Quarter 1Q12 Earnings (1) Net income – operating $28,767 $32,116 $26,524 Earnings per diluted share - operating $0.20 $0.23 $0.19 Profitability Performance ROTE (1) 17.46% 19.51% 17.78% ROTA (1) 1.08% 1.18% 1.04% Net interest margin 3.66% 3.66% 3.74% Efficiency ratio 59.8% 55.5% 60.4% Strong Organic Growth Balance Sheet Trends (2) Total loan growth 7.1% 6.0% 1.4% Commercial loan growth 10.8% 7.6% 3.6% Consumer loan growth 6.1% 11.7% 2.6% Transaction deposits and customer repo growth (3) 2.6% 11.9% 8.9% (1) Adjusted results, refer to Appendix for GAAP to Non-GAAP Reconciliation details; (2)Average, annualized linked quarter organic growth results (organic reflects adjustments for balances acquired via the Parkvale 1Q12); (3) Excludes time deposits |
 Balance Sheet Highlights 29 Average Balances, $ in millions 1Q13 Linked-Quarter Growth (1) (1Q13-4Q12) Year-over-Year Growth (1Q13-1Q12) 1Q13 Highlights Balance $ % $ % Securities $2,254 -$1.3 -0.2% $159.6 7.6% Strong linked quarter and year- over-year loan growth Sustained loan growth momentum Commercial loan growth driven by C&I growth Solid consumer loan growth results Attractive deposit mix Lower cost, relationship- focused transaction deposits and customer repurchase agreements = 75% of total deposits and customer repurchase agreements (4) Total loans $8,189 $140.8 7.1% $410.9 5.3% Commercial loans $4,469 $115.9 10.8% $294.6 7.1% C&I loans $1,657 $89.2 23.1% $249.1 17.7% Consumer loans (2) $2,571 $37.9 6.1% $231.2 9.9% Residential mortgage loans $1,111 -$12.0 -4.3% -$111.9 -9.2% Earning assets $10,473 $52.7 2.1% $502.3 5.0% Total deposits and customer repos $9,938 -$36.4 -1.5% $338.1 3.5% Transaction deposits and customer repos (3) $7,444 $48.2 2.6% $658.3 9.7% Time Deposits $2,494 -$84.5 -13.3% -$320.2 -11.4% (1)% growth annualized; (2)Includes Direct Installment, Indirect Installment and Consumer LOC portfolios; (3)Excludes time deposits; (4)Period-end as of March 31, 2013. |
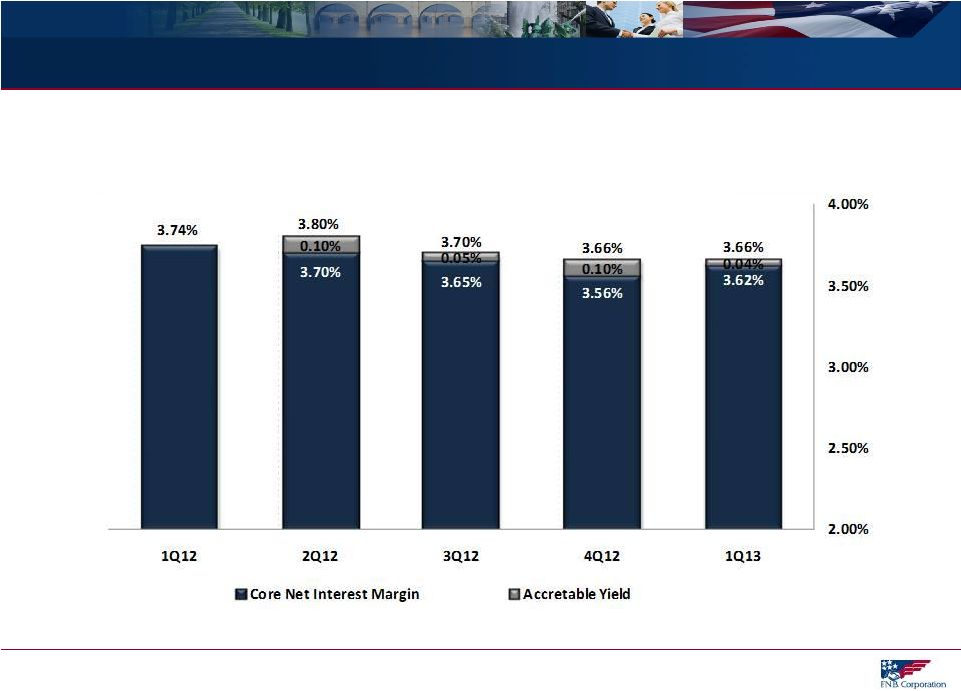 Net Interest Margin Trends 30 Net Interest Margin Trends |
 Asset Quality Results (1) 31 $ in thousands 1Q13 4Q12 1Q12 1Q13 Highlights NPL’s+OREO/Total loans+OREO 1.59% 1.60% 2.22% Consistent, solid performance with continued favorable trends Total delinquency improved from 4Q12 and 1Q13 1Q13 Provision for loan losses $6.4 million for the originated portfolios $1.2 million for the acquired portfolios Reserve position directionally consistent with performance Allowance for loan losses to total non- performing loans continues to increase Total delinquency 1.45% 1.64% 2.03% Provision for loan losses (2) $7,541 $9,274 $6,572 Net charge-offs (NCO’s) (2) $4,213 $7,614 $5,141 NCO’s/Total average loans (2) 0.21% 0.38% 0.27% NCO’s/Total average originated loans 0.22% 0.45% 0.32% Allowance for loan losses/ Total loans 1.39% 1.38% 1.55% Allowance for loan losses/ Total non-performing loans 124.80% 123.88% 92.95% (1) Metrics shown are originated portfolio metrics unless noted as a total portfolio metric. “Originated portfolio” or “Originated loans” excludes loans acquired at fair value and accounted for in accordance with ASC 805 (effective January 1, 2009), as the risk of credit loss has been considered by virtue of the Corporation’s estimate of fair value. (1) Total portfolio metric |
 Capital Position 32 Regulatory “Well-Capitalized” 12.2% 10.6% 8.3% 6.1% 12.3% 10.7% 8.4% 6.2% 0.0% 2.0% 4.0% 6.0% 8.0% 10.0% 12.0% 14.0% Total Risk-Based Tier One Leverage Tangible Common Equity December 31, 2012 March 31, 2013 |
 33 Investment Thesis |
 Long-Term Investment Thesis 34 Long-Term Investment Thesis: Targeted EPS Growth 5-6% Expected Dividend Yield (Targeted Payout Ratio 60-70%) 4-6% FNB’s long-term investment thesis reflects a commitment to efficient capital management and creating value for our shareholders Total Shareholder Return 9-12% |
 High-Performing Financial Institution 35 Notes: Data per SNL Financial and FNB. Year-to-date performance represents 1Q13. Relative valuation metrics and total return as of May 16, 2013. FNB ROTCE represents operating ROTCE – refer to Supplemental Information. Assets ($ billions) ROTCE (%) Efficiency Ratio (%) Net Charge- Offs (%) Net Interest Margin (%) Price/TBV (x) Price/ 2014E EPS (x) Dividend Yield (%) Total Return 3 Yr (%) Peer Median Results Regional Peer Group $16.1 11.24 62.5 0.37 3.32 1.58x 13.85x 2.35 15.78 Top 100 Banks/Thrifts Based on Asset Size $13.1 11.60 62.2 0.27 3.45 1.58x 13.32x 2.37 19.94 Top 100 Trading at > 2.0x Tangible Book $12.8 14.16 55.5 0.22 3.71 2.24x 13.54x 2.67 35.08 F.N.B. Corporation $12.0 17.46 59.8 0.21 3.66 2.34x 13.01x 4.10 45.96 1Q13 Performance Relative Valuation/Total Return |
 Consistent Operating Results 36 0.00% 0.05% 0.10% 0.15% 0.20% 0.25% Regional Peer Median FNB ROAA Volatility FNB = 80% Percentile 0.000% 0.005% 0.010% 0.015% 0.020% 0.025% 0.030% 0.035% 0.040% 0.045% 0.050% Regional Peer Median FNB Revenue/Avg Assets Volatility FNB = 96% Percentile Data per FNB and/or SNL Financial Refer to Supplemental Information for peer listing FNB’s ability to deliver consistent operating results exceeds peer results FNB and Peer Volatility (Standard Deviation 1Q10 – 1Q13) |
 Attractive Relative Valuation 37 nsensus estimates for FNB and peers as of 3/31/2013; (2) As of May 16, 2013 FNB has a modest P/E valuation relative to peers given its higher-quality earnings stream, stronger dividend yield and future growth potential FNB Regional Peer Group Median Top 100 Banks/Thrifts Median (1) Price/Earnings Ratio (2) FY13 Consensus EPS (FNB=$0.84) 13.9x 14.4x 14.0x FY 14 Consensus EPS (FNB=$0.90) 13.0x 13.8x 13.3x Price/Tangible Book Value (2) 2.3x 1.6x 1.6x Price/Book Value (2) 1.2x 1.1x 1.2x Dividend Yield (2) 4.1% 2.4% 2.4% |
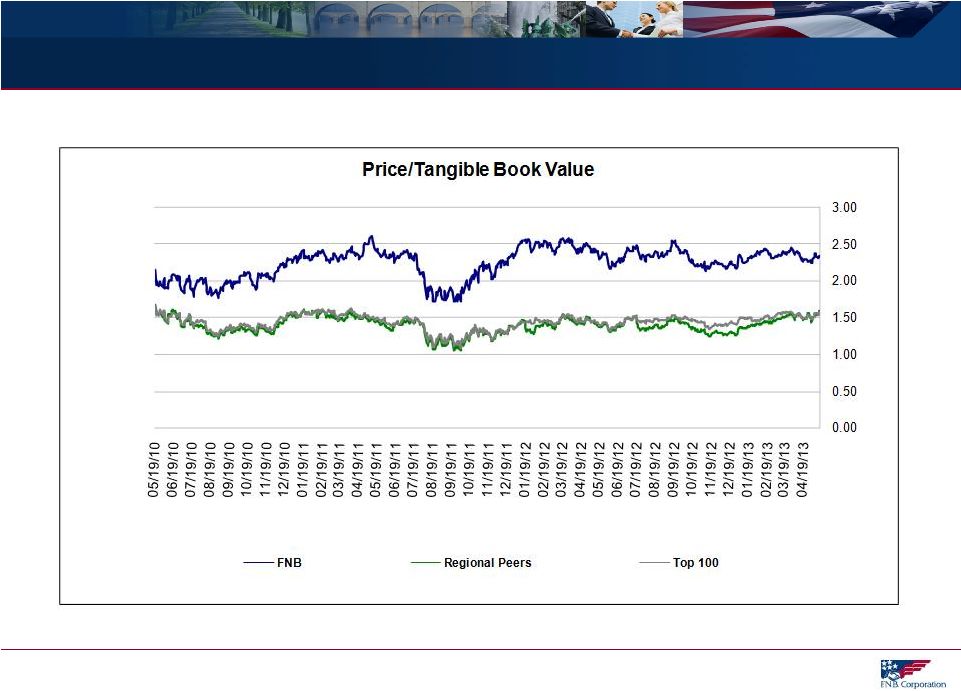 Price/TBV Trends (1) Market data per SNL Financial as May 16, 2013. Refer to Supplemental Information for regional peer listing. Top 100 represents the top 100 U.S. banks and thrifts by total assets as of 3/31/2013 38 FNB consistently trades at a premium to peers on price to tangible book value per share (1) |
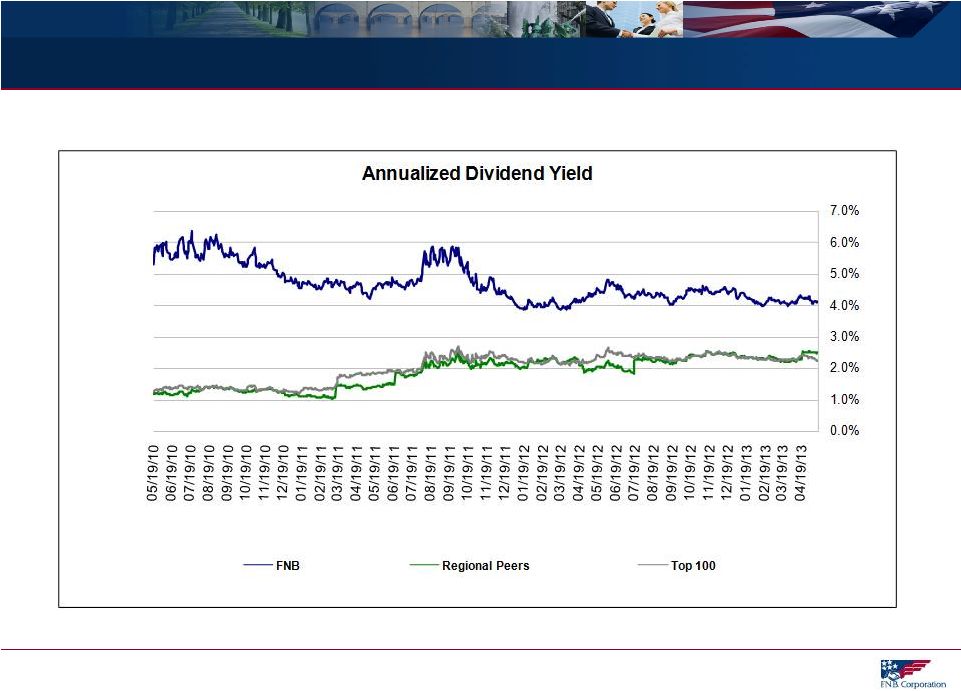 Dividend Yield Trends 39 FNB’s dividend yield remains well above peer levels (1) (1) Market data per SNL Financial as May 16, 2013. Refer to Supplemental Information for regional peer listing. Top 100 represents the top 100 U.S. banks and thrifts by total assets as of 3/31/2013 |
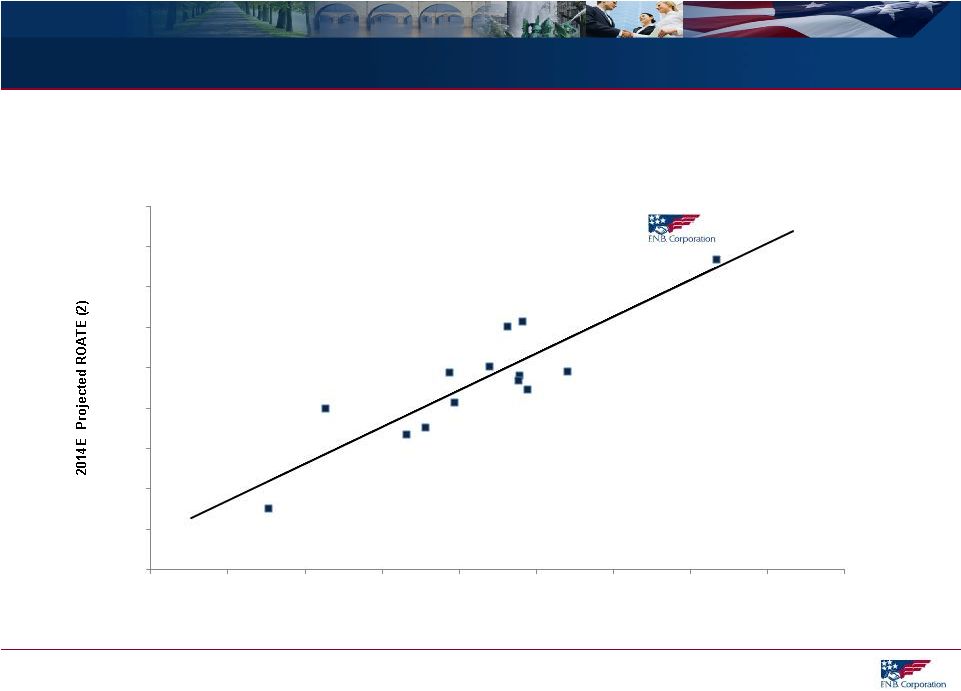 ROATE and P/TBV Analysis Where a bank trades relative to tangible book value is highly correlated with its projected return on tangible capital Source: SNL Financial as of 5/16/2013; Note: Data set above includes FNB’s regional peer group; (1) R-squared represents the percentage of the variation in price to tangible book value (P/TBV) that can be explained by variation in 2014E projected return on average tangible equity (ROATE); (2) Based on consensus mean estimates for FY2014. 40 R² = 0.7717 2% 4% 6% 8% 10% 12% 14% 16% 18% 20% 0.50x 0.75x 1.00x 1.25x 1.50x 1.75x 2.00x 2.25x 2.50x 2.75x Price/Tangible Book Value |
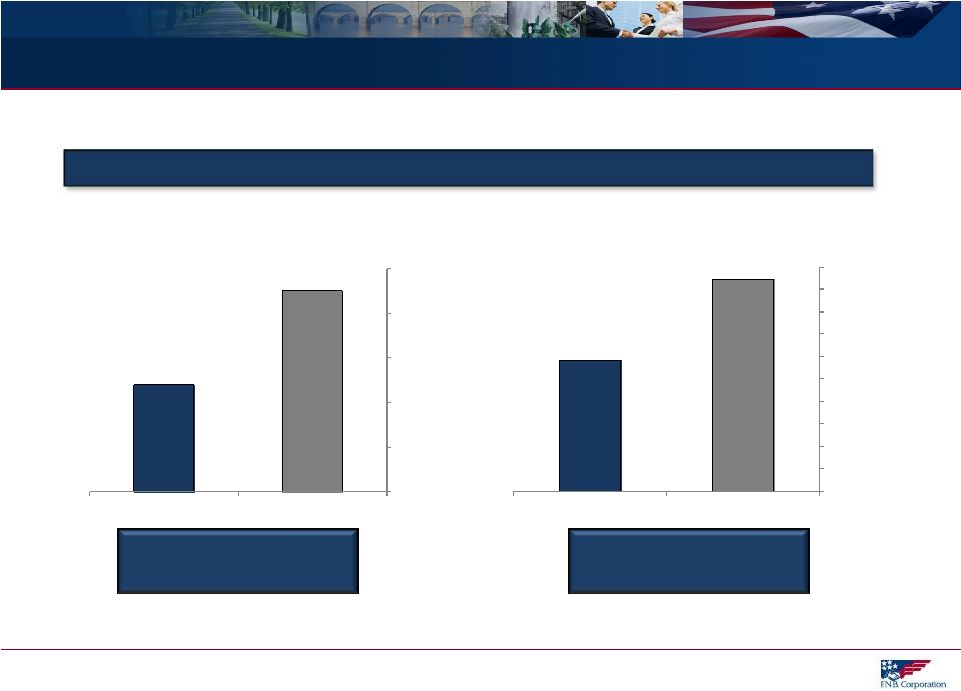
 Favorable Long-Term Total Return 41 Three-Year Total Shareholder Return Results (1) 21% 20% 46% 0% 5% 10% 15% 20% 25% 30% 35% 40% 45% 50% Top 100 Banks and Thrifts Regional Peers FNB (1) Market data per SNL Financial as May 16, 2013. Refer to Supplemental Information for regional peer listing. Top 100 represents the top 100 U.S. banks and thrifts by total assets as of 3/31/2013 |
 42 Supplemental Information |
 43 Supplemental Information Index Diversified Loan Portfolio Deposits and Customer Repurchase Agreements Investment Portfolio Loan Risk Profile Regency Finance Company Profile Marcellus and Utica Shale Exposure and Focus Regional Peer Group Listing GAAP to Non-GAAP Reconciliation First Quarter 2013 Earnings Release (April 23, 2013) |
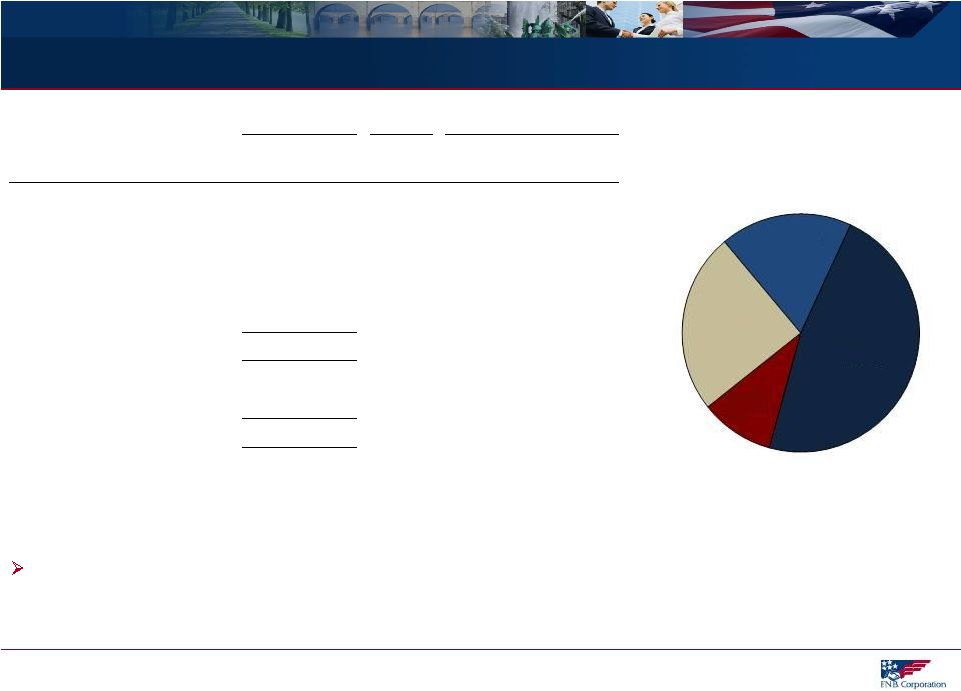
 Diversified Loan Portfolio 44 Note: Balance, CAGR and % of Portfolio based on period-end balances 3/31/2013 CAGR % of Portfolio ($ in millions) Balance 12/08- 3/13 12/31/08 3/31/2013 C&I $1,711 13.2% 16% 21% CRE: Non-Owner Occupied 1,349 8.3% 17% 16% CRE: Owner Occupied 1,274 3.8% 16% 15% Commercial Leases 132 21.4% 1% 2% Total Commercial $4,466 8.9% 50% 54% Consumer Home Equity 1,774 9.4% 21% 22% Residential Mortgage 1,027 16.5% 10% 12% Indirect 561 2.6% 9% 7% Other 158 2.6% 3% 2% Regency 168 1.3% 2% 2% Florida 55 -25.7% 5% 1% Total Loan Portfolio $8,209 8.1% 100% 100% Well diversified portfolio Strong growth results driven by commercial loan growth $8.2 Billion Loan Portfolio March 31, 2013 C&I + Owner Occupied CRE = 36% of Total Loan Portfolio Commercial & Industrial 21% Consumer Home Equity 22% Residential Mortgage 12% Indirect 7% Other 2% Regency 2% Florida 1% Commercial Leases 2% CRE: Non- Owner Occupied 16% CRE: Owner Occupied 15% |
 Deposits and Customer Repurchase Agreements 45 Note: Balance, CAGR and % of Portfolio based on period-end balances; (1) Transaction deposits include savings, NOW, MMDA and non-interest bearing deposits; (2) December 31, 2008 through March 31, 2013 3/31/2013 CAGR Mix % ($ in millions) Balance 12/08- 3/13 12/31/08 3/31/2013 Savings, NOW, MMDA $4,715 12.9% 44% 47% Time Deposits 2,443 1.2% 36% 25% Non-Interest Bearing 1,793 17.0% 14% 18% Customer Repos 1,000 23.0% 6% 10% Total Deposits and Customer Repo Agreements $9,952 10.7% 100% 100% Transaction Deposits (1) and Customer Repo Agreements $7,508 15.0% 64% 75% Loans to Deposits and Customer Repo Agreements Ratio = 82% March 31, 2013 New client acquisition and relationship-based focus reflected in favorable deposit mix – 15.0% average growth for transaction deposits and customer repo agreements (2) – 75% of total deposits and customer repo agreements are transaction-based deposits (1) $10.0 Billion Deposits and Customer Repo Agreements March 31, 2013 Non-Interest Bearing 18% Savings, NOW, MMDA 47% Customer Repos 10% Time Deposits 25% |
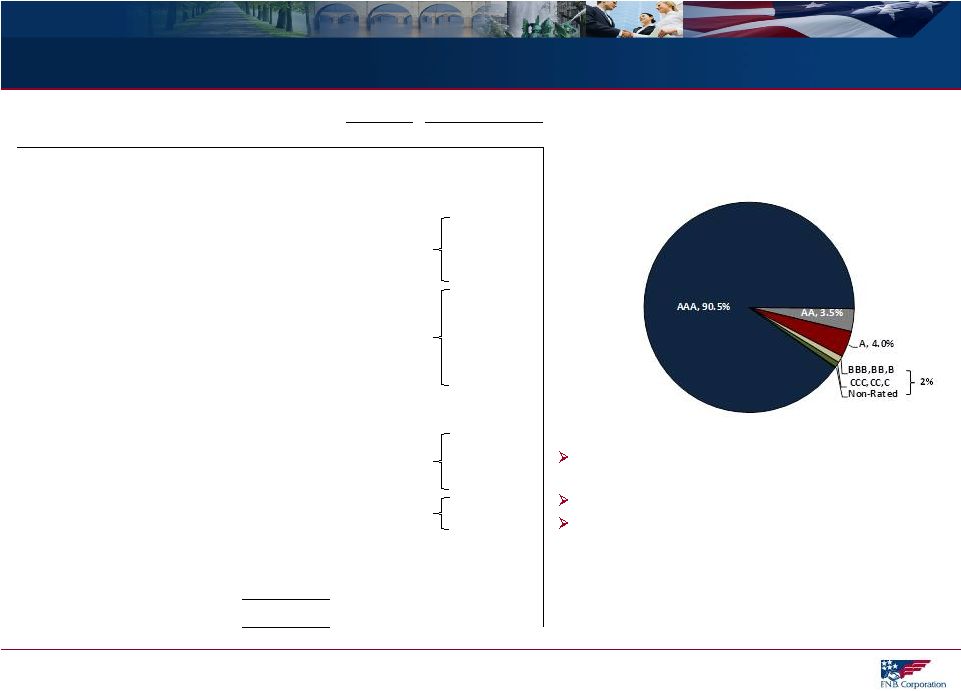 % Ratings ($ in millions (1) ) Portfolio Investment % Agency MBS $927 40% AAA 100% Highly Rated $2.3 Billion Investment Portfolio March 31, 2013 CMO Agency 725 32% AAA 100% Agency Senior Notes 398 17% AAA 100% Municipals 163 7% AAA AA A BBB 3% 47% 49% 1% Trust Preferred (2) 31 1% A BBB BB B CCC C 2% 5% 14% 16% 8% 55% Short Term 15 1% AAA 100% CMO Private Label 12 1% AA A BBB BB 23% 17% 29% 31% Corporate 15 1% A BBB 70% 30% Bank Stocks 2 - Non-Rated Commercial MBS 1 - AAA 100% US Treasury 1 - AAA 100% Total Investment Portfolio $2,289 100% Investment Portfolio 46 (1) Amounts reflect GAAP; (2) Original cost of $ 105 million, adjusted cost of $44 million, fair value of $31 million 94% of total portfolio rated AA or better, 98% rated A or better Relatively low duration of 2.8 Municipal bond portfolio – Highly rated with an average rating of AA and 99% of the portfolio rated A or better – General obligation bonds = 99.5% of portfolio – 77.1% from municipalities located throughout Pennsylvania |
 47 Loan Risk Profile (1) Originated portfolio metric $ in millions Balance 3/31/2013 % of Loans NPL's/Loans (1) Net Charge- Offs/Loans (1) Total Past Due/Loans (1) Commercial and Industrial $1,710,798 20.8% 0.61% -0.03% 0.77% CRE: Non-Owner Occupied 1,349,235 16.4% 1.16% 0.52% 1.45% CRE: Owner Occupied 1,273,851 15.5% 1.79% 0.14% 2.13% Home Equity and Other Consumer 1,902,167 23.2% 0.54% 0.20% 0.84% Residential Mortgage 1,026,509 12.5% 1.21% 0.05% 2.29% Indirect Consumer 560,594 6.8% 0.18% 0.39% 0.95% Regency Finance 167,586 2.0% 4.01% 4.01% 3.20% Commercial Leases 131,501 1.6% 0.50% -0.02% 1.59% Florida 55,438 0.7% 21.21% -7.27% 21.21% Other 31,608 0.4% 0.00% 1.22% 0.12% Total $8,209,286 100.0% 1.11% 0.22% 1.45% |
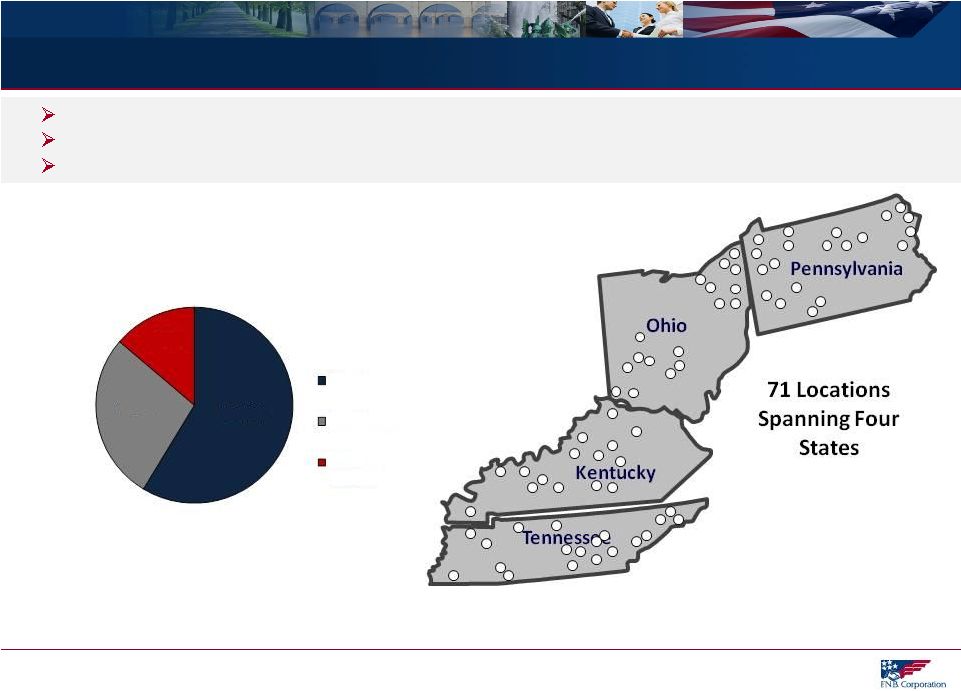 Conservatively run consumer finance business with over 80 years of consumer lending experience Good credit quality: Year-to-date net charge-offs to average loans of 3.95% Strong returns: 1Q13 : ROA 3.86%, ROE 42.52%, ROTE 47.87% Regency Finance Company Profile 48 Regency Finance Company $168 Million Loan Portfolio 86% of Real Estate Loans are First Mortgages 58.7% 27.6% 13.7% Direct Real Estate Sales Finance |
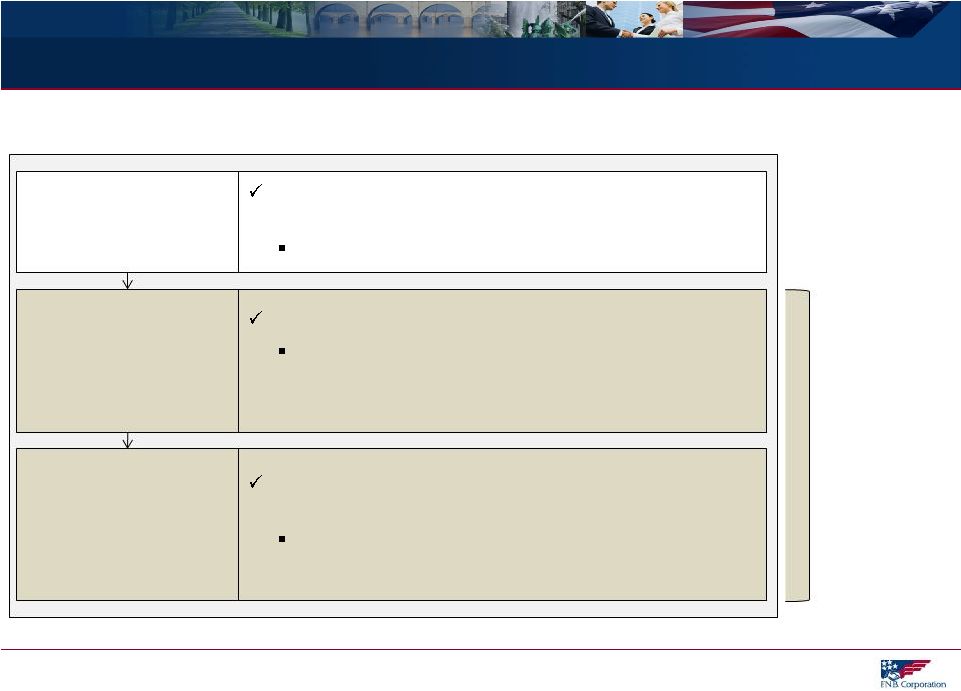
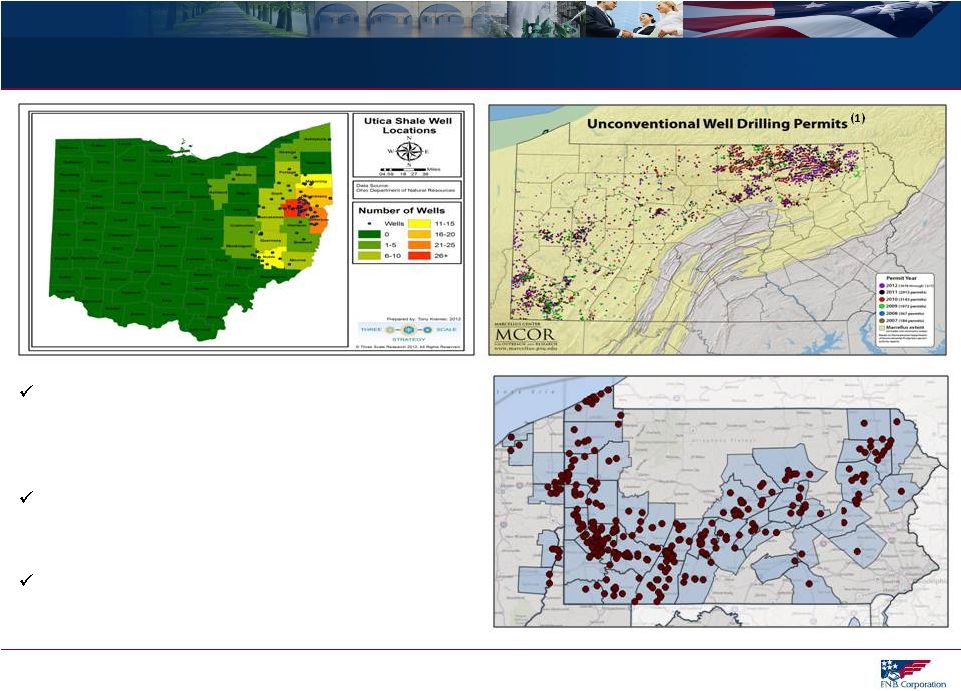 Marcellus and Utica Shale Exposure 49 (1) Sources: www.marcellus.psu.edu, retrieved May 3, 2013; (2) www.dnr.state.oh.us, retrieved May 31, 2012; (3) Sterne Agee June 7, 2010 and FBR Capital Markets, March 2, 2011. FNB Banking Locations Pennsylvania Ohio FNB is well-positioned in the Marcellus Shale and Utica Shale regions with a Pennsylvania footprint that closely aligns with the Marcellus Shale concentration and exposure to the Utica Shale region in Ohio. FNB has been noted by analysts as being one of the best geographically positioned banks to benefit from the Marcellus Shale. (3) This presents opportunity for FNB given the expected positive economic lift across much of FNB’s footprint. Ohio Utica Shale Well Locations (2) |
 Marcellus and Utica Shale FNB Strategic Focus 50 Opportunity for FNB relates to potential indirect and induced economic benefits across footprint Direct Effect: Oil and Gas Directly associated with the extraction, processing and delivery of the gas Drilling, extraction and support activities Indirect Effect: Supply Chain Provides goods and services to the energy industry e.g.: Iron and steel, transportation, commodity traders, heavy equipment, surveyors, utilities, rig parts, attorneys, real estate, machinery manufacturers, etc. Induced Benefit: Consumption Resulting benefit to industries and individuals from positive direct and indirect effects e.g.: Higher education, travel, housing, food and drink, entertainment, utilities, etc. FNB Strategic Focus: Supply Chain and Consumption |
 Regional Peer Group Listing 51 Ticker Institution Ticker Institution ASBC Associated Bancorp ONB Old National Bancorp AF Astoria Financial Corporation PVTB Private Bancorp, Inc. CBSH Commerce Bancshares, Inc. SUSQ Susquehanna Bancshares, Inc. FMER First Merit Corp. UMBF UMB Financial Corp. FULT Fulton Financial Corporation VLY Valley National Bancorp MBFI MB Financial, Inc WBS Webster Financial Corporation NPBC National Penn Bancshares, Inc. WTFC Wintrust Financial Corporation |
 GAAP to Non-GAAP Reconciliation 52 Operating: Earnings, Return on Avg Tangible Equity, Return on Avg Tangible Assets March 31, 2013 December 31, 2012 March 31, 2012 2012 2011 2010 Operating net income Net income $28,538 $28,955 $21,582 $110,410 $87,047 $74,652 Add: Merger and severance costs, net of tax 229 (3) 4,943 5,203 3,238 402 Add: Litigation settlement accrual, net of tax - 1,950 1,950 Add: Branch consolidation costs, net of tax - 1,214 1,214 Less: Gain on sale of building, net of tax 942 Less: One-time pension expense credit, net of tax 6,853 Operating net income $28,767 $32,116 $26,524 $117,835 $90,285 $68,201 Operating diluted earnings per share Diluted earnings per share $0.20 $0.21 $0.15 $0.79 $0.70 $0.65 Add: Merger and severance costs, net of tax 0.00 (0.00) 0.04 0.04 0.03 0.00 Add: Litigation settlement accrual, net of tax - 0.01 - 0.01 - - Add: Branch consolidation costs, net of tax - 0.01 - 0.01 - - Less: Gain on sale of building 0.01 - - Less: One-time pension expense credit - - - - - 0.06 Operating diluted earnings per share $0.20 $0.23 $0.19 $0.84 $0.72 $0.60 Operating return on average tangible equity Operating net income (annualized) $116,668 $127,762 $106,681 $117,835 $90,285 $68,201 Amortization of intangibles, net of tax (annualized) 5,237 5,800 5,964 5,938 4,698 4,364 $121,904 $133,562 $112,645 $123,773 $94,983 $72,565 Average shareholders' equity $1,410,827 $1,400,429 $1,352,569 $1,376,493 $1,181,941 $1,057,732 Less: Average intangible assets 712,466 715,962 719,195 717,031 599,851 564,448 Average tangible equity $698,361 $684,467 $633,375 $659,462 $582,090 $493,284 Operating return on average tangible equity 17.46% 19.51% 17.78% 18.77% 16.32% 14.71% Operating return on average tangible assets Operating net income (annualized) $116,668 $127,762 $106,681 $117,835 $90,285 $68,201 Amortization of intangibles, net of tax (annualized) 5,237 5,800 5,964 5,938 4,698 4,364 $121,904 $133,562 $112,645 $123,773 $94,983 $72,565 Average total assets $12,004,759 $11,988,283 $11,563,665 $11,782,821 $9,871,164 $8,906,734 Less: Average intangible assets 712,466 715,962 719,195 717,031 599,851 564,448 Average tangible assets 11,292,292 $ 11,272,320 $ 10,844,470 $ 11,065,790 $ 9,271,313 $ 8,342,286 $ Operating return on average tangible assets 1.08% 1.18% 1.04% 1.12% 1.02% 0.87% For the Quarter Ended Year Ended December 31, |