Filed by F.N.B. Corporation
Pursuant to Rule 425 under the Securities Act of 1933
and deemed filed pursuant to Rule 14a-6 of the Securities Exchange Act of 1934
Subject Company: PVF Capital Corp.
(SEC Registration Statement No. 333-189708)
The following slides are excerpts from an investor presentation used by F.N.B. management on August 20, 2013. The entire slide presentation is also available on F.N.B.’s website, atwww.fnbcorporation.com.
Additional Information About the Merger:
In connection with their pending merger, F.N.B. Corporation and PVF Capital Corp. are required to file a proxy statement/prospectus and other relevant documents with the SEC. F.N.B. and PVF Capital also file annual, quarterly and current reports, proxy statements and other information with the SEC. These documents may be obtained free of charge at the SEC’s website athttp://www.sec.gov. Additionally, investors and security holders may obtain free copies of the documents that F.N.B. has filed with the SEC by contacting James G. Orie, Chief Legal Officer, F.N.B. Corporation, One F.N.B. Boulevard, Hermitage, PA 16148, telephone: (724) 983-3317, and free copies of the documents that PVF Capital has filed with the SEC by contacting Jeffrey N. Male, Secretary, PVF Capital Corp., 30000 Aurora Road, Solon, OH 44139, telephone: (440) 248-7171.
SHAREHOLDERS OF PVF CAPITAL CORP. ARE ADVISED TO READ THE PROXY STATEMENT/PROSPECTUS AND ANY OTHER RELEVANT DOCUMENT FILED WITH THE SEC, AS WELL AS ANY AMENDMENTS AND SUPPLEMENTS TO THOSE DOCUMENTS, BECAUSE THEY WILL CONTAIN IMPORTANT INFORMATION.
F.N.B., PVF Capital and certain of their directors and executive officers may be deemed to be participants in the solicitation of proxies from shareholders of PVF Capital in connection with the proposed merger. The proxy statement/prospectus, when it becomes available, will describe the interests those directors and officers may have in the merger.
 Cautionary Statement Regarding Forward-Looking Information and Non-GAAP Financial Information 2 This presentation and the reports F.N.B. Corporation files with the Securities and Exchange Commission often contain “forward-looking statements” relating to present or future trends or factors affecting the banking industry and, specifically, the financial operations, markets and products of F.N.B. Corporation. These forward-looking statements involve certain risks and uncertainties. There are a number of important factors that could cause F.N.B. Corporation’s future results to differ materially from historical performance or projected performance. These factors include, but are not limited to: (1) a significant increase in competitive pressures among financial institutions; (2) changes in the interest rate environment that may reduce interest margins; (3) changes in prepayment speeds, loan sale volumes, charge-offs and loan loss provisions; (4) general economic conditions; (5) various monetary and fiscal policies and regulations of the U.S. government that may adversely affect the businesses in which F.N.B. Corporation is engaged; (6) technological issues which may adversely affect F.N.B. Corporation’s financial operations or customers; (7) changes in the securities markets; (8) risk factors mentioned in the reports and registration statements F.N.B. Corporation files with the Securities and Exchange Commission; (9) housing prices; (10) job market; (11) consumer confidence and spending habits; (12) estimates of fair value of certain F.N.B. Corporation assets and liabilities; (13) transaction risks associated with the pending mergers of PVF Capital Corp. and BCSB Bancorp, Inc., and integration challenges related to the recently completed merger with Annapolis Bancorp, Inc. and the difficulties encountered in expanding into a new market; or (14) the effects of current, pending and future legislation, regulation and regulatory actions. F.N.B. Corporation undertakes no obligation to revise these forward-looking statements or to reflect events or circumstances after the date of this presentation. To supplement its consolidated financial statements presented in accordance with Generally Accepted Accounting Principles (GAAP), the Corporation provides additional measures of operating results, net income and earnings per share (EPS) adjusted to exclude certain costs, expenses, and gains and losses. The Corporation believes that these non-GAAP financial measures are appropriate to enhance the understanding of its past performance as well as prospects for its future performance. In the event of such a disclosure or release, the Securities and Exchange Commission’s Regulation G requires: (i) the presentation of the most directly comparable financial measure calculated and presented in accordance with GAAP and (ii) a reconciliation of the differences between the non-GAAP financial measure presented and the most directly comparable financial measure calculated and presented in accordance with GAAP. The required presentations and reconciliations are contained herein and can be found at our website, www.fnbcorporation.com, under “Shareholder and Investor Relations” by clicking on “Non-GAAP Reconciliation.” The Appendix to this presentation contains non-GAAP financial measures used by the Corporation to provide information useful to investors in understanding the Corporation's operating performance and trends, and facilitate comparisons with the performance of the Corporation's peers. While the Corporation believes that these non-GAAP financial measures are useful in evaluating the Corporation, the information should be considered supplemental in nature and not as a substitute for or superior to the relevant financial information prepared in accordance with GAAP. The non-GAAP financial measures used by the Corporation may differ from the non-GAAP financial measures other financial institutions use to measure their results of operations. This information should be reviewed in conjunction with the Corporation’s financial results disclosed on July 23, 2013 and in its periodic filings with the Securities and Exchange Commission. |
 About F.N.B. Corporation 6 Fourth Largest Pennsylvania-Based Bank Positioned for Sustained Growth Consistent, Strong Operating Results Operating Strategy • Assets:$14.0 billion (1) • Loans:$9.5 billion (1) • Deposits:$11.6 billion (1) • Banking locations:286 (1) • Consumer finance locations:72 • Attractive and expanding footprint: PA/OH/MD/WV: Banking locations span 56 counties and four states (1) • Leading market position (Pro-Forma) (2) • #3 market share in the Pittsburgh MSA • #10 market share in the Baltimore MSA • #6 overall market position for all counties of operation • Top quartile profitability performance • Deliver consistent, solid results • Industry-leading, consistent loan growth through recent economic cycle • Strong performance:3-year total shareholder return of 88% (3) • Reposition and reinvest for sustained growth; maintain low-risk profile • Reposition and reinvest for sustained growth • Maintain disciplined expense control • Expanding market share potential and growth opportunities • Maintain low-risk profile (1) Pro-forma for pending acquisition of PVFC, expected to close October 2013 with assets of approximately $0.8 billion, loans of $0.6 billion, deposits of $0.6 billion and 16 banking locations and BCSB Bancorp, expected to close 1Q14 with assets of approximately $0.6 billion, loans of $0.3 billion, deposits of $0.6 billion and 16 banking locations (2) SNL Financial, Pro-forma for PVFC & BCSB, excludes custodian bank; (3) As of August 14, 2013 |
 Reposition and Reinvest – Actions Drive Long-Term Performance 9 2009 2010 2011 2012 2013 YTD PEOPLE Talent Management Strengthened team through key hires; Continuous team development Attract, retain, develop best talent Geographic Segmentation Regional model Regional Realignment Created 5 & 6 Regions PROCESS Sales Management/Cross Sell Proprietary sales management system developed and implemented: Balanced scorecards, cross-functional alignment Consumer Banking Scorecards Consumer Banking Refinement/Daily Monitoring Continued Utilization Commercial Banking Sales Management Expansion to additional lines of business Private Banking, Insurance, Wealth Management PRODUCT Product Development Deepened product set and niche areas allow FNB to successfully compete with larger banks and gain share Private Banking Capital Markets Online and mobile banking investment /implementation – Online banking enhancements, mobile banking and app Online/mobile banking infrastructure complete with mobile remote deposit capture and online budgeting tools Asset Based Lending Small Business Realignment Treasury Management PRODUCTIVITY Branch Optimization Continuous evolution of branch network to optimize profitability and growth prospects De-Novo Expansion 9 Locations Continuous Evaluation Consolidate 2 Locations Consolidate 6 Locations Consolidate 37 Locations Acquisitions Opportunistically expand presence in attractive markets CB&T Parkvale ANNB Closed 4/13 PVFC 10/13 BCSB 1Q14 th th |
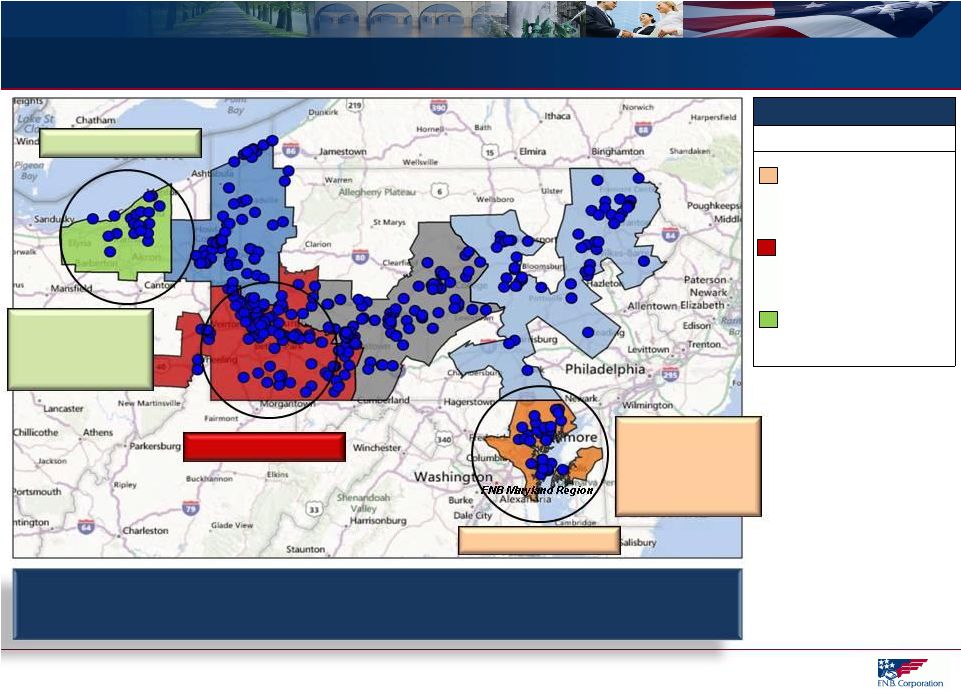 FNB’s model utilizes six regions, including three in top 30 MSA markets, with each having a regional headquarters housing cross-functional teams. FNB Banking Footprint - Regional Alignment 13 Source: SNL Financial, Pro-Forma for PVFC and BCSB Top 30 MSA Presence MSA Population 2.7 million #20 MSA 2.4 million #22 MSA 2.1 million #28 MSA Cleveland MSA Pittsburgh MSA Baltimore MSA PVFC Acquisition Expected Completion October 2013 FNB Northwest Region FNB Central Region FNB Capital Region FNB Pittsburgh Region FNB Cleveland Region ANNB Completed 4/6/2013 & BCSB Acquisition Expected Completion 1Q14 Baltimore, MD Pittsburgh, PA Cleveland, OH |
 MSA Market Share - Proven Success, Opportunity For Growth 15 Source: SNL Financial, deposit data as of June 30, 2012, pro-forma as of August 1, 2013, excludes custodial bank (Pittsburgh MSA). All Other MSA’s represent MSA’s with FNB presence excluding Pittsburgh, Cleveland and Baltimore MSA’s. Established MSA Markets – Proven Success, Leading Share Position Achieved Recent and Pending Expansion MSA Markets – Opportunity for Growth Pittsburgh, PA MSA Rank Institution Total Deposits ($ 000's) Market Share (%) 1 PNC Financial Services Group Inc. 42,596,832 54.7 2 Royal Bank of Scotland Group Plc 6,883,477 8.8 3 F.N.B. Corporation 3,524,259 4.5 4 Dollar Bank Federal Savings Bank 3,453,494 4.4 5 First Niagara Financial Group Inc. 2,830,934 3.6 6 Huntington Bancshares Inc. 2,526,263 3.2 7 First Commonwealth Financial Cor 2,426,042 3.1 8 S&T Bancorp Inc. 1,684,601 2.2 9 TriState Capital Holdings Inc. 1,679,984 2.2 10 Northwest Bancshares Inc. 1,046,252 1.3 All Other FNB MSA's (excludes Pittsburgh, Baltimore, Cleveland) Rank Institution Total Deposits ($ 000's) Market Share (%) 1 PNC Financial Services Group Inc. 10,910,138 11.8 2 M&T Bank Corp. 6,599,882 7.1 �� 3 F.N.B. Corporation 5,219,603 5.6 4 Wells Fargo & Co. 4,734,090 5.1 5 Banco Santander SA 3,854,650 4.2 6 Huntington Bancshares Inc. 3,839,197 4.1 7 Royal Bank of Scotland Group Plc 3,645,447 3.9 8 FirstMerit Corp. 3,163,562 3.4 9 Susquehanna Bancshares Inc. 2,946,878 3.2 10 JPMorgan Chase & Co. 2,481,729 2.7 Baltimore-Towson, MD MSA Rank Institution Total Deposits ($ 000's) Market Share (%) 1 Bank of America Corp. 15,836,195 24.8 2 M&T Bank Corp. 14,823,019 23.2 3 PNC Financial Services Group Inc. 6,659,451 10.4 4 Wells Fargo & Co. 5,913,121 9.3 5 BB&T Corp. 3,612,709 5.7 6 SunTrust Banks Inc. 2,084,077 3.3 7 Susquehanna Bancshares Inc. 1,188,991 1.9 8 First Mariner Bancorp 1,030,695 1.6 9 Capital One Financial Corp. 931,446 1.5 10 F.N.B. Corporation 913,327 1.4 Cleveland-Elyria-Mentor, OH MSA Rank Institution Total Deposits ($ 000's) Market Share (%) 1 KeyCorp 9,961,386 19.8 2 PNC Financial Services Group Inc. 5,758,463 11.5 3 TFS Financial Corp. (MHC) 5,628,594 11.2 4 Royal Bank of Scotland Group Plc 4,420,693 8.8 5 Huntington Bancshares Inc. 4,212,182 8.4 6 Fifth Third Bancorp 3,531,385 7.0 7 FirstMerit Corp. 3,349,627 6.7 8 JPMorgan Chase & Co. 2,738,568 5.4 9 U.S. Bancorp 1,979,041 3.9 10 Dollar Bank Federal Savings Bank 1,662,699 3.3 14 F.N.B. Corporation 649,212 1.3 |
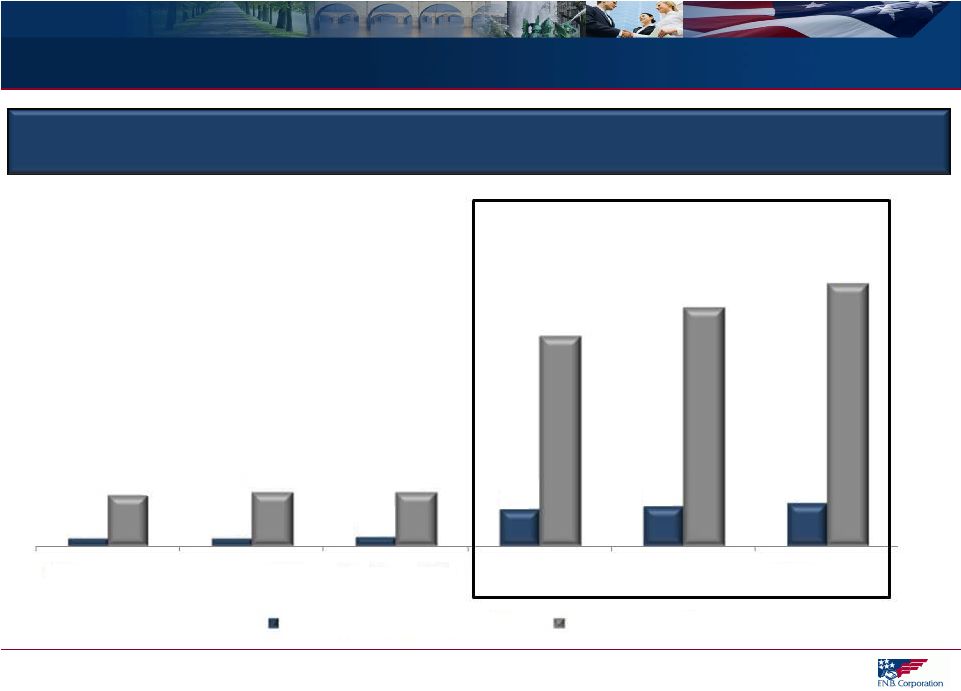 Significant Commercial Prospects 17 Note: Above metrics at the MSA level (1) Data per U.S. Census Bureau (2) Data per Hoover’s as of August 14, 2013 Strong Concentration of Commercial Prospects Over 175,000 Total Businesses 1,912 1,986 2,112 8,913 9,690 10,479 12,851 13,345 13,410 52,149 59,240 65,169 Youngstown MSA Scranton MSA Harrisburg MSA Cleveland MSA Pittsburgh MSA Baltimore MSA # of Business with Revenue >$1M Total Businesses Significant Commercial Prospects Concentrated in Pittsburgh, Baltimore & Cleveland Opportunity to Leverage Core Competency and Drive Sustained Organic Growth (1) (2) (1) |
 18 Acquisition Strategy Disciplined and Consistent Strategy Significant Expansion Enhanced Organic Growth Prospects |
 Acquisition Strategy 19 Disciplined and Consistent Acquisition Strategy Disciplined identification and focus on markets that offer potential to leverage core competencies and growth opportunities Create shareholder value Meet strategic vision Fit culturally Targeted financial and capital recoupment hurdles Proficient and experienced due diligence team Extensive and detailed due diligence process Superior post-acquisition execution Execute FNB’s proven, scalable, business model Proven success assimilating FNB’s strong sales culture Criteria Evaluation Strategy Strategy Execution Strategy Criteria Evaluation Execution |
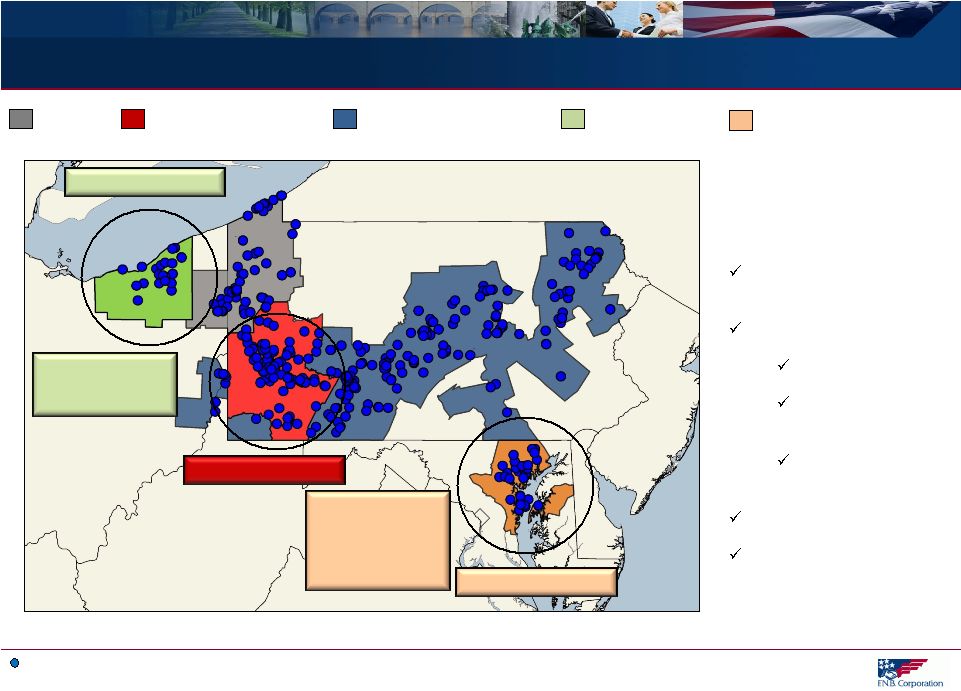 Significant Acquisition-Related Expansion 20 FNB Banking Location (pro-forma) 12 th bank acquisition since 2002 announced June 14, 2013 (BCSB) Pre-2002 Presence Additional Acquisition-Related Expansion Pittsburgh MSA Acquisition Expansion Cleveland MSA Expansion Baltimore MSA Pittsburgh MSA Cleveland MSA PVFC Acquisition Target Completion October 2013 ANNB Completed 4/6/2013 & BCSB Acquisition Target Completion 1Q14 Maryland Acquisition- Related Expansion Cleveland Hermitage Erie State College Harrisburg Philadelphia Scranton Baltimore Pittsburgh WV OH PA NY MD Fourth consecutive acquisition in a major MSA Status of recent acquisitions ANNB closed 4/6/2013 PVFC expected close 10/2013 BCSB expected close 1Q14 Five acquisitions since 2010 Ten acquisitions since 2005 |
 M&A Strategic Update – Progressing as Planned 21 Significant Progress Replicating Proven Success in Pittsburgh MSA to Expansion Markets of Baltimore MSA (ANNB And BCSB Acquisitions) and Cleveland MSA (PVFC Acquisition) Strategies Pittsburgh MSA Baltimore MSA Cleveland MSA Market Characteristics Support Sustained Organic Growth Markets with considerable scale and growth opportunities. Density of commercial prospects, strong consumer, wealth, private banking, insurance opportunities support FNB’s strategy. Commercial Prospects (1) 59,240 65,169 52,149 Population 2.4 million 2.7 million 2.1 million Median Household Income $46,000 $63,000 $45,000 Single Family Housing Permits YOY Change (6/13) (3) 31% 40% 23% FNB Execution in Market Instills FNB Culture Assemble strong regional leadership with established market connections. Build experienced cross- functional team. Deploy proprietary sales management process immediately. Create synergistic cross- functional alignment. Leadership In Process Team Sales Management Cross-Functional Alignment Market Position Establishes Scale and Presence Achieve attractive market position. Establish strong presence and FNB hub with a regional headquarters. Market Position (2) #3 #10 #14 Regional Headquarters In Process (1) Data per U.S. Census Bureau;(2) Deposit market share, pro-forma, excludes custodial bank in Pittsburgh MSA (3) Information as of August 6, 2013 as per local market monitor |
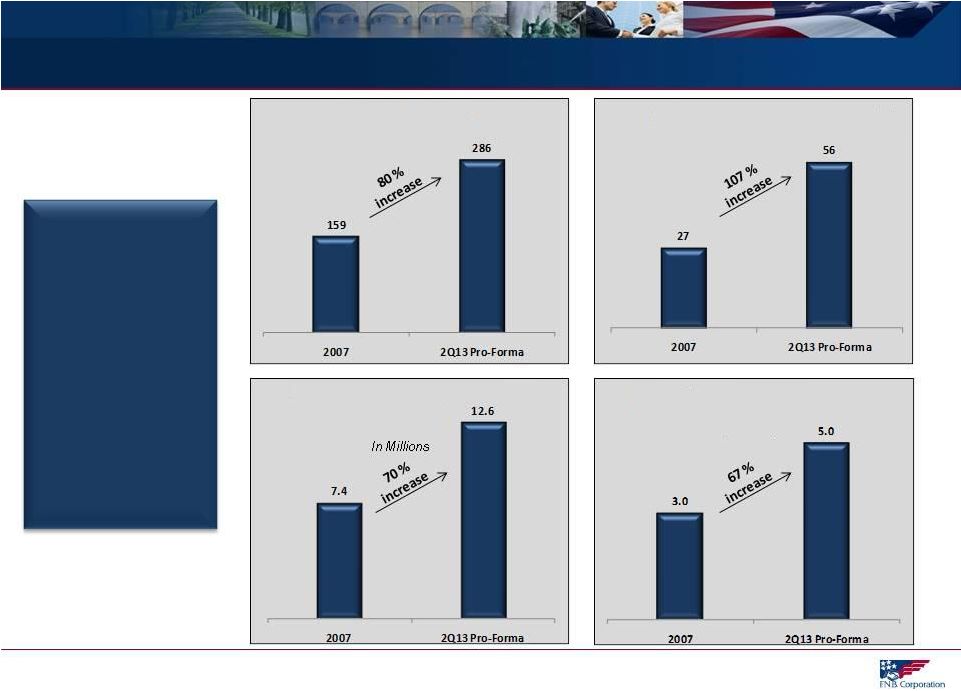 Expanded Franchise = Enhanced Organic Growth Prospects 22 Note: Market population and market businesses represent current metrics based on respective FNB MSA presence Data per FNB, SNL Financial and/or U.S. Census Bureau (Businesses) Acquisition- Related Expansion in Higher Growth Markets Enhances Organic Growth Opportunities FNB Branches FNB Counties of Operation (MSA) FNB Markets Households (MSA) FNB Markets' Population |