![]() F.N.B. Corporation Third Quarter 2013 Investor Presentation Guggenheim Partners – New York, NY November 6, 2013 Exhibit 99.1 |
![]() Cautionary Statement Regarding Forward-Looking Information and Non-GAAP Financial Information 2 This presentation and the reports F.N.B. Corporation files with the Securities and Exchange Commission often contain “forward-looking statements” relating to present or future trends or factors affecting the banking industry and, specifically, the financial operations, markets and products of F.N.B. Corporation. These forward-looking statements involve certain risks and uncertainties. There are a number of important factors that could cause F.N.B. Corporation’s future results to differ materially from historical performance or projected performance. These factors include, but are not limited to: (1) a significant increase in competitive pressures among financial institutions; (2) changes in the interest rate environment that may reduce interest margins; (3) changes in prepayment speeds, loan sale volumes, charge-offs and loan loss provisions; (4) general economic conditions; (5) various monetary and fiscal policies and regulations of the U.S. government that may adversely affect the businesses in which F.N.B. Corporation is engaged; (6) technological issues which may adversely affect F.N.B. Corporation’s financial operations or customers; (7) changes in the securities markets; (8) risk factors mentioned in the reports and registration statements F.N.B. Corporation files with the Securities and Exchange Commission; (9) housing prices; (10) job market; (11) consumer confidence and spending habits; (12) estimates of fair value of certain F.N.B. Corporation assets and liabilities; (13) transaction risks associated with the pending merger of BCSB Bancorp, Inc., and integration challenges related to the recently completed mergers with PVF Capital Corp. and Annapolis Bancorp, Inc. and the difficulties encountered in expanding into a new market and (14) the effects of current, pending and future legislation, regulation and regulatory actions. F.N.B. Corporation undertakes no obligation to revise these forward-looking statements or to reflect events or circumstances after the date of this presentation. To supplement its consolidated financial statements presented in accordance with Generally Accepted Accounting Principles (GAAP), the Corporation provides additional measures of operating results, net income and earnings per share (EPS) adjusted to exclude certain costs, expenses, and gains and losses. The Corporation believes that these non-GAAP financial measures are appropriate to enhance the understanding of its past performance as well as prospects for its future performance. In the event of such a disclosure or release, the Securities and Exchange Commission’s Regulation G requires: (i) the presentation of the most directly comparable financial measure calculated and presented in accordance with GAAP and (ii) a reconciliation of the differences between the non-GAAP financial measure presented and the most directly comparable financial measure calculated and presented in accordance with GAAP. The Appendix to this presentation contains non-GAAP financial measures used by the Corporation to provide information useful to investors in understanding the Corporation's operating performance and trends, and facilitate comparisons with the performance of the Corporation's peers. While the Corporation believes that these non-GAAP financial measures are useful in evaluating the Corporation, the information should be considered supplemental in nature and not as a substitute for or superior to the relevant financial information prepared in accordance with GAAP. The non-GAAP financial measures used by the Corporation may differ from the non-GAAP financial measures other financial institutions use to measure their results of operations. This information should be reviewed in conjunction with the Corporation’s financial results disclosed on October 17, 2013 and in its periodic filings with the Securities and Exchange Commission. |
![]() Important Information About the Pending Mergers 3 Merger of F.N.B. and BCSB Bancorp. In connection with the proposed merger between F.N.B. and BCSB Bancorp, a definitive proxy statement of BCSB Bancorp and prospectus of F.N.B. will be filed with the SEC. SHAREHOLDERS OF BCSB BANCORP, INC. ARE URGED TO READ THE DEFINITIVE PROXY STATEMENT/PROSPECTUS AND ANY OTHER RELEVANT DOCUMENTS THAT ARE FILED WITH THE SEC, AS WELL AS ANY AMENDMENTS OR SUPPLEMENTS TO THOSE DOCUMENTS, BECAUSE THEY WILL CONTAIN IMPORTANT INFORMATION. F.N.B. and BCSB Bancorp and certain of their directors and executive officers may be deemed to be participants in the solicitation of proxies from BCSB Bancorp shareholders in connection with the proposed merger. Information concerning such participants’ ownership of BCSB Bancorp common stock will be set forth in the definitive proxy statement/prospectus. Where to Find Additional Information. A free copy of the definitive proxy statement/prospectus for each pending merger (when it is available), as well as other documents containing information about F.N.B. Corporation and BCSB Bancorp, Inc., may be obtained at the SEC’s Internet site (http://www.sec.gov). In addition, investors and security holders may obtain free copies of the documents that F.N.B. and BCSB Bancorp have filed with the SEC by contacting the following persons at each corporation: F.N.B.: James G. Orie, Chief Legal Officer, F.N.B. Corporation, One F.N.B. Boulevard, Hermitage, PA 16148, telephone: (724) 983-3317 BCSB Bancorp: Joseph J. Bouffard, President and Chief Executive Officer, BCSB Bancorp, Inc., 4111 East Joppa Road, Baltimore, MD 21236, telephone: (410) 256-5000 |
![]() 4 F.N.B. Corporation Key Investment Considerations About F.N.B. Corporation Experienced Leadership Team Reposition and Reinvest Strategy Drives Growth Strong Operating Trends |
![]() Key Investment Considerations 5 Consistent Strategy Focused on Long-Term Perspective Achieved organic growth throughout the recent economic cycle, largely driven by growth in loans and low-cost deposits Consistent and high-quality operating results Continuous investments in People, Process, Products and Productivity Maintain lower-risk profile with significant investments in enterprise-wide risk management Strong culture focused on people, talent management, cross-sell and sophisticated product offerings Proven success achieving top market position in major markets and across footprint Proven ability to compete effectively against much larger peers Disciplined acquisition and expansion strategy focused on organic growth potential Long-term investment thesis centered on efficient capital management and generating shareholder value Attractive relative valuation with consistent and supported P/TBV, modest P/E and strong dividend yield KEY INVESTMENT CONSIDERATIONS – Differentiating Factors |
![]() About F.N.B. Corporation 6 (1) Pro-forma for the recently completed PVFC acquisition, which closed October 12, 2013 with assets of approximately $0.7 billion, loans of $0.5 billion, deposits of $0.6 billion and 16 banking locations and the pending acquisition of BCSB Bancorp, expected to close 1Q14 with assets of approximately $0.6 billion, loans of $0.3 billion, deposits of $0.6 billion and 16 banking locations (2) SNL Financial, Pro-forma for PVFC & BCSB, excludes custodian bank; (3) As of November 1, 2013 Fourth Largest Pennsylvania-Based Bank Positioned for Sustained Growth Consistent, Strong Operating Results Operating Strategy Assets:$14.1 billion (1) Loans:$9.6 billion (1) Deposits:$11.8 billion (1) Banking locations:282 (1) Consumer finance locations:72 Attractive and expanding footprint: PA/OH/MD/WV: Banking locations span 56 counties and four states (1) Leading market position (Pro-Forma) (2) #3 market share in the Pittsburgh MSA #10 market share in the Baltimore MSA #6 overall market position for all counties of operation Top quartile profitability performance Deliver consistent, solid results Industry-leading, consistent loan growth through recent economic cycle Strong performance:3-year total shareholder return of 73% (3) Reposition and reinvest for sustained growth; maintain low risk profile Reposition and reinvest for sustained growth Maintain disciplined expense control Expanding market share potential and growth opportunities Maintain low-risk profile |
![]() Years of Banking Experience Joined FNB Prior Experience President and CEO Vincent J. Delie, Jr. 26 2005 National City President, First National Bank John C. Williams, Jr. 42 2008 Huntington National City Mellon Bank Chief Financial Officer Vincent J. Calabrese, Jr. 25 2007 People’s United Chief Credit Officer Gary L. Guerrieri 27 2002 FNB Promistar Experienced Leadership Team 7 Experienced and respected executive management team has guided FNB through the cycle |
![]() Reposition and Reinvest Strategy 8 Talent Management Geographic Segmentation Sales Management/Cross-Sell Product Development Branch Optimization Electronic Delivery Investment Utilize Acquisitions to Enhance Growth Opportunities Proven ability to attract talent Consistent, strong operating results Revenue growth Consistent organic loan growth Continued organic transaction deposit growth Attractive market position Expanded market share potential via entry and expansion in attractive markets Strong 3-year total shareholder return Strategic Focus Drives Long-Term Growth and Performance Actions Results |
![]() Reposition and Reinvest – Actions Drive Long-Term Performance 9 2009 2010 2011 2012 2013 YTD PEOPLE Talent Management Strengthened team through key hires; Continuous team development Attract, retain, develop best talent Geographic Segmentation Regional model Regional Realignment Created 5 & 6 Regions PROCESS Sales Management/Cross Sell Proprietary sales management system developed and implemented: Balanced scorecards, cross-functional alignment Consumer Banking Scorecards Consumer Banking Refinement/Daily Monitoring Continued Utilization Commercial Banking Sales Management Expansion to additional lines of business Private Banking, Insurance, Wealth Management PRODUCT Product Development Deepened product set and niche areas allow FNB to successfully compete with larger banks and gain share Private Banking Capital Markets Online and mobile banking investment /implementation – Online banking enhancements, mobile banking and app Online/mobile banking infrastructure complete with mobile remote deposit capture and online budgeting tools Asset Based Lending Small Business Realignment Treasury Management PRODUCTIVITY Branch Optimization Continuous evolution of branch network to optimize profitability and growth prospects De-Novo Expansion 11 Locations Consolidate 2 Locations Consolidate 6 Locations Consolidate 37 Locations Consolidate 6 Locations Acquisitions Opportunistically expand presence in attractive markets CB&T Parkvale ANNB Closed 4/13 PVFC Closed 10/13 BCSB 1Q14 th th |
![]() Consistent Loan and Transaction Deposit Growth 10 (1) Organic balances exclude initial respective balances acquired upon transaction close for ANNB (4/2013), PVSA (1/2012) and CBT (1/2011) Consistent Growth in Loans and Transaction Deposits Loans (Quarterly, In Billions) Transaction Deposits and Customer Repos (Quarterly, In Billions) $8.7 $8.0 $6.8 $6.0 $7.1 $6.7 $6.4 3Q13 4Q12 4Q11 4Q10 Total Organic $8.0 $7.4 $5.8 $5.2 $6.5 $6.3 $5.5 3Q13 4Q12 4Q11 4Q10 Total Organic CAGR 4Q10 – 3Q13 Total 17.3% Organic (1) 8.9% CAGR 4Q10 – 3Q13 Total 14.4% Organic (1) 6.3% |
![]() Transaction Deposit Growth - Strengthened Funding Mix 11 (1) Based on period-end balances Consistent Transaction Deposit Growth Results in Strengthened Deposit Mix Total Transaction Deposits and Customer Repos Mix 78% 77% 75% 74% 73% 71% 22% 23% 25% 26% 27% 29% 9/30/2013 6/30/2013 3/31/2013 12/31/2012 12/31/2011 12/31/2010 Transaction Deposits and Customer Repos Time Deposits Transaction deposits and customer repos = 78% of total deposits and customer repos Strong growth in average non- interest bearing deposits of $131.8 million, or 27.5% annualized, resulted in further strengthened mix 3Q13 |
![]() Peer Leading ROTA and ROTE 12 Return on tangible assets and return on tangible equity are non-GAAP measures and FNB ROTE and ROTA exclude merger costs, refer to Appendix for GAAP to Non-GAAP Reconciliation details. Peer data per SNL Financial. ROTA and ROTE Exceed Peer Results 1.08% 1.08% 1.12% 0.00% 0.20% 0.40% 0.60% 0.80% 1.00% 1.20% 1Q13 2Q13 3Q13 FNB Peer Group Median Return on Average Tangible Assets Return on Average Tangible Equity 17.46% 17.33% 18.33% 0.00% 2.00% 4.00% 6.00% 8.00% 10.00% 12.00% 14.00% 16.00% 18.00% 20.00% 1Q13 2Q13 3Q13 FNB Peer Group Median |
![]() High-Quality Earnings 13 (1) At respective period-end. FNB levels represents allowance for loan losses to total originated loans. Peer data per SNL Financial and based on availability. FNB Continues to Deliver High-Quality Earnings Provision for Loan Losses as % of Net Charge-Offs ($) FNB provision for loan losses exceeds net charge-offs to support consistent, solid loan growth results Allowance for Loan Losses/Total Loans (%) (1) FNB allowance for loan losses to total loans (originated portfolio) has remained relatively stable 133% 134% 113% 61% 75% 9/30/2013 YTD 6/30/2013 YTD 2012 FNB Peer Group Median 1.34 1.35 1.39 1.25 1.34 1.47 9/30/2013 6/30/2013 12/31/2012 FNB Peer Group Median |
![]() Market Position Top Overall and MSA Market Position Regional Alignment Presence in Major Markets Significant Commercial Prospects 14 |
![]() FNB’s model utilizes six regions, including three in top 30 MSA markets, with each having a regional headquarters housing cross-functional teams. FNB Banking Footprint - Regional Alignment 15 Source: SNL Financial, Pro-Forma for PVFC and BCSB Baltimore MSA Pittsburgh MSA Cleveland MSA PVFC Target Completion October 2013 ANNB Completed 4/6/2013 & BCSB Completed 10/12/13 Cleveland Hermitage Erie State College Harrisburg Philadelphia Scranton WV OH PA NY MD Baltimore Pittsburgh Top 30 MSA Presence MSA Population Baltimore, MD 2.7 million #20 MSA Pittsburgh, PA 2.4 million #22 MSA Cleveland, OH 2.1 million #29 MSA |
![]() Top Overall Market Position 16 Source: SNL Financial, deposit data as of June 30, 2013, pro-forma as of October 21, 2013, excludes custodial bank. FNB Pennsylvania Counties of Operation Rank Institution Branch Count Total Market Deposits ($ 000) Total Market Share (%) 1 PNC Financial Services 399 58,855,363 35.3 2 Royal Bank of Scotland 202 10,073,477 6.4 3 F.N.B. Corporation 224 8,884,922 5.6 4 M&T Bank Corp. 141 7,393,569 4.7 5 Wells Fargo & Co. 65 4,905,156 3.1 6 First Commonwealth 99 4,225,821 2.7 7 Banco Santander 72 4,056,694 2.6 8 Dollar Bank 37 3,556,646 2.2 9 Susquehanna Bancshares 80 3,105,908 2.0 10 First Niagara Financial 73 3,060,621 1.9 Total (1-138) 2,449 158,109,555 100.0 FNB All Counties of Operation Rank Institution Branch Count Total Market Deposits ($ 000) Total Market Share (%) 1 PNC Financial Services 515 70,806,498 24.2 2 M&T Bank Corp. 247 21,368,411 7..3 3 Bank of America 91 15,886,192 5.4 4 Royal Bank of Scotland 289 14,902,081 5.1 5 KeyCorp 98 12,538,370 4.3 6 F.N.B. Corporation 281 10,995,883 3.8 7 Wells Fargo & Co 124 10,776,383 3.7 8 Huntington 224 10,569,758 3.6 9 FirstMerit Corp. 104 6,941,093 2.4 10 TFS Financial 22 5,950,561 2.0 Total (1-233) 4,346 292,676,461 100.0 FNB holds the #3 overall retail market position for Pennsylvania counties of operation and #6 position for all counties |
![]() 17 Source: SNL Financial, deposit data as of June 30, 2013, pro-forma as of October 22, 2013, excludes custodial bank (Pittsburgh MSA). All Other MSA’s represent MSA’s with FNB presence excluding Pittsburgh, Cleveland and Baltimore MSA’s. Baltimore-Towson, MD MSA Rank Institution Total Deposits ($000) Market Share (%) 1 Bank of America Corp. 16,078,490 25.1 2 M&T Bank Corp. 14,292,887 22.3 3 PNC Financial Services Group Inc. 6,789,660 10.6 4 Wells Fargo & Co. 6,049,235 9.5 5 BB&T Corp. 3,909,353 6.1 6 SunTrust Banks Inc. 2,094,589 3.3 7 Susquehanna Bancshares Inc. 1,258,598 2.0 8 First Mariner Bancorp 1,109,454 1.7 9 Capital One Financial Corp. 976,432 1.5 10 F.N.B. Corporation 914,733 1.4 Cleveland-Elyria-Mentor, OH MSA Rank Institution Total Deposits ($000) Market Share (%) 1 KeyCorp 11,363,682 21.8 2 PNC Financial Services Group Inc. 6,382,510 12.2 3 TFS Financial Corp. (MHC) 5,425,587 10.4 4 Huntington Bancshares Inc. 4,261,126 8.2 5 Royal Bank of Scotland Group Plc 4,104,874 7.9 6 FirstMerit Corp. 3,522,009 6.8 7 Fifth Third Bancorp 3,384,743 6.5 8 JPMorgan Chase & Co. 2,939,452 5.6 9 U.S. Bancorp 2,032,321 3.9 10 Dollar Bank Federal Savings Bank 1,701,264 3.3 14 F.N.B. Corporation 623,947 1.2 Pittsburgh, PA MSA Rank Institution Total Deposits ($000) Market Share (%) 1 PNC Financial Services Group Inc. 47,062,720 56.5 2 Royal Bank of Scotland Group Plc 7,129,530 8.6 3 F.N.B. Corporation 3,867,847 4.6 4 Dollar Bank Federal Savings Bank 3,556,646 4.3 5 First Niagara Financial Group Inc. 2,762,262 3.3 6 Huntington Bancshares Inc. 2,512,422 3.0 7 First Commonwealth Financial Corp. 2,465,101 3.0 8 TriState Capital Holdings Inc. 1,940,243 2.3 9 S&T Bancorp Inc. 1,685,131 2.0 10 Northwest Bancshares Inc. 1,045,914 1.3 All Other FNB MSA's (excludes Pittsburgh, Baltimore, Cleveland) Rank Institution Total Deposits ($000) Market Share (%) 1 PNC Financial Services Group Inc. 11,180,309 11.7 2 M&T Bank Corp. 7,288,461 7.6 3 F.N.B. Corporation 5,175,196 5.4 4 Wells Fargo & Co. 4,861,113 5.1 5 Banco Santander SA 4,056,694 4.2 6 Huntington Bancshares Inc. 3,875,653 4.0 7 Royal Bank of Scotland Group Plc 3,667,677 3.8 8 FirstMerit Corp. 3,419,084 3.6 9 Susquehanna Bancshares Inc. 2,947,480 3.1 10 JPMorgan Chase & Co. 2,631,476 2.7 MSA Market Share - Proven Success, Opportunity For Growth Established MSA Markets – Proven Success, Leading Share Position Achieved Recent Expansion MSA Markets – Opportunity for Growth |
![]() ![]() Population Rank MSA (000's) #1 #2 #3 1 New York (1) 19,567 JPM BofA Citi 2 Los Angeles 12,829 BofA Wells Fargo Mitsubishi UFJ 3 Chicago 9,461 JPM BMO BofA 4 Dallas 6,426 BofA JPM Wells Fargo 5 Philadelphia 5,965 BofA Capital One TD 6 Houston 5,920 JPM Wells Fargo BofA 7 Washington (1) 5,636 Wells Fargo Capital One BofA 8 Miami 5,565 Wells Fargo BofA Citi 9 Atlanta 5,287 SunTrust Wells Fargo BofA 10 Boston (1) 4,552 BofA RBS Banco Santander 11 San Francisco 4,335 BofA Wells Fargo Citi 12 Detroit 4,296 JPM Comerica BofA 13 Riverside 4,225 BofA Wells Fargo JPM 14 Phoenix 4,193 JPM Wells Fargo BofA 15 Seattle 3,440 BofA Wells Fargo U.S. Bancorp 16 Minneapolis 3,349 Wells Fargo U.S. Bancorp TCF 17 San Diego 3,095 Wells Fargo Mitsubishi UFJ BofA 18 St. Louis (1) 2,788 U.S. Bancorp BofA Commerce 19 Tampa (1) 2,783 BofA Wells Fargo SunTrust 20 Baltimore 2,710 BofA M&T PNC 21 Denver 2,543 Wells Fargo JPM FirstBank 22 Pittsburgh (1) 2,356 PNC RBS 23 Portland 2,226 BofA U.S. Bancorp Wells Fargo 24 Charlotte 2,217 BofA Wells Fargo BB&T 25 Sacramento 2,149 Wells Fargo BofA U.S. Bancorp Top 3 Banks in MSA by Deposit Market Share Unique #3 Position in a Major Market 18 Source: MSA population per U.S. Census Bureau 2010 data; Deposit market share per SNL Financial as of June 30, 2013, pro-forma as of October 22, 2013 (1) Excludes custodial bank F.N.B. Corporation FNB is uniquely positioned as one of only very few community banks to hold a Top 3 deposit market rank in one of the nation’s 25 largest metropolitan statistical areas. |
![]() Significant Commercial Prospects 19 Note: Above metrics at the MSA level (1) Data per U.S. Census Bureau (2) Data per Hoover’s as of October 21, 2013 Significant Commercial Prospects Concentrated in Pittsburgh, Baltimore & Cleveland Opportunity to Leverage Core Competency and Drive Sustained Organic Growth (1) (2) Strong Concentration of Commercial Prospects Over 175,000 Total Businesses (1) 1,904 1,987 2,094 8,857 9,621 10,106 12,851 13,345 13,410 52,149 59,240 65,169 Youngstown MSA Scranton MSA Harrisburg MSA Cleveland MSA Pittsburgh MSA Baltimore MSA # of Business with Revenue >$1M Total Businesses |
![]() 20 Acquisition Strategy Disciplined and Consistent Strategy Significant Expansion Enhanced Organic Growth Prospects |
![]() Acquisition Strategy 21 Disciplined and Consistent Acquisition Strategy Strategy Disciplined identification and focus on markets that offer potential to leverage core competencies and growth opportunities Criteria Create shareholder value Meet strategic vision Fit culturally Evaluation Targeted financial and capital recoupment hurdles Proficient and experienced due diligence team Extensive and detailed due diligence process Execution Superior post-acquisition execution Execute FNB’s proven, scalable, business model Proven success assimilating FNB’s strong sales culture Experienced Acquirer 12th bank acquisition since 2002 announced June 2013 (BCSB) Fourth consecutive acquisition in a major MSA Five acquisitions since 2010 Ten acquisitions since 2005 Execution Execution Criteria Criteria Evaluation Evaluation Strategy Strategy |
![]() 22 Baltimore, MD MSA Annapolis Bancorp, Inc - Closed April 6, 2013 BCSB Bancorp, Inc. - Target close February, 2014 Talent established Team and leadership in place Presence anchored Downtown Baltimore headquarters announced Performance tracking well Loan production on target, pipelines healthy Sales management processes fully deployed Cleveland, Ohio MSA PVF Capital Corp. – Closed October 12, 2013 Team and leadership in place Downtown Cleveland headquarters announced Sales management process deployed BCSB Locations FNB Locations (including ANNB) PVFC Locations Continued Positive Progress Integrating Acquisitions Team and Leadership Established Regional Headquarters in Both Markets Announced Results Tracking Well Cleveland Baltimore Pittsburgh Performance goals established Presence anchored Talent established Recent Acquisitions – Positioning for Sustained Organic Growth |
![]() Expanded Franchise = Enhanced Organic Growth Prospects 23 Note: Market population and market businesses represent current metrics based on respective FNB MSA presence Data per FNB, SNL Financial and/or U.S. Census Bureau (Businesses) Acquisition- Related Expansion in Higher Growth Markets Enhances Organic Growth Opportunities In Millions |
![]() 24 Strong Operating Results 3Q13 Highlights and Trends |
![]() 3Q13 Financial Highlights – Quarterly Trends 25 Current Quarter 3Q13 Prior Quarter 2Q13 Prior Year Quarter 3Q12 Operating Earnings (1) Net income ($ millions) $32.2 $30.1 $29.9 Earnings per diluted share $0.22 $0.21 $0.21 Profitability Performance ROTE (1) 18.33% 17.33% 18.57% ROTA (1) 1.12% 1.08% 1.12% Net interest margin 3.64% 3.63% 3.70% Efficiency ratio 59.7% 58.6% 57.4% Strong Balance Sheet Trends (2) Total loan growth 9.3% 5.6% 4.7% Commercial loan growth 4.2% 5.8% 5.0% Consumer loan growth 25.3% 11.8% 12.0% Transaction deposits and customer repo growth (3) 7.0% 7.4% 8.7% (1) Non-GAAP measure, refer to Appendix for GAAP to Non-GAAP Reconciliation details; (2) Average, annualized linked quarter organic growth results. Organic growth results exclude balances acquired in the ANNB acquisition 2Q13; (3) Total deposits excluding time deposits |
![]() Balance Sheet Highlights 26 Average Balances, $ in Millions 3Q13 Linked-Quarter Growth (1) 3Q13 Highlights Balance $ % Securities $2,275 -$20.7 -3.6% Strong balance sheet growth, with continued momentum growing loans and transaction deposits Growth in average total loans of $200.2 million or 9.3% annualized Growth in average transaction deposits and customer repurchase agreements of $138.6 million or 7.0% annualized Transaction deposit growth further enhanced attractive deposit mix Total loans $8,730 $200.2 9.3% Commercial loans $4,783 $49.6 4.2% Consumer loans (2) $2,860 $171.5 25.3% Residential mortgage loans $1,043 -$22.2 -8.3% Earning assets $11,048 $161.6 5.9% Total deposits and customer repos $10,403 $68.9 2.6% Transaction deposits and customer repos (3) $8,011 $138.6 7.0% Time deposits $2,392 -$69.7 -11.2% (1) % growth annualized; (2) Includes Direct Installment, Indirect Installment and Consumer LOC portfolios; (3) Excludes time deposits; (4) Period-end as of September 30, 2013 Growth driven by strong growth in average non-interest bearing deposits of $131.8 million or 27.5% annualized Lower cost, relationship-based transaction deposits and customer repurchase agreements represent 78% of total deposits and customer repurchase agreements compared to 74% at September 30, 2012 (4) |
![]() Net Interest Margin Trends 27 Net Interest Margin Trends Relatively stable core net interest margin The net interest margin has benefited from the consistent growth in loans and transaction deposits Active net interest management through Pricing Committee and Asset/Liability Committee effective through focused efforts on managing interest rate risk strategy and margin preservation 3Q13 net interest income (FTE) totaled $101.0 million, growing $2.5 million, or 2.6%, linked quarter, and $5.7 million, or 5.9%, compared to the prior year quarter 3.64% 3.63% 3.66% 3.66% 3.70% 2.00% 2.25% 2.50% 2.75% 3.00% 3.25% 3.50% 3.75% 4.00% 3Q13 2Q13 1Q13 4Q12 3Q12 Core Net Interest Margin Accretable Yield Benefit |
![]() Asset Quality Results (1) 28 $ in Thousands 3Q13 2Q13 3Q12 3Q13 Highlights NPL’s+OREO/Total loans+OREO 1.49% 1.59% 1.69% Total delinquency 1.44% 1.44% 1.66% Provision for loan losses (2) $7,280 $7,903 $8,429 Net charge-offs (NCO’s) (2) $5,507 $7,325 $7,362 NCO’s/Total average loans (2) 0.25% 0.34% 0.37% NCO’s/Total average originated loans 0.26% 0.33% 0.42% Allowance for loan losses/ Total loans 1.34% 1.35% 1.43% Allowance for loan losses/ Total non-performing loans 127.37% 121.68% 120.23% Solid performance with metrics remaining at good, consistent levels Net charge-offs very low at 0.26% annualized for the originated portfolio Provision for loan losses of $7.3 million exceeds net charge-offs in support of the strong loan growth Reserve position consistent with prior quarter levels NPL’s+OREO/Total loans +OREO improved from the prior quarter and the year-ago quarter Delinquency remained stable compared to the prior quarter and improved from the year-ago quarter (1) Metrics shown are originated portfolio metrics unless noted as a total portfolio metric. “Originated portfolio” or “Originated loans” excludes loans acquired at fair value and accounted for in accordance with ASC 805 (effective January 1, 2009), as the risk of credit loss has been considered by virtue of the Corporation’s estimate of fair value. (2) Total portfolio metric |
![]() Asset Quality Trends 29 NCO’s Originated Loans/ Total Originated Loans (1)(3) NPL’s+OREO/ Total Originated Loans+OREO (1)(2) Asset Quality Trends Compare Favorably to Peer Results 2.74% 2.15% 1.60% 1.59% 1.59% 1.49% 0.00% 0.50% 1.00% 1.50% 2.00% 2.50% 3.00% 3.50% 4.00% 2010 2011 2012 1Q13 2Q13 3Q13 FNB Peer Group Median 0.77% 0.62% 0.41% 0.27% 0.00% 0.20% 0.40% 0.60% 0.80% 1.00% 1.20% FY 2010 FY 2011 FY 2012 YTD 2013 FNB Peer Group Median Peer data per SNL Financial, refer to Appendix for peer listing; (1) Metrics shown are originated portfolio. “Originated portfolio” or “Originated loans” excludes loans acquired at fair value and accounted for in accordance with ASC 805 (effective January 1, 2009), as the risk of credit loss has been considered by virtue of the Corporation’s estimate of fair value; (2) Based on balances at quarter end for each period presented; (3) Full year or quarterly results annualized. |
![]() Capital Position 30 Capital Position as of September 30, 2013 (1) (1) Regulatory risked-based ratios estimated as of September 30, 2013. 12.1% 10.6% 8.4% 6.1% 12.1% 10.6% 8.4% 6.1% 0.0% 2.0% 4.0% 6.0% 8.0% 10.0% 12.0% 14.0% Total Risk-Based Tier One Leverage Tangible Common Equity June 30, 2013 September 30, 2013 |
![]() 31 Investment Thesis Long-Term Investment Thesis |
![]() Long-Term Investment Thesis - Return Focused 32 Long-Term Investment Thesis Targeted EPS Growth 5-6% Targeted Dividend Yield (Targeted Payout Ratio 60-70%) 4-6% Implied Total Shareholder Return 9-12% FNB’s long-term investment thesis reflects a commitment to efficient capital management and creating value for our shareholders |
![]() Operating Results Outperform Peers 33 ROTE (1) Efficiency Ratio Net Interest Margin Net Charge Offs to Average Loans - The above represents full-year 2010, 2011, 2012 and/or quarterly, year-to-date results where noted. Refer to Supplemental Information for peer group listing. (1) Operating results, refer to Supplemental Information for details |
![]() Consistent Operating Results 34 FNB = 85% Percentile FNB = 94% Percentile Data per FNB and/or SNL Financial Refer to Supplemental Information for peer listing FNB’s ability to deliver consistent operating results exceeds peer results 0.00% 0.05% 0.10% 0.15% 0.20% 0.25% 2013 Peer Median FNB ROAA Volatility 0.000% 0.005% 0.010% 0.015% 0.020% 0.025% 0.030% 0.035% 0.040% 0.045% 0.050% 2013 Peer Median FNB Revenue/Avg Assets Volatility FNB and Peer Volatility (Standard Deviation 1Q10 – 3Q13) |
![]() Attractive P/E Valuation Highlights Potential Upside Market data per SNL Financial as of November 1, 2013. Refer to Supplemental Information for regional peer listing. 35 Consistent premium to peers based on price to tangible book value per share FNB currently reflects an attractive valuation based on future earnings 0.00x 0.50x 1.00x 1.50x 2.00x 2.50x 3.00x 3.50x 4.00x 11/01/10 11/01/11 11/01/12 11/01/13 FNB 2013 Group Peer Median 14.54x 15.36x 13.00x 13.50x 14.00x 14.50x 15.00x 15.50x FNB 2013 Peer Median Historical Price / TBV Per Share (x) Price / 2014 EPS Estimate (x) |
![]() 36 Transaction Overview Successfully raised $151.2 million through a combination of common equity (4.7 million shares, $54.5 million net proceeds, including over-allotment option exercised) and preferred equity (4.0 million shares, $96.7 million net proceeds). Proactive Capital Management Action Supports future growth opportunities and proactively positions F.N.B. for Basel III implementation , including the redemption of certain trust preferred securities Demonstrated track record of robust loan growth (17 consecutive quarters of organic growth) Positions FNB to redeem $131.5mm of existing trust preferred securities at a weighted average cost of 4.33%² and potential repayment of BCSB’s $16.5mm of trust preferred securities upon anticipated closing of pending acquisition Adds $151mm of fully Basel III-compliant capital to support future balance sheet growth Strengthens/improves quality of capital under Basel III; Tier 1 common improves ~50bps to 9.1% Current rate environment presented opportunity to access permanent capital at historically attractive levels Use of proceeds consistent with FNB’s proactive and efficient capital management strategy Reported and Pro-Forma Capital Ratios as of September 30, 2013³ 12.1% 12.2% Total risk-based capital Tier 1 leverage TCE / TA 8.4% 8.5% 6.1% 6.5% Tier 1 : 10.6% Tier 1 : 10.7% Tier 1 common Non- common Tier 1 Tier 2 8.6% 9.1% 2.0% 1.6% 1.5% 1.5% As Reported Pro forma As Reported Pro forma As Reported Pro forma ¹Under Basel III Final rules, if a depository institution holding company under $15 billion makes an acquisition and the resulting organization has total consolidated assets of $15 billion or more, its non- qualifying capital instruments also will be subject to the phase-out schedule (25% includable in Tier 1 in 2015 and 0% includable in Tier 1 in 2016); ² Weighted average cost of redeemed trust preferred securities assumes 3 month LIBOR of 0.24%; ³ Pro forma capital ratios do not include impacts from PVF Capital and BCSB transactions; capital ratios shown on a Basel I basis October 2013 Capital Actions – Proactive Capital Management 1 |
![]() 37 Supplemental Information |
![]() 38 Supplemental Information Index Diversified Loan Portfolio Deposits and Customer Repurchase Agreements Investment Portfolio Loan Risk Profile Marcellus and Utica Shale Exposure Regency Finance Company Profile Regional Peer Group Listing GAAP to Non-GAAP Reconciliation Third Quarter 2013 Earnings Release (October 17, 2013) |
![]() Diversified Loan Portfolio 39 Note: Balance, CAGR and % of Portfolio based on period-end balances 9/30/2013 CAGR % of Portfolio ($ in millions) Balance 12/08- 9/30/13 12/31/08 9/30/13 C&I $1,755 13.9% 16% 20% CRE: Non-Owner Occupied 1,555 11.4% 16% 17% CRE: Owner Occupied 1,317 5.9% 17% 15% Commercial Leases 142 32.7% 1% 2% Total Commercial $4,769 10.9% 50% 54% Consumer Home Equity 2,042 11.6% 21% 23% Residential Mortgage 987 12.0% 10% 11% Indirect 624 4.4% 9% 7% Other 192 4.5% 3% 2% Regency 175 2.2% 2% 2% Florida 49 -31.4% 5% <1% Total Loan Portfolio $8,837 9.2% 100% 100% Well diversified portfolio Strong growth results driven by commercial loan growth $8.8 Billion Loan Portfolio September 30, 2013 C&I + Owner Occupied CRE = 35% of Total Loan Portfolio Commercial & Industrial 20% Consumer Home Equity 23% Residential Mortgage 11% Other 2% Regency 2% Florida 0% Commercial Leases 2% CRE: Non Owner Occupied 17% CRE: Owner Occupied 15% Indirect 7% |
![]() Deposits and Customer Repurchase Agreements 40 Note: Balance, CAGR and % of Portfolio based on period-end balances; (1) Transaction deposits include savings, NOW, MMDA and non-interest bearing deposits; (2) December 31, 2008 through September 30, 2013 9/30/2013 CAGR Mix % ($ in millions) Balance 12/08- 9/13 12/31/08 9/30/13 Savings, NOW, MMDA $4,981 12.8% 44% 47% Time Deposits 2,360 0.4% 36% 22% Non-Interest Bearing 2,116 19.2% 14% 20% Customer Repos 1,101 22.8% 6% 11% Total Deposits and Customer Repo Agreements $10,558 10.9% 100% 100% Transaction Deposits (1) and Customer Repo Agreements $8,198 15.4% 64% 78% Loans to Deposits and Customer Repo Agreements Ratio = 84% at September 30, 2013 New client acquisition and relationship-based focus reflected in favorable deposit mix – 15.4% average growth for transaction deposits and customer repo agreements (2) – 78% of total deposits and customer repo agreements are transaction-based deposits (1) $10.6 Billion Deposits and Customer Repo Agreements September 30, 2013 Non-Interest Bearing 20% Savings, NOW, MMDA 47% Customer Repos 11% Time Deposits 22% |
![]() % Ratings ($ in millions (1) ) Portfolio Investment % Agency MBS $878 37% AAA 100% CMO Agency 831 35% AAA 100% Agency Senior Notes 376 16% AAA 100% Municipals 153 7% AAA AA A BBB 2% 50% 47% 1% Trust Preferred (2) 35 1% BBB BB B CCC Ca C 5% 13% 12% 8% 2% 60% Short Term 49 2% AAA 100% CMO Private Label 9 1% AA A BBB BB 23% 12% 34% 31% Corporate 10 1% A 100% Bank Stocks 2 - Non-Rated Commercial MBS 2 - AAA 100% US Treasury 1 - AAA 100% Total Investment Portfolio $2,346 100% Investment Portfolio 41 (1) Amounts reflect GAAP; (2) Original cost of $ 104 million, adjusted cost of $43 million, fair value of $35 million Highly Rated $2.3 Billion Investment Portfolio September 30, 2013 Ratings Composition AAA, 91.2% AA, 3.3% A, 3.5% BBB,BB,B Non- Rated Available for Sale, 49% Held to Maturity, 51% CCC,CC,Ca,C 2% – Highly rated with an average rating of AA and 99% of the portfolio rated A or better – General obligation bonds = 99.0% of portfolio – 78.0% from municipalities located throughout Pennsylvania Relatively low duration of 3.4 Portfolio comprised of 49% AFS and 51% HTM Municipal bond portfolio 95% of total portfolio rated AA or better, 98% rated A or better |
![]() 42 Loan Risk Profile (1) Originated portfolio metric $ in millions Balance 9/30/2013 % of Loans NPL's/Loans (1) YTD Net Charge- Offs/Loans (1) Total Past Due/Loans (1) Commercial and Industrial $1,755 19.9% 0.48% 0.22% 0.75% CRE: Non-Owner Occupied 1,555 17.6% 1.04% 0.24% 1.25% CRE: Owner Occupied 1,317 14.9% 2.02% 0.08% 2.32% Home Equity and Other Consumer 2,181 24.7% 0.48% 0.20% 0.88% Residential Mortgage 987 11.2% 1.22% 0.11% 2.63% Indirect Consumer 624 7.1% 0.16% 0.35% 1.00% Regency Finance 175 2.0% 4.09% 3.72% 3.75% Commercial Leases 142 1.6% 0.55% 0.16% 1.14% Florida 49 0.6% 22.14% -2.17% 22.14% Other 53 0.6% 0.00% 2.31% 0.11% Total $8,837 100.0% 1.05% 0.27% 1.44% |
![]() Marcellus and Utica Shale Exposure 43 (1) Sources: www.marcellus.psu.edu, retrieved May 3, 2013; (2) www.dnr.state.oh.us, retrieved June 5, 2013; (3) Sterne Agee June 7, 2010 and FBR Capital Markets, March 2, 2011. Ohio FNB PA/OH Banking Locations Pennsylvania Ohio FNB is well-positioned in the Marcellus Shale and Utica Shale regions with a Pennsylvania footprint that closely aligns with the Marcellus Shale concentration and exposure to the Utica Shale region in Ohio. FNB has been noted by analysts as being one of the best geographically positioned banks to benefit from the Marcellus Shale. (3) Ohio Utica Shale (2) FNB branch map per SNL Financial |
![]() Marcellus and Utica Shale FNB Strategic Focus 44 Opportunity for FNB relates to potential indirect and induced economic benefits across footprint Direct Effect: Oil and Gas Directly associated with the extraction, processing and delivery of the gas Drilling, extraction and support activities Indirect Effect: Supply Chain Provides goods and services to the energy industry e.g.: Iron and steel, transportation, commodity traders, heavy equipment, surveyors, utilities, rig parts, attorneys, real estate, machinery manufacturers, etc. Induced Benefit: Consumption Resulting benefit to industries and individuals from positive direct and indirect effects e.g.: Higher education, travel, housing, food and drink, entertainment, utilities, etc. FNB Strategic Focus: Supply Chain and Consumption |
![]() Consumer finance business with over 80 years of consumer lending experience Credit quality: 3Q13 YTD net charge-offs to average loans of 3.71% Returns: 3Q13 YTD: ROA 3.89%, ROE 42.00%, ROTE 47.16% Regency Finance Company Profile (1) Return on average tangible common equity (ROTCE) is calculated by dividing net income less amortization of intangibles by average common equity less average intangibles. 45 72 Locations Spanning Four States Regency Finance Company $175 Million Loan Portfolio 86% of Real Estate Loans are First Mortgages 60% 26% 14% Direct Real Estate Sales Finance Ohio Kentucky Tennessee Pennsylvania |
![]() Regional Peer Group Listing 46 Ticker Institution Ticker Institution ASBC Associated Bancorp ONB Old National Bancorp AF Astoria Financial Corporation PVTB Private Bancorp, Inc. CBSH Commerce Bancshares, Inc. SUSQ Susquehanna Bancshares, Inc. FMER First Merit Corp. UMBF UMB Financial Corp. FULT Fulton Financial Corporation VLY Valley National Bancorp MBFI MB Financial, Inc WBS Webster Financial Corporation NPBC National Penn Bancshares, Inc. WTFC Wintrust Financial Corporation |
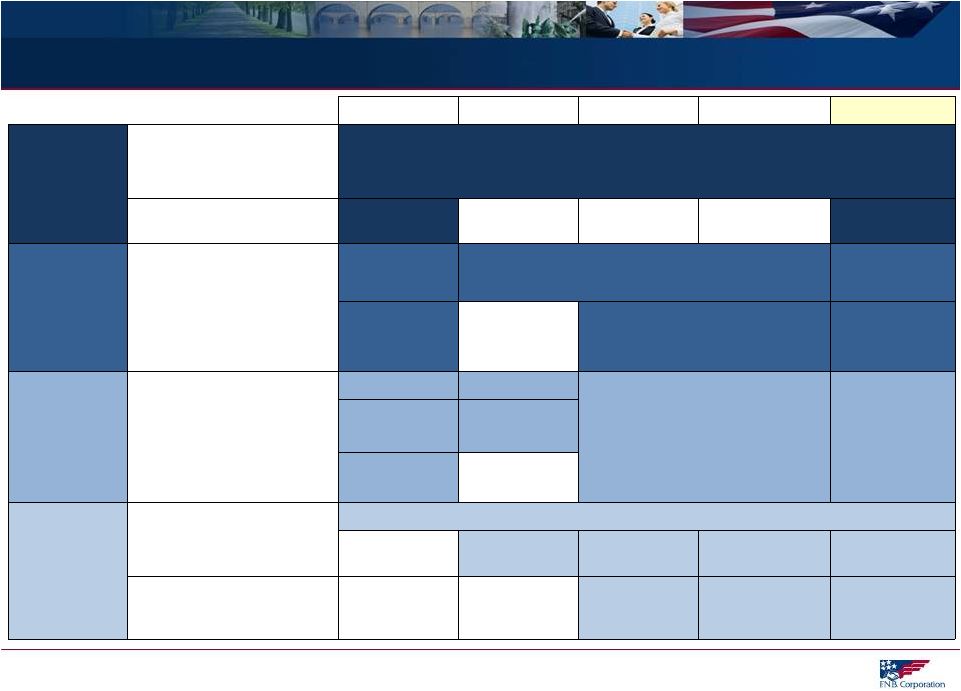
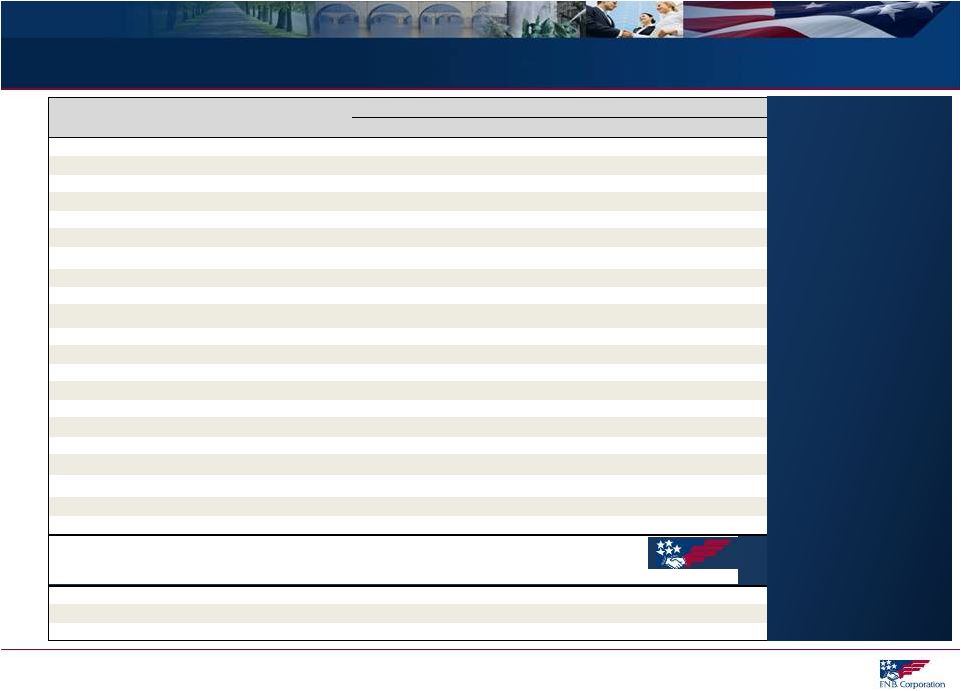
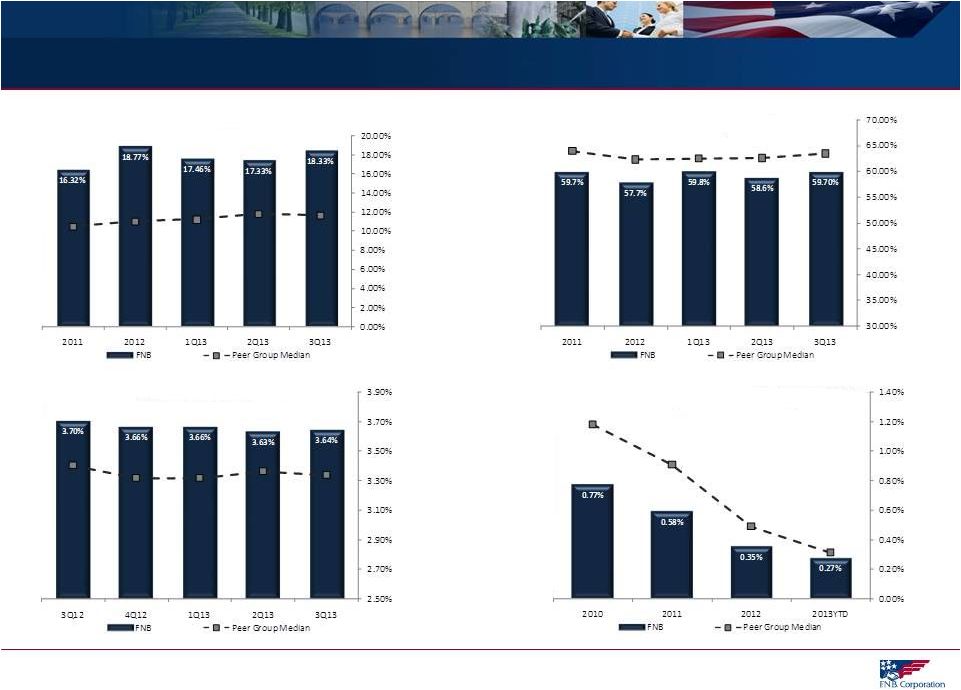
![]() GAAP to Non-GAAP Reconciliation 47 Operating: Earnings, Return on Avg Tangible Equity, Return on Avg Tangible Assets September 30, 2013 June 30, 2013 March 31, 2013 September 30, 2012 2012 2011 2010 Operating net income Net income $31,634 $29,193 $28,538 $30,743 $110,410 $87,047 $74,652 Add: Merger and severance costs, net of tax 593 1,915 229 57 5,203 3,238 402 Add: Litigation settlement accrual, net of tax - - - - 1,950 - - Add: Branch consolidation costs, net of tax - - - - 1,214 - - Less: Gain on extinguishment of debt, net of tax - (1,013) - - - - - Less: Gain on sale of building, net of tax - - - (942) (942) - - Less: One-time pension expense credit - - - - - - (6,853) Operating net income $32,227 $30,095 $28,767 $29,858 $117,835 $90,285 $68,201 Operating diluted earnings per share Diluted earnings per share $0.22 $0.20 $0.20 $0.22 $0.79 $0.70 $0.65 Add: Merger and severance costs, net of tax 0.00 0.02 0.00 0.00 0.04 0.02 0.00 Add: Litigation settlement accrual, net of tax - - - - 0.01 - - Add: Branch consolidation costs, net of tax - - - - 0.01 - - Less: Gain on extinguishment of debt, net of tax - (0.01) - - - - - Less: Gain on sale of building - - - (0.01) (0.01) - - Less: One-time pension expense credit - - - - - - (0.05) Operating diluted earnings per share $0.22 $0.21 $0.20 $0.21 $0.84 $0.72 $0.60 Operating return on average tangible equity Operating net income (annualized) $127,858 $120,706 $116,668 $118,784 $117,835 $90,285 $68,201 Amortization of intangibles, net of tax (annualized) 5,455 5,538 5,237 5,798 5,938 4,698 4,364 $133,313 $126,244 $121,904 $124,582 $123,773 $94,983 $72,565 Average shareholders' equity $1,475,751 $1,473,945 $1,410,827 $1,385,282 $1,376,493 $1,181,941 $1,057,732 Less: Average intangible assets 748,592 745,458 712,466 714,501 717,031 599,851 564,448 Average tangible equity $727,159 $728,487 $698,361 $670,781 $659,462 $582,089 $493,284 Operating return on average tangible equity 18.33% 17.33% 17.46% 18.57% 18.77% 16.32% 14.71% Operating return on average tangible assets Operating net income (annualized) $127,858 $120,706 $116,668 $118,784 $117,834 $90,285 $68,201 Amortization of intangibles, net of tax (annualized) 5,455 5,538 5,237 5,798 5,938 4,698 4,364 $133,313 $126,244 $121,904 $124,582 $123,772 $94,983 $72,565 Average total assets $12,615,338 $12,470,029 $12,004,759 $11,842,204 $11,782,821 $9,871,164 $8,906,734 Less: Average intangible assets 748,592 745,458 712,466 714,501 717,031 599,851 564,448 Average tangible assets 11,866,746 $ 11,724,570 $ 11,292,292 $ 11,127,704 $ 11,065,789 $ 9,271,313 $ 8,342,286 $ Operating return on average tangible assets 1.12% 1.08% 1.08% 1.12% 1.12% 1.02% 0.87% For the Quarter Ended For the Year Ended |