F.N.B. Corporation Investor Presentation Keefe, Bruyette & Woods – Boston Bank Conference February 26, 2014 Exhibit 99.1 |
Cautionary Statement Regarding Forward-Looking Information and Non-GAAP Financial Information 2 This presentation and the reports F.N.B. Corporation files with the Securities and Exchange Commission often contain “forward-looking statements” relating to present or future trends or factors affecting the banking industry and, specifically, the financial operations, markets and products of F.N.B. Corporation. These forward-looking statements involve certain risks and uncertainties. There are a number of important factors that could cause F.N.B. Corporation’s future results to differ materially from historical performance or projected performance. These factors include, but are not limited to: (1) a significant increase in competitive pressures among financial institutions; (2) changes in the interest rate environment that may reduce interest margins; (3) changes in prepayment speeds, loan sale volumes, charge-offs and loan loss provisions; (4) general economic conditions; (5) various monetary and fiscal policies and regulations of the U.S. government that may adversely affect the businesses in which F.N.B. Corporation is engaged; (6) technological issues which may adversely affect F.N.B. Corporation’s financial operations or customers; (7) changes in the securities markets; (8) risk factors mentioned in the reports and registration statements F.N.B. Corporation files with the Securities and Exchange Commission; (9) housing prices; (10) job market; (11) consumer confidence and spending habits; (12) estimates of fair value of certain F.N.B. Corporation assets and liabilities; (13) integration challenges related to the recently completed mergers with BCSB Bancorp, Inc. and PVF Capital Corp. and the difficulties encountered in expanding into a new market; (14) the effects of current, pending and future legislation, regulation and regulatory actions, or (15) the impact on federal regulated agencies that have oversight or review of F.N.B. Corporation’s business and securities activities. F.N.B. Corporation undertakes no obligation to revise these forward-looking statements or to reflect events or circumstances after the date of this presentation. To supplement its consolidated financial statements presented in accordance with Generally Accepted Accounting Principles (GAAP), the Corporation provides additional measures of operating results, net income and earnings per share (EPS) adjusted to exclude certain costs, expenses, and gains and losses. The Corporation believes that these non-GAAP financial measures are appropriate to enhance the understanding of its past performance as well as prospects for its future performance. In the event of such a disclosure or release, the Securities and Exchange Commission’s Regulation G requires: (i) the presentation of the most directly comparable financial measure calculated and presented in accordance with GAAP and (ii) a reconciliation of the differences between the non-GAAP financial measure presented and the most directly comparable financial measure calculated and presented in accordance with GAAP. The Appendix to this presentation contains non-GAAP financial measures used by the Corporation to provide information useful to investors in understanding the Corporation's operating performance and trends, and facilitate comparisons with the performance of the Corporation's peers. While the Corporation believes that these non-GAAP financial measures are useful in evaluating the Corporation, the information should be considered supplemental in nature and not as a substitute for or superior to the relevant financial information prepared in accordance with GAAP. The non-GAAP financial measures used by the Corporation may differ from the non-GAAP financial measures other financial institutions use to measure their results of operations. This information should be reviewed in conjunction with the Corporation’s financial results disclosed on January 21, 2014 and in its periodic filings with the Securities and Exchange Commission. |
3 F.N.B. Corporation About F.N.B. Corporation Experienced Leadership Team Favorably Positioned for Long-Term Success Strong Operating Trends |
About F.N.B. Corporation 4 • Assets: $14.2 billion (1) • Loans: $9.8 billion (1) • Deposits: $11.6 billion (1) • Banking locations: 282 (1) • Consumer finance locations: 72 Fourth Largest Pennsylvania-Based Bank • Attractive and expanding footprint: PA/OH/MD/WV: Banking locations span 56 counties and four states (1) • Leading market position (2) • #3 market share in the Pittsburgh MSA • #10 market share in the Baltimore MSA • #6 overall market position for all counties of operation Positioned for Sustained Growth • Top quartile profitability performance • Deliver consistent, solid results • Industry-leading, consistent loan growth through recent economic cycle • Strong performance: 3-year total shareholder return of 30% (3) Consistent, Strong Operating Results • Reposition and reinvest for sustained growth; maintain low risk profile • Reposition and reinvest for sustained growth • Maintain disciplined expense control • Expanding market share potential and growth opportunities • Maintain low-risk profile Operating Strategy (1) Pro-forma for the recently completed acquisition of BCSB Bancorp, which closed on February 15, 2014, with assets of approximately $0.6 billion, loans of $0.3 billion, deposits of $0.5 billion and 16 banking locations; (2) SNL Financial, excludes custodian bank; (3) As of February 11, 2014 |
Years of Banking Experience Joined FNB Prior Experience President and CEO Vincent J. Delie, Jr. 27 2005 National City President, First National Bank John C. Williams, Jr. 43 2008 Huntington National City Mellon Bank Chief Financial Officer Vincent J. Calabrese, Jr. 26 2007 People’s United Chief Credit Officer Gary L. Guerrieri 28 2002 FNB Promistar Experienced Leadership Team 5 Experienced and respected executive management team has guided FNB through the cycle |
High-Quality Earnings – 2013 Highlights Operating ROATCE of 17.35% - continued top decile performance relative to peers Record net income Record loan production of $3.3 billion, increasing 11% over the prior year Organic growth in total loans for 18 consecutive quarters at an average annualized rate of 5% Continued enhancements to funding mix with transaction deposits and customer repos representing 76% of total deposits and customer repos at December 31, 2013 Solid and consistent asset quality results - provision for loan losses continued to exceed net charge-offs to support loan growth Consistent loan and low-cost deposit growth supports stability in the net interest margin Full-year efficiency ratio of 58.9% Expanded Footprint and Growth Potential Recent acquisitions in dynamic markets enhance organic growth opportunities Repositioned and Enhanced Delivery Channel Full suite of online and mobile banking products, 46k customers currently enrolled, with continued growth expected Branch optimization strategy has resulted in 52 consolidations and 9 de-novo expansions since 2010 Significant Talent Acquisition Leadership and team build-outs over past several years in existing markets Leadership and team build in expansion markets essentially complete Sales Management Process and Culture Developed and implemented proprietary systems, processes and strong culture over the past several years Deployed across FNB business units Consistent Investments in Enterprise-Wide Risk Management Infrastructure Well-positioned to continue successfully navigating regulatory environment Recent Capital Actions Strengthen Capital Structure, Support Growth Objectives and Address Basel III Provisions Favorably Positioned for Long-Term Success 6 |
High-Quality Earnings 7 (1) At respective period-end. FNB levels represents allowance for loan losses to total originated loans. Peer data per SNL Financial. FNB Continues to Deliver High-Quality Earnings Provision for Loan Losses as % of Net Charge-Offs ($) FNB provision for loan losses exceeds net charge-offs to support consistent, solid loan growth results Allowance for Loan Losses/Total Loans (%) (1) FNB allowance for loan losses to total loans (originated portfolio) has remained relatively stable 126% 133% 134% 113% 57% 56% 66% 44% FY 2013 9/30/2013 YTD 6/30/2013 YTD 2012 FNB Peer Group Median |
Full Year Financial Highlights – Annual Trends 8 2013 2012 2011 2010 Quality Operating Earnings Net income available to common shareholders ($ millions) $123.5 $117.8 $90.3 $68.2 Earnings per diluted common share $0.84 $0.84 $0.72 $0.60 Profitability Performance ROTCE (1) 17.35% 18.75% 16.32% 14.71% ROTA (1) 1.09% 1.12% 1.02% 0.87% Net interest margin 3.65% 3.73% 3.79% 3.77% Efficiency ratio 58.9% 58.3% 59.7% 60.7% Strong Balance Sheet Organic Growth Trends Total loan growth 6.3% 4.3% 5.2% 2.5% Commercial loan growth 7.1% 5.4% 5.8% 3.5% Consumer loan growth excluding Residential 12.8% 7.4% 4.4% 2.2% Transaction deposits and customer repo growth 7.9% 9.6% 8.0% 11.2% (1) Non-GAAP measure, refer to Appendix for GAAP to Non-GAAP Reconciliation details; (2) Full year average organic growth results. Organic growth results exclude balances acquired in the following acquisitions; PVFC 4Q13, ANNB 2Q13, PVSA 1Q12, CB&T 1Q11 (3) Total deposits excluding time deposits (1) (3) (2) |
Annual Earnings Trends 9 (1) On an operating basis, a Non-GAAP measure, refer to Appendix for GAAP to Non-GAAP Reconciliation for details; (2) $, in millions; (3) Consists of wealth management, trust, brokerage and insurance units. Full Year Net Income and EPS Trends (1) Solid earnings growth trajectory muted in 2013 by headwinds $68.2 $90.3 $117.8 $123.5 $0.60 $0.72 $0.84 $0.84 $- $- $20.0 $40.0 $60.0 $80.0 $100.0 $120.0 $140.0 Net Income Available to Common Shareholders Earnings per Diluted Common Share (1) Earnings Benefit of Full Year of 2013 Accomplishments: Full-year average organic loan growth of 6.3% 18 consecutive quarters of linked-quarter growth Record loan production of $3.3 billion Full-year average organic transaction deposit and customer repurchase agreement growth of 7.9% Organic growth in average non-interest bearing deposits of 16.9% Wealth Group (3) revenue totaled $45 million, increasing 11%, compared to 2012 Relatively stable net interest margin and solid asset quality Branch optimization continued Consolidated additional 7 locations, 3 de-novo expansions; bringing total consolidations to 52 since 2010 and de-novo expansions to 9 locations Mobile and online banking strategy solidified Three acquisitions, expanded into two additional dynamic metropolitan markets, Baltimore, Maryland and Cleveland, Ohio Strengthened capital structure under Basel III rules Initial year of Durbin-related and other revenue loss, and increased regulatory-related costs negatively impact 2013 earnings by an estimated $0.05 per diluted common share (1)(2) Muted by 2013 Regulatory-Related Headwinds: |
Consistent Loan and Transaction Deposit Growth 10 (1) Organic balances exclude initial respective balances acquired upon transaction close for PVFC (10/2013), ANNB (4/2013), PVSA (1/2012) and CBT (1/2011) Consistent Growth in Loans and Transaction Deposits Loans (Quarterly, In Billions) Transaction Deposits and Customer Repos (Quarterly, In Billions) $8.5 $7.4 $5.8 $5.2 $6.7 $6.3 $5.5 4Q13 4Q12 4Q11 4Q10 Total Organic $9.3 $8.0 $6.8 $6.0 $7.3 $6.7 $6.4 4Q13 4Q12 4Q11 4Q10 Total Organic CAGR 4Q10 – 4Q13 Total 18.1% Organic (1) 9.1% CAGR 4Q10 – 4Q13 Total 15.6% Organic (1) 6.4% |
Transaction Deposit Growth - Strengthened Funding Mix 11 (1) Based on period-end balances Consistent Transaction Deposit Growth Results in Strengthened Deposit Mix Total Transaction Deposits and Customer Repos Mix Transaction deposits and customer repos = 76% of total deposits and customer repos at 12/31/2013 Strong growth in non-interest bearing deposits of $461.9 million, or 26.6%, resulted in strengthened funding mix compared to prior year-end 2013 12/31/2013 12/31/2012 12/31/2011 12/31/2010 Transaction Deposits and Customer Repos Time Deposits |
Reposition and Reinvest – Actions Drive Long-Term Performance 12 2009 2010 2011 2012 2013 PEOPLE Talent Management Strengthened team through key hires; Continuous team development Attract, retain, develop best talent Geographic Segmentation Regional model Regional Realignment Created 5 th & 6 th Regions PROCESS Sales Management/Cross Sell Proprietary sales management system developed and implemented: Balanced scorecards, cross-functional alignment Consumer Banking Scorecards Consumer Banking Refinement/Daily Monitoring Continued Utilization Commercial Banking Sales Management Expansion to additional lines of business Private Banking, Insurance, Wealth Management PRODUCT Product Development Deepened product set and niche areas allow FNB to successfully compete with larger banks and gain share Private Banking Capital Markets Online and mobile banking investment /implementation – Online banking enhancements, mobile banking and app Online/mobile banking infrastructure complete with mobile remote deposit capture and online budgeting tools Asset Based Lending Small Business Realignment Treasury Management PRODUCTIVITY Branch Optimization Continuous evolution of branch network to optimize profitability and growth prospects De-Novo Expansion 9 Locations Consolidate 2 Locations Consolidate 6 Locations Consolidate 37 Locations Consolidate 7 Locations Acquisitions Opportunistically expand presence in attractive markets CB&T Parkvale ANNB Closed 4/13 PVFC Closed 10/13 BCSB Closed 2/14 |
Market Position Top Overall Market Position Regional Alignment Presence in Major Markets Acquisition-Related Expansion Strengthens Position 13 |
Top Overall Market Position 14 Source: SNL Financial, deposit data as of June 30, 2013, pro-forma as of February 10, 2014, excludes custodial bank. FNB Pennsylvania Counties of Operation Rank Institution Branch Count Total Market Deposits ($ 000) Total Market Share (%) 1 PNC Financial Services 290 55,855,363 35.3 2 Royal Bank of Scotland 201 10,073,477 6.4 3 F.N.B. Corporation 223 8,884,922 5.6 4 M&T Bank Corp. 141 7,393,569 4.7 5 Wells Fargo & Co. 64 4,905,156 3.1 6 First Commonwealth 99 4,225,821 2.7 7 Banco Santander 72 4,056,694 2.6 8 Dollar Bank 37 3,556,646 2.2 9 Susquehanna Bancshares 79 3,105,908 2.0 10 First Niagara Financial 73 3,060,621 1.9 Total (1-135) 2,432 158,109,555 100.0 FNB All Counties of Operation Rank Institution Branch Count Total Market Deposits ($ 000) Total Market Share (%) 1 PNC Financial Services 501 70,806,498 24.2 2 M&T Bank Corp. 246 21,368,411 7..3 3 Bank of America 90 15,886,192 5.4 4 Royal Bank of Scotland 288 14,902,081 5.1 5 KeyCorp 98 12,538,370 4.3 6 F.N.B. Corporation 282 10,995,883 3.8 7 Wells Fargo & Co 122 10,776,383 3.7 8 Huntington 222 10,569,758 3.6 9 FirstMerit Corp. 98 6,941,093 2.4 10 TFS Financial 22 5,950,561 2.0 Total (1-242) 4,309 292,676,461 100.0 FNB holds the #3 overall retail market position for Pennsylvania counties of operation and #6 position for all counties |
FNB’s model utilizes six regions, including three in top 30 MSA markets, with each having a regional headquarters housing cross-functional teams. FNB Banking Footprint - Regional Alignment 15 Source: SNL Financial Baltimore MSA Pittsburgh MSA Cleveland MSA PVFC Completed October 2013 ANNB Completed April 2013 & BCSB Completed February 2014 Top 30 MSA Presence MSA Population Baltimore, MD 2.7 million #20 MSA Pittsburgh, PA 2.4 million #22 MSA Cleveland, OH 2.1 million #29 MSA |
MSA Market Share - Proven Success, Opportunity For Growth 16 Source: SNL Financial, deposit data as of June 30, 2013, pro-forma as of February 11, 2014, excludes custodial bank (Pittsburgh MSA). All Other MSAs represent MSA’s with FNB presence excluding Pittsburgh, Cleveland and Baltimore MSAs. Established MSA Markets – Proven Success, Leading Share Position Achieved Recent Expansion MSA Markets – Opportunity for Growth Pittsburgh, PA MSA Rank Institution Total Deposits ($000) Market Share (%) 1 PNC Financial Services Group Inc. 47,062,720 56.5 2 Royal Bank of Scotland Group Plc 7,129,530 8.6 3 F.N.B. Corp. 3,867,847 4.6 4 Dollar Bank Federal Savings Bank 3,556,646 4.3 5 First Niagara Financial Group Inc. 2,762,262 3.3 6 Huntington Bancshares Inc. 2,512,422 3.0 7 First Commonwealth Financial Corp. 2,465,101 3.0 8 TriState Capital Holdings Inc. 1,940,243 2.3 9 S&T Bancorp Inc. 1,685,131 2.0 10 Northwest Bancshares Inc. 1,045,914 1.3 Baltimore-Towson, MD MSA Rank Institution Total Deposits ($000) Market Share (%) 1 Bank of America Corp. 16,078,490 25.1 2 M&T Bank Corp. 14,292,887 22.3 3 PNC Financial Services Group Inc. 6,789,660 10.6 4 Wells Fargo & Co. 6,049,235 9.5 5 BB&T Corp. 3,909,353 6.1 6 SunTrust Banks Inc. 2,094,589 3.3 7 Susquehanna Bancshares Inc. 1,258,598 2.0 8 First Mariner Bancorp 1,109,454 1.7 9 Capital One Financial Corp. 976,432 1.5 10 F.N.B. Corp. 914,733 1.4 Cleveland-Elyria-Mentor, OH MSA Rank Institution Total Deposits ($000) Market Share (%) 1 KeyCorp 11,363,682 21.8 2 PNC Financial Services Group Inc. 6,382,510 12.2 3 TFS Financial Corp. (MHC) 5,425,587 10.4 4 Huntington Bancshares Inc. 4,261,126 8.2 5 Royal Bank of Scotland Group Plc 4,104,874 7.9 6 FirstMerit Corp. 3,522,009 6.8 7 Fifth Third Bancorp 3,384,743 6.5 8 JPMorgan Chase & Co. 2,939,452 5.6 9 U.S. Bancorp 2,032,321 3.9 10 Dollar Bank Federal Savings Bank 1,701,264 3.3 14 F.N.B. Corp. 623,947 1.2 All Other FNB MSA's (excludes Pittsburgh, Baltimore, Cleveland) Rank Institution Total Deposits ($000) Market Share (%) 1 PNC Financial Services Group Inc. 11,180,309 11.7 2 M&T Bank Corp. 7,288,461 7.6 3 F.N.B. Corp. 5,175,196 5.4 4 Wells Fargo & Co. 4,861,113 5.1 5 Banco Santander SA 4,056,694 4.2 6 Huntington Bancshares Inc. 3,875,653 4.0 7 Royal Bank of Scotland Group Plc 3,667,677 3.8 8 FirstMerit Corp. 3,419,084 3.6 9 Susquehanna Bancshares Inc. 2,947,480 3.1 10 JPMorgan Chase & Co. 2,631,476 2.7 |
Acquisition Strategy 17 Disciplined and Consistent Acquisition Strategy Strategy Disciplined identification and focus on markets that offer potential to leverage core competencies and growth opportunities Criteria Create shareholder value Meet strategic vision Fit culturally Evaluation Targeted financial and capital recoupment hurdles Proficient and experienced due diligence team Extensive and detailed due diligence process Execution Superior post-acquisition execution Execute FNB’s proven, scalable, business model Proven success assimilating FNB’s strong sales culture 12th bank acquisition since 2002 closed February 2014 (BCSB) Fourth consecutive acquisition in a major MSA Five acquisitions since 2010 Ten acquisitions since 2005 Execution Criteria Evaluation Strategy Experienced Acquirer |
Recent Acquisitions – Positioning for Sustained Organic Growth 18 Baltimore, MD MSA Annapolis Bancorp, Inc - Closed April 6, 2013 BCSB Bancorp, Inc. – Closed February 15, 2014 Talent established Team and leadership in place Presence anchored Downtown Baltimore headquarters Performance tracking well Loan production on target, pipelines healthy Sales management processes fully deployed Cleveland, Ohio MSA PVF Capital Corp. – Closed October 12, 2013 Team and leadership in place Downtown Cleveland headquarters Loan production on target, pipelines healthy Sales management process deployed FNB Locations (including ANNB) Continued Success Integrating Acquisitions Team and Leadership Established Regional Headquarters in Both Markets Results Tracking Well BCSB Locations PVFC Locations Presence anchored Performance goals established Talent established |
Significant Commercial Prospects 19 Note: Above metrics at the MSA level (1) Data per U.S. Census Bureau (2) Data per Hoover’s as of February 7, 2014 Strong Concentration of Commercial Prospects Over 175,000 Total Businesses (1) Significant Commercial Prospects Concentrated in Pittsburgh, Baltimore & Cleveland Opportunity to Leverage Core Competency and Drive Sustained Organic Growth |
Expanded Franchise = Enhanced Organic Growth Prospects 20 Note: Market population and market businesses represent current metrics based on respective FNB MSA presence Data per FNB, SNL Financial and/or U.S. Census Bureau (Businesses) Acquisition- Related Expansion in Higher Growth Markets Enhances Organic Growth Opportunities |
21 Strong Operating Results 4Q13 Highlights and Trends |
4Q13 Financial Highlights 22 Solid Operating Results and Strategic Accomplishments Operating Result Highlights Return on average tangible assets of 1.07% (1) Return on average tangible common equity of 16.45% (1) Net interest margin of 3.67%, expanded 3 basis points Efficiency ratio of 58% Linked-quarter operating leverage; revenue growth of 5.6% compared to the prior quarter Absorbed second quarter of Durbin impact of $2.7 million (pre-tax) Total average organic loan growth of $129.4 million or 5.9% annualized Transaction deposit and customer repurchase agreement average organic growth of $137.7 million or 6.8% annualized Primarily driven by growth in non-interest bearing deposits and customer repurchase agreements Non-performing loans and OREO to total originated loans and OREO improved 5 basis points 1.44% Total delinquency for the originated portfolio improved 16 basis points to 1.28% Strategic Accomplishments (1) Operating results, a non-GAAP measure, refer to Appendix for GAAP to Non-GAAP Reconciliation details 4Q13 operating (1) net income available to common shareholders of $32.5 million; earnings per diluted common share of $0.21 Solid profitability performance and continued high-quality earnings Strong balance sheet growth Continued good asset quality results Secured an investment grade rating from Moody’s Investor’s Services on October 3, 2013 Completed the PVF Capital Corp. (PVFC) acquisition on October 12, 2013 Completed a capital offering in late October 2013, raising $161.3 million in net proceeds, strengthening capital structure under Basel III and enhancing ability to execute organic growth strategy |
4Q13 Financial Highlights – Quarterly Trends 23 Current Quarter 4Q13 Prior Quarter 3Q13 Prior Year Quarter 4Q12 Operating Earnings (1) Net income available to common shareholders ($ millions) $32.5 $32.2 $32.1 Earnings per diluted common share $0.21 $0.22 $0.23 Profitability Performance ROTCE (1) 16.45% 18.32% 19.49% ROTA (1) 1.07% 1.12% 1.18% Net interest margin 3.67% 3.64% 3.66% Efficiency ratio 57.8% 59.7% 55.4% Strong Balance Sheet Organic Growth Trends (2) Total loan growth 5.9% 9.3% 6.0% Commercial loan growth 4.4% 4.2% 7.6% Consumer loan growth 13.8% 25.3% 11.7% Transaction deposits and customer repo growth (3) 6.8% 7.0% 11.9% (1) Non-GAAP measure, refer to Appendix for GAAP to Non-GAAP Reconciliation details; (2) Average, annualized linked quarter organic growth results. Organic growth results exclude balances acquired in the PVFC acquisition (4Q13); (3) Total deposits excluding time deposits |
Balance Sheet Highlights 24 (1) Linked-quarter growth, organic growth % is annualized and excludes balances acquired from the PVFC acquisition completed October 12, 2013; (2) Includes Direct Installment, Indirect Installment and Consumer LOC portfolios; (3) Excludes time deposits; (4) Period-end as of December 31, 2013 Average Balances, $ in Millions 4Q13 Reported Growth (1) Organic Growth (1) 4Q13 Highlights Balance $ $ % Securities $2,316 $40.3 - - Strong balance sheet growth, with continued momentum organically growing loans and transaction deposits Total reported growth reflects the benefit from the completion of the PVFC acquisition on October 12, 2013 Organic growth in average total loans of $129.4 million or 5.9% annualized Organic growth in average transaction deposits and customer repurchase agreements of $137.7 million or 6.8% annualized Lower cost, relationship-based transaction deposits and customer repurchase agreements represent 76% of total transaction deposits and customer repurchase agreements (4) Total loans $9,323 $592.7 $129.4 5.9% Commercial loans $5,154 $370.5 $52.6 4.4% Consumer loans (2) $3,039 $179.3 $99.6 13.8% Residential mortgage loans $1,085 $42.1 -$23.5 -8.9% Earning assets $11,775 $726.9 - - Total deposits and customer repos $11,113 $710.5 $71.3 2.7% Transaction deposits and customer repos (3) $8,504 $493.0 $137.7 6.8% Time deposits $2,609 $217.5 -$66.3 -11.0% |
Net Interest Margin Trends 25 Net Interest Margin Trends The 4Q13 net interest margin was stable compared to the prior quarter when adjusting for: The benefit of 6 basis points from $1.7 million additional accretable yield which was partially offset by, The 3 basis points narrowing due to the temporary increase in short-term interest bearing cash balances from the capital raise. 4Q13 net interest income (FTE) totaled $108.7 million, growing $7.6 million, or 7.5%, linked quarter, and $12.9 million, or 13.5%, compared to the prior year quarter |
Asset Quality Results (1) 26 $ in Thousands 4Q13 3Q13 4Q12 4Q13 Highlights NPL’s+OREO/Total loans+OREO 1.44% 1.49% 1.60% Total delinquency 1.28% 1.44% 1.64% Provision for loan losses (2) $8,366 $7,280 $9,274 Net charge-offs (NCO’s) (2) $7,364 $5,507 $7,614 NCO’s/Total average loans (2) 0.32% 0.25% 0.38% NCO’s/Total average originated loans 0.30% 0.26% 0.45% Allowance for loan losses/ Total loans 1.29% 1.34% 1.39% Allowance for loan losses/ Total non-performing loans 135.42% 127.37% 123.88% Solid performance with continued positive movement Net charge-off results were at good levels and reflect year-over-year improvement Total provision continues to exceed net- charge-offs Reserve position reflects favorable credit migration in the portfolio, pay-downs and improved non-performing loan levels NPL’s+OREO/Total loans +OREO improved from the prior quarter and the year-ago quarter Delinquency improved compared to the prior quarter and the year-ago quarter (1) Metrics shown are originated portfolio metrics unless noted as a total portfolio metric. “Originated portfolio” or “Originated loans” excludes loans acquired at fair value and accounted for in accordance with ASC 805 (effective January 1, 2009), as the risk of credit loss has been considered by virtue of the Corporation’s estimate of fair value. (2) Total portfolio metric |
Asset Quality Trends 27 Asset Quality Trending Positively and Compares Favorably to Peer Results NPL’s+OREO/ Total Originated Loans+OREO (1)(2) NCO’s Originated Loans/ Total Originated Loans (1)(3) Peer data per SNL Financial, refer to Appendix for peer listing; (1) Metrics shown are originated portfolio. “Originated portfolio” or “Originated loans” excludes loans acquired at fair value and accounted for in accordance with ASC 805 (effective January 1, 2009), as the risk of credit loss has been considered by virtue of the Corporation’s estimate of fair value; (2) Based on balances at quarter end for each period presented; (3) Full year or quarterly results annualized. |
Capital Position 28 Capital Position as of December 31, 2013 12.1% 10.6% 8.6% 8.4% 6.1% 12.5% 11.1% 9.3% 8.8% 6.7% Total Risk-Based Tier One Tier One Common Leverage Tangible Common Equity September 30, 2013 December 31, 2013 Capital levels at December 31, 2013 reflect the benefit of the fourth quarter of 2013 capital actions. Raised $161.3 million in net proceeds through the issuance of 4.7 million shares of common stock ($54.4 million in proceeds) and 4.4 million depository shares of non-cumulative perpetual preferred stock ($106.9 million in net proceeds). Redeemed $115 million in trust preferred securities, with an additional $16.5 million expected to be redeemed in the first quarter of 2014. Capital structure strengthened under Basel III rules, with trust preferred securities representing 7% of Tier 1 capital at December 31, 2013 compared to 19% at September 30, 2013. Tier 1 common ratio improves to 9.3% and the tangible common equity improves to 6.7% at December 31, 2013. |
29 Investment Thesis Long-Term Investment Thesis |
Long-Term Investment Thesis - Return Focused 30 FNB’s long-term investment thesis reflects a commitment to efficient capital management and creating value for our shareholders Long-Term Investment Thesis Targeted EPS Growth 5-6% Targeted Dividend Yield (Targeted Payout Ratio 60-70%) 4-6% Implied Total Shareholder Return 9-12% |
Operating Results Outperform Peers 31 The above represents full-year 2011, 2012, 2013 and/or quarterly, year-to-date results where noted. Refer to Supplemental Information for peer group listing. (1) Operating results, refer to Supplemental Information for details 0.00% 2.00% 4.00% 6.00% 8.00% 10.00% 12.00% 14.00% 16.00% 18.00% 20.00% 2013 2012 2011 ROTCE (1) FNB Peer Group Median 30.0% 35.0% 40.0% 45.0% 50.0% 55.0% 60.0% 65.0% 70.0% 4Q13 3Q13 2Q13 1Q13 2013 2012 2011 Efficiency Ratio FNB Peer Group Median 2.50% 2.70% 2.90% 3.10% 3.30% 3.50% 3.70% 3.90% 4Q13 3Q13 2Q13 1Q13 4Q12 Net Interest Margin FNB Peer Group Median 0.00% 0.10% 0.20% 0.30% 0.40% 0.50% 0.60% 0.70% 0.80% 0.90% 1.00% 2013 2012 2011 Net Charge-Offs to Average Loans FNB Peer Group Median |
Consistent Operating Results 32 FNB = 87% Percentile FNB = 89% Percentile Data per FNB and/or SNL Financial Refer to Supplemental Information for peer listing FNB’s ability to deliver consistent operating results exceeds peer results 0.00% 0.05% 0.10% 0.15% 0.20% 0.25% 2013 Peer Median FNB ROAA Volatility 0.000% 0.010% 0.020% 0.030% 0.040% 0.050% 0.060% 2013 Peer Median FNB Revenue/Avg Assets Volatility FNB and Peer Volatility (Standard Deviation 1Q10 – 4Q13) |
Attractive P/E Valuation Highlights Potential Upside 33 Consistent premium to peers based on price to tangible book value per share FNB currently reflects an attractive valuation based on future earnings 12.73x 14.11x 8.00x 9.00x 10.00x 11.00x 12.00x 13.00x 14.00x 15.00x FNB 2013 Peer Median 0.00x 0.50x 1.00x 1.50x 2.00x 2.50x 3.00x 3.50x 4.00x 02/10/11 02/10/12 02/10/13 02/10/14 FNB 2013 Group Peer Median Historical Price / TBV Per Share (x) Price / 2015 EPS Estimate (x) Market data per SNL Financial as of February 11, 2014. Refer to Supplemental Information for regional peer listing. |
34 Supplemental Information |
35 Supplemental Information Index Diversified Loan Portfolio Deposits and Customer Repurchase Agreements Investment Portfolio Loan Risk Profile Regency Finance Company Profile Regional Peer Group Listing GAAP to Non-GAAP Reconciliation |
Diversified Loan Portfolio 36 Note: Balance, CAGR and % of Portfolio based on period-end balances 12/31/2013 5 YR CAGR % of Portfolio ($ in millions) Balance 12/31/08- 12/31/13 12/31/08 12/31/13 C&I $1,881 14.7% 16% 20% CRE: Non-Owner Occupied 1,809 14.2% 16% 19% CRE: Owner Occupied 1,397 6.9% 17% 15% Commercial Leases 159 33.9% 1% 1% Total Commercial $5,246 12.5% 50% 55% Consumer Home Equity 2,170 12.4% 21% 23% Residential Mortgage 1,043 12.6% 10% 11% Indirect 642 4.8% 9% 7% Other 186 3.6% 3% 2% Regency 180 2.6% 2% 2% Florida 39 -33.2% 5% <1% Total Loan Portfolio $9,506 10.3% 100% 100% Well diversified portfolio Strong growth results driven by commercial loan growth $9.5 Billion Loan Portfolio December 31, 2013 C&I + Owner Occupied CRE = 35% of Total Loan Portfolio Other 2% Regency 2% Florida 0% Commercial Leases 1% Commercial & Industrial 20% Consumer Home Equity 23% Residential Mortgage 11% Indirect 7% CRE: Non Owner Occupied 19% CRE: Owner Occupied 15% - |
Deposits and Customer Repurchase Agreements 37 Note: Balance, CAGR and % of Portfolio based on period-end balances; (1) Transaction deposits include savings, NOW, MMDA and non-interest bearing deposits; (2) December 31, 2008 through December 31, 2013 12/31/2013 5 YR CAGR Mix % ($ in millions) Balance 12/31/08- 12/31/13 12/31/08 12/31/13 Savings, NOW, MMDA $5,142 12.8% 44% 47% Time Deposits 2,606 2.4% 36% 23% Non-Interest Bearing 2,200 19.1% 14% 20% Customer Repos 1,092 21.4% 6% 10% Total Deposits and Customer Repo Agreements $11,040 11.3% 100% 100% Transaction Deposits (1) and Customer Repo Agreements $8,434 15.2% 64% 76% Loans to Deposits and Customer Repo Agreements Ratio = 86% at December 31, 2013 New client acquisition and relationship-based focus reflected in favorable deposit mix – 15.2% average growth for transaction deposits and customer repo agreements (2) – 76% of total deposits and customer repo agreements are transaction-based deposits (1) $11.0 Billion Deposits and Customer Repo Agreements December 31, 2013 |
Investment Portfolio 38 (1) Amounts reflect GAAP; (2) Original cost of $ 104 million, adjusted cost of $44 million, fair value of $38 million Highly Rated $2.4 Billion Investment Portfolio December 31, 2013 Ratings Composition % Ratings ($ in millions (1) ) Portfolio Investment % Agency MBS $880 37% AAA 100% CMO Agency 877 37% AAA 100% Agency Senior Notes 374 16% AAA 100% Municipals 149 6% AAA AA A BBB 11% 53% 35% 1% Trust Preferred (2) 38 2% BBB BB B CCC Ca C 4% 12% 12% 8% 2% 62% Short Term 16 1% AAA 100% CMO Private Label 9 <1% AA A BBB BB 31% 23% 12% 34% Corporate 10 <1% A BBB 51% 49% Bank Stocks 2 - Non-Rated Commercial MBS 2 - AAA 100% US Treasury 1 - AAA 100% Total Investment Portfolio $2,358 100% 95% of total portfolio rated AA or better, 98% rated A or better Relatively low duration of 3.3 Portfolio comprised of 49% AFS and 51% HTM Municipal bond portfolio Highly rated with an average rating of AA and 99% of the portfolio rated A or better General obligation bonds = 98.9% of portfolio 79.0% from municipalities located throughout Pennsylvania |
39 Loan Risk Profile (1) Originated portfolio metric $ in millions Balance 12/31/2013 % of Loans NPL's/Loans (1) YTD Net Charge- Offs/Loans (1) Total Past Due/Loans (1) Commercial and Industrial $1,881 19.8% 0.38% 0.13% 0.49% CRE: Non-Owner Occupied 1,809 19.0% 0.80% 0.20% 0.90% CRE: Owner Occupied 1,397 14.7% 1.92% 0.09% 2.06% Home Equity and Other Consumer 2,311 24.3% 0.46% 0.21% 0.76% Residential Mortgage 1,043 11.0% 1.35% 0.18% 2.84% Indirect Consumer 642 6.8% 0.17% 0.37% 1.10% Regency Finance 180 1.9% 3.94% 3.74% 3.53% Commercial Leases 159 1.7% 0.46% 0.18% 0.91% Florida 39 0.4% 24.07% 0.75% 24.07% Other 45 0.5% 0.00% 2.27% 0.08% Total $9,506 100.0% 0.95% 0.28% 1.28% |
Consumer finance business with over 80 years of consumer lending experience Credit quality: 2013 Full Year net charge-offs to average loans of 3.74% Returns: 2013 Full Year: ROA 3.98%, ROE 42.64%, ROTE 47.79% Regency Finance Company Profile (1) Return on average tangible common equity (ROTCE) is calculated by dividing net income less amortization of intangibles by average common equity less average intangibles. 40 Regency Finance Company $180 Million Loan Portfolio 85% of Real Estate Loans are First Mortgages 61% 24% 15% Direct Real Estate Sales Finance Ohio Pennsylvania Kentucky 72 Locations Spanning Four States Tennessee |
Regional Peer Group Listing 41 Ticker Institution Ticker Institution ASBC Associated Bancorp ONB Old National Bancorp AF Astoria Financial Corporation PVTB Private Bancorp, Inc. CBSH Commerce Bancshares, Inc. SUSQ Susquehanna Bancshares, Inc. FMER First Merit Corp. UMBF UMB Financial Corp. FULT Fulton Financial Corporation VLY Valley National Bancorp MBFI MB Financial, Inc WBS Webster Financial Corporation NPBC National Penn Bancshares, Inc. WTFC Wintrust Financial Corporation |
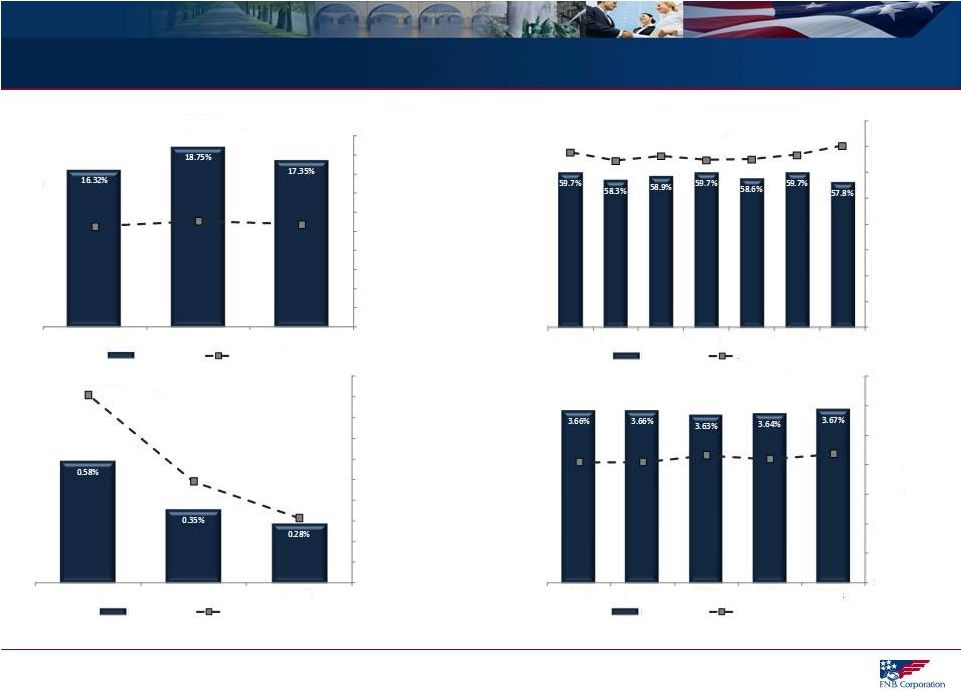
GAAP to Non-GAAP Reconciliation 42 Quarterly and Full Year Non-GAAP Reconciliation December 31, 2013 September 30, 2013 December 31, 2012 2013 2012 2011 2010 Operating net income Net income $28,439 $31,634 $28,955 $117,804 $110,410 $87,047 $74,652 Add: Merger and severance costs, net of tax 2,599 593 (3) 5,336 5,203 3,238 402 Add: Litigation settlement accrual, net of tax - - 1,950 - 1,950 - - Add: Branch consolidation costs, net of tax - - 1,214 - 1,214 - - Add: Debt redemption costs, net of tax 1,412 - - 1,412 - - - Less: Gain on extinguishment of debt, net of tax - - - (1,013) - - - Less: Gain on sale of building, net of tax - - - - (942) - - Less: One-time pension expense credit, next of tax - - - - - - (6,853) Operating net income $32,450 $32,228 $32,116 $123,540 $117,835 $90,285 $68,201 Operating diluted earnings per share Diluted earnings per share $0.18 $0.22 $0.21 $0.80 $0.79 $0.70 $0.65 Add: Merger and severance costs, net of tax 0.02 0.00 (0.00) 0.04 0.04 0.02 0.00 Add: Litigation settlement accrual, net of tax - - 0.01 - 0.01 - - Add: Branch consolidation costs, net of tax - - 0.01 - 0.01 - - Add: Debt redemption costs, net of tax 0.01 - - 0.01 - - - Less: Gain on extinguishment of debt, net of tax - - - (0.01) - - - Less: Gain on sale of building, net of tax - - - - (0.01) - - Less: One-time pension expense credit, next of tax - - - - - - (0.05) Operating diluted earnings per share $0.21 $0.22 $0.23 $0.84 $0.84 $0.72 $0.60 Operating return on average tangible common equity Operating net income (annualized) $128,744 $127,859 $127,763 $123,539 $117,835 $90,285 $68,201 Amortization of intangibles, net of tax (annualized) 6,045 5,330 5,645 5,465 5,801 4,698 4,364 $134,789 $133,189 $133,408 $129,004 $123,635 $94,983 $72,565 Average shareholders' common equity $1,623,543 $1,475,751 $1,400,429 $1,496,544 $1,376,493 $1,181,941 $1,057,732 Less: Average intangible assets 804,098 748,592 715,962 752,894 717,031 599,851 564,448 Average tangible common equity $819,446 $727,159 $684,467 $743,651 $659,462 $582,089 $493,284 Operating return on average tangible common equity 16.45% 18.32% 19.49% 17.35% 18.75% 16.32% 14.71% Operating return on average tangible assets Operating net income (annualized) $128,744 $127,859 $127,763 $123,539 $117,835 $90,285 $68,201 Amortization of intangibles, net of tax (annualized) 6,045 5,330 5,645 5,465 5,801 4,698 4,364 $134,789 $133,189 $133,408 $129,004 $123,635 $94,983 $72,565 Average total assets $13,456,936 $12,615,338 $11,988,283 $12,640,685 $11,782,821 $9,871,164 $8,906,734 Less: Average intangible assets 804,098 748,592 715,962 752,894 717,031 599,851 564,448 Average tangible assets 12,652,838 $ 11,866,746 $ 11,272,320 $ 11,887,792 $ 11,065,789 $ 9,271,313 $ 8,342,286 $ Operating return on average tangible assets 1.07% 1.12% 1.18% 1.09% 1.12% 1.02% 0.87% For the Quarter Ended Year Ended December 31, |