Filed by F.N.B. Corporation
Pursuant to Rule 425 under the Securities Act of 1933
and deemed filed pursuant to Rule 14a-12 of the Securities Exchange Act of 1934
Subject Company: OBA Financial Services, Inc.
(Commission File No. 01-34593)
The portions of the F.N.B. Corporation Investor Presentation – First Quarter 2014, dated May 14, 2014, which relate to the proposed merger between F.N.B. Corporation and OBA Financial Services, Inc., are furnished below.
Cautionary Statement Regarding Forward-Looking Information
The presentation and the reports F.N.B. Corporation files with the Securities and Exchange Commission often contain “forward-looking statements” relating to present or future trends or factors affecting the banking industry and, specifically, the financial operations, markets and products of F.N.B. Corporation. These forward-looking statements involve certain risks and uncertainties. There are a number of important factors that could cause F.N.B. Corporation’s future results to differ materially from historical performance or projected performance. These factors include, but are not limited to: (1) a significant increase in competitive pressures among financial institutions; (2) changes in the interest rate environment that may reduce interest margins; (3) changes in prepayment speeds, loan sale volumes, charge-offs and loan loss provisions; (4) general economic conditions; (5) various monetary and fiscal policies and regulations of the U.S. government that may adversely affect the businesses in which F.N.B. Corporation is engaged; (6) technological issues which may adversely affect F.N.B. Corporation’s financial operations or customers; (7) changes in the securities markets; (8) risk factors mentioned in the reports and registration statements F.N.B. Corporation files with the Securities and Exchange Commission; (9) housing prices; (10) job market; (11) consumer confidence and spending habits; (12) estimates of fair value of certain F.N.B. Corporation assets and liabilities; (13) transaction risks associated with the pending merger of OBA Financial Services Inc., and integration challenges related to the completed mergers with BCSB Bancorp, Inc., PVF Capital Corp. and Annapolis Bancorp, Inc. and the difficulties encountered in expanding into a new market; (14) the effects of current, pending and future legislation, regulation and regulatory actions, or (15) the impact on federal regulated agencies that have oversight or review of F.N.B. Corporation’s business and securities activities. F.N.B. Corporation undertakes no obligation to revise these forward-looking statements or to reflect events or circumstances after the date of this presentation.
Additional Information About the Merger and Where to Find It
In connection with the merger, F.N.B. Corporation will file with the SEC a Registration Statement on Form S-4 that will include a Proxy Statement of OBA Financial Services, Inc. and a Prospectus of F.N.B., as well as other relevant documents concerning the proposed transaction.
SHAREHOLDERS OF OBA FINANCIAL SERVICES, INC. ARE URGED TO READ THE REGISTRATION STATEMENT AND THE PROXY STATEMENT/PROSPECTUS REGARDING THE MERGER WHEN IT BECOMES AVAILABLE AND ANY OTHER RELEVANT DOCUMENTS FILED WITH THE SEC, AS WELL AS ANY AMENDMENTS OR SUPPLEMENTS TO THOSE DOCUMENTS, BECAUSE THEY WILL CONTAIN IMPORTANT INFORMATION.
The proxy statement/prospectus and other relevant materials (when they become available), and any other documents F.N.B. and OBA have filed with the SEC, may be obtained free of charge at the SEC’s internet site, http://www.sec.gov. Copies of the documents F.N.B. has filed with the SEC may be obtained, free of charge, by contacting James G. Orie, Chief Legal Officer, F.N.B. Corporation, One F.N.B. Boulevard, Hermitage, PA 16148, telephone: (724) 983-3317; and copies of the documents OBA has filed with the SEC may be obtained by contacting Charles E. Weller, President and Chief Executive Officer, OBA Financial Services, Inc., 20300 Seneca Meadows Parkway, Germantown, MD 20876, telephone: (301) 916-0742.
F.N.B. and OBA and certain of their directors and executive officers may be deemed to be participants in the solicitation of proxies from the shareholders of OBA in connection with the merger. Information concerning such participants’ ownership of OBA common stock will be set forth in the Proxy Statement/Prospectus regarding the merger when it becomes available. This communication does not constitute an offer of any securities for sale.
 About F.N.B. Corporation 5 (1) Pro-forma for the pending acquisition of OBA Financial Services, Inc., which is expected to close in 3Q14, with assets of approximately $0.4 billion, loans of $0.3 billion, deposits of $0.3 billion and 6 banking locations; (2) SNL Financial, excludes custodian bank • Assets: $14.9 billion (1) • Loans: $10.2 billion (1) • Deposits: $12.2 billion (1) • Banking locations: 289 (1) • Market Capitalization: $2.1 billion • Attractive and expanding footprint: PA/OH/MD/WV: Banking locations span 57 counties and four states (1) • Presence in three major metropolitan markets (2) • #3 market share in the Pittsburgh, Pennsylvania MSA • #10 market share in the Baltimore, Maryland MSA • #14 market share in the Cleveland, Ohio MSA • Solid profitability performance • Consistent, high-quality results • Industry-leading, consistent loan growth • Solid shareholder returns • Position for sustained growth; maintain low risk profile • Reposition and reinvest in the franchise • Maintain disciplined expense control • Expand market share potential and growth opportunities • Maintain low-risk profile High-Quality, Growing Regional Financial Institution Positioned for Sustained Growth Consistent, Strong Operating Results Operating Strategy |
 Market Position Strong Market Position Regional Alignment Presence in Major Markets Acquisition-Related Expansion Enhances Organic Growth Opportunities 14 |
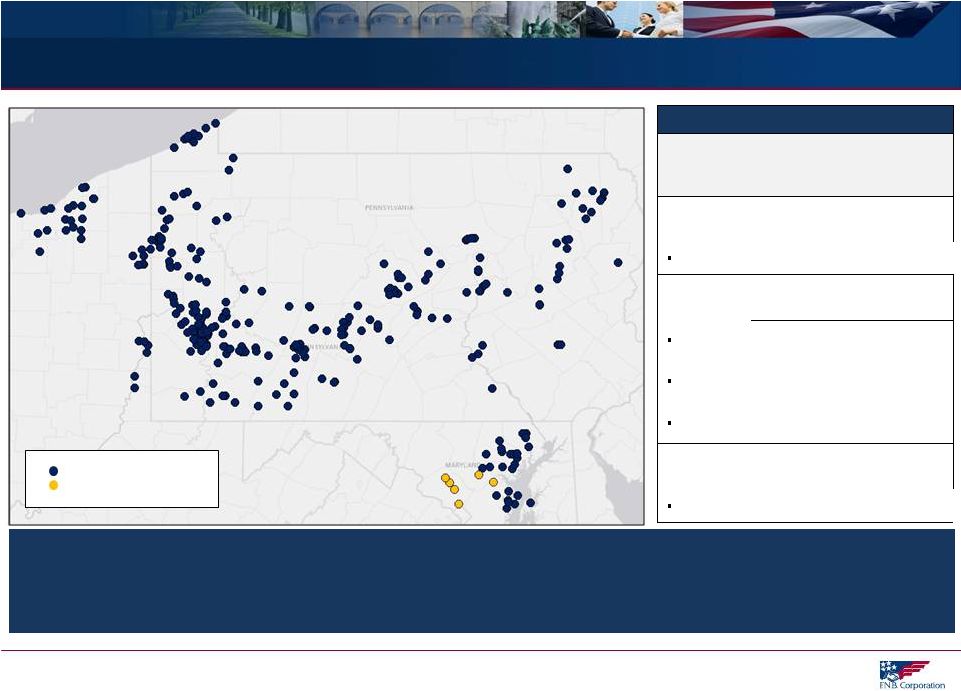 FNB’s model utilizes six regions, including three in major metropolitan markets, with each having a regional headquarters housing cross-functional teams. The five most recent announced acquisitions position FNB in dynamic metro markets. FNB Banking Footprint 15 Source: SNL Financial FNB Recent Acquisition Summary MSA FNB Market Share MSA Population Pittsburgh #3 2.4 Million (#22 MSA) PVSA - Closed 1Q12 Baltimore #10 2.7 Million (#20 MSA) ANNB - Closed 2Q13 BCSB - Closed 1Q14 OBAF – Pending, expected close 3Q14 Cleveland #14 2.1 Million (#29 MSA) PVFC - Closed 4Q13 Cleveland MSA Pittsburgh MSA Baltimore MSA Current FNB Locations OBAF Locations |
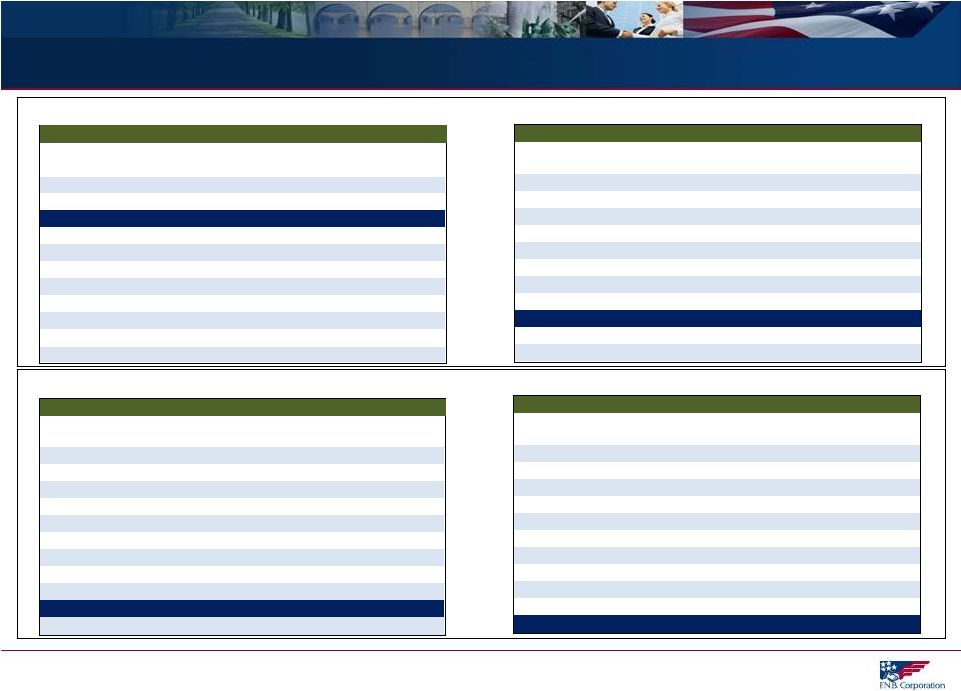 MSA Market Share - Proven Success, Opportunity For Growth 16 Source: SNL Financial, deposit data as of June 30, 2013, pro-forma as of April 30, 2014, excludes custodial bank (Pittsburgh MSA and Washington DC MSA). All Other MSAs represent MSA’s with FNB presence excluding Pittsburgh, Cleveland and Baltimore MSAs. Established MSA Markets – Proven Success, Leading Share Position Achieved Recent Expansion MSA Markets – Opportunity for Growth Pittsburgh, PA MSA Rank Institution Total Deposits ($000) Market Share (%) 1 PNC Financial Services Group Inc. 46,290,008 56.1% 2 Royal Bank of Scotland Group Plc 7,129,530 8.6% 3 F.N.B. Corp. 3,835,905 4.6% 4 Dollar Bank Federal Savings Bank 3,556,646 4.3% 5 First Niagara Financial Group Inc. 2,762,262 3.3% 6 Huntington Bancshares Inc. 2,512,422 3.0% 7 First Commonwealth 2,465,101 3.0% 8 TriState Capital Holdings Inc. 1,940,243 2.4% 9 S&T Bancorp Inc. 1,674,394 2.0% 10 Northwest Bancshares Inc. 1,045,914 1.3% All Other FNB MSAs Rank Institution Total Deposits ($000) Market Share (%) 1 Wells Fargo & Co. 28,625,288 11.5% 2 Capital One Financial Corp. 21,808,231 8.8% 3 PNC Financial Services Group Inc. 21,451,640 8.6% 4 Bank of America Corp. 21,178,566 8.5% 5 SunTrust Banks Inc. 16,558,202 6.7% 6 BB&T Corp. 13,395,183 5.4% 7 M&T Bank Corp. 11,277,819 4.5% 8 Citigroup Inc. 6,617,764 2.7% 9 F.N.B. Corp. 5,400,417 2.2% 10 United Bankshares Inc. 4,538,141 1.8% Baltimore - Towson, MD MSA Rank Institution Total Deposits ($000) Market Share (%) 1 Bank of America Corp. 16,059,885 25.4% 2 M&T Bank Corp. 14,128,448 22.3% 3 PNC Financial Services Group Inc. 6,716,296 10.6% 4 Wells Fargo & Co. 6,049,235 9.6% 5 BB&T Corp. 3,883,370 6.1% 6 SunTrust Banks Inc. 2,046,469 3.2% 7 First Mariner Bancorp 1,093,935 1.7% 8 Susquehanna Bancshares Inc. 1,082,184 1.7% 9 Capital One Financial Corp. 976,373 1.5% 10 F.N.B. Corp. 965,219 1.5% Cleveland-Elyria-Mentor, OH MSA Rank Institution Total Deposits ($000) Market Share (%) 1 KeyCorp 11,363,682 21.9% 2 PNC Financial Services Group Inc. 6,331,873 12.2% 3 TFS Financial Corp. (MHC) 5,425,587 10.4% 4 Huntington Bancshares Inc. 4,261,126 8.2% 5 Royal Bank of Scotland Group Plc 4,104,874 7.9% 6 FirstMerit Corp. 3,469,571 6.7% 7 Fifth Third Bancorp 3,384,743 6.5% 8 JPMorgan Chase & Co. 2,893,731 5.6% 9 U.S. Bancorp 2,032,321 3.9% 10 Dollar Bank Federal Savings Bank 1,701,264 3.3% 14 F.N.B. Corp. 623,947 1.2% |
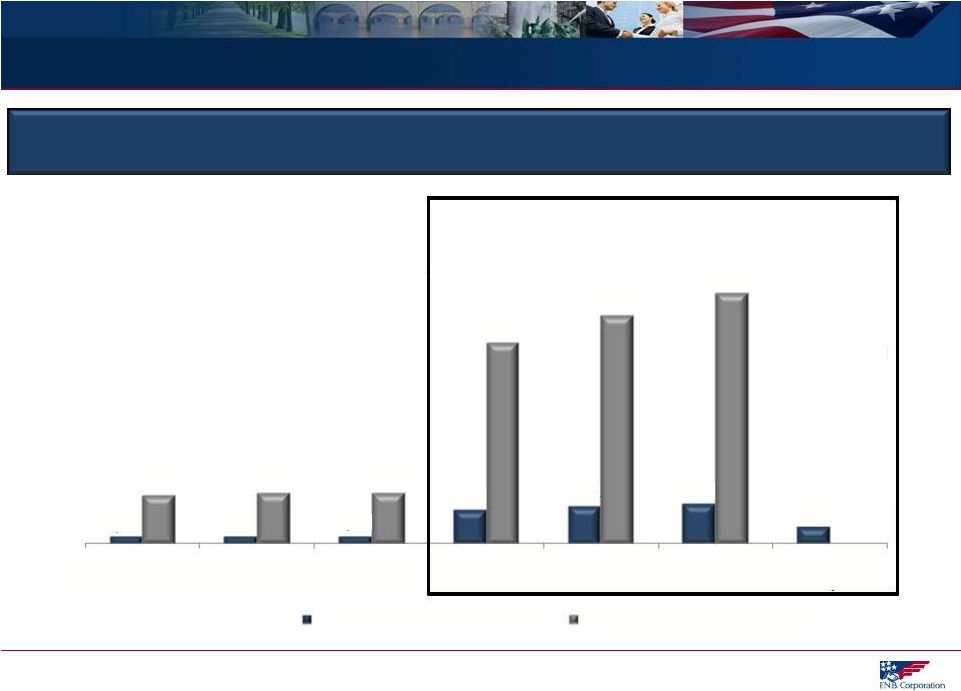 Significant Commercial Prospects 17 Note: Above metrics at the MSA and County level (1) Data per U.S. Census Bureau, and does not include total businesses related to pending OBAF acquisition (2) Data per Hoover’s as of May 2, 2014 (3) Montgomery County, Maryland, presented as potential prospects related to pending OBAF acquisition expansion Significant Commercial Prospects Concentrated in Pittsburgh, Maryland & Cleveland Opportunity to Leverage Core Competency and Drive Sustained Organic Growth (1) (2) Strong Concentration of Commercial Prospects In Metro Expansion Markets Over 175,000 Total Businesses (1) (3) 1,882 1,993 2,090 8,867 9,674 10,340 4,584 12,851 13,345 13,410 52,149 59,240 65,169 Youngstown, OH MSA Scranton, PA MSA Harrisburg, PA MSA Cleveland, OH MSA Pittsburgh, PA MSA Baltimore, MD MSA Montgomery County, MD # of Business with Revenue >$1M Total Businesses |
 Disciplined Acquisition Strategy – Platform for Organic Growth 18 Disciplined and Consistent Acquisition Strategy Strategy Disciplined identification and focus on markets that offer potential to leverage core competencies and growth opportunities Criteria Create shareholder value Meet strategic vision Fit culturally Evaluation Targeted financial and capital recoupment hurdles Proficient and experienced due diligence team Extensive and detailed due diligence process Execution Superior post-acquisition execution Execute FNB’s proven, scalable, business model Proven success assimilating FNB’s strong sales culture 13th bank acquisition announced since 2002 (OBAF) Fifth consecutive acquisition in a major MSA Five acquisitions completed since 2010 Ten acquisitions completed since 2005 Execution Strategy Criteria Evaluation Experienced Acquirer |
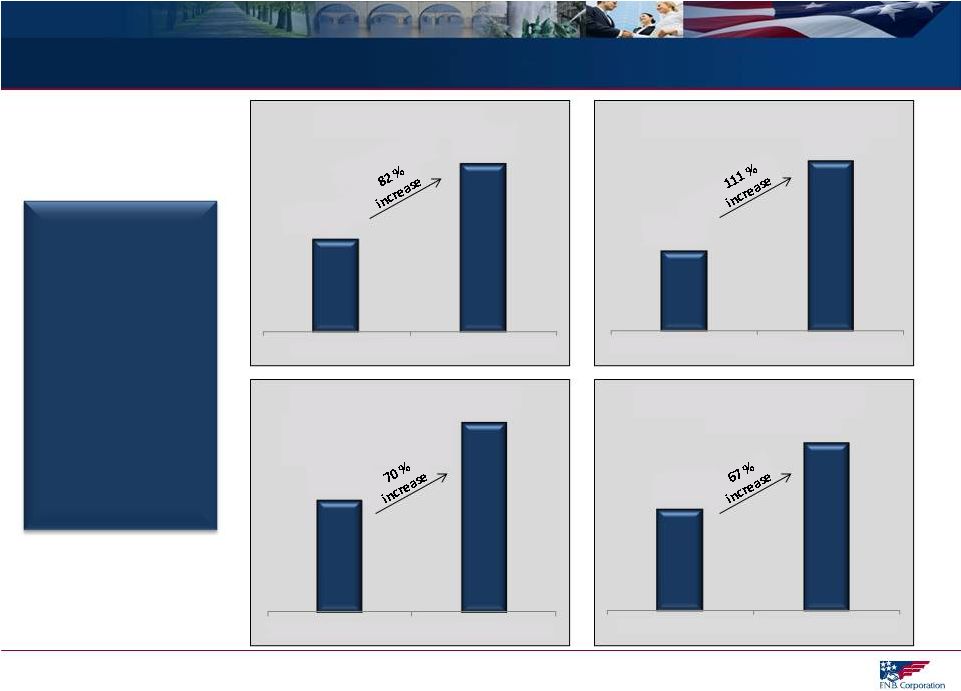 Expanded Franchise = Enhanced Organic Growth Prospects 19 Note: Market population and market businesses represent current metrics based on respective FNB MSA presence Data per FNB, SNL Financial and/or U.S. Census Bureau (Businesses) Acquisition- Related Expansion in Higher Growth Markets Enhances Organic Growth Opportunities In Millions 159 289 2007 1Q14 Pro -Forma FNB Branches 27 57 2007 1Q14 Pro -Forma FNB Counties of Operation 7.4 12.6 2007 1Q14 Pro -Forma FNB Markets Population (MSA) 3.0 5.0 2007 1Q14 Pro -Forma FNB Markets Households (MSA) |
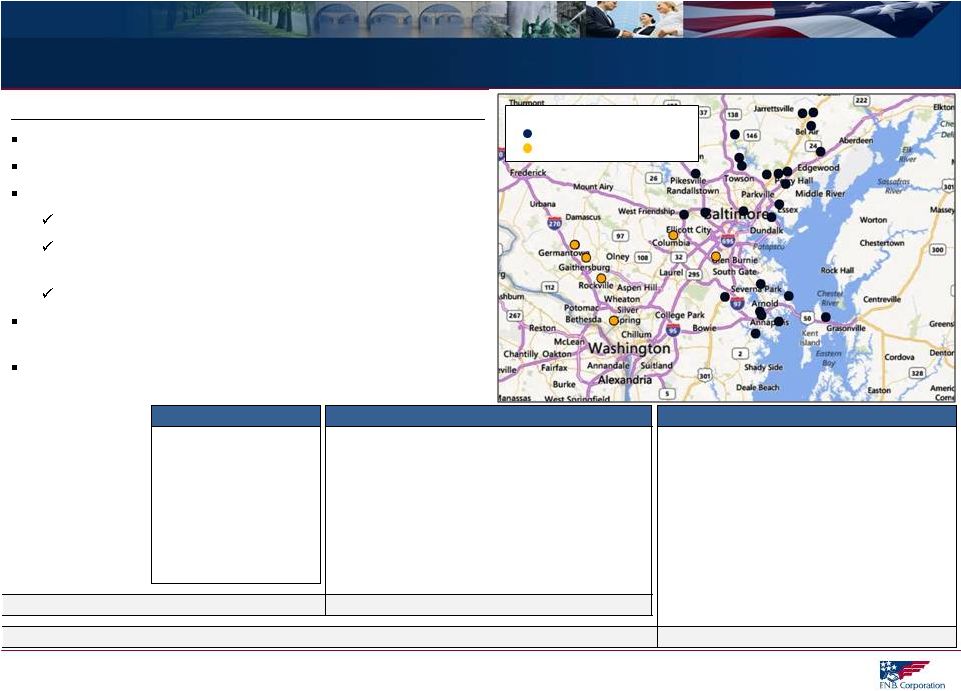 FNB Maryland Acquisitions – Platform For Growth In Place 20 FNB Maryland Acquisition History Announce Completion Assets Loans Deposits Branches Credit Mark Cost Savings OBAF 4/2014 3Q14 0.4 $ 0.3 $ 0.3 $ 6 1.3 x 3% 40% BCSB 6/2013 2/2014 0.6 $ 0.3 $ 0.5 $ 16 1.4 x 6% 25% ANNB 10/2012 4/2013 0.4 $ 0.3 $ 0.4 $ 8 1.6 x 6% 30% FNB Regional HQ 3/2014 1 Total Scale 1.4 $ 0.9 $ 1.2 $ 31 Average P/TBV, Credit Mark, Cost Savings 1.4 x 5% 32% Dates Scale (1) Pricing/Credit Marks/Cost Savings (2) P/TBV ($ in billions) (1) As of close for completed acquisitions , announce date for pending acquisition; (2) As of announce date FNB’s Expanding Maryland Presence Continues to Strengthen Solid platform for growth established in under one year Top 10 deposit market share Cost effective, lower-risk acquisitions Attractively priced at an average of 1.4x TBV Solid, performing acquired portfolios - average credit mark of 5% Established presence enables realization of cost savings Steady pace of acquisitions has allowed time to build strong, in-market leadership and team Leverages FNB’s experienced integration team FNB Maryland Presence Current FNB Locations OBAF Locations |