- FNB Dashboard
- Financials
- Filings
-
Holdings
- Transcripts
- ETFs
- Insider
- Institutional
- Shorts
-
425 Filing
F.N.B. (FNB) 425Business combination disclosure
Filed: 24 Sep 15, 12:00am
Filed by F.N.B. Corporation
Pursuant to Rule 425 under the Securities Act of 1933
and deemed filed pursuant to Rule 14a-12 of the Securities Exchange Act of 1934
Subject Company: Metro Bancorp, Inc.
(File No. 001-36852)
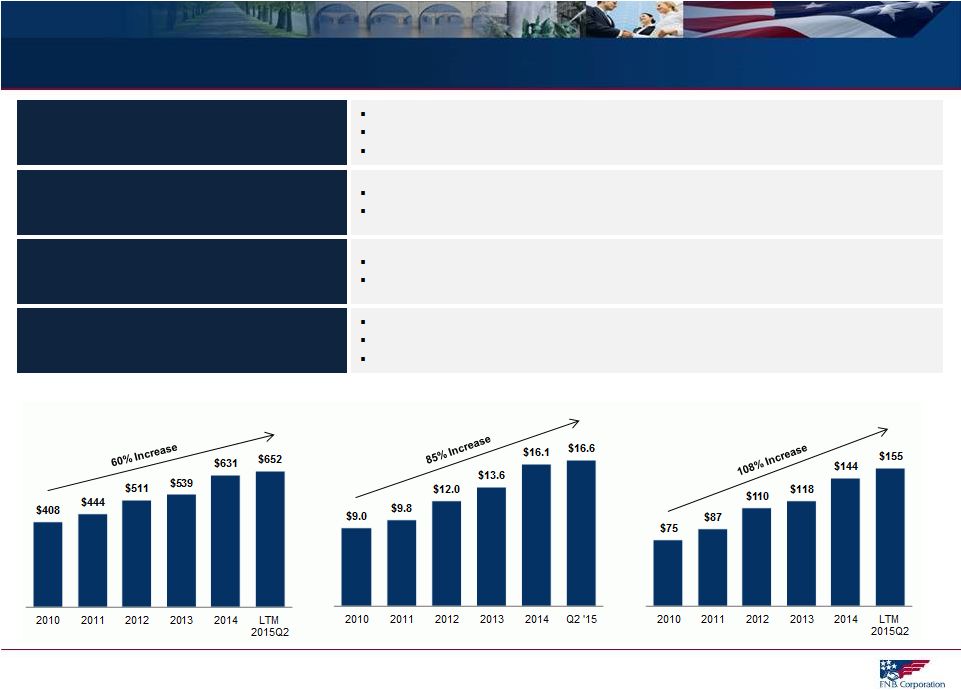
 About F.N.B. Corporation (1) Pro forma for 6/30/2015. (2) SNL Financial, retail market share (excludes custodian banks). Total Assets (In Billions) Total Revenue (In Millions) Net Income (In Millions) High-Quality, Growing Regional Financial Institution $16.6 billion in total assets (~$20 billion including Metro acquisition (1) ) Headquartered in Pittsburgh, PA Founded in 1864 Well-Positioned for Sustained Growth Attractive and expanding footprint: banking and consumer finance locations span six states Top market share position in Metro Markets: Pittsburgh, Baltimore and Cleveland (2) Consistent, Strong Operating Results High-quality earnings, top-quartile profitability performance Industry-leading, consistent organic loan growth results Operating Strategy Position for sustained, profitable growth Maintain a low-risk profile Disciplined expense control |
 Metro Transaction Rationale Source: SNL Financial, Hoover’s and Company public documents. (1) Based on 6/30/2015 GAAP data. (2) Based on assets and market capitalization on a pro forma basis. (3) Based on FDIC deposit data as of 6/30/2014. Pro forma for announced acquisition of BofA branches. Custodian banks were excluded from the rankings. (4) Data includes Metro’s markets (Harrisburg, York, Lancaster, Reading, and Lebanon MSAs). (5) Assets and core net income pro forma for LTM 6/30/2015. Core net income represents net income available to common shareholders. Excludes realized gain on securities, amortization of intangibles, goodwill impairment and nonrecurring items. Strategically Compelling FNB will become the largest regional bank and second largest bank based in Pennsylvania (2) FNB obtains immediate scale and #3 market share in the Harrisburg MSA with $1.4 billion in deposits (3) Attractive demographics with significant retail and commercial opportunities Access to 45 thousand businesses and population of over 2 million with median household income of $58 thousand (4) Significant operating scale and leveraging of FNB's risk management infrastructure Pro Forma total assets of $20 billion and core net income of $180 million (5) Complementary balance sheet and attractive funding profile Low Risk Credit diligence covered over 80% of commercial portfolio Comprehensive due diligence review and conservative credit mark (4.9% of loans) Metro Overview Total assets of $3.0bn as of 6/30/2015 Currently operates through 32 branches across Pennsylvania Utilizes retail driven business model, focused on convenience and customer service Attractive deposit base with 24% non-interest bearing deposits as of 6/30/2015 (1) |
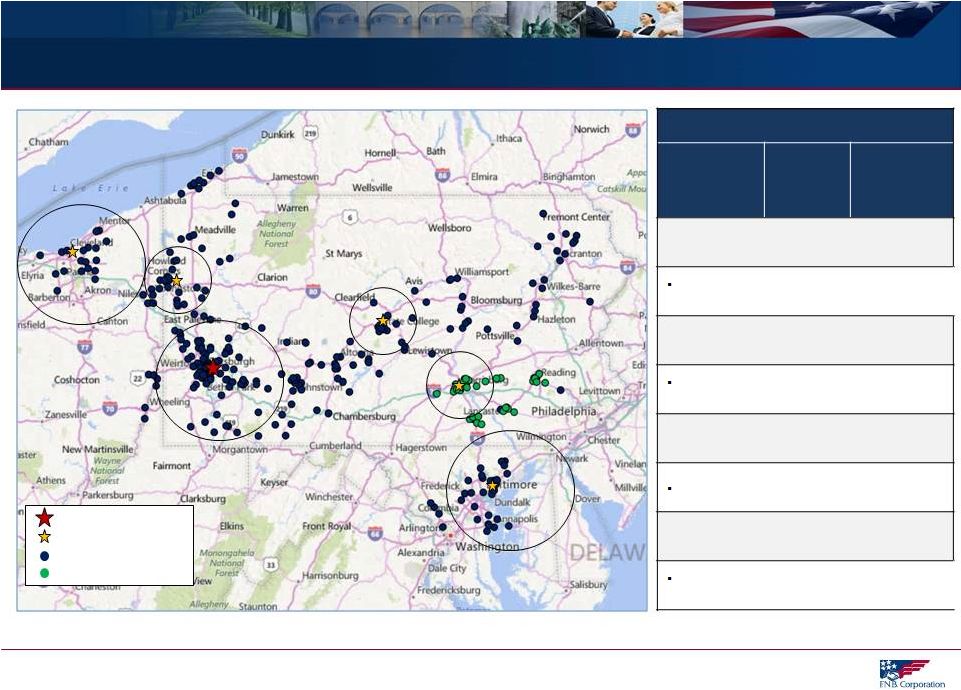
 FNB Banking Footprint FNB Recent Acquisition Summary MSA FNB Deposit Market Share Region Population Pittsburgh #3 2.4 Million (#22 MSA) PVSA - Closed 1Q12, FITB Branches expected 1H16 Baltimore #8 2.7 Million (#20 MSA) ANNB - Closed 2Q13, BCSB - Closed 1Q14, OBAF - Closed 3Q14 Cleveland #14 2.1 Million (#29 MSA) PVFC - Closed 4Q13 Harrisburg #3 2.1 Million (2) 5 BofA Branches 3Q15, METR – Expected Close 1Q16 Cleveland MSA Pittsburgh MSA Baltimore MSA (1) Pro-Forma for 17 branches from FITB and recently closed 5 branches from BAC (2) Population data includes Metro’s markets (Harrisburg, York, Lancaster, Reading, and Lebanon MSAs) FNB Locations (1) FNB Headquarters FNB Regional Hubs METR Locations Note: Circles represent the 6 FNB regions (3 large circles for metro markets and 3 smaller circles for community markets) |
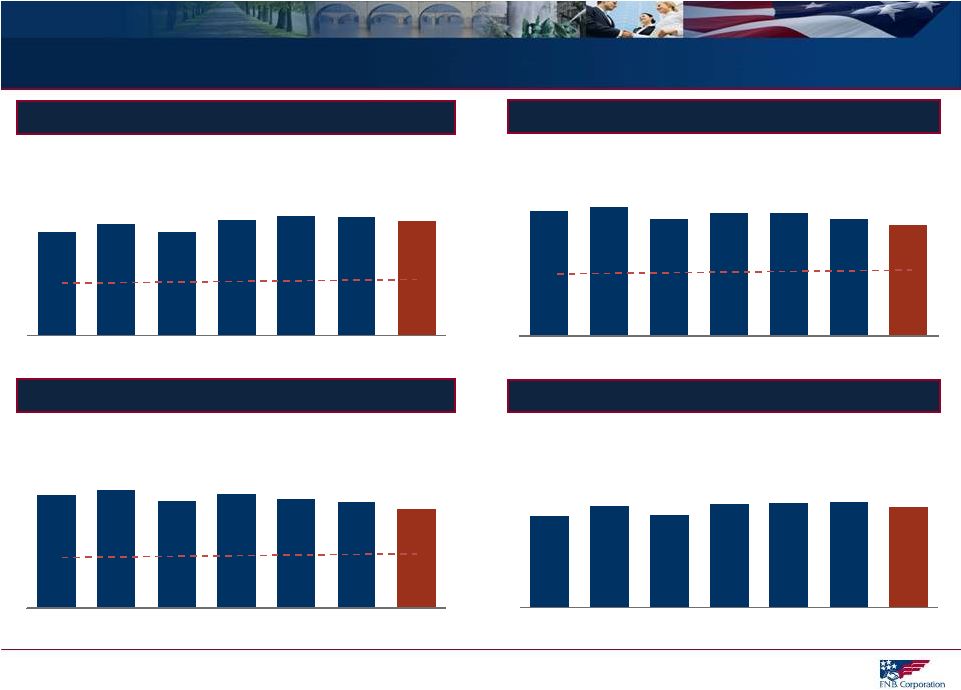
 Efficient Management of Capital… Tier 1 Common (%) Tier 1 Capital (%) Tier 1 Leverage (%) TCE / TA (%) Source: Company public documents. Note: Pro forma columns incorporate the closed acquisition of five Bank of America branches in 3Q15, pending acquisition of Metro and pending acquisition of 17 Fifth Third Bank branches. 6.0% 6.7% 6.1% 6.8% 6.8% 6.9% 6.6% 2010Y 2011Y 2012Y 2013Y 2014Y 2015Q2 Pro Forma 2015Q2 8.4% 9.0% 8.4% 9.3% 9.6% 9.6% 9.2% 2010Y 2011Y 2012Y 2013Y 2014Y 2015Q2 Pro Forma 2015Q2 Basel III Minimum: 4.5% 8.7% 9.2% 8.3% 8.8% 8.4% 8.2% 7.7% 2010Y 2011Y 2012Y 2013Y 2014Y 2015Q2 Pro Forma 2015Q2 Basel III Minimum: 4.0% 11.4% 11.7% 10.6% 11.1% 11.1% 10.6% 10.1% 2010Y 2011Y 2012Y 2013Y 2014Y 2015Q2 Pro Forma 2015Q2 Basel III Minimum: 6.0% |