 F.N.B. Corporation Investor Presentation Third Quarter 2016 August 15-16, 2016 Exhibit 99.1 |
 The presentation includes “snapshot” information about F.N.B. Corporation used by and of illustration and is not intended as a full business or financial review and should be viewed in the context of all the information made available by F.N.B. Corporation in its SEC filings. The information provided in this presentation and the reports F.N.B. Corporation files with the Securities and Exchange Commission often contain “forward-looking statements” relating to present or future trends or factors affecting the banking industry and, specifically, the operations, markets and products of F.N.B. Corporation. These forward-looking statements involve certain risks and uncertainties. There are a number of important factors that could cause F.N.B. Corporation’s future results to differ materially from historical performance or projected performance. These factors include, but are not limited to the risks discussed in F.N.B. Corporation’s 2015 Form 10-K such as: (1) a significant increase in competitive pressures on financial institutions; (2) a challenging interest rate environment; (3) changes in prepayment speeds, loan sale volumes, charge-offs and loan loss provisions; (4) general economic conditions; (5) various monetary and fiscal policies and regulations of the U.S. government that may adversely affect the businesses in which F.N.B. Corporation is engaged; (6) technological issues which may adversely affect F.N.B. Corporation’s operations or customers; (7) changes and trends in the capital markets; (8) housing prices; (9) job market; (10) consumer confidence and spending habits; (11) estimates of fair value of certain F.N.B. Corporation assets and liabilities; (12) the effects of current, pending and future legislation, regulation and regulatory actions, and (13) the impact of federal regulated agencies that have oversight or review of F.N.B. Corporation’s business and securities activities. F.N.B. Corporation undertakes no obligation to revise these forward-looking statements or to reflect events or circumstances after the date of this presentation. To supplement its consolidated financial statements presented in accordance with Generally Accepted Accounting Principles (GAAP), the Corporation provides additional measures of operating results, net income and earnings per share (EPS) adjusted to exclude certain costs, expenses, and gains and losses. The Corporation believes that these non-GAAP financial measures are appropriate to enhance the understanding of its past performance as well as prospects for its future performance. In the event of such a disclosure or release, the Securities and Exchange Commission’s Regulation G requires: (i) the presentation of the most directly comparable financial measure calculated and presented in accordance with GAAP and (ii) a reconciliation of the differences between the non-GAAP financial measure presented and the most directly comparable financial measure calculated and presented in accordance with GAAP. The Appendix to this presentation contains non-GAAP financial measures used by the Corporation to provide information useful to investors in understanding the Corporation's operating performance and trends, and facilitate comparisons with the performance of the Corporation's peers. While the Corporation believes that these non-GAAP financial measures are useful in evaluating the Corporation, the information should be considered supplemental in nature and not as a substitute for or superior to the relevant financial information prepared in accordance with GAAP. The non-GAAP financial measures used by the Corporation may differ from the non-GAAP financial measures other financial institutions use to measure their results of operations. This information should be reviewed in conjunction with the Corporation’s financial results disclosed on July 21, 2016, and in its periodic filings with the Securities and Exchange Commission. Cautionary Statement Regarding Forward-Looking Information and Non-GAAP Financial Information 2 |
 Cautionary Statement Regarding Forward-Looking Information and Non- GAAP Financial Information 3 This presentation contains "forward-looking statements" within the meaning of the Private Securities Litigation Reform Act, relating to present or future trends or factors affecting the banking industry and, specifically, the financial operations, markets and products of F.N.B. Corporation (“FNB”) and Yadkin Financial Corporation (“Yadkin”). Forward-looking statements are typically identified by words such as “believe”, “plan”, “expect”, “anticipate”, “intend”, “outlook”, “estimate”, “forecast”, “will”, “should”, “project”, “goal”, and other similar words and expressions. These forward-looking statements involve certain risks and uncertainties. In addition to factors previously disclosed in FNB and Yadkin reports filed with the SEC and those identified elsewhere in this filing, the following factors among others, could cause actual results to differ materially from forward-looking statements or historical performance: ability to obtain regulatory approvals in a timely manner and without significant expense or other burdens; meet other closing conditions to the Merger, including applicable regulatory approvals and the approval by FNB and Yadkin shareholders, on the expected terms and schedule; delay in closing the Merger; difficulties and delays in integrating the FNB and Yadkin businesses or fully realizing anticipated cost savings and revenues; business disruption following the Merger; the challenges attendant to entering a new remote geographic market, changes in asset quality and credit risk; the inability to sustain revenue and earnings growth; changes in interest rates and capital markets; inflation; customer acceptance of FNB products and services by Yadkin customers; customer borrowing, repayment, investment and deposit practices; customer disintermediation; the introduction, withdrawal, success and timing of business initiatives; competitive conditions or to effectively implement integration and data conversion plans and other consequences associated with mergers, acquisitions and divestitures; economic conditions; and the impact, extent and timing of technological changes, capital management activities, and other actions and policies of the Federal Reserve Board and the Office of the Comptroller of the Currency and legislative and regulatory actions and reforms. FNB and Yadkin undertake no obligation to revise their respective forward-looking statements or to reflect events or circumstances after the date of this presentation. To supplement its consolidated financial statements presented in accordance with Generally Accepted Accounting Principles (GAAP), the FNB and Yadkin have respectively provided additional measures of operating results, net income and earnings per share (EPS) adjusted to exclude certain costs, expenses, and gains and losses. FNB and Yadkin believe that these non-GAAP financial measures are appropriate to enhance the understanding of its past performance as well as prospects for its future performance. In the event of such a disclosure or release, the Securities and Exchange Commission’s Regulation G requires: (i) the presentation of the most directly comparable financial measure calculated and presented in accordance with GAAP and (ii) a reconciliation of the differences between the non-GAAP financial measure presented and the most directly comparable financial measure calculated and presented in accordance with GAAP. The Appendix to this presentation contains non-GAAP financial measures used by the FNB and Yadkin to provide information useful to investors in understanding each Company’s respective operating performance and trends, and facilitate comparisons with the performance of each of FNB’s and Yadkin’s respective peers. While each of FNB and Yadkin believe that these non-GAAP financial measures are useful in evaluating each company, the information should be considered supplemental in nature and not as a substitute for or superior to the relevant financial information prepared in accordance with GAAP. The non-GAAP financial measures used by each of FNB and Yadkin may differ from the non-GAAP financial measures other financial institutions use to measure their results of operations. This information should be reviewed in conjunction with each of FNB’s and Yadkin’s financial results disclosed on July 21, 2016 and in its periodic filings with the Securities and Exchange Commission. ADDITIONAL INFORMATION ABOUT THE MERGER This communication is being made in respect of the proposed transaction involving Yadkin and FNB. This material is not a solicitation of any vote or approval of Yadkin’s or FNB's shareholders and is not a substitute for the joint proxy statement/prospectus or any other documents which Yadkin and FNB may send to their respective shareholders in connection with the proposed merger. This communication does not constitute an offer to sell or the solicitation of an offer to buy any securities. F.N.B. Corporation and Yadkin Financial Corporation will file a joint proxy statement/prospectus and other relevant documents with the SEC in connection with the merger. THE RESPECTIVE SHAREHOLDERS OF AND F.N.B. CORPORATION AND YADKIN FINANCIAL CORPORATION ARE ADVISED TO READ THE JOINT PROXY STATEMENT/PROSPECTUS WHEN IT BECOMES AVAILABLE AND ANY OTHER RELEVANT DOCUMENTS FILED WITH THE SEC, AS WELL AS ANY AMENDMENTS OR SUPPLEMENTS TO THOSE DOCUMENTS, BECAUSE THEY WILL CONTAIN IMPORTANT INFORMATION. The proxy statements/prospectuses and other relevant materials (when they become available), and any other documents F.N.B. Corporation and Yadkin Financial Corporation have filed with the SEC, may be obtained free of charge at the SEC's website at www.sec.gov. In addition, investors and security holders may obtain free copies of the documents F.N.B. Corporation has filed with the SEC by contacting James Orie, Chief Legal Officer, F.N.B. Corporation, One North Shore Center, Pittsburgh, PA 15212 , telephone: (724) 983-3317; and may obtain free copies of the documents Yadkin Financial Corporation has filed with the SEC by contacting Terry Earley, CFO, Yadkin Financial Corporation, 3600 Glenwood Avenue, Raleigh, NC 27612, telephone: (919) 659-9015. F.N.B. Corporation and Yadkin Financial Corporation and certain of their directors and executive officers may be deemed to be participants in the solicitation of proxies from shareholders of F.N.B. Corporation and Yadkin Financial Corporation in connection with the proposed merger. Information concerning such participants' ownership of F.N.B. Corporation and Yadkin Financial Corporation common shares will be set forth in the joint proxy statements/prospectuses relating to the merger when they become available. This communication does not constitute an offer of any securities for sale. |
 F.N.B. Corporation About F.N.B. Corporation Favorably Positioned for Long-Term Success 4 |
 About F.N.B. Corporation – Pro Forma with Yadkin • Assets: $28.7 billion (1) • Loans: $19.8 billion (1) • Deposits: $21.1 billion (1) • #6 bank in Raleigh • #8 bank in Charlotte • #6 bank in Piedmont Triad (5) (1) Pro-Forma for pending acquisition of Yadkin Financial Corporation as of 6/30/16 (2) As of August 10, 2016 TSR for FNB, includes the market capitalization for YDKN and FNB combined based on closing prices. (3) SNL Financial, MSA retail market share (excludes custodian banks). (4) Pro-Forma for pending HBAN acquisition of FMER. (5) Greensboro – High Point MSA and Winston – Salem MSA. 5 • Headquarters: Pittsburgh, PA • Banking locations: 430 (1) • Pro-Forma Market Capitalization: $3.9 billion (2) High-Quality, Growing Regional Financial Institution Operating Strategy • Middle market regional bank focused on serving consumer and wholesale banking clients • Reposition and reinvest in the franchise • Expand market share potential and organic growth opportunities • Maintain disciplined expense control • Maintain a low-risk profile • Attractive and expanding footprint: Banking locations spanning eight states • Leading presence with top regional bank market share in major metropolitan markets (3) • #3 bank in Pittsburgh • #8 bank Baltimore • #13 bank in Cleveland (4) Well-Positioned for Sustained Growth Consistent, Strong Operating Results • High-quality earnings • Top-quartile profitability performance • Industry-leading, consistent organic loan growth results • Solid shareholder return - 5-year total return of 77% (2) • Attractive dividend yield ranked among the top 15% of the top 100 U.S. banks and thrifts • Strong return on tangible common equity, expected to be further supported by planned Yadkin acquisition • FNB currently trades at a discount to peers on an earnings basis Superior Returns with Valuation Upside |
 2009-2011 2012 2013 2014 2015 2016 PEOPLE Talent Management Strengthened team through key hires; Continuous team development Attract, retain, develop best talent Chief Technology & Chief Marketing Officer Filled, Launched Project Management Office, Chief Wholesale Banking and Chief Consumer Banking Officer Filled Director of Data Enterprise Management, Director of Product & Segment Strategy, Director of Interest Rate Sales & Marketing Filled Geographic Segmentation Regional model Regional Realignment Created 5 & 6 Regions Announced Pittsburgh as HQ Improved market share in Central PA PROCESS Sales Management/Cross Sell Proprietary sales management system developed & implemented: Balanced scorecards Consumer Banking Scorecards Consumer Banking Refinement/Daily Monitoring Continued Utilization Commercial Banking Sales Mgt. Expansion to additional lines of business: Private Banking, Insurance, Wealth Management Continued Enhancements PRODUCT Product Development Deepened product set and niche areas allow FNB to successfully compete with larger banks and gain share Private Banking, ABL, Small Business Realignment Treasury Mgt. Capital Markets, online and mobile banking investment /implementation – Online banking enhancements, mobile banking and app Online/mobile banking infrastructure complete with mobile remote deposit capture and online budgeting tools. New website launched, ApplePay™, International Banking Intelligent Teller Machines, new retail product branding, digital in-branch kiosks, upgrades to mobile banking app, new commercial banking app PRODUCTIVITY Branch Optimization Continuous evolution of branch network to optimize profitability and growth prospects De-Novo Expansion 13 Locations BAC Branches FITB Branches, Opened innovative banking center in State College, PA Consolidate 8 Locations Consolidate 37 Locations Consolidate 7 Locations Consolidate 1 Location Consolidate 6 Locations Consolidate 9 Locations Acquisitions Opportunistically expand presence in attractive markets CB&T PVSA ANNB PVFC BCSB OBAF METR YDKN Announced Reposition and Reinvest – Long-Term Plan to Build Infrastructure for a Larger Organization 6 th th |
 Acquisition Strategy Acquisition-Related Expansion Enhances Organic Growth FNB Announces Agreement to Acquire Yadkin Financial 7 |
 Disciplined Acquisition Strategy – Platform for Organic Growth Disciplined and Consistent Acquisition Strategy Strategy Disciplined identification and focus on markets that offer attractive consumer demographics and commercial opportunities Provides geographic & portfolio diversification through increased number of commercial prospects providing further granularity of risk Criteria Shareholder value creation Strategically relevant Financially attractive, with limited diminution of capital Fulfills stated investment thesis financial objectives Evaluation Targeted financial metrics and capital recoupment Proficient and experienced due diligence team Comprehensive due diligence process Execution Superior process for immediate conversion Execute FNB’s proven, scalable, business model Proven success assimilating FNB’s strong sales culture Fully integrated into FNB’s risk and credit culture and processes Deploy FNB’s credit underwriting platform and standards Execution Criteria Strategy Evaluation 8 |
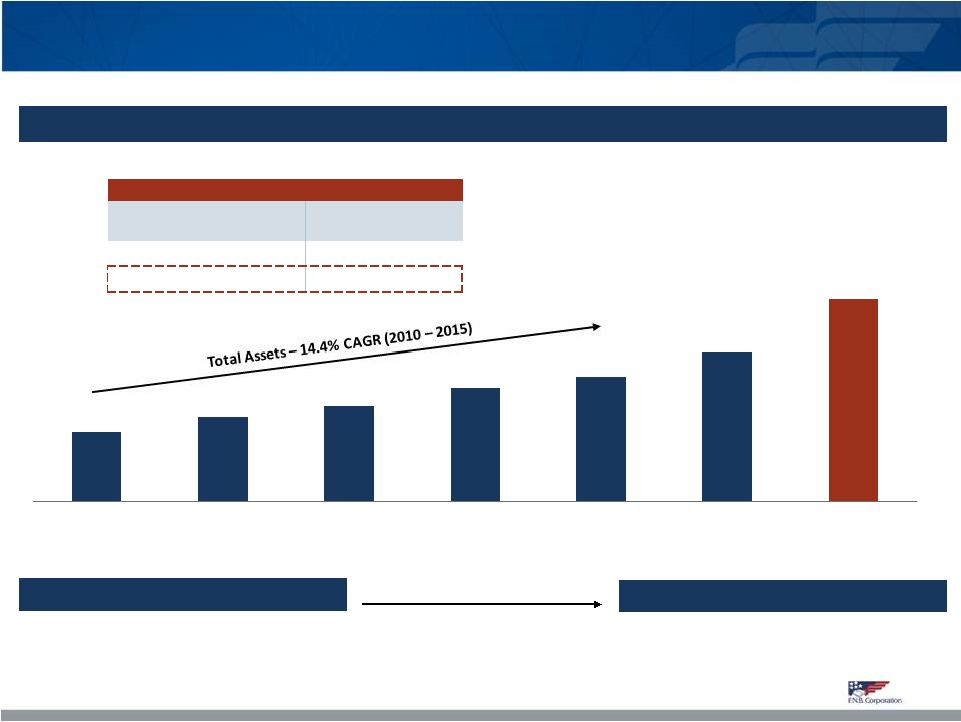 $9.8 $12.0 $13.6 $16.1 $17.6 $21.2 $28.7 2011 2012 2013 2014 2015 Q2 2016 Q2 2016 Pro Forma Yadkin FNB’s Market Expansion Model has Delivered Strong Organic Growth… 2011 Total Assets: $9.8 bn Pro Forma Q2 2016 Total Assets: $28.7 bn 10 Acquisitions since 2011 Total Assets (in $ billions) (1) Organic balances exclude initial respective balances acquired upon transaction close for BAC(9/2015), OBAF (9/2014), BCSB (2/2014), PVFC (10/2013), ANNB (4/2013), PVSA (1/2012) and CBT (1/2011). 2010 - 2015 Loans Transaction Deposit and Customer Repos Total Growth 14.9% 15.2% Organic Growth (1) 9.2% 9.6% 9 |
 Tangible Book Value per Share Growth Since 2009 Efficiency Ratio … and Enhanced Operating Leverage Resulting in Tangible Book Value Growth Peer Median (2) FNB Source: SNL Financial. (1) Defined as the percentage change in operating revenue (net interest income + non-interest income, excluding realized gains on securities and nonrecurring revenue as defined by SNL Financial) during the period less the percentage change in noninterest expense (excluding nonrecurring expense as defined by SNL Financial). (2) Publicly traded banks with between $10 - $50 billion in assets nationwide. Excludes banks who went public after 2009 and Investors Bancorp due to its conversion from a MHC between 2009 and 2015. Operating Leverage – 2009 to 2015 (1) Peer Median (2) FNB 10 59% 62% 61% 62% 64% 63% 62% 62% 59% 60% 58% 59% 58% 56% 55% 57% 59% 61% 63% 65% 2009Y 2010Y 2011Y 2012Y 2013Y 2014Y 2015Y $4.17 $4.40 $4.81 $4.93 $5.43 $5.99 $6.38 2009Y 2010Y 2011Y 2012Y 2013Y 2014Y 2015Y 19.3% (0.7%) |
 Yadkin: Compelling Strategic and Financial Rationale Creates a Premier Middle Market Regional Bank in the Mid-Atlantic and Southeast Significant Long-Term Shareholder Value Creation Experienced Acquirer and Proven Market Expansion Model (1) Includes Pittsburgh MSA, Baltimore MSA, Raleigh MSA, Charlotte MSA and the Piedmont Triad (Greensboro – High Point MSA and Winston – Salem MSA). 11 Extends FNB’s footprint into attractive high-growth metro markets in the Southeast Transforms FNB’s growth profile with nearly half of pro forma franchise in large, attractive markets Top 10 deposit market share in five major metro markets with population greater than 1 million (1) Nearly $30 billion in pro forma assets with increased scale and business opportunities Leverages FNB’s investments in technology and compliance Expertise and product set to deepen customer penetration Expect high retention rate of market leadership and customer-facing employees Empowers Yadkin’s experienced bankers Well-positioned to attract additional in-market talent Financially attractive transaction with conservative assumptions Mid-to-high single digit earnings accretion TBV per share earnback of 4.5 years Modeled to flat interest rates for next five years Drives positive operating leverage through organic growth of middle market C&I business, consumer banking and fee income and focused expense reductions Positions FNB for long-term growth in a challenging interest rate and regulatory environment Recent FNB acquisition of Metro has been closed and fully integrated Comprehensive due diligence review and conservative credit mark Pro forma capital ratios exceed well-capitalized levels and CRE concentration comfortably below regulatory guidance |
 Yadkin FNB Cleveland Pittsburgh Baltimore Yadkin has top 10 market share in North Carolina’s most attractive markets Yadkin Extends FNB’s Distribution Network Into Faster Growing Southeastern Markets Source: SNL Financial. Based on FDIC deposit data as of June 30, 2015. Pro forma for closed FNB and Yadkin acquisitions. (1) Totals equal to the aggregate of all markets in which Yadkin or FNB has deposits. (2) Totals equal to weighted average by deposits in each market in which Yadkin or FNB has deposits. (3) Greensboro – High Point MSA and Winston – Salem MSA. (4) Ranking for North Carolina. Wilmington Raleigh Piedmont Triad (3) Charlotte Harrisburg Scranton Philadelphia Canton Akron Columbus Cincinnati Charleston Annapolis Knoxville Columbia 12 Population (mm) (1) Population Growth ('10-'16) (2) Market Rank Branches Deposits Pro Forma ($mm) % of Total Yadkin Metro Markets Raleigh MSA 1.3 12.7% 6 12 $1,064 5% Greensboro - High Point MSA 0.8 4.3 6 10 846 4 Charlotte MSA 2.4 9.9 8 18 784 4 Winston-Salem MSA 0.7 2.9 4 18 779 4 Wilmington MSA 0.3 9.6 6 5 366 2 Yadkin Total 9.7 7.0 7 100 5,203 25 FNB Total 25.6 0.0 330 15,963 75 FNB Pro Forma 35.3 1.7% 430 21,166 (4) |
 Significant Commercial Lending Opportunities Across FNB’s Footprint Total C&I Businesses (000s) (1) Total Businesses (000s) 2013-2014 GDP Growth (2) Sales ($bn) Source: SNL Financial, U.S. Bureau of Economic Analysis, US Census Bureau. FNB Top Markets defined as the five markets outlined above. (1) Includes companies classified with the NAICS as Healthcare and Social Assistance, Wholesale Trade, Manufacturing or Transportation and Warehousing. (2) Measured in current dollars. Total FNB Top Markets is calculated based on total GDP growth in the markets. FNB Existing Yadkin 13 408 100 97 89 77 45 FNB Top Markets Baltimore MSA Pittsburgh MSA Charlotte MSA Cleveland MSA Raleigh MSA 74 19 17 16 15 7 FNB Top Markets Pittsburgh MSA Baltimore MSA Charlotte MSA Cleveland MSA Raleigh MSA $932 $236 $227 $193 $180 $96 FNB Top Markets Pittsburgh MSA Baltimore MSA Charlotte MSA Cleveland MSA Raleigh MSA 3.8% 4.6% 4.5% 4.3% 3.4% 2.9% FNB Top Markets Raleigh MSA Pittsburgh MSA Charlotte MSA Baltimore MSA Cleveland MSA |
 Enhanced Product Offering Positions Company For Future Revenue Growth The combined company will have a broader suite of products and services to offer new and existing commercial, wealth management and retail customers (1) Includes estimated revenue loss from Durbin. Excludes impact of gain on sale of trust business. (1) (1) 14 Corporate Banking Small Business Banking Investment Real Estate Financing International Banking Asset-based Lending Treasury Management SBA Banking Builder Finance Capital Markets Lease Financing Mortgage Lending Home Equity Consumer Lending Wealth Management / Trust Brokerage / Investments Private Banking Insurance Q2 Annualized Fee Income ($ millions) 206 57 Fee income / Average Assets 0.99% 0.77% Product / Service |
 Yadkin: Transaction Overview (1) Non-voting common stock shareholders will elect to receive FNB shares at the exchange ratio or cash equal to exchange ratio multiplied by FNB’s 20-day trailing average closing price ending on and including the fifth such trading day prior to the closing date. Yadkin has 200K non-voting common shares (0.4% of shares outstanding). (2) Based on FNB’s 20-day trailing average closing price of $12.66 as of July 20, 2016. (3) Based on Yadkin TBV per share at June 30, 2016 of $12.28. (4) Net of existing credit mark of $43.7 million and current ALLL balance of $11.6 million. Consideration Fixed 2.16x exchange ratio; 100% stock (1) $27.35 per Yadkin share (2) Yadkin shareholders will own ~35% of FNB Deal Value Approximately $1.4 billion (2) Key Pricing Ratios 14.2x Price / 2017E EPS, based on Yadkin consensus estimates 11.2x Price / 2017E adjusted EPS with fully phased cost savings 2.23x Price / tangible book value (3) Required Approvals Customary regulatory FNB and Yadkin shareholders Expected Closing Q1 2017 Key Assumptions Cost savings: 25% of Yadkin’s non-interest expense base, phased in 75% in 2017 and 100% thereafter Credit mark: Gross mark at 3.6% of gross loans, representing a net credit mark of 2.6% (4) One-time transaction expenses: ~$100 million pre-tax Core deposit intangible: 1.8% amortized over 10 years (SOYD) Board Seat One Yadkin Board member to join FNB Board following the closing of the transaction Estimated Pro Forma Impact Accretive to GAAP EPS by ~5.5% and cash EPS by ~6.5% in 2018 and growing thereafter TBV per share dilution: ~8.5% with 4.5 years earnback using crossover method and 14 months on a pro forma earnings basis IRR: ~20% No additional capital raise required – HoldCo and Bank will remain well-capitalized in accordance with regulatory guidelines 15 |
 Comprehensive due diligence process led by FNB’s cross-functional integration teams Constructed a detailed bottoms-up five year financial forecast model incorporating assumptions from business due diligence teams Extensive credit due diligence, including thorough loan file review and credit re-underwriting Reviewed two-thirds of all commercial loan exposures Thorough review of all compliance, legal and operational risks Pro forma CRE concentration comfortably below regulatory guidance Maximizing Execution Certainty Thorough Due Diligence Process Keys to Successful Integration Highly experienced integrator – successfully converted nine bank / branch acquisitions since 2010 Developed proprietary step-by-step playbook Dedicated integration teams led by experienced management from large institutions Systems / Operational Integration Current leadership will remain highly involved post closing Steve Jones, Chief Banking Officer, will lead North and South Carolina market Expect high retention of market leadership and customer-facing employees Well-positioned to attract additional in-market talent to supplement existing teams People Integration / Local Management Team Similar customer-focused, commercially oriented business model FNB consistently recognized as a top-tier employer in its major markets Culture Deeply embedded in FNB’s culture and processes Built a robust and scalable compliance, risk management and technology infrastructure Risk Management Proactive outreach and discussion of transaction benefits Increased products and services Focus on building community brand awareness Customers / Communities 16 |
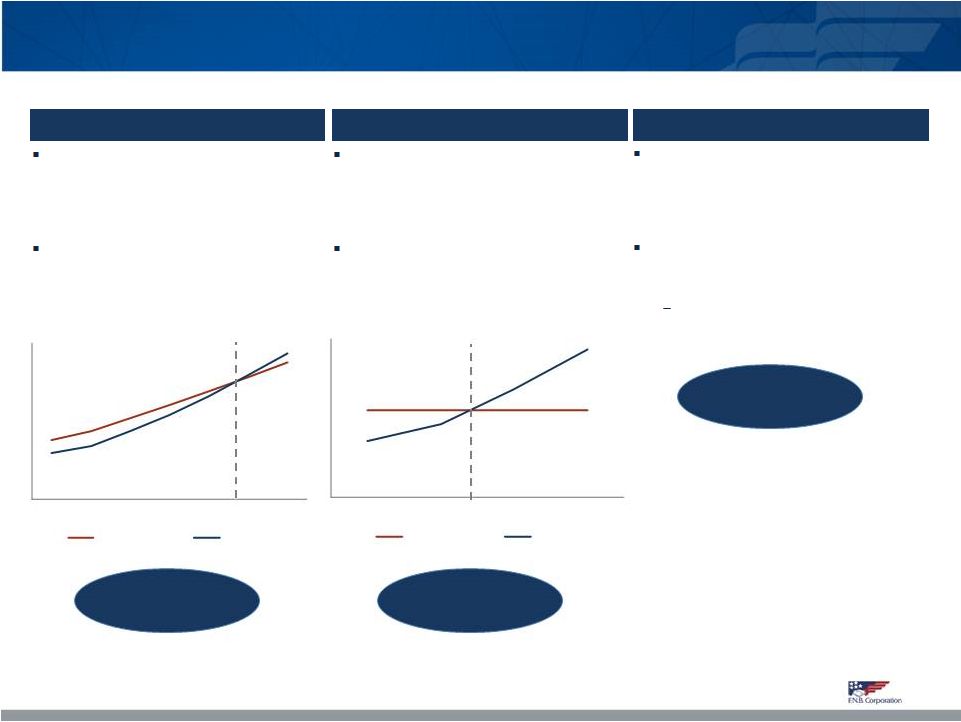 The amount of time until the projected TBV per share for the combined company exceeds the standalone FNB projected TBV per share Restructuring charge at close included in initial dilution, remainder of restructuring charge reflected in projected TBV per share Combined Earnings Crossover Method The amount of time until the projected TBV per share for the combined company exceeds the standalone FNB TBV per share at close (i.e. before dilution) Restructuring charge at close included in initial dilution, remainder of restructuring charge reflected in pro forma projected TBV ~4.5 Years 14 Months Static Method “Quick and dirty” estimate of earnback based on TBV per share dilution at close divided by cash EPS accretion in the first year (2018) Does not give any credit for future earnings growth Includes only the restructuring charge incurred at close ~8.5 Years Yadkin: Tangible Book Value Per Share Earnback Approaches 17 Close 2017 2018 2019 2020 2021 2022 Standalone Pro Forma Close 2017 2018 2019 Standalone Pro Forma |
 Operating Results 2Q16 Highlights and Trends 18 |
 Full Year Financial Highlights – Annual Trends 2015 2014 2013 2012 2011 Quality Operating Earnings (1) Net income available to common shareholders ($ millions) $153.7 $135.6 $123.5 $117.8 $90.3 Earnings per diluted common share $0.87 $0.80 $0.84 $0.84 $0.72 Profitability Performance ROTCE (1) 14.52% 14.72% 17.35% 18.75% 16.32% ROTA (1) 1.06% 1.06% 1.09% 1.12% 1.02% Net interest margin 3.42% 3.59% 3.65% 3.73% 3.79% Core net interest margin 3.39% 3.55% 3.62% 3.67% 3.79% Efficiency ratio 56.1% 57.2% 58.9% 57.7% 59.7% Strong Balance Sheet Organic Growth Trends (2) Total loan growth 9.7% 9.0% 6.3% 4.3% 5.2% Commercial loan growth 8.6% 9.1% 7.1% 5.4% 5.8% Consumer loan growth (3) 11.4% 13.8% 12.8% 7.4% 4.4% Transaction deposits and customer repo growth (4) 7.4% 6.3% 7.9% 9.6% 8.0% (1) Non-GAAP measure, refer to Appendix for GAAP to Non-GAAP Reconciliation details; (2) Full-year average organic growth results. Organic growth results exclude initial balances acquired in the following acquisitions; BofA 3Q15, OBAF 3Q14, BCSB 1Q14, PVFC 4Q13, ANNB 2Q13, PVSA 1Q12, CB&T 1Q11; (3) Consumer includes Residential, Direct Installment, Indirect Installment and Consumer LOC portfolios; (4) Total deposits excluding time deposits. 19 |
 2Q16 Operating Highlights Continued Momentum and Positive Trends (All comparisons refer to the first quarter of 2016, except as noted) Operating (1) net income available to common shareholders of $46.1 million; operating earnings per diluted common share of $0.22 Continued revenue growth and diligent expense management Record total operating revenue of $208 million (1) ; Linked-quarter revenue growth achieved for fourteen straight quarters Positive results from previous investments made in fee-based business units; mortgage banking, insurance, wealth management and capital markets Solid organic loan growth results Total average organic loan growth of 4.3% annualized, marks 28 consecutive linked-quarter of total organic growth 0.3% annualized commercial loan growth (impacted by acquired commercial loan sales); 9.7% annualized consumer loan growth (2) Solid organic deposit and customer repo growth results Total average organic deposit and customer repo growth of 3.8% annualized; total average organic transaction deposit and customer repo growth of 4.3% annualized (1) Operating results, a non-GAAP measure, refer to Appendix for GAAP to Non-GAAP Reconciliation details; (2) Includes Direct Installment, Indirect Installment, Residential and Consumer LOC portfolios. 20 th |
 2Q16 Operating Highlights (cont’d) Continued Positive Trends (All comparisons refer to the first quarter of 2016, except as noted) Solid profitability performance Return on average tangible assets of 1.04% (1) , Return on average tangible common equity of 14.70% (1) Core net interest margin (2) of 3.35%, slightly compressed from the first quarter of 2016. Efficiency ratio of 55.4%, compared to 56.4% in the prior quarter and 56.0% in the year-ago quarter. Second quarter 2016 reflects the seventeenth consecutive quarter below 60% 2Q16 Strategic Developments and Corporate Recognition On April 22, 2016, closed the acquisition on Pittsburgh area Fifth Third branches Recognized as Top Workplace in Northeastern Ohio by the Cleveland Plain Dealer. (1) Operating results, a non-GAAP measure, refer to Appendix for GAAP to Non-GAAP Reconciliation details; (2) Excluding accretable yield adjustments associated with acquired loan accounting 21 |
 2Q16 Financial Highlights – Quarterly Trends Current Quarter 2Q16 Previous Quarter 1Q16 Prior-Year Quarter 2Q15 Operating Earnings (1) NI available to common shareholders ($ millions) $46.1 $40.7 $38.4 Earnings per diluted common share $0.22 $0.21 $0.22 Profitability Performance ROTCE (1) 14.70% 13.71% 14.72% ROTA (1) 1.04% 1.01% 1.08% Reported net interest margin 3.41% 3.40% 3.43% Core net interest margin (2) 3.35% 3.38% 3.39% Efficiency ratio 55.4% 56.4% 56.0% Strong Balance Sheet Organic Growth Trends (Average, % Annualized) (3) Total loan growth 4.3% 8.2% 8.8% Commercial loan growth 0.3% 11.3% 9.6% Consumer loan growth (4) 9.7% 4.5% 7.6% Total deposit and customer repo growth 3.8% 6.2% 7.0% Transaction deposits and customer repo growth (5) 4.3% 7.9% 9.4% (1) Non-GAAP measure, refer to Appendix for GAAP to Non-GAAP Reconciliation details; (2) Excluding accretable yield adjustments associated with acquired loan accounting; (3) Average, annualized linked quarter organic growth results. Organic growth results exclude initial balances acquired via acquisition; (4) Includes Direct Installment, Indirect Installment, Residential and Consumer LOC portfolios; (5) Total deposits excluding time deposits. 22 |
 Investment Thesis Long-Term Investment Thesis 23 |
 Strengthens FNB’s Long Term Investment Thesis FNB’s long-term investment thesis remains unchanged with a commitment to efficient capital management and creating value for our combined shareholders Long-Term Investment Thesis: Targeted Annual Total Return for Shareholders of 9-12% Thesis Centered on a Balanced Combination of Capital Management, EPS Growth and Dividend Yield Efficient Capital Management Sustainable, Profitable Growth Attractive Dividend Yield (1) Dividend yield based on FNB stock price as of August 5, 2016. Top 100 banks and thrifts based on market cap. 24 Disciplined, profitable deployment of capital, both organically and acquisition-related, to deliver sustained EPS growth Commitment to an attractive dividend, balanced with growth and capital objectives Current dividend yield of 3.8% ranks in the top 15% among the top 100 U.S. banks and thrifts (1) Retain capital needed to support organic growth Maintain capital levels commensurate with lower-risk profile Optimize risk / reward balance New metro markets represent a significant opportunity to continue organic growth |
 Source: SNL Financial. Market data as of 8/9/2016. All estimates are based on median consensus. (1) Publicly traded banks with between $10 - $50 billion in assets nationwide. (2) Refer to appendix for Non-GAAP reconciliation Despite strong pro forma metrics, FNB currently trades at a discount to peers (1) Creating a Top Performing Bank with Superior Returns 2Q16 Operating ROATCE (2) P / 2016E EPS P / 2017E EPS 2Q16 Net Interest Margin 2Q16 Efficiency Ratio 2Q16 Operating ROTA (2) 13.6x 16.6x 15.4x 14.2x FNB Peer Upper Quartile Peer Median Peer Lower Quartile 12.4x 14.9x 13.8x 13.0x FNB Peer Upper Quartile Peer Median Peer Lower Quartile 25 55% 14.7% 1.0% 3.4% 3.7% 3.3% 3.1 % FNB Peer Upper Quartile Peer Median Peer Lower Quartile 1.2% 1.0% 0.8% FNB Peer Upper Quartile Peer Median Peer Lower Quartile 49% 61% 67% FNB Peer Upper Quartile Peer Median Peer Lower Quartile 14.2% 11.2% 9.6% FNB Peer Upper Quartile Peer Median Peer Lower Quartile |
 Pro Forma Capital Levels Position FNB for Future Growth Total Capital Ratio Note: Well-capitalized requirements in accordance with Basel III standards. Tier 1 Common Ratio Tier 1 Ratio TCE / TA 6.7% 6.9% FNB 6/30/16 Pro Forma at Close 6.5% 9.2% Well-Capitalized Requirement Pro Forma at Close 8.0% 9.6% Well-Capitalized Requirement Pro Forma at Close 10.0% 11.5% Well-Capitalized Requirement Pro Forma at Close FNB’s pro forma capital ratios are expected to exceed well-capitalized thresholds 26 |
 Source: SNL Financial. Market data as of 8/9/2016. All estimates are based on median consensus. (1) Publicly traded banks with between $10 - $50 billion in assets nationwide. Bank tangible book value valuation is highly correlated to returns on equity Transaction Impact: Significant upside Relative Valuation Compared to Peers 27 R² = 78% 0.50x 0.75x 1.00x 1.25x 1.50x 1.75x 2.00x 2.25x 2.50x 2.75x 3.00x 5% 6% 7% 8% 9% 10% 11% 12% 13% 14% 15% 16% 17% 18% 19% 20% 2017E ROATCE (%) |
 Dividend Yield Trends Relative to Peers Dividend Yield as of Respective Period-End (1) FNB % Ranking (2) 2012 91 2013 91 2014 87 2015 84 2Q16 87 (1) Represents annualized dividend yield based on share price on last trading day for each period shown; (2) Percentile ranking relative to peer median results for each period shown. Peer data per SNL Financial. 28 3.83% 3.60% 3.60% 3.80% 4.52% 2.28% 2.12% 1.87% 1.72% 1.95% 2Q16 2015 2014 2013 2012 FNB Peer Median st st th th th |
 Supplemental Information 29 |
 Supplemental Information Index Yadkin Transaction Tangible Book Value per Share Dilution Diversified Loan Portfolio Deposits and Customer Repurchase Agreements Investment Portfolio Regency Finance Company Profile Peer Group Listing GAAP to Non-GAAP Reconciliation 30 |
 Yadkin: Tangible Book Value per Share Dilution Calculation 31 Net Credit Mark Calculation Total loans at June 30, 2016 5,408 Disclosed gross credit mark 3.6% Gross credit mark 192 Deductions: Existing loan loss reserves (12) Existing YDKN credit marks from prior acquisitions (44) Net Mark 137 Tax 36% After tax 87 $ millions Millions of shares $ per share 1. YDKN Standalone TBV Roll Forward YDKN TBV as of June 30, 2016 $634 51.6 12.28 Three Quarters of Consensus Median Earnings Prior to Close 1.32 Three Quarters of $0.10 Per Share Common Dividends (0.30) Intangible Amoritzation 5.0 0.10 Standalone YDKN Tangible Book Value at Close 691 51.6 13.40 2. Calculation of Intangibles Created Yadkin TCE at close 691 (+) Net After-tax Credit Mark (87) Adjusted Tangible Book Value 604 Deal Value 1,410 Excess over Adjusted TBV 807 (+) CDI Created (63) (+) DTL on CDI 23 Goodwill created 766 Core Deposit Intangible 63 Total Intangibles Created 829 3. Calculation of TBV Dilution on Pro Forma FNB Standalone FNB Tangible Book Value at Close 1,402 210.1 6.67 Equity Consideration to Yadkin 1,410 111.4 Goodwill and Intangibles Created (829) (+) After Tax Acquisition Expenses (22) Pro Forma FNB Tangible Book Value at Close 1,960 321.5 6.10 TBV Dilution at Close (%) 8.5% |
 Diversified Loan Portfolio Note: Balance, CAGR and % of Portfolio based on period-end balances 6/30/2016 CAGR % of Portfolio ($ in millions) Balance 12/31/11- 6/30/2016 12/31/11 6/30/2016 C&I $3,015 19.3% 20% 21% CRE: Non-Owner Occupied 3,374 25.9% 17% 23% CRE: Owner Occupied 1,982 13.0% 17% 14% Commercial Leasing 265 21.3% 2% 2% Total Commercial $8,636 19.9% 56% 60% Consumer Home Equity 2,818 16.7% 21% 20% Residential Mortgage 1,647 24.2% 10% 11% Indirect 1,063 16.9% 8% 7% Other 209 4.7% 3% 1% Regency 188 3.1% 2% 1% Total Loan Portfolio $14,563 18.2% 100% 100% Well diversified portfolio Strong growth results driven by commercial loan growth $14.6 Billion Loan Portfolio June 30, 2016 C&I + Owner Occupied CRE = 34% of Total Loan Portfolio 32 Commercial & Industrial 21% Consumer Home Equity 19% Residential Mortgage 11% Indirect 7% Other 1% Regency 1% Commercial Leases 2% CRE: Non- Owner Occupied 23% CRE: Owner Occupied 14% |
 Deposits and Customer Repurchase Agreements Note: Balance, CAGR and % of Portfolio based on period-end balances; (1) Transaction deposits include savings, NOW, MMDA and non-interest bearing deposits; (2) December 31, 2011 through June 30, 2016 6/30/2016 CAGR (2) Mix % ($ in millions) Balance 12/31/11 - 6/30/16 12/31/11 6/30/16 Savings, NOW, MMDA $8,942 21.0% 48% 57% Non-Interest Bearing 3,969 27.3% 17% 25% Time Deposits 2,618 4.4% 27% 17% Customer Repos 280 -17.0% 8% 2% Total Deposits and Customer Repo Agreements $15,808 16.5% 100% 100% Transaction Deposits (1) and Customer Repo Agreements $13,191 20.1% 73% 83% Loans to Deposits and Customer Repo Agreements Ratio = 92% at June 30, 2016 New client acquisition and relationship-based focus reflected in favorable deposit mix – 16.5% average growth for transaction deposits and customer repo agreements (2) – 83% of total deposits and customer repo agreements are transaction-based deposits (1) $15.8 Billion Deposits and Customer Repo Agreements June 30, 2016 33 Non-Interest Bearing 25% Savings, NOW, MMDA 57% Customer Repos 2% Time Deposits 17% |
 % Ratings ($ in millions (1) ) Portfolio Investment % Agency MBS $1,997 48% AAA 100% CMO Agency 1,114 27% AAA 100% Agency Senior Notes 674 16% AAA 100% Municipals 314 7% AAA AA A BBB 2% 78% 20% <1% Commercial MBS (2) 54 1% AAA 100% US Treasury 31 1% AAA 100% Other 14 <1% Various/ NR Total Investment Portfolio $4,198 100% 98% of total portfolio rated AA or better, 99% rated A or better Relatively low duration of 3.0 Municipal bond portfolio Highly rated with an average rating of AA and 80.0% of the portfolio rated A or better General obligation bonds = 99.8% of portfolio 96% from municipalities located throughout Pennsylvania, Ohio and Maryland. Ratings 0.5% Investment Portfolio (1) Amounts reflect GAAP (2) Comprised of Ginnie Mae Project Loans and FNMA DUS bond holdings Highly Rated $4.2 Billion Investment Portfolio June 30, 2016 Composition 34 Available for Sale, 51% Held to Maturity, 49% AAA, 92.4% AA, 5.8% A, 1.6% BBB,BB,B CCC,CC,Ca,C Non-Rated |
 Consumer finance business with over 80 years of consumer lending experience Credit quality: 2Q16 net charge-offs to average loans of 3.63% Returns: 2Q16: ROA 4.02%, ROE 45.60%, ROTE 51.13% Regency Finance Company Profile Tennessee Ohio Pennsylvania Kentucky 77 Locations Spanning Four States Regency Finance Company $188 Million Loan Portfolio 89% of Real Estate Loans are First Mortgages 35 18% 1% 17% 64% Sales Finance Deferred Loan Fees Real Estate Direct |
 Peer Group Listing 36 Ticker Institution Ticker Institution ASB Associated Bancorp MBFI MB Financial, Inc. BANC Banc of California, Inc. NYCB New York Community Bancorp, Inc. BKU BankUnited, Inc. ONB Old National Bancorp BOH Bank of Hawaii Corporation OZRK Bank of the Ozarks, Inc. BOKF BOK Financial Corporation PACW PacWest Bancorp BPOP Popular, Inc. PB Prosperity Bancshares, Inc. BXS BancorpSouth, Inc. PBCT People’s United Financial, Inc. CATY Cathay General Bancorp SBNY Signature Bank CBSH Commerce Bancshares, Inc. SIVB SVB Financial Group CFR Cullen/Frost Bankers, Inc. SNV Synovus Financial Corp. EWBC East West Bancorp, Inc. STL Sterling Bancorp FBC Flagstar Bancorp, Inc. TCB TCF Financial Corp. FBP First Bancorp. TCBI Texas Capital Bancshares, Inc. FCNCA First Citizens BancShares, Inc. TRMK Trustmark Corp. FHB First Hawaiian, Inc. UBSI United Bankshares FHN First Horizon National Corp. UMBF UMB Financial Corp. FMBI First Midwest Bancorp UMPQ Umpqua Holdings Corporation FULT Fulton Financial Corp VLY Valley National Bancorp GWB Great Western Bancorp, Inc. WAFD Washington Federal, Inc. HBHC Hancock Holding Company WAL Western Alliance Bancorporation HTH Hilltop Holdings Inc. WBS Webster Financial Corporation IBKC IBERIABANK Corporation WTFC Wintrust Financial Corporation ISBC Investors Bancorp, Inc. |
  GAAP to Non-GAAP Reconciliation Operating Return on Average Tangible Common Equity Operating Return on Average Tangible Assets June 30, 2016 March 31, 2016 December 31, 2015 September 30, 2015 June 30, 2015 Operating net income Net income available to common shareholders 39,290 $ 24,122 $ 37,111 $ 38,043 $ 38,121 $ Add: Merger, acquisition and severance costs, net of tax 10,551 24,940 1,350 1,312 371 Add: Tax benefit of merger costs (3,693) (8,411) (360) (459) (130) Operating net income available to common shareholders 46,148 $ 40,651 $ 38,102 $ 38,896 $ 38,362 $ Operating diluted earnings per share Diluted earnings per common share 0.19 $ 0.12 $ 0.21 $ 0.22 $ 0.22 $ Add: Merger, acquisition and severance costs, net of tax 0.05 0.13 0.01 0.00 0.00 Add: Tax benefit of merger costs (0.02) (0.04) (0.00) (0.00) (0.00) Operating diluted earnings per common share 0.22 $ 0.21 $ 0.22 $ 0.22 $ 0.22 $ Operating return on average tangible common equity Operating net income avail to common shareholders (annualized) 185,606 $ 163,925 $ 151,174 $ 154,312 $ 153,870 $ Amortization of intangibles, net of tax (annualized) 10,551 8,404 6,965 6,711 6,751 196,157 $ 172,329 $ 158,139 $ 161,023 $ 160,621 $ Average shareholders' common equity 2,425,345 $ 2,222,835 $ 1,992,710 $ 1,975,162 $ 1,959,143 $ Less: Average intangible assets 1,090,542 965,594 870,843 869,110 868,133 Average tangible common equity 1,334,802 $ 1,257,240 $ 1,121,865 $ 1,106,052 $ 1,091,010 $ Operating return on average tangible common equity 14.70% 13.71% 14.10% 14.56% 14.72% Operating return on average tangible assets Operating net income (annualized) 193,691 $ 172,010 $ 159,149 $ 162,287 $ 161,933 $ Amortization of intangibles, net of tax (annualized) 10,551 8,404 6,965 6,711 6,751 204,242 $ 180,414 $ 166,114 $ 168,998 $ 168,684 $ Average total assets 20,780,413 $ 18,916,639 $ 17,076,285 $ 16,732,310 $ 16,457,166 $ Less: Average intangible assets 1,090,542 965,595 870,843 869,110 868,133 Average tangible assets 19,689,871 $ 17,951,044 $ 16,205,441 $ 15,863,200 $ 15,589,034 $ Operating return on average tangible assets 1.04% 1.01% 1.03% 1.07% 1.08% For the Quarter Ended 37 |
  GAAP to Non-GAAP Reconciliation Total Operating Revenue June 30, 2016 March 31, 2016 December 31, 2015 September 30, 2015 June 30, 2015 Total Revenue Net Interest Income (FTE) 157,160 $ 142,817 $ 129,430 $ 127,151 $ 125,572 $ Non-Interest Income 51,411 46,044 43,117 41,359 39,752 �� Less: Non-Operating Adjustments Gain on redemption of TPS - (2,442) - - - Gain (Loss) on Sale of Securities (226) (71) (503) (314) (14) Total Operating Revenue 208,344 $ 186,348 $ 172,044 $ 168,197 $ 165,310 $ For the Quarter Ended 38 |