UNITED STATES
SECURITIES AND EXCHANGE COMMISSION
WASHINGTON, D.C. 20549
FORM N-CSR
CERTIFIED SHAREHOLDER REPORT OF REGISTERED MANAGEMENT
INVESTMENT COMPANIES
Investment Company Act file number: 811-02383
ALLIANCEBERNSTEIN BOND FUND, INC.
(Exact name of registrant as specified in charter)
1345 Avenue of the Americas, New York, New York 10105
(Address of principal executive offices) (Zip code)
Joseph J. Mantineo
AllianceBernstein L.P.
1345 Avenue of the Americas
New York, New York 10105
(Name and address of agent for service)
Registrant’s telephone number, including area code: (800) 221-5672
Date of fiscal year end: September 30, 2007
Date of reporting period: September 30, 2007
| ITEM 1. | REPORTS TO STOCKHOLDERS. |
ANNUAL REPORT
AllianceBernstein Bond Fund Corporate Bond Portfolio

September 30, 2007
Annual Report
Investment Products Offered
| • | Are Not FDIC Insured |
| • | May Lose Value |
| • | Are Not Bank Guaranteed |
The investment return and principal value of an investment in the Fund will fluctuate as the prices of the individual securities in which it invests fluctuate, so that your shares, when redeemed, may be worth more or less than their original cost. You should consider the investment objectives, risks, charges and expenses of the Fund carefully before investing. For a free copy of the Fund’s prospectus, which contains this and other information, visit our web site at www.alliancebernstein.com or call your financial advisor or AllianceBernstein® at (800) 227-4618. Please read the prospectus carefully before you invest.
You may obtain performance information current to the most recent month-end by visiting www.alliancebernstein.com.
This shareholder report must be preceded or accompanied by the Fund’s prospectus for individuals who are not current shareholders of the Fund.
You may obtain a description of the Fund’s proxy voting policies and procedures, and information regarding how the Fund voted proxies relating to portfolio securities during the most recent 12-month period ended June 30, without charge. Simply visit AllianceBernstein’s web site at www.alliancebernstein.com, or go to the Securities and Exchange Commission’s (the “Commission”) web site at www.sec.gov, or call AllianceBernstein at (800) 227-4618.
The Fund files its complete schedule of portfolio holdings with the Commission for the first and third quarters of each fiscal year on Form N-Q. The Fund’s Forms N-Q are available on the Commission’s web site at www.sec.gov. The Fund’s Forms N-Q may also be reviewed and copied at the Commission’s Public Reference Room in Washington, DC; information on the operation of the Public Reference Room may be obtained by calling (800) SEC-0330.
AllianceBernstein Investments, Inc. is an affiliate of AllianceBernstein L.P., the manager of the AllianceBernstein funds, and is a member of FINRA.
AllianceBernstein® and the AB Logo are registered trademarks and service marks used by permission of the owner, AllianceBernstein L.P.
November 26, 2007
Annual Report
This report provides management’s discussion of fund performance for AllianceBernstein Bond Fund Corporate Bond Portfolio (the “Portfolio”) for the annual reporting period ended September 30, 2007. On November 16, 2007, the shareholders of AllianceBernstein Corporate Bond Portfolio (“Corporate Bond”), a series of AllianceBernstein Bond Fund, Inc. (“Bond Fund”), and AllianceBernstein High Yield Fund, Inc. (“High Yield”) approved the acquisition of the assets and liabilities of each fund by AllianceBernstein Emerging Market Debt Fund, Inc. (“Emerging Market Debt”). Emerging Market Debt, Corporate Bond and High Yield pursue the same investment objective, but Emerging Market Debt is less restricted by sector limitations than Corporate Bond or High Yield. After the proposed acquisitions, Emerging Market Debt (which will be renamed AllianceBernstein High Income Fund, Inc. in view of the recently approved broadening of its investment policies) will have complete flexibility to seek high income from foreign and domestic corporate and sovereign debt securities denominated either in the U.S. dollar or in local currencies. It will continue to invest substantially all of its assets in below investment-grade securities. The proposed acquisitions are described in more detail in the Prospectus/Proxy Statement found on the AllianceBernstein website at www.alliancebernstein.com.
Investment Objective and Policies
This open-end fund seeks to maximize total returns from price appreciation
and income. The Portfolio invests, under normal circumstances, at least 80% of its net assets in corporate bonds and other corporate debt securities. The Portfolio also invests in securities of non-corporate issuers. The Portfolio invests primarily in fixed-income securities considered investment grade but also invests in below investment-grade securities. The Portfolio may invest up to 50% of its assets in foreign (non-U.S.) fixed-income securities and in sovereign debt obligations. All of the Portfolio’s investments, whether foreign or domestic, are U.S. dollar-denominated. The Portfolio may invest in debt securities with a range of maturities from short to long term. The Portfolio may invest in mortgage-related and other asset-backed securities, loan participations, inflation-protected securities, structured securities, variable, floating- and inverse-floating-rate instruments and preferred stock, and may use other investment techniques. The Portfolio may use leverage for investment purposes. The Portfolio intends, among other things, to enter into transactions such as reverse repurchase agreements and dollar rolls. The Portfolio may invest, without limit, in derivatives, such as options, futures, forwards or swap agreements.
Investment Results
The table on page 5 shows the Portfolio’s performance compared to its benchmark, the Lehman Brothers (LB) Baa U.S. Credit Index, for the six- and 12-month periods ended September 30, 2007. Performance for the Lipper Corporate Debt BBB-Rated Funds Average has also
| ALLIANCEBERNSTEIN BOND FUND CORPORATE BOND PORTFOLIO • | 1 |
been included. Funds in the Lipper Average have generally similar investment objectives to the Portfolio, although some may have different investment policies and sales and management fees.
The Portfolio’s Class A shares without sales charges outperformed the benchmark for the 12-month period ended September 30, 2007. In January of 2007, proceeds were received and credited to the Portfolio resulting from the WorldCom class action settlement. The addition of these proceeds enhanced the Portfolio’s performance for the period by 3.04%, and was the primary contributor to the Portfolio’s outperformance for the 12-month period. If the WorldCom settlement had not occurred, the Portfolio would have underperformed the benchmark for the 12-month period. The Portfolio’s high yield allocation also contributed positively to performance during the 12-month period under review.
For the six- and 12-month periods, the Portfolio’s overweight in Tier 1 and other capital securities detracted from the Portfolio’s performance. Tier 1 capital securities and hybrids, which have rapidly gained in popularity in recent years, were a particular drag on relative performance, as a rise in systemic risk was felt hardest in junior subordinated debt. Hybrid capital securities, which are concentrated in financial issues and by their nature require investors to move down the credit spectrum, became the primary vehicle for risk reduction as systemic risk rose in the credit markets. Con-
cerns about stresses in the housing market, deteriorating credit quality and a diminished willingness by the market to finance leveraged acquisitions all caused hybrid spreads to widen sharply. Lastly, the Portfolio’s high yield allocation detracted from performance during the six-month period.
Market Review and Investment Strategy
The past several months have seen the return of volatility to the capital markets, as the credit crisis in the U.S. subprime market spilled over—in the form of a liquidity crunch—into other sectors and asset classes and even the overnight funding market. As investors flocked to the safety of the highest-quality securities, government bond yields fell worldwide and yield spreads widened across fixed income.
Serious delinquencies on U.S. subprime mortgage loans began to climb early in 2007, with the most recent loans—those that originated in 2006 and 2007—experiencing delinquencies at an unprecedented rate. In turn, cumulative loan losses began to rise as well. Many subprime lenders went bankrupt or otherwise closed their doors, making refinancing impossible for many subprime homeowners and all but ensuring losses. Securitizations of subprime debt—whether in the form of asset-backed securities (ABS) or collateralized debt obligations (CDOs)—also dried up with vanished investor demand, draining liquidity out of these markets. Concern next mounted for the asset-backed commercial paper (ABCP) market.
| 2 | • ALLIANCEBERNSTEIN BOND FUND CORPORATE BOND PORTFOLIO |
Central banks—including the European Central Bank, the U.S. Federal Reserve (the “Fed”), the Bank of Japan, the Bank of Canada and the Reserve Bank of Australia—responded by injecting liquidity into the markets by way of cheap loans to banks; the Fed also cut its discount rate. These measures culminated in the Fed’s dramatic 50-basis-point ease, which aimed to restore confidence in the financial markets and put the economy on firmer footing. Markets responded favorably, as evidenced by the subsequent tightening of yield spreads in September—though spreads remain well above pre-crisis levels.
Despite several months of negative returns during the last six months of the annual period, the Baa-rated credit bond market posted a positive return of 4.33% for the 12-month period ended September 30, 2007 as represented by Lehman Brothers; however, this market underperformed duration–neutral Treasuries by -1.32% during the same time period. Except for gaming, which returned -6.65%, and home construction, which returned -2.81%, all industries posted positive returns, with higher-rated AAA credit outperforming the lower-rated quality tiers during the period. Intermediate credit at 4.67% outperformed long credit at 2.96% for the 12-month period ended September 30, 2007, as
longer maturity securities were nega tively impacted by rising long-term rates.
Within the Portfolio, spread duration remained shorter than the benchmark throughout much of the 12-month reporting period until it was increased to a near neutral position late in the period. The Portfolio remained underweight in long duration credit and overweight in the five-to-10 year duration segment. Earlier in the reporting period, the potential for rising systemic risk, an environment of a flat or inverted yield curve supported the Global Credit Investment Team’s (the “Team’s”) strategy of underweighting credit exposure versus the benchmark. Today, on a risk-adjusted basis, investment-grade corporate bonds look attractive from both quantitative and fundamental perspectives. U.S. corporate credit metrics are still robust, with leverage low and profits continuing to grow, albeit modestly. The Team believes that the Fed’s rate cut has improved the odds of profit reacceleration into 2008. Therefore, the Team viewed the recent market volatility as an opportunity to increase the Portfolio’s exposure to investment-grade corporates at the expense of mortgages, moving closer to a neutral stance in credit. Finally, the Team recently reduced the Portfolio’s position in junior subordinated holdings.
| ALLIANCEBERNSTEIN BOND FUND CORPORATE BOND PORTFOLIO • | 3 |
HISTORICAL PERFORMANCE
An Important Note About the Value of Historical Performance
The performance shown on the following pages represents past performance and does not guarantee future results. Current performance may be lower or higher than the performance information shown. You may obtain performance information current to the most recent month-end by visiting www.alliancebernstein.com.
The investment return and principal value of an investment in the Portfolio will fluctuate, so that your shares, when redeemed, may be worth more or less than their original cost. You should consider the investment objectives, risks, charges and expenses of the Portfolio carefully before investing. For a free copy of the Portfolio’s prospectus, which contains this and other information, visit our website at www.alliancebernstein.com or call your financial advisor or AllianceBernstein Investments at 800.227.4618. You should read the prospectus carefully before you invest.
All fees and expenses related to the operation of the Portfolio have been deducted. NAV returns do not reflect sales charges; if sales charges were reflected, the Portfolio’s quoted performance would be lower. SEC returns reflect the applicable sales charges for each share class: a 4.25% maximum front-end sales charge for Class A shares; the applicable contingent deferred sales charge for Class B shares (3% year 1, 2% year 2, 1% year 3, 0% year 4); a 1% 1 year contingent deferred sales charge for Class C shares. Returns for the different share classes will vary due to different expenses associated with each class. Performance assumes reinvestment of distributions and does not account for taxes.
Benchmark Disclosure
The unmanaged Lehman Brothers (LB) Baa U.S. Credit Index does not reflect fees and expenses associated with the active management of a mutual fund portfolio. The LB Baa U.S. Credit Index contains both corporate and non-corporate sectors that are rated investment grade. The unmanaged Lipper Corporate Debt BBB-Rated Funds Average (the “Lipper Average”) is based on the performance of a universe of funds that invest at least 65% of their assets in corporate or government debt issues rated in the top four grades. For the 12- and six-month periods ended September 30, 2007, the Lipper Average consisted of 154 and 144 funds, respectively. These funds have generally similar investment objectives to the Portfolio, although some may have different investment policies and sales and management fees. An investor cannot invest directly in an index or an average, and their results are not indicative of the performance for any specific investment, including the Portfolio.
A Word About Risk
The Portfolio can invest in foreign securities, including in emerging markets, which may magnify fluctuations due to changes in foreign exchange rates and the possibility of substantial volatility due to political and economic uncertainties in foreign countries. Price fluctuation in the Portfolio’s securities may be caused by changes in the general level of interest rates or changes in bond credit quality ratings. Please note, as interest rates rise, existing bond prices fall and can cause the value of an investment in the Portfolio to decline. Changes in interest rates have a greater effect on bonds with longer maturities than on those with shorter maturities. High yield bonds, otherwise known as “junk bonds,” involve a greater risk of default and price volatility than other bonds. Investing in below-investment-grade securities presents special risks, including credit risk. Investments in the Portfolio are not guaranteed because of fluctuation in the net asset value of the underlying fixed-income related investments. Similar to direct bond ownership, bond funds have the same interest rate, inflation and credit risks that are associated with the underlying bonds owned by the Portfolio. Portfolio purchasers should understand that, in contrast to owning individual bonds, there are ongoing fees and expenses associated with owning shares of bond funds. This Portfolio can utilize leverage as an investment strategy. When a Portfolio borrows money or otherwise leverages its portfolio, it may be volatile because leverage tends to exaggerate the effect of any increase or decrease in the value of a Portfolio’s investments. A Portfolio may create leverage through the use of reverse repurchase arrangements, forward contracts or dollar rolls or by borrowing money. While the Portfolio invests principally in bonds and other fixed-income securities, in order to achieve its investment objectives, the Portfolio may at times use certain types of investment derivatives, such as options, futures, forwards and swaps. These instruments involve risks different from, and in certain cases, greater than, the risks presented by more traditional investments. These risks are fully discussed in the Portfolio’s prospectus.
(Historical Performance continued on next page)
| 4 | • ALLIANCEBERNSTEIN BOND FUND CORPORATE BOND PORTFOLIO |
Historical Performance
HISTORICAL PERFORMANCE
(continued from previous page)
| THE PORTFOLIO VS. ITS BENCHMARK PERIODS ENDED SEPTEMBER 30, 2007 | Returns | |||||
| 6 Months | 12 Months | |||||
AllianceBernstein Bond Fund Corporate Bond Portfolio† | ||||||
Class A | -0.50% | 5.65% | ||||
Class B | -0.94% | 4.89% | ||||
Class C | -0.85% | 4.91% | ||||
Advisor Class* | -0.44% | 5.96% | ||||
Class R* | -0.69% | 5.30% | ||||
Class K* | -0.50% | 5.67% | ||||
Class I* | -0.35% | 5.99% | ||||
Lehman Brothers Baa U.S. Credit Index | 1.00% | 4.33% | ||||
Lipper Corporate Debt BBB-Rated Funds Average | 1.25% | 4.57% | ||||
* Please note that these share classes are for investors purchasing shares through accounts established under certain fee-based programs sponsored and maintained by certain broker-dealers and financial intermediaries, institutional pension plans and/or investment advisory clients of, and certain other persons associated with, the Adviser and its affiliates or the Funds. | ||||||
† Reflects the positive impact of proceeds related to class action settlements that were originated from individual fund holdings. For further information, please visit: www.alliancebernstein.com/CmsObjectABD/PDF/HistoricalPricing/settlements.pdf. | ||||||
GROWTH OF A $10,000 INVESTMENT IN THE PORTFOLIO 9/30/97 TO 9/30/07
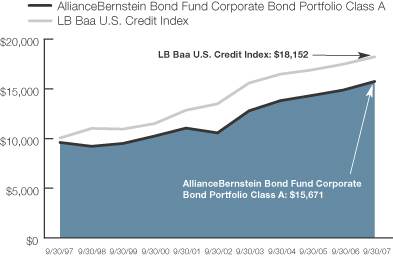
This chart illustrates the total value of an assumed $10,000 investment in AllianceBernstein Bond Fund Corporate Bond Portfolio Class A shares (from 9/30/97 to 9/30/07) as compared to the performance of the Portfolio’s benchmark, the Lehman Brothers Baa U.S. Credit Index. The chart reflects the deduction of the maximum 4.25% sales charge from the initial $10,000 investment in the Portfolio and assumes the reinvestment of dividends and capital gains distributions.
See Historical Performance and Benchmark disclosures on previous page.
(Historical Performance continued on next page)
| ALLIANCEBERNSTEIN BOND FUND CORPORATE BOND PORTFOLIO • | 5 |
Historical Performance
HISTORICAL PERFORMANCE
(continued from previous page)
| AVERAGE ANNUAL RETURNS AS OF SEPTEMBER 30, 2007 | |||||||||||
| NAV Returns | SEC Returns | SEC Yields** | |||||||||
| Class A Shares | 5.23 | % | |||||||||
1 Year | 5.65 | % | 1.12 | % | |||||||
5 Years | 8.32 | % | 7.38 | % | |||||||
10 Years | 5.05 | % | 4.60 | % | |||||||
| Class B Shares | 4.72 | % | |||||||||
1 Year | 4.89 | % | 1.89 | % | |||||||
5 Years | 7.53 | % | 7.53 | % | |||||||
10 Years(a) | 4.60 | % | 4.60 | % | |||||||
| Class C Shares | 4.75 | % | |||||||||
1 Year | 4.91 | % | 3.91 | % | |||||||
5 Years | 7.55 | % | 7.55 | % | |||||||
10 Years | 4.31 | % | 4.31 | % | |||||||
| Advisor Class Shares† | 5.77 | % | |||||||||
1 Year | 5.96 | % | 5.96 | % | |||||||
5 Years | 8.60 | % | 8.60 | % | |||||||
Since Inception* | 9.33 | % | 9.33 | % | |||||||
| Class R Shares† | 5.07 | % | |||||||||
1 Year | 5.30 | % | 5.30 | % | |||||||
Since Inception* | 5.23 | % | 5.23 | % | |||||||
| Class K Shares† | 5.39 | % | |||||||||
1 Year | 5.67 | % | 5.67 | % | |||||||
Since Inception* | 3.33 | % | 3.33 | % | |||||||
| Class I Shares† | 5.71 | % | |||||||||
1 Year | 5.99 | % | 5.99 | % | |||||||
Since Inception* | 3.65 | % | 3.65 | % | |||||||
The Portfolio’s current prospectus fee table shows the Portfolio’s total annual operating expense ratios as 1.11%, 1.84%, 1.82%, 0.81%, 1.39%, 1.03% and 0.75% for Class A, Class B, Class C, Advisor Class, Class R, Class K and Class I, respectively.
(a) | Assumes conversion of Class B shares into Class A shares after six years. |
| * | Inception Dates: 8/8/02 for Advisor Class shares; 11/3/03 for Class R shares; 3/1/05 for Class K and Class I shares. |
| ** | SEC yields are calculated based on SEC guidelines for the 30-day period ended September 30, 2007. |
| † | These share classes are offered at net asset value (NAV) to eligible investors and their SEC returns are the same as the NAV returns. Please note that these share classes are for investors purchasing shares through accounts established under certain fee-based programs sponsored and maintained by certain broker-dealers and financial intermediaries, institutional pension plans and/or investment advisory clients of, and certain other persons associated with, the Adviser and its affiliates or the Funds. The inception dates for these share classes are listed above. |
See Historical Performance disclosures on page 4.
(Historical Performance continued on next page)
| 6 | • ALLIANCEBERNSTEIN BOND FUND CORPORATE BOND PORTFOLIO |
Historical Performance
HISTORICAL PERFORMANCE
(continued from previous page)
| SEC AVERAGE ANNUAL RETURNS (WITH ANY APPLICABLE SALES CHARGES) AS OF THE MOST RECENT CALENDAR QUARTER-END (SEPTEMBER 30, 2007) | |||
| SEC Returns | |||
| Class A Shares | |||
1 Year | 1.12 | % | |
5 Years | 7.38 | % | |
10 Years | 4.60 | % | |
| Class B Shares | |||
1 Year | 1.89 | % | |
5 Years | 7.53 | % | |
10 Years(a) | 4.60 | % | |
| Class C Shares | |||
1 Year | 3.91 | % | |
5 Years | 7.55 | % | |
10 Years | 4.31 | % | |
| Advisor Class Shares† | |||
1 Year | 5.96 | % | |
5 Years | 8.60 | % | |
Since Inception* | 9.33 | % | |
| Class R Shares† | |||
1 Year | 5.30 | % | |
Since Inception* | 5.23 | % | |
| Class K Shares† | |||
1 Year | 5.67 | % | |
Since Inception* | 3.33 | % | |
| Class I Shares† | |||
1 Year | 5.99 | % | |
Since Inception* | 3.65 | % | |
(a) | Assumes conversion of Class B shares into Class A shares after six years. |
| * | Inception Dates: 8/8/02 for Advisor Class shares; 11/3/03 for Class R shares; 3/1/05 for Class K and Class I shares. |
| † | Please note that these share classes are for investors purchasing shares through accounts established under certain fee-based programs sponsored and maintained by certain broker-dealers and financial intermediaries, institutional pension plans and/or investment advisory clients of, and certain other persons associated with, the Adviser and its affiliates or the Funds. The inception dates for each class are listed above. |
See Historical Performance disclosures on page 4.
| ALLIANCEBERNSTEIN BOND FUND CORPORATE BOND PORTFOLIO • | 7 |
Historical Performance
FUND EXPENSES
As a shareholder of the Fund, you incur two types of costs: (1) transaction costs, including sales charges (loads) on purchase payments, contingent deferred sales charges on redemptions and (2) ongoing costs, including management fees; distribution (12b-1) fees; and other Fund expenses. This example is intended to help you understand your ongoing costs (in dollars) of investing in the Fund and to compare these costs with the ongoing costs of investing in other mutual funds.
The Example is based on an investment of $1,000 invested at the beginning of the period and held for the entire period as indicated below.
Actual Expenses
The table below provides information about actual account values and actual expenses. You may use the information, together with the amount you invested, to estimate the expenses that you paid over the period. Simply divide your account value by $1,000 (for example, an $8,600 account value divided by $1,000 = 8.6), then multiply the result by the number under the heading entitled “Expenses Paid During Period” to estimate the expenses you paid on your account during this period.
Hypothetical Example for Comparison Purposes
The table below also provides information about hypothetical account values and hypothetical expenses based on the Fund’s actual expense ratio and an assumed annual rate of return of 5% before expenses, which is not the Fund’s actual return. The hypothetical account values and expenses may not be used to estimate the actual ending account balance or expenses you paid for the period. You may use this information to compare the ongoing costs of investing in the Fund and other funds by comparing this 5% hypothetical example with the 5% hypothetical examples that appear in the shareholder reports of other funds.
Please note that the expenses shown in the table are meant to highlight your ongoing costs only and do not reflect any transactional costs, such as sales charges (loads), or contingent deferred sales charges on redemptions. Therefore, the hypothetical example is useful in comparing ongoing costs only, and will not help you determine the relative total costs of owning different funds. In addition, if these transactional costs were included, your costs would have been higher.
| Beginning Account Value April 1, 2007 | Ending Account Value September 30, 2007 | Expenses Paid During Period* | ||||||||||||||||
| Actual | Hypothetical | Actual | Hypothetical** | Actual | Hypothetical | |||||||||||||
| Class A | $ | 1,000 | $ | 1,000 | $ | 995.03 | $ | 1,019.85 | $ | 5.20 | $ | 5.27 | ||||||
| Class B | $ | 1,000 | $ | 1,000 | $ | 990.58 | $ | 1,016.14 | $ | 8.88 | $ | 9.00 | ||||||
| Class C | $ | 1,000 | $ | 1,000 | $ | 991.51 | $ | 1,016.24 | $ | 8.79 | $ | 8.90 | ||||||
| Advisor Class | $ | 1,000 | $ | 1,000 | $ | 995.61 | $ | 1,021.31 | $ | 3.75 | $ | 3.80 | ||||||
| Class R | $ | 1,000 | $ | 1,000 | $ | 993.09 | $ | 1,018.00 | $ | 7.04 | $ | 7.13 | ||||||
| Class K | $ | 1,000 | $ | 1,000 | $ | 994.95 | $ | 1,019.45 | $ | 5.60 | $ | 5.67 | ||||||
| Class I | $ | 1,000 | $ | 1,000 | $ | 996.45 | $ | 1,021.26 | $ | 3.80 | $ | 3.85 | ||||||
| * | Expenses are equal to the classes’ annualized expense ratios of 1.04%, 1.78%, 1.76%, 0.75%, 1.41%, 1.12% and 0.76%, respectively, multiplied by the average account value over the period, multiplied by 183/365 (to reflect the one-half year period). |
| ** | Assumes 5% return before expenses. |
| 8 | • ALLIANCEBERNSTEIN BOND FUND CORPORATE BOND PORTFOLIO |
Fund Expenses
PORTFOLIO SUMMARY
September 30, 2007
PORTFOLIO STATISTICS
Net Assets ($mil): $584.7
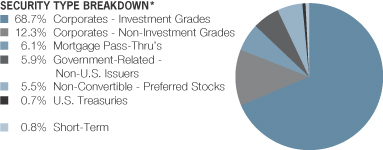
All data are as of September 30, 2007. The Portfolio’s security type breakdown is expressed as a percentage of total investments (excluding security lending collateral) and may vary over time.
Please note: The issuer classifications presented herein are based on the Lehman Brothers Fixed Income Indices developed by Lehman Brothers. The fund components are divided either into duration, country, bond ratings or corporate sectors as classified by Lehman Brothers. These sector classifications are broadly defined. The “Portfolio of Investments” section of the report reflects more specific industry information and is consistent with the investment restrictions discussed in the fund’s prospectus.
| ALLIANCEBERNSTEIN BOND FUND CORPORATE BOND PORTFOLIO • | 9 |
Portfolio Summary
PORTFOLIO OF INVESTMENTS
September 30, 2007
Principal | U.S. $ Value | |||||
CORPORATES - INVESTMENT | ||||||
Industrial – 40.6% | ||||||
Basic – 5.5% | ||||||
Alcan, Inc. | $ | 3,500 | $ | 3,431,827 | ||
Inco Ltd. | 7,995 | 7,803,943 | ||||
International Steel Group, Inc. | 2,565 | 2,546,848 | ||||
Southern Copper Corp. | 3,900 | 4,234,277 | ||||
Teck Cominco, Ltd. | 5,000 | 4,681,670 | ||||
Union Carbide Corp. | 5,000 | 5,273,060 | ||||
Weyerhaeuser Co. | 4,300 | 4,314,478 | ||||
| 32,286,103 | ||||||
Capital Goods – 2.1% | ||||||
Lafarge SA | 2,500 | 2,557,547 | ||||
Tyco International Group, SA | 9,550 | 9,639,961 | ||||
| 12,197,508 | ||||||
Communications - Media – 9.2% | ||||||
BSKYB Finance UK PLC | 4,000 | 3,880,620 | ||||
Comcast Cable Communications Holdings, Inc. | 15,420 | 19,609,475 | ||||
News America Holdings, Inc. | 1,800 | 1,992,730 | ||||
News America, Inc. | 5,000 | 4,828,785 | ||||
Reed Elsevier Capital, Inc. | 5,000 | 4,919,625 | ||||
RR Donnelley & Sons Co. | 2,400 | 2,263,524 | ||||
Time Warner, Inc. | 5,000 | 5,490,070 | ||||
Turner Broadcasting System, Inc. | 9,473 | 10,595,579 | ||||
| 53,580,408 | ||||||
Communications - Telecommunications – 8.3% | ||||||
Bellsouth Capital Funding Corp. | 3,800 | 4,392,310 | ||||
| 10 | • ALLIANCEBERNSTEIN BOND FUND CORPORATE BOND PORTFOLIO |
Portfolio of Investments
Principal | U.S. $ Value | |||||
Embarq Corp. | $ | 5,000 | $ | 5,198,655 | ||
7.082%, 6/01/16 | 4,300 | 4,457,767 | ||||
Nextel Communications, Inc. | 7,000 | 7,114,135 | ||||
Series E | 5,000 | 5,019,995 | ||||
Rogers Cable, Inc. | 1,500 | 1,616,175 | ||||
Sprint Capital Corp. | 4,500 | 4,342,941 | ||||
Telecom Italia Capital SA | 5,000 | 4,868,085 | ||||
Verizon New Jersey, Inc. | 2,500 | 2,543,062 | ||||
Verizon New York, Inc. | 4,290 | 4,567,284 | ||||
Vodafone Group PLC | 3,800 | 4,357,920 | ||||
| 48,478,329 | ||||||
Consumer Cyclical - Other – 1.6% | ||||||
DR Horton, Inc. | 4,256 | 3,952,164 | ||||
Starwood Hotels & Resorts Worldwide, Inc. | 5,035 | 5,209,921 | ||||
| 9,162,085 | ||||||
Consumer Cyclical - Retailers – 1.8% | ||||||
Federated Department Stores, Inc. | 2,500 | 2,576,927 | ||||
JC Penney Corp., Inc. | 4,100 | 4,324,713 | ||||
Ltd. Brands, Inc. | 3,500 | 3,516,804 | ||||
| 10,418,444 | ||||||
Consumer Non-Cyclical – 7.1% | ||||||
Altria Group, Inc. | 5,000 | 6,142,875 | ||||
Fisher Scientific International, Inc. | 3,000 | 2,945,274 | ||||
The Kroger Co. | 5,250 | 4,962,793 | ||||
7.50%, 4/01/31(b) | 2,000 | 2,203,194 | ||||
Reynolds American, Inc. | 9,000 | 9,582,327 | ||||
| ALLIANCEBERNSTEIN BOND FUND CORPORATE BOND PORTFOLIO • | 11 |
Portfolio of Investments
Principal | U.S. $ Value | |||||
Safeway, Inc. | $ | 5,000 | $ | 5,091,395 | ||
7.25%, 2/01/31(b) | 2,000 | 2,143,436 | ||||
Sara Lee Corp. | 1,600 | 1,492,546 | ||||
Tyson Foods, Inc. | 7,000 | 7,213,619 | ||||
| 41,777,459 | ||||||
Energy – 2.5% | ||||||
Duke Capital LLC | 3,000 | 3,330,945 | ||||
Gazprom | 5,000 | 4,956,000 | ||||
Tengizchevroil Finance Co. | 6,215 | 6,121,153 | ||||
| 14,408,098 | ||||||
Technology – 1.4% | ||||||
Electronic Data Systems Corp. | 6,000 | 6,053,574 | ||||
Motorola, Inc. | 2,035 | 1,970,529 | ||||
7.50%, 5/15/25 | 325 | 337,318 | ||||
| 8,361,421 | ||||||
Transportation - Railroads – 1.1% | ||||||
CSX Transportation, Inc. | 5,200 | 6,629,912 | ||||
| 237,299,767 | ||||||
Financial Institutions – 18.7% | ||||||
Banking – 6.8% | ||||||
BOI Capital Funding Number 2 | 1,425 | 1,274,859 | ||||
Credit Agricole SA/London | 3,000 | 2,818,584 | ||||
Dresdner Funding Trust I | 10,000 | 10,846,420 | ||||
HBOS PLC | 5,000 | 4,426,230 | ||||
Mizuho Financial Group Cayman Ltd. | 9,100 | 9,478,378 | ||||
MUFG Capital Finance 1 Ltd. | 2,400 | 2,281,361 | ||||
Resona Preferred Global Securities | 5,000 | 5,017,605 | ||||
Russia Agriculture Bank Rshb C | 1,550 | 1,464,440 | ||||
| 12 | • ALLIANCEBERNSTEIN BOND FUND CORPORATE BOND PORTFOLIO |
Portfolio of Investments
Principal | U.S. $ Value | |||||
Washington Mutual Preferred Funding Trust I | $ | 2,700 | $ | 2,471,067 | ||
| 40,078,944 | ||||||
Brokerage – 1.2% | ||||||
The Bear Stearns Cos, Inc. | 3,500 | 3,430,836 | ||||
Lehman Brothers Holdings, Inc. | 3,600 | 3,348,713 | ||||
| 6,779,549 | ||||||
Finance – 2.5% | ||||||
CIT Group, Inc. | 4,200 | 3,830,656 | ||||
Countrywide Financial Corp. | 716 | 671,096 | ||||
Countrywide Home Loans, Inc. | 78 | 69,839 | ||||
ILFC E-Capital Trust II | 1,500 | 1,445,876 | ||||
iStar Financial, Inc. | 2,500 | 2,407,500 | ||||
Series 1 | 3,700 | 3,311,404 | ||||
SLM Corp. | 3,000 | 2,827,005 | ||||
| 14,563,376 | ||||||
Insurance – 7.7% | ||||||
AMBAC Financial Group, Inc. | 1,000 | 862,818 | ||||
Coventry Health Care, Inc. | 1,660 | 1,668,859 | ||||
5.95%, 3/15/17 | 1,415 | 1,368,363 | ||||
Farmers Insurance Exchange | 3,000 | 3,438,828 | ||||
Humana, Inc. | 2,200 | 2,231,783 | ||||
Liberty Mutual Group, Inc. | 5,000 | 5,140,625 | ||||
North Front Pass Through Trust | 5,000 | 4,865,290 | ||||
Ohio Casualty Corp. | 6,650 | 7,112,308 | ||||
WellPoint, Inc. | 4,400 | 4,047,490 | ||||
| ALLIANCEBERNSTEIN BOND FUND CORPORATE BOND PORTFOLIO • | 13 |
Portfolio of Investments
Principal | U.S. $ Value | |||||
WR Berkley Corp. | $ | 7,500 | $ | 7,348,800 | ||
ZFS Finance USA Trust I | 7,000 | 6,921,873 | ||||
| 45,007,037 | ||||||
Other Finance – 0.5% | ||||||
ORIX Corp. | 3,000 | 2,941,536 | ||||
| 109,370,442 | ||||||
Utility – 8.3% | ||||||
Electric – 4.2% | ||||||
Constellation Energy Group, Inc. | 3,700 | 4,127,879 | ||||
Dominion Resources, Inc./VA | 4,100 | 4,170,401 | ||||
FPL Group Capital, Inc. | 5,000 | 4,744,580 | ||||
Kansas Gas & Electric | 5,000 | 4,775,150 | ||||
Potomac Edison Co. | 3,500 | 3,385,445 | ||||
Xcel Energy, Inc. | 3,300 | 3,283,408 | ||||
| 24,486,863 | ||||||
Natural Gas – 4.1% | ||||||
Energy Transfer Partners, LP | 1,500 | 1,462,332 | ||||
Enterprise Products Operating LP | 10,000 | 9,386,170 | ||||
6.65%, 10/15/34 | 3,000 | 2,984,988 | ||||
Source Gas LLC | 3,000 | 2,887,866 | ||||
Southern Union Co. | 3,200 | 3,372,461 | ||||
TransCanada Pipelines Ltd. | 4,500 | 4,318,848 | ||||
| 24,412,665 | ||||||
| 48,899,528 | ||||||
Total Corporates - Investment Grades | 395,569,737 | |||||
| 14 | • ALLIANCEBERNSTEIN BOND FUND CORPORATE BOND PORTFOLIO |
Portfolio of Investments
Principal | U.S. $ Value | |||||
CORPORATES - NON-INVESTMENT | ||||||
Industrial – 7.0% | ||||||
Basic – 0.5% | ||||||
Packaging Corp. of America | $ | 2,825 | $ | 2,796,956 | ||
Communications - Media – 2.5% | ||||||
Clear Channel Communications, Inc. | 2,500 | 2,092,452 | ||||
DirecTV Holdings LLC | 5,155 | 4,890,806 | ||||
Echostar DBS Corp. | 4,300 | 4,396,750 | ||||
Insight Midwest LP | 1,039 | 1,040,299 | ||||
Shaw Communications, Inc. | 655 | 669,738 | ||||
7.25%, 4/06/11 | 1,235 | 1,265,875 | ||||
| 14,355,920 | ||||||
Communications - Telecommunications – 0.2% | ||||||
Windstream Corp. | 1,369 | 1,440,873 | ||||
Consumer Cyclical - Other – 2.1% | ||||||
Harrahs Operating Co. Inc. | 10,000 | 8,100,000 | ||||
MGM Mirage | 4,500 | 4,426,875 | ||||
| 12,526,875 | ||||||
Consumer Cyclical - Retailers – 0.9% | ||||||
GSC Holdings Corp. | 5,000 | 5,200,000 | ||||
Consumer Non-Cyclical – 0.5% | ||||||
Boston Scientific Corp. | 3,000 | 2,880,000 | ||||
Energy – 0.3% | ||||||
Tesoro Corp. | 1,500 | 1,503,750 | ||||
| 40,704,374 | ||||||
Utility – 3.7% | ||||||
Electric – 3.3% | ||||||
Edison Mission Energy | 2,280 | 2,245,800 | ||||
Indiantown Cogeneration LP | 5,301 | 5,599,140 | ||||
| ALLIANCEBERNSTEIN BOND FUND CORPORATE BOND PORTFOLIO • | 15 |
Portfolio of Investments
| Principal Amount (000) | U.S. $ Value | |||||
Reliant Energy, Inc. | $ | 450 | $ | 453,375 | ||
7.875%, 6/15/17 | 560 | 563,500 | ||||
TECO Energy, Inc. | 5,000 | 5,186,735 | ||||
TXU Corp. | 7,000 | 5,645,570 | ||||
| 19,694,120 | ||||||
Natural Gas – 0.4% | ||||||
Williams Cos, Inc. | 2,100 | 2,249,625 | ||||
| 21,943,745 | ||||||
Financial Institutions – 1.5% | ||||||
Banking – 0.2% | ||||||
Russian Standard Finance | 1,314 | 1,152,903 | ||||
Insurance – 1.3% | ||||||
AFC Capital Trust I | 5,000 | 4,843,710 | ||||
Liberty Mutual Group, Inc. | 2,705 | 2,510,051 | ||||
| 7,353,761 | ||||||
| 8,506,664 | ||||||
Total Corporates - Non-Investment Grades | 71,154,783 | |||||
MORTGAGE PASS-THRU’S – 6.0% | ||||||
Fixed Rate 30-Year – 6.0% | ||||||
Federal National Mortgage Association | 27,338 | 25,376,229 | ||||
Series 2007 | 9,738 | 9,538,831 | ||||
Total Mortgage Pass-Thru’s | 34,915,060 | |||||
GOVERNMENT-RELATED - NON-U.S. ISSUERS – 5.8% | ||||||
Sovereigns – 5.8% | ||||||
United Mexican States | 24,000 | 23,940,000 | ||||
Republic of South Africa | 10,000 | 9,837,500 | ||||
Total Government-Related - Non-U.S. Issuers | 33,777,500 | |||||
| 16 | • ALLIANCEBERNSTEIN BOND FUND CORPORATE BOND PORTFOLIO |
Portfolio of Investments
| Principal Amount (000) | U.S. $ Value | ||||||
NON-CONVERTIBLE - PREFERRED STOCKS – 5.4% | |||||||
Industrial – 3.8% | |||||||
Communications - Telecommunications – 3.8% | |||||||
Centaur Funding Corp. | 20,280 | $ | 22,523,475 | ||||
Financial Institutions – 1.6% | |||||||
Banking – 1.0% | |||||||
Royal Bank of Scotland Group PLC | 200,000 | 4,490,000 | |||||
Santander Finance Preferred SA | 67,000 | 1,557,750 | |||||
| 6,047,750 | |||||||
Other Finance – 0.6% | |||||||
Capital One Capital II | 130,000 | 3,203,200 | |||||
| 9,250,950 | |||||||
Total Non-Convertible - Preferred Stocks | 31,774,425 | ||||||
U.S. TREASURIES – 0.7% | |||||||
U.S. Treasury Note | $ | 4,000 | 4,069,688 | ||||
| Shares | |||||||
SHORT-TERM INVESTMENTS – 0.8% | |||||||
Investment Companies – 0.8% | |||||||
AllianceBernstein Fixed-Income Shares, Inc. – Prime STIF Portfolio(d) | 4,478,799 | 4,478,799 | |||||
Total Investments Before Security Lending Collateral – 98.5% | 575,739,992 | ||||||
INVESTMENT OF CASH COLLATERAL FOR SECURITIES LOANED – 4.4% | |||||||
Short Terms – 4.4% | |||||||
UBS Private Money Market Fund, LLC | 26,040,066 | 26,040,066 | |||||
Total Investments – 102.9% | 601,780,058 | ||||||
Other assets less liabilities – (2.9)% | (17,126,137 | ) | |||||
Net Assets – 100.0% | $ | 584,653,921 | |||||
| ALLIANCEBERNSTEIN BOND FUND CORPORATE BOND PORTFOLIO • | 17 |
Portfolio of Investments
CREDIT DEFAULT SWAP CONTRACTS (see Note D)
| Swap Counterparty & Referenced Obligation | Notional Amount (000) | Interest Rate | Termination Date | Unrealized Appreciation/ (Depreciation) | ||||||||
Buy Contracts: | ||||||||||||
Merrill Lynch Reed Elsevier Capital, Inc. | $ | 5,000 | 0.32 | % | 6/20/12 | $ | (16,963 | ) | ||||
Morgan Stanley Time Warner | 5,000 | 0.37 | 6/20/11 | (11,150 | ) | |||||||
Sale Contracts: | ||||||||||||
Merrill Lynch Union Pacific Corp. | 6,000 | 0.53 | 12/20/15 | 42,088 | ||||||||
| (a) | Security is exempt from registration under Rule 144A of the Securities Act of 1933. These securities are considered liquid and may be resold in transactions exempt from registration, normally to qualified institutional buyers. At September 30, 2007, the aggregate market value of these securities amounted to $97,967,315 or 16.8% of net assets. |
| (b) | Represents entire or partial securities out on loan. See Note E for securities lending information. |
| (c) | Variable rate coupon, rate shown as of September 30, 2007. |
| (d) | Investment in affiliated money market mutual fund. |
| See notes to financial statements. |
| 18 | • ALLIANCEBERNSTEIN BOND FUND CORPORATE BOND PORTFOLIO |
Portfolio of Investments
STATEMENT OF ASSETS & LIABILITIES
September 30, 2007
| Assets | ||||
Investments in securities, at value | ||||
Unaffiliated issuers (cost $602,918,100 – including investment of cash collateral for securities loaned of $26,040,066) | $ | 597,301,259 | (a) | |
Affiliated issuers (cost $4,478,799) | 4,478,799 | |||
Cash | 59,240 | |||
Interest and dividends receivable | 10,344,736 | |||
Receivable for capital stock sold | 4,636,153 | |||
Unrealized appreciation of swap contracts | 42,088 | |||
Total assets | 616,862,275 | |||
| Liabilities | ||||
Payable for collateral on securities loaned | 26,040,066 | |||
Payable for capital stock redeemed | 4,325,310 | |||
Dividends payable | 778,903 | |||
Advisory fee payable | 239,912 | |||
Distribution fee payable | 228,610 | |||
Transfer Agent fee payable | 77,280 | |||
Unrealized depreciation of swap contracts | 28,113 | |||
Administrative fee payable | 27,749 | |||
Accrued expenses | 462,411 | |||
Total liabilities | 32,208,354 | |||
Net Assets | $ | 584,653,921 | ||
| Composition of Net Assets | ||||
Capital stock, at par | $ | 49,306 | ||
Additional paid-in capital | 832,005,493 | |||
Distributions in excess of net investment income | (545,282 | ) | ||
Accumulated net realized loss on investment transactions | (241,252,730 | ) | ||
Net unrealized depreciation on investments | (5,602,866 | ) | ||
| $ | 584,653,921 | |||
Net Asset Value Per Share—21 billion shares of capital stock authorized,
$.001 par value
| Class | Net Assets | Shares Outstanding | Net Asset Value | ||||||
| A | $ | 434,507,793 | 36,636,208 | $ | 11.86 | * | |||
| B | $ | 59,170,526 | 4,995,585 | $ | 11.84 | ||||
| C | $ | 85,843,903 | 7,241,493 | $ | 11.85 | ||||
| Advisor | $ | 3,878,247 | 327,219 | $ | 11.85 | ||||
| R | $ | 651,059 | 54,883 | $ | 11.86 | ||||
| K | $ | 332,590 | 28,042 | $ | 11.86 | ||||
| I | $ | 269,803 | 22,741 | $ | 11.86 | ||||
| * | The maximum offering price per share for Class A shares was $12.39 which reflects a sales charge of 4.25%. |
| (a) | Includes securities on loan with a value of $24,882,342 (see Note E). |
| See notes to financial statements. |
| ALLIANCEBERNSTEIN BOND FUND CORPORATE BOND PORTFOLIO • | 19 |
Statement of Assets & Liabilities
STATEMENT OF OPERATIONS
Year Ended September 30, 2007
| Investment Income | ||||||||
Interest | $ | 33,495,785 | ||||||
Dividends | ||||||||
Unaffiliated issuers | 3,761,328 | |||||||
Affiliated issuers | 435,519 | $ | 37,692,632 | |||||
| Expenses | ||||||||
Advisory fee (see Note B) | 2,986,007 | |||||||
Distribution fee—Class A | 1,259,555 | |||||||
Distribution fee—Class B | 820,499 | |||||||
Distribution fee—Class C | 878,149 | |||||||
Distribution fee—Class R | 1,409 | |||||||
Distribution fee—Class K | 759 | |||||||
Transfer agency—Class A | 619,989 | |||||||
Transfer agency—Class B | 159,194 | |||||||
Transfer agency—Class C | 141,447 | |||||||
Transfer agency—Advisor Class | 9,483 | |||||||
Transfer agency—Class R | 754 | |||||||
Transfer agency—Class K | 614 | |||||||
Transfer agency—Class I | 378 | |||||||
Printing | 385,347 | |||||||
Custodian | 213,833 | |||||||
Administrative | 108,991 | |||||||
Audit | 81,216 | |||||||
Registration fees | 80,067 | |||||||
Legal | 39,810 | |||||||
Directors’ fees | 36,453 | |||||||
Miscellaneous | 16,814 | |||||||
Total expenses | 7,840,768 | |||||||
Less: expense offset arrangement | (49,867 | ) | ||||||
Net expenses | 7,790,901 | |||||||
Net investment income | 29,901,731 | |||||||
| Realized and Unrealized Gain (Loss) on Investment Transactions | ||||||||
Net realized gain (loss) on: | ||||||||
Investment transactions | 13,763,098 | |||||||
Swap contracts | (547,218 | ) | ||||||
Net change in unrealized appreciation/depreciation of: | ||||||||
Investments | (9,989,337 | ) | ||||||
Swap contracts | (1,154,610 | ) | ||||||
Net gain on investment transactions | 2,071,933 | |||||||
Net Increase in Net Assets from Operations | $ | 31,973,664 | ||||||
See notes to financial statements.
| 20 | • ALLIANCEBERNSTEIN BOND FUND CORPORATE BOND PORTFOLIO |
Statement of Operations
STATEMENT OF CHANGES IN NET ASSETS
| Year Ended September 30, 2007 | Year Ended September 30, 2006 | |||||||
| Increase (Decrease) in Net Assets from Operations | ||||||||
Net investment income | $ | 29,901,731 | $ | 32,431,046 | ||||
Net realized gain (loss) on investment transactions | 13,215,880 | (4,842,396 | ) | |||||
Net change in unrealized appreciation/depreciation of investment transactions | (11,143,947 | ) | (7,045,801 | ) | ||||
Net increase in net assets from operations | 31,973,664 | 20,542,849 | ||||||
| Dividends to Shareholders from | ||||||||
Net investment income | ||||||||
Class A | (22,410,940 | ) | (22,942,215 | ) | ||||
Class B | (3,770,947 | ) | (5,779,960 | ) | ||||
Class C | (4,064,109 | ) | (4,433,687 | ) | ||||
Advisor Class | (362,564 | ) | (289,824 | ) | ||||
Class R | (14,317 | ) | (4,155 | ) | ||||
Class K | (16,207 | ) | (1,687 | ) | ||||
Class I | (16,729 | ) | (5,133 | ) | ||||
| Capital Stock Transactions | ||||||||
Net decrease | (28,649,865 | ) | (136,946,182 | ) | ||||
Total decrease | (27,332,014 | ) | (149,859,994 | ) | ||||
| Net Assets | ||||||||
Beginning of period | 611,985,935 | 761,845,929 | ||||||
End of period (including undistributed net investment income/(distributions in excess of) of ($545,282) and $77,048, respectively) | $ | 584,653,921 | $ | 611,985,935 | ||||
See notes to financial statements.
| ALLIANCEBERNSTEIN BOND FUND CORPORATE BOND PORTFOLIO • | 21 |
Statement of Changes in Net Assets
NOTES TO FINANCIAL STATEMENTS
September 30, 2007
NOTE A
Significant Accounting Policies
AllianceBernstein Bond Fund, Inc. (the “Fund”) is registered under the Investment Company Act of 1940 as a diversified, open-end management investment company. The Fund, which is a Maryland corporation, operates as a series company currently comprised of three portfolios: the Corporate Bond Portfolio, the Intermediate Bond Portfolio and the U.S. Government Portfolio. Each series is considered to be a separate entity for financial reporting and tax purposes. This report relates only to the Corporate Bond Portfolio. The Corporate Bond Portfolio (the “Portfolio”) offers Class A, Class B, Class C, Advisor Class, Class R, Class K and Class I shares. Class A shares are sold with a front-end sales charge of up to 4.25% for purchases not exceeding $1,000,000. With respect to purchases of $1,000,000 or more, Class A shares redeemed within one year of purchase may be subject to a contingent deferred sales charge of 1%. Class B shares are currently sold with a contingent deferred sales charge which declines from 3% to zero depending on the period of time the shares are held. Class B shares will automatically convert to Class A shares six years after the end of the calendar month of purchase. Class C shares are subject to a contingent deferred sales charge of 1% on redemptions made within the first year after purchase. Class R and Class K shares are sold without an initial or contingent deferred sales charge. Advisor Class and Class I shares are sold without an initial or contingent deferred sales charge and are not subject to ongoing distribution expenses. All seven classes of shares have identical voting, dividend, liquidation and other rights, except that the classes bear different distribution and transfer agency expenses. Each class has exclusive voting rights with respect to its distribution plan. The financial statements have been prepared in conformity with U.S. generally accepted accounting principles which require management to make certain estimates and assumptions that affect the reported amounts of assets and liabilities in the financial statements and amounts of income and expenses during the reporting period. Actual results could differ from those estimates. The following is a summary of significant accounting policies followed by the Portfolio.
1. Security Valuation
Portfolio securities are valued at their current market value determined on the basis of market quotations or, if market quotations are not readily available or are deemed unreliable, at “fair value” as determined in accordance with procedures established by and under the general supervision of the Fund’s Board of Directors.
In general, the market value of securities which are readily available and deemed reliable are determined as follows. Securities listed on a national securities exchange (other than securities listed on the NASDAQ Stock Market, Inc. (“NASDAQ”)) or on a foreign securities exchange are valued at the last sale price at the close of the exchange or foreign securities exchange. If there has
| 22 | • ALLIANCEBERNSTEIN BOND FUND CORPORATE BOND PORTFOLIO |
Notes to Financial Statements
been no sale on such day, the securities are valued at the mean of the closing bid and asked prices on such day. Securities listed on more than one exchange are valued by reference to the principal exchange on which the securities are traded; securities listed only on NASDAQ are valued in accordance with the NASDAQ Official Closing Price; listed put or call options are valued at the last sale price. If there has been no sale on that day, such securities will be valued at the closing bid prices on that day; open futures contracts and options thereon are valued using the closing settlement price or, in the absence of such a price, the most recent quoted bid price. If there are no quotations available for the day of valuation, the last available closing settlement price is used; securities traded in the over-the-counter market, (“OTC”) are valued at the mean of the current bid and asked prices as reported by the National Quotation Bureau or other comparable sources; U.S. Government securities and other debt instruments having 60 days or less remaining until maturity are valued at amortized cost if their original maturity was 60 days or less; or by amortizing their fair value as of the 61st day prior to maturity if their original term to maturity exceeded 60 days; fixed-income securities, including mortgage backed and asset backed securities, may be valued on the basis of prices provided by a pricing service or at a price obtained from one or more of the major broker/dealers. In cases where broker/dealer quotes are obtained, AllianceBernstein L.P. (the “Adviser”) may establish procedures whereby changes in market yields or spreads are used to adjust, on a daily basis, a recently obtained quoted price on a security; and OTC and other derivatives are valued on the basis of a quoted bid price or spread from a major broker/dealer in such security.
Securities for which market quotations are not readily available (including restricted securities) or are deemed unreliable are valued at fair value. Factors considered in making this determination may include, but are not limited to, information obtained by contacting the issuer, analysts, analysis of the issuer’s financial statements or other available documents. In addition, the Fund may use fair value pricing for securities primarily traded in non-U.S. markets because most foreign markets close well before the Fund values its securities at 4:00 p.m., Eastern Time. The earlier close of these foreign markets gives rise to the possibility that significant events, including broad market moves, may have occurred in the interim and may materially affect the value of those securities.
2. Taxes
It is the Portfolio’s policy to meet the requirements of the Internal Revenue Code applicable to regulated investment companies and to distribute all of its investment company taxable income and net realized gains, if any, to shareholders. Therefore, no provisions for federal income or excise taxes are required. The Portfolio may be subject to taxes imposed by countries in which it invests. Such taxes are generally based on income and/or capital gains earned or repatriated. Taxes are accrued and applied to net investment income, net realized gains and net unrealized appreciation/depreciation as such income and/or gains are earned.
| ALLIANCEBERNSTEIN BOND FUND CORPORATE BOND PORTFOLIO • | 23 |
Notes to Financial Statements
3. Investment Income and Investment Transactions
Dividend income is recorded on the ex-dividend date or as soon as the Portfolio is informed of the dividend. Interest income is accrued daily. Investment transactions are accounted for on the trade date the securities are purchased or sold. Investment gains and losses are determined on the identified cost basis. The Portfolio amortizes premiums and accretes discounts as adjustments to interest income.
4. Class Allocations
All income earned and expenses incurred by the Portfolio are borne on a pro-rata basis by each outstanding class of shares, based on the proportionate interest in the Portfolio represented by the net assets of such class, except for class specific expenses which are allocated to the respective class. Realized and unrealized gains and losses are allocated among the various share classes based on respective net assets.
5. Dividends and Distributions
Dividends and distributions to shareholders, if any, are recorded on the ex-dividend date. Income dividends and capital gains distributions are determined in accordance with federal tax regulations and may differ from those determined in accordance with U.S. generally accepted accounting principles. To the extent these differences are permanent, such amounts are reclassified within the capital accounts based on their federal tax basis treatment; temporary differences do not require such reclassification.
NOTE B
Advisory Fee and Other Transactions with Affiliates
Under the terms of the investment advisory agreement, the Portfolio pays the Adviser an advisory fee at an annual rate of .50% of the first $2.5 billion, .45% of the next $2.5 billion and .40% in excess of $5 billion, of the Portfolio’s average daily net assets. The fee is accrued daily and paid monthly.
Pursuant to the Advisory agreement, the Portfolio paid $108,991 to the Adviser representing the cost of certain legal and accounting services provided to the Portfolio by the Adviser for the year ended September 30, 2007.
The Portfolio compensates AllianceBernstein Investor Services, Inc. (“ABIS”), a wholly-owned subsidiary of the Adviser, under a Transfer Agency Agreement for providing personnel and facilities to perform transfer agency services for the Fund. ABIS may make payments to intermediaries that provide omnibus account services, sub-accounting services and/or networking services. Such compensation retained by ABIS amounted to $461,928 for the year ended September 30, 2007.
For the year ended September 30, 2007, the Portfolio’s expenses were reduced by $49,867 under an expense offset arrangement with ABIS.
| 24 | • ALLIANCEBERNSTEIN BOND FUND CORPORATE BOND PORTFOLIO |
Notes to Financial Statements
AllianceBernstein Investments, Inc. (the “Distributor”), a wholly-owned subsidiary of the Adviser, serves as the distributor of the Portfolio’s shares. The Distributor has advised the Portfolio that it has retained front-end sales charge of $21,874 from the sale of Class A shares and received $5,742, $34,835 and $5,104 in contingent deferred sales charges imposed upon redemptions by shareholders of Class A, Class B and Class C shares, respectively, for the year ended September 30, 2007.
The Portfolio may invest in the AllianceBernstein Fixed-Income Shares, Inc. –Prime STIF Portfolio and the AllianceBernstein Fixed-Income Shares, Inc. –Government STIF Portfolio (collectively, the “STIF Portfolios”), open-end management investment companies managed by the Adviser. The STIF Portfolios are offered as cash management options to mutual funds, trusts, and other accounts managed by the Adviser, and are not available for direct purchase by members of the public. The STIF Portfolios pay no investment management fees.
NOTE C
Distribution Services Agreement
The Portfolio has adopted a Distribution Services Agreement (the “Agreement”) pursuant to Rule 12b-1 under the Investment Company Act of 1940. Under the Agreement, the Portfolio pays distribution and servicing fees to the Distributor at an annual rate of up to .30% of the Portfolio’s average daily net assets attributable to Class A shares, 1% of the Portfolio’s average daily net assets attributable to both Class B and Class C shares, .50% of the Portfolio’s average daily net assets attributable to Class R shares and .25% of the Portfolio’s average daily net assets attributable to Class K shares. There are no distribution and servicing fees on the Advisor Class and Class I shares. The fees are accrued daily and paid monthly. The Agreement provides that the Distributor will use such payments in their entirety for distribution assistance and promotional activities. The Distributor has incurred expenses in excess of the distribution costs reimbursed by the Portfolio in the amounts of $9,827,942, $5,876,095, $12,751 and $2,151 for Class B, Class C, Class R and Class K shares, respectively. While such costs may be recovered from the Portfolio in future periods so long as the Agreement is in effect, the rate of the distribution and servicing fees payable under the Agreement may not be increased without a shareholder vote. In accordance with the Agreement, there is no provision for recovery of unreimbursed distribution costs incurred by the Distributor beyond the current fiscal year for Class A shares. The Agreement also provides that the Adviser may use its own resources to finance the distribution of the Portfolio’s shares.
| ALLIANCEBERNSTEIN BOND FUND CORPORATE BOND PORTFOLIO • | 25 |
Notes to Financial Statements
NOTE D
Investment Transactions
Purchases and sales of investment securities (excluding short-term investments) for the year ended September 30, 2007 were as follows:
| Purchases | Sales | |||||
Investment securities (excluding U.S. government securities) | $ | 211,839,526 | $ | 265,174,250 | ||
U.S. government securities | 77,779,807 | 36,056,380 | ||||
The cost of investments for federal income tax purposes, gross unrealized appreciation and unrealized depreciation (excluding swaps) are as follows:
Cost | $ | 607,549,063 | ||
Gross unrealized appreciation | $ | 7,433,632 | ||
Gross unrealized depreciation | (13,202,636 | ) | ||
Net unrealized depreciation | $ | (5,769,004 | ) | |
1. Option Transactions
For hedging and investment purposes, the Portfolio may purchase and write (sell) put and call options on U.S. and foreign government securities and foreign currencies that are traded on U.S. and foreign securities exchanges and over-the-counter markets.
The risk associated with purchasing an option is that the Portfolio pays a premium whether or not the option is exercised. Additionally, the Portfolio bears the risk of loss of the premium and change in market value should the counterparty not perform under the contract. Put and call options purchased are accounted for in the same manner as portfolio securities. The cost of securities acquired through the exercise of call options is increased by premiums paid. The proceeds from securities sold through the exercise of put options are decreased by the premiums paid.
When the Portfolio writes an option, the premium received by the Portfolio is recorded as a liability and is subsequently adjusted to the current market value of the option written. Premiums received from written options which expire unexercised are recorded by the Portfolio on the expiration date as realized gains from options written. The difference between the premium received and the amount paid on effecting a closing purchase transaction, including brokerage commissions, is also treated as a realized gain, or if the premium received is less than the amount paid for the closing purchase transaction, as a realized loss. If a call option is exercised, the premium received is added to the proceeds from the sale of the underlying security or currency in determining whether the Portfolio has realized a gain or loss. If a put option is exercised, the premium received reduces the cost basis of the security or currency purchased by the Portfolio. In writing an option, the Portfolio bears the market risk of an unfavorable change
| 26 | • ALLIANCEBERNSTEIN BOND FUND CORPORATE BOND PORTFOLIO |
Notes to Financial Statements
in the price of the security or currency underlying the written option. Exercise of an option written by the Portfolio could result in the Portfolio selling or buying a security or currency at a price different from the current market value. For the year ended September 30, 2007, the Portfolio had no transactions in written options.
2. Swap Agreements
The Portfolio may enter into swaps to hedge its exposure to interest rates and credit risk or for investment purposes. A swap is an agreement that obligates two parties to exchange a series of cash flows at specified intervals based upon or calculated by reference to changes in specified prices or rates for a specified amount of an underlying asset. The payment flows are usually netted against each other, with the difference being paid by one party to the other.
Risks may arise as a result of the failure of the counterparty to the swap contract to comply with the terms of the swap contract. The loss incurred by the failure of a counterparty is generally limited to the net interim payment to be received by the Portfolio, and/or the termination value at the end of the contract. Therefore, the Portfolio considers the creditworthiness of each counterparty to a swap contract in evaluating potential credit risk. Additionally, risks may arise from unanticipated movements in interest rates or in the value of the underlying securities.
As of October 1, 2003, the Portfolio has adopted the method of accounting for interim payments on swap contracts in accordance with Financial Accounting Standards Board Statement No. 133. The Portfolio accrues for the interim payments on swap contracts on a daily basis, with the net amount recorded within unrealized appreciation/depreciation of swap contracts on the statement of assets and liabilities. Once the interim payments are settled in cash, the net amount is recorded as realized gain/loss on swaps, in addition to realized gain/loss recorded upon termination of swap contracts on the statement of operations. Prior to October 1, 2003, these interim payments were reflected within interest income/expense in the statement of operations. Fluctuations in the value of swap contracts are recorded as a component of net change in unrealized appreciation/depreciation of investments.
The Portfolio may enter into credit default swaps. The Portfolio may purchase credit protection on the referenced obligation of the credit default swap (“Buy Contract”) or provide credit protection on the referenced obligation of the credit default swap (“Sale Contract”). A sale/(buy) in a credit default swap provides upon the occurrence of a credit event, as defined in the swap agreement, for the Portfolio to buy/(sell) from/(to) the counterparty at the notional amount (the “Notional Amount”) and receive/(deliver) the principal amount of the referenced obligation. If a credit event occurs, the maximum payout amount for a Sale Contract is limited to the Notional Amount of the swap contract (“Maximum Payout Amount”). During the term of the swap agreement, the Portfolio receives/(pays) fixed payments from/(to) the respective counterparty,
| ALLIANCEBERNSTEIN BOND FUND CORPORATE BOND PORTFOLIO • | 27 |
Notes to Financial Statements
calculated at the agreed upon interest rate applied to the Notional Amount. These interim payments are recorded within unrealized appreciation/depreciation of swap contracts on the statement of assets and liabilities.
Credit default swaps may involve greater risks than if a Portfolio had invested in the referenced obligation directly. Credit default swaps are subject to general market risk, liquidity risk, counterparty risk and credit risk. If the Portfolio is a buyer and no credit event occurs, it will lose its investment. In addition, if the Portfolio is a seller and a credit event occurs, the value of the referenced obligation received by the Portfolio coupled with the periodic payments previously received, may be less than the Maximum Payout Amount it pays to the buyer, resulting in a loss to the Portfolio.
At September 30, 2007, the Portfolio had Sale Contracts outstanding with Maximum Payout Amounts aggregating $6,000,000, with net unrealized appreciation of $42,088, and term of 3 years, as reflected in the portfolio of investments.
In certain circumstances, the Portfolio may hold Sale Contracts on the same referenced obligation and with the same counterparty it has purchased credit protection, which may reduce its obligation to make payments on Sale Contracts, if a credit event occurs.
3. Reverse Repurchase Agreements
Under a reverse repurchase agreement, the Portfolio sells securities and agrees to repurchase them at a mutually agreed upon date and price. At the time the Portfolio enters into a reverse repurchase agreement, it will establish a segregated account with the custodian containing liquid assets having a value at least equal to the repurchase price.
For the year ended September 30, 2007, the Portfolio had no transactions in reverse repurchase agreements.
4. Financial Futures Contracts
The Portfolio may buy or sell financial futures contracts for the purpose of hedging its portfolio against adverse effects of anticipated movements in the market. The Portfolio bears the market risk that arises from changes in the value of these financial instruments and the imperfect correlation between movements in the price of the futures contracts and movements in the price of the securities hedged or used for cover.
At the time the Portfolio enters into a futures contract, the Portfolio deposits and maintains as collateral an initial margin with the broker, as required by the exchange on which the transaction is effected. Pursuant to the contract, the Portfolio agrees to receive from or pay to the broker an amount of cash equal to the daily fluctuation in the value of the contract. Such receipts or payments are
| 28 | • ALLIANCEBERNSTEIN BOND FUND CORPORATE BOND PORTFOLIO |
Notes to Financial Statements
known as variation margin and are recorded by the Portfolio as unrealized gains or losses. Risks may arise from the potential inability of a counterparty to meet the terms of the contract. When the contract is closed, the Portfolio records a realized gain or loss equal to the difference between the value of the contract at the time it was opened and the time it was closed.
NOTE E
Securities Lending
The Portfolio has entered into a securities lending agreement with AG Edwards & Sons, Inc. (the “Lending Agent”). Under the terms of the agreement, the Lending Agent, on behalf of the Portfolio, administers the lending of portfolio securities to certain broker-dealers. In return, the Portfolio receives fee income from the lending transactions or it retains a portion of interest on the investment of any cash received as collateral. The Portfolio also continues to receive dividends or interest on the securities loaned. Under the terms of the securities lending agreement, security voting rights pass to the borrower, although the Portfolio can at will terminate a loan regaining the right to vote. Unrealized gain or loss on the value of the securities loaned that may occur during the term of the loan will be reflected in the accounts of the Portfolio. All loans are continuously secured by collateral exceeding the value of the securities loaned. All collateral consists of either cash or U.S. government securities. The Lending Agent may invest the cash collateral received in accordance with the investment restrictions of the Portfolio in one or more of the following investments: U.S. government or U.S. government agency obligations, bank obligations, corporate debt obligations, asset-backed securities, investment funds, structured products, repurchase agreements and an eligible money market fund. The Lending Agent will indemnify the Portfolio for any loss resulting from a borrower’s failure to return a loaned security when due. As of September 30, 2007, the Portfolio had loaned securities with a value of $24,882,342 and received cash collateral which was invested in short-term securities valued at $26,040,066 as included in the accompanying portfolio of investments. For the year ended September 30, 2007, the Portfolio earned fee income of $42,699 which is included in interest income in the accompanying statement of operations.
| ALLIANCEBERNSTEIN BOND FUND CORPORATE BOND PORTFOLIO • | 29 |
Notes to Financial Statements
NOTE F
Capital Stock
Each class consists of 3,000,000,000 authorized shares. Transactions in capital shares for each class were as follows:
| Shares | Amount | |||||||||||||||||
| Year Ended September 30, 2007 | Year Ended September 30, 2006 | Year Ended September 30, 2007 | Year Ended September 30, 2006 | |||||||||||||||
| Class A | ||||||||||||||||||
Shares sold | 7,180,152 | 4,016,871 | $ | 86,359,080 | $ | 47,460,818 | ||||||||||||
Shares issued in reinvestment of dividends | 1,201,449 | 1,421,001 | 14,414,166 | 16,688,135 | ||||||||||||||
Shares converted from Class B | 2,156,352 | 1,549,291 | 25,936,677 | 18,205,393 | ||||||||||||||
Shares redeemed | (9,007,422 | ) | (12,098,632 | ) | (108,184,991 | ) | (141,944,764 | ) | ||||||||||
Net increase (decrease) | 1,530,531 | (5,111,469 | ) | $ | 18,524,932 | $ | (59,590,418 | ) | ||||||||||
| Class B | ||||||||||||||||||
Shares sold | 680,906 | 568,651 | $ | 8,217,255 | $ | 6,746,239 | ||||||||||||
Shares issued in reinvestment of dividends | 179,946 | 345,832 | 2,160,732 | 4,059,344 | ||||||||||||||
Shares converted to Class A | (2,158,851 | ) | (1,551,187 | ) | (25,936,677 | ) | (18,205,393 | ) | ||||||||||
Shares redeemed | (2,085,146 | ) | (4,567,131 | ) | (25,033,531 | ) | (53,557,445 | ) | ||||||||||
Net decrease | (3,383,145 | ) | (5,203,835 | ) | $ | (40,592,221 | ) | $ | (60,957,255 | ) | ||||||||
| Class C | ||||||||||||||||||
Shares sold | 953,789 | 729,227 | $ | 11,444,848 | $ | 8,623,570 | ||||||||||||
Shares issued in reinvestment of dividends | 176,345 | 235,393 | 2,113,747 | 2,762,415 | ||||||||||||||
Shares redeemed | (1,578,119 | ) | (2,492,475 | ) | (18,945,344 | ) | (29,249,350 | ) | ||||||||||
Net decrease | (447,985 | ) | (1,527,855 | ) | $ | (5,386,749 | ) | $ | (17,863,365 | ) | ||||||||
| Advisor Class | ||||||||||||||||||
Shares sold | 551,951 | 116,355 | $ | 6,675,929 | $ | 1,379,179 | ||||||||||||
Shares issued in reinvestment of dividends | 29,252 | 23,818 | 350,817 | 279,359 | ||||||||||||||
Shares redeemed | (715,288 | ) | (92,863 | ) | (8,501,657 | ) | (1,097,124 | ) | ||||||||||
Net increase (decrease) | (134,085 | ) | 47,310 | $ | (1,474,911 | ) | $ | 561,414 | ||||||||||
| 30 | • ALLIANCEBERNSTEIN BOND FUND CORPORATE BOND PORTFOLIO |
Notes to Financial Statements
| Shares | Amount | |||||||||||||||||
| Year Ended September 30, 2007 | Year Ended September 30, 2006 | Year Ended September 30, 2007 | Year Ended September 30, 2006 | |||||||||||||||
| Class R | ||||||||||||||||||
Shares sold | 49,235 | 11,499 | $ | 592,479 | $ | 134,961 | ||||||||||||
Shares issued in reinvestment of dividends | 1,148 | 338 | 13,717 | 3,949 | ||||||||||||||
Shares redeemed | (8,162 | ) | (1,913 | ) | (97,915 | ) | (22,485 | ) | ||||||||||
Net increase | 42,221 | 9,924 | $ | 508,281 | $ | 116,425 | ||||||||||||
| Class K | ||||||||||||||||||
Shares sold | 32,839 | 51,419 | $ | 390,167 | $ | 603,189 | ||||||||||||
Shares issued in reinvestment of dividends | 1,211 | 14 | 14,370 | 158 | ||||||||||||||
Shares redeemed | (58,257 | ) | – 0 – | (709,547 | ) | – 0 – | ||||||||||||
Net increase (decrease) | (24,207 | ) | 51,433 | $ | (305,010 | ) | $ | 603,347 | ||||||||||
| Class I | ||||||||||||||||||
Shares sold | 13,129 | 19,527 | $ | 158,902 | $ | 226,810 | ||||||||||||
Shares issued in reinvestment of dividends | 1,387 | 385 | 16,666 | 4,467 | ||||||||||||||
Shares redeemed | (8,405 | ) | (4,099 | ) | (99,755 | ) | (47,607 | ) | ||||||||||
Net increase | 6,111 | 15,813 | $ | 75,813 | $ | 183,670 | ||||||||||||
NOTE G
Joint Credit Facility
A number of open-end mutual funds managed by the Adviser, including the Portfolio, participate in a $250 million revolving credit facility (the “Facility”) intended to provide short-term financing if necessary, subject to certain restrictions in connection with abnormal redemption activity. Commitment fees related to the Facility are paid by the participating funds and are included in miscellaneous expenses in the statement of operations. The Portfolio did not utilize the Facility during the year ended September 30, 2007.
NOTE H
Risks Involved in Investing in the Portfolio
Interest Rate Risk and Credit Risk—Interest rate risk is the risk that changes in interest rates will affect the value of the Portfolio’s investments in fixed-income debt securities such as bonds or notes. Increases in interest rates may cause the value of the Portfolio’s investments to decline. Credit risk is the risk that the issuer or guarantor of a debt security, or the counterparty to a derivative contract, will be unable or unwilling to make timely principal and/or interest payments, or to otherwise honor its obligations. The degree of risk for a particular security may be reflected in its credit risk rating. Credit risk is greater for
| ALLIANCEBERNSTEIN BOND FUND CORPORATE BOND PORTFOLIO • | 31 |
Notes to Financial Statements
medium quality and lower-rated securities. Lower-rated debt securities and similar unrated securities (commonly known as “junk bonds”) have speculative elements or are predominantly speculative risks.
Foreign Securities Risk—Investing in securities of foreign companies or foreign governments involves special risks which include changes in foreign currency exchange rates and the possibility of future political and economic developments which could adversely affect the value of such securities. Moreover, securities of many foreign companies or foreign governments and their markets may be less liquid and their prices more volatile than those of comparable U.S. companies or of the U.S. government.
Indemnification Risk—In the ordinary course of business, the Portfolio enters into contracts that contain a variety of indemnifications. The Portfolio’s maximum exposure under these arrangements is unknown. However, the Portfolio has not had prior claims or losses pursuant to these indemnification provisions and expects the risk of loss thereunder to be remote.
NOTE I
Distributions to Shareholders
The tax character of distributions paid during the fiscal years ended September 30, 2007 and September 30, 2006 were as follows:
| 2007 | 2006 | |||||
Distributions paid from: | ||||||
Ordinary income | $ | 30,655,813 | $ | 33,456,661 | ||
Long-term capital gain | –0– | –0– | ||||
Total taxable distributions | 30,655,813 | 33,456,661 | ||||
Total distributions paid | $ | 30,655,813 | $ | 33,456,661 | ||
As of September 30, 2007, the components of accumulated earnings/(deficit) on a tax basis were as follows:
Undistributed ordinary income | $ | 399,759 | ||
Accumulated capital and other losses | (241,252,728 | )(a) | ||
Unrealized appreciation/(depreciation) | (5,769,004 | )(b) | ||
Total accumulated earnings/(deficit) | $ | (246,621,973 | )(c) | |
(a) | On September 30, 2007, the Portfolio had a net capital loss carryforward for federal income tax purposes of $241,252,728 of which $54,554,000 expires in the year 2008, $52,066,319 expires in the year 2009 and $134,632,409 expires in the year 2010. To the extent future capital gains are offset by capital loss carryforwards, such gains will not be distributed. During the fiscal year, the Portfolio utilized capital loss carryforwards of $6,727,979. In addition, the Portfolio had expired capital loss carryforward of $35,482,052 for fiscal year. |
(b) | The differences between book-basis and tax-basis unrealized appreciation/(depreciation) are attributable primarily to the tax deferral of losses on wash sales, the difference between book and tax treatment of swap income and the difference between book and tax amortization methods for premium. |
(c) | The difference between book-basis and tax-basis components of accumulated earnings/(deficit) is attributable to dividends payable. |
| 32 | • ALLIANCEBERNSTEIN BOND FUND CORPORATE BOND PORTFOLIO |
Notes to Financial Statements
During the current fiscal year, permanent differences primarily due to the tax treatment of swaps, paydown gain reclassification, consent fee reclassification, tax treatment of bond premium, and capital loss carryforward expiration resulted in a net decrease in distributions in excess of net investment income, a net decrease to accumulated net realized loss on investment transactions and a net decrease to additional paid in capital. This reclassification had no effect on net assets.
NOTE J
Legal Proceedings
On October 2, 2003, a purported class action complaint entitled Hindo, et al. v. AllianceBernstein Growth & Income Fund, et al. (“Hindo Complaint”) was filed against the Adviser, Alliance Capital Management Holding L.P. (“Alliance Holding”), Alliance Capital Management Corporation, AXA Financial, Inc., the AllianceBernstein Funds, certain officers of the Adviser (“AllianceBernstein defendants”), and certain other unaffiliated defendants, as well as unnamed Doe defendants. The Hindo Complaint was filed in the United States District Court for the Southern District of New York by alleged shareholders of two of the AllianceBernstein Funds. The Hindo Complaint alleges that certain of the AllianceBernstein defendants failed to disclose that they improperly allowed certain hedge funds and other unidentified parties to engage in “late trading” and “market timing” of AllianceBernstein Fund securities, violating Sections 11 and 15 of the Securities Act, Sections 10(b) and 20(a) of the Exchange Act and Sections 206 and 215 of the Advisers Act. Plaintiffs seek an unspecified amount of compensatory damages and rescission of their contracts with the Adviser, including recovery of all fees paid to the Adviser pursuant to such contracts.
Following October 2, 2003, 43 additional lawsuits making factual allegations generally similar to those in the Hindo Complaint were filed in various federal and state courts against the Adviser and certain other defendants. All state court actions against the Adviser either were voluntarily dismissed or removed to federal court. On February 20, 2004, the Judicial Panel on Multidistrict Litigation transferred all federal actions to the United States District Court for the District of Maryland (the “Mutual Fund MDL”). On September 29, 2004, plaintiffs filed consolidated amended complaints with respect to four claim types: mutual fund shareholder claims; mutual fund derivative claims; derivative claims brought on behalf of Alliance Holding; and claims brought under ERISA by participants in the Profit Sharing Plan for Employees of the Adviser. All four complaints include substantially identical factual allegations, which appear to be based in large part on the Order of the SEC dated December 18, 2003 as amended and restated January 14, 2004 (“SEC Order) and the New York State Attorney General Assurance of Discontinuance dated September 1, 2004 (“NYAG Order”).
On April 21, 2006, the Adviser and attorneys for the plaintiffs in the mutual fund shareholder claims, mutual fund derivative claims, and ERISA claims
| ALLIANCEBERNSTEIN BOND FUND CORPORATE BOND PORTFOLIO • | 33 |
Notes to Financial Statements
entered into a confidential memorandum of understanding (“MOU”) containing their agreement to settle these claims. The agreement will be documented by a stipulation of settlement and will be submitted for court approval at a later date. The settlement amount ($30 million) which the Adviser previously accrued and disclosed, has been disbursed. The derivative claims brought on behalf of Alliance Holding, in which plaintiffs seek an unspecified amount of damages, remain pending.
It is possible that these matters and/or other developments resulting from these matters could result in increased redemptions of the AllianceBernstein Mutual Funds’ shares or other adverse consequences to the AllianceBernstein Mutual Funds. This may require the AllianceBernstein Mutual Funds to sell investments held by those funds to provide for sufficient liquidity and could also have an adverse effect on the investment performance of the AllianceBernstein Mutual Funds. However, the Adviser believes that these matters are not likely to have a material adverse effect on its ability to perform advisory services relating to the AllianceBernstein Mutual Funds.
NOTE K
Recent Accounting Pronouncements
On July 13, 2006, the Financial Accounting Standards Board (“FASB”) released FASB Interpretation No. 48 “Accounting for Uncertainty in Income Taxes” (“FIN 48”). FIN 48 provides guidance for how uncertain tax positions should be recognized, measured, presented and disclosed in the financial statements. FIN 48 requires the evaluation of tax positions taken or expected to be taken in the course of preparing a fund’s tax returns to determine whether the tax positions are “more-likely-than-not” of being sustained by the applicable tax authority. Tax positions not deemed to meet the more-likely-than-not threshold would be recorded in the current period. Adoption of FIN 48 is required for fiscal years beginning after December 15, 2006 and is to be applied to all open tax years as of the effective date. On December 22, 2006, the Securities and Exchange Commission notified the industry that the implementation of FIN 48 by registered investment companies could be delayed until the last business day of the first required financial statement reporting period for fiscal years beginning after December 15, 2006. At this time, management is evaluating the implications of FIN 48 and its impact on the financial statements has not yet been determined.
On September 20, 2006, the FASB released Statement of Financial Accounting Standards No. 157 “Fair Value Measurements” (“FAS 157”). FAS 157 establishes an authoritative definition of fair value, sets out a framework for measuring fair value, and requires additional disclosures about fair-value measurements. The application of FAS 157 is required for fiscal years beginning after November 15, 2007 and interim periods within those fiscal years. At this time, management is evaluating the implications of FAS 157 and its impact on the financial statements has not yet been determined.
| 34 | • ALLIANCEBERNSTEIN BOND FUND CORPORATE BOND PORTFOLIO |
Notes to Financial Statements
Note L
Subsequent Event
On November 16, 2007, the shareholders of the Portfolio approved the acquisition of the Portfolio by AllianceBernstein High Income Fund, Inc. (AllianceBernstein Emerging Market Debt Fund, Inc. until the time of the merger when its name will be changed). The acquisition of the Portfolio is expected to take place early in the first quarter of 2008.
| ALLIANCEBERNSTEIN BOND FUND CORPORATE BOND PORTFOLIO • | 35 |
Notes to Financial Statements
FINANCIAL HIGHLIGHTS
Selected Data For A Share Of Capital Stock Outstanding Throughout Each Period
| Class A | ||||||||||||||||||
| Year Ended September 30, | July 1, 2003 to Sept. 30, 2003(b) | Year Ended June 30, 2003 | ||||||||||||||||
| 2007 | 2006 | 2005 | 2004(a) | |||||||||||||||
Net asset value, beginning of period | $ 11.84 | $ 12.01 | $ 12.18 | $ 11.97 | $ 12.03 | $ 10.70 | ||||||||||||
Income From Investment Operations | ||||||||||||||||||
Net investment income(c) | .62 | .59 | .66 | .75 | (d) | .18 | .77 | |||||||||||
Net realized and unrealized gain (loss) on investment transactions | .04 | (.15 | ) | (.19 | ) | .18 | (.06 | ) | 1.35 | |||||||||
Net increase in net asset value from operations | .66 | .44 | .47 | .93 | .12 | 2.12 | ||||||||||||
Less: Dividends and Distributions | ||||||||||||||||||
Dividends from net investment income | (.64 | ) | (.61 | ) | (.64 | ) | (.72 | ) | (.18 | ) | (.76 | ) | ||||||
Tax return of capital | – 0 | – | – 0 | – | – 0 | – | – 0 | – | – 0 | – | (.03 | ) | ||||||
Total dividends and distributions | (.64 | ) | (.61 | ) | (.64 | ) | (.72 | ) | (.18 | ) | (.79 | ) | ||||||
Net asset value, end of period | $ 11.86 | $ 11.84 | $ 12.01 | $ 12.18 | $ 11.97 | $ 12.03 | ||||||||||||
| Total Return | ||||||||||||||||||
Total investment return based on net asset value(e) | 5.65 | %* | 3.86 | % | 3.86 | % | 8.01 | % | 1.06 | % | 20.75 | % | ||||||
Ratios/Supplemental Data | ||||||||||||||||||
Net assets, end of period (000’s omitted) | $434,508 | $415,539 | $483,169 | $512,458 | $535,318 | $555,979 | ||||||||||||
Ratio to average net assets of: | ||||||||||||||||||
Expenses, net of waivers/reimbursements | 1.10 | %(f) | 1.11 | %(f) | 1.08 | % | 1.16 | % | 1.20 | %(g) | 1.16 | % | ||||||
Expenses, before waivers/reimbursements | 1.10 | %(f) | 1.11 | %(f) | 1.08 | % | 1.20 | % | 1.20 | %(g) | 1.16 | % | ||||||
Expenses, before waivers/reimbursements, excluding interest expense | 1.10 | %(f) | 1.11 | %(f) | 1.08 | % | 1.12 | % | 1.15 | %(g) | 1.13 | % | ||||||
Net investment income | 5.21 | %(f) | 5.06 | %(f) | 5.38 | % | 6.25 | %(d) | 6.18 | %(g) | 6.96 | % | ||||||
Portfolio turnover rate | 50 | % | 73 | % | 127 | % | 230 | % | 65 | % | 171 | % | ||||||
See footnote summary on page 42.
| 36 | • ALLIANCEBERNSTEIN BOND FUND CORPORATE BOND PORTFOLIO |
Financial Highlights
Selected Data For A Share Of Capital Stock Outstanding Throughout Each Period
| Class B | ||||||||||||||||||
| Year Ended September 30, | July 1 2003 to Sept. 30, 2003(b) | Year Ended June 30, 2003 | ||||||||||||||||
| 2007 | 2006 | 2005 | 2004(a) | |||||||||||||||
Net asset value, beginning of period | $ 11.82 | $ 12.00 | $ 12.17 | $ 11.96 | $ 12.02 | $ 10.70 | ||||||||||||
Income From Investment Operations | ||||||||||||||||||
Net investment income(c) | .54 | .51 | .57 | .66 | (d) | .16 | .69 | |||||||||||
Net realized and unrealized gain (loss) on investment transactions | .03 | (.16 | ) | (.19 | ) | .19 | (.06 | ) | 1.35 | |||||||||
Net increase in net asset value from operations | .57 | .35 | .38 | .85 | .10 | 2.04 | ||||||||||||
Less: Dividends and Distributions | ||||||||||||||||||
Dividends from net investment income | (.55 | ) | (.53 | ) | (.55 | ) | (.64 | ) | (.16 | ) | (.70 | ) | ||||||
Tax return of capital | – 0 | – | – 0 | – | – 0 | – | – 0 | – | – 0 | – | (.02 | ) | ||||||
Total dividends and distributions | (.55 | ) | (.53 | ) | (.55 | ) | (.64 | ) | (.16 | ) | (.72 | ) | ||||||
Net asset value, end of period | $ 11.84 | $ 11.82 | $ 12.00 | $ 12.17 | $ 11.96 | $ 12.02 | ||||||||||||
| Total Return | ||||||||||||||||||
Total investment return based on net asset value(e) | 4.89 | %* | 3.05 | % | 3.13 | % | 7.26 | % | .88 | % | 19.85 | % | ||||||
Ratios/Supplemental Data | ||||||||||||||||||
Net assets, end of period (000’s omitted) | $59,170 | $99,052 | $162,973 | $251,173 | $383,763 | $418,095 | ||||||||||||
Ratio to average net assets of: | ||||||||||||||||||
Expenses, net of waivers/reimbursements | 1.84 | %(f) | 1.84 | %(f) | 1.80 | % | 1.89 | % | 1.92 | %(g) | 1.88 | % | ||||||
Expenses, before waivers/reimbursements | 1.84 | %(f) | 1.84 | %(f) | 1.80 | % | 1.93 | % | 1.92 | %(g) | 1.88 | % | ||||||
Expenses, before waivers/reimbursements, excluding interest expense | 1.84 | %(f) | 1.84 | %(f) | 1.79 | % | 1.84 | % | 1.87 | %(g) | 1.85 | % | ||||||
Net investment income | 4.46 | %(f) | 4.33 | %(f) | 4.65 | % | 5.55 | %(d) | 5.48 | %(g) | 6.27 | % | ||||||
Portfolio turnover rate | 50 | % | 73 | % | 127 | % | 230 | % | 65 | % | 171 | % | ||||||
See footnote summary on page 42.
| ALLIANCEBERNSTEIN BOND FUND CORPORATE BOND PORTFOLIO • | 37 |
Financial Highlights
Selected Data For A Share Of Capital Stock Outstanding Throughout Each Period
| Class C | ||||||||||||||||||
| Year Ended September 30, | July 1 2003(b) | Year 2003 | ||||||||||||||||
| 2007 | 2006 | 2005 | 2004(a) | |||||||||||||||
Net asset value, beginning of period | $ 11.83 | $ 12.01 | $ 12.18 | $ 11.96 | $ 12.02 | $ 10.70 | ||||||||||||
Income From Investment Operations | ||||||||||||||||||
Net investment income(c) | .54 | .51 | .57 | .67 | (d) | .16 | .69 | |||||||||||
Net realized and unrealized gain (loss) on investment transactions | .04 | (.16 | ) | (.19 | ) | .19 | (.06 | ) | 1.35 | |||||||||
Net increase in net asset value from operations | .58 | .35 | .38 | .86 | .10 | 2.04 | ||||||||||||
Less: Dividends and Distributions | ||||||||||||||||||
Dividends from net investment income | (.56 | ) | (.53 | ) | (.55 | ) | (.64 | ) | (.16 | ) | (.70 | ) | ||||||
Tax return of capital | – 0 | – | – 0 | – | – 0 | – | – 0 | – | – 0 | – | (.02 | ) | ||||||
Total dividends and distributions | (.56 | ) | (.53 | ) | (.55 | ) | (.64 | ) | (.16 | ) | (.72 | ) | ||||||
Net asset value, end of period | $ 11.85 | $ 11.83 | $ 12.01 | $ 12.18 | $ 11.96 | $ 12.02 | ||||||||||||
| Total Return | ||||||||||||||||||
Total investment return based on net asset value(e) | 4.91 | %* | 3.05 | % | 3.14 | % | 7.35 | % | .88 | % | 19.85 | % | ||||||
Ratios/Supplemental Data | ||||||||||||||||||
Net assets, end of period (000’s omitted) | $85,844 | $90,972 | $110,680 | $126,685 | $157,719 | $168,123 | ||||||||||||
Ratio to average net assets of: | ||||||||||||||||||
Expenses, net of waivers/reimbursements | 1.81 | %(f) | 1.82 | %(f) | 1.79 | % | 1.87 | % | 1.91 | %(g) | 1.87 | % | ||||||
Expenses, before waivers/reimbursements | 1.81 | %(f) | 1.82 | %(f) | 1.79 | % | 1.92 | % | 1.91 | %(g) | 1.87 | % | ||||||
Expenses, before waivers/reimbursements, excluding interest expense | 1.81 | %(f) | 1.82 | %(f) | 1.78 | % | 1.84 | % | 1.86 | %(g) | 1.84 | % | ||||||
Net investment income | 4.50 | %(f) | 4.36 | %(f) | 4.65 | % | 5.55 | %(d) | 5.49 | %(g) | 6.28 | % | ||||||
Portfolio turnover rate | 50 | % | 73 | % | 127 | % | 230 | % | 65 | % | 171 | % | ||||||
See footnote summary on page 42
| 38 | • ALLIANCEBERNSTEIN BOND FUND CORPORATE BOND PORTFOLIO |
Financial Highlights
Selected Data For A Share Of Capital Stock Outstanding Throughout Each Period
| Advisor Class | ||||||||||||||||||
| Year Ended September 30, | July 1, 2003(b) | August 8, 2003 | ||||||||||||||||
| 2007 | 2006 | 2005 | 2004(a) | |||||||||||||||
Net asset value, beginning of period | $ 11.83 | $ 12.01 | $ 12.19 | $ 11.98 | $ 12.03 | $ 10.21 | ||||||||||||
Income From Investment Operations | ||||||||||||||||||
Net investment income(c) | .68 | .63 | .68 | .84 | (d) | .19 | .69 | |||||||||||
Net realized and unrealized gain (loss) on investment transactions | .02 | (.16 | ) | (.18 | ) | .13 | (.05 | ) | 1.85 | |||||||||
Net increase in net asset value from operations | .70 | .47 | .50 | .97 | .14 | 2.54 | ||||||||||||
Less: Dividends and Distributions | ||||||||||||||||||
Dividends from net investment income | (.68 | ) | (.65 | ) | (.68 | ) | (.76 | ) | (.19 | ) | (.70 | ) | ||||||
Tax return of capital | – 0 | – | – 0 | – | – 0 | – | – 0 | – | – 0 | – | (.02 | ) | ||||||
Total dividends and distributions | (.68 | ) | (.65 | ) | (.68 | ) | (.76 | ) | (.19 | ) | (.72 | ) | ||||||
Net asset value, end of period | $ 11.85 | $ 11.83 | $ 12.01 | $ 12.19 | $ 11.98 | $ 12.03 | ||||||||||||
| Total Return | ||||||||||||||||||
Total investment return based on net asset value(e) | 5.96 | %* | 4.09 | % | 4.10 | % | 8.34 | % | 1.22 | % | 25.70 | % | ||||||
Ratios/Supplemental Data | ||||||||||||||||||
Net assets, end of period (000’s omitted) | $3,878 | $5,457 | $4,971 | $86 | $2,883 | $2,298 | ||||||||||||
Ratio to average net assets of: | ||||||||||||||||||
Expenses, net of waivers/reimbursements | .80 | %(f) | .81 | %(f) | .83 | % | .88 | % | .91 | %(g) | .88 | %(g) | ||||||
Expenses, before waivers/reimbursements | .80 | %(f) | .81 | %(f) | .83 | % | .92 | % | .91 | %(g) | .88 | %(g) | ||||||
Expenses, before waivers/reimbursements, excluding interest expense | .80 | %(f) | .81 | %(f) | .82 | % | .83 | % | .86 | %(g) | .85 | %(g) | ||||||
Net investment income | 5.37 | %(f) | 5.37 | %(f) | 5.62 | % | 6.52 | %(d) | 6.51 | %(g) | 6.90 | %(g) | ||||||
Portfolio turnover rate | 50 | % | 73 | % | 127 | % | 230 | % | 65 | % | 171 | % | ||||||
See footnote summary on page 42.
| ALLIANCEBERNSTEIN BOND FUND CORPORATE BOND PORTFOLIO • | 39 |
Financial Highlights
Selected Data For A Share Of Capital Stock Outstanding Throughout Each Period
| Class R | ||||||||||||
| Year Ended September 30, | November 3, 2003(h) to September 30, 2004(a) | |||||||||||
| 2007 | 2006 | 2005 | ||||||||||
Net asset value, beginning of period | $ 11.84 | $ 12.02 | $ 12.18 | $ 11.88 | ||||||||
Income From Investment Operations | ||||||||||||
Net investment income(c) | .59 | .56 | .60 | .66 | (d) | |||||||
Net realized and unrealized gain (loss) on investment transactions | .03 | (.16 | ) | (.15 | ) | .27 | ||||||
Net increase (decrease) in net asset value from operations | .62 | .40 | .45 | .93 | ||||||||
Less: Dividends | ||||||||||||
Dividends from net investment income | (.60 | ) | (.58 | ) | (.61 | ) | (.63 | ) | ||||
Net asset value, end of period | $ 11.86 | $ 11.84 | $ 12.02 | $ 12.18 | ||||||||
Total Return | ||||||||||||
Total investment return based on net asset value(e) | 5.30 | %* | 3.46 | % | 3.71 | % | 8.04 | % | ||||
Ratios/Supplemental Data | ||||||||||||
Net assets, end of period (000’s omitted) | $651 | $150 | $33 | $10 | ||||||||
Ratio to average net assets of: | ||||||||||||
Expenses, net of waivers/reimbursements | 1.43 | %(f) | 1.36 | %(f) | 1.39 | % | 1.34 | %(g) | ||||
Expenses, before waivers/reimbursements | 1.43 | %(f) | 1.36 | %(f) | 1.39 | % | 1.39 | %(g) | ||||
Expenses, before waivers/reimbursements, excluding interest expense | 1.43 | %(f) | 1.36 | %(f) | 1.38 | % | 1.31 | %(g) | ||||
Net investment income | 4.99 | %(f) | 4.92 | %(f) | 5.02 | % | 6.04 | %(d)(g) | ||||
Portfolio turnover rate | 50 | % | 73 | % | 127 | % | 230 | % | ||||
See footnote summary on page 42.
| 40 | • ALLIANCEBERNSTEIN BOND FUND CORPORATE BOND PORTFOLIO |
Financial Highlights
Selected Data For A Share Of Capital Stock Outstanding Throughout Each Period
| Class K | |||||||||
| Year Ended September 30, | March 1, 2005(h) to September 30, | ||||||||
| 2007 | 2006 | ||||||||
Net asset value, beginning of period | $ 11.84 | $ 12.01 | $ 12.48 | ||||||
Income From Investment Operations | |||||||||
Net investment income(c) | .62 | .34 | .37 | ||||||
Net realized and unrealized gain (loss) on investment transactions | .04 | .11 | † | (.48 | ) | ||||
Net increase (decrease) in net asset value from operations | .66 | .45 | (.11 | ) | |||||
Less: Dividends | |||||||||
Dividends from net investment income | (.64 | ) | (.62 | ) | (.36 | ) | |||
Net asset value, end of period | $ 11.86 | $ 11.84 | $ 12.01 | ||||||
Total Return | |||||||||
Total investment return based on net asset value(e) | 5.67 | %* | 3.94 | % | (.89 | )% | |||
Ratios/Supplemental Data | |||||||||
Net assets, end of period (000’s omitted) | $333 | $619 | $10 | ||||||
Ratio to average net assets of: | |||||||||
Expenses | 1.12 | %(f) | 1.03 | %(f) | 1.10 | %(g) | |||
Expenses, excluding interest expense | 1.12 | %(f) | 1.03 | %(f) | 1.10 | %(g) | |||
Net investment income | 5.19 | %(f) | 5.51 | %(f) | 5.25 | %(g) | |||
Portfolio turnover rate | 50 | % | 73 | % | 127 | % | |||
See footnote summary on page 42.
| ALLIANCEBERNSTEIN BOND FUND CORPORATE BOND PORTFOLIO • | 41 |
Financial Highlights
Selected Data For A Share Of Capital Stock Outstanding Throughout Each Period
| Class I | |||||||||
| Year Ended September 30 | March 1, 2005(h) to September 30, | ||||||||
| 2007 | 2006 | ||||||||
Net asset value, beginning of period | $ 11.84 | $ 12.01 | $ 12.48 | ||||||
Income From Investment Operations | |||||||||
Net investment income(c) | .69 | .64 | .40 | ||||||
Net realized and unrealized gain (loss) on investment transactions | .01 | (.16 | ) | (.49 | ) | ||||
Net increase (decrease) in net asset value from operations | .70 | .48 | (.09 | ) | |||||
Less: Dividends | |||||||||
Dividends from net investment income | (.68 | ) | (.65 | ) | (.38 | ) | |||
Net asset value, end of period | $ 11.86 | $ 11.84 | $ 12.01 | ||||||
Total Return | |||||||||
Total investment return based on net asset value(e) | 5.99 | %* | 4.22 | % | (.70 | )% | |||
Ratios/Supplemental Data | |||||||||
Net assets, end of period (000’s omitted) | $270 | $197 | $10 | ||||||
Ratio to average net assets of: | |||||||||
Expenses | .78 | %(f) | .73 | %(f) | .79 | %(g) | |||
Expenses, excluding interest expense | .78 | %(f) | .73 | %(f) | .79 | %(g) | |||
Net investment income | 5.55 | %(f) | 5.58 | %(f) | 5.59 | %(g) | |||
Portfolio Turnover Rate | 50 | % | 73 | % | 127 | % | |||
| (a) | As of October 1, 2003, the Portfolio has adopted the method of accounting for interim payments on swap contracts in accordance with Financial Accounting Standards Board Statement No. 133. These interim payments are reflected within net realized and unrealized gain (loss) on swap contracts, however, prior to October 1, 2003, these interim payments were reflected within interest income/expense on the statement of operations. The effect of this change for the year ended September 30, 2004, was to increase net investment income per share by $.02 for Class A, B, C, Advisor Class and Class R and decrease net realized and unrealized gain on investment transactions per share by $.02 for Class A, B, C, Advisor Class and Class R. Consequently, the ratios of net investment income to average net assets increased by 0.18%, 0.16%, 0.16%, 0.18% and 0.17% for Class A, B, C, Advisor Class and Class R, respectively. |
| (b) | The Portfolio changed its fiscal year end from June 30 to September 30. |
| (c) | Based on average shares outstanding. |
| (d) | Net of expenses waived and reimbursed by the Adviser. |
| (e) | Total investment return is calculated assuming an initial investment made at the net asset value at the beginning of the period, reinvestment of all dividends and distributions at net asset value during the period, and redemption on the last day of the period. Initial sales charges or contingent deferred sales charges are not reflected in the calculation of total investment return. Total return does not reflect the deduction of taxes that a shareholder would pay on fund distributions or the redemption of fund shares. Total investment return calculated for a period of less than one year is not annualized. |
| (f) | The ratio includes expenses attributable to costs of proxy solicitation. |
| (g) | Annualized. |
| (h) | Commencement of distributions. |
| * | Includes the impact of proceeds received and credited to the Portfolio resulting from the WorldCom class action settlement, which enhanced the performance of each share class for the year ended September 30, 2007 by 3.04%. |
| † | Due to the timing of sales and repurchases of capital shares, the net realized and unrealized gain (loss) per share is not in accord with the portfolio’s change in net realized and unrealized gain (loss) on investment transactions for the period. |
| 42 | • ALLIANCEBERNSTEIN BOND FUND CORPORATE BOND PORTFOLIO |
Financial Highlights
REPORT OF INDEPENDENT REGISTERED
PUBLIC ACCOUNTING FIRM
To the Shareholders and Board of Directors of AllianceBernstein Bond Fund, Inc.
Corporate Bond Portfolio
We have audited the accompanying statement of assets and liabilities of Corporate Bond Portfolio (the “Portfolio”), one of the Portfolios constituting the AllianceBernstein Bond Fund, Inc., including the portfolio of investments, as of September 30, 2007, and the related statement of operations for the year then ended, the statement of changes in net assets for each of the two years in the period then ended, and the financial highlights for each of the periods indicated therein. These financial statements and financial highlights are the responsibility of the Portfolio’s management. Our responsibility is to express an opinion on these financial statements and financial highlights based on our audits.
We conducted our audits in accordance with the standards of the Public Company Accounting Oversight Board (United States). Those standards require that we plan and perform the audit to obtain reasonable assurance about whether the financial statements and financial highlights are free of material misstatement. We were not engaged to perform an audit of the Portfolio’s internal control over financial reporting. Our audits included consideration of internal control over financial reporting as a basis for designing audit procedures that are appropriate in the circumstances, but not for the purpose of expressing an opinion on the effectiveness of the Portfolio’s internal control over financial reporting. Accordingly, we express no such opinion. An audit also includes examining, on a test basis, evidence supporting the amounts and disclosures in the financial statements and financial highlights, assessing the accounting principles used and significant estimates made by management, and evaluating the overall financial statement presentation. Our procedures included confirmation of securities owned as of September 30, 2007 by correspondence with the custodian and others or by other appropriate auditing procedures where replies from others were not received. We believe that our audits provide a reasonable basis for our opinion.
In our opinion, the financial statements and financial highlights referred to above present fairly, in all material respects, the financial position of the Corporate Bond Portfolio at September 30, 2007, the results of its operations for the year then ended, the changes in its net assets for each of the two years in the period then ended, and the financial highlights for each of the indicated periods in conformity with U.S. generally accepted accounting principles.

New York, New York
November 27, 2007
| ALLIANCEBERNSTEIN BOND FUND CORPORATE BOND PORTFOLIO • | 43 |
Report of Independent Registered Public Accounting Firm
TAX INFORMATION (unaudited)
73.0% of the ordinary income dividends paid by the Fund during the fiscal year ended September 30, 2007, qualify as “interest related dividends” for non-U.S. shareholders.
| 44 | • ALLIANCEBERNSTEIN BOND FUND CORPORATE BOND PORTFOLIO |
Tax Information
SUPPLEMENTAL PROXY INFORMATION (unaudited)
A Special Meeting of Shareholders of AllianceBernstein Corporate Bond Portfolio was held on November 2, 2007 and adjourned until November 16, 2007.
A description of the proposal and number of shares voted at the meeting follows. The proposal was approved by shareholders.
| Voted For | Against | Abstain/ Authority Withheld | ||||
1. Acquisition of AllianceBernstein Corporate Bond by AllianceBernstein High Income Fund, Inc. | 20,104,608 | 1,106,281 | 3,924,690 |
| ALLIANCEBERNSTEIN BOND FUND CORPORATE BOND PORTFOLIO • | 45 |
Supplemental Proxy Information
BOARD OF DIRECTORS
William H. Foulk, Jr.(1), Chairman
Marc O. Mayer, President and Chief Executive Officer
David H. Dievler(1)
John H. Dobkin(1)
Michael J. Downey(1)
D. James Guzy(1)
Nancy P. Jacklin(1)
Marshall C. Turner, Jr.(1)
Earl D. Weiner(1)
OFFICERS
Philip L. Kirstein, Senior Vice President and Independent Compliance Officer
Andrew M. Aran(2), Vice President
Gershon Distenfeld(2), Vice President
Jeffrey S. Phlegar(2), Vice President
Lawrence J. Shaw(2), Vice President
Emilie D. Wrapp, Secretary
Joseph J. Mantineo, Treasurer and Chief Financial Officer
Vincent S. Noto, Controller
Custodian State Street Bank and Trust Company One Lincoln Street Boston, MA 02111
Principal Underwriter AllianceBernstein Investments, Inc. 1345 Avenue of the Americas New York, NY 10105
Transfer Agent AllianceBernstein Investor Services, Inc. P.O. Box 786003 San Antonio, TX 78278-6003 Toll-Free (800) 221-5672 | Independent Registered Public Accounting Firm Ernst & Young LLP 5 Times Square New York, NY 10036
Legal Counsel Seward & Kissel LLP One Battery Park Plaza New York, NY 10004 |
| (1) | Member of the Audit Committee, the Governance and Nominating Committee and the Independent Directors Committee. |
| (2) | The day-to-day management of and investment decisions for the Portfolio are made by the Global Credit Investment Team. Messrs. Aran, Distenfeld, Phlegar and Shaw are the investment professionals with the most significant responsibility for the day-to-day management of the Portfolio. |
| 46 | • ALLIANCEBERNSTEIN BOND FUND CORPORATE BOND PORTFOLIO |
Board of Directors
MANAGEMENT OF THE FUND
Board of Directors Information
The business and affairs of the Fund are managed under the direction of the Board of Directors. Certain information concerning the Fund’s Directors is set forth below.
| NAME, ADDRESS*, AGE (FIRST YEAR ELECTED**) | PRINCIPAL OCCUPATION(S) DURING PAST 5 YEARS | PORTFOLIOS IN FUND COMPLEX OVERSEEN BY DIRECTOR | OTHER DIRECTORSHIPS HELD BY DIRECTOR | |||
| DISINTERESTED DIRECTORS | ||||||
Chairman of the Board William H. Foulk, Jr., #,*** 75 (1998) | Investment Adviser and an Independent Consultant. He was formerly Senior Manager of Barrett Associates, Inc., a registered investment adviser, with which he had been associated since prior to 2002. He was formerly Deputy Comptroller and Chief Investment Officer of the State of New York and, prior thereto, Chief Investment Officer of the New York Bank for Savings. | 109 | None | |||
David H. Dievler, # 78 (1987) | Independent Consultant. Until December 1994, he was Senior Vice President of AllianceBernstein Corporation (“AB Corp.”) (formerly, Alliance Capital Management Corporation) responsible for mutual fund administration. Prior to joining AB Corp. in 1984, he was Chief Financial Officer of Eberstadt Asset Management since 1968. Prior to that, he was Senior Manager at Price Waterhouse & Co. Member of American Institute of Certified Public Accountants since 1953. | 108 | None | |||
John H. Dobkin, # 65 (1998) | Consultant. Formerly, President of Save Venice, Inc. (preservation organization) from 2001-2002, Senior Advisor from June 1999-June 2000 and President of Historic Hudson Valley (historic preservation) from December 1989-May 1999. Previously, Director of the National Academy of Design and during 1988-1992, Director and Chairman of the Audit Committee of AB Corp. | 107 | None | |||
| ALLIANCEBERNSTEIN BOND FUND CORPORATE BOND PORTFOLIO • | 47 |
Management of the Fund
| NAME, ADDRESS*, AGE (FIRST YEAR ELECTED**) | PRINCIPAL OCCUPATION(S) DURING PAST 5 YEARS | PORTFOLIOS IN FUND COMPLEX OVERSEEN BY DIRECTOR | OTHER DIRECTORSHIPS HELD BY DIRECTOR | |||
DISINTERESTED DIRECTORS (continued) | ||||||
Michael J. Downey, # 63 (2005) | Consultant since January 2004. Formerly, managing partner of Lexington Capital, LLC (investment advisory firm) from December 1997 until December 2003. Prior thereto, Chairman and CEO of Prudential Mutual Fund Management from 1987 to 1993. | 107 | Asia Pacific Fund, Inc. and The Merger Fund | |||
D. James Guzy, # 71 (2005) | Chairman of the Board of PLX Technology (semi-conductors) and of SRC Computers Inc., with which he has been associated since prior to 2002. He is also President of the Arbor Company (private family investments). | 107 | Intel Corporation (semi-conductors) and Cirrus Logic Corporation (semi-conductors) | |||
Nancy P. Jacklin, # 59 (2006) | Formerly, U.S. Executive Director of the International Monetary Fund (December 2002-May 2006); Partner, Clifford Chance (1992-2002); Sector Counsel, International Banking and Finance, and Associate General Counsel, Citicorp (1985-1992); Assistant General Counsel (International), Federal Reserve Board of Governors (1982-1985); and Attorney Advisor, U.S. Department of the Treasury (1973-1982). Member of the Bar of the District of Columbia and of New York; and member of the Council on Foreign Relations. | 107 | None | |||
Marshall C. Turner, Jr., # 66 (2005) | Consultant. Formerly, President and CEO, Toppan Photomasks, Inc. (semi-conductor manufacturing services), 2005-2006, and Chairman and CEO from 2003 until 2005, when the company was acquired and renamed from Dupont Photomasks, Inc. Principal, Turner Venture Associates (venture capital and consulting) 1993-2003. | 107 | Xilinx, Inc. (semi-conductors) and MEMC Electronic Materials, Inc. (semi-conductor substrates) | |||
| 48 | • ALLIANCEBERNSTEIN BOND FUND CORPORATE BOND PORTFOLIO |
Management of the Fund
| NAME, ADDRESS*, AGE (FIRST YEAR ELECTED**) | PRINCIPAL OCCUPATION(S) DURING PAST 5 YEARS | PORTFOLIOS IN FUND COMPLEX OVERSEEN BY DIRECTOR | OTHER DIRECTORSHIPS HELD BY DIRECTOR | |||
DISINTERESTED DIRECTORS (continued) | ||||||
Earl D. Weiner, # 68 2007 | Of Counsel, and Partner from 1976-2006, of the law firm Sullivan & Cromwell LLP, specializing in investment management, corporate, and securities law; member of ABA Federal Regulation of Securities Committee Task Force on Fund Director’s Guidebook. | 107 | None | |||
| INTERESTED DIRECTOR | ||||||
Marc O. Mayer, + 50 (2003) | Executive Vice President of the Adviser since 2001, and Executive Managing Director of AllianceBernstein Investments, Inc. (“ABI”) since 2003; prior thereto, he was head of AllianceBernstein Institutional Investments, a unit of the Adviser from 2001-2003. Prior thereto, Chief Executive Officer of Sanford C. Bernstein & Co., LLC (institutional research and brokerage arm of Bernstein & Co. LLC) (“SCB & Co.”) and its predecessor since prior to 2002. | 107 | SCB Partners Inc.; SCB Inc. | |||
| * | The address for each of the Fund’s disinterested Directors is AllianceBernstein L.P., c/o Philip Kirstein, 1345 Avenue of the Americas, New York, NY 10105. |
| ** | There is no stated term of office for the Fund’s directors. |
| *** | Member of Fair Value Pricing Committee. |
| # | Member of the Audit Committee, Governance and Nominating Committee and Independent Directors Committee. |
| + | Mr. Mayer is an “interested director”, as defined in the 1940 Act, due to his position as an Executive Vice President of AllianceBernstein. |
| ALLIANCEBERNSTEIN BOND FUND CORPORATE BOND PORTFOLIO • | 49 |
Management of the Fund
Officer Information
Certain information concerning the Fund’s Officers is set forth below.
| NAME, ADDRESS*, AND AGE | PRINCIPAL POSITION(S) HELD WITH FUND | PRINCIPAL OCCUPATION DURING PAST 5 YEARS | ||
Marc O. Mayer 50 | President and Chief Executive Officer | See biography above. | ||
Philip L. Kirstein 62 | Senior Vice President & Independent Compliance Officer | Senior Vice President and Independent Compliance Officer of the AllianceBernstein Funds, with which he has been associated since October 2004. Prior thereto, he was Of Counsel to Kirkpatrick & Lockhart, LLP from October 2003 to October 2004, and General Counsel of Merrill Lynch Investment Managers L.P. since prior to 2002 until March 2003. | ||
Andrew M. Aran 50 | Vice President | Senior Vice President of AllianceBernstein, with which he has been associated since prior to 2002. | ||
Gershon Distenfeld 31 | Vice President | Vice President of AllianceBernstein with which he has been associated since prior to 2002. | ||
Jeffrey S. Phlegar 41 | Vice President | Executive Vice President of AllianceBernstein, with which he has been associated since prior to 2002. | ||
Lawrence J. Shaw 56 | Vice President | Senior Vice President of AllianceBernstein, with which he has been associated since prior to 2002. | ||
Emilie D. Wrapp 52 | Secretary | Senior Vice President, Assistant General Counsel and Assistant Secretary of ABI**, with which she has been associated since prior to 2002. | ||
Joseph J. Mantineo 48 | Treasurer and Chief Financial Officer | Senior Vice President of AllianceBernstein Investor Services (“ABIS”) and Vice President of ABI**, with which he has been associated since prior to 2002. | ||
Vincent S. Noto 42 | Controller | Vice President of ABIS**, with which he has been associated since prior to 2002. |
| * | The address for each of the Fund’s Officers is 1345 Avenue of the Americas, New York, NY 10105. |
| ** | AllianceBernstein, ABI, ABIS and SCB & Co. are affiliates of the Fund. |
| The Fund’s Statement of Additional Information (“SAI”) has additional information about the Fund’s Directors and Officers and is available without charge upon request. Contact your financial representative or AllianceBernstein at 1-800-227-4618 for a free prospectus or SAI. |
| 50 | • ALLIANCEBERNSTEIN BOND FUND CORPORATE BOND PORTFOLIO |
Management of the Fund
THE FOLLOWING IS NOT PART OF THE SHAREHOLDER REPORT OR THE FINANCIAL STATEMENTS
SUMMARY OF SENIOR OFFICER’S EVALUATION OF INVESTMENT ADVISORY AGREEMENT1
The following is a summary of the evaluation of the Investment Advisory Agreement between AllianceBernstein L.P. (the “Adviser”) and the AllianceBernstein Bond Fund, Inc. (the “Fund”) in respect of AllianceBernstein Corporate Bond Portfolio (the “Portfolio”).2 The evaluation of the Investment Advisory Agreement was prepared by Philip L. Kirstein, the Senior Officer of the Fund for the Directors of the Fund, as required by an August 2004 agreement between the Adviser and the New York State Attorney General (the “NYAG”). The Senior Officer’s evaluation of the Investment Advisory Agreement is not meant to diminish the responsibility or authority of the Board of Directors of the Fund to perform its duties pursuant to Section 15 of the Investment Company Act of 1940 (the “40 Act”) and applicable state law. The purpose of the summary is to provide shareholders with a synopsis of the independent evaluation of the reasonableness of the advisory fees proposed to be paid by the Portfolio which was provided to the Directors in connection with their review of the proposed approval of the continuance of the Investment Advisory Agreement. The Senior Officer’s evaluation considered the following factors:
| 1. | Advisory fees charged to institutional and other clients of the Adviser for like services; |
| 2. | Advisory fees charged by other mutual fund companies for like services; |
| 3. | Costs to the Adviser and its affiliates of supplying services pursuant to the advisory agreement, excluding any intra-corporate profit; |
| 4. | Profit margins of the Adviser and its affiliates from supplying such services; |
| 5. | Possible economies of scale as the Portfolio grows larger; and |
| 6. | Nature and quality of the Adviser’s services including the performance of the Portfolio. |
PORTFOLIO ADVISORY FEES, EXPENSE REIMBURSEMENTS & RATIOS
The Adviser proposed that the Portfolio pay the advisory fee set forth in the table below for receiving the services to be provided pursuant to the Investment Advisory Agreement. The fee schedule below, implemented in January 2004 in connection with the Adviser’s settlement with the NYAG in December 2003, is
| 1 | It should be noted that the information in the fee summary was completed on October 23, 2006 and presented to the Board of Directors on October 31 – November 2, 2006. |
| 2 | Future references to the Portfolio do not include “AllianceBernstein.” References in the fee summary pertaining to performance and expense ratios refer to Class A shares of the Portfolio. |
| ALLIANCEBERNSTEIN BOND FUND CORPORATE BOND PORTFOLIO • | 51 |
based on a master schedule that contemplates eight categories of funds with almost all funds in each category having the same advisory fee schedule.3
| Category | Net Assets 09/30/06 (million) | Advisory Fee Based on % of Average Daily Net Assets | Portfolio | |||
| High Income | $612.3 | 50 bp on 1st $2.5 billion | Corporate Bond | |||
| 45 bp on next $2.5 billion | Portfolio | |||||
| 40 bp on the balance |
The Adviser is reimbursed as specified in the Investment Advisory Agreement for certain clerical, legal, accounting, administrative and other services provided to the Portfolio. During the most recently completed fiscal year, the Adviser received $92,000 (0.01% of the Portfolio’s average daily net assets) for such services.
Set forth below are the Portfolio’s total expense ratios for the most recent semi-annual period:
| Portfolio | Total Expense Ratio4 | Fiscal Year | |||||
| Corporate Bond Portfolio | Advisor | 0.82 | % | September 30 | |||
| Class A | 1.13 | % | |||||
| Class B | 1.85 | % | |||||
| Class C | 1.83 | % | |||||
| Class R | 1.35 | % | |||||
| Class K | 1.04 | % | |||||
| Class I | 0.81 | % | |||||
I. ADVISORY FEES CHARGED TO INSTITUTIONAL AND OTHER CLIENTS
The advisory fees charged to investment companies which the Adviser manages and sponsors are normally higher than those charged to similar sized institutional accounts, including pension plans and sub-advised investment companies. The fee differential reflects, among other things, different services provided to such clients, and different liabilities assumed. Services provided by the Adviser to the Portfolio that are not provided to non-investment company clients include providing office space and personnel to serve as Fund Officers, who among other responsibilities make the certifications required under the Sarbanes-Oxley Act of 2002, and coordinating with and monitoring the Portfolio’s third party service providers such as Fund counsel, auditors, custodians, transfer agents and pricing services. The accounting, administrative, legal and compliance requirements for the Portfolio are more costly than those for institutional assets due to the greater complexities and time required for investment companies, although, as previously noted, a portion of the costs are
| 3 | Most of the AllianceBernstein Mutual Funds, which the Adviser manages, were affected by the Adviser’s settlement with the NYAG. |
| 4 | Annualized. |
| 52 | • ALLIANCEBERNSTEIN BOND FUND CORPORATE BOND PORTFOLIO |
reimbursed by the Portfolio to the Adviser. Also, retail mutual funds managed by the Adviser are widely held. Servicing the Portfolio’s investors is more time consuming and labor intensive compared to institutional clients since the Adviser needs to communicate with a more extensive network of financial intermediaries and shareholders. In addition, managing the cash flow of an investment company may be more difficult than that of a stable pool of assets, such as an institutional account with little cash movement in either direction, particularly if the fund is in net redemption and the Adviser is frequently forced to sell securities to raise cash for redemptions. However, managing a fund with positive cash flow may be easier at times than managing a stable pool of assets. Finally, in recent years, investment advisers have been sued by institutional clients and have suffered reputational damage both by the attendant publicity and outcomes other than complete victories. Accordingly, the legal and reputational risks associated with institutional accounts are greater than previously thought, although still not equal to those related to the mutual fund industry.
Notwithstanding the Adviser’s view that managing an investment company is not comparable to managing other institutional accounts because the services provided are different, it is worth considering information regarding the advisory fees charged to institutional accounts with substantially similar investment styles as the Portfolio. However, with respect to the Portfolio, the Adviser represented that there is no institutional product in the Form ADV that has a substantially similar investment style as the Portfolio.
The Adviser represented that it does not sub-advise any registered investment company with a substantially similar investment style as the Portfolio.
| II. | MANAGEMENT FEES CHARGED BY OTHER MUTUAL FUND COMPANIES FOR LIKE SERVICES. |
Lipper, Inc. (“Lipper”), an analytical service that is not affiliated with the Adviser, compared the fees charged to the Portfolio with fees charged to other investment companies for similar services by other investment advisers. Lipper’s analysis included the Portfolio’s ranking with respect to the proposed advisory fee relative to the median of the Portfolio’s Lipper Expense Group (“EG”)5 at the approximate current asset level of the Portfolio.6
| 5 | Lipper does not consider average account size when constructing EGs. Funds with relatively small average account sizes tend to have higher transfer agent expense ratio than comparable sized funds that have relatively large average account sizes. Note that there are limitations on Lipper expense category data because different funds categorize expenses differently. |
| 6 | The contractual management fee is calculated by Lipper using the Portfolio’s contractual management fee rate at a hypothetical asset level. The hypothetical asset level is based on the combined net assets of all classes of the Portfolio, rounded up to the next $25 million. Lipper’s total expense ratio information is based on the most recent annual report except as otherwise noted. A ranking of “1” means that the Portfolio has the lowest effective fee rate in the Lipper peer group. |
| ALLIANCEBERNSTEIN BOND FUND CORPORATE BOND PORTFOLIO • | 53 |
Lipper describes an EG as a representative sample of comparable funds. Lipper’s standard methodology for screening funds to be included in an EG entails the consideration of several fund criteria, including fund type, investment classifica-tion/objective, load type and similar 12b-1/non-12b-1 service fees, asset (size) comparability, and expense components and attributes. An EG will typically consist of seven to twenty funds. However, because the Portfolio’s original EG had an insufficient number of peers, at the request of the Adviser and the Senior Officer, Lipper expanded the Portfolio’s EG to include peers that had a similar (but not the same) Lipper investment classification/objective.
| Portfolio | Contractual Management Fee7 | Lipper Expense Group Median | Rank | |||
| Corporate Bond Portfolio8 | 0.500 | 0.500 | 4/11 |
Because Lipper had expanded the Portfolio’s EG, under Lipper’s standard guidelines, the Portfolio’s Lipper Expense Universe (“EU”) was also expanded to include universes of those peers that had a similar (but not the same) Lipper investment objective/classification.9 A “normal” EU will include funds that have the same investment objective/classification as the subject fund.10 Set forth below is a comparison of the Portfolio’s total expense ratio and the medians of the Portfolio’s EGs and EUs. The Portfolio’s total expense ratio rankings are also shown:
| Portfolio | 11Expense Ratio (%) | Lipper Exp. Group Median (%) | Rank | Lipper Exp. Universe Median (%) | Rank | |||||
| Corporate Bond Portfolio12 | 1.077 | 1.026 | 10/11 | 1.005 | 37/47 |
Based on this analysis, the Portfolio has a more favorable ranking on a management fee basis than it does on a total expense ratio basis.
| 7 | The contractual management fee does not reflect any expense reimbursements made by the Portfolio to the Adviser for certain clerical, legal, accounting, administrative, and other services. |
| 8 | The Portfolio’s EG, includes the Portfolio, five other BBB-rated corporate debt funds, and five A-rated corporate debt funds. |
| 9 | The expansion of the Fund’s EU was not requested by the Adviser or the Senior Officer. They requested that only the EGs be expanded. |
| 10 | Except for asset size comparability, Lipper uses the same criteria for selecting a Lipper Expense Group when selecting a Lipper Expense Universe. Unlike the Lipper Expense Group, the Lipper Expense Universe allows for the same adviser to be represented by more than just one fund. |
| 11 | Most recently completed fiscal year Class A share total expense ratio. |
| 12 | The Portfolio’s EU, includes the Portfolio, the EG and all other BBB-rated and A-rated corporate debt funds. |
| 54 | • ALLIANCEBERNSTEIN BOND FUND CORPORATE BOND PORTFOLIO |
| III. | COSTS TO THE ADVISER AND ITS AFFILIATES OF SUPPLYING SERVICES PURSUANT TO THE ADVISORY FEE ARRANGEMENT, EXCLUDING ANY INTRA-CORPORATE PROFIT. |
A consultant was retained by the Senior Officer to work with the Adviser’s personnel to align the Adviser’s two profitability reporting systems. The alignment, which now has been completed, allows the Adviser’s management and the Directors to receive consistent presentations of the financial results and profitability although the two profitability reporting systems operate independently. See Section IV for additional discussion.
| IV. | PROFIT MARGINS OF THE ADVISER AND ITS AFFILIATES FOR SUPPLYING SUCH SERVICES. |
The profitability information for the Portfolio prepared by the Adviser for the Board of Directors was reviewed by the Senior Officer and the consultant. The Adviser’s profitability from providing investment advisory services to the Portfolio increased during calendar year 2005 relative to 2004.
In addition to the Adviser’s direct profits from managing the Portfolio, certain of the Adviser’s affiliates have business relationships with the Portfolio and may earn a profit from providing other services to the Portfolio. The courts have referred to this type of business opportunity as “fall-out benefits” to the Adviser and indicated that such benefits should be factored into the evaluation of the total relationship between the Portfolio and the Adviser. Neither case law nor common business practice precludes the Adviser’s affiliates from earning a reasonable profit on this type of relationship provided the affiliates’ charges and services are competitive. These affiliates provide transfer agent and distribution related services to the Portfolio and receive transfer agent fees, Rule 12b-1 payments, front-end sales loads and contingent deferred sales charges (“CDSC”).
AllianceBernstein Investments, Inc. (“ABI”), an affiliate of the Adviser, is the Portfolio’s principal underwriter. ABI and the Adviser have disclosed in the Portfolio’s prospectus that they may make revenue sharing payments from their own resources, in addition to resources derived from sales loads and Rule 12b-1 fees, to firms that sell shares of the Portfolio. In 2005, ABI paid approximately 0.042% of the average monthly assets of the AllianceBernstein Mutual Funds or approximately $18.0 million for distribution services and educational support (revenue sharing payments). For 2006, it is anticipated, ABI will pay approximately 0.04% of the average monthly assets of the AllianceBernstein Mutual Funds or approximately $17.5 million.13 During the Portfolio’s most recently completed fiscal year, ABI received from the Portfolio $21,699, $4,813,825 and $174,345 in front-end sales charges, Rule 12b-1 and CDSC fees, respectively.
| 13 | ABI currently inserts the “Advance” in quarterly account statements and pays the incremental costs associated with the mailing. The incremental cost is less than what an “independent mailing” would cost. |
| ALLIANCEBERNSTEIN BOND FUND CORPORATE BOND PORTFOLIO • | 55 |
Fees and reimbursements for out of pocket expenses charged by AllianceBernstein Investor Services, Inc. (“ABIS”), the affiliated transfer agent for the Portfolio, are charged on a per account basis, based on the level of service provided and the class of share held by the account. ABIS also receives a fee per shareholder sub-account for each account maintained by an intermediary on an omnibus basis. ABIS’ after-tax profitability increased in 2005 in comparison to 2004. During the Portfolio’s most recently completed fiscal year, ABIS received $651,716 in fees from the Portfolio.14
V. POSSIBLE ECONOMIES OF SCALE
The Adviser has indicated that the breakpoints in the fee schedule being proposed reflect a sharing of economies of scale to the extent they exist. Based on some of the professional literature that has considered economies of scale in the mutual fund industry, it is thought that to the extent economies of scale exist, they may more often exist across a fund family as opposed to a specific fund. This is because the costs incurred by the Adviser, such as investment research or technology for trading or compliance systems can be spread across a greater asset base as the fund family increases in size. It is also possible that as the level of services required to operate a successful investment company has increased over time, and advisory firms have made such investments in their business to provide improved services, there may be a sharing of economies of scale without a reduction in advisory fees.
An independent consultant, retained by the Senior Officer, made a presentation to the Board of Directors regarding possible economies of scale or scope in the mutual fund industry. Based on the presentation, it was evident that fund management companies benefit from economies of scale. However, due to the lack of cost data, economists, who have written on this subject, had to infer facts about the costs from the behavior of fund expenses; there was a lack of consensus among economists as to whether economies of scale were being passed on to the shareholders. In the meantime, it is clear that to the extent a fund’s assets were to exceed the initial breakpoint its shareholders would benefit from a lower fee rate.
| VI. | NATURE AND QUALITY OF THE ADVISER’S SERVICES, INCLUDING THE PERFORMANCE OF THE PORTFOLIO |
With assets under management of approximately $659 billion as of September 30, 2006, the Adviser has the investment experience to manage and provide non-investment services (described in Section I) to the Portfolio.
| 14 | The fees disclosed are net of any expense offsets with ABIS. An expense offset is created by the interest earned on the positive cash balance that occur within the transfer agent account as there is a one day lag with regards to money movement from the shareholder’s account to the transfer agent’s account and then the transfer agent’s account to the Portfolio’s account. During the Portfolio’s most recently completed fiscal year, the fees paid by the Portfolio to ABIS were reduced by $8,679 under the offset agreement between the Portfolio and ABIS. |
| 56 | • ALLIANCEBERNSTEIN BOND FUND CORPORATE BOND PORTFOLIO |
The information below, prepared by Lipper, shows the 1, 3, 5 and 10 year performance returns and rankings of the Portfolio15 relative to the Portfolio’s Lipper Performance Group (“PG”) and Lipper Performance Universe (“PU”)16 for the periods ended June 30, 2006.17
| Corporate Bond Portfolio | Portfolio Return | PG Median | PU Median | PG Rank | PU Rank | |||||
1 year | -1.99 | -0.95 | -1.01 | 6/6 | 27/31 | |||||
3 year | 3.92 | 2.91 | 2.77 | 1/6 | 4/27 | |||||
5 year | 5.07 | 4.98 | 5.19 | 3/6 | 11/19 | |||||
10 year | 6.14 | 5.84 | 6.05 | 2/6 | 3/11 |
Set forth below are the 1, 3, 5, 10 year and since inception performance returns of the Portfolio (in bold)18 versus its benchmark:19
| Periods Ending June 30, 2006 Annualized Performance | ||||||||||
| Portfolio | 1 Year | 3 Year | 5 Year | 10 Year | Since Inception | |||||
Corporate Bond Portfolio | -1.99 | 3.92 | 5.07 | 6.14 | 8.94 | |||||
Lehman Brothers BAA U.S. Credit Index | -2.37 | 2.39 | 5.96 | 6.61 | 9.41 | |||||
CONCLUSION:
Based on the factors discussed above the Senior Officer’s conclusion is that the proposed advisory fee for the Portfolio is reasonable and within the range of what would have been negotiated at arms-length in light of all the surrounding circumstances. This conclusion in respect of the Portfolio is based on an evaluation of all of these factors and no single factor was dispositive.
Dated: November 15, 2006
| 15 | The performance returns and rankings are for the Class A shares of the Portfolio. It should be noted that the performance returns of the Portfolio that is shown was provided by the Adviser. Lipper maintains its own database that includes the Portfolio’s performance returns. However, differences in distribution price (ex-date versus payable date) and rounding differences may cause the Adviser’s own performance returns of the Portfolio to be one or two basis points different from Lipper. To maintain consistency in this evaluation, the performance returns of the Portfolio, as reported by the Adviser, are provided instead of Lipper. |
| 16 | The Portfolio’s PG and PU are not identical to the Portfolio’s EG and EU. The Portfolio’s PG only includes peers from the Portfolio’s EG that have the same Lipper investment classi-fication/objective as the Portfolio. The Portfolio’s PU is not identical to the Portfolio’s EU. Funds with negative management fees are excluded from EUs but not necessarily from PUs. In addition, PUs only include funds of the same Lipper investment objective/classifi-cation as the Portfolio, in contrast to EUs, which include funds of similar but not the same investment objective/classification. |
| 17 | Note that the current Lipper investment classification/objective dictates the PG and PU throughout the life of the Fund even if a Fund may have had a different investment classi-fication/objective at different points in time. |
| 18 | The performance returns shown are for the Class A shares of the Portfolio. |
| 19 | The Adviser provided Portfolio and benchmark performance return information for periods through June 30, 2006. |
| ALLIANCEBERNSTEIN BOND FUND CORPORATE BOND PORTFOLIO • | 57 |
THIS PAGE IS NOT PART OF THE SHAREHOLDER REPORT OR THE FINANCIAL STATEMENTS
ALLIANCEBERNSTEIN FAMILY OF FUNDS
Wealth Strategies Funds
Balanced Wealth Strategy
Wealth Appreciation Strategy
Wealth Preservation Strategy
Tax-Managed Balanced Wealth Strategy
Tax-Managed Wealth Appreciation Strategy
Tax-Managed Wealth Preservation Strategy
Blended Style Funds
U.S. Large Cap Portfolio
International Portfolio
Tax-Managed International Portfolio
Growth Funds
Domestic
Growth Fund
Mid-Cap Growth Fund
Large Cap Growth Fund
Small Cap Growth Portfolio
Global & International
Global Health Care Fund
Global Research Growth Fund
Global Technology Fund
Greater China ‘97 Fund
International Growth Fund
International Research Growth Fund
Value Funds
Domestic
Balanced Shares
Focused Growth & Income Fund
Growth & Income Fund
Small/Mid-Cap Value Fund
Utility Income Fund
Value Fund
Global & International
Global Real Estate Investment Fund*
Global Value Fund
International Value Fund
Taxable Bond Funds
Global Bond Fund*
Corporate Bond Portfolio
Emerging Market Debt Fund
Diversified Yield Fund*
High Yield Fund
Intermediate Bond Portfolio
Short Duration Portfolio
Municipal Bond Funds
National | Michigan |
Intermediate Municipal Bond Funds
Intermediate California
Intermediate Diversified
Intermediate New York
Closed-End Funds
All-Market Advantage Fund
AllianceBernstein Global High Income Fund*
AllianceBernstein Income Fund*
AllianceBernstein National Municipal Income Fund*
ACM Managed Dollar Income Fund
California Municipal Income Fund
New York Municipal Income Fund
The Spain Fund
Retirement Strategies Funds
2000 Retirement Strategy | 2020 Retirement Strategy | 2040 Retirement Strategy | ||
2005 Retirement Strategy | 2025 Retirement Strategy | 2045 Retirement Strategy | ||
2010 Retirement Strategy | 2030 Retirement Strategy | 2050 Retirement Strategy | ||
2015 Retirement Strategy | 2035 Retirement Strategy | 2055 Retirement Strategy |
We also offer Exchange Reserves,** which serves as the money market fund exchange vehicle for the AllianceBernstein mutual funds.
You should consider the investment objectives, risks, charges and expenses of any AllianceBernstein fund/portfolio carefully before investing. For free copies of our prospectuses, which contain this and other information, visit us online at www.alliancebernstein.com or contact your financial advisor. Please read the prospectus carefully before investing.
| * | Prior to January 26, 2007, AllianceBernstein Global High Income Fund was named Alliance World Dollar Government Fund II and AllianceBernstein Income Fund was named ACM Income Fund. Prior to March 1, 2007, Global Real Estate Investment Fund was named Real Estate Investment Fund. Prior to May 18, 2007, AllianceBernstein National Municipal Income Fund was named National Municipal Income Fund. Prior to November 5, 2007, Diversified Yield Fund was named Global Strategic Income Trust and Global Bond Fund was named Global Government Income Trust. |
| ** | An investment in the Fund is not a deposit in a bank and is not insured or guaranteed by the Federal Deposit Insurance Corporation or any other government agency. Although the Fund seeks to preserve the value of your investment at $1.00 per share, it is possible to lose money by investing in the Fund. |
| 58 | • ALLIANCEBERNSTEIN BOND FUND CORPORATE BOND PORTFOLIO |
AllianceBernstein Family of Funds
NOTES
| ALLIANCEBERNSTEIN BOND FUND CORPORATE BOND PORTFOLIO • | 59 |
NOTES
| 60 | • ALLIANCEBERNSTEIN BOND FUND CORPORATE BOND PORTFOLIO |
ALLIANCEBERNSTEIN BOND FUND CORPORATE BOND PORTFOLIO
1345 Avenue of the Americas
New York, NY 10105
800.221.5672
| CB-0151-0907 |  | |
ANNUAL REPORT
AllianceBernstein Bond Fund
U.S. Government Portfolio

September 30, 2007
Annual Report
Investment Products Offered
| • | Are Not FDIC Insured |
| • | May Lose Value |
| • | Are Not Bank Guaranteed |
The investment return and principal value of an investment in the Fund will fluctuate as the prices of the individual securities in which it invests fluctuate, so that your shares, when redeemed, may be worth more or less than their original cost. You should consider the investment objectives, risks, charges and expenses of the Fund carefully before investing. For a free copy of the Fund’s prospectus, which contains this and other information, visit our web site at www.alliancebernstein.com or call your financial advisor or AllianceBernstein® at (800) 227-4618. Please read the prospectus carefully before you invest.
You may obtain performance information current to the most recent month-end by visiting www.alliancebernstein.com.
This shareholder report must be preceded or accompanied by the Fund’s prospectus for individuals who are not current shareholders of the Fund.
You may obtain a description of the Fund’s proxy voting policies and procedures, and information regarding how the Fund voted proxies relating to portfolio securities during the most recent 12-month period ended June 30, without charge. Simply visit AllianceBernstein’s web site at www.alliancebernstein.com, or go to the Securities and Exchange Commission’s (the “Commission”) web site at www.sec.gov, or call AllianceBernstein at (800) 227-4618.
The Fund files its complete schedule of portfolio holdings with the Commission for the first and third quarters of each fiscal year on Form N-Q. The Fund’s Forms N-Q are available on the Commission’s web site at www.sec.gov. The Fund’s Forms N-Q may also be reviewed and copied at the Commission’s Public Reference Room in Washington, DC; information on the operation of the Public Reference Room may be obtained by calling (800) SEC-0330.
AllianceBernstein Investments, Inc. is an affiliate of AllianceBernstein L.P., the manager of the AllianceBernstein funds, and is a member of FINRA.
AllianceBernstein® and the AB Logo are registered trademarks and service marks used by permission of the owner, AllianceBernstein L.P.
November 27, 2007
Annual Report
This report provides management’s discussion of fund performance for AllianceBernstein Bond Fund U.S. Government Portfolio (the “Portfolio”) for the annual reporting period ended September 30, 2007. On November 2, 2007, the Portfolio was acquired by AllianceBernstein Bond Fund — Intermediate Bond Portfolio. Please see the AllianceBernstein Bond Fund — Intermediate Bond Portfolio prospectus addressing the acquisition, dated September 18, 2007, for details.
Investment Objectives and Policies
The Portfolio’s investment objective is to generate income and price appreciation without assuming what AllianceBernstein considers undue risk. The Portfolio invests, under normal circumstances, at least 80% of its net assets in U.S. Government securities and repurchase agreements and forward contracts relating to U.S. Government securities. The Portfolio may invest the remaining 20% of its net assets in non-U.S. government debt securities, such as mortgage-related and other asset-backed securities, loan participations, inflation-protected securities, structured securities and variable, floating, and inverse floating rate instruments, preferred stock, and other corporate debt securities. The Portfolio will not invest in any security rated below BBB- by Standard and Poor’s (S&P) or Baa- by Moody’s. The Portfolio may invest in debt securities with a range of maturities from short- to long-term.
The Portfolio may use leverage for investment purposes. The Portfolio
intends, among other things, to enter into transactions such as reverse repurchase agreements and dollar rolls. The Portfolio may also invest, without limit, in derivative instruments, such as options, futures, forwards, or swap agreements.
Investment Results
The table on page 4 shows the Portfolio’s performance compared to its benchmark, the Lehman Brothers (LB) Government Index, which represents the U.S. government bond market, for the six- and 12-month periods ended September 30, 2007. Performance is also included for the Lipper General U.S. Government Funds Average (the “Lipper Average”). Funds in the Lipper Average have generally similar investment objectives to the Portfolio, although some may have different investment policies and sales and management fees.
The Portfolio’s Class A shares without sales charges underperformed the benchmark for both the six- and 12-month periods ended September 30, 2007. The Portfolio’s Class A shares without sales charges were in line with the Lipper Average for the six-month period, but underperformed the Lipper Average for the 12-month period under review. The Portfolio’s Class A shares without sales charges underperformed the benchmark during both periods as a broad liquidity crunch stemming from the subprime mortgage crisis led to falling Treasury yields, widening spreads across fixed-income markets and poor performance for non-government
| ALLIANCEBERNSTEIN BOND FUND U.S. GOVERNMENT PORTFOLIO • | 1 |
sectors relative to Treasuries. The Portfolio’s underweight to Treasuries and agencies and exposure to non-government sectors, specifically exposure to subprime-related asset-backed securities (ABS) and collateralized debt obligations (CDOs) as well as commercial mortgage-backed securities (CMBS), mortgage pass-throughs and Alt-A mortgage securities detracted from performance for both periods. Alt-A mortgage securities, or ‘alternative’ mortgages, are home loans made with less than full documentation.
Market Review and Investment Strategy
In the second half of the annual reporting period, concerns regarding subprime mortgages led to dramatic market volatility, reduced access to credit for consumers and corporations and worries that the broader economy would be negatively impacted by the subprime crisis. Reacting to these concerns, the U.S. Federal Reserve (the “Fed”) cut the fed funds rate by 50 basis points to 4.75% in September 2007.
Concerns regarding the subprime mortgage crisis caused fixed-income markets to sell off sharply in June, July and August of 2007. There was heightened demand for U.S. Treasuries during this period, as investors sought less-risky assets in light of the
subprime market volatility. For the
annual reporting period, U.S. Treasury holdings returned 5.63%, outperforming spread sectors on both an absolute and duration adjusted basis. Shorter maturity Treasuries outperformed longer-term Treasuries. Within the non-Treasury sectors, agencies returned 5.73% followed by mortgage pass-throughs at 5.39%, CMBS at 4.43% and ABS at 4.12%. Subprime-backed ABS and Alt-A mortgage securities saw significant price deterioration, despite their AAA and AA ratings. During the annual period, the yield curve steepened as shorter-term yields fell most, while 30-year yields inched up slightly. Two-year yields lost 70 basis points to yield 3.98%, the 10-year yield lost four basis points to end the period at 4.59% and 30-year yields gained seven basis points to end the period at 4.84%.
During the 12-month reporting period, the Portfolio was underweight to Treasuries and agencies and maintained significant allocations to higher-quality non-Treasury sectors including mortgages, CMOs, CMBS and ABS in an effort to enhance portfolio yield. The Portfolio also focused on increasing its allocation to floating-rate securities due to rising short-term yields and limited price volatility. Lastly, the Portfolio maintained its duration and yield curve structure closer to the benchmark during this period.
| 2 | • ALLIANCEBERNSTEIN BOND FUND U.S. GOVERNMENT PORTFOLIO |
HISTORICAL PERFORMANCE
An Important Note About the Value of Historical Performance
The performance on the following pages represents past performance and does not guarantee future results. Current performance may be lower or higher than the performance information shown. You may obtain performance information current to the most recent month-end by visiting www.alliancebernstein.com.
The investment return and principal value of an investment in the Portfolio will fluctuate, so that your shares, when redeemed, may be worth more or less than their original cost. You should consider the investment objectives, risks, charges and expenses of the Portfolio carefully before investing. For a free copy of the Portfolio’s prospectus, which contains this and other information, visit our website at www.alliancebernstein.com or call your financial advisor or AllianceBernstein Investments at 800.227.4618. You should read the prospectus carefully before you invest.
All fees and expenses related to the operation of the Portfolio have been deducted. NAV returns do not reflect sales charges; if sales charges were reflected, the Portfolio’s quoted performance would be lower. SEC returns reflect the applicable sales charges for each share class: a 4.25% maximum front-end sales charge for Class A shares; the applicable contingent deferred sales charge for Class B shares (3% year 1, 2% year 2, 1% year 3, 0% year 4); a 1% 1 year contingent deferred sales charge for Class C shares. Returns for the different share classes will vary due to different expenses associated with each class. Performance assumes reinvestment of distributions and does not account for taxes.
Benchmark Disclosure
The unmanaged Lehman Brothers (LB) Government Index does not reflect fees and expenses associated with the active management of a mutual fund portfolio. The Index is composed of the LB Treasury Index and the LB Agency Index. For the six- and 12-month periods ended September 30, 2007, the Lipper General U.S. Government Funds Average consisted of 176 and 165 funds, respectively. These funds have generally similar investment objectives to the Portfolio, although some may have different investment policies and sales and management fees. An investor cannot invest directly in an index or average, and their results are not indicative of the performance for any specific investment, including the Portfolio.
A Word About Risk
Price fluctuations in the Portfolio’s securities may be caused by changes in the general level of interest rates or changes in bond credit quality ratings. Please note, as interest rates rise, existing bond prices fall and can cause the value of an investment in the Portfolio to decline. Changes in interest rates have a greater effect on bonds with longer maturities than on those with shorter maturities. Investments in the Portfolio are not guaranteed because of fluctuation in the net asset value of the underlying fixed-income related investments. Similar to direct bond ownership, bond funds have the same interest rate, inflation and credit risks that are associated with the underlying bonds owned by the Portfolio. The Portfolio’s investments in mortgage-related or asset-backed securities may be subjected to prepayment risk. Portfolio purchasers should understand that, in contrast to owning individual bonds, there are ongoing fees and expenses associated with owning shares of bond funds. While the Portfolio invests principally in bonds and other fixed-income securities, in order to achieve its investment objectives, the Portfolio may at times use certain types of investment derivatives, such as options, futures, forwards and swaps. These instruments involve risks different from, and in certain cases, greater then, the risks presented by more traditional investments. The Portfolio may utilize leverage through the use of reverse repurchase arrangements, forward contracts or dollar rolls or by borrowing money. When a fund borrows money or otherwise leverages its portfolio, it may be volatile because leverage tends to exaggerate the effect of any increase or decrease in the value of a fund’s investments. These risks are fully discussed in the Portfolio’s prospectus.
(Historical Performance continued on next page)
| ALLIANCEBERNSTEIN BOND FUND U.S. GOVERNMENT PORTFOLIO • | 3 |
Historical Performance
HISTORICAL PERFORMANCE
(continued from previous page)
| THE PORTFOLIO VS. ITS BENCHMARK PERIODS ENDED SEPTEMBER 30, 2007 | Returns | |||||
| 6 Months | 12 Months | |||||
AllianceBernstein Bond Fund U.S. Government Portfolio | ||||||
Class A | 1.72% | 3.37% | ||||
Class B | 1.34% | 2.60% | ||||
Class C | 1.35% | 2.62% | ||||
Advisor Class* | 1.72% | 3.52% | ||||
Class R* | 1.41% | 3.08% | ||||
Class K* | 1.58% | 3.33% | ||||
Class I* | 1.91% | 3.80% | ||||
Lehman Brothers Government Index | 3.26% | 5.63% | ||||
Lipper General U.S. Government Funds Average | 1.73% | 3.87% | ||||
* Please note that these share classes are for investors purchasing shares through accounts established under certain fee-based programs sponsored and maintained by certain broker-dealers and financial intermediaries, institutional pension plans and/or advisory clients of, and certain other persons associated with, the Adviser and its affiliates or the Funds. | ||||||
GROWTH OF A $10,000 INVESTMENT IN THE PORTFOLIO 9/30/97 TO 9/30/07
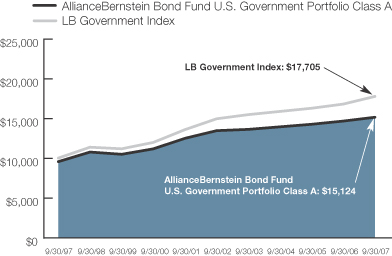
This chart illustrates the total value of an assumed $10,000 investment in AllianceBernstein Bond Fund U.S. Government Portfolio Class A shares (from 9/30/97 to 9/30/07) as compared to the performance of the benchmark, the LB Government Index. The chart reflects the deduction of the maximum 4.25% sales charge from the initial $10,000 investment in the Portfolio and assumes the reinvestment of dividends and capital gains distributions.
See Historical Performance and Benchmark disclosures on page 3.
(Historical Performance continued on next page)
| 4 | • ALLIANCEBERNSTEIN BOND FUND U.S. GOVERNMENT PORTFOLIO |
Historical Performance
HISTORICAL PERFORMANCE
(continued from previous page)
| AVERAGE ANNUAL RETURNS AS OF SEPTEMBER 30, 2007 | |||||||||
| NAV Returns | SEC Returns | SEC Yields** | |||||||
| Class A Shares | 4.51 | % | |||||||
1 Year | 3.37 | % | -0.97 | % | |||||
5 Years | 2.38 | % | 1.51 | % | |||||
10 Years | 4.67 | % | 4.22 | % | |||||
| Class B Shares | 3.95 | % | |||||||
1 Year | 2.60 | % | -0.36 | % | |||||
5 Years | 1.64 | % | 1.64 | % | |||||
10 Years(a) | 4.22 | % | 4.22 | % | |||||
| Class C Shares | 3.97 | % | |||||||
1 Year | 2.62 | % | 1.63 | % | |||||
5 Years | 1.65 | % | 1.65 | % | |||||
10 Years | 3.93 | % | 3.93 | % | |||||
| Advisor Class Shares† | 5.01 | % | |||||||
1 Year | 3.52 | % | 3.52 | % | |||||
5 Years | 2.66 | % | 2.66 | % | |||||
Since Inception* | 4.75 | % | 4.75 | % | |||||
| Class R Shares† | 4.27 | % | |||||||
1 Year | 3.08 | % | 3.08 | % | |||||
Since Inception* | 2.86 | % | 2.86 | % | |||||
| Class K Shares† | 4.54 | % | |||||||
1 Year | 3.33 | % | 3.33 | % | |||||
Since Inception* | 2.98 | % | 2.98 | % | |||||
| Class I Shares† | 4.94 | % | |||||||
1 Year | 3.80 | % | 3.80 | % | |||||
Since Inception* | 3.36 | % | 3.36 | % | |||||
The Portfolio’s prospectus fee table shows the Portfolio’s total annual operating expenses as 1.03%, 1.77%, 1.75%, 0.73%, 1.33%, 1.01% and 0.74% for Class A, Class B, Class C, Advisor Class, Class R, Class K and Class I, respectively.
| (a) | Assumes conversion of Class B shares into Class A shares after six years. |
| * | Inception Dates: 10/6/00 for Advisor Class shares; 11/3/03 for Class R shares; 3/1/05 for Class K and Class I shares. |
| ** | SEC yields are calculated based on SEC guidelines for the 30-day period ended September 30, 2007. |
| † | These share classes are offered at net asset value (NAV) to eligible investors and their SEC returns are the same as their NAV returns. Please note that these share classes are for investors purchasing shares through accounts established under certain fee-based programs sponsored and maintained by certain broker-dealers and financial intermediaries, institutional pension plans and/or advisory clients of, and certain other persons associated with, the Adviser and its affiliates or the Funds. The inception dates for these share classes are listed above. |
See Historical Performance disclosures on page 3.
(Historical Performance continued on next page)
| ALLIANCEBERNSTEIN BOND FUND U.S. GOVERNMENT PORTFOLIO • | 5 |
Historical Performance
HISTORICAL PERFORMANCE
(continued from previous page)
SEC AVERAGE ANNUAL RETURNS (WITH ANY APPLICABLE SALES CHARGES) AS OF THE MOST RECENT CALENDAR QUARTER-END (SEPTEMBER 30, 2007) |
| ||
| SEC Returns | |||
| Class A Shares | |||
1 Year | -0.97 | % | |
5 Years | 1.51 | % | |
10 Years | 4.22 | % | |
| Class B Shares | |||
1 Year | -0.36 | % | |
5 Years | 1.64 | % | |
10 Years(a) | 4.22 | % | |
| Class C Shares | |||
1 Year | 1.63 | % | |
5 Years | 1.65 | % | |
10 Years | 3.93 | % | |
| Advisor Class Shares† | |||
1 Year | 3.52 | % | |
5 Years | 2.66 | % | |
Since Inception* | 4.75 | % | |
| Class R Shares† | |||
1 Year | 3.08 | % | |
Since Inception* | 2.86 | % | |
| Class K Shares† | |||
1 Year | 3.33 | % | |
Since Inception* | 2.98 | % | |
| Class I Shares† | |||
1 Year | 3.80 | % | |
Since Inception* | 3.36 | % | |
| (a) | Assumes conversion of Class B shares into Class A shares after six years. |
| * | Inception Dates: 10/6/00 for Advisor Class shares; 11/3/03 for Class R shares; 3/1/05 for Class K and Class I shares. |
| † | Please note that these share classes are for investors purchasing shares through accounts established under certain fee-based programs sponsored and maintained by certain broker-dealers and financial intermediaries, institutional pension plans and/or advisory clients of, and certain other persons associated with, the Adviser and its affiliates or the Funds. The inception dates for these share classes are listed above. |
See Historical Performance disclosures on page 3.
| 6 | • ALLIANCEBERNSTEIN BOND FUND U.S. GOVERNMENT PORTFOLIO |
Historical Performance
FUND EXPENSES
As a shareholder of the Fund, you incur two types of costs: (1) transaction costs, including sales charges (loads) on purchase payments, contingent deferred sales charges on redemptions and (2) ongoing costs, including management fees; distribution (12b-1) fees; and other Fund expenses. This example is intended to help you understand your ongoing costs (in dollars) of investing in the Fund and to compare these costs with the ongoing costs of investing in other mutual funds.
The Example is based on an investment of $1,000 invested at the beginning of the period and held for the entire period as indicated below.
Actual Expenses
The table below provides information about actual account values and actual expenses. You may use the information, together with the amount you invested, to estimate the expenses that you paid over the period. Simply divide your account value by $1,000 (for example, an $8,600 account value divided by $1,000 = 8.6), then multiply the result by the number under the heading entitled “Expenses Paid During Period” to estimate the expenses you paid on your account during this period.
Hypothetical Example for Comparison Purposes
The table below also provides information about hypothetical account values and hypothetical expenses based on the Fund’s actual expense ratio and an assumed annual rate of return of 5% before expenses, which is not the Fund’s actual return. The hypothetical account values and expenses may not be used to estimate the actual ending account balance or expenses you paid for the period. You may use this information to compare the ongoing costs of investing in the Fund and other funds by comparing this 5% hypothetical example with the 5% hypothetical examples that appear in the shareholder reports of other funds.
Please note that the expenses shown in the table are meant to highlight your ongoing costs only and do not reflect any transactional costs, such as sales charges (loads), or contingent deferred sales charges on redemptions. Therefore, the hypothetical example is useful in comparing ongoing costs only, and will not help you determine the relative total costs of owning different funds. In addition, if these transactional costs were included, your costs would have been higher.
| Beginning Account Value April 1, 2007 | Ending Account Value September 30, 2007 | Expenses Paid During Period* | ||||||||||||||||
| Actual | Hypothetical | Actual | Hypothetical** | Actual | Hypothetical | |||||||||||||
| Class A | $ | 1,000 | $ | 1,000 | $ | 1,017.19 | $ | 1,020.16 | $ | 4.96 | $ | 4.96 | ||||||
| Class B | $ | 1,000 | $ | 1,000 | $ | 1,013.41 | $ | 1,016.34 | $ | 8.78 | $ | 8.80 | ||||||
| Class C | $ | 1,000 | $ | 1,000 | $ | 1,013.49 | $ | 1,016.50 | $ | 8.63 | $ | 8.64 | ||||||
| Advisor Class | $ | 1,000 | $ | 1,000 | $ | 1,017.20 | $ | 1,021.61 | $ | 3.49 | $ | 3.50 | ||||||
| Class R | $ | 1,000 | $ | 1,000 | $ | 1,014.10 | $ | 1,018.55 | $ | 6.56 | $ | 6.58 | ||||||
| Class K | $ | 1,000 | $ | 1,000 | $ | 1,015.84 | $ | 1,019.70 | $ | 5.41 | $ | 5.42 | ||||||
| Class I | $ | 1,000 | $ | 1,000 | $ | 1,019.08 | $ | 1,021.96 | $ | 3.14 | $ | 3.14 | ||||||
| * | Expenses are equal to the classes’ annualized expense ratios of 0.98%, 1.74%, 1.71%, 0.69%, 1.30%, 1.07% and 0.62%, respectively, multiplied by the average account value over the period, multiplied by 183/365 (to reflect the one-half year period). |
| ** | Assumes 5% return before expenses. |
| ALLIANCEBERNSTEIN BOND FUND U.S. GOVERNMENT PORTFOLIO • | 7 |
Fund Expenses
PORTFOLIO SUMMARY
September 30, 2007
PORTFOLIO STATISTICS
Net Assets ($mil): $510.1
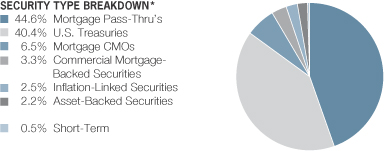
| * | All data are as of September 30, 2007. The Portfolio’s security type breakdown is expressed as a percentage of total investments (excluding security lending collateral) and may vary over time. |
| 8 | • ALLIANCEBERNSTEIN BOND FUND U.S. GOVERNMENT PORTFOLIO |
Portfolio Summary
PORTFOLIO OF INVESTMENTS
September 30, 2007
| Principal Amount (000) | U.S. $ Value | |||||
MORTGAGE PASS-THRU’S – 44.4% | ||||||
Fixed Rate 30-Year – 28.3% | ||||||
Federal Gold Loan Mortgage Corp. | $ | 8,832 | $ | 9,119,470 | ||
Federal National Mortgage Association | 201 | 204,441 | ||||
Series 2006 | 13,377 | 12,780,961 | ||||
6.50%, 2/01/36-12/01/36 | 20,608 | 20,986,250 | ||||
Series 2007 | 67,297 | 64,394,470 | ||||
6.50%, 4/01/37-8/01/37 | 26,386 | 26,867,503 | ||||
Government National Mortgage Association Series 1990 | 0 | 240 | ||||
Series 1999 | 350 | 373,531 | ||||
Series 2000 | 312 | 316,934 | ||||
Series 2003 | 9,539 | 9,420,066 | ||||
| 144,463,866 | ||||||
Agency ARMS – 8.7% | ||||||
Federal Home Loan Mortgage Corp. | 512 | 514,659 | ||||
Series 2006 | 2,646 | 2,621,548 | ||||
5.774%, 12/01/36(a) | 3,690 | 3,716,051 | ||||
Series 2007 | 3,472 | 3,498,396 | ||||
5.903%, 3/01/37(a) | 5,552 | 5,599,981 | ||||
5.954%, 1/01/37(a) | 6,531 | 6,599,647 | ||||
6.249%, 4/01/37(a) | 3,761 | 3,813,906 | ||||
Federal National Mortgage Association | 371 | 372,924 | ||||
4.677%, 5/01/35(a) | 723 | 722,734 | ||||
4.81%, 7/01/35(a) | 1,316 | 1,315,940 | ||||
7.016%, 1/01/36(a) | 1,007 | 1,026,999 | ||||
Series 2006 | 588 | 591,082 | ||||
4.529%, 8/01/34(a) | 621 | 624,454 | ||||
5.562%, 4/01/36(a) | 954 | 962,417 | ||||
5.692%, 12/01/36(a) | 6,533 | 6,600,173 | ||||
5.807%, 3/01/36(a) | 2,222 | 2,249,441 | ||||
| ALLIANCEBERNSTEIN BOND FUND U.S. GOVERNMENT PORTFOLIO • | 9 |
Portfolio of Investments
| Principal Amount (000) | U.S. $ Value | |||||
5.924%, 6/01/36(a) | $ | 331 | $ | 335,042 | ||
5.996%, 5/01/36(a) | 838 | 851,348 | ||||
Series 2007 | 2,649 | 2,683,261 | ||||
| 44,700,003 | ||||||
Non-Agency ARMS – 6.1% | ||||||
Adjustable Rate Mortgage Trust | 2,643 | 2,588,439 | ||||
Banc of America Funding Corp. | 3,698 | 3,684,621 | ||||
Bear Stearns Alt-A Trust | 2,262 | 2,279,963 | ||||
Series 2007-1, Class 21A1 | 2,601 | 2,595,990 | ||||
Citigroup Mortgage Loan Trust, Inc. | 2,692 | 2,644,052 | ||||
Countrywide Home Loan Mortgage Pass | 3,132 | 3,131,169 | ||||
Indymac INDA Mortgage Loan Trust | 3,417 | 3,427,902 | ||||
Indymac Index Mortgage Loan Trust | 1,751 | 1,760,087 | ||||
JPMorgan Alternative Loan Trust | 2,331 | 2,345,338 | ||||
Series 2006-A3, Class 2A1 | 2,274 | 2,284,360 | ||||
Residential Funding Mortgage Securities, Inc. | 2,705 | 2,642,991 | ||||
Structured Asset Securities Corp. | 1,685 | 1,657,831 | ||||
| 31,042,743 | ||||||
| 10 | • ALLIANCEBERNSTEIN BOND FUND U.S. GOVERNMENT PORTFOLIO |
Portfolio of Investments
| Principal Amount (000) | U.S. $ Value | |||||
Fixed Rate 15-Year – 1.3% | ||||||
Government National Mortgage Association | $ | 1,760 | $ | 1,806,512 | ||
Series 2001 | 4,549 | 4,705,539 | ||||
| 6,512,051 | ||||||
Total Mortgage Pass-Thru’s | 226,718,663 | |||||
U.S. TREASURIES – 39.6% | ||||||
U.S. Treasury Bonds | 11,700 | 13,250,250 | ||||
6.25%, 8/15/23 | 18,000 | 20,678,904 | ||||
6.625%, 2/15/27(c)(d) | 23,400 | 28,436,476 | ||||
7.125%, 2/15/23 | 20,000 | 24,821,880 | ||||
7.50%, 11/15/16 | 19,500 | 23,687,937 | ||||
8.75%, 5/15/17 | 5,340 | 7,032,945 | ||||
11.25%, 2/15/15 | 23,694 | 33,736,181 | ||||
U.S. Treasury Notes | 4,000 | 3,947,188 | ||||
4.50%, 11/15/15(d) | 18,560 | 18,584,648 | ||||
4.625%, 11/15/16(d) | 7,238 | 7,273,625 | ||||
5.125%, 5/15/16(d) | 4,000 | 4,167,812 | ||||
5.75%, 8/15/10(d) | 15,500 | 16,218,084 | ||||
Total U.S. Treasuries | 201,835,930 | |||||
MORTGAGE CMO’S – 6.8% | ||||||
Non-Agency Fixed Rate – 4.4% | ||||||
Countrywide Alternative Loan Trust | 11,557 | 327,076 | ||||
Series 2006-J8, Class A2 | 2,614 | 2,596,562 | ||||
Deutsche Mortgage Securities, Inc. | 1,257 | 1,243,041 | ||||
Greenpoint Mortgage Funding Trust | 12,066 | 180,986 | ||||
Series 2005-AR5, Class 4X2 | 6,925 | 75,745 | ||||
Merrill Lynch Mortgage Investors, Inc. | 2,360 | 2,337,465 | ||||
| ALLIANCEBERNSTEIN BOND FUND U.S. GOVERNMENT PORTFOLIO • | 11 |
Portfolio of Investments
| Principal Amount (000) | U.S. $ Value | |||||
Residential Accredit Loans, Inc. | $ | 2,636 | $ | 2,676,340 | ||
Residential Asset Mortgage Products, Inc. | 3,572 | 3,584,013 | ||||
Residential Asset Securitization Trust | 1,687 | 1,190,485 | ||||
Structured Asset Mortgage Investments, Inc. | 3,908 | 92,804 | ||||
Structured Asset Securities Corp. | 3,144 | 3,128,662 | ||||
Series 2006-RM1, Class AIO | 4,376 | 897,172 | ||||
Washington Mutual Mortgage Pass Through | 2,473 | 2,462,363 | ||||
Wells Fargo Mortgage Backed Securities Trust | 1,887 | 1,878,761 | ||||
| 22,671,475 | ||||||
Non-Agency Adjustable Rate – 2.2% | ||||||
Countrywide Alternative Loan Trust | 2,750 | 2,694,658 | ||||
Greenpoint Mortgage Funding Trust | 998 | 842,157 | ||||
Series 2006-AR2, Class 4A1 | 2,698 | 2,697,767 | ||||
JPMorgan Alternative Loan Trust | 2,433 | 2,459,788 | ||||
Washington Mutual Mortgage Pass Through | 2,484 | 2,393,331 | ||||
| 11,087,701 | ||||||
Agency Fixed Rate – 0.2% | ||||||
Government National Mortgage Association | 23,558 | 1,123,485 | ||||
Total Mortgage CMO’s | 34,882,661 | |||||
| 12 | • ALLIANCEBERNSTEIN BOND FUND U.S. GOVERNMENT PORTFOLIO |
Portfolio of Investments
| Principal Amount (000) | U.S. $ Value | |||||
COMMERCIAL MORTGAGE-BACKED SECURITIES – 3.2% | ||||||
Non-Agency Fixed Rate CMBS – 3.2% | ||||||
Credit Suisse Mortgage Capital Certificates | $ | 4,130 | $ | 4,022,579 | ||
GS Mortgage Securities Corp. II | 2,670 | 2,713,619 | ||||
LB-UBS Commercial Mortgage Trust | 121,670 | 1,090,503 | ||||
Series 2006-C6, Class XCL | 77,212 | 1,423,209 | ||||
Series 2007-C6, Class A3 | 4,500 | 4,581,540 | ||||
Mortgage Capital Funding, Inc. | 291 | 12 | ||||
Prudential Securities Secured Financing Corp. | 211,215 | 2,667,502 | ||||
Total Commercial Mortgage-Backed Securities | 16,498,964 | |||||
INFLATION-LINKED SECURITIES – 2.5% | ||||||
U.S. Treasury Notes | 12,688 | 12,769,997 | ||||
ASSET-BACKED SECURITIES – 2.1% | ||||||
Home Equity Loans - Floating Rate – 1.3% | ||||||
HFC Home Equity Loan Asset Backed Certificates | 650 | 595,523 | ||||
Home Equity Asset Trust | 500 | 200,000 | ||||
Household Home Equity Loan trust | 1,250 | 1,097,475 | ||||
Series 2007-2, Class M2 | 650 | 597,630 | ||||
Lehman XS Trust | 1,000 | 838,460 | ||||
Series 2006-18N, Class M2 | 3,000 | 2,349,330 | ||||
| ALLIANCEBERNSTEIN BOND FUND U.S. GOVERNMENT PORTFOLIO • | 13 |
Portfolio of Investments
| Principal Amount (000) | U.S. $ Value | ||||
Saxon Asset Securities | $ 1,000 | $ | 878,980 | ||
| 6,557,398 | |||||
Other - Floating Rate – 0.3% | |||||
Halcyon Securitized Product Investors | 580 | 301,600 | |||
Libertas Preferred Funding Ltd. | 1,350 | 607,500 | |||
Neapolitan Segregated Portfolio | 500 | 140,000 | |||
Petra CRE CDO Ltd. | 550 | 508,491 | |||
| 1,557,591 | |||||
Other - Fixed Rate – 0.3% | |||||
DB Master Finance, LLC | 1,395 | 1,394,288 | |||
Government National Mortgage Association | 2,451 | 127,908 | |||
| 1,522,196 | |||||
Home Equity Loans - Fixed Rate – 0.2% | |||||
Nationstar NIM Trust | 210 | 199,131 | |||
Structured Asset Securities Corp. | 4,846 | 1,116,831 | |||
| 1,315,962 | |||||
Total Asset-Backed Securities | 10,953,147 | ||||
| Shares | |||||
SHORT-TERM INVESTMENTS – 0.5% | |||||
Investment Companies – 0.5% | |||||
AllianceBernstein Fixed-Income Shares, | 2,346,857 | 2,346,857 | |||
Total Investments Before Security Lending Collateral – 99.1% | |||||
(cost $501,376,306) | 506,006,219 | ||||
| 14 | • ALLIANCEBERNSTEIN BOND FUND U.S. GOVERNMENT PORTFOLIO |
Portfolio of Investments
| Shares | U.S. $ Value | |||||
INVESTMENT OF CASH COLLATERAL FOR SECURITIES LOANED – 15.4% | ||||||
| Short Terms – 15.4% | ||||||
UBS Private Money Market Fund, LLC | 78,327,687 | $ | 78,327,687 | |||
Total Investments – 114.5% | 584,333,906 | |||||
Other assets less liabilities – (14.5)% | (74,198,442 | ) | ||||
Net Assets – 100.0% | $ | 510,135,464 | ||||
FINANCIAL FUTURES CONTRACTS (see Note D)
| Type | Number of Contracts | Expiration Month | Original Value | Value at September 30, 2007 | Unrealized Appreciation/ (Depreciation) | ||||||||
Purchased Contracts | |||||||||||||
U.S. T-Note 2 Yr Future | 156 | December 2007 | $ | 32,216,890 | $ | 32,299,313 | $ | 82,423 | |||||
U.S. T-Note 5 Yr Future | 119 | December 2007 | 12,716,611 | 12,736,719 | 20,108 | ||||||||
Sold Contracts | |||||||||||||
U.S. T-Note 10 Yr Future | 361 | December 2007 | 39,613,062 | 39,450,531 | 162,531 | ||||||||
| $ | 265,062 | ||||||||||||
| (a) | Floating Rate Security. Stated interest rate was in effect at September 30, 2007. |
| (b) | Variable rate coupon, rate shown as of September 30, 2007. |
| (c) | Position, or a portion thereof, has been segregated to collateralize margin requirements for open futures contracts. The market value of this security amounted to $425,332. |
| (d) | Represents entire or partial securities out on loan. See Note E for securities lending information. |
| (e) | IO – Interest Only |
| (f) | Security is exempt from registration under Rule 144A of the Securities Act of 1933. These securities are considered liquid and may be resold in transactions exempt from registration, normally to qualified institutional buyers. At September 30, 2007, the aggregate market value of these securities amounted to $11,589,268 or 2.3% of net assets. |
| (g) | Illiquid security. |
| (h) | Investment in affiliated money market mutual fund. |
| Glossary: |
| TIPS | – Treasury Inflation Protected Security |
| See notes to financial statements. |
| ALLIANCEBERNSTEIN BOND FUND U.S. GOVERNMENT PORTFOLIO • | 15 |
Portfolio of Investments
STATEMENT OF ASSETS & LIABILITIES
September 30, 2007
| Assets | ||||
Investments in securities, at value: | ||||
Unaffiliated issuers (cost $577,357,136 — including investment of cash collateral for securities loaned of $78,327,687) | $ | 581,987,049 | (a) | |
Affiliated issuers (cost $2,346,857) | 2,346,857 | |||
Cash | 49,688 | |||
Dividends and interest receivable | 4,339,902 | |||
Receivable for investment securities sold | 2,424,559 | |||
Receivable for capital stock sold | 2,291,737 | |||
Receivable for variation margin on futures contracts | 26,531 | |||
Total assets | 593,466,323 | |||
| Liabilities | ||||
Payable for collateral on securities loaned | 78,327,687 | |||
Payable for capital stock redeemed | 2,992,222 | |||
Dividends payable | 664,818 | |||
Advisory fee payable | 576,940 | |||
Distribution fee payable | 188,738 | |||
Transfer Agent fee payable | 84,141 | |||
Administrative fee payable | 26,567 | |||
Accrued expenses and other liabilities | 469,746 | |||
Total liabilities | 83,330,859 | |||
Net Assets | $ | 510,135,464 | ||
| Composition of Net Assets | ||||
Capital stock, at par | $ | 75,488 | ||
Additional paid-in capital | 607,577,135 | |||
Distributions in excess of net investment income | (2,548,895 | ) | ||
Accumulated net realized loss on investment transactions | (99,862,717 | ) | ||
Net unrealized appreciation of investments | 4,894,453 | |||
| $ | 510,135,464 | |||
Net Asset Value Per Share—21 billion shares of capital stock authorized, $.001 par value
| Class | Net Assets | Shares Outstanding | Net Asset Value | ||||||
| A | $ | 404,144,098 | 59,813,101 | $ | 6.76 | * | |||
| B | $ | 46,083,591 | 6,821,410 | $ | 6.76 | ||||
| C | $ | 58,242,059 | 8,607,317 | $ | 6.77 | ||||
| Advisor | $ | 1,285,537 | 190,045 | $ | 6.76 | ||||
| R | $ | 41,489 | 6,136 | $ | 6.76 | ||||
| K | $ | 329,067 | 48,725 | $ | 6.75 | ||||
| I | $ | 9,623 | 1,424 | $ | 6.76 | ||||
| * | The maximum offering price per share for Class A shares was $7.06 which reflects a sales charge of 4.25%. |
| (a) | Includes securities on loan with a value of $76,325,262 (see Note E). |
| See notes to financial statements. |
| 16 | • ALLIANCEBERNSTEIN BOND FUND U.S. GOVERNMENT PORTFOLIO |
Statement of Assets & Liabilities
STATEMENT OF OPERATIONS
Year Ended September 30, 2007
| Investment Income | ||||||||
Interest | $ | 26,929,430 | ||||||
Dividends | ||||||||
Affiliated issuers | 1,344,235 | $ | 28,273,665 | |||||
| Expenses | ||||||||
Advisory fee (see Note B) | 2,450,828 | |||||||
Distribution fee—Class A | 1,277,124 | |||||||
Distribution fee—Class B | 651,379 | |||||||
Distribution fee—Class C | 620,612 | |||||||
Distribution fee—Class R | 300 | |||||||
Distribution fee—Class K | 189 | |||||||
Transfer agency—Class A | 664,093 | |||||||
Transfer agency—Class B | 139,159 | |||||||
Transfer agency—Class C | 111,544 | |||||||
Transfer agency—Advisor Class | 8,364 | |||||||
Transfer agency—Class R | 144 | |||||||
Transfer agency—Class K | 128 | |||||||
Transfer agency—Class I | 4 | |||||||
Printing | 283,408 | |||||||
Custodian | 174,114 | |||||||
Registration fees | 102,182 | |||||||
Administrative | 101,181 | |||||||
Audit | 76,942 | |||||||
Directors’ fees | 38,667 | |||||||
Legal | 34,133 | |||||||
Miscellaneous | 6,413 | |||||||
Total expenses before interest expense | 6,740,908 | |||||||
Interest expense | 458,472 | |||||||
Total expenses | 7,199,380 | |||||||
Less: expense offset arrangement | (88,977 | ) | ||||||
Net expenses | 7,110,403 | |||||||
Net investment income | 21,163,262 | |||||||
| Realized and Unrealized Gain (Loss) on Investment Transactions | ||||||||
Net realized loss on: | ||||||||
Investment transactions | (10,064,135 | ) | ||||||
Futures contracts | (973,230 | ) | ||||||
Net change in unrealized | 6,905,277 | |||||||
Futures contracts | 173,947 | |||||||
Net loss on investment transactions | (3,958,141 | ) | ||||||
Net Increase in Net Assets from Operations | $ | 17,205,121 | ||||||
See notes to financial statements.
| ALLIANCEBERNSTEIN BOND FUND U.S. GOVERNMENT PORTFOLIO • | 17 |
Statement of Operations
STATEMENT OF CHANGES IN NET ASSETS
| Year Ended September 30, 2007 | Year Ended September 30, 2006 | |||||||
| Increase (Decrease) in Net Assets from Operations | ||||||||
Net investment income | $ | 21,163,262 | $ | 28,104,262 | ||||
Net realized loss on investment transactions | (11,037,365 | ) | (9,502,318 | ) | ||||
Net change in unrealized appreciation/depreciation of investments | 7,079,224 | (5,137,033 | ) | |||||
Net increase in net assets from operations | 17,205,121 | 13,464,911 | ||||||
| Dividends to Shareholders from | ||||||||
Net investment income | ||||||||
Class A | (19,121,850 | ) | (22,604,739 | ) | ||||
Class B | (2,431,287 | ) | (4,137,570 | ) | ||||
Class C | (2,334,383 | ) | (2,849,239 | ) | ||||
Advisor Class | (241,299 | ) | (303,181 | ) | ||||
Class R | (2,549 | ) | (1,262 | ) | ||||
Class K | (3,383 | ) | (451 | ) | ||||
Class I | (474 | ) | (475 | ) | ||||
| Capital Stock Transactions | ||||||||
Net decrease | (94,049,190 | ) | (145,187,552 | ) | ||||
| Capital Contributions | ||||||||
Proceeds from third party regulatory settlement (see Note F) | 2,755 | –0– | ||||||
Total decrease | (100,976,539 | ) | (161,619,558 | ) | ||||
| Net Assets | ||||||||
Beginning of period | 611,112,003 | 772,731,561 | ||||||
End of period (including distributions in excess of net investment income of ($2,548,895) and ($6,248,034), respectively) | $ | 510,135,464 | $ | 611,112,003 | ||||
See notes to financial statements.
| 18 | • ALLIANCEBERNSTEIN BOND FUND U.S. GOVERNMENT PORTFOLIO |
Statement of Changes in Net Assets
NOTES TO FINANCIAL STATEMENTS
September 30, 2007
NOTE A
Significant Accounting Policies
AllianceBernstein Bond Fund, Inc. (the “Fund”) is registered under the Investment Company Act of 1940 as a diversified, open-end management investment company. The Fund, which is a Maryland corporation, operates as a series company currently comprised of three portfolios: the Corporate Bond Portfolio, the Intermediate Bond Portfolio, and the U.S. Government Portfolio. Each series is considered to be a separate entity for financial reporting and tax purposes. This report relates only to the U.S Government Portfolio. The U.S. Government Portfolio (the “Portfolio”) offers Class A, Class B, Class C, Advisor Class, Class R, Class K and Class I shares. Class A shares are sold with a front-end sales charge of up to 4.25% for purchases not exceeding $1,000,000. With respect to purchases of $1,000,000 or more, Class A shares redeemed within one year of purchase may be subject to a contingent deferred sales charge of 1%. Class B shares are currently sold with a contingent deferred sales charge which declines from 3% to zero depending on the period of time the shares are held. Class B shares will automatically convert to Class A shares six years after the end of the calendar month of purchase. Class C shares are subject to a contingent deferred sales charge of 1% on redemptions made within the first year after purchase. Class R and Class K shares are sold without an initial or contingent deferred sales charge. Advisor Class and Class I shares are sold without an initial or contingent deferred sales charge and are not subject to ongoing distribution expenses. All seven classes of shares have identical voting, dividend, liquidation and other rights, except that the classes bear different distribution and transfer agency expenses. Each class has exclusive voting rights with respect to its distribution plan. The financial statements have been prepared in conformity with U.S. generally accepted accounting principles which require management to make certain estimates and assumptions that affect the reported amounts of assets and liabilities in the financial statements and amounts of income and expenses during the reporting period. Actual results could differ from those estimates. The following is a summary of significant accounting policies followed by the Portfolio.
1. Security Valuation
Portfolio securities are valued at their current market value determined on the basis of market quotations or, if market quotations are not readily available or are deemed unreliable, at “fair value” as determined in accordance with procedures established by and under the general supervision of the Fund’s Board of Directors.
In general, the market value of securities which are readily available and deemed reliable are determined as follows. Securities listed on a national securities exchange (other than securities listed on the NASDAQ Stock Market, Inc. (“NASDAQ”)) or on a foreign securities exchange are valued at the last sale price at the close of the exchange or foreign securities exchange. If there has been no sale on such day, the securities are valued at the mean of the closing bid and asked prices on such day. Securities listed on more than one exchange are
| ALLIANCEBERNSTEIN BOND FUND U.S. GOVERNMENT PORTFOLIO • | 19 |
Notes to Financial Statements
valued by reference to the principal exchange on which the securities are traded; securities listed only on NASDAQ are valued in accordance with the NASDAQ Official Closing Price; listed put or call options are valued at the last sale price. If there has been no sale on that day, such securities will be valued at the closing bid prices on that day; open futures contracts and options thereon are valued using the closing settlement price or, in the absence of such a price, the most recent quoted bid price. If there are no quotations available for the day of valuation, the last available closing settlement price is used; securities traded in the over-the-counter market, (“OTC”) are valued at the mean of the current bid and asked prices as reported by the National Quotation Bureau or other comparable sources; U.S. Government securities and other debt instruments having 60 days or less remaining until maturity are valued at amortized cost if their original maturity was 60 days or less; or by amortizing their fair value as of the 61st day prior to maturity if their original term to maturity exceeded 60 days; fixed-income securities, including mortgage backed and asset backed securities, may be valued on the basis of prices provided by a pricing service or at a price obtained from one or more of the major broker/dealers. In cases where broker/dealer quotes are obtained, AllianceBernstein L.P. (the “Adviser”) may establish procedures whereby changes in market yields or spreads are used to adjust, on a daily basis, a recently obtained quoted price on a security; and OTC and other derivatives are valued on the basis of a quoted bid price or spread from a major broker/dealer in such security.
Securities for which market quotations are not readily available (including restricted securities) or are deemed unreliable are valued at fair value. Factors considered in making this determination may include, but are not limited to, information obtained by contacting the issuer, analysts, analysis of the issuer’s financial statements or other available documents. In addition, the Fund may use fair value pricing for securities primarily traded in non-U.S. markets because most foreign markets close well before the Fund values its securities at 4:00 p.m., Eastern Time. The earlier close of these foreign markets gives rise to the possibility that significant events, including broad market moves, may have occurred in the interim and may materially affect the value of those securities.
2. Taxes
It is the Portfolio’s policy to meet the requirements of the Internal Revenue Code applicable to regulated investment companies and to distribute all of its investment company taxable income and net realized gains, if any, to shareholders. Therefore, no provisions for federal income or excise taxes are required. The Portfolio may be subject to taxes imposed by countries in which it invests. Such taxes are generally based on income and/or capital gains earned or repatriated. Taxes are accrued and applied to net investment income, net realized gains and net unrealized appreciation/depreciation as such income and/or gains are earned.
| 20 | • ALLIANCEBERNSTEIN BOND FUND U.S. GOVERNMENT PORTFOLIO |
Notes to Financial Statements
3. Investment Income and Investment Transactions
Interest income is accrued daily. Investment transactions are accounted for on the trade date the securities are purchased or sold. Investment gains and losses are determined on the identified cost basis. The Portfolio amortizes premiums and accretes discounts as adjustments to interest income.
4. Class Allocations
All income earned and expenses incurred by the Portfolio are borne on a pro-rata basis by each outstanding class of shares, based on the proportionate interest in the Portfolio represented by the net assets of such class, except for class specific expenses which are allocated to the respective class. Expenses of the Fund are charged to each Portfolio in proportion to net assets. Realized and unrealized gains and losses are allocated among the various share classes based on respective net assets.
5. Dividends and Distributions
Dividends and distributions to shareholders, if any, are recorded on the ex-dividend date. Income dividends and capital gains distributions are determined in accordance with federal tax regulations and may differ from those determined in accordance with U.S. generally accepted accounting principles. To the extent these differences are permanent, such amounts are reclassified within the capital accounts based on their federal tax basis treatment; temporary differences do not require such reclassification.
6. Repurchase Agreements
It is the Portfolio’s policy that its custodian or designated subcustodian take control of securities as collateral under repurchase agreements and to determine on a daily basis that the value of such securities are sufficient to cover the value of the repurchase agreements. If the seller defaults and the value of the collateral declines or if bankruptcy proceedings are commenced with respect to the seller of the security, realization of collateral by the Portfolio may be delayed or limited.
NOTE B
Advisory Fee and Other Transactions with Affiliates
Under the terms of the investment advisory agreement, the Portfolio pays the Adviser an advisory fee at an annual rate of .45% of the first $2.5 billion, .40% of the next $2.5 billion and .35% in excess of $5 billion, of the Portfolio’s net assets valued on the last business day of the previous quarter. The fee is accrued daily and paid quarterly.
Pursuant to the Advisory agreement, the Portfolio paid $101,181 to the Adviser representing the cost of certain legal and accounting services provided to the Portfolio by the Adviser for the year ended September 30, 2007.
The Portfolio compensates AllianceBernstein Investor Services, Inc. (“ABIS”), a wholly-owned subsidiary of the Adviser, under a Transfer Agency Agreement for
| ALLIANCEBERNSTEIN BOND FUND U.S. GOVERNMENT PORTFOLIO • | 21 |
Notes to Financial Statements
providing personnel and facilities to perform transfer agency services for the Fund. ABIS may make payments to intermediaries that provide omnibus account services, sub-accounting services and/or networking services. Such compensation retained by ABIS amounted to $523,795 for the year ended September 30, 2007.
For the year ended September 30, 2007, the Portfolio’s expenses were reduced by $88,977 under an expense offset arrangement with ABIS.
AllianceBernstein Investments, Inc. (the “Distributor”), a wholly-owned subsidiary of the Adviser, serves as the distributor of the Portfolio’s shares. The Distributor has advised the Portfolio that it has retained front-end sales charge of $6,946 from the sale of Class A shares and received $32,993, $24,904 and $3,692 in contingent deferred sales charges imposed upon redemptions by shareholders of Class A, Class B and Class C shares, respectively, for the year ended September 30, 2007.
The Portfolio may invest in the AllianceBernstein Fixed-Income Shares, Inc. — Prime STIF Portfolio and the AllianceBernstein Fixed-Income Shares, Inc. — Government STIF Portfolio (collectively, the “STIF Portfolios”), open-end management investment companies managed by the Adviser. The STIF Portfolios are offered as cash management options to mutual funds, trusts, and other accounts managed by the Adviser, and are not available for direct purchase by members of the public. The STIF Portfolios pay no investment management fees.
Accrued expenses includes $522 owed to a former director under the Fund’s deferred compensation plan.
NOTE C
Distribution Services Agreement
The Portfolio has adopted a Distribution Services Agreement (the “Agreement”) pursuant to Rule 12b-1 under the Investment Company Act of 1940. Under the Agreement, the Portfolio pays distribution and servicing fees to the Distributor at an annual rate of up to .30% of the Portfolio’s average daily net assets attributable to Class A shares, 1% of the Portfolio’s average daily net assets attributable to both Class B and Class C shares, .50% of the Portfolio’s average daily net assets attributable to Class R shares and .25% of the Portfolio’s average daily net assets attributable to Class K shares. There are no distribution and servicing fees on the Advisor Class and Class I shares. The fees are accrued daily and paid monthly. The Agreement provides that the Distributor will use such payments in their entirety for distribution assistance and promotional activities. The Distributor has incurred expenses in excess of the distribution costs reimbursed by the Portfolio in the amounts of $36,832,389, $6,375,277, $9,115 and $292 for Class B, Class C, Class R and Class K shares, respectively. While such costs may be recovered from the Portfolio in future periods so long as the Agreement is in effect, the rate of the distribution and servicing fees payable under the
| 22 | • ALLIANCEBERNSTEIN BOND FUND U.S. GOVERNMENT PORTFOLIO |
Notes to Financial Statements
Agreement may not be increased without a shareholder vote. In accordance with the Agreement, there is no provision for recovery of unreimbursed distribution costs incurred by the Distributor beyond the current fiscal year for Class A shares. The Agreement also provides that the Adviser may use its own resources to finance the distribution of the Portfolio’s shares.
NOTE D
Investment Transactions
Purchases and sales of investment securities (excluding short-term investments) for the year ended September 30, 2007 were as follows:
| Purchases | Sales | |||||
Investment securities (excluding | $ | 63,046,738 | $ | 45,894,571 | ||
U.S. government securities | 1,064,411,229 | 1,159,038,872 | ||||
The cost of investments for federal income tax purposes, gross unrealized appreciation and unrealized depreciation (excluding future contracts) are as follows:
Cost | $ | 582,906,478 | ||
Gross unrealized appreciation | $ | 6,572,733 | ||
Gross unrealized depreciation | (5,145,305 | ) | ||
Net unrealized appreciation | $ | 1,427,428 | ||
1. Financial Futures Contracts
The Portfolio may buy or sell financial futures contracts for the purpose of hedging its portfolio against adverse effects of anticipated movements in the market. The Portfolio bears the market risk that arises from changes in the value of these financial instruments and the imperfect correlation between movements in the price of the futures contracts and movements in the price of the securities hedged or used for cover.
At the time the Portfolio enters into a futures contract, the Portfolio deposits and maintains as collateral an initial margin with the broker, as required by the exchange on which the transaction is effected. Pursuant to the contract, the Portfolio agrees to receive from or pay to the broker an amount of cash equal to the daily fluctuation in the value of the contract. Such receipts or payments are known as variation margin and are recorded by the Portfolio as unrealized gains or losses. Risks may arise from the potential inability of a counterparty to meet the terms of the contract. When the contract is closed, the Portfolio records a realized gain or loss equal to the difference between the value of the contract at the time it was opened and the time it was closed.
2. Swap Agreements
The Portfolio may enter into interest rate swaps to protect itself from interest rate fluctuations on the underlying debt instruments. A swap is an agreement
| ALLIANCEBERNSTEIN BOND FUND U.S. GOVERNMENT PORTFOLIO • | 23 |
Notes to Financial Statements
that obligates two parties to exchange a series of cash flows at specified intervals based upon or calculated by reference to changes in specified prices or rates for a specified amount of an underlying asset. The payment flows are usually netted against each other, with the difference being paid by one party to the other.
Risks may arise as a result of the failure of the counterparty to the swap contract to comply with the terms of the swap contract. The loss incurred by the failure of a counterparty is generally limited to the net interim payment to be received by the Portfolio, and/or the termination value at the end of the contract. Therefore, the Portfolio considers the creditworthiness of each counterparty to a swap contract in evaluating potential credit risk. Additionally, risks may arise from unanticipated movements in interest rates or in the value of the underlying securities.
As of October 1, 2003, the Portfolio has adopted the method of accounting for interim payments on swap contracts in accordance with Financial Accounting Standards Board Statement No. 133. The Portfolio accrues for the interim payments on swap contracts on a daily basis, with the net amount recorded within unrealized appreciation/depreciation of swap contracts on the statement of assets and liabilities. Once the interim payments are settled in cash, the net amount is recorded as realized gain/loss on swaps, in addition to realized gain/loss recorded upon termination of swap contracts on the statement of operations. Prior to October 1, 2003, these interim payments were reflected within interest income/expense in the statement of operations. Fluctuations in the value of swap contracts are recorded as a component of net change in unrealized appreciation/depreciation of investments.
3. Option Transactions
For hedging and investment purposes, the Portfolio may purchase and write (sell) put and call options on U.S. and foreign government securities and foreign currencies that are traded on U.S. and foreign securities exchanges and over-the-counter markets.
The risk associated with purchasing an option is that the Portfolio pays a premium whether or not the option is exercised. Additionally, the Portfolio bears the risk of loss of the premium and change in market value should the counterparty not perform under the contract. Put and call options purchased are accounted for in the same manner as portfolio securities. The cost of securities acquired through the exercise of call options is increased by premiums paid. The proceeds from securities sold through the exercise of put options are decreased by the premiums paid.
When the Portfolio writes an option, the premium received by the Portfolio is recorded as a liability and is subsequently adjusted to the current market value of the option written. Premiums received from written options which expire unexercised are recorded by the Portfolio on the expiration date as realized gains
| 24 | • ALLIANCEBERNSTEIN BOND FUND U.S. GOVERNMENT PORTFOLIO |
Notes to Financial Statements
from options written. The difference between the premium received and the amount paid on effecting a closing purchase transaction, including brokerage commissions, is also treated as a realized gain, or if the premium received is less than the amount paid for the closing purchase transaction, as a realized loss. If a call option is exercised, the premium received is added to the proceeds from the sale of the underlying security or currency in determining whether the Portfolio has realized a gain or loss. If a put option is exercised, the premium received reduces the cost basis of the security or currency purchased by the Portfolio. In writing an option, the Portfolio bears the market risk of an unfavorable change in the price of the security or currency underlying the written option. Exercise of an option written by the Portfolio could result in the Portfolio selling or buying a security or currency at a price different from the current market value. For the year ended September 30, 2007, the Portfolio had no transactions in written options.
4. Reverse Repurchase Agreements
Under a reverse repurchase agreement, the Portfolio sells securities and agrees to repurchase them at a mutually agreed upon date and price. At the time the Portfolio enters into a reverse repurchase agreement, it will establish a segregated account with the custodian containing liquid assets having a value at least equal to the repurchase price.
For the year ended September 30, 2007, the average amount of reverse repurchase agreements outstanding was $8,805,775 and the daily weighted average annualized interest rate was 5.14%. There were no reverse repurchase agreements outstanding at September 30, 2007.
5. Dollar Rolls
The Portfolio may enter into dollar rolls. Dollar rolls involve sales by the Portfolio of securities for delivery in the current month and the Portfolio’s simultaneously contracting to repurchase substantially similar (same type and coupon) securities on a specified future date. During the roll period, the Portfolio forgoes principal and interest paid on the securities. The Portfolio is compensated by the difference between the current sales price and the lower forward price for the future purchase (often referred to as the “drop”) as well as by the interest earned on the cash proceeds of the initial sale. Dollar rolls involve the risk that the market value of the securities the Portfolio is obligated to repurchase under the agreement may decline below the repurchase price. Dollar rolls are speculative techniques and may be considered to be borrowings by the Portfolio. For the year ended September 30, 2007, the Portfolio earned drop income of $126,838 which is included in interest income in the accompanying statement of operations.
NOTE E
Securities Lending
The Portfolio has entered into a securities lending agreement with AG Edwards & Sons, Inc. (the “Lending Agent”). Under the terms of the
| ALLIANCEBERNSTEIN BOND FUND U.S. GOVERNMENT PORTFOLIO • | 25 |
Notes to Financial Statements
agreement, the Lending Agent, on behalf of the Portfolio, administers the lending of portfolio securities to certain broker-dealers. In return, the Portfolio receives fee income from the lending transactions or it retains a portion of interest on the investment of any cash received as collateral. The Portfolio also continues to receive dividends or interest on the securities loaned. Under the terms of the securities lending agreement, security voting rights pass to the borrower, although the Fund can at will terminate a loan and regain the right to vote. Unrealized gain or loss on the value of the securities loaned that may occur during the term of the loan will be reflected in the accounts of the Portfolio. All loans are continuously secured by collateral exceeding the value of the securities loaned. All collateral consists of either cash or U.S. government securities. The Lending Agent may invest the cash collateral received in accordance with the investment restrictions of the Portfolio in one or more of the following investments: U.S. government or U.S. government agency obligations, bank obligations, corporate debt obligations, asset-backed securities, investment funds, structured products, repurchase agreements and an eligible money market fund. The Lending Agent will indemnify the Portfolio for any loss resulting from a borrower’s failure to return a loaned security when due. As of September 30, 2007, the Portfolio had loaned securities with a value of $76,325,262 and received cash collateral which was invested in short-term securities valued at $78,327,687 as included in the accompanying portfolio of investments. For the year ended September 30, 2007, the Portfolio earned fee income of $132,436 which is included in interest income in the accompanying statement of operations.
NOTE F
Capital Stock
Each class consists of 3,000,000,000 authorized shares. Transactions in capital shares for each class were as follows:
| Shares | Amount | |||||||||||||||||
| Year Ended September 30, 2007 | Year Ended September 30, 2006 | Year Ended September 30, 2007 | Year Ended September 30, 2006 | |||||||||||||||
| Class A | ||||||||||||||||||
Shares sold | 3,415,741 | 3,048,503 | $ | 23,183,887 | $ | 20,805,776 | ||||||||||||
Shares issued in reinvestment of dividends | 1,792,676 | 2,200,043 | 11,954,861 | 15,016,751 | ||||||||||||||
Shares converted from Class B | 2,677,963 | 1,871,028 | 18,131,945 | 12,764,162 | ||||||||||||||
Shares redeemed | (14,927,770 | ) | (18,093,151 | ) | (101,068,953 | ) | (123,462,197 | ) | ||||||||||
Net decrease | (7,041,390 | ) | (10,973,577 | ) | $ | (47,798,260 | ) | $ | (74,875,508 | ) | ||||||||
| 26 | • ALLIANCEBERNSTEIN BOND FUND U.S. GOVERNMENT PORTFOLIO |
Notes to Financial Statements
| Shares | Amount | |||||||||||||||||
| Year Ended September 30, 2007 | Year Ended September 30, 2006 | Year Ended September 30, 2007 | Year Ended September 30, 2006 | |||||||||||||||
| Class B | ||||||||||||||||||
Shares sold | 647,422 | 691,326 | $ | 4,385,415 | $ | 4,711,220 | ||||||||||||
Shares issued in reinvestment of dividends | 283,394 | 469,777 | 1,892,909 | 3,208,836 | ||||||||||||||
Shares converted to Class A | (2,677,963 | ) | (1,871,255 | ) | (18,131,945 | ) | (12,764,162 | ) | ||||||||||
Shares redeemed | (3,399,968 | ) | (7,205,125 | ) | (23,020,031 | ) | (49,186,249 | ) | ||||||||||
Net decrease | (5,147,115 | ) | (7,915,277 | ) | $ | (34,873,652 | ) | $ | (54,030,355 | ) | ||||||||
| Class C | ||||||||||||||||||
Shares sold | 649,119 | 689,394 | $ | 4,399,605 | $ | 4,716,179 | ||||||||||||
Shares issued in reinvestment of dividends | 249,880 | 265,512 | 1,681,906 | 1,815,660 | ||||||||||||||
Shares redeemed | (2,045,797 | ) | (3,254,684 | ) | (13,864,338 | ) | (22,265,463 | ) | ||||||||||
Net decrease | (1,146,798 | ) | (2,299,778 | ) | $ | (7,782,827 | ) | $ | (15,733,624 | ) | ||||||||
| Advisor Class | ||||||||||||||||||
Shares sold | 165,144 | 501,706 | $ | 1,118,315 | $ | 3,469,562 | ||||||||||||
Shares issued in reinvestment of dividends | 35,560 | 44,186 | 240,935 | 302,189 | ||||||||||||||
Shares redeemed | (778,474 | ) | (633,069 | ) | (5,275,060 | ) | (4,330,825 | ) | ||||||||||
Net decrease | (577,770 | ) | (87,177 | ) | $ | (3,915,810 | ) | $ | (559,074 | ) | ||||||||
| Class R | ||||||||||||||||||
Shares sold | 10,679 | 2,333 | $ | 72,245 | $ | 15,834 | ||||||||||||
Shares issued in reinvestment of dividends | 308 | 124 | 2,087 | 840 | ||||||||||||||
Shares redeemed | (10,076 | ) | (833 | ) | (67,847 | ) | (5,668 | ) | ||||||||||
Net increase | 911 | 1,624 | $ | 6,485 | $ | 11,006 | ||||||||||||
| Class K | ||||||||||||||||||
Shares sold | 46,934 | 0 | $ | 312,503 | $ | 0 | ||||||||||||
Shares issued in reinvestment of dividends | 376 | 0 | 2,530 | 3 | ||||||||||||||
Shares redeemed | (24 | ) | 0 | (159 | ) | 0 | ||||||||||||
Net increase | 47,286 | 0 | $ | 314,874 | $ | 3 | ||||||||||||
| Class I | ||||||||||||||||||
Shares sold | 0 | 0 | $ | 0 | $ | 0 | ||||||||||||
Shares issued in reinvestment of dividends | 0 | 0 | 0 | 0 | ||||||||||||||
Shares redeemed | 0 | 0 | 0 | 0 | ||||||||||||||
Net increase | 0 | 0 | $ | 0 | $ | 0 | ||||||||||||
| ALLIANCEBERNSTEIN BOND FUND U.S. GOVERNMENT PORTFOLIO • | 27 |
Notes to Financial Statements
During the period, the Portfolio received $2,755 related to a third-party’s settlement of regulatory proceedings involving allegations of improper trading. This amount is presented in the Portfolio’s statement of changes in net assets. Neither the Portfolio nor its affiliates were involved in the proceedings or the calculation of the payment.
NOTE G
Risks Involved in Investing in the Portfolio
Interest Rate Risk and Credit Risk — Interest rate risk is the risk that changes in interest rates will affect the value of the Portfolio’s investments in fixed-income debt securities such as bonds or notes. Increases in interest rates may cause the value of the Portfolio’s investments to decline. Credit risk is the risk that the issuer or guarantor of a debt security, or the counterparty to a derivative contract, will be unable or unwilling to make timely principal and/or interest payments, or to otherwise honor its obligations. The degree of risk for a particular security may be reflected in its credit risk rating. Credit risk is greater for medium quality and lower-rated securities. Lower-rated debt securities and similar unrated securities (commonly known as “junk bonds”) have speculative elements or are predominantly speculative risks.
Indemnification Risk — In the ordinary course of business, the Portfolio enters into contracts that contain a variety of indemnifications. The Portfolio’s maximum exposure under these arrangements is unknown. However, the Portfolio has not had prior claims or losses pursuant to these indemnification provisions and expects the risk of loss thereunder to be remote.
NOTE H
Joint Credit Facility
A number of open-end mutual funds managed by the Adviser, including the Portfolio, participate in a $250 million revolving credit facility (the “Facility”) intended to provide short-term financing if necessary, subject to certain restrictions in connection with abnormal redemption activity. Commitment fees related to the Facility are paid by the participating funds and are included in miscellaneous expenses in the statement of operations. The Portfolio did not utilize the Facility during the year ended September 30, 2007.
NOTE I
Distributions to Shareholders
The tax character of distributions paid during the fiscal years ended September 30, 2007 and September 30, 2006 were as follows:
| 2007 | 2006 | |||||
Distributions paid from: | ||||||
Ordinary income | $ | 24,135,225 | $ | 29,896,917 | ||
Long-term capital gain | –0– | –0– | ||||
Total taxable distributions | $ | 24,135,225 | $ | 29,896,917 | ||
Total distributions paid | $ | 24,135,225 | $ | 29,896,917 | ||
| 28 | • ALLIANCEBERNSTEIN BOND FUND U.S. GOVERNMENT PORTFOLIO |
Notes to Financial Statements
As of September 30, 2007, the components of accumulated earnings/(deficit) on a tax basis were as follows:
Undistributed ordinary income | $ | 1,318,409 | ||
Accumulated capital and other losses | (99,597,655 | )(a) | ||
Unrealized appreciation/(depreciation) | 1,426,906 | (b) | ||
Total accumulated earnings/(deficit) | $ | (96,852,340 | )(c) | |
(a) | On September 30, 2007, the Portfolio had a net capital loss carryforward for federal income tax purposes of $86,498,631, of which $6,470,420 expires in the year 2008, $23,497,731 expires in the year 2011, $27,734,923 expires in the year 2013, 11,528,490 expires in the year 2014, and $17,267,067 expires in the year 2015. To the extent future capital gains are offset by capital loss carryforwards, such gains will not be distributed. During the fiscal year ended September 30, 2007, $48,732,137 of capital loss carryforward expired. Net capital losses incurred after October 31, and within the taxable year are deemed to arise on the first business day of the Portfolio’s next taxable year. For the fiscal year ended September 30, 2007, the Portfolio deferred to October 1, 2007 post-October capital losses of $12,566,762. For the year ended September 30, 2007, the Portfolio deferred losses on straddles of $532,262. |
(b) | The differences between book-basis and tax-basis unrealized appreciation/(depreciation) are attributable primarily to the tax deferral of losses on wash sales, the difference between book and tax amortization methods for premium and the realization for tax purposes of unrealized gains/(losses) on certain derivative instruments. |
(c) | The difference between book-basis and tax-basis components of accumulated earnings/(deficit) is attributable to dividends payable. |
During the current fiscal year, permanent differences primarily due to the tax treatment on bond premium, reclassification of paydown gains/losses and the expiration of capital loss carryforward resulted in a net decrease in distributions in excess of net investment income, a net decrease in accumulated net realized loss on investment transactions and a net decrease in additional paid-in capital. This reclassification had no effect on net assets.
NOTE J
Legal Proceedings
On October 2, 2003, a purported class action complaint entitled Hindo, et al. v. AllianceBernstein Growth & Income Fund, et al. (“Hindo Complaint”) was filed against the Adviser, Alliance Capital Management Holding L.P. (“Alliance Holding”), Alliance Capital Management Corporation, AXA Financial, Inc., the AllianceBernstein Funds, certain officers of the Adviser (“AllianceBernstein defendants”), and certain other unaffiliated defendants, as well as unnamed Doe defendants. The Hindo Complaint was filed in the United States District Court for the Southern District of New York by alleged shareholders of two of the AllianceBernstein Funds. The Hindo Complaint alleges that certain of the AllianceBernstein defendants failed to disclose that they improperly allowed certain hedge funds and other unidentified parties to engage in “late trading” and “market timing” of AllianceBernstein Fund securities, violating Sections 11 and 15 of the Securities Act, Sections 10(b) and 20(a) of the Exchange Act and
| ALLIANCEBERNSTEIN BOND FUND U.S. GOVERNMENT PORTFOLIO • | 29 |
Notes to Financial Statements
Sections 206 and 215 of the Advisers Act. Plaintiffs seek an unspecified amount of compensatory damages and rescission of their contracts with the Adviser, including recovery of all fees paid to the Adviser pursuant to such contracts.
Following October 2, 2003, 43 additional lawsuits making factual allegations generally similar to those in the Hindo Complaint were filed in various federal and state courts against the Adviser and certain other defendants. All state court actions against the Adviser either were voluntarily dismissed or removed to federal court. On February 20, 2004, the Judicial Panel on Multidistrict Litigation transferred all federal actions to the United States District Court for the District of Maryland (the “Mutual Fund MDL”). On September 29, 2004, plaintiffs filed consolidated amended complaints with respect to four claim types: mutual fund shareholder claims; mutual fund derivative claims; derivative claims brought on behalf of Alliance Holding; and claims brought under ERISA by participants in the Profit Sharing Plan for Employees of the Adviser. All four complaints include substantially identical factual allegations, which appear to be based in large part on the Order of the SEC dated December 18, 2003 as amended and restated January 14, 2004 (“SEC Order) and the New York State Attorney General Assurance of Discontinuance dated September 1, 2004 (“NYAG Order”).
On April 21, 2006, the Adviser and attorneys for the plaintiffs in the mutual fund shareholder claims, mutual fund derivative claims, and ERISA claims entered into a confidential memorandum of understanding (“MOU”) containing their agreement to settle these claims. The agreement will be documented by a stipulation of settlement and will be submitted for court approval at a later date. The settlement amount ($30 million) which the Adviser previously accrued and disclosed, has been disbursed. The derivative claims brought on behalf of Alliance Holding, in which plaintiffs seek an unspecified amount of damages, remain pending.
It is possible that these matters and/or other developments resulting from these matters could result in increased redemptions of the AllianceBernstein Mutual Funds’ shares or other adverse consequences to the AllianceBernstein Mutual Funds. This may require the AllianceBernstein Mutual Funds to sell investments held by those funds to provide for sufficient liquidity and could also have an adverse effect on the investment performance of the AllianceBernstein Mutual Funds. However, the Adviser believes that these matters are not likely to have a material adverse effect on its ability to perform advisory services relating to the AllianceBernstein Mutual Funds.
NOTE K
Recent Accounting Pronouncements
On July 13, 2006, the Financial Accounting Standards Board (“FASB”) released FASB Interpretation No. 48 “Accounting for Uncertainty in Income Taxes”
| 30 | • ALLIANCEBERNSTEIN BOND FUND U.S. GOVERNMENT PORTFOLIO |
Notes to Financial Statements
(“FIN 48”). FIN 48 provides guidance for how uncertain tax positions should be recognized, measured, presented and disclosed in the financial statements. FIN 48 requires the evaluation of tax positions taken or expected to be taken in the course of preparing a fund’s tax returns to determine whether the tax positions are “more-likely-than-not” of being sustained by the applicable tax authority. Tax positions not deemed to meet the more-likely-than-not threshold would be recorded in the current period. Adoption of FIN 48 is required for fiscal years beginning after December 15, 2006 and is to be applied to all open tax years as of the effective date. On December 22, 2006, the Securities and Exchange Commission notified the industry that the implementation of FIN 48 by registered investment companies could be delayed until the last business day of the first required financial statement reporting period for fiscal years beginning after December 15, 2006. At this time, management is evaluating the implications of FIN 48 and its impact on the financial statements has not yet been determined.
On September 20, 2006, the FASB released Statement of Financial Accounting Standards No. 157 “Fair Value Measurements” (“FAS 157”). FAS 157 establishes an authoritative definition of fair value, sets out a framework for measuring fair value, and requires additional disclosures about fair-value measurements. The application of FAS 157 is required for fiscal years beginning after November 15, 2007 and interim periods within those fiscal years. At this time, management is evaluating the implications of FAS 157 and its impact on the financial statements has not yet been determined.
NOTE L
Subsequent Event
On November 5, 2007, the Intermediate Bond Portfolio of the Fund acquired all of the assets and assumed all of the liabilities of the Portfolio in a tax free event, pursuant to an Agreement and Plan of Acquisistion and Liquidation approved by the Board of Directors of the Fund at the Regular Meetings of the Board of Directors of the Fund held on August 2, 2007. As a result of the acquisition, stockholders of the Portfolio received shares of Intermediate Bond Portfolio equivalent to the aggregate net asset value of the shares they held in the Portfolio.
| ALLIANCEBERNSTEIN BOND FUND U.S. GOVERNMENT PORTFOLIO • | 31 |
Notes to Financial Statements
FINANCIAL HIGHLIGHTS
Selected Data For A Share Of Capital Stock Outstanding Throughout Each Period
| Class A | ||||||||||||||||||
| Year Ended September 30, | July 1, 2003 to September 30, 2003(a) | Year June 30, | ||||||||||||||||
| 2007 | 2006 | 2005 | 2004 | |||||||||||||||
Net asset value, beginning of period | $ 6.84 | $ 6.98 | $ 7.11 | $ 7.27 | $ 7.49 | $ 7.21 | ||||||||||||
Income From Investment Operations | ||||||||||||||||||
Net investment income(b) | .27 | .30 | .28 | .30 | (c) | .06 | .27 | |||||||||||
Net realized and unrealized gain (loss) on investment transactions | (.05 | ) | (.13 | ) | (.12 | ) | (.13 | ) | (.20 | ) | .35 | |||||||
Net increase (decrease) in net asset value from operations | .22 | .17 | .16 | .17 | (.14 | ) | .62 | |||||||||||
| Less: Dividends | ||||||||||||||||||
Dividends from net | (.30 | ) | (.31 | ) | (.29 | ) | (.33 | ) | (.08 | ) | (.34 | ) | ||||||
Net asset value, end of period | $ 6.76 | $ 6.84 | $ 6.98 | $ 7.11 | $ 7.27 | $ 7.49 | ||||||||||||
| Total Return | ||||||||||||||||||
Total investment return based on net asset value(d) | 3.37 | % | 2.60 | % | 2.31 | % | 2.49 | % | (1.80 | )% | 8.82 | % | ||||||
| Ratios/Supplemental Data | ||||||||||||||||||
Net assets, end of period (000’s omitted) | $404,144 | $457,168 | $543,547 | $626,183 | $811,376 | $889,115 | ||||||||||||
Ratio to average net assets of: | ||||||||||||||||||
Expenses, net of waivers/reimbursements | 1.12 | %(e)(f) | 1.04 | %(f) | 1.30 | % | 1.34 | % | 1.18 | %(g) | 1.10 | % | ||||||
Expenses, before waivers/reimbursements | 1.12 | %(e)(f) | 1.04 | %(f) | 1.30 | % | 1.39 | % | 1.18 | %(g) | 1.10 | % | ||||||
Expenses, before waivers/reimbursements, excluding interest expense | 1.04 | %(e)(f) | 1.00 | %(f) | 1.06 | % | 1.10 | % | 1.11 | %(g) | 1.09 | % | ||||||
Net investment income | 3.95 | %(f) | 4.33 | %(f) | 3.90 | % | 4.23 | %(c) | 3.43 | %(g) | 3.64 | % | ||||||
Portfolio turnover rate | 206 | % | 159 | % | 166 | % | 150 | % | 241 | % | 976 | % | ||||||
See footnote summary on page 38.
| 32 | • ALLIANCEBERNSTEIN BOND FUND U.S. GOVERNMENT PORTFOLIO |
Financial Highlights
Selected Data For A Share Of Capital Stock Outstanding Throughout Each Period
| Class B | |||||||||||||||||||
| Year Ended September 30, | July 1, 2003 to September 30, 2003(a) | Year Ended June 30, 2003 | |||||||||||||||||
| 2007 | 2006 | 2005 | 2004 | ||||||||||||||||
Net asset value, beginning of period | $ 6.84 | $ 6.98 | $ 7.11 | $ 7.27 | $ 7.49 | $ 7.21 | |||||||||||||
Income From Investment Operations | |||||||||||||||||||
Net investment income(b) | .22 | .24 | .23 | .25 | (c) | .05 | .22 | ||||||||||||
Net realized and unrealized gain (loss) on investment transactions | (.05 | ) | (.12 | ) | (.12 | ) | (.13 | ) | (.20 | ) | .35 | ||||||||
Net increase (decrease) in net asset value from operations | .17 | .12 | .11 | .12 | (.15 | ) | .57 | ||||||||||||
| Less: Dividends | |||||||||||||||||||
Dividends from net | (.25 | ) | (.26 | ) | (.24 | ) | (.28 | ) | (.07 | ) | (.29 | ) | |||||||
Net asset value, end of period | $ 6.76 | $ 6.84 | $ 6.98 | $ 7.11 | $ 7.27 | $ 7.49 | |||||||||||||
| Total Return | |||||||||||||||||||
Total investment return based on net asset value(d) | 2.60 | % | 1.86 | % | 1.57 | % | 1.74 | % | (1.98 | )% | 8.07 | % | |||||||
| Ratios/Supplemental Data | |||||||||||||||||||
Net assets, end of period (000’s omitted) | $46,084 | $81,834 | $138,856 | $229,823 | $399,040 | $495,606 | |||||||||||||
Ratio to average net assets of: | |||||||||||||||||||
Expenses, net of waivers/reimbursements | 1.88 | %(e)(f) | 1.79 | %(f) | 2.02 | % | 2.07 | % | 1.90 | %(g) | 1.82 | % | |||||||
Expenses, before waivers/reimbursements | 1.88 | %(e)(f) | 1.79 | %(f) | 2.02 | % | 2.13 | % | 1.90 | %(g) | 1.82 | % | |||||||
Expenses, before waivers/reimbursements, excluding interest expense | 1.79 | %(e)(f) | 1.75 | %(f) | 1.78 | % | 1.83 | % | 1.83 | %(g) | 1.81 | % | |||||||
Net investment income | 3.27 | %(f) | 3.59 | %(f) | 3.20 | % | 3.55 | %(c) | 2.75 | %(g) | 2.95 | % | |||||||
Portfolio turnover rate | 206 | % | 159 | % | 166 | % | 150 | % | 241 | % | 976 | % | |||||||
See footnote summary on page 38.
| ALLIANCEBERNSTEIN BOND FUND U.S. GOVERNMENT PORTFOLIO • | 33 |
Financial Highlights
Selected Data For A Share Of Capital Stock Outstanding Throughout Each Period
| Class C | ||||||||||||||||||
| Year Ended September 30, | July 1, 30, 2003(a) | Year 2003 | ||||||||||||||||
| 2007 | 2006 | 2005 | 2004 | |||||||||||||||
Net asset value, beginning of period | $ 6.85 | $ 6.99 | $ 7.12 | $ 7.28 | $ 7.50 | $ 7.22 | ||||||||||||
Income From Investment Operations | ||||||||||||||||||
Net investment income(b) | .22 | .25 | .23 | .25 | (c) | .05 | .22 | |||||||||||
Net realized and unrealized gain (loss) on investment transactions | (.04 | ) | (.12 | ) | (.12 | ) | (.13 | ) | (.20 | ) | .35 | |||||||
Net increase (decrease) in net asset value from operations | .18 | .13 | .11 | .12 | (.15 | ) | .57 | |||||||||||
| Less: Dividends | ||||||||||||||||||
Dividends from net | (.26 | ) | (.27 | ) | (.24 | ) | (.28 | ) | (.07 | ) | (.29 | ) | ||||||
Net asset value, end of period | $ 6.77 | $ 6.85 | $ 6.99 | $ 7.12 | $ 7.28 | $ 7.50 | ||||||||||||
| Total Return | ||||||||||||||||||
Total investment return based on net asset value(d) | 2.62 | % | 1.87 | % | 1.58 | % | 1.73 | % | (1.98 | )% | 8.06 | % | ||||||
| Ratios/Supplemental Data | ||||||||||||||||||
Net assets, end of period (000’s omitted) | $58,242 | $66,796 | $84,303 | $107,003 | $167,359 | $204,006 | ||||||||||||
Ratio to average net assets of: | ||||||||||||||||||
Expenses, net of waivers/reimbursements | 1.85 | %(e)(f) | 1.76 | %(f) | 2.02 | % | 2.06 | % | 1.89 | %(g) | 1.81 | % | ||||||
Expenses, before waivers/reimbursements | 1.85 | %(e)(f) | 1.76 | %(f) | 2.02 | % | 2.11 | % | 1.89 | %(g) | 1.81 | % | ||||||
Expenses, before waivers/reimbursements, excluding interest expense | 1.76 | %(e)(f) | 1.72 | %(f) | 1.77 | % | 1.82 | % | 1.83 | %(g) | 1.80 | % | ||||||
Net investment income | 3.22 | %(f) | 3.60 | %(f) | 3.19 | % | 3.56 | %(c) | 2.76 | %(g) | 2.96 | % | ||||||
Portfolio turnover rate | 206 | % | 159 | % | 166 | % | 150 | % | 241 | % | 976 | % | ||||||
See footnote summary on page 38.
| 34 | • ALLIANCEBERNSTEIN BOND FUND U.S. GOVERNMENT PORTFOLIO |
Financial Highlights
Selected Data For A Share Of Capital Stock Outstanding Throughout Each Period
| Advisor Class | ||||||||||||||||||
| Year Ended September 30, | July 1, 2003 to September 30, 2003(a) | Year Ended June 30, 2003 | ||||||||||||||||
| 2007 | 2006 | 2005 | 2004 | |||||||||||||||
Net asset value, beginning of period | $ 6.85 | $ 7.00 | $ 7.12 | $ 7.28 | $ 7.50 | $ 7.21 | ||||||||||||
Income From Investment Operations | ||||||||||||||||||
Net investment income(b) | .32 | .31 | .30 | .32 | (c) | .07 | .29 | |||||||||||
Net realized and unrealized | (.09 | ) | (.12 | ) | (.11 | ) | (.12 | ) | (.20 | ) | .37 | |||||||
Net increase (decrease) in net asset value from | .23 | .19 | .19 | .20 | (.13 | ) | .66 | |||||||||||
| Less: Dividends | ||||||||||||||||||
Dividends from net investment income | (.32 | ) | (.34 | ) | (.31 | ) | (.36 | ) | (.09 | ) | (.37 | ) | ||||||
Net asset value, end of | $ 6.76 | $ 6.85 | $ 7.00 | $ 7.12 | $ 7.28 | $ 7.50 | ||||||||||||
| Total Return | ||||||||||||||||||
Total investment return based on net asset value(d) | 3.52 | % | 2.75 | % | 2.76 | % | 2.82 | % | (1.72 | )% | 9.29 | % | ||||||
| Ratios/Supplemental Data | �� | |||||||||||||||||
Net assets, end of period | $1,286 | $5,259 | $5,981 | $247,020 | $204,108 | $197,649 | ||||||||||||
Ratio to average net assets of: | ||||||||||||||||||
Expenses, net of waivers/reimbursements | .83 | %(e)(f) | .74 | %(f) | .94 | % | 1.02 | % | .89 | %(g) | .81 | % | ||||||
Expenses, before waivers/reimbursements | .83 | %(e)(f) | .74 | %(f) | .94 | % | 1.08 | % | .89 | %(g) | .81 | % | ||||||
Expenses, before waivers/reimbursements, excluding interest expense | .75 | %(e)(f) | .70 | %(f) | .72 | % | .79 | % | .81 | %(g) | .80 | % | ||||||
Net investment income | 4.49 | %(f) | 4.61 | %(f) | 4.11 | % | 4.52 | %(c) | 3.72 | %(g) | 3.96 | % | ||||||
Portfolio turnover rate | 206 | % | 159 | % | 166 | % | 150 | % | 241 | % | 976 | % | ||||||
See footnote summary on page 38.
| ALLIANCEBERNSTEIN BOND FUND U.S. GOVERNMENT PORTFOLIO • | 35 |
Financial Highlights
Selected Data For A Share Of Capital Stock Outstanding Throughout Each Period
| Class R | ||||||||||||
| Year Ended September 30, | November 3, 2004 | |||||||||||
| 2007 | 2006 | 2005 | ||||||||||
Net asset value, beginning of period | $ 6.84 | $ 6.98 | $ 7.11 | $ 7.14 | ||||||||
Income From Investment Operations | ||||||||||||
Net investment income(b) | .29 | .27 | .26 | .26 | (c) | |||||||
Net realized and unrealized gain (loss) on investment transactions | (.08 | ) | (.12 | ) | (.11 | ) | 0 | |||||
Net increase in net asset value from operations | .21 | .15 | .15 | .26 | ||||||||
Less: Dividends | ||||||||||||
Dividends from net investment income | (.29 | ) | (.29 | ) | (.28 | ) | (.29 | ) | ||||
Net asset value, end of period | $ 6.76 | $ 6.84 | $ 6.98 | $ 7.11 | ||||||||
Total Return | ||||||||||||
Total investment return based on net asset value(d) | 3.08 | % | 2.26 | % | 2.14 | % | 3.72 | % | ||||
Ratios/Supplemental Data | ||||||||||||
Net assets, end of period (000’s omitted) | $41 | $35 | $25 | $16 | ||||||||
Ratio to average net assets of: | ||||||||||||
Expenses, net of waivers/reimbursements | 1.37 | %(e)(f) | 1.34 | %(f) | 1.49 | % | 1.48 | %(g) | ||||
Expenses, before waivers/reimbursements | 1.37 | %(e)(f) | 1.34 | %(f) | 1.49 | % | 1.54 | %(g) | ||||
Expenses, before waivers/reimbursements, excluding interest expense | 1.31 | %(e)(f) | 1.31 | %(f) | 1.25 | % | 1.27 | %(g) | ||||
Net investment income | 3.81 | %(f) | 4.03 | %(f) | 3.68 | % | 4.08 | %(g)(c) | ||||
Portfolio turnover rate | 206 | % | 159 | % | 166 | % | 150 | % | ||||
See footnote summary on page 38.
| 36 | • ALLIANCEBERNSTEIN BOND FUND U.S. GOVERNMENT PORTFOLIO |
Financial Highlights
Selected Data For A Share Of Capital Stock Outstanding Throughout Each Period
| Class K | |||||||||
| Year Ended September 30, | March 1, 2005 | ||||||||
| 2007 | 2006 | ||||||||
Net asset value, beginning of period | $ 6.84 | $ 6.98 | $ 7.02 | ||||||
Income From Investment Operations | |||||||||
Net investment income(b) | .16 | .30 | .16 | ||||||
Net realized and unrealized gain (loss) on investment transactions | .06 | † | (.13 | ) | (.03 | ) | |||
Net increase in net asset value from operations | .22 | .17 | .13 | ||||||
Less: Dividends | |||||||||
Dividends from net investment income | (.31 | ) | (.31 | ) | (.17 | ) | |||
Net asset value, end of period | $ 6.75 | $ 6.84 | $ 6.98 | ||||||
Total Return | |||||||||
Total investment return based on net asset value(d) | 3.33 | % | 2.57 | % | 1.79 | % | |||
Ratios/Supplemental Data | |||||||||
Net assets, end of period (000’s omitted) | $329 | $10 | $10 | ||||||
Ratio to average net assets of: | |||||||||
Expenses | 1.17 | %(e)(f) | 1.02 | %(f) | 1.17 | %(g) | |||
Expenses, excluding interest expense | 1.16 | %(e)(f) | .98 | %(f) | .95 | %(g) | |||
Net investment income | 2.53 | %(f) | 4.34 | %(f) | 3.79 | %(g) | |||
Portfolio turnover rate | 206 | % | 159 | % | 166 | % | |||
See footnote summary on page 38.
| ALLIANCEBERNSTEIN BOND FUND U.S. GOVERNMENT PORTFOLIO • | 37 |
Financial Highlights
Selected Data For A Share Of Capital Stock Outstanding Throughout Each Period
| Class I | |||||||||
| Year Ended September 30, | March 1, 2005 | ||||||||
| 2007 | 2006 | ||||||||
Net asset value, beginning of period | $ 6.84 | $ 6.98 | $ 7.02 | ||||||
| Income From Investment Operations | |||||||||
Net investment income(b) | .29 | .32 | .17 | ||||||
Net realized and unrealized loss on investment transactions | (.04 | ) | (.13 | ) | (.03 | ) | |||
Net increase in net asset value from operations | .25 | .19 | .14 | ||||||
| Less: Dividends | |||||||||
Dividends from net investment income | (.33 | ) | (.33 | ) | (.18 | ) | |||
Net asset value, end of period | $ 6.76 | $ 6.84 | $ 6.98 | ||||||
| Total Return | |||||||||
Total investment return based on net asset value(d) | 3.80 | % | 2.89 | % | 1.97 | % | |||
| Ratios/Supplemental Data | |||||||||
Net assets, end of period (000’s omitted) | $10 | $10 | $10 | ||||||
Ratio to average net assets of: | |||||||||
Expenses | .73 | %(e)(f) | .75 | %(f) | .89 | %(g) | |||
Expenses, excluding interest expense | .64 | %(e)(f) | .71 | %(f) | .68 | %(g) | |||
Net investment income | 4.33 | %(f) | 4.62 | %(f) | 4.10 | %(g) | |||
Portfolio turnover rate | 206 | % | 159 | % | 166 | % | |||
| (a) | The Portfolio changed its fiscal year end from June 30 to September 30. |
| (b) | Based on average shares outstanding. |
| (c) | Net of fees and expenses waived/reimbursed by the Adviser. |
| (d) | Total investment return is calculated assuming an initial investment made at the net asset value at the beginning of the period, reinvestment of all dividends and distributions at net asset value during the period, and redemption on the last day of the period. Initial sales charges or contingent deferred sales charges are not reflected in the calculation of total investment return. Total return does not reflect the deduction of taxes that a shareholder would pay on fund distributions or the redemption of fund shares. Total investment return calculated for a period of less than one year is not annualized. |
| (e) | Ratios reflect expenses grossed up for expense offset arrangement with the Transfer Agent. For the period shown below, the net expense ratios (including interest expense) were as follows: |
| Year Ended September 30, 2007 | |||
| Class A | 1.11 | % | |
| Class B | 1.87 | % | |
| Class C | 1.83 | % | |
| Advisor Class | .81 | % | |
| Class R | 1.35 | % | |
| Class K | 1.15 | % | |
| Class I | .70 | % |
| (f) | The ratio includes expenses attributable to costs of proxy solicitation. |
| (g) | Annualized. |
| (h) | Commencement of distributions. |
| † | Due to the timing of sales and repurchases of capital shares, the net realized and unrealized gain (loss) per share is not in accord with the portfolio’s change in net realized and unrealized gain (loss) on investment transactions for the period. |
| 38 | • ALLIANCEBERNSTEIN BOND FUND U.S. GOVERNMENT PORTFOLIO |
Financial Highlights
REPORT OF INDEPENDENT REGISTERED
PUBLIC ACCOUNTING FIRM
To the Shareholders and Board of Directors of
AllianceBernstein Bond Fund, Inc.
U.S. Government Portfolio
We have audited the accompanying statement of assets and liabilities, including the portfolio of investments, of the U.S. Government Portfolio (the “Portfolio”), one of the portfolios constituting the AllianceBernstein Bond Fund, Inc., as of September 30, 2007, and the related statement of operations for the year then ended, the statements of changes in net assets for each of the two years in the period then ended, and the financial highlights for each of the periods indicated therein. These financial statements and financial highlights are the responsibility of the Portfolio’s management. Our responsibility is to express an opinion on these financial statements and financial highlights based on our audits.
We conducted our audits in accordance with the standards of the Public Company Accounting Oversight Board (United States). Those standards require that we plan and perform the audit to obtain reasonable assurance about whether the financial statements and financial highlights are free of material misstatement. We were not engaged to perform an audit of the Portfolio’s internal control over financial reporting. Our audits included consideration of internal control over financial reporting as a basis for designing audit procedures that are appropriate in the circumstances, but not for the purpose of expressing an opinion on the effectiveness of the Portfolio’s internal control over financial reporting. Accordingly, we express no such opinion. An audit also includes examining, on a test basis, evidence supporting the amounts and disclosures in the financial statements and financial highlights, assessing the accounting principles used and significant estimates made by management, and evaluating the overall financial statement presentation. Our procedures included confirmation of securities owned as of September 30, 2007 by correspondence with the custodian and others or by other appropriate auditing procedures where replies from others were not received. We believe that our audits provide a reasonable basis for our opinion.
In our opinion, the financial statements and financial highlights referred to above present fairly, in all material respects, the financial position of the U.S. Government Portfolio of the AllianceBernstein Bond Fund, Inc. at September 30, 2007, the results of its operations for the year then ended, the changes in its net assets for each of the two years in the period then ended, and the financial highlights for each of the indicated periods, in conformity with U.S. generally accepted accounting principles.

New York, New York
November 27, 2007
| ALLIANCEBERNSTEIN BOND FUND U.S. GOVERNMENT PORTFOLIO • | 39 |
Report of Independent Registered Public Accounting Firm
TAX INFORMATION (unaudited)
86.2% of the ordinary income dividends paid by the Fund during the fiscal year ended September 30, 2007, qualify as “interest related dividends” for non-U.S. shareholders.
| 40 | • ALLIANCEBERNSTEIN BOND FUND U.S. GOVERNMENT PORTFOLIO |
Tax Information
BOARD OF DIRECTORS
William H. Foulk, Jr.(1), Chairman
Marc O. Mayer, President and Chief Executive Officer
David H. Dievler(1)
John H. Dobkin(1)
Michael J. Downey(1)
D. James Guzy(1)
Nancy P. Jacklin(1)
Marshall C. Turner, Jr.(1)
Earl D. Weiner(1)
OFFICERS
Philip L. Kirstein, Senior Vice President and Independent Compliance Officer
S. Sean Kelleher(2), Vice President
Lipkee Lu(2), Vice President
Jeffrey S. Phlegar, Vice President
Kewjin Yuoh(2), Vice President
Joseph J. Mantineo, Treasurer and Chief Financial Officer
Vincent S. Noto, Controller
Emilie D. Wrapp, Secretary
Custodian State Street Bank and Trust Company
Principal Underwriter AllianceBernstein Investments, Inc.
Transfer Agent AllianceBernstein Investor | Independent Registered Public Accounting Firm Ernst & Young LLP
Legal Counsel Seward & Kissel LLP |
| (1) | Member of the Audit Committee, the Governance and Nominating Committee and the Independent Directors Committee. |
| (2) | The day-to-day management of and investment decisions for the Portfolio are made by the U.S. Investment Grade: Structured Asset Investment Team. Messrs. Yuoh, Kelleher, and Lu are the investment professionals with the most significant responsibility for the day-today management of the Portfolio. |
| ALLIANCEBERNSTEIN BOND FUND U.S. GOVERNMENT PORTFOLIO • | 41 |
Board of Directors
MANAGEMENT OF THE FUND
Board of Directors Information
The business and affairs of the Fund are managed under the direction of the Board of Directors. Certain information concerning the Fund’s Directors is set forth below.
| NAME, ADDRESS*, AGE (FIRST YEAR ELECTED**) | PRINCIPAL OCCUPATION(S) DURING PAST 5 YEARS | PORTFOLIOS IN FUND COMPLEX OVERSEEN BY DIRECTOR | OTHER DIRECTORSHIPS HELD BY DIRECTOR | |||
| DISINTERESTED DIRECTORS | ||||||
Chairman of the Board William H. Foulk, Jr., #,*** | Investment Adviser and an Independent Consultant. He was formerly Senior Manager of Barrett Associates, Inc., a registered investment adviser, with which he had been associated since prior to 2002. He was formerly Deputy Comptroller and Chief Investment Officer of the State of New York and, prior thereto, Chief Investment Officer of the New York Bank for Savings. | 109 | None | |||
David H. Dievler, # | Independent Consultant. Until December 1994, he was Senior Vice President of AllianceBernstein Corporation (“AB Corp.”) (formerly, Alliance Capital Management Corporation) responsible for mutual fund administration. Prior to joining AB Corp. in 1984, he was Chief Financial Officer of Eberstadt Asset Management since 1968. Prior to that, he was Senior Manager at Price Waterhouse & Co. Member of the American Institute of Certified Public Accountants since 1953. | 108 | None | |||
| John H. Dobkin, # 65 (1998) | Consultant. Formerly, President of Save Venice, Inc. (preservation organization) from 2001-2002, Senior Advisor from June 1999 – June 2000 and President of Historic Hudson Valley (historic preservation) from December 1989 – May 1999. Previously, Director of the National Academy of Design and during 1988- 1992, Director and Chairman of the Audit Committee of AB Corp. | 107 | None | |||
| 42 | • ALLIANCEBERNSTEIN BOND FUND U.S. GOVERNMENT PORTFOLIO |
Management of the Fund
| NAME, ADDRESS*, AGE (FIRST YEAR ELECTED**) | PRINCIPAL OCCUPATION(S) DURING PAST 5 YEARS | PORTFOLIOS IN FUND COMPLEX OVERSEEN BY DIRECTOR | OTHER DIRECTORSHIPS HELD BY DIRECTOR | |||
| DISINTERESTED DIRECTORS (continued) | ||||||
| Michael J. Downey, # 63 (2005) | Consultant since January 2004. Formerly, managing partner of Lexington Capital, LLC (investment advisory firm) from December 1997 until December 2003. Prior thereto, Chairman and CEO of Prudential Mutual Fund Management from 1987 to 1993. | 107 | Asia Pacific Fund, Inc. and The Merger Fund | |||
| D. James Guzy, # 71 (2005) | Chairman of the Board of PLX Technology (semi-conductors) and of SRC Computers, Inc. with which he has been associated since prior to 2002. He is also President of the Arbor Company (private family investments). | 107 | Intel Corporation (semi-conductors) and Cirrus Logic Corporation (semi-conductors) | |||
| Nancy P. Jacklin, # 59 (2006) | Formerly, U.S. Executive Director of the International Monetary Fund (December 2002 – May 2006); Partner, Clifford Chance (1992-2002); Sector Counsel, International Banking and Finance, and Associate General Counsel, Citicorp (1985-1992); Assistant General Counsel (International), Federal Reserve Board of Governors (1982-1985); and Attorney Advisor, U.S. Department of the Treasury (1973-1982). Member of the Bar of the District of Columbia and of New York and member of the Council on Foreign Relations. | 107 | None | |||
| Marshall C. Turner, Jr., # 66 (2005) | Consultant. Formerly, President and CEO, Toppan Photomasks, Inc. (semi-conductor manufacturing services), 2005-2006, and Chairman and CEO from 2003 until 2005, when the company was acquired and renamed from Dupont Photomasks, Inc. Principal, Turner Venture Associates (venture capital and consulting) 1993-2003. | 107 | Xilinx, Inc. (semi-conductors) and MEMC Electronic Materials, Inc. (semi-conductor substrates) | |||
| ALLIANCEBERNSTEIN BOND FUND U.S. GOVERNMENT PORTFOLIO • | 43 |
Management of the Fund
| NAME, ADDRESS*, AGE (FIRST YEAR ELECTED**) | PRINCIPAL OCCUPATION(S) DURING PAST 5 YEARS | PORTFOLIOS IN FUND COMPLEX OVERSEEN BY DIRECTOR | OTHER DIRECTORSHIPS HELD BY DIRECTOR | |||
| DISINTERESTED DIRECTORS (continued) | ||||||
| Earl D. Weiner, # 68 2007 | Of Counsel, and Partner from 1976-2006, of the law firm Sullivan & Cromwell LLP, specializing in investment management, corporate, and securities law; member of ABA Federal Regulation of Securities Committee Task Force on Fund Director’s Guidebook. | 107 | None | |||
| INTERESTED DIRECTOR | ||||||
Marc O. Mayer, + New York, NY 10105 50 | Executive Vice President of AllianceBernstein L.P. since 2001, and Executive Managing Director of AllianceBernstein Investments, Inc. (“ABI”) since 2003; prior thereto, he was head of AllianceBernstein Institutional Investments, a unit of AllianceBernstein L.P. from 2001-2003. Prior thereto, Chief Executive Officer of Sanford C. Bernstein & Co., LLC (institutional research and brokerage arm of Bernstein & Co., LLC) (“SCB & Co.”) and its predecessor since prior to 2002. | 107 | SCB Partners Inc. and SCB Inc. | |||
| * | The address for each of the Fund’s disinterested Directors is AllianceBernstein L.P., c/o Philip L. Kirstein, 1345 Avenue of the Americas, New York, NY 10105. |
| ** | There is no stated term of office for the Fund’s Directors. |
| *** | Member of the Fair Value Pricing Committee. |
| # | Member of the Audit Committee, Governance and Nominating Committee and Independent Directors Committee. |
| + | Mr. Mayer is an “interested director”, as defined in the 1940 Act, due to his position as an Executive Vice President of AllianceBernstein L.P. |
| 44 | • ALLIANCEBERNSTEIN BOND FUND U.S. GOVERNMENT PORTFOLIO |
Management of the Fund
Officer Information
Certain information concerning the Fund’s Officers is set forth below.
| NAME, ADDRESS* AND AGE | POSITION(S) HELD WITH FUND | PRINCIPAL OCCUPATION DURING PAST 5 YEARS | ||
| Marc O. Mayer 50 | President and Chief Executive Officer | See biography above. | ||
| Philip L. Kirstein 62 | Senior Vice President and Independent Compliance Officer | Senior Vice President and Independent Compliance Officer of the AllianceBernstein Funds, with which he has been associated since October 2004. Prior thereto, he was Of Counsel to Kirkpatrick & Lockhart, LLP from October 2003 to October 2004, and General Counsel of Merrill Lynch Investment Managers L.P. since prior to 2002 until March 2003. | ||
| S. Sean Kelleher 46 | Vice President | Senior Vice President of AllianceBernstein L.P., with which he has been associated since prior to 2002. | ||
| Lipkee Lu 39 | Vice President | Vice President of AllianceBernstein L.P. since June 2005. Prior thereto, he was a Senior Vice President and Structured Product portfolio manager at Deerfield Capital Management LLC since prior to 2002. | ||
| Jeffrey S. Phlegar 41 | Vice President | Executive Vice President of AllianceBernstein L.P., with which he has been associated since prior to 2002. | ||
| Kewjin Yuoh 36 | Vice President | Vice President of AllianceBernstein L.P. since March 2003. Prior thereto, he was a Vice President of Credit Suisse Asset Management since prior to 2002. | ||
| Emilie D. Wrapp 52 | Secretary | Senior Vice President, Assistant General Counsel and Assistant Secretary of ABI with which she has been associated since prior to 2002. |
| ALLIANCEBERNSTEIN BOND FUND U.S. GOVERNMENT PORTFOLIO • | 45 |
Management of the Fund
| NAME, ADDRESS* AND AGE | POSITION(S) HELD WITH FUND | PRINCIPAL OCCUPATION DURING PAST 5 YEARS | ||
| Joseph J. Mantineo 48 | Treasurer and Chief Financial Officer | Senior Vice President of AllianceBernstein Investments Services Inc. (“ABIS”)**, with which he has been associated since prior to 2002. | ||
| Vincent S. Noto 42 | Controller | Vice President of ABIS**, with which he has been associated since prior to 2002. |
| * | The address for each of the Fund’s Officers is 1345 Avenue of the Americas, New York, NY 10105. |
| ** | AllianceBernstein L.P., ABI, ABIS and SCB & Co. are affiliates of the Fund. |
| The Fund’s Statement of Additional Information (“SAI”) has additional information about the Fund’s Directors and Officers and is available without charge upon request. Contact your financial representative or AllianceBernstein at 1-800-227-4618 for a free prospectus or SAI. |
| 46 | • ALLIANCEBERNSTEIN BOND FUND U.S. GOVERNMENT PORTFOLIO |
Management of the Fund
THE FOLLOWING IS NOT PART OF THE SHAREHOLDER REPORT OR THE FINANCIAL STATEMENTS
SUMMARY OF SENIOR OFFICER’S EVALUATION OF INVESTMENT ADVISORY AGREEMENT1
The following is a summary of the evaluation of the Investment Advisory Agreement between AllianceBernstein L.P. (the “Adviser”) and AllianceBernstein Bond Fund, Inc. (the “Fund”) in respect of AllianceBernstein U.S. Government Portfolio (the “Portfolio”), prepared by Philip L. Kirstein, the Senior Officer of the Fund for the Directors of the Fund, as required by an August 2004 agreement between the Adviser and the New York State Attorney General (the “NYAG”).2 The Senior Officer’s evaluation of the Investment Advisory Agreement is not meant to diminish the responsibility or authority of the Board of Directors of the Fund to perform its duties pursuant to Section 15 of the Investment Company Act of 1940 (the “40 Act”) and applicable state law. The purpose of the summary is to provide shareholders with a synopsis of the independent evaluation of the reasonableness of the advisory fees proposed to be paid by the Portfolio which was provided to the Directors in connection with their review of the proposed approval of the continuance of the Investment Advisory Agreement. The Senior Officer’s evaluation considered the following factors:
| 1. | Advisory fees charged to institutional and other clients of the Adviser for like services; |
| 2. | Advisory fees charged by other mutual fund companies for like services; |
| 3. | Costs to the Adviser and its affiliates of supplying services pursuant to the advisory agreement, excluding any intra-corporate profit; |
| 4. | Profit margins of the Adviser and its affiliates from supplying such services; |
| 5. | Possible economies of scale as the Portfolio grows larger; and |
| 6. | Nature and quality of the Adviser’s services including the performance of the Portfolio. |
| 1 | It should be noted that the information in the fee summary was completed on October 23, 2006 and presented to the Board of Directors on October 31 – November 2, 2006. |
| 2 | Future references to the Portfolio do not include “AllianceBernstein.” References in the fee summary pertaining to performance and expense ratios refer to the Class A shares of the Portfolio. |
| ALLIANCEBERNSTEIN BOND FUND U.S. GOVERNMENT PORTFOLIO • | 47 |
PORTFOLIO ADVISORY FEES, EXPENSE REIMBURSEMENTS & RATIOS
The Adviser proposed that the Portfolio pay the advisory fee set forth in the table below for receiving the services to be provided pursuant to the Investment Advisory Agreement. The fee schedule below, implemented in January 2004 in connection with the Adviser’s settlement with the NYAG in December 2003, is based on a master schedule that contemplates eight categories of funds with almost all funds in each category having the same advisory fee schedule.3
| Category | Net Assets 09/30/06 (million) | Advisory Fee4 | Portfolio | |||
| Low Risk Income | $611.5 | 45 bp on 1st $2.5 billion 40 bp on next $2.5 billion 35 bp on the balance | U.S. Government Portfolio |
The Adviser is reimbursed as specified in the Investment Advisory Agreement for certain clerical, legal, accounting, administrative and other services provided to the Portfolio. During the Portfolio’s most recently completed fiscal year, the Adviser received $91,771 (0.01% of the Portfolio’s average daily net assets) for such services.
Set forth below are the Portfolio’s total expense ratios for the most recent semi-annual period:
| Portfolio | Total Expense Ratio5 | Fiscal Year | ||||
| U.S. Government Portfolio6 | Advisor Class A | 0.84% 1.15% | September 30 | |||
I. ADVISORY FEES CHARGED TO INSTITUTIONAL AND OTHER CLIENTS
The advisory fees charged to investment companies which the Adviser manages and sponsors are normally higher than those charged to similar sized institutional accounts, including pension plans and sub-advised investment companies. The fee differential reflects, among other things, different services provided to such clients, and different liabilities assumed. Services provided by the Adviser to
| 3 | Most of the AllianceBernstein Mutual Funds, which the Adviser manages, were affected by the Adviser’s settlement with the NYAG. |
| 4 | The Portfolio’s advisory fees are based on the Portfolio’s net assets at the end of each quarter and are paid on a quarterly basis. |
| 5 | Annualized. |
| 6 | Includes interest expense of 0.06%, relating to the short-term credit facility used by the Portfolio. |
| 48 | • ALLIANCEBERNSTEIN BOND FUND U.S. GOVERNMENT PORTFOLIO |
the Portfolio that are not provided to non-investment company clients include providing office space and personnel to serve as Fund Officers, who among other responsibilities make the certifications required under the Sarbanes-Oxley Act of 2002, and coordinating with and monitoring the Portfolio’s third party service providers such as Fund counsel, auditors, custodians, transfer agents and pricing services. The accounting, administrative, legal and compliance requirements for the Portfolio are more costly than those for institutional assets due to the greater complexities and time required for investment companies, although as previously noted, a portion of these expenses are reimbursed by the Portfolio to the Adviser. Also, retail mutual funds managed by the Adviser are widely held. Servicing the Portfolio’s investors is more time consuming and labor intensive compared to institutional clients since the Adviser needs to communicate with a more extensive network of financial intermediaries and shareholders. In addition, managing the cash flow of an investment company may be more difficult than that of a stable pool of assets, such as an institutional account with little cash movement in either direction, particularly if the Portfolio is in net redemption and the Adviser is frequently forced to sell securities to raise cash for redemptions. However, managing a fund with positive cash flow may be easier at times than managing a stable pool of assets. Finally, in recent years, investment advisers have been sued by institutional clients and have suffered reputational damage both by the attendant publicity and outcomes other than complete victories. Accordingly, the legal and reputational risks associated with institutional accounts are greater than previously thought, although still not equal to those related to the mutual fund industry.
Notwithstanding the Adviser’s view that managing an investment company is not comparable to managing other institutional accounts because the services provided are different, it is worth considering information regarding the advisory fees charged to institutional accounts with substantially similar investment styles as the Portfolio. However, with respect to the Portfolio, the Adviser represented that there is no institutional product in the Form ADV that has a substantially similar investment style as the Portfolio.
The adviser also manages the AllianceBernstein Variable Products Series Fund, Inc. “AVPS”), which is available through variable annuity and variable life contracts offered by other financial institutions and offers policyholders the option to utilize certain AVPS portfolios as the investment option underlying their
| ALLIANCEBERNSTEIN BOND FUND U.S. GOVERNMENT PORTFOLIO • | 49 |
insurance contracts. Set forth below is the fee schedule of the AVPS portfolio that has a similar investment style as the Portfolio:7
| Portfolio | AVPS Portfolio | Fee Schedule | ||
| U.S. Government Portfolio8 | U.S. Government/ High Grade Securities Portfolio | 0.45% on first $2.5 billion 0.40% on next $2.5 billion 0.35% on the balance |
The Adviser represented that it does not sub-advise any registered investment company that has a similar investment strategy as the Portfolio.
| II. | MANAGEMENT FEES CHARGED BY OTHER MUTUAL FUND COMPANIES FOR LIKE SERVICES. |
Lipper, Inc. (“Lipper”), an analytical service that is not affiliated with the Adviser, compared the fees charged to the Portfolio with fees charged to other investment companies for similar services by other investment advisers. Lipper’s analysis included the Portfolio’s ranking with respect to the proposed advisory fee relative to the median of the Portfolio’s Lipper Expense Group (“EG”)9 at the approximate current asset level of the Portfolio.10
Lipper describes an EG as a representative sample of comparable funds. Lipper’s standard methodology for screening funds to be included in an EG entails the consideration of several fund criteria, including fund type, investment classifica-tion/objective, load type and similar 12b-1/non-12b-1 service fees, asset (size) comparability, and expense components and attributes. An EG will typically consist of seven to twenty funds.
| 7 | It should be noted that AVPS was affected by the settlement between the Adviser and the NYAG. |
| 8 | AVPS U.S. Government/High Grade Securities Portfolio’s management fees are paid on a monthly basis and are based on the portfolio’s average daily net assets, in contrast to the Portfolio, whose fees are paid on a quarterly basis and are based on the Portfolio’s quarter end net assets. |
| 9 | Lipper does not consider average account size when constructing EGs. Funds with relatively small average account sizes tend to have higher transfer agent expense ratio than comparable sized funds that have relatively large average account sizes. |
| 10 | The contractual management fee is calculated by Lipper using the Portfolio’s contractual management fee rate at a hypothetical asset level. The hypothetical asset level is based on the combined net assets of all classes of the Portfolio, rounded up to the next $25 million. Lipper’s total expense ratio information is based on the most recent annual report except as otherwise noted. A ranking of “1” means that the Portfolio has the lowest effective fee rate in the Lipper peer group. |
| 50 | • ALLIANCEBERNSTEIN BOND FUND U.S. GOVERNMENT PORTFOLIO |
| Portfolio | Contractual Management Fee11 | Lipper Expense Group Median | Rank | |||
| U.S. Government Portfolio | 0.450 | 0.509 | 5/12 |
Lipper also analyzed the Portfolio’s most recently completed fiscal year total expense ratio in comparison to the Portfolio’s EG and Lipper Expense Universe (“EU”). The EU12 is a broader group compared to the EG, consisting of all funds that have the same investment classification/objective and load type as the subject Portfolio.
| Portfolio | Expense Ratio (%)13 | Lipper Exp. Group Median (%) | Rank | Lipper Exp Universe Median (%) | Rank | |||||
| U.S. Government Portfolio | 1.066 | 0.982 | 11/12 | 0.990 | 24/32 |
Based on this analysis, the Portfolio has a more favorable ranking on a management fee basis than it does on a total expense ratio basis.
| III. | COSTS TO THE ADVISER AND ITS AFFILIATES OF SUPPLYING SERVICES PURSUANT TO THE ADVISORY FEE ARRANGEMENT, EXCLUDING ANY INTRA-CORPORATE PROFIT. |
A consultant was retained by the Senior Officer to work with the Adviser’s personnel to align the Adviser’s two profitability reporting systems. The alignment, which now has been completed, allows the Adviser’s management and the Directors to receive consistent presentations of the financial results and profitability although the two profitability reporting systems operate independently. See Section IV for additional discussion.
| IV. | PROFIT MARGINS OF THE ADVISER AND ITS AFFILIATES FOR SUPPLYING SUCH SERVICES. |
The profitability information for the Portfolio prepared by the Adviser for the Board of Directors was reviewed by the Senior Officer and the consultant. The Adviser’s profitability from providing investment advisory services to the Portfolio increased during calendar year 2005 relative to 2004.
| 11 | The contractual management fee does not reflect any expense reimbursements made by the Portfolio to the Adviser for certain clerical, legal, accounting, administrative, and other services. |
| 12 | Except for asset (size) comparability, Lipper uses the same criteria for selecting a Lipper Expense Group when selecting a Lipper Expense Universe. Unlike the Lipper Expense Group, the Lipper Expense Universe allows for the same adviser to be represented by more than just one fund. |
| 13 | Most recently completed fiscal year Class A share total expense ratio. |
| ALLIANCEBERNSTEIN BOND FUND U.S. GOVERNMENT PORTFOLIO • | 51 |
In addition to the Adviser’s direct profits from managing the Portfolio, certain of the Adviser’s affiliates have business relationships with the Portfolio and may earn a profit from providing other services to the Portfolio. The courts have referred to this type of business opportunity as “fall-out benefits” to the Adviser and indicated that such benefits should be factored into the evaluation of the total relationship between the Portfolio and the Adviser. Neither case law nor common business practice precludes the Adviser’s affiliates from earning a reasonable profit on this type of relationship provided the affiliates’ charges and services are competitive. These affiliates provide transfer agent and distribution related services to the Portfolio and receive transfer agent fees, Rule 12b-1 payments, front-end sales loads and contingent deferred sales charges (“CDSC”).
AllianceBernstein Investments, Inc. (“ABI”), an affiliate of the Adviser, is the Portfolio’s principal underwriter. ABI and the Adviser have disclosed in the Portfolio’s prospectus that they may make revenue sharing payments from their own resources, in addition to resources derived from sales loads and Rule 12b-1 fees, to firms that sell shares of the Portfolio. In 2005, ABI paid approximately 0.042% of the average monthly assets of the AllianceBernstein Mutual Funds or approximately $18.0 million for distribution services and educational support (revenue sharing payments). For 2006, it is anticipated, ABI will pay approximately 0.04% of the average monthly assets of the AllianceBernstein Mutual Funds or approximately $17.5 million.14 During the Portfolio’s most recently completed fiscal year, ABI received from the Portfolio $9,606, $4,541,671 and $183,553 in front-end sales charges, Rule 12b-1 and CDSC fees, respectively.
Fees and reimbursements for out of pocket expenses charged by AllianceBernstein Investor Services, Inc. (“ABIS”), the affiliated transfer agent for the Portfolio, are charged on a per account basis, based on the level of service provided and the class of share held by the account. ABIS also receives a fee per shareholder sub-account for each account maintained by an intermediary on an omnibus basis. ABIS’ after-tax profitability increased in 2005 in comparison to 2004. During the Portfolio’s most recently completed fiscal year, ABIS received $1,554,400 in fees from the Portfolio.15
| 14 | ABI currently inserts the “Advance” in quarterly account statements and pays the incremental costs associated with the mailing. The incremental cost is less than what an “independent mailing” would cost. |
| 15 | The fees disclosed are net of any expense offsets with ABIS. An expense offset is created by the interest earned on the positive cash balance that occur within the transfer agent account as there is a one day lag with regards to money movement from the shareholder’s account to the transfer agent’s account and then the transfer agent’s account to the Portfolio’s account. During the Portfolio’s most recently completed fiscal year, the fees paid by the Portfolio to ABIS were reduced by $15,301 under the offset agreement between the Portfolio and ABIS. |
| 52 | • ALLIANCEBERNSTEIN BOND FUND U.S. GOVERNMENT PORTFOLIO |
| V. | POSSIBLE ECONOMIES OF SCALE |
The Adviser has indicated that the breakpoints in the fee schedule being proposed reflect a sharing of economies of scale to the extent they exist. Based on some of the professional literature that has considered economies of scale in the mutual fund industry it is thought that to the extent economies of scale exist, they may more often exist across a fund family as opposed to a specific fund. This is because the costs incurred by the Adviser, such as investment research or technology for trading or compliance systems can be spread across a greater asset base as the fund family increases in size. It is also possible that as the level of services required to operate a successful investment company has increased over time, and advisory firms have made such investments in their business to provide improved services, there may be a sharing of economies of scale without a reduction in advisory fees.
An independent consultant, retained by the Senior Officer, made a presentation to the Board of Directors regarding possible economies of scale or scope in the mutual fund industry. Based on the presentation, it was evident that fund management companies benefit from economies of scale. However, due to lack of cost data, researchers had to infer facts about the costs from the behavior of fund expenses; there was a lack of consensus among researchers as to whether economies of scale were being passed on to the shareholders. In the meantime, it is clear that to the extent a fund’s assets were to exceed the initial breakpoint its shareholders benefit from a lower fee rate.
| VI. | NATURE AND QUALITY OF THE ADVISER’S SERVICES INCLUDING THE PERFORMANCE OF THE PORTFOLIO. |
With assets under management of approximately $659 billion as of September 30, 2006, the Adviser has the investment experience to manage and provide non-investment services (described in Section I) to the Portfolio.
| ALLIANCEBERNSTEIN BOND FUND U.S. GOVERNMENT PORTFOLIO • | 53 |
The information below shows the 1, 3, 5 and 10 year performance returns and rankings of the Portfolio16 relative to the Portfolio’s Lipper Performance Group (“PG”) and Lipper Performance Universe (“PU”)17 for the periods ended June 30, 2006.18
| U.S. Government Portfolio | Portfolio Return | PG Median | PU Median | PG Rank | PU Rank | |||||
1 year | -1.98 | -1.44 | -1.39 | 12/12 | 37/42 | |||||
3 year | 0.69 | 1.26 | 1.13 | 11/12 | 33/39 | |||||
5 year | 3.54 | 4.08 | 4.07 | 11/12 | 28/36 | |||||
10 year | 4.94 | 5.37 | 5.32 | 12/12 | 25/30 |
Set forth below are the 1, 3, 5, 10 year and since inception performance returns of the Portfolio (in bold)19 versus its benchmark:20
| Periods Ending June 30, 2006 Annualized Performance | ||||||||||
| Funds | 1 Year | 3 Year | 5 Year | 10 Year | Since Inception | |||||
U.S. Government Portfolio | -1.98 | 0.69 | 3.54 | 4.94 | 6.22 | |||||
Lehman Brothers Government Bond Index | -1.16 | 1.31 | 4.73 | 6.04 | 7.40 | |||||
CONCLUSION:
Based on the factors discussed above the Senior Officer’s conclusion is that the proposed advisory fee for the Portfolio is reasonable and within the range of what would have been negotiated at arms-length in light of all the surrounding circumstances. This conclusion in respect of the Portfolio is based on an evaluation of all of these factors and no single factor was dispositive.
Dated: November 15, 2006
| 54 | • ALLIANCEBERNSTEIN BOND FUND U.S. GOVERNMENT PORTFOLIO |
| 16 | The performance returns and rankings are for the Class A shares of the Portfolio. It should be noted that the performance returns of the Portfolio that is shown was provided by the Adviser. Lipper maintains its own database that includes the Portfolio’s performance returns. However, differences in the distribution price (ex-date versus payable date) and rounding differences may cause the Adviser’s own performance returns of the Portfolio to be one or two basis points different from Lipper. To maintain consistency in this evaluation, the performance returns of the Portfolio, as reported by the Adviser, are provided instead of Lipper. |
| 17 | The Portfolio’s PG is identical to the Portfolio’s EG. The Portfolio’s PU is not identical to the Portfolio’s EU. Funds with negative management fees are normally excluded from EUs, but not necessarily from PUs. |
| 18 | Note that the current Lipper investment classification/objective dictates the PG and PU throughout the life of the Portfolio even if a Portfolio may have had a different investment classification/objective at different points in time. |
| 19 | The performance returns shown are for the Class A shares of the Portfolio. |
| 20 | The Adviser provided Portfolio and benchmark performance return information for periods through June 30, 2006. |
THIS PAGE IS NOT PART OF THE SHAREHOLDER REPORT OR THE FINANCIAL STATEMENTS
ALLIANCEBERNSTEIN FAMILY OF FUNDS
Wealth Strategies Funds
Balanced Wealth Strategy
Wealth Appreciation Strategy
Wealth Preservation Strategy
Tax-Managed Balanced Wealth Strategy
Tax-Managed Wealth Appreciation Strategy
Tax-Managed Wealth Preservation Strategy
Blended Style Funds
U.S. Large Cap Portfolio
International Portfolio
Tax-Managed International Portfolio
Growth Funds
Domestic
Growth Fund
Mid-Cap Growth Fund
Large Cap Growth Fund
Small Cap Growth Portfolio
Global & International
Global Health Care Fund
Global Research Growth Fund
Global Technology Fund
Greater China ‘97 Fund
International Growth Fund
International Research Growth Fund
Value Funds
Domestic
Balanced Shares
Focused Growth & Income Fund
Growth & Income Fund
Small/Mid-Cap Value Fund
Utility Income Fund
Value Fund
Global & International
Global Real Estate Investment Fund*
Global Value Fund
International Value Fund
Taxable Bond Funds
Global Bond Fund*
Corporate Bond Portfolio
Emerging Market Debt Fund
Diversified Yield Fund*
High Yield Fund
Intermediate Bond Portfolio
Short Duration Portfolio
Municipal Bond Funds
National | Michigan |
Intermediate Municipal Bond Funds
Intermediate California
Intermediate Diversified
Intermediate New York
Closed-End Funds
All-Market Advantage Fund
AllianceBernstein Global High Income Fund*
AllianceBernstein Income Fund*
AllianceBernstein National Municipal Income Fund*
ACM Managed Dollar Income Fund
California Municipal Income Fund
New York Municipal Income Fund
The Spain Fund
Retirement Strategies Funds
2000 Retirement Strategy | 2020 Retirement Strategy | 2040 Retirement Strategy | ||
2005 Retirement Strategy | 2025 Retirement Strategy | 2045 Retirement Strategy | ||
2010 Retirement Strategy | 2030 Retirement Strategy | 2050 Retirement Strategy | ||
2015 Retirement Strategy | 2035 Retirement Strategy | 2055 Retirement Strategy |
We also offer Exchange Reserves,** which serves as the money market fund exchange vehicle for the AllianceBernstein mutual funds.
You should consider the investment objectives, risks, charges and expenses of any AllianceBernstein fund/portfolio carefully before investing. For free copies of our prospectuses, which contain this and other information, visit us online at www.alliancebernstein.com or contact your financial advisor. Please read the prospectus carefully before investing.
| * | Prior to January 26, 2007, AllianceBernstein Global High Income Fund was named Alliance World Dollar Government Fund II and AllianceBernstein Income Fund was named ACM Income Fund. Prior to March 1, 2007, Global Real Estate Investment Fund was named Real Estate Investment Fund. Prior to May 18, 2007, AllianceBernstein National Municipal Income Fund was named National Municipal Income Fund. Prior to November 5, 2007, Diversified Yield Fund was named Global Strategic Income Trust and Global Bond Fund was named Global Government Income Trust. |
| ** | An investment in the Fund is not a deposit in a bank and is not insured or guaranteed by the Federal Deposit Insurance Corporation or any other government agency. Although the Fund seeks to preserve the value of your investment at $1.00 per share, it is possible to lose money by investing in the Fund. |
| ALLIANCEBERNSTEIN BOND FUND U.S. GOVERNMENT PORTFOLIO • | 55 |
AllianceBernstein Family of Funds
NOTES
| 56 | • ALLIANCEBERNSTEIN BOND FUND U.S. GOVERNMENT PORTFOLIO |
ALLIANCEBERNSTEIN BOND FUND U.S. GOVERNMENT PORTFOLIO
1345 Avenue of the Americas
New York, NY 10105
800.221.5672
| USG-0151-0907 |  | |
| ITEM 2. | CODE OF ETHICS. |
(a) The registrant has adopted a code of ethics that applies to its principal executive officer, principal financial officer and principal accounting officer. A copy of the registrant’s code of ethics is filed herewith as Exhibit 12(a)(1).
(b) During the period covered by this report, no material amendments were made to the provisions of the code of ethics adopted in 2(a) above.
(c) During the period covered by this report, no implicit or explicit waivers to the provisions of the code of ethics adopted in 2(a) above were granted.
| ITEM 3. | AUDIT COMMITTEE FINANCIAL EXPERT. |
The registrant’s Board of Directors has determined that independent directors David H. Dievler and William H. Foulk, Jr. qualify as audit committee financial experts.
| ITEM 4. | PRINCIPAL ACCOUNTANT FEES AND SERVICES. |
(a) - (c) The following table sets forth the aggregate fees billed by the independent registered public accounting firm Ernst & Young LLP, for the Fund’s last two fiscal years for professional services rendered for: (i) the audit of the Fund’s annual financial statements included in the Fund’s annual report to stockholders; (ii) assurance and related services that are reasonably related to the performance of the audit of the Fund’s financial statements and are not reported under (i), which include advice and education related to accounting and auditing issues and quarterly press release review (for those Funds which issue press releases), and preferred stock maintenance testing (for those Funds that issue preferred stock); and (iii) tax compliance, tax advice and tax return preparation.
| Audit Fees | Audit-Related Fees | Tax Fees | |||||||||||
AllianceBernstein U.S. Government Portfolio | 2006 | $ | 54,500 | $ | 5,566 | $ | 12,781 | ||||||
| 2007 | $ | 57,500 | $ | 5,410 | $ | 12,775 | |||||||
AllianceBernstein Corporate Bond Portfolio | 2006 | $ | 54,500 | $ | 5,566 | $ | 14,675 | ||||||
| 2007 | $ | 58,500 | $ | 5,445 | $ | 15,525 | |||||||
| (d) | Not applicable. |
(e) (1) Beginning with audit and non-audit service contracts entered into on or after May 6, 2003, the Fund’s Audit Committee policies and procedures require the pre-approval of all audit and non-audit services provided to the Fund by the Fund’s independent registered public accounting firm. The Fund’s Audit Committee policies and procedures also require pre-approval of all audit and non-audit services provided to the Adviser and Service Affiliates to the extent that these services are directly related to the operations or financial reporting of the Fund.
(e) (2) All of the amounts for Audit Fees, Audit-Related Fees and Tax Fees in the table under Item 4 (a) – (c) are for services pre-approved by the Fund’s Audit Committee.
(f) Not applicable.
(g) The following table sets forth the aggregate non-audit services provided to the Fund, the Fund’s Adviser and entities that control, are controlled by or under common control with the Adviser that provide ongoing services to the Fund, which include preparing an annual internal control report pursuant to Statement on Auditing Standards No. 70 (“Service Affiliates”):
All Fees for Non-Audit Services Portfolio, the Adviser | Total Amount of Audit Committee (Portion Comprised of Audit Related Fees) (Portion Comprised of Tax Fees) | ||||||||||
AB U.S. Government Portfolio | 2006 | $ | 679,835 | $ | 149,862 | ||||||
| $ | (137,081 | ) | |||||||||
| $ | (12,781 | ) | |||||||||
| 2007 | $ | 1,211,440 | $ | 137,705 | |||||||
| $ | (124,930 | ) | |||||||||
| $ | (12,775 | ) | |||||||||
AB Corporate Bond | 2006 | $ | 681,729 | $ | 169,385 | ||||||
| $ | (154,710 | ) | |||||||||
| $ | (14,675 | ) | |||||||||
| 2007 | $ | 1,214,225 | $ | 140,490 | |||||||
| $ | (124,965 | ) | |||||||||
| $ | (15,525 | ) | |||||||||
(h) The Audit Committee of the Fund has considered whether the provision of any non-audit services not pre-approved by the Audit Committee provided by the Fund’s independent registered public accounting firm to the Adviser and Service Affiliates is compatible with maintaining the auditor’s independence.
| ITEM 5. | AUDIT COMMITTEE OF LISTED REGISTRANTS. |
Not applicable to the registrant.
| ITEM 6. | SCHEDULE OF INVESTMENTS. |
Please see Schedule of Investments contained in the Report to Shareholders included under Item 1 of this Form N-CSR.
| ITEM 7. | DISCLOSURE OF PROXY VOTING POLICIES AND PROCEDURES FOR CLOSED-END MANAGEMENT INVESTMENT COMPANIES. |
Not applicable to the registrant.
| ITEM 8. | PORTFOLIO MANAGERS OF CLOSED-END MANAGEMENT INVESTMENT COMPANIES. |
Not applicable to the registrant.
| ITEM 9. | PURCHASES OF EQUITY SECURITIES BY CLOSED-END MANAGEMENT INVESTMENT COMPANY AND AFFILIATED PURCHASERS. |
Not applicable to the registrant.
| ITEM 10. | SUBMISSION OF MATTERS TO A VOTE OF SECURITY HOLDERS. |
There have been no material changes to the procedures by which shareholders may recommend nominees to the Fund’s Board of Directors since the Fund last provided disclosure in response to this item.
| ITEM 11. | CONTROLS AND PROCEDURES. |
(a) The registrant’s principal executive officer and principal financial officer have concluded that the registrant’s disclosure controls and procedures (as defined in Rule 30a-2(c) under the Investment Company Act of 1940, as amended) are effective at the reasonable assurance level based on their evaluation of these controls and procedures as of a date within 90 days of the filing date of this document.
(b) There were no changes in the registrant’s internal controls over financial reporting that occurred during the second fiscal quarter of the period that has materially affected, or is reasonably likely to materially affect, the registrant’s internal control over financial reporting.
| ITEM 12. | EXHIBITS. |
The following exhibits are attached to this Form N-CSR:
| EXHIBIT NO. | DESCRIPTION OF EXHIBIT | |
| 12 (a) (1) | Code of Ethics that is subject to the disclosure of Item 2 hereof | |
| 12 (b) (1) | Certification of Principal Executive Officer Pursuant to Section 302 of the Sarbanes-Oxley Act of 2002 | |
| 12 (b) (2) | Certification of Principal Financial Officer Pursuant to Section 302 of the Sarbanes-Oxley Act of 2002 | |
| 12 (c) | Certification of Principal Executive Officer and Principal Financial Officer Pursuant to Section 906 of the Sarbanes-Oxley Act of 2002 | |
SIGNATURES
Pursuant to the requirements of the Securities Exchange Act of 1934 and the Investment Company Act of 1940, the registrant has duly caused this report to be signed on its behalf by the undersigned, thereunto duly authorized.
(Registrant): AllianceBernstein Bond Fund, Inc.
| By: | /s/ Marc O. Mayer | |
| Marc O. Mayer | ||
| President | ||
| Date: | November 26, 2007 | |
Pursuant to the requirements of the Securities Exchange Act of 1934 and the Investment Company Act of 1940, this report has been signed below by the following persons on behalf of the registrant and in the capacities and on the dates indicated.
| By: | /s/ Marc O. Mayer | |
| Marc O. Mayer | ||
| President | ||
| Date: | November 26, 2007 | |
| By: | /s/ Joseph J. Mantineo | |
| Joseph J. Mantineo | ||
| Treasurer and Chief Financial Officer | ||
| Date: | November 26, 2007 | |