UNITED STATES
SECURITIES AND EXCHANGE COMMISSION
WASHINGTON, D.C. 20549
FORM N-CSR
CERTIFIED SHAREHOLDER REPORT OF REGISTERED
MANAGEMENT INVESTMENT COMPANIES
Investment Company Act file number: 811-02383
ALLIANCEBERNSTEIN BOND FUND, INC.
(Exact name of registrant as specified in charter)
1345 Avenue of the Americas, New York, New York 10105
(Address of principal executive offices) (Zip code)
Joseph J. Mantineo
AllianceBernstein L.P.
1345 Avenue of the Americas
New York, New York 10105
(Name and address of agent for service)
Registrant’s telephone number, including area code: (800) 221-5672
Date of fiscal year end: October 31, 2011
Date of reporting period: October 31, 2011
| ITEM 1. | REPORTS TO STOCKHOLDERS. |
ANNUAL REPORT
AllianceBernstein Bond Fund
Intermediate Bond Portfolio

October 31, 2011
Annual Report
Investment Products Offered
| • | Are Not FDIC Insured |
| • | May Lose Value |
| • | Are Not Bank Guaranteed |
Investors should consider the investment objectives, risks, charges and expenses of the Fund carefully before investing. For copies of our prospectus or summary prospectus, which contain this and other information, visit us online at www.alliancebernstein.com or contact your AllianceBernstein Investments representative. Please read the prospectus and/or summary prospectus carefully before investing.
This shareholder report must be preceded or accompanied by the Fund’s prospectus for individuals who are not current shareholders of the Fund.
You may obtain a description of the Fund’s proxy voting policies and procedures, and information regarding how the Fund voted proxies relating to portfolio securities during the most recent 12-month period ended June 30, without charge. Simply visit AllianceBernstein’s website at www.alliancebernstein.com, or go to the Securities and Exchange Commission’s (the “Commission”) website at www.sec.gov, or call AllianceBernstein at (800) 227-4618.
The Fund files its complete schedule of portfolio holdings with the Commission for the first and third quarters of each fiscal year on Form N-Q. The Fund’s Forms N-Q are available on the Commission’s website at www.sec.gov. The Fund’s Forms N-Q may also be reviewed and copied at the Commission’s Public Reference Room in Washington, DC; information on the operation of the Public Reference Room may be obtained by calling (800) SEC-0330. AllianceBernstein publishes full portfolio holdings for the Fund monthly at www.alliancebernstein.com.
AllianceBernstein Investments, Inc. (ABI) is the distributor of the AllianceBernstein family of mutual funds. ABI is a member of FINRA and is an affiliate of AllianceBernstein L.P., the manager of the funds.
AllianceBernstein® and the AB Logo are registered trademarks and service marks used by permission of the owner, AllianceBernstein L.P.
December 14, 2011
Annual Report
This report provides management’s discussion of fund performance for AllianceBernstein Intermediate Bond Portfolio (the “Portfolio”) for the annual reporting period ended October 31, 2011.
Investment Objective and Policies
The Portfolio’s investment objective is to generate income and price appreciation without assuming what AllianceBernstein L.P. (the “Adviser”) considers undue risk.
The Portfolio invests, under normal circumstances, at least 80% of its net assets in fixed income securities. The Portfolio expects to invest in readily marketable fixed income securities with a range of maturities from short- to long-term and relatively attractive yields that do not involve undue risk of loss of capital. The Portfolio expects to invest in fixed-income securities with a dollar-weighted average maturity of generally between three to ten years and an average duration of three to six years. The Portfolio may invest up to 25% of its net assets in below investment grade bonds. The Portfolio may use leverage for investment purposes.
The Portfolio may invest without limit in U.S. dollar-denominated foreign fixed income securities and may invest up to 25% of its assets in non-U.S. dollar-denominated foreign fixed income securities. These investments may include, in each case, developed and emerging market debt securities. The Portfolio may invest in mortgage-related and other asset-backed securities,
loan participations, inflation-protected securities, structured securities, variable, floating, and inverse floating rate instruments and preferred stock, and may use other investment techniques. The Portfolio intends, among other things, to enter into transactions such as reverse repurchase agreements and dollar rolls. The Portfolio may invest, without limit, in derivatives, such as options, futures, forwards, or swap agreements.
The Portfolio expects to engage in active and frequent trading of portfolio securities to achieve its principal investment strategies. A higher rate of portfolio turnover increases transaction expenses, which may negatively affect the Portfolio’s performance. High portfolio turnover also may result in the realization of substantial net short-term capital gains, which, when distributed, are taxable to shareholders.
Investment Results
The table on page 5 shows the Portfolio’s performance compared with its benchmark, the Barclays Capital U.S. Aggregate Bond Index for the six- and 12-month periods ended October 31, 2011.
The Portfolio underperformed its benchmark for both the six- and 12-month periods, before sales charges. Within the Portfolio’s sector allocation, an underweight to Treasuries and overweight to investment grade corporates, as well as exposure to high yield corporates and bank loans, detracted for both periods. An overweight to commercial
| ALLIANCEBERNSTEIN BOND FUND INTERMEDIATE BOND PORTFOLIO • | 1 |
mortgage-backed securities (“CMBS”) detracted for the six-month period. Within the Portfolio’s security selection, corporate and CMBS security selection detracted from performance for both periods. Corporate security selection in particular was a primary detractor for the six-month period. Credit default swap positions, held as a hedge against the Portfolio’s cash position, were a slight detractor for both periods.
The Portfolio utilized currency forwards during both periods for both hedging and non-hedging purposes. Overall currency positioning contributed positively for the 12-month period, and was a modest detractor for the six-month period. During both periods, the Portfolio utilized derivative instruments including Treasury futures and interest rate swaps in order to manage duration and yield curve positioning. The Portfolio’s overall yield curve positioning, specifically an overweight to the intermediate part of the yield curve where yields declined most, was a significant positive contributor for both the six- and 12-month periods.
Market Review and Investment Strategy
The global economic recovery that was underway slowed early in the year, resulting from a myriad of global events. Social unrest in North Africa and the Middle East, supply disruptions from the natural disaster in Japan and a spike in commodity prices, particularly oil, all provided headwinds for the global economy early in the year. During the
six-month period ended October 31, 2011, renewed fears of a double-dip recession roiled the global capital markets, driving up risk aversion, sending equities sharply lower and widening credit spreads. Fiscal challenges—ranging from the contentious debate over the U.S. debt ceiling to the ongoing sovereign debt woes of Greece and the peripheral European nations—were at the forefront of investors’ worries. The mounting fear and uncertainty led to a spike in financial market volatility.
Fixed income markets posted solid positive absolute returns for the annual period. The broad investment-grade fixed income market posted positive returns every month with the exception of June, as investors preferred fixed income over equity assets. Non-government sectors generally outperformed in the first six months of the period, with Treasuries rallying toward the end of period as risk aversion set in and investors preferred safety. Although fixed income absolute returns were positive for the period, volatility was elevated and returns swung month to month between risk assets and safer Treasuries dependent on investors’ risk tolerance. Investors’ concerns over the health of the economy and worries emanating from the European sovereign debt crisis led to the exacerbated financial market volatility.
For the annual period, investment grade corporates and high yield corporates led positive returns, followed by agency mortgage-backed securities, CMBS and asset-backed
| 2 | • ALLIANCEBERNSTEIN BOND FUND INTERMEDIATE BOND PORTFOLIO |
securities. Agency mortgage-backed securities were supported by government purchases while CMBS benefited from a stabilization of property fundamentals and investor appetite for yield. Corporate securities were helped by continued strong revenue and earnings growth. U.S. Treasury securities, which were in negative territory early in the period, rallied strongly in response to increased global uncertainties to post 5.27% for the annual period. During the period, government yields declined across the maturity spectrum.
Over the past several months, the U.S. Investment-Grade Core Fixed Income
Team (the “Team”) has reduced risk in the Portfolio, moving closer to the benchmark as global uncertainties have risen. The Portfolio is still holding a modest overweight in CMBS with a modest underweight in corporate bonds, and its corporate positions are well diversified in order to mitigate idiosyncratic risk. The Portfolio’s average duration is modestly lower than the benchmark, and the Team continues to maintain a concentration in intermediate maturity securities, where the steepness in yield curves is most extreme. As risk aversion abates and markets stabilize, the Team will be ready to move quickly to seize potential opportunities.
| ALLIANCEBERNSTEIN BOND FUND INTERMEDIATE BOND PORTFOLIO • | 3 |
HISTORICAL PERFORMANCE
An Important Note About Historical Performance
The investment return and principal value of an investment in the Portfolio will fluctuate, so that shares, when redeemed, may be worth more or less than their original cost. Performance shown on the following pages represents past performance and does not guarantee future results. Current performance may be lower or higher than the performance information shown. You may obtain performance information current to the most recent month-end by visiting www.alliancebernstein.com.
All fees and expenses related to the operation of the Portfolio have been deducted. NAV returns do not reflect sales charges; if sales charges were reflected, the Portfolio’s quoted performance would be lower. SEC returns reflect the applicable sales charges for each share class: a 4.25% maximum front-end sales charge for Class A shares; the applicable contingent deferred sales charge for Class B shares (3% year 1, 2% year 2, 1% year 3); a 1% 1-year contingent deferred sales charge for Class C shares. Returns for the different share classes will vary due to different expenses associated with each class. Performance assumes reinvestment of distributions and does not account for taxes.
Benchmark Disclosure
The unmanaged Barclays Capital U.S. Aggregate Bond Index does not reflect fees and expenses associated with the active management of a mutual fund portfolio. The Barclays Capital U.S. Aggregate Bond Index represents the performance of securities within the U.S. investment grade fixed rate bond market, with index components for government and corporate securities, mortgage pass-through securities, asset-backed securities, and commercial mortgage-backed securities. An investor cannot invest directly in an index, and its results are not indicative of the performance for any specific investment, including the Portfolio.
A Word About Risk
Derivatives Risk: Investing in derivative instruments such as options, futures, forwards or swaps can be riskier than traditional investments, and may be more volatile, especially in a down market.
Credit Risk: A bond’s credit rating reflects the issuer’s ability to make timely payments of interest or principal—the lower the rating, the higher the risk of default. If the issuer’s financial strength deteriorates, the issuer’s rating may be lowered and the bond’s value may decline.
Market Risk: The market values of the portfolio’s holdings rise and fall from day to day, so investments may lose value.
Inflation Risk: Prices for goods and services tend to rise over time, which may erode the purchasing power of investments.
Below Investment Grade Securities Risk: Investments in fixed-income securities with lower ratings (commonly known as “junk bonds”) tend to have a higher probability that an issuer will default or fail to meet its payment obligations.
Foreign (Non-U.S.) Risk: Non-U.S. securities may be more volatile because of political, regulatory, market and economic uncertainties associated with such securities. Fluctuations in currency exchange rates may negatively affect the value of the investment or reduce returns. These risks are magnified in emerging or developing markets.
Interest Rate Risk (with Prepayment Risk): As interest rates rise, bond prices fall and vice versa—long-term securities tend to rise and fall more than short-term securities. The values of mortgage-related and asset-backed securities are particularly sensitive to changes in interest rates due to prepayment risk.
These risks are fully discussed in the Portfolio’s prospectus.
(Historical Performance continued on next page)
| 4 | • ALLIANCEBERNSTEIN BOND FUND INTERMEDIATE BOND PORTFOLIO |
Historical Performance
HISTORICAL PERFORMANCE
(continued from previous page)
THE PORTFOLIO VS. ITS BENCHMARK PERIODS ENDED OCTOBER 31, 2011 | NAV Returns | |||||||||
| 6 Months | 12 Months | |||||||||
AllianceBernstein Bond Fund | ||||||||||
Class A | 3.06% | 4.11% | ||||||||
| ||||||||||
Class B* | 2.80% | 3.50% | ||||||||
| ||||||||||
Class C | 2.71% | 3.40% | ||||||||
| ||||||||||
Advisor Class† | 3.31% | 4.43% | ||||||||
| ||||||||||
Class R† | 2.96% | 3.91% | ||||||||
| ||||||||||
Class K† | 3.09% | 4.17% | ||||||||
| ||||||||||
Class I† | 3.31% | 4.42% | ||||||||
| ||||||||||
Barclays Capital U.S. Aggregate Bond Index | 4.98% | 5.00% | ||||||||
| ||||||||||
* Effective January 31, 2009, Class B shares are no longer available for purchase to new investors. Please see Note A for additional information.
† Please note that these share classes are for investors purchasing shares through accounts established under certain fee-based programs sponsored and maintained by certain broker-dealers and financial intermediaries, institutional pension plans and/or investment advisory clients of, and certain other persons associated with, the Adviser and its affiliates or the Funds.
| ||||||||||
See Historical Performance and Benchmark disclosures on page 4.
(Historical Performance continued on next page)
| ALLIANCEBERNSTEIN BOND FUND INTERMEDIATE BOND PORTFOLIO • | 5 |
Historical Performance
HISTORICAL PERFORMANCE
(continued from previous page)
GROWTH OF A $10,000 INVESTMENT IN THE PORTFOLIO 10/31/01 TO 10/31/11
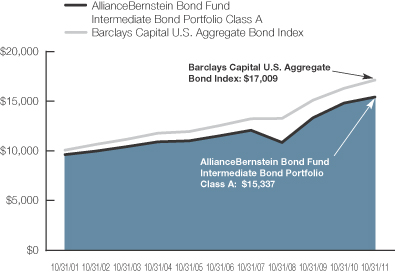
This chart illustrates the total value of an assumed $10,000 investment in AllianceBernstein Bond Fund Intermediate Bond Portfolio Class A shares (from 10/31/01 to 10/31/11) as compared to the performance of its benchmark. The chart reflects the deduction of the maximum 4.25% sales charge from the initial $10,000 investment in the Portfolio and assumes the reinvestment of dividends and capital gains distributions.
See Historical Performance and Benchmark disclosures on page 4.
(Historical Performance continued on next page)
| 6 | • ALLIANCEBERNSTEIN BOND FUND INTERMEDIATE BOND PORTFOLIO |
Historical Performance
HISTORICAL PERFORMANCE
(continued from previous page)
| AVERAGE ANNUAL RETURNS AS OF OCTOBER 31, 2011 | ||||||||||||
| NAV Returns | SEC Returns | SEC Yields* | ||||||||||
| Class A Shares | 1.77 | % | ||||||||||
1 Year | 4.11 | % | -0.33 | % | ||||||||
5 Years | 6.04 | % | 5.12 | % | ||||||||
10 Years | 4.82 | % | 4.37 | % | ||||||||
| Class B Shares(a) | 1.11 | % | ||||||||||
1 Year | 3.50 | % | 0.50 | % | ||||||||
5 Years | 5.32 | % | 5.32 | % | ||||||||
10 Years | 4.42 | % | 4.42 | % | ||||||||
| Class C Shares | 1.15 | % | ||||||||||
1 Year | 3.40 | % | 2.40 | % | ||||||||
5 Years | 5.31 | % | 5.31 | % | ||||||||
10 Years | 4.11 | % | 4.11 | % | ||||||||
| Advisor Class Shares** | 2.14 | % | ||||||||||
1 Year | 4.43 | % | 4.43 | % | ||||||||
5 Years | 6.37 | % | 6.37 | % | ||||||||
10 Years | 5.15 | % | 5.15 | % | ||||||||
| Class R Shares** | 1.55 | % | ||||||||||
1 Year | 3.91 | % | 3.91 | % | ||||||||
5 Years | 5.82 | % | 5.82 | % | ||||||||
Since Inception† | 4.85 | % | 4.85 | % | ||||||||
| Class K Shares** | 1.86 | % | ||||||||||
1 Year | 4.17 | % | 4.17 | % | ||||||||
5 Years | 6.09 | % | 6.09 | % | ||||||||
Since Inception† | 5.36 | % | 5.36 | % | ||||||||
| Class I Shares** | 2.19 | % | ||||||||||
1 Year | 4.42 | % | 4.42 | % | ||||||||
5 Years | 6.39 | % | 6.39 | % | ||||||||
Since Inception† | 5.63 | % | 5.63 | % | ||||||||
The Portfolio’s prospectus fee table shows the Portfolio’s total annual operating expense ratios as 1.11%, 1.88%, 1.83%, 0.80%, 1.37%, 1.09% and 0.81% for Class A, Class B, Class C, Advisor Class, Class R, Class K and Class I shares, respectively, gross of any fee waivers or expense reimbursements. Contractual fee waivers and/or expense reimbursements limit the Portfolio’s annual operating expense ratios (exclusive of interest expense) to 0.85%, 1.55%, 1.55%, 0.55%, 1.05%, 0.80% and 0.55% for Class A, Class B, Class C, Advisor Class, Class R, Class K and Class I shares, respectively. These waivers/reimbursements extend through the Portfolio’s current fiscal year and may be extended by the Adviser for additional one-year terms. Absent reimbursements or waivers, performance would have been lower. The Financial Highlights section of this report sets forth expense ratio data for the current reporting period; the expense ratios shown above may differ from the expense ratios in the Financial Highlights sections since they are based on different time periods.
| * | SEC yields are calculated based on SEC guidelines for the 30-day period ended October 31, 2011. |
| (a) | Assumes conversion of Class B shares into Class A shares after six years. |
| ** | These share classes are offered at net asset value (NAV) to eligible investors and their SEC returns are the same as the NAV returns. Please note that these share classes are for investors purchasing shares through accounts established under certain fee-based programs sponsored and maintained by certain broker-dealers and financial intermediaries, institutional pension plans and/or investment advisory clients of, and certain other persons associated with, the Adviser and its affiliates or the Funds. |
| † | Inception dates: 11/3/03 for Class R shares; 3/1/05 for Class K and Class I shares. |
See Historical Performance disclosures on page 4.
(Historical Performance continued on next page)
| ALLIANCEBERNSTEIN BOND FUND INTERMEDIATE BOND PORTFOLIO • | 7 |
Historical Performance
HISTORICAL PERFORMANCE
(continued from previous page)
| SEC AVERAGE ANNUAL RETURNS (WITH ANY APPLICABLE SALES CHARGES) AS OF THE MOST RECENT CALENDAR QUARTER-END (SEPTEMBER 30, 2011) | ||||
| SEC Returns | ||||
| Class A Shares | ||||
1 Year | 0.38 | % | ||
5 Years | 5.28 | % | ||
10 Years | 4.58 | % | ||
| Class B Shares(a) | ||||
1 Year | 1.15 | % | ||
5 Years | 5.51 | % | ||
10 Years | 4.65 | % | ||
| Class C Shares | ||||
1 Year | 3.16 | % | ||
5 Years | 5.48 | % | ||
10 Years | 4.32 | % | ||
| Advisor Class Shares* | ||||
1 Year | 5.19 | % | ||
5 Years | 6.54 | % | ||
10 Years | 5.37 | % | ||
| Class R Shares* | ||||
1 Year | 4.67 | % | ||
5 Years | 5.98 | % | ||
Since Inception† | 4.92 | % | ||
| Class K Shares* | ||||
1 Year | 4.93 | % | ||
5 Years | 6.25 | % | ||
Since Inception† | 5.45 | % | ||
| Class I Shares* | ||||
1 Year | 5.19 | % | ||
5 Years | 6.56 | % | ||
Since Inception† | 5.73 | % | ||
| (a) | Assumes conversion of Class B shares into Class A shares after six years. |
| * | Please note that these share classes are for investors purchasing shares through accounts established under certain fee-based programs sponsored and maintained by certain broker-dealers and financial intermediaries, institutional pension plans and/or investment advisory clients of, and certain other persons associated with, the Adviser and its affiliates or the Funds. |
| † | Inception dates: 11/3/03 for Class R shares; 3/1/05 for Class K and Class I shares. |
See Historical Performance disclosures on page 4.
| 8 | • ALLIANCEBERNSTEIN BOND FUND INTERMEDIATE BOND PORTFOLIO |
Historical Performance
FUND EXPENSES
(unaudited)
As a shareholder of the Fund, you incur two types of costs: (1) transaction costs, including sales charges (loads) on purchase payments, contingent deferred sales charges on redemptions and (2) ongoing costs, including management fees; distribution (12b-1) fees; and other Fund expenses. This example is intended to help you understand your ongoing costs (in dollars) of investing in the Fund and to compare these costs with the ongoing costs of investing in other mutual funds.
The Example is based on an investment of $1,000 invested at the beginning of the period and held for the entire period as indicated below.
Actual Expenses
The table below provides information about actual account values and actual expenses. You may use the information, together with the amount you invested, to estimate the expenses that you paid over the period. Simply divide your account value by $1,000 (for example, an $8,600 account value divided by $1,000 = 8.6), then multiply the result by the number under the heading entitled “Expenses Paid During Period” to estimate the expenses you paid on your account during this period.
Hypothetical Example for Comparison Purposes
The table below also provides information about hypothetical account values and hypothetical expenses based on the Fund’s actual expense ratio and an assumed annual rate of return of 5% before expenses, which is not the Fund’s actual return. The hypothetical account values and expenses may not be used to estimate the actual ending account balance or expenses you paid for the period. You may use this information to compare the ongoing costs of investing in the Fund and other funds by comparing this 5% hypothetical example with the 5% hypothetical examples that appear in the shareholder reports of other funds.
Please note that the expenses shown in the table are meant to highlight your ongoing costs only and do not reflect any transactional costs, such as sales charges (loads), or contingent deferred sales charges on redemptions. Therefore, the hypothetical example is useful in comparing ongoing costs only, and will not help you determine the relative total costs of owning different funds. In addition, if these transactional costs were included, your costs would have been higher.
| Beginning Account Value May 1, 2011 | Ending Account Value October 31, 2011 | Expenses Paid During Period* | Annualized Expense Ratio* | |||||||||||||
| Class A | ||||||||||||||||
Actual | $ | 1,000 | $ | 1,030.60 | $ | 4.35 | 0.85 | % | ||||||||
Hypothetical** | $ | 1,000 | $ | 1,020.81 | $ | 4.33 | 0.85 | % | ||||||||
| Class B | ||||||||||||||||
Actual | $ | 1,000 | $ | 1,028.00 | $ | 7.87 | 1.55 | % | ||||||||
Hypothetical** | $ | 1,000 | $ | 1,017.30 | $ | 7.83 | 1.55 | % | ||||||||
| Class C | ||||||||||||||||
Actual | $ | 1,000 | $ | 1,027.10 | $ | 7.87 | 1.55 | % | ||||||||
Hypothetical** | $ | 1,000 | $ | 1,017.30 | $ | 7.83 | 1.55 | % | ||||||||
| Advisor Class | ||||||||||||||||
Actual | $ | 1,000 | $ | 1,033.10 | $ | 2.82 | 0.55 | % | ||||||||
Hypothetical** | $ | 1,000 | $ | 1,022.31 | $ | 2.80 | 0.55 | % | ||||||||
| Class R | ||||||||||||||||
Actual | $ | 1,000 | $ | 1,029.60 | $ | 5.37 | 1.05 | % | ||||||||
Hypothetical** | $ | 1,000 | $ | 1,019.80 | $ | 5.35 | 1.05 | % | ||||||||
| Class K | ||||||||||||||||
Actual | $ | 1,000 | $ | 1,030.90 | $ | 4.10 | 0.80 | % | ||||||||
Hypothetical** | $ | 1,000 | $ | 1,021.06 | $ | 4.08 | 0.80 | % | ||||||||
| ALLIANCEBERNSTEIN BOND FUND INTERMEDIATE BOND PORTFOLIO • | 9 | �� |
Fund Expenses
FUND EXPENSES
(unaudited)
(continued from previous page)
| Beginning Account Value May 1, 2011 | Ending Account Value October 31, 2011 | Expenses Paid During Period* | Annualized Expense Ratio* | |||||||||||||
| Class I | ||||||||||||||||
Actual | $ | 1,000 | $ | 1,033.10 | $ | 2.82 | 0.55 | % | ||||||||
Hypothetical** | $ | 1,000 | $ | 1,022.31 | $ | 2.80 | 0.55 | % | ||||||||
| * | Expenses are equal to the classes’ annualized expense ratio, multiplied by the average account value over the period, multiplied by 184/365 (to reflect the one-half year period). |
| ** | Assumes 5% return before expenses. |
| 10 | • ALLIANCEBERNSTEIN BOND FUND INTERMEDIATE BOND PORTFOLIO |
Fund Expenses
PORTFOLIO SUMMARY
October 31, 2011 (unaudited)
PORTFOLIO STATISTICS
Net Assets ($mil): $548.0
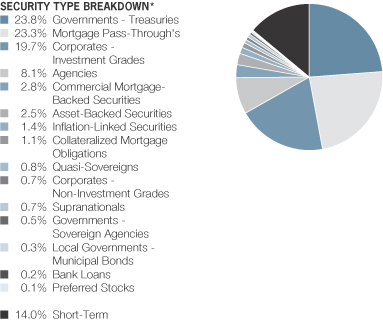
| * | All data are as of October 31, 2011. The Portfolio’s security type breakdown is expressed as a percentage of total investments and may vary over time. The Portfolio also enters into derivative transactions, which may be used for hedging or investment purposes (see “Portfolio of Investments” section of the report for additional details). |
| ALLIANCEBERNSTEIN BOND FUND INTERMEDIATE BOND PORTFOLIO • | 11 |
Portfolio Summary
PORTFOLIO OF INVESTMENTS
October 31, 2011
Principal (000) | U.S. $ Value | |||||||||
| ||||||||||
GOVERNMENTS - TREASURIES – 25.0% | ||||||||||
United States – 25.0% | ||||||||||
U.S. Treasury Bonds | U.S.$ | 8,899 | $ | 11,034,512 | ||||||
4.625%, 2/15/40 | 11,895 | 15,140,099 | ||||||||
5.375%, 2/15/31 | 4,140 | 5,631,046 | ||||||||
U.S. Treasury Notes | 38,620 | 38,692,606 | ||||||||
1.50%, 6/30/16 | 15,655 | 16,075,806 | ||||||||
2.625%, 4/30/16-11/15/20 | 42,510 | 44,915,345 | ||||||||
3.75%, 11/15/18 | 5,022 | 5,745,822 | ||||||||
|
| |||||||||
Total Governments - Treasuries | 137,235,236 | |||||||||
|
| |||||||||
MORTGAGE PASS-THROUGH’S – 24.4% | ||||||||||
Agency Fixed Rate 30-Year – 20.5% | ||||||||||
Federal Home Loan Mortgage Corp. Gold | 16,463 | 17,384,600 | ||||||||
5.50%, 4/01/38 | 3,194 | 3,455,896 | ||||||||
Series 2005 | 1,448 | 1,572,645 | ||||||||
Series 2007 | 194 | 210,680 | ||||||||
Federal National Mortgage Association | 8,035 | 8,169,963 | ||||||||
4.00%, TBA | 12,070 | 12,548,085 | ||||||||
4.00%, 1/01/41 | 8,150 | 8,476,968 | ||||||||
5.50%, 1/01/35-6/01/38 | 11,018 | 11,989,416 | ||||||||
6.00%, 2/01/38-2/01/40 | 11,169 | 12,241,299 | ||||||||
Series 2003 | 207 | 223,500 | ||||||||
5.50%, 4/01/33-7/01/33 | 1,618 | 1,763,205 | ||||||||
Series 2004 | 874 | 952,570 | ||||||||
6.00%, 9/01/34 | 326 | 361,069 | ||||||||
Series 2005 | 644 | 683,507 | ||||||||
5.50%, 2/01/35 | 647 | 705,435 | ||||||||
Series 2006 | 575 | 619,507 | ||||||||
5.50%, 4/01/36 | 1,558 | 1,695,926 | ||||||||
6.00%, 2/01/36 | 2,133 | 2,365,724 | ||||||||
Series 2007 | 526 | 559,449 | ||||||||
5.00%, 11/01/35-7/01/36 | 6,958 | 7,493,521 | ||||||||
5.50%, 8/01/37 | 5,469 | 5,959,273 | ||||||||
Series 2008 | 1,522 | 1,651,514 | ||||||||
| 12 | • ALLIANCEBERNSTEIN BOND FUND INTERMEDIATE BOND PORTFOLIO |
Portfolio of Investments
Principal (000) | U.S. $ Value | |||||||||
| ||||||||||
6.00%, 3/01/37-5/01/38 | U.S.$ | 9,075 | $ | 9,973,683 | ||||||
Series 2010 | 1,012 | 1,109,104 | ||||||||
Government National Mortgage Association | 169 | 190,575 | ||||||||
|
| |||||||||
| 112,357,114 | ||||||||||
|
| |||||||||
Agency Fixed Rate 15-Year – 2.5% | ||||||||||
Federal National Mortgage Association | 3,459 | 3,682,214 | ||||||||
4.50%, 3/01/25-6/01/26 | 8,863 | 9,428,280 | ||||||||
Government National Mortgage Association | 9 | 8,927 | ||||||||
Series 2001 | 453 | 470,797 | ||||||||
|
| |||||||||
| 13,590,218 | ||||||||||
|
| |||||||||
Agency ARMs – 1.4% | ||||||||||
Federal Home Loan Mortgage Corp. | 2,047 | 2,168,446 | ||||||||
Series 2006 | 435 | 454,169 | ||||||||
5.924%, 1/01/37(b) | 124 | 130,021 | ||||||||
Series 2007 | 1,500 | 1,544,943 | ||||||||
5.697%, 3/01/37(b) | 1,414 | 1,500,846 | ||||||||
Federal National Mortgage Association | 1,487 | 1,555,137 | ||||||||
3.201%, 8/01/37(a) | 570 | 601,928 | ||||||||
|
| |||||||||
| 7,955,490 | ||||||||||
|
| |||||||||
Total Mortgage Pass-Through’s | 133,902,822 | |||||||||
|
| |||||||||
CORPORATES - INVESTMENT | ||||||||||
Industrial – 9.0% | ||||||||||
Basic – 1.2% | ||||||||||
AngloGold Ashanti Holdings PLC | 855 | 839,738 | ||||||||
ArcelorMittal | 1,470 | 1,509,866 | ||||||||
ArcelorMittal USA, Inc. | 150 | 157,822 | ||||||||
Dow Chemical Co. (The) | 462 | 524,280 | ||||||||
8.55%, 5/15/19 | 490 | 636,554 | ||||||||
| ALLIANCEBERNSTEIN BOND FUND INTERMEDIATE BOND PORTFOLIO • | 13 |
Portfolio of Investments
Principal (000) | U.S. $ Value | |||||||||
| ||||||||||
International Paper Co. | U.S.$ | 235 | $ | 251,460 | ||||||
7.95%, 6/15/18 | 830 | 996,180 | ||||||||
Packaging Corp. of America | 870 | 933,219 | ||||||||
PPG Industries, Inc. | 578 | 613,394 | ||||||||
Teck Resources Ltd. | 90 | 98,801 | ||||||||
|
| |||||||||
| 6,561,314 | ||||||||||
|
| |||||||||
Capital Goods – 0.5% | ||||||||||
Holcim US Finance Sarl & Cie SCS | 132 | 141,704 | ||||||||
Owens Corning | 955 | 1,029,129 | ||||||||
Republic Services, Inc. | 508 | 579,205 | ||||||||
5.50%, 9/15/19 | 753 | 865,516 | ||||||||
|
| |||||||||
| 2,615,554 | ||||||||||
|
| |||||||||
Communications - Media – 1.9% | ||||||||||
CBS Corp. | 530 | 684,810 | ||||||||
Comcast Cable Communications Holdings, Inc. | 1,439 | 2,068,607 | ||||||||
DirecTV Holdings LLC/DirecTV Financing Co., Inc. | 565 | 600,733 | ||||||||
4.75%, 10/01/14 | 525 | 569,707 | ||||||||
News America, Inc. | 523 | 574,370 | ||||||||
6.55%, 3/15/33 | 142 | 152,916 | ||||||||
9.25%, 2/01/13 | 310 | 337,261 | ||||||||
Reed Elsevier Capital, Inc. | 1,193 | 1,486,424 | ||||||||
Time Warner Cable, Inc. | 740 | 813,020 | ||||||||
7.50%, 4/01/14 | 1,055 | 1,197,667 | ||||||||
Time Warner Entertainment Co. LP | 325 | 427,362 | ||||||||
WPP Finance UK | 1,185 | 1,354,709 | ||||||||
|
| |||||||||
| 10,267,586 | ||||||||||
|
| |||||||||
Communications - | ||||||||||
American Tower Corp. | 1,185 | 1,251,872 | ||||||||
AT&T, Inc. | 646 | 702,200 | ||||||||
Telecom Italia Capital SA | 1,150 | 1,168,169 | ||||||||
| 14 | • ALLIANCEBERNSTEIN BOND FUND INTERMEDIATE BOND PORTFOLIO |
Portfolio of Investments
Principal (000) | U.S. $ Value | |||||||||
| ||||||||||
6.375%, 11/15/33 | U.S.$ | 110 | $ | 98,039 | ||||||
7.175%, 6/18/19 | 515 | 541,107 | ||||||||
United States Cellular Corp. | 1,560 | 1,510,812 | ||||||||
|
| |||||||||
| 5,272,199 | ||||||||||
|
| |||||||||
Consumer Cyclical - Automotive – 0.2% | ||||||||||
Harley-Davidson Funding Corp. | 1,010 | 1,100,917 | ||||||||
|
| |||||||||
Consumer Cyclical - Entertainment – 0.7% | ||||||||||
Time Warner, Inc. | 600 | 648,097 | ||||||||
7.625%, 4/15/31 | 1,285 | 1,652,055 | ||||||||
Viacom, Inc. | 1,230 | 1,411,515 | ||||||||
|
| |||||||||
| 3,711,667 | ||||||||||
|
| |||||||||
Consumer Cyclical - Other – 0.2% | ||||||||||
Marriott International, Inc./DE | 1,370 | 1,420,820 | ||||||||
|
| |||||||||
Consumer Cyclical - Retailers – 0.1% | ||||||||||
CVS Caremark Corp. | 605 | 737,907 | ||||||||
|
| |||||||||
Consumer Non-Cyclical – 0.8% | ||||||||||
Ahold Finance USA LLC | 1,275 | 1,589,083 | ||||||||
Beam, Inc. | 810 | 819,817 | ||||||||
Bunge Ltd. Finance Corp. | 130 | 136,187 | ||||||||
5.875%, 5/15/13 | 965 | 1,014,849 | ||||||||
Cadbury Schweppes US Finance LLC | 310 | 330,902 | ||||||||
Delhaize Group SA | 335 | 367,048 | ||||||||
Whirlpool Corp. | 155 | 175,644 | ||||||||
|
| |||||||||
| 4,433,530 | ||||||||||
|
| |||||||||
Energy – 0.9% | ||||||||||
Anadarko Petroleum Corp. | 296 | 340,168 | ||||||||
6.45%, 9/15/36 | 401 | 464,834 | ||||||||
Marathon Petroleum Corp. | 180 | 184,653 | ||||||||
5.125%, 3/01/21(c) | 306 | 330,708 | ||||||||
Nabors Industries, Inc. | 1,013 | 1,275,760 | ||||||||
| ALLIANCEBERNSTEIN BOND FUND INTERMEDIATE BOND PORTFOLIO • | 15 |
Portfolio of Investments
Principal (000) | U.S. $ Value | |||||||||||
| ||||||||||||
Noble Energy, Inc. | U.S.$ | 1,232 | $ | 1,620,817 | ||||||||
Noble Holding International Ltd. | 108 | 117,139 | ||||||||||
Weatherford International Ltd./Bermuda | 91 | 101,001 | ||||||||||
9.625%, 3/01/19 | 605 | 788,936 | ||||||||||
|
| |||||||||||
| 5,224,016 | ||||||||||||
|
| |||||||||||
Other Industrial – 0.2% | ||||||||||||
Noble Group Ltd. | 1,099 | 1,077,020 | ||||||||||
|
| |||||||||||
Technology – 0.5% | ||||||||||||
Agilent Technologies, Inc. | 217 | 236,545 | ||||||||||
Computer Sciences Corp. | 805 | 844,319 | ||||||||||
Motorola Solutions, Inc. | 30 | 34,967 | ||||||||||
Xerox Corp. | 1,250 | 1,423,141 | ||||||||||
|
| |||||||||||
| 2,538,972 | ||||||||||||
|
| |||||||||||
Transportation - Airlines – 0.2% | ||||||||||||
Southwest Airlines Co. | 730 | 781,402 | ||||||||||
5.75%, 12/15/16 | 490 | 540,977 | ||||||||||
|
| |||||||||||
| 1,322,379 | ||||||||||||
|
| |||||||||||
Transportation - Services – 0.6% | ||||||||||||
Asciano Finance Ltd. | 1,490 | 1,504,407 | ||||||||||
Con-way, Inc. | 871 | 850,170 | ||||||||||
Ryder System, Inc. | 383 | 439,981 | ||||||||||
7.20%, 9/01/15 | 369 | 436,344 | ||||||||||
|
| |||||||||||
| 3,230,902 | ||||||||||||
|
| |||||||||||
| 49,514,783 | ||||||||||||
|
| |||||||||||
Financial Institutions – 8.8% | ||||||||||||
Banking – 5.1% | ||||||||||||
Bank of America Corp. | 1,050 | 1,122,349 | ||||||||||
7.625%, 6/01/19 | 1,305 | 1,418,054 | ||||||||||
Series L | 390 | 390,523 | ||||||||||
Bear Stearns Cos. LLC (The) | 315 | 330,808 | ||||||||||
5.70%, 11/15/14 | 1,655 | 1,810,439 | ||||||||||
Citigroup, Inc. | 1,015 | 1,075,236 | ||||||||||
| 16 | • ALLIANCEBERNSTEIN BOND FUND INTERMEDIATE BOND PORTFOLIO |
Portfolio of Investments
Principal (000) | U.S. $ Value | |||||||||
| ||||||||||
8.50%, 5/22/19 | U.S.$ | 1,495 | $ | 1,849,940 | ||||||
Compass Bank | 1,339 | 1,247,040 | ||||||||
Countrywide Financial Corp. | 62 | 60,579 | ||||||||
Goldman Sachs Group, Inc. (The) | 376 | 379,536 | ||||||||
6.00%, 6/15/20 | 1,430 | 1,506,007 | ||||||||
7.50%, 2/15/19 | 990 | 1,118,479 | ||||||||
JPMorgan Chase & Co. | 1,165 | 1,179,676 | ||||||||
Macquarie Group Ltd. | 1,475 | 1,424,882 | ||||||||
Morgan Stanley | 1,555 | 1,546,883 | ||||||||
6.625%, 4/01/18 | 995 | 1,037,015 | ||||||||
National Capital Trust II | 372 | 336,503 | ||||||||
Nationwide Building Society | 1,415 | 1,470,076 | ||||||||
Royal Bank of Scotland PLC (The) | 1,140 | 1,203,793 | ||||||||
Santander US Debt SA Unipersonal | 1,500 | 1,451,585 | ||||||||
Shinhan Bank | 530 | 537,500 | ||||||||
Societe Generale SA | 695 | 664,530 | ||||||||
SouthTrust Corp. | 1,470 | 1,579,816 | ||||||||
UFJ Finance Aruba AEC | 172 | 185,395 | ||||||||
Unicredit Luxembourg Finance SA | 685 | 557,365 | ||||||||
Union Bank NA | 1,580 | 1,702,224 | ||||||||
Wachovia Corp. | 485 | 515,707 | ||||||||
|
| |||||||||
| 27,701,940 | ||||||||||
|
| |||||||||
Brokerage – 0.2% | ||||||||||
Jefferies Group, Inc. | 764 | 689,755 | ||||||||
6.875%, 4/15/21 | 568 | 547,392 | ||||||||
|
| |||||||||
| 1,237,147 | ||||||||||
|
| |||||||||
Finance – 0.2% | ||||||||||
SLM Corp. | 885 | 882,325 | ||||||||
|
| |||||||||
| ALLIANCEBERNSTEIN BOND FUND INTERMEDIATE BOND PORTFOLIO • | 17 |
Portfolio of Investments
Principal (000) | U.S. $ Value | |||||||||
| ||||||||||
Insurance – 2.8% | ||||||||||
Allied World Assurance Co., Ltd. | U.S.$ | 650 | $ | 742,543 | ||||||
Allstate Corp. (The) | 1,360 | 1,254,600 | ||||||||
American International Group, Inc. | 680 | 712,196 | ||||||||
Assurant, Inc. | 92 | 95,803 | ||||||||
Coventry Health Care, Inc. | 295 | 331,451 | ||||||||
6.125%, 1/15/15 | 115 | 126,398 | ||||||||
6.30%, 8/15/14 | 900 | 988,377 | ||||||||
Genworth Financial, Inc. | 1,274 | 1,149,720 | ||||||||
Guardian Life Insurance Co. of America | 700 | 888,353 | ||||||||
Hartford Financial Services Group, Inc. | 280 | 280,523 | ||||||||
5.50%, 3/30/20 | 726 | 744,372 | ||||||||
Humana, Inc. | 130 | 146,322 | ||||||||
7.20%, 6/15/18 | 825 | 963,523 | ||||||||
Lincoln National Corp. | 361 | 440,454 | ||||||||
Markel Corp. | 684 | 783,954 | ||||||||
Massachusetts Mutual Life Insurance Co. | 710 | 1,071,331 | ||||||||
Metlife Capital Trust IV | 590 | 624,601 | ||||||||
MetLife, Inc. | 358 | 448,921 | ||||||||
Nationwide Mutual Insurance Co. | 1,190 | 1,460,060 | ||||||||
Principal Financial Group, Inc. | 900 | 1,023,568 | ||||||||
QBE Capital Funding III Ltd. | 420 | 394,352 | ||||||||
XL Group PLC | 824 | 874,137 | ||||||||
|
| |||||||||
| 15,545,559 | ||||||||||
|
| |||||||||
Other Finance – 0.3% | ||||||||||
Aviation Capital Group Corp. | 552 | 535,790 | ||||||||
ORIX Corp. | 1,345 | 1,379,715 | ||||||||
|
| |||||||||
| 1,915,505 | ||||||||||
|
| |||||||||
| 18 | • ALLIANCEBERNSTEIN BOND FUND INTERMEDIATE BOND PORTFOLIO |
Portfolio of Investments
Principal (000) | U.S. $ Value | |||||||||
| ||||||||||
REITS – 0.2% | ||||||||||
Healthcare Realty Trust, Inc. | U.S.$ | 845 | $ | 873,154 | ||||||
|
| |||||||||
| 48,155,630 | ||||||||||
|
| |||||||||
Utility – 2.3% | ||||||||||
Electric – 1.2% | ||||||||||
Allegheny Energy Supply Co. LLC | 870 | 947,319 | ||||||||
Ameren Corp. | 770 | 871,146 | ||||||||
Constellation Energy Group, Inc. | 1,150 | 1,181,423 | ||||||||
FirstEnergy Corp. | 126 | 126,205 | ||||||||
Series C | 279 | 350,683 | ||||||||
Nisource Finance Corp. | 1,465 | 1,752,212 | ||||||||
SPI Electricity & Gas Australia Holdings Pty Ltd. | 283 | 301,829 | ||||||||
TECO Finance, Inc. | 310 | 326,356 | ||||||||
5.15%, 3/15/20 | 380 | 415,743 | ||||||||
Union Electric Co. | 140 | 172,623 | ||||||||
Wisconsin Energy Corp. | 140 | 138,600 | ||||||||
|
| |||||||||
| 6,584,139 | ||||||||||
|
| |||||||||
Natural Gas – 1.1% | ||||||||||
DCP Midstream LLC | 396 | 428,554 | ||||||||
Energy Transfer Partners LP | 411 | 458,134 | ||||||||
7.50%, 7/01/38 | 909 | 1,043,576 | ||||||||
EQT Corp. | 689 | 819,796 | ||||||||
Kinder Morgan Energy Partners LP | 527 | 540,108 | ||||||||
TransCanada PipeLines Ltd. | 1,670 | 1,702,021 | ||||||||
Williams Partners LP | 733 | 809,914 | ||||||||
|
| |||||||||
| 5,802,103 | ||||||||||
|
| |||||||||
| 12,386,242 | ||||||||||
|
| |||||||||
| ALLIANCEBERNSTEIN BOND FUND INTERMEDIATE BOND PORTFOLIO • | 19 |
Portfolio of Investments
Principal (000) | U.S. $ Value | |||||||||
| ||||||||||
Non Corporate Sectors – 0.6% | ||||||||||
Agencies - Not Government | ||||||||||
Centrais Eletricas Brasileiras SA | U.S.$ | 1,090 | $ | 1,128,150 | ||||||
Gazprom OAO Via Gaz Capital SA | 977 | 1,051,496 | ||||||||
IPIC GMTN Ltd. | 925 | 924,075 | ||||||||
Korea National Oil Corp. | 325 | 329,990 | ||||||||
|
| |||||||||
| 3,433,711 | ||||||||||
|
| |||||||||
Total Corporates - Investment Grades | 113,490,366 | |||||||||
|
| |||||||||
AGENCIES – 8.5% | ||||||||||
Agency Debentures – 8.5% | ||||||||||
Federal Farm Credit Bank | 9,500 | 9,507,125 | ||||||||
0.276%, 9/29/14(b) | 13,510 | 13,507,784 | ||||||||
Federal National Mortgage Association | 1,500 | 1,499,706 | ||||||||
6.25%, 5/15/29 | 8,610 | 11,734,914 | ||||||||
Residual Funding Corp. Principal Strip | 12,340 | 10,025,682 | ||||||||
|
| |||||||||
Total Agencies | 46,275,211 | |||||||||
|
| |||||||||
COMMERCIAL MORTGAGE-BACKED SECURITIES – 3.0% | ||||||||||
Non-Agency Fixed Rate CMBS – 3.0% | ||||||||||
Commercial Mortgage Pass Through Certificates | 2,130 | 2,284,738 | ||||||||
Credit Suisse Mortgage Capital Certificates | 2,850 | 3,110,889 | ||||||||
Greenwich Capital Commercial Funding Corp. | 775 | 449,500 | ||||||||
JP Morgan Chase Commercial Mortgage Securities Corp. | 1,455 | 1,567,738 | ||||||||
Series 2006-CB15, Class A4 | 2,335 | 2,522,400 | ||||||||
| 20 | • ALLIANCEBERNSTEIN BOND FUND INTERMEDIATE BOND PORTFOLIO |
Portfolio of Investments
Principal (000) | U.S. $ Value | |||||||||
| ||||||||||
Series 2006-CB16, Class A4 | U.S.$ | 1,810 | $ | 1,971,856 | ||||||
Merrill Lynch/Countrywide Commercial Mortgage Trust | 220 | 248,767 | ||||||||
Series 2006-4, Class AM | 940 | 842,682 | ||||||||
Series 2007-9, Class A4 | 2,940 | 3,066,402 | ||||||||
Prudential Securities Secured Financing Corp. | 13,601 | 235,565 | ||||||||
|
| |||||||||
Total Commercial Mortgage-Backed Securities | 16,300,537 | |||||||||
|
| |||||||||
ASSET-BACKED SECURITIES – 2.7% | ||||||||||
Autos - Fixed Rate – 1.0% | ||||||||||
AmeriCredit Automobile Receivables Trust | 658 | 657,971 | ||||||||
Ford Auto Securitization Trust | CAD | 1,914 | 1,918,910 | |||||||
Ford Credit Auto Lease Trust | U.S.$ | 1,862 | 1,861,832 | |||||||
Santander Drive Auto Receivables Trust | 751 | 751,326 | ||||||||
|
| |||||||||
| 5,190,039 | ||||||||||
|
| |||||||||
Credit Cards - Floating Rate – 0.9% | ||||||||||
American Express Credit Account Master Trust | 2,720 | 2,720,000 | ||||||||
Citibank Omni Master Trust | 2,405 | 2,424,385 | ||||||||
|
| |||||||||
| 5,144,385 | ||||||||||
|
| |||||||||
Other ABS - Fixed Rate – 0.3% | ||||||||||
CNH Equipment Trust | 1,261 | 1,265,679 | ||||||||
GE Equipment Midticket LLC | 567 | 566,534 | ||||||||
|
| |||||||||
| 1,832,213 | ||||||||||
|
| |||||||||
| ALLIANCEBERNSTEIN BOND FUND INTERMEDIATE BOND PORTFOLIO • | 21 |
Portfolio of Investments
Principal (000) | U.S. $ Value | |||||||||
| ||||||||||
Home Equity Loans - Floating Rate – 0.3% | ||||||||||
HSBC Home Equity Loan Trust | U.S.$ | 122 | $ | 109,065 | ||||||
Series 2007-1, Class M1 | 1,250 | 906,957 | ||||||||
Series 2007-2, Class M1 | 600 | 408,648 | ||||||||
|
| |||||||||
| 1,424,670 | ||||||||||
|
| |||||||||
Autos - Floating Rate – 0.1% | ||||||||||
Navistar Financial Dealer Note Master Trust | 704 | 705,100 | ||||||||
|
| |||||||||
Home Equity Loans - Fixed Rate – 0.1% | ||||||||||
Asset Backed Funding Certificates | 96 | 79,781 | ||||||||
Citifinancial Mortgage Securities, Inc. | 88 | 76,264 | ||||||||
Credit-Based Asset Servicing and Securitization LLC | 209 | 182,893 | ||||||||
Nationstar NIM Trust | 18 | 0 | ||||||||
|
| |||||||||
| 338,938 | ||||||||||
|
| |||||||||
Total Asset-Backed Securities | 14,635,345 | |||||||||
|
| |||||||||
INFLATION-LINKED SECURITIES – 1.5% | ||||||||||
United States – 1.5% | ||||||||||
U.S. Treasury Inflation Index | 7,733 | 8,149,428 | ||||||||
|
| |||||||||
COLLATERALIZED MORTGAGE OBLIGATIONS – 1.1% | ||||||||||
Non-Agency Fixed Rate – 0.7% | ||||||||||
Citigroup Mortgage Loan Trust, Inc. | 1,388 | 1,175,057 | ||||||||
Indymac Index Mortgage Loan Trust | 1,298 | 558,619 | ||||||||
| 22 | • ALLIANCEBERNSTEIN BOND FUND INTERMEDIATE BOND PORTFOLIO |
Portfolio of Investments
Principal (000) | U.S. $ Value | |||||||||
| ||||||||||
JP Morgan Alternative Loan Trust | U.S.$ | 1,516 | $ | 796,810 | ||||||
Structured Asset Securities Corp. | 1,390 | 1,070,117 | ||||||||
Series 2003-6A, Class B3 | 790 | 89,241 | ||||||||
|
| |||||||||
| 3,689,844 | ||||||||||
|
| |||||||||
Non-Agency Floating Rate – 0.4% | ||||||||||
Countrywide Alternative Loan Trust | 115 | 70,451 | ||||||||
Series 2006-OA14, Class 3A1 | 2,237 | 1,008,020 | ||||||||
Series 2007-OA3, Class M1 | 176 | 655 | ||||||||
WaMu Mortgage Pass Through Certificates | 1,743 | 941,622 | ||||||||
|
| |||||||||
| 2,020,748 | ||||||||||
|
| |||||||||
Non-Agency ARMs – 0.0% | ||||||||||
Citigroup Mortgage Loan Trust, Inc. | 408 | 257,854 | ||||||||
|
| |||||||||
Agency Floating Rate – 0.0% | ||||||||||
Government National Mortgage Association | 14,692 | 200,941 | ||||||||
|
| |||||||||
Agency Fixed Rate – 0.0% | ||||||||||
Fannie Mae Grantor Trust | 65 | 47,833 | ||||||||
|
| |||||||||
Total Collateralized Mortgage Obligations | 6,217,220 | |||||||||
|
| |||||||||
QUASI-SOVEREIGNS – 0.8% | ||||||||||
Quasi-Sovereign Bonds – 0.8% | ||||||||||
Kazakhstan – 0.2% | ||||||||||
KazMunayGas National Co. | 790 | 865,050 | ||||||||
|
| |||||||||
Malaysia – 0.3% | ||||||||||
Petronas Capital Ltd. | 1,385 | 1,566,273 | ||||||||
|
| |||||||||
| ALLIANCEBERNSTEIN BOND FUND INTERMEDIATE BOND PORTFOLIO • | 23 |
Portfolio of Investments
Principal (000) | U.S. $ Value | |||||||||
| ||||||||||
Russia – 0.2% | ||||||||||
Russian Agricultural Bank OJSC Via RSHB Capital SA | U.S.$ | 1,175 | $ | 1,296,906 | ||||||
|
| |||||||||
United Arab Emirates – 0.1% | ||||||||||
MDC-GMTN B.V. | 520 | 537,711 | ||||||||
|
| |||||||||
Total Quasi-Sovereigns | 4,265,940 | |||||||||
|
| |||||||||
CORPORATES - NON-INVESTMENT | ||||||||||
Financial Institutions – 0.6% | ||||||||||
Banking – 0.2% | ||||||||||
ABN Amro Bank NV | EUR | 340 | 329,556 | |||||||
BankAmerica Capital II | U.S.$ | 415 | 377,650 | |||||||
LBG Capital No.1 PLC | 635 | 520,700 | ||||||||
|
| |||||||||
| 1,227,906 | ||||||||||
|
| |||||||||
Brokerage – 0.1% | ||||||||||
Lehman Brothers Holdings, Inc. | 520 | 128,700 | ||||||||
6.20%, 9/26/14(h) | 615 | 156,825 | ||||||||
7.875%, 11/01/09(h) | 1,476 | 365,310 | ||||||||
Series G | 79 | 19,552 | ||||||||
|
| |||||||||
| 670,387 | ||||||||||
|
| |||||||||
Insurance – 0.3% | ||||||||||
ING Capital Funding Trust III | 825 | 698,960 | ||||||||
XL Group PLC | 805 | 676,200 | ||||||||
|
| |||||||||
| 1,375,160 | ||||||||||
|
| |||||||||
| 3,273,453 | ||||||||||
|
| |||||||||
Industrial – 0.2% | ||||||||||
Basic – 0.2% | ||||||||||
Lyondell Chemical Co. | 431 | 484,875 | ||||||||
| 24 | • ALLIANCEBERNSTEIN BOND FUND INTERMEDIATE BOND PORTFOLIO |
Portfolio of Investments
Principal (000) | U.S. $ Value | |||||||||
| ||||||||||
United States Steel Corp. | U.S.$ | 416 | $ | 386,880 | ||||||
|
| |||||||||
| 871,755 | ||||||||||
|
| |||||||||
Total Corporates - Non-Investment Grades | 4,145,208 | |||||||||
|
| |||||||||
SUPRANATIONALS – 0.7% | ||||||||||
European Bank for Reconstruction & Development | BRL | 3,890 | 2,285,648 | |||||||
European Investment Bank | U.S.$ | 1,490 | 1,766,426 | |||||||
|
| |||||||||
Total Supranationals | 4,052,074 | |||||||||
|
| |||||||||
GOVERNMENTS - SOVEREIGN | ||||||||||
United Kingdom – 0.5% | ||||||||||
Royal Bank of Scotland PLC (The) | 2,780 | 2,810,338 | ||||||||
|
| |||||||||
LOCAL GOVERNMENTS - MUNICIPAL | ||||||||||
United States – 0.3% | ||||||||||
California GO | 1,355 | 1,659,360 | ||||||||
|
| |||||||||
BANK LOANS – 0.2% | ||||||||||
Utility – 0.1% | ||||||||||
Electric – 0.1% | ||||||||||
FirstLight Power Resources, Inc. (fka NE Energy, Inc.) | 852 | 772,954 | ||||||||
|
| |||||||||
Industrial – 0.1% | ||||||||||
Communications - Media – 0.0% | ||||||||||
Clear Channel Communications, Inc. | 163 | 127,682 | ||||||||
|
| |||||||||
Services – 0.0% | ||||||||||
ServiceMaster Co., (The) | 6 | 5,634 | ||||||||
2.75%-2.83%, 7/24/14(b) | 59 | 56,571 | ||||||||
|
| |||||||||
| 62,205 | ||||||||||
|
| |||||||||
| ALLIANCEBERNSTEIN BOND FUND INTERMEDIATE BOND PORTFOLIO • | 25 |
Portfolio of Investments
| Company | Principal (000) | U.S. $ Value | ||||||||
| ||||||||||
Technology – 0.1% | ||||||||||
SunGard Data Systems Inc. (Solar Capital Corp.) | U.S.$ | 349 | $ | 344,972 | ||||||
|
| |||||||||
| 534,859 | ||||||||||
|
| |||||||||
Total Bank Loans | 1,307,813 | |||||||||
|
| |||||||||
| Shares | ||||||||||
PREFERRED STOCKS – 0.1% | ||||||||||
Financial Institutions – 0.1% | ||||||||||
Finance – 0.1% | ||||||||||
Citigroup Capital XII | 23,000 | 588,570 | ||||||||
|
| |||||||||
SHORT-TERM INVESTMENTS – 14.8% | ||||||||||
Investment Companies – 14.8% | ||||||||||
AllianceBernstein Fixed-Income Shares, Inc. – Government STIF Portfolio, 0.09%(j) | 80,830,161 | 80,830,161 | ||||||||
|
| |||||||||
Total Investments – 105.1% | 575,865,629 | |||||||||
Other assets less liabilities – (5.1)% | (27,883,552 | ) | ||||||||
|
| |||||||||
Net Assets – 100.0% | $ | 547,982,077 | ||||||||
|
| |||||||||
FORWARD CURRENCY EXCHANGE CONTRACTS (see Note D)
| Counterparty & Description | Contract Amount (000) | U.S. $ Value on | U.S. $ Value at October 31, 2011 | Unrealized Appreciation/ (Depreciation) | ||||||||||||
Buy Contracts | ||||||||||||||||
Goldman Sachs International: | ||||||||||||||||
Brazilian Real settling | 4,198 | $ | 2,382,719 | $ | 2,445,380 | $ | 62,661 | |||||||||
Brazilian Real settling | 4,198 | 2,486,438 | 2,445,380 | (41,058 | ) | |||||||||||
Sale Contracts | ||||||||||||||||
Barclarys Bank PLC Wholesale: | ||||||||||||||||
Canadian Dollar settling | 1,911 | 1,891,955 | 1,916,468 | (24,513 | ) | |||||||||||
| 26 | • ALLIANCEBERNSTEIN BOND FUND INTERMEDIATE BOND PORTFOLIO |
Portfolio of Investments
| Counterparty & Description | Contract Amount (000) | U.S. $ Value on | U.S. $ Value at October 31, 2011 | Unrealized Appreciation/ (Depreciation) | ||||||||||||
Goldman Sachs International: | ||||||||||||||||
Brazilian Real settling | 4,198 | $ | 2,486,438 | $ | 2,445,380 | $ | 41,058 | |||||||||
Brazilian Real settling | 4,198 | 2,313,141 | 2,445,380 | (132,239 | ) | |||||||||||
Brazilian Real settling | 4,198 | 2,367,402 | 2,427,887 | (60,485 | ) | |||||||||||
Westpac Banking Corporation: | ||||||||||||||||
Euro settling | 769 | 1,055,440 | 1,063,852 | (8,412 | ) | |||||||||||
|
| |||||||||||||||
| $ | (162,988 | ) | ||||||||||||||
|
| |||||||||||||||
| (1) | Contract represents non-deliverable forward where payment is received from or paid to a counterparty based on the net realized gain/loss on settlement date. |
CREDIT DEFAULT SWAP CONTRACTS ON INDICES (see Note D)
| Swap Counterparty & Referenced Obligation | Fixed Deal (Pay) Receive Rate | Implied Credit Spread at October 31, 2011 | Notional Amount (000) | Market Value | Upfront Premiums Paid (Received) | Unrealized Appreciation/ (Depreciation) | ||||||||||||||||||
Buy Contracts | ||||||||||||||||||||||||
Morgan Stanley Capital Services Inc.: | ||||||||||||||||||||||||
CDX-NAHYS17V1-5Y, 12/20/2016* | (5.00 | )% | 6.57 | % | $ | 9,850 | $ | 545,854 | $ | 926,857 | $ | (381,003 | ) | |||||||||||
CDX-NAIGS17V1-5Y, 12/20/16* | (1.00 | ) | 1.21 | 16,220 | 143,779 | 310,581 | (166,802 | ) | ||||||||||||||||
ITRAXX-FINSENS16V1-5 Year Index, 12/20/16* | (1.00 | ) | 2.25 | EUR | 7,320 | 560,687 | 881,809 | (321,122 | ) | |||||||||||||||
|
| |||||||||||||||||||||||
| $ | (868,927 | ) | ||||||||||||||||||||||
|
| |||||||||||||||||||||||
| * | Termination date |
| (a) | Variable rate coupon, rate shown as of October 31, 2011. |
| (b) | Floating Rate Security. Stated interest rate was in effect at October 31, 2011. |
| ALLIANCEBERNSTEIN BOND FUND INTERMEDIATE BOND PORTFOLIO • | 27 |
Portfolio of Investments
| (c) | Security is exempt from registration under Rule 144A of the Securities Act of 1933. These securities are considered liquid and may be resold in transactions exempt from registration, normally to qualified institutional buyers. At October 31, 2011, the aggregate market value of these securities amounted to $34,079,590 or 6.2% of net assets. |
| (d) | Illiquid security. |
| (e) | IO – Interest Only |
| (f) | Security is exempt from registration under Rule 144A of the Securities Act of 1933. This security, which represents 0.00% of net assets as of October 31, 2011, is considered illiquid and restricted. |
| Restricted Securities | Acquisition Date | Cost | Market Value | Percentage of Net Assets | ||||||||||||
Nationstar NIM Trust | 4/04/07 | $ | 17,606 | $ | 0 | 0.00 | % | |||||||||
| (g) | Fair valued. |
| (h) | Security is in default and is non-income producing. |
| (i) | Non-income producing security. |
| (j) | Investment in affiliated money market mutual fund. The rate shown represents the 7-day yield as of period end. |
Currency Abbreviations:
BRL – Brazilian Real
CAD – Canadian Dollar
EUR – Euro
Glossary:
ABS – Asset-Backed Securities
ARMs – Adjustable Rate Mortgages
CMBS – Commercial Mortgage-Backed Securities
GO – General Obligation
OJSC – Open Joint Stock Company
REIT – Real Estate Investment Trust
TBA – To Be Announced
TIPS – Treasury Inflation Protected Security
See notes to financial statements.
| 28 | • ALLIANCEBERNSTEIN BOND FUND INTERMEDIATE BOND PORTFOLIO |
Portfolio of Investments
STATEMENT OF ASSETS & LIABILITIES
October 31, 2011
| Assets | ||||
Investments in securities, at value | ||||
Unaffiliated issuers (cost $478,090,411) | $ | 495,035,468 | ||
Affiliated issuers (cost $80,830,161) | 80,830,161 | (a) | ||
Cash | 21,666 | |||
Foreign currencies, at value (cost $15,462) | 15,288 | |||
Interest and dividends receivable | 3,911,926 | |||
Premium paid on credit default swap contracts | 2,119,247 | |||
Receivable for capital stock sold | 947,079 | |||
Receivable for investment securities sold | 880,339 | |||
Unrealized appreciation of forward currency exchange contracts | 103,719 | |||
Other assets (see Note F) | 310,598 | |||
|
| |||
Total assets | 584,175,491 | |||
|
| |||
| Liabilities | ||||
Payable for investment securities purchased | 31,382,051 | |||
Collateral received from broker | 1,440,000 | |||
Payable for capital stock redeemed | 1,291,868 | |||
Unrealized depreciation on credit default swap contracts | 868,927 | |||
Dividends payable | 346,970 | |||
Unrealized depreciation of forward currency exchange contracts | 266,707 | |||
Distribution fee payable | 149,364 | |||
Advisory fee payable | 132,054 | |||
Transfer Agent fee payable | 48,177 | |||
Administrative fee payable | 17,750 | |||
Accrued expenses | 249,546 | |||
|
| |||
Total liabilities | 36,193,414 | |||
|
| |||
Net Assets | $ | 547,982,077 | ||
|
| |||
| Composition of Net Assets | ||||
Capital stock, at par | $ | 49,641 | ||
Additional paid-in capital | 589,891,594 | |||
Undistributed net investment income | 4,402,419 | |||
Accumulated net realized loss on investment | (62,463,011 | ) | ||
Net unrealized appreciation on investments, foreign currency denominated assets and liabilities and other assets | 16,101,434 | |||
|
| |||
| $ | 547,982,077 | |||
|
|
Net Asset Value Per Share—21 billion shares of capital stock authorized, $.001 par value
| Class | Net Assets | Shares Outstanding | Net Asset Value | |||||||||
| A | $ | 381,577,140 | 34,562,085 | $ | 11.04 | * | ||||||
| ||||||||||||
| B | $ | 11,103,766 | 1,005,301 | $ | 11.05 | |||||||
| ||||||||||||
| C | $ | 62,146,676 | 5,639,712 | $ | 11.02 | |||||||
| ||||||||||||
| Advisor | $ | 88,402,255 | 8,003,771 | $ | 11.05 | |||||||
| ||||||||||||
| R | $ | 1,168,404 | 105,827 | $ | 11.04 | |||||||
| ||||||||||||
| K | $ | 2,868,534 | 259,644 | $ | 11.05 | |||||||
| ||||||||||||
| I | $ | 715,302 | 64,703 | $ | 11.06 | |||||||
| ||||||||||||
| * | The maximum offering price per share for Class A shares was $11.53 which reflects a sales charge of 4.25%. |
| (a) | Includes investment of cash collateral of $1,440,000 received from broker for credit default swap contracts. |
See notes to financial statements.
| ALLIANCEBERNSTEIN BOND FUND INTERMEDIATE BOND PORTFOLIO • | 29 |
Statement of Assets & Liabilities
STATEMENT OF OPERATIONS
Year Ended October 31, 2011
| Investment Income | ||||||||
Interest | $ | 23,390,333 | ||||||
Dividends | ||||||||
Unaffiliated issuers | 48,875 | |||||||
Affiliated issuers | 32,930 | $ | 23,472,138 | |||||
|
| |||||||
| Expenses | ||||||||
Advisory fee (see Note B) | 2,477,246 | |||||||
Distribution fee—Class A | 1,164,669 | |||||||
Distribution fee—Class B | 132,749 | |||||||
Distribution fee—Class C | 608,870 | |||||||
Distribution fee—Class R | 4,350 | |||||||
Distribution fee—Class K | 9,218 | |||||||
Transfer agency—Class A | 551,828 | |||||||
Transfer agency—Class B | 26,385 | |||||||
Transfer agency—Class C | 94,196 | |||||||
Transfer agency—Advisor Class | 117,545 | |||||||
Transfer agency—Class R | 2,262 | |||||||
Transfer agency—Class K | 7,374 | |||||||
Transfer agency—Class I | 1,271 | |||||||
Custodian | 210,262 | |||||||
Registration fees | 126,497 | |||||||
Administrative | 66,498 | |||||||
Printing | 54,085 | |||||||
Audit | 47,859 | |||||||
Legal | 39,931 | |||||||
Directors’ fees | 9,893 | |||||||
Miscellaneous | 24,113 | |||||||
|
| |||||||
Total expenses | 5,777,101 | |||||||
Less: expenses waived and reimbursed by the Adviser (see Note B) | (829,500 | ) | ||||||
|
| |||||||
Net expenses | 4,947,601 | |||||||
|
| |||||||
Net investment income | 18,524,537 | |||||||
|
| |||||||
| Realized and Unrealized Gain (Loss) on Investment and Foreign Currency Transactions | ||||||||
Net realized gain (loss) on: | ||||||||
Investment transactions | 11,673,399 | |||||||
Futures contracts | 20,587 | |||||||
Swap contracts | (22,262 | ) | ||||||
Foreign currency transactions | 166,903 | |||||||
Net change in unrealized appreciation/depreciation of: | ||||||||
Investments | (8,539,082 | ) | ||||||
Futures contracts | (145,998 | ) | ||||||
Swap contracts | (868,927 | ) | ||||||
Foreign currency denominated assets and liabilities and other assets | (148,070 | ) | ||||||
|
| |||||||
Net gain on investment and foreign currency transactions | 2,136,550 | |||||||
|
| |||||||
Net Increase in Net Assets from Operations | $ | 20,661,087 | ||||||
|
|
See notes to financial statements.
| 30 | • ALLIANCEBERNSTEIN BOND FUND INTERMEDIATE BOND PORTFOLIO |
Statement of Operations
STATEMENT OF CHANGES IN NET ASSETS
| Year Ended October 31, 2011 | Year Ended October 31, 2010 | |||||||
| Increase (Decrease) in Net Assets from Operations: | ||||||||
Net investment income | $ | 18,524,537 | $ | 22,527,856 | ||||
Net realized gain on investment and foreign currency transactions | 11,838,627 | 9,026,359 | ||||||
Net change in unrealized appreciation/depreciation of investments and foreign currency denominated assets and liabilities and other assets | (9,702,077 | ) | 29,314,219 | |||||
|
|
|
| |||||
Net increase in net assets from operations | 20,661,087 | 60,868,434 | ||||||
| Dividends to Shareholders from: | ||||||||
Net investment income | ||||||||
Class A | (13,589,921 | ) | (16,561,657 | ) | ||||
Class B | (373,781 | ) | (626,368 | ) | ||||
Class C | (1,708,102 | ) | (2,112,596 | ) | ||||
Advisor Class | (3,120,955 | ) | (3,181,347 | ) | ||||
Class R | (28,243 | ) | (14,384 | ) | ||||
Class K | (131,770 | ) | (179,089 | ) | ||||
Class I | (40,701 | ) | (74,493 | ) | ||||
| Capital Stock Transactions: | ||||||||
Net decrease | (50,771,470 | ) | (16,039,225 | ) | ||||
| Capital Contributions | ||||||||
Proceeds from third party regulatory settlement (see Note E) | – 0 | – | 168,359 | |||||
|
|
|
| |||||
Total increase (decrease) | (49,103,856 | ) | 22,247,634 | |||||
| Net Assets: | ||||||||
Beginning of period | 597,085,933 | 574,838,299 | ||||||
|
|
|
| |||||
End of period (including undistributed net investment income of $4,402,419 and $3,379,230, respectively) | $ | 547,982,077 | $ | 597,085,933 | ||||
|
|
|
| |||||
See notes to financial statements.
| ALLIANCEBERNSTEIN BOND FUND INTERMEDIATE BOND PORTFOLIO • | 31 |
Statement of Changes in Net Assets
NOTES TO FINANCIAL STATEMENTS
October 31, 2011
NOTE A
Significant Accounting Policies
AllianceBernstein Bond Fund, Inc. (the “Fund”) is registered under the Investment Company Act of 1940 as a diversified, open-end management investment company. The Fund, which is a Maryland corporation, operates as a series company currently comprised of four portfolios: the Intermediate Bond Portfolio, the Bond Inflation Strategy Portfolio, the Municipal Bond Inflation Strategy Portfolio and the Real Asset Strategy Portfolio. The Intermediate Bond Portfolio commenced operations on July 1, 1999. The Bond Inflation Strategy Portfolio and Municipal Bond Inflation Strategy Portfolio commenced operations on January 26, 2010. The Real Asset Strategy Portfolio commenced operations on March 8, 2010. This report relates only to the Intermediate Bond Portfolio. The Intermediate Bond Portfolio (the “Portfolio”) offers Class A, Class B, Class C, Advisor Class, Class R, Class K, and Class I shares. Class A shares are sold with a front-end sales charge of up to 4.25% for purchases not exceeding $1,000,000. With respect to purchases of $1,000,000 or more, Class A shares redeemed within one year of purchase may be subject to a contingent deferred sales charge of 1%. Class B shares are currently sold with a contingent deferred sales charge which declines from 3% to zero depending on the period of time the shares are held. Effective January 31, 2009, sales of Class B shares of the Portfolio to new investors were suspended. Class B shares will only be issued (i) upon the exchange of Class B shares from another AllianceBernstein Mutual Fund, (ii) for purposes of dividend reinvestment, (iii) through the Portfolio’s Automatic Investment Program (the “Program”) for accounts that established the Program prior to January 31, 2009, and (iv) for purchases of additional shares by Class B shareholders as of January 31, 2009. The ability to establish a new Program for accounts containing Class B shares was suspended as of January 31, 2009. Class B shares will automatically convert to Class A shares six years after the end of the calendar month of purchase. Class C shares are subject to a contingent deferred sales charge of 1% on redemptions made within the first year after purchase. Class R and Class K shares are sold without an initial or contingent deferred sales charge. Advisor Class and Class I shares are sold without an initial or contingent deferred sales charge and are not subject to ongoing distribution expenses. All seven classes of shares have identical voting, dividend, liquidation and other rights, except that the classes bear different distribution and transfer agency expenses. Each class has exclusive voting rights with respect to its distribution plan. The financial statements have been prepared in conformity with U.S. generally accepted accounting principles (“U.S. GAAP”) which require management to make certain estimates and assumptions that affect the reported amounts of assets and liabilities in the financial statements and amounts of income and expenses during the reporting period. Actual results could differ from those estimates. The following is a summary of significant accounting policies followed by the Portfolio.
| 32 | • ALLIANCEBERNSTEIN BOND FUND INTERMEDIATE BOND PORTFOLIO |
Notes to Financial Statements
1. Security Valuation
Portfolio securities are valued at their current market value determined on the basis of market quotations or, if market quotations are not readily available or are deemed unreliable, at “fair value” as determined in accordance with procedures established by and under the general supervision of the Fund’s Board of Directors.
In general, the market value of securities which are readily available and deemed reliable are determined as follows: Securities listed on a national securities exchange (other than securities listed on the NASDAQ Stock Market, Inc. (“NASDAQ”)) or on a foreign securities exchange are valued at the last sale price at the close of the exchange or foreign securities exchange. If there has been no sale on such day, the securities are valued at the mean of the closing bid and ask prices on such day. Securities listed on more than one exchange are valued by reference to the principal exchange on which the securities are traded; securities listed only on NASDAQ are valued in accordance with the NASDAQ Official Closing Price; listed or over the counter market (“OTC”) put or call options are valued at the mid level between the current bid and ask prices. If either a current bid or current ask price is unavailable, AllianceBernstein L.P. (the “Adviser”) will have discretion to determine the best valuation (e.g. last trade price); open futures contracts and options thereon are valued using the closing settlement price or, in the absence of such a price, the most recent quoted bid price. If there are no quotations available for the day of valuation, the last available closing settlement price is used; U.S. government securities and other debt instruments having 60 days or less remaining until maturity are valued at amortized cost if their original maturity was 60 days or less; or by amortizing their fair value as of the 61st day prior to maturity if their original term to maturity exceeded 60 days; fixed-income securities, including mortgage backed and asset backed securities, may be valued on the basis of prices provided by a pricing service or at a price obtained from one or more of the major broker/dealers. In cases where broker/dealer quotes are obtained, the Adviser may establish procedures whereby changes in market yields or spreads are used to adjust, on a daily basis, a recently obtained quoted price on a security; and swaps and other derivatives are valued daily, primarily using independent pricing services, independent pricing models using market inputs, as well as third party broker-dealers or counterparties, which are approved by the Board of Directors. Investments in money market funds are valued at their net asset value each day.
Securities for which market quotations are not readily available (including restricted securities) or are deemed unreliable are valued at fair value. Factors considered in making this determination may include, but are not limited to, information obtained by contacting the issuer, analysts, analysis of the issuer’s financial statements or other available documents. In addition, the Portfolio may use fair value pricing for securities primarily traded in non-U.S. markets because most foreign markets close well before the Portfolio values its securities at
| ALLIANCEBERNSTEIN BOND FUND INTERMEDIATE BOND PORTFOLIO • | 33 |
Notes to Financial Statements
4:00 p.m., Eastern Time. The earlier close of these foreign markets gives rise to the possibility that significant events, including broad market moves, may have occurred in the interim and may materially affect the value of those securities.
2. Fair Value Measurements
In accordance with U.S. GAAP regarding fair value measurements, fair value is defined as the price that the Portfolio would receive to sell an asset or pay to transfer a liability in an orderly transaction between market participants at the measurement date. The U.S. GAAP disclosure requirements establish a framework for measuring fair value, and a three-level hierarchy for fair value measurements based upon the transparency of inputs to the valuation of an asset or liability. Inputs may be observable or unobservable and refer broadly to the assumptions that market participants would use in pricing the asset or liability. Observable inputs reflect the assumptions market participants would use in pricing the asset or liability based on market data obtained from sources independent of the Portfolio. Unobservable inputs reflect the Portfolio’s own assumptions about the assumptions that market participants would use in pricing the asset or liability based on the best information available in the circumstances. Each investment is assigned a level based upon the observability of the inputs which are significant to the overall valuation. The three-tier hierarchy of inputs is summarized below.
| • | Level 1—quoted prices in active markets for identical investments |
| • | Level 2—other significant observable inputs (including quoted prices for similar investments, interest rates, prepayment speeds, credit risk, etc.) |
| • | Level 3—significant unobservable inputs (including the Portfolio’s own assumptions in determining the fair value of investments) |
| 34 | • ALLIANCEBERNSTEIN BOND FUND INTERMEDIATE BOND PORTFOLIO |
Notes to Financial Statements
The following table summarizes the valuation of the Portfolio’s investments by the above fair value hierarchy levels as of October 31, 2011:
Investments in Securities: | Level 1 | Level 2 | Level 3 | Total | ||||||||||||
Assets: | ||||||||||||||||
Governments – Treasuries | $ | – 0 | – | $ | 137,235,236 | $ | – 0 | – | $ | 137,235,236 | ||||||
Mortgage Pass-Through’s | – 0 | – | 133,902,822 | – 0 | – | 133,902,822 | ||||||||||
Corporates – Investment Grades | – 0 | – | 113,490,366 | – 0 | – | 113,490,366 | ||||||||||
Agencies | – 0 | – | 46,275,211 | – 0 | – | 46,275,211 | ||||||||||
Commercial Mortgage-Backed Securities | – 0 | – | 11,941,953 | 4,358,584 | 16,300,537 | |||||||||||
Asset-Backed Securities | – 0 | – | 11,039,524 | 3,595,821 | 14,635,345 | |||||||||||
Inflation-Linked Securities | – 0 | – | 8,149,428 | – 0 | – | 8,149,428 | ||||||||||
Collateralized Mortgage Obligations | – 0 | – | 248,774 | 5,968,446 | 6,217,220 | |||||||||||
Quasi-Sovereigns | – 0 | – | 4,265,940 | – 0 | – | 4,265,940 | ||||||||||
Corporates – Non-Investment Grades | – 0 | – | 4,145,208 | – 0 | – | 4,145,208 | ||||||||||
Supranationals | – 0 | – | 4,052,074 | – 0 | – | 4,052,074 | ||||||||||
Governments – Sovereign Agencies | – 0 | – | 2,810,338 | – 0 | – | 2,810,338 | ||||||||||
Local Governments – Municipal Bonds | – 0 | – | 1,659,360 | – 0 | – | 1,659,360 | ||||||||||
Bank Loans | – 0 | – | – 0 | – | 1,307,813 | 1,307,813 | ||||||||||
Preferred Stocks | 588,570 | – 0 | – | – 0 | – | 588,570 | ||||||||||
Short-Term Investments | 80,830,161 | – 0 | – | – 0 | – | 80,830,161 | ||||||||||
|
|
|
|
|
|
|
| |||||||||
Total Investments in Securities | 81,418,731 | 479,216,234 | 15,230,664 | 575,865,629 | ||||||||||||
Other Financial Instruments* : | ||||||||||||||||
Assets: | ||||||||||||||||
Forward Currency Exchange Contracts | – 0 | – | 103,719 | – 0 | – | 103,719 | ||||||||||
Liabilities: | ||||||||||||||||
Forward Currency Exchange Contracts | – 0 | – | (266,707 | ) | – 0 | – | (266,707 | ) | ||||||||
Credit Default Swap Contracts | – 0 | – | (868,927 | ) | – 0 | – | (868,927 | ) | ||||||||
|
|
|
|
|
|
|
| |||||||||
Total | $ | 81,418,731 | $ | 478,184,319 | $ | 15,230,664 | $ | 574,833,714 | ||||||||
|
|
|
|
|
|
|
| |||||||||
| * | Other financial instruments are derivative instruments, such as futures, forwards and swap contracts, which are valued at the unrealized appreciation/depreciation on the instrument. |
| ALLIANCEBERNSTEIN BOND FUND INTERMEDIATE BOND PORTFOLIO • | 35 |
Notes to Financial Statements
Following is a reconciliation of investments in which significant unobservable inputs (Level 3) were used in determining fair value. The transfers between levels of the fair value hierarchy assumes the financial instrument was transferred at the beginning of the reporting period.
| Commercial Mortgage- Backed Securities | Corporates - Non-Investment Grades | Bank Loans | ||||||||||
Balance as of 10/31/10 | $ | 17,478,935 | $ | 2,488,011 | $ | 11,156,610 | ||||||
Accrued discounts/(premiums) | 97,853 | 558 | 143,110 | |||||||||
Realized gain (loss) | 867,540 | 7,537 | (85,029 | ) | ||||||||
Change in unrealized appreciation/depreciation | (1,170,761 | ) | (24,376 | ) | (149,920 | ) | ||||||
Purchases | 2,338,672 | – 0 | – | 1,345,078 | ||||||||
Sales | (15,253,655 | ) | (571,492 | ) | (11,102,036 | ) | ||||||
Transfers into Level 3 | – 0 | – | – 0 | – | – 0 | – | ||||||
Transfers out of Level 3 | – 0 | – | (1,900,238 | ) | – 0 | – | ||||||
|
|
|
|
|
| |||||||
Balance as of 10/30/11 | $ | 4,358,584 | $ | – 0 | – | $ | 1,307,813 | |||||
|
|
|
|
|
| |||||||
Net change in unrealized appreciation/depreciation from Investments held as of 10/30/11* | $ | (352,345 | ) | $ | – 0 | – | $ | (38,266 | ) | |||
|
|
|
|
|
| |||||||
| Collateralized Mortgage Obligations | Asset-Backed Securities | Total | ||||||||||
Balance as of 10/31/10 | $ | 8,659,846 | $ | 1,752,202 | $ | 41,535,604 | ||||||
Accrued discounts/(premiums) | (1,161 | ) | 201 | 240,561 | ||||||||
Realized gain (loss) | (923,200 | ) | (70,636 | ) | (203,788 | ) | ||||||
Change in unrealized appreciation/depreciation | 1,063,918 | 522,902 | 241,763 | |||||||||
Purchases | – 0 | – | 1,827,498 | 5,511,248 | ||||||||
Sales | (2,830,957 | ) | (436,346 | ) | (30,194,486 | ) | ||||||
Transfers into Level 3 | – 0 | – | – 0 | – | ||||||||
Transfers out of Level 3 | – 0 | – | – 0 | – | (1,900,238 | ) | ||||||
|
|
|
|
|
| |||||||
Balance as of 10/30/11 | $ | 5,968,446 | $ | 3,595,821 | $ | 15,230,664 | ||||||
|
|
|
|
|
| |||||||
Net change in unrealized appreciation/depreciation from Investments held as of 10/30/11* | $ | 321,499 | $ | 341,584 | $ | 272,472 | ||||||
|
|
|
|
|
| |||||||
| * | The unrealized appreciation/depreciation is included in net change in unrealized appreciation/depreciation of investments in the accompanying statement of operations. |
3. Currency Translation
Assets and liabilities denominated in foreign currencies and commitments under forward currency exchange contracts are translated into U.S. dollars at the mean of the quoted bid and asked prices of such currencies against the U.S. dollar. Purchases and sales of portfolio securities are translated into U.S. dollars at the rates of exchange prevailing when such securities were acquired or sold. Income and expenses are translated into U.S. dollars at rates of exchange prevailing when accrued.
| 36 | • ALLIANCEBERNSTEIN BOND FUND INTERMEDIATE BOND PORTFOLIO |
Notes to Financial Statements
Net realized gain or loss on foreign currency transactions represents foreign exchange gains and losses from sales and maturities of foreign fixed income investments, foreign currency exchange contracts, holding of foreign currencies, currency gains or losses realized between the trade and settlement dates on foreign investment transactions, and the difference between the amounts of dividends, interest and foreign withholding taxes recorded on the Portfolio’s books and the U.S. dollar equivalent amounts actually received or paid. Net unrealized currency gains and losses from valuing foreign currency denominated assets and liabilities at period end exchange rates are reflected as a component of net unrealized appreciation or depreciation of investments and foreign currency denominated assets and liabilities.
4. Taxes
It is the Portfolio’s policy to meet the requirements of the Internal Revenue Code applicable to regulated investment companies and to distribute all of its investment company taxable income and net realized gains, if any, to shareholders. Therefore, no provisions for federal income or excise taxes are required. The Portfolio may be subject to taxes imposed by countries in which it invests. Such taxes are generally based on income and/or capital gains earned or repatriated. Taxes are accrued and applied to net investment income, net realized gains and net unrealized appreciation/depreciation as such income and/or gains are earned.
In accordance with U.S. GAAP requirements regarding accounting for uncertainties in income taxes, management has analyzed the Portfolio’s tax positions taken or expected to be taken on federal and state income tax returns for all open tax years (the current and the prior three tax years) and has concluded that no provision for income tax is required in the Portfolio’s financial statements.
5. Investment Income and Investment Transactions
Dividend income is recorded on the ex-dividend date or as soon as the Portfolio is informed of the dividend. Interest income is accrued daily. Investment transactions are accounted for on the date the securities are purchased or sold. Investment gains or losses are determined on the identified cost basis. The Portfolio amortizes premiums and accretes discounts as adjustments to interest income.
6. Class Allocations
All income earned and expenses incurred by the Portfolio are borne on a pro-rata basis by each outstanding class of shares, based on the proportionate interest in the Portfolio represented by the net assets of such class, except for class specific expenses which are allocated to the respective class. Expenses of the Fund are charged to each Portfolio in proportion to net assets. Realized and unrealized gains and losses are allocated among the various share classes based on respective net assets.
| ALLIANCEBERNSTEIN BOND FUND INTERMEDIATE BOND PORTFOLIO • | 37 |
Notes to Financial Statements
7. Dividends and Distributions
Dividends and distributions to shareholders, if any, are recorded on the ex-dividend date. Income dividends and capital gains distributions are determined in accordance with federal tax regulations and may differ from those determined in accordance with U.S. GAAP. To the extent these differences are permanent, such amounts are reclassified within the capital accounts based on their federal tax basis treatment; temporary differences do not require such reclassification.
NOTE B
Advisory Fee and Other Transactions with Affiliates
Under the terms of the investment advisory agreement, the Portfolio pays the Adviser an advisory fee at an annual rate of .45% of the first $2.5 billion, .40% of the next $2.5 billion and .35% in excess of $5 billion, of the Portfolio’s average daily net assets. The Adviser has agreed to waive its fees and bear certain expenses to the extent necessary to limit total operating expenses on an annual basis to .85%, 1.55%, 1.55%, .55%, 1.05%, .80% and .55% of the daily average net assets for the Class A, Class B, Class C, Advisor Class, Class R, Class K and Class I shares, respectively. This waiver extends through January 31, 2012 and then may be extended by the Adviser for additional one year terms. For the year ended October 31, 2011, such reimbursement amounted to $829,500.
Pursuant to the investment advisory agreement, the Portfolio may reimburse the Adviser for certain legal and accounting services provided to the Portfolio by the Adviser. For the year ended October 31, 2011, such fee amounted to $66,498.
The Portfolio compensates AllianceBernstein Investor Services, Inc. (“ABIS”), a wholly-owned subsidiary of the Adviser, under a Transfer Agency Agreement for providing personnel and facilities to perform transfer agency services for the Portfolio. ABIS may make payments to intermediaries that provide omnibus account services, sub-accounting services and/or networking services. Such compensation retained by ABIS amounted to $500,201 for the year ended October 31, 2011.
AllianceBernstein Investments, Inc. (the “Distributor”), a wholly-owned subsidiary of the Adviser, serves as the distributor of the Portfolio’s shares. The Distributor has advised the Portfolio that it has retained front-end sales charges of $10,684 from the sale of Class A shares and received $4,601, $9,180 and $5,329 in contingent deferred sales charges imposed upon redemptions by shareholders of Class A, Class B and Class C shares, respectively, for the year ended October 31, 2011.
The Portfolio may invest in the AllianceBernstein Fixed-Income Shares, Inc. – Government STIF Portfolio (“Government STIF Portfolio”), an open-end management investment company managed by the Adviser. The Government STIF Portfolio is offered as a cash management option to mutual funds and
| 38 | • ALLIANCEBERNSTEIN BOND FUND INTERMEDIATE BOND PORTFOLIO |
Notes to Financial Statements
other institutional accounts of the Adviser, and is not available for direct purchase by members of the public. The Government STIF Portfolio pays no investment management fees but does bear its own expenses. A summary of the Portfolio’s transactions in shares of the Government STIF Portfolio for the year ended October 31, 2011 is as follows:
Market Value October 31, 2010 (000) | Purchases at Cost (000) | Sales Proceeds (000) | Market Value October 31, 2011 (000) | Dividend Income (000) | ||||||||||||||
| $ | 51,510 | $ | 274,271 | $ | 244,951 | $ | 80,830 | $ | 33 | |||||||||
Brokerage commissions paid on investment transactions for the year ended October 31, 2011 amounted to $1,773, of which $0 and $0, respectively, was paid to Sanford C. Bernstein & Co. LLC and Sanford C. Bernstein Limited, affiliates of the Adviser.
NOTE C
Distribution Services Agreement
The Portfolio has adopted a Distribution Services Agreement (the “Agreement”) pursuant to Rule 12b-1 under the Investment Company Act of 1940. Under the Agreement, the Portfolio pays distribution and servicing fees to the Distributor at an annual rate of up to .30% of the Portfolio’s average daily net assets attributable to Class A shares, 1% of the Portfolio’s average daily net assets attributable to both Class B and Class C shares, .50% of the Portfolio’s average daily net assets attributable to Class R shares and .25% of the Portfolio’s average daily net assets attributable to Class K shares. There are no distribution and servicing fees on the Advisor Class and Class I shares. The fees are accrued daily and paid monthly. The Agreement provides that the Distributor will use such payments in their entirety for distribution assistance and promotional activities. Since the commencement of the Portfolio’s operations, the Distributor has incurred expenses in excess of the distribution costs reimbursed by the Portfolio in the amounts of $0, $839,503, $89,990 and $34,890 for Class B, Class C, Class R and Class K shares, respectively. While such costs may be recovered from the Portfolio in future periods so long as the Agreement is in effect, the rate of the distribution and servicing fees payable under the Agreement may not be increased without a shareholder vote. In accordance with the Agreement, there is no provision for recovery of unreimbursed distribution costs incurred by the Distributor beyond the current fiscal year for Class A shares. The Agreement also provides that the Adviser may use its own resources to finance the distribution of the Portfolio’s shares.
| ALLIANCEBERNSTEIN BOND FUND INTERMEDIATE BOND PORTFOLIO • | 39 |
Notes to Financial Statements
NOTE D
Investment Transactions
Purchases and sales of investment securities (excluding short-term investments) for the year ended October 31, 2011 were as follows:
| Purchases | Sales | |||||||
Investment securities (excluding | $ | 95,153,294 | $ | 214,539,202 | ||||
U.S. government securities | 515,487,583 | 435,295,901 | ||||||
The cost of investments for federal income tax purposes, gross unrealized appreciation and unrealized depreciation (excluding futures, foreign currency and swap transactions) are as follows:
Cost | $ | 559,138,390 | ||
|
| |||
Gross unrealized appreciation | $ | 26,779,399 | ||
Gross unrealized depreciation | (10,052,160 | ) | ||
|
| |||
Net unrealized appreciation | $ | 16,727,239 | ||
|
|
1. Derivative Financial Instruments
The Portfolio may use derivatives to earn income and enhance returns, to hedge or adjust the risk profile of its portfolio, to replace more traditional direct investments, or to obtain exposure to otherwise inaccessible markets.
The principal types of derivatives utilized by the Portfolio, as well as the methods in which they may be used are:
| • | Futures Contracts |
The Portfolio may buy or sell futures contracts for the purpose of hedging its portfolio against adverse effects of anticipated movements in the market or for investment purposes. The Portfolio bears the market risk that arises from changes in the value of these instruments and the imperfect correlation between movements in the price of the futures contracts and movements in the price of the securities hedged or used for cover. The Portfolio may also purchase or sell futures contracts for foreign currencies or options thereon for non-hedging purposes as a means of making direct investment in foreign currencies, as described below under “Currency Transactions”.
At the time the Portfolio enters into a futures contract, the Portfolio deposits and maintains as collateral an initial margin with the broker, as required by the exchange on which the transaction is effected. Pursuant to the contract, the Portfolio agrees to receive from or pay to the broker an amount of cash equal to the daily fluctuation in the value of the contract. Such receipts or payments are known as variation margin and are recorded by the Portfolio as unrealized gains or losses. Risks may arise from the potential inability of a counterparty to meet the terms of the contract. The
| 40 | • ALLIANCEBERNSTEIN BOND FUND INTERMEDIATE BOND PORTFOLIO |
Notes to Financial Statements
credit/counterparty risk for exchange-traded futures contracts is generally less than privately negotiated futures contracts, since the clearinghouse, which is the issuer or counterparty to each exchange-traded future, provides a guarantee of performance. This guarantee is supported by a daily payment system (i.e., margin requirements). When the contract is closed, the Portfolio records a realized gain or loss equal to the difference between the value of the contract at the time it was opened and the time it was closed.
Use of long futures contracts subjects the Portfolio to risk of loss in excess of the amounts shown on the statement of assets and liabilities, up to the notional value of the futures contracts. Use of short futures contracts subjects the Portfolio to unlimited risk of loss. Under some circumstances, futures exchanges may establish daily limits on the amount that the price of a futures contract can vary from the previous day’s settlement price, which could effectively prevent liquidation of unfavorable positions.
During the year ended October 31, 2011, the Portfolio held futures contracts for hedging and non-hedging purposes.
| • | Forward Currency Exchange Contracts |
The Portfolio may enter into forward currency exchange contracts in order to hedge its exposure to changes in foreign currency exchange rates on its foreign portfolio holdings, to hedge certain firm purchase and sale commitments denominated in foreign currencies and for non-hedging purposes as a means of making direct investments in foreign currencies, as described below under “Currency Transactions”.
A forward currency exchange contract is a commitment to purchase or sell a foreign currency at a future date at a negotiated forward rate. The gain or loss arising from the difference between the original contract and the closing of such contract would be included in net realized gain or loss on foreign currency transactions. Fluctuations in the value of open forward currency exchange contracts are recorded for financial reporting purposes as unrealized appreciation and/or depreciation by the Portfolio. Risks may arise from the potential inability of a counterparty to meet the terms of a contract and from unanticipated movements in the value of a foreign currency relative to the U.S. dollar. The face or contract amount, in U.S. dollars reflects the total exposure the Portfolio has in that particular currency contract.
During the year ended October 31, 2011, the Portfolio held forward currency exchange contracts for hedging and non-hedging purposes.
| • | Swap Agreements |
The Portfolio may enter into swaps to hedge its exposure to interest rates, credit risk, or currencies. The Portfolio may also enter into swaps for non-hedging purposes as a means of gaining market exposures including
| ALLIANCEBERNSTEIN BOND FUND INTERMEDIATE BOND PORTFOLIO • | 41 |
Notes to Financial Statements
by making direct investments in foreign currencies, as described below under “Currency Transactions”. A swap is an agreement that obligates two parties to exchange a series of cash flows at specified intervals based upon or calculated by reference to changes in specified prices or rates for a specified amount of an underlying asset. The payment flows are usually netted against each other, with the difference being paid by one party to the other. In addition, collateral may be pledged or received by the Portfolio in accordance with the terms of the respective swap agreements to provide value and recourse to the Portfolio or its counterparties in the event of default, bankruptcy or insolvency by one of the parties to the swap agreement.
Risks may arise as a result of the failure of the counterparty to the swap contract to comply with the terms of the swap contract. The loss incurred by the failure of a counterparty is generally limited to the net interim payment to be received by the Portfolio, and/or the termination value at the end of the contract. Therefore, the Portfolio considers the creditworthiness of each counterparty to a swap contract in evaluating potential counterparty risk. This risk is mitigated by having a netting arrangement between the Portfolio and the counterparty and by the posting of collateral by the counterparty to the Portfolio to cover the Portfolio exposure to the counterparty. Additionally, risks may arise from unanticipated movements in interest rates or in the value of the underlying securities. The Portfolio accrues for the interim payments on swap contracts on a daily basis, with the net amount recorded within unrealized appreciation/depreciation of swap contracts on the statement of assets and liabilities, where applicable. Once the interim payments are settled in cash, the net amount is recorded as realized gain/(loss) on swaps on the statement of operations, in addition to any realized gain/(loss) recorded upon the termination of swap contracts. Fluctuations in the value of swap contracts are recorded as a component of net change in unrealized appreciation/depreciation of swap contracts on the statement of operations.
Interest Rate Swaps:
The Portfolio is subject to interest rate risk exposure in the normal course of pursuing its investment objectives. Because the Portfolio holds fixed rate bonds, the value of these bonds may decrease if interest rates rise. To help hedge against this risk and to maintain its ability to generate income at prevailing market rates, the Portfolio may enter into interest rate swap contracts. Interest rate swaps are agreements between two parties to exchange cash flows based on a notional amount. The Portfolio may elect to pay a fixed rate and receive a floating rate, or, receive a fixed rate and pay a floating rate on a notional amount.
In addition, the Portfolio may also enter into interest rate swap transactions to preserve a return or spread on a particular investment or
| 42 | • ALLIANCEBERNSTEIN BOND FUND INTERMEDIATE BOND PORTFOLIO |
Notes to Financial Statements
portion of its portfolio, or protecting against an increase in the price of securities the Portfolio anticipates purchasing at a later date. Interest rate swaps involve the exchange by a Portfolio with another party of their respective commitments to pay or receive interest (e.g., an exchange of floating rate payments for fixed rate payments) computed based on a contractually-based principal (or “notional”) amount. Interest rate swaps are entered into on a net basis (i.e., the two payment streams are netted out, with the Portfolio receiving or paying, as the case may be, only the net amount of the two payments).
During the year ended October 31, 2011, the Portfolio held interest rate swap contracts for hedging and non-hedging purposes.
Credit Default Swaps:
The Portfolio may enter into credit default swaps, including to manage its exposure to the market or certain sectors of the market, to reduce its risk exposure to defaults by corporate and sovereign issuers held by the Portfolio, or to create exposure to corporate or sovereign issuers to which it is not otherwise exposed. The Portfolio may purchase credit protection (“Buy Contract”) or provide credit protection (“Sale Contract”) on the referenced obligation of the credit default swap. During the term of the swap agreement, the Portfolio receives/(pays) fixed payments from/(to) the respective counterparty, calculated at the agreed upon rate applied to the notional amount. The accrual for these interim payments is recorded within unrealized appreciation/depreciation of swap contracts on the statement of assets and liabilities. Upfront premiums paid or received in connection with credit default swap contracts are recognized as cost or proceeds on the statement of assets and liabilities and are amortized on a straight line basis over the life of the contract. Amortized upfront premiums are included in net realized gain/(loss) from swaps on the statement of operations. If the Portfolio is a buyer/(seller) of protection and a credit event occurs, as defined under the terms of the swap agreement, the Portfolio will either (i) receive from the seller/(pay to the buyer) of protection an amount equal to the notional amount of the swap contract (the “Maximum Payout Amount”) and deliver/(take delivery of) the referenced obligation or (ii) receive/(pay) a net settlement amount in the form of cash or securities equal to the notional amount of the swap less the recovery value of the referenced obligation.
Credit default swaps may involve greater risks than if a Portfolio had invested in the referenced obligation directly. Credit default swaps are subject to general market risk, liquidity risk, counterparty risk and credit risk. If the Portfolio is a buyer of protection and no credit event occurs, it will lose the payments it made to its counterparty. If the Portfolio is a seller of protection and a credit event occurs, the value of the referenced obligation received by the Portfolio coupled with the periodic payments previously received, may be less than the Maximum Payout Amount it pays
| ALLIANCEBERNSTEIN BOND FUND INTERMEDIATE BOND PORTFOLIO • | 43 |
Notes to Financial Statements
to the buyer, resulting in a net loss to the Portfolio.
During the year ended October 31, 2011, the Portfolio held credit default swap contracts for hedging purposes.
Implied credit spreads utilized in determining the market value of credit default swaps on issuers as of period end are disclosed in the portfolio of investments. The implied spreads serve as an indicator of the current status of the payment/performance risk and typically reflect the likelihood of default by the issuer of the referenced obligation. The implied credit spread of a particular reference obligation also reflects the cost of buying/selling protection and may reflect upfront payments required to be made to enter into the agreement. Widening credit spreads typically represent a deterioration of the referenced obligation’s credit soundness and greater likelihood of default or other credit event occurring as defined under the terms of the agreement. A credit spread identified as “Defaulted” indicates a credit event has occurred for the referenced obligation.
Documentation governing the Portfolio’s swap transactions may contain provisions for early termination of a swap in the event the net assets of the Portfolio decline below specific levels set forth in the documentation (“net asset contingent features”). If these levels are triggered, the Portfolio’s counterparty has the right to terminate the swap and require the Portfolio to pay or receive a settlement amount in connection with the terminated swap transaction. As of October 31, 2011, the Portfolio had credit default swap contracts in liability positions with net asset contingent features. The fair value of such contracts amounted to $868,927 at October 31, 2011.
At October 31, 2011, the Portfolio had entered into the following derivatives:
Asset Derivatives | Liability Derivatives | |||||||||||
Derivative Type | Statement of | Fair Value | Statement of | Fair Value | ||||||||
Foreign exchange contracts | Unrealized appreciation of forward currency exchange contracts | $ | 103,719 | | Unrealized depreciation of forward currency exchange contracts | $ | 266,707 | | ||||
Credit contracts | Unrealized depreciation on credit default swap contracts | 868,927 | ||||||||||
|
|
|
| |||||||||
Total | $ | 103,719 | $ | 1,135,634 | ||||||||
|
|
|
| |||||||||
The effect of derivative instruments on the statement of operations for the year ended October 31, 2011:
| 44 | • ALLIANCEBERNSTEIN BOND FUND INTERMEDIATE BOND PORTFOLIO |
Notes to Financial Statements
Derivative Type | Location of Gain | Realized Gain or (Loss) on Derivatives | Change in Unrealized Appreciation or (Depreciation) | |||||||
Foreign exchange contracts | Net realized gain (loss) on foreign currency transactions; Net change in unrealized appreciation/depreciation of foreign currency denominated assets and liabilities and other assets | $ | 1,251,068 | $ | (218,788 | ) | ||||
Credit contracts | Net realized gain (loss) on swap contracts; Net change in unrealized appreciation/depreciation of swap contracts | 311,566 | (868,927 | ) | ||||||
Interest rate contracts | Net realized gain (loss) on swap contracts; Net change in unrealized appreciation/depreciation of swap contracts | (333,828 | ) | – 0 | – | |||||
Interest rate contracts | Net realized gain (loss) on futures contracts; Net change in unrealized appreciation/depreciation of futures contracts | 20,587 | (145,998 | ) | ||||||
|
|
|
| |||||||
Total | $ | 1,249,393 | $ | (1,233,713 | ) | |||||
|
|
|
| |||||||
For the year ended October 31, 2011, the average monthly principal amount of foreign exchange contracts was $69,067,979. For seven months of the year, the average monthly notional amount of interest rate swaps was $32,990,000. For five months of the year, the average monthly original value of futures contracts was $34,137,899 and the average monthly notional amount of credit default swaps was $24,487,019.
2. Currency Transactions
The Portfolio may invest in non-U.S. Dollar securities on a currency hedged or unhedged basis. The Portfolio may seek investment opportunities by taking long or short positions in currencies through the use of currency-related derivatives, including forward currency exchange contracts, futures and options on futures, swaps, and other options. The Portfolio may enter into transactions for investment opportunities when it anticipates that a foreign currency will appreciate or depreciate in value but securities denominated in that currency are not held by the Portfolio and do not present attractive investment opportunities. Such transactions may also be used when the Adviser believes that it may be more efficient than a direct investment in a foreign currency-denominated security. The
| ALLIANCEBERNSTEIN BOND FUND INTERMEDIATE BOND PORTFOLIO • | 45 |
Notes to Financial Statements
Portfolio may also conduct currency exchange contracts on a spot basis (i.e., for cash at the spot rate prevailing in the currency exchange market for buying or selling currencies).
3. Dollar Rolls
The Portfolio may enter into dollar rolls. Dollar rolls involve sales by the Portfolio of securities for delivery in the current month and the Portfolio’s simultaneously contracting to repurchase substantially similar (same type and coupon) securities on a specified future date. During the roll period, the Portfolio forgoes principal and interest paid on the securities. The Portfolio is compensated by the difference between the current sales price and the lower forward price for the future purchase (often referred to as the “drop”) as well as by the interest earned on the cash proceeds of the initial sale. Dollar rolls involve the risk that the market value of the securities the Portfolio is obligated to repurchase under the agreement may decline below the repurchase price. Dollar rolls are speculative techniques and may be considered to be borrowings by the Portfolio. For the year ended October 31, 2011, the Portfolio earned drop income of $230,240 which is included in interest income in the accompanying statement of operations.
4. Reverse Repurchase Agreements
Under a reverse repurchase agreement, the Portfolio sells securities and agrees to repurchase them at a mutually agreed upon date and price. At the time the Portfolio enters into a reverse repurchase agreement, it will establish a segregated account with the custodian containing liquid assets having a value at least equal to the repurchase price. For the year ended October 31, 2011, the average amount of reverse repurchase agreements outstanding was $112,685 and the daily weighted average interest rate was (0.49)%. During the period, the Portfolio received net interest payment from counterparties.
NOTE E
Capital Stock
Each class consists of 3,000,000,000 authorized shares. Transactions in capital shares for each class were as follows:
| Shares | Amount | |||||||||||||||||||
| Year Ended October 31, 2011 | Year Ended October 31, 2010 | Year Ended October 31, 2011 | Year Ended October 31, 2010 | |||||||||||||||||
|
| |||||||||||||||||||
| Class A | ||||||||||||||||||||
Shares sold | 2,899,019 | 3,783,872 | $ | 31,699,852 | $ | 40,097,894 | ||||||||||||||
| ||||||||||||||||||||
Shares issued in reinvestment of dividends | 899,313 | 1,117,653 | 9,793,717 | 11,805,318 | ||||||||||||||||
| ||||||||||||||||||||
Shares converted from Class B | 312,840 | 554,999 | 3,401,345 | 5,874,476 | ||||||||||||||||
| ||||||||||||||||||||
Shares redeemed | (7,606,304 | ) | (8,189,358 | ) | (82,758,220 | ) | (86,447,781 | ) | ||||||||||||
| ||||||||||||||||||||
Net decrease | (3,495,132 | ) | (2,732,834 | ) | $ | (37,863,306 | ) | $ | (28,670,093 | ) | ||||||||||
| ||||||||||||||||||||
| 46 | • ALLIANCEBERNSTEIN BOND FUND INTERMEDIATE BOND PORTFOLIO |
Notes to Financial Statements
| Shares | Amount | |||||||||||||||||||
| Year Ended October 31, 2011 | Year Ended October 31, 2010 | Year Ended October 31, 2011 | Year Ended October 31, 2010 | |||||||||||||||||
|
|
|
|
|
|
|
|
| ||||||||||||
| Class B | ||||||||||||||||||||
Shares sold | 164,104 | 333,372 | $ | 1,790,665 | $ | 3,532,916 | ||||||||||||||
| ||||||||||||||||||||
Shares issued in reinvestment of dividends | 30,903 | 51,669 | 336,321 | 544,881 | ||||||||||||||||
| ||||||||||||||||||||
Shares converted to Class A | (312,754 | ) | (554,999 | ) | (3,401,345 | ) | (5,874,476 | ) | ||||||||||||
| ||||||||||||||||||||
Shares redeemed | (337,887 | ) | (492,541 | ) | (3,675,573 | ) | (5,203,968 | ) | ||||||||||||
| ||||||||||||||||||||
Net decrease | (455,634 | ) | (662,499 | ) | $ | (4,949,932 | ) | $ | (7,000,647 | ) | ||||||||||
| ||||||||||||||||||||
| Class C | ||||||||||||||||||||
Shares sold | 916,125 | 1,138,306 | $ | 10,028,746 | $ | 12,010,339 | ||||||||||||||
| ||||||||||||||||||||
Shares issued in reinvestment of dividends | 117,553 | 151,425 | 1,277,698 | 1,596,358 | ||||||||||||||||
| ||||||||||||||||||||
Shares redeemed | (1,465,825 | ) | (1,225,089 | ) | (15,896,017 | ) | (12,934,810 | ) | ||||||||||||
| ||||||||||||||||||||
Net increase (decrease) | (432,147 | ) | 64,642 | $ | (4,589,573 | ) | $ | 671,887 | ||||||||||||
| ||||||||||||||||||||
| Advisor Class | ||||||||||||||||||||
Shares sold | 2,072,355 | 2,657,378 | $ | 22,795,526 | $ | 28,172,205 | ||||||||||||||
| ||||||||||||||||||||
Shares issued in reinvestment of dividends | 279,117 | 292,328 | 3,040,775 | 3,095,448 | ||||||||||||||||
| ||||||||||||||||||||
Shares redeemed | (2,536,553 | ) | (825,457 | ) | (27,472,513 | ) | (8,719,645 | ) | ||||||||||||
| ||||||||||||||||||||
Net increase (decrease) | (185,081 | ) | 2,124,249 | $ | (1,636,212 | ) | $ | 22,548,008 | ||||||||||||
| ||||||||||||||||||||
| Class R | ||||||||||||||||||||
Shares sold | 70,380 | 66,211 | $ | 765,280 | $ | 707,789 | ||||||||||||||
| ||||||||||||||||||||
Shares issued in reinvestment of dividends | 2,588 | 1,288 | 28,234 | 13,722 | ||||||||||||||||
| ||||||||||||||||||||
Shares redeemed | (36,220 | ) | (13,641 | ) | (392,662 | ) | (144,888 | ) | ||||||||||||
| ||||||||||||||||||||
Net increase | 36,748 | 53,858 | $ | 400,852 | $ | 576,623 | ||||||||||||||
| ||||||||||||||||||||
| Class K | ||||||||||||||||||||
Shares sold | 138,633 | 83,823 | $ | 1,506,114 | $ | 882,061 | ||||||||||||||
| ||||||||||||||||||||
Shares issued in reinvestment of dividends | 12,302 | 17,010 | 134,067 | 179,761 | ||||||||||||||||
| ||||||||||||||||||||
Shares redeemed | (287,844 | ) | (135,292 | ) | (3,139,003 | ) | (1,430,861 | ) | ||||||||||||
| ||||||||||||||||||||
Net decrease | (136,909 | ) | (34,459 | ) | $ | (1,498,822 | ) | $ | (369,039 | ) | ||||||||||
| ||||||||||||||||||||
| ALLIANCEBERNSTEIN BOND FUND INTERMEDIATE BOND PORTFOLIO • | 47 |
Notes to Financial Statements
| Shares | Amount | |||||||||||||||||||
| Year Ended October 31, 2011 | Year Ended October 31, 2010 | Year Ended October 31, 2011 | Year Ended October 31, 2010 | |||||||||||||||||
|
|
|
|
|
|
|
|
| ||||||||||||
| Class I | ||||||||||||||||||||
Shares sold | 13,178 | 36,758 | $ | 144,328 | $ | 400,172 | ||||||||||||||
| ||||||||||||||||||||
Shares issued in reinvestment of dividends | 3,809 | 7,135 | 41,484 | 74,723 | ||||||||||||||||
| ||||||||||||||||||||
Shares redeemed | (74,830 | ) | (416,635 | ) | (820,289 | ) | (4,270,859 | ) | ||||||||||||
| ||||||||||||||||||||
Net decrease | (57,843 | ) | (372,742 | ) | $ | (634,477 | ) | $ | (3,795,964 | ) | ||||||||||
| ||||||||||||||||||||
For the year ended October 31, 2010, the Portfolio received $168,359 related to a third-party’s settlement of regulatory proceedings involving allegations of improper trading. This amount is presented in the Portfolio’s statement of changes in net assets. Neither the Portfolio nor its affiliates were involved in the proceedings or the calculation of the payment.
NOTE F
Risks Involved in Investing in the Portfolio
Interest Rate Risk and Credit Risk—Interest rate risk is the risk that changes in interest rates will affect the value of the Portfolio’s investments in fixed-income debt securities such as bonds or notes. Increases in interest rates may cause the value of the Portfolio’s investments to decline. Credit risk is the risk that the issuer or guarantor of a debt security, or the counterparty to a derivative contract, will be unable or unwilling to make timely principal and/or interest payments, or to otherwise honor its obligations. The degree of risk for a particular security may be reflected in its credit risk rating. Credit risk is greater for medium quality and lower-rated securities. Lower-rated debt securities and similar unrated securities (commonly known as “junk bonds”) have speculative elements or are predominantly speculative risks.
Prior to September 15, 2008, the Portfolio had swap counterparty exposure to Lehman Brothers Holdings Inc. (“Lehman Brothers”), as a guarantor for Lehman Brothers Special Financing Inc. (“LBSF”), which filed for bankruptcy on September 15, 2008. As a result, on September 15, 2008, the Portfolio terminated all outstanding swap contracts with LBSF prior to their scheduled maturity dates in accordance with the terms of the swap agreements. Upon the termination of the swap contracts, Lehman Brothers’ obligations to the Portfolio amounted to $743,058. The Portfolio’s claim to these obligations is subject to the pending bankruptcy proceeding against the Lehman Brothers estate (the “Bankruptcy Claim”). As of October 31, 2011, the Bankruptcy Claim, based upon the estimated recovery value, was being valued at $310,598 (41.80% of the Bankruptcy Claim). The estimated recovery value may change over time. The Adviser has agreed to make the Portfolio whole in respect of the amount of the recovery that would be paid on the Bankruptcy Claim in the event the Bankruptcy Claim is not honored by the Lehman Brothers estate, or with respect to
| 48 | • ALLIANCEBERNSTEIN BOND FUND INTERMEDIATE BOND PORTFOLIO |
Notes to Financial Statements
any diminution in value upon the sale of the Bankruptcy Claim, in either case resulting from the manner in which the Bankruptcy Claim was processed by the Adviser.
Foreign Securities Risk—Investing in securities of foreign companies or foreign governments involve special risks which include changes in foreign currency exchange rates and the possibility of future political and economic developments which could adversely affect the value of such securities. Moreover, securities of many foreign companies or foreign governments and their markets may be less liquid and their prices more volatile than those of comparable U.S. companies or of the U.S. government.
Currency Risk—This is the risk that changes in foreign currency exchange rates may negatively affect the value of the Portfolio’s investments or reduce the returns of the Portfolio. For example, the value of the Portfolio’s investments in foreign currency-denominated securities or currencies may decrease if the U.S. Dollar is strong (i.e., gaining value relative to other currencies) and other currencies are weak (i.e., losing value relative to the U.S. Dollar). Currency markets are generally not as regulated as securities markets. Independent of the Portfolio’s investments denominated in foreign currencies, the Portfolio’s positions in various foreign currencies may cause the Portfolio to experience investment losses due to the changes in exchange rates and interest rates.
Derivatives Risk—The Portfolio may enter into derivative transactions such as forwards, options, futures and swaps. Derivatives may be illiquid, difficult to price, and leveraged so that small changes may produce disproportionate losses for the Portfolio, and subject to counterparty risk to a greater degree than more traditional investments. Derivatives may result in significant losses, including losses that are far greater than the value of the derivatives reflected in the statement of assets and liabilities.
Leverage Risk—When the Portfolio borrows money or otherwise leverages its portfolio, it may be volatile because leverage tends to exaggerate the effect of any increase or decrease in the value of the Portfolio’s investments. The Portfolio may create leverage through the use of reverse repurchase arrangements, forward currency exchange contracts, forward commitments, dollar rolls or futures contracts or by borrowing money. The use of derivative instruments by the Portfolio, such as forwards, futures, options and swaps, may also result in a form of leverage. Leverage may result in higher returns to the Portfolio than if the Portfolio were not leveraged, but may also adversely affect returns, particularly if the market is declining.
Indemnification Risk—In the ordinary course of business, the Portfolio enters into contracts that contain a variety of indemnifications. The Portfolio’s maximum exposure under these arrangements is unknown. However, the Portfolio has not had prior claims or losses pursuant to these indemnification provisions
| ALLIANCEBERNSTEIN BOND FUND INTERMEDIATE BOND PORTFOLIO • | 49 |
Notes to Financial Statements
and expects the risk of loss thereunder to be remote. Therefore, the Portfolio has not accrued any liability in connection with these indemnification provisions.
NOTE G
Joint Credit Facility
A number of open-end mutual funds managed by the Adviser, including the Portfolio, participate in a $140 million revolving credit facility (the “Facility”) intended to provide short-term financing, if necessary, subject to certain restrictions in connection with abnormal redemption activity. Commitment fees related to the Facility are paid by the participating funds and are included in miscellaneous expenses in the statement of operations. The Portfolio did not utilize the Facility during the year ended October 31, 2011.
NOTE H
Distributions to Shareholders
The tax character of distributions paid during the fiscal years ended October 31, 2011 and October 31, 2010 were as follows:
| 2011 | 2010 | |||||||
Distributions paid from: | ||||||||
Ordinary income | $ | 18,993,473 | $ | 22,749,934 | ||||
|
|
|
| |||||
Total taxable distributions | 18,993,473 | 22,749,934 | ||||||
|
|
|
| |||||
Total distributions paid | $ | 18,993,473 | $ | 22,749,934 | ||||
|
|
|
| |||||
As of October 31, 2011, the components of accumulated earnings/(deficit) on a tax basis were as follows:
Undistributed ordinary income | $ | 3,723,665 | ||
Accumulated capital and other losses | (62,251,380 | )(a) | ||
Unrealized appreciation/(depreciation) | 16,915,531 | (b) | ||
|
| |||
Total accumulated earnings/(deficit) | $ | (41,612,184 | )(c) | |
|
|
| (a) | On October 31, 2011, the Portfolio had a net capital loss carryforward for federal income tax purposes of $62,180,522 (of which approximately $58,874,284 was attributable to the purchase of net assets of AllianceBernstein Bond Fund -U.S. Government Portfolio) of which $17,593,762 expires in the year 2012, $12,682,229 expires in the year 2013, $19,419,566 expires in the year 2014, and $12,484,965 expires in the year 2015. To the extent future capital gains are offset by capital loss carryforwards, such gains will not be distributed. During the fiscal year, the Portfolio utilized capital loss carryforwards of $10,141,161. As a result of the acquisition of U.S. Government Portfolio by the Portfolio, various limitations and reductions regarding the future utilization of certain capital loss carryforwards were applied, based on certain provisions in the Internal Revenue Code. The Portfolio deferred straddle losses of $70,858 at October 31, 2011. |
| (b) | The differences between book-basis and tax-basis unrealized appreciation/(depreciation) are attributable primarily to the tax deferral of losses on wash sales, the difference between book and tax amortization methods for premium, the tax treatment of swap income, and the realization for tax purposes of gains/losses on certain derivative instruments. |
| (c) | The difference between book-basis and tax-basis components of accumulated earnings/(deficit) is attributable to dividends payable. |
| 50 | • ALLIANCEBERNSTEIN BOND FUND INTERMEDIATE BOND PORTFOLIO |
Notes to Financial Statements
During the current fiscal year, permanent differences primarily due to the tax treatment of swap income, paydown reclassification, foreign currency reclassification, the tax treatment of premium amortization, reclassifications on futures and swaps, and the tax treatment of proceeds from the sale of defaulted securities resulted in a net increase in undistributed net investment income and a net increase in accumulated net realized loss on investment and foreign currency transactions. This reclassification had no effect on net assets.
NOTE I
Recent Accounting Pronouncements
In April 2011, the Financial Accounting Standards Board (“FASB”) issued an Accounting Standard Update (“ASU”) related to the accounting for repurchase agreements and similar agreements that both entitle and obligate a transferor to repurchase or redeem financial assets before their maturity. The ASU modifies the criteria for determining effective control of transferred assets and, as a result, certain agreements may now be accounted for as secured borrowings. The ASU is effective prospectively for new transfers and existing transactions that are modified in the first interim or annual period beginning on or after December 15, 2011. At this time, management is evaluating the implications of this ASU and its impact on the financial statements has not been determined.
In May 2011, the Financial Accounting Standards Board (“FASB”) issued an Accounting Standards Update (“ASU”) to develop common requirements for measuring fair value and for disclosing information about fair value measurements in U.S. GAAP and International Financial Reporting Standards (“IFRS”). The amendments are intended to improve the comparability of fair value measurements presented and disclosed in the financial statements prepared in accordance with U.S. GAAP and IFRS. The ASU is effective during interim or annual periods beginning after December 15, 2011. At this time, management is evaluating the implication of this ASU and its impact on the financial statements has not been determined.
NOTE J
Subsequent Events
Management has evaluated subsequent events for possible recognition or disclosure in the financial statements through the date the financial statements are issued. Management has determined that there are no material events that would require disclosure in the Portfolio’s financial statements through this date.
| ALLIANCEBERNSTEIN BOND FUND INTERMEDIATE BOND PORTFOLIO • | 51 |
Notes to Financial Statements
FINANCIAL HIGHLIGHTS
Selected Data For A Share Of Capital Stock Outstanding Throughout Each Period
| Class A | ||||||||||||||||||||
| Year Ended October 31, | ||||||||||||||||||||
| 2011 | 2010 | 2009 | 2008 | 2007 | ||||||||||||||||
|
|
|
| |||||||||||||||||
Net asset value, beginning of period | $ 10.98 | $ 10.28 | $ 8.77 | $ 10.24 | $ 10.18 | |||||||||||||||
|
| |||||||||||||||||||
Income From Investment Operations | ||||||||||||||||||||
Net investment income(a)(b) | .37 | .42 | .44 | .50 | .42 | |||||||||||||||
Net realized and unrealized gain (loss) on investment and foreign currency transactions | .07 | .70 | 1.53 | (1.49 | ) | .06 | ||||||||||||||
Contributions from Adviser | – 0 | – | – 0 | – | – 0 | – | .00 | (c) | – 0 | – | ||||||||||
|
| |||||||||||||||||||
Net increase (decrease) in net asset value from operations | .44 | 1.12 | 1.97 | (.99 | ) | .48 | ||||||||||||||
|
| |||||||||||||||||||
Less: Dividends | ||||||||||||||||||||
Dividends from net investment income | (.38 | ) | (.42 | ) | (.46 | ) | (.48 | ) | (.42 | ) | ||||||||||
|
| |||||||||||||||||||
Net asset value, end of period | $ 11.04 | $ 10.98 | $ 10.28 | $ 8.77 | $ 10.24 | |||||||||||||||
|
| |||||||||||||||||||
Total Return | ||||||||||||||||||||
Total investment return based on net asset value(d) | 4.11 | % | 11.17 | %* | 23.01 | %* | (10.15 | )%* | 4.79 | %* | ||||||||||
Ratios/Supplemental Data | ||||||||||||||||||||
Net assets, end of period (000’s omitted) | $381,577 | $418,023 | $419,319 | $360,606 | $41,696 | |||||||||||||||
Ratio to average net | ||||||||||||||||||||
Expenses, net of waivers/ reimbursements | .85 | % | .91 | %(e) | .89 | % | .85 | % | .98 | % | ||||||||||
Expenses, net of waivers/ reimbursements, excluding interest expense and TALF administration fee | .85 | % | .85 | %(e) | .85 | % | .85 | % | .98 | % | ||||||||||
Expenses, before waivers/ reimbursements | 1.00 | % | 1.11 | %(e) | 1.11 | % | 1.09 | % | 1.54 | % | ||||||||||
Expenses, before waivers/reimbursements, excluding interest expense and TALF administration fee | 1.00 | % | 1.05 | %(e) | 1.07 | % | 1.09 | % | 1.54 | % | ||||||||||
Net investment income(b) | 3.42 | % | 3.98 | %(e) | 4.71 | % | 4.68 | % | 4.13 | % | ||||||||||
Portfolio turnover rate | 115 | % | 99 | % | 95 | % | 184 | % | 173 | % | ||||||||||
See footnote summary on page 59.
| 52 | • ALLIANCEBERNSTEIN BOND FUND INTERMEDIATE BOND PORTFOLIO |
Financial Highlights
Selected Data For A Share Of Capital Stock Outstanding Throughout Each Period
| Class B | ||||||||||||||||||||
| Year Ended October 31, | ||||||||||||||||||||
| 2011 | 2010 | 2009 | 2008 | 2007 | ||||||||||||||||
|
|
|
| |||||||||||||||||
Net asset value, beginning of period | $ 10.98 | $ 10.28 | $ 8.77 | $ 10.23 | $ 10.18 | |||||||||||||||
|
| |||||||||||||||||||
Income From Investment Operations | ||||||||||||||||||||
Net investment income(a)(b) | .30 | .35 | .38 | .42 | .35 | (f) | ||||||||||||||
Net realized and unrealized gain (loss) on investment and foreign currency transactions | .08 | .70 | 1.52 | (1.47 | ) | .05 | ||||||||||||||
Contributions from Adviser | – 0 | – | – 0 | – | – 0 | – | .00 | (c) | – 0 | – | ||||||||||
|
| |||||||||||||||||||
Net increase (decrease) in net asset value from operations | .38 | 1.05 | 1.90 | (1.05 | ) | .40 | ||||||||||||||
|
| |||||||||||||||||||
Less: Dividends | ||||||||||||||||||||
Dividends from net investment income | (.31 | ) | (.35 | ) | (.39 | ) | (.41 | ) | (.35 | ) | ||||||||||
|
| |||||||||||||||||||
Net asset value, end of period | $ 11.05 | $ 10.98 | $ 10.28 | $ 8.77 | $ 10.23 | |||||||||||||||
|
| |||||||||||||||||||
Total Return | ||||||||||||||||||||
Total investment return based on net asset value(d) | 3.50 | % | 10.40 | %* | 22.17 | %* | (10.69 | )%* | 3.96 | %* | ||||||||||
Ratios/Supplemental Data | ||||||||||||||||||||
Net assets, end of period (000’s omitted) | $11,104 | $16,048 | $21,830 | $31,207 | $20,157 | |||||||||||||||
Ratio to average net | ||||||||||||||||||||
Expenses, net of waivers/reimbursements | 1.55 | % | 1.62 | %(e) | 1.58 | % | 1.55 | % | 1.66 | % | ||||||||||
Expenses, net of waivers/reimbursements, excluding interest expense and TALF administration fee | 1.55 | % | 1.55 | %(e) | 1.55 | % | 1.55 | % | 1.66 | % | ||||||||||
Expenses, before waivers/reimbursements | 1.75 | % | 1.88 | %(e) | 1.87 | % | 1.83 | % | 2.29 | % | ||||||||||
Expenses, before waivers/reimbursements, excluding interest expense and TALF administration fee | 1.75 | % | 1.81 | %(e) | 1.84 | % | 1.83 | % | 2.29 | % | ||||||||||
Net investment income(b) | 2.73 | % | 3.35 | %(e) | 4.07 | % | 3.95 | % | 3.46 | %(f) | ||||||||||
Portfolio turnover rate | 115 | % | 99 | % | 95 | % | 184 | % | 173 | % | ||||||||||
See footnote summary on page 59.
| ALLIANCEBERNSTEIN BOND FUND INTERMEDIATE BOND PORTFOLIO • | 53 |
Financial Highlights
Selected Data For A Share Of Capital Stock Outstanding Throughout Each Period
| Class C | ||||||||||||||||||||
| Year Ended October 31, | ||||||||||||||||||||
| 2011 | 2010 | 2009 | 2008 | 2007 | ||||||||||||||||
|
|
|
| |||||||||||||||||
Net asset value, beginning of period | $ 10.96 | $ 10.26 | $ 8.75 | $ 10.22 | $ 10.16 | |||||||||||||||
|
| |||||||||||||||||||
Income From Investment Operations | ||||||||||||||||||||
Net investment income(a)(b) | .29 | .35 | .38 | .43 | .35 | |||||||||||||||
Net realized and unrealized gain (loss) on investment and foreign currency transactions | .07 | .70 | 1.52 | (1.49 | ) | .06 | ||||||||||||||
Contributions from Adviser | – 0 | – | – 0 | – | – 0 | – | .00 | (c) | – 0 | – | ||||||||||
|
| |||||||||||||||||||
Net increase (decrease) in net asset value from operations | .36 | 1.05 | 1.90 | (1.06 | ) | .41 | ||||||||||||||
|
| |||||||||||||||||||
Less: Dividends | ||||||||||||||||||||
Dividends from net investment income | (.30 | ) | (.35 | ) | (.39 | ) | (.41 | ) | (.35 | ) | ||||||||||
|
| |||||||||||||||||||
Net asset value, end of period | $ 11.02 | $ 10.96 | $ 10.26 | $ 8.75 | $ 10.22 | |||||||||||||||
|
| |||||||||||||||||||
Total Return | ||||||||||||||||||||
Total investment return based on net asset value(d) | 3.40 | % | 10.42 | %* | 22.22 | %* | (10.80 | )%* | 4.07 | %* | ||||||||||
Ratios/Supplemental Data | ||||||||||||||||||||
Net assets, end of period (000’s omitted) | $62,147 | $66,568 | $61,635 | $51,708 | $9,404 | |||||||||||||||
Ratio to average net | ||||||||||||||||||||
Expenses, net of waivers/reimbursements | 1.55 | % | 1.61 | %(e) | 1.59 | % | 1.55 | % | 1.68 | % | ||||||||||
Expenses, net of waivers/reimbursements, excluding interest expense and TALF administration fee | 1.55 | % | 1.55 | %(e) | 1.55 | % | 1.55 | % | 1.68 | % | ||||||||||
Expenses, before waivers/reimbursements | 1.71 | % | 1.83 | %(e) | 1.82 | % | 1.80 | % | 2.27 | % | ||||||||||
Expenses, before waivers/reimbursements, excluding interest expense and TALF administration fee | 1.71 | % | 1.77 | %(e) | 1.78 | % | 1.80 | % | 2.27 | % | ||||||||||
Net investment income(b) | 2.72 | % | 3.27 | %(e) | 4.02 | % | 3.99 | % | 3.45 | % | ||||||||||
Portfolio turnover rate | 115 | % | 99 | % | 95 | % | 184 | % | 173 | % | ||||||||||
See footnote summary on page 59.
| 54 | • ALLIANCEBERNSTEIN BOND FUND INTERMEDIATE BOND PORTFOLIO |
Financial Highlights
Selected Data For A Share Of Capital Stock Outstanding Throughout Each Period
| Advisor Class | ||||||||||||||||||||
| Year Ended October 31, | ||||||||||||||||||||
| 2011 | 2010 | 2009 | 2008 | 2007 | ||||||||||||||||
|
|
|
| |||||||||||||||||
Net asset value, beginning of period | $ 10.99 | $ 10.28 | $ 8.78 | $ 10.24 | $ 10.18 | |||||||||||||||
|
| |||||||||||||||||||
Income From Investment Operations | ||||||||||||||||||||
Net investment income(a)(b) | .40 | .44 | .47 | .50 | .45 | |||||||||||||||
Net realized and unrealized gain (loss) on investment and foreign currency transactions | .07 | .73 | 1.51 | (1.45 | ) | .06 | ||||||||||||||
Contributions from Adviser | – 0 | – | – 0 | – | – 0 | – | .00 | (c) | – 0 | – | ||||||||||
|
| |||||||||||||||||||
Net increase (decrease) in net asset value from operations | .47 | 1.17 | 1.98 | (.95 | ) | .51 | ||||||||||||||
|
| |||||||||||||||||||
Less: Dividends | ||||||||||||||||||||
Dividends from net investment income | (.41 | ) | (.46 | ) | (.48 | ) | (.51 | ) | (.45 | ) | ||||||||||
|
| |||||||||||||||||||
Net asset value, end of period | $ 11.05 | $ 10.99 | $ 10.28 | $ 8.78 | $ 10.24 | |||||||||||||||
|
| |||||||||||||||||||
Total Return | ||||||||||||||||||||
Total investment return based on net asset value(d) | 4.43 | % | 11.59 | %* | 23.23 | %* | (9.78 | )%* | 5.11 | %* | ||||||||||
Ratios/Supplemental Data | ||||||||||||||||||||
Net assets, end of period (000’s omitted) | $88,402 | $89,981 | $62,369 | $33,139 | $32,375 | |||||||||||||||
Ratio to average net | ||||||||||||||||||||
Expenses, net of waivers/reimbursements | .55 | % | .60 | %(e) | .60 | % | .55 | % | .68 | % | ||||||||||
Expenses, net of waivers/reimbursements, excluding interest expense and TALF administration fee | .55 | % | .55 | %(e) | .55 | % | .55 | % | .68 | % | ||||||||||
Expenses, before waivers/reimbursements | .70 | % | .80 | %(e) | .80 | % | .80 | % | 1.25 | % | ||||||||||
Expenses, before waivers/reimbursements, excluding interest expense and TALF administration fee | .70 | % | .75 | %(e) | .76 | % | .80 | % | 1.25 | % | ||||||||||
Net investment income(b) | 3.70 | % | 4.19 | %(e) | 4.95 | % | 4.98 | % | 4.44 | % | ||||||||||
Portfolio turnover rate | 115 | % | 99 | % | 95 | % | 184 | % | 173 | % | ||||||||||
See footnote summary on page 59.
| ALLIANCEBERNSTEIN BOND FUND INTERMEDIATE BOND PORTFOLIO • | 55 |
Financial Highlights
Selected Data For A Share Of Capital Stock Outstanding Throughout Each Period
| Class R | ||||||||||||||||||||
| Year Ended October 31, | ||||||||||||||||||||
| 2011 | 2010 | 2009 | 2008 | 2007 | ||||||||||||||||
|
|
|
| |||||||||||||||||
Net asset value, beginning of period | $ 10.98 | $ 10.28 | $ 8.77 | $ 10.24 | $ 10.18 | |||||||||||||||
|
| |||||||||||||||||||
Income From Investment Operations | ||||||||||||||||||||
Net investment income(a)(b) | .34 | .37 | .43 | .46 | .44 | |||||||||||||||
Net realized and unrealized gain (loss) on investment and foreign currency transactions | .08 | .73 | 1.51 | (1.47 | ) | .02 | ||||||||||||||
Contributions from Adviser | – 0 | – | – 0 | – | – 0 | – | .00 | (c) | – 0 | – | ||||||||||
|
| |||||||||||||||||||
Net increase (decrease) in net asset value from operations | .42 | 1.10 | 1.94 | (1.01 | ) | .46 | ||||||||||||||
|
| |||||||||||||||||||
Less: Dividends | ||||||||||||||||||||
Dividends from net investment income | (.36 | ) | (.40 | ) | (.43 | ) | (.46 | ) | (.40 | ) | ||||||||||
|
| |||||||||||||||||||
Net asset value, end of period | $ 11.04 | $ 10.98 | $ 10.28 | $ 8.77 | $ 10.24 | |||||||||||||||
|
| |||||||||||||||||||
Total Return | ||||||||||||||||||||
Total investment return based on net asset value(d) | 3.91 | % | 10.94 | %* | 22.74 | %* | (10.33 | )%* | 4.57 | %* | ||||||||||
Ratios/Supplemental Data | ||||||||||||||||||||
Net assets, end of period (000’s omitted) | $1,168 | $759 | $156 | $73 | $577 | |||||||||||||||
Ratio to average net | ||||||||||||||||||||
Expenses, net of waivers/reimbursements | 1.05 | % | 1.08 | %(e) | 1.11 | % | 1.05 | % | 1.18 | % | ||||||||||
Expenses, net of waivers/reimbursements, excluding interest expense and TALF administration fee | 1.05 | % | 1.05 | %(e) | 1.05 | % | 1.05 | % | 1.18 | % | ||||||||||
Expenses, before waivers/reimbursements | 1.31 | % | 1.37 | %(e) | 1.38 | % | 1.25 | % | 1.74 | % | ||||||||||
Expenses, before waivers/reimbursements, excluding interest expense and TALF administration fee | 1.31 | % | 1.34 | %(e) | 1.33 | % | 1.25 | % | 1.74 | % | ||||||||||
Net investment income(b) | 3.16 | % | 3.49 | %(e) | 4.39 | % | 4.45 | % | 3.97 | % | ||||||||||
Portfolio turnover rate | 115 | % | 99 | % | 95 | % | 184 | % | 173 | % | ||||||||||
See footnote summary on page 59.
| 56 | • ALLIANCEBERNSTEIN BOND FUND INTERMEDIATE BOND PORTFOLIO |
Financial Highlights
Selected Data For A Share Of Capital Stock Outstanding Throughout Each Period
| Class K | ||||||||||||||||||||
| Year Ended October 31, | ||||||||||||||||||||
| 2011 | 2010 | 2009 | 2008 | 2007 | ||||||||||||||||
|
|
|
| |||||||||||||||||
Net asset value, beginning of period | $ 10.99 | $ 10.29 | $ 8.78 | $ 10.25 | $ 10.19 | |||||||||||||||
|
| |||||||||||||||||||
Income From Investment Operations | ||||||||||||||||||||
Net investment income(a)(b) | .38 | .43 | .45 | .48 | .42 | |||||||||||||||
Net realized and unrealized gain (loss) on investment and foreign currency transactions | .07 | .70 | 1.52 | (1.47 | ) | .06 | ||||||||||||||
Contributions from Adviser | – 0 | – | – 0 | – | – 0 | – | .00 | (c) | – 0 | – | ||||||||||
|
| |||||||||||||||||||
Net increase (decrease) in net asset value from operations | .45 | 1.13 | 1.97 | (.99 | ) | .48 | ||||||||||||||
|
| |||||||||||||||||||
Less: Dividends | ||||||||||||||||||||
Dividends from net investment income | (.39 | ) | (.43 | ) | (.46 | ) | (.48 | ) | (.42 | ) | ||||||||||
|
| |||||||||||||||||||
Net asset value, end of period | $ 11.05 | $ 10.99 | $ 10.29 | $ 8.78 | $ 10.25 | |||||||||||||||
|
| |||||||||||||||||||
Total Return | ||||||||||||||||||||
Total investment return based on net asset value(d) | 4.17 | % | 11.21 | %* | 23.05 | %* | (10.09 | )%* | 4.84 | %* | ||||||||||
Ratios/Supplemental Data | ||||||||||||||||||||
Net assets, end of period (000’s omitted) | $2,869 | $4,359 | $4,434 | $3,784 | $7,222 | |||||||||||||||
Ratio to average net | ||||||||||||||||||||
Expenses, net of waivers/reimbursements | .80 | % | .86 | %(e) | .84 | % | .80 | % | .93 | % | ||||||||||
Expenses, net of waivers/reimbursements, excluding interest expense and TALF administration fee | .80 | % | .80 | %(e) | .80 | % | .80 | % | .93 | % | ||||||||||
Expenses, before waivers/reimbursements | 1.01 | % | 1.09 | %(e) | 1.05 | % | 1.02 | % | 1.53 | % | ||||||||||
Expenses, before waivers/reimbursements, excluding interest expense and TALF administration fee | 1.01 | % | 1.03 | %(e) | 1.01 | % | 1.02 | % | 1.53 | % | ||||||||||
Net investment income(b) | 3.49 | % | 4.02 | %(e) | 4.76 | % | 4.69 | % | 4.39 | % | ||||||||||
Portfolio turnover rate | 115 | % | 99 | % | 95 | % | 184 | % | 173 | % | ||||||||||
See footnote summary on page 59.
| ALLIANCEBERNSTEIN BOND FUND INTERMEDIATE BOND PORTFOLIO • | 57 |
Financial Highlights
Selected Data For A Share Of Capital Stock Outstanding Throughout Each Period
| Class I | ||||||||||||||||||||
| Year Ended October 31, | ||||||||||||||||||||
| 2011 | 2010 | 2009 | 2008 | 2007 | ||||||||||||||||
|
|
|
| |||||||||||||||||
Net asset value, beginning of period | $ 11.00 | $ 10.29 | $ 8.78 | $ 10.24 | $ 10.18 | |||||||||||||||
|
| |||||||||||||||||||
Income From Investment Operations | ||||||||||||||||||||
Net investment income(a)(b) | .42 | .49 | .47 | .50 | .45 | |||||||||||||||
Net realized and unrealized gain (loss) on investment and foreign currency transactions | .05 | .68 | 1.52 | (1.45 | ) | .06 | ||||||||||||||
Contributions from Adviser | – 0 | – | – 0 | – | – 0 | – | .00 | (c) | – 0 | – | ||||||||||
|
| |||||||||||||||||||
Net increase (decrease) in net asset value from operations | .47 | 1.17 | 1.99 | (.95 | ) | .51 | ||||||||||||||
|
| |||||||||||||||||||
Less: Dividends | ||||||||||||||||||||
Dividends from net investment income | (.41 | ) | (.46 | ) | (.48 | ) | (.51 | ) | (.45 | ) | ||||||||||
|
| |||||||||||||||||||
Net asset value, end of period | $ 11.06 | $ 11.00 | $ 10.29 | $ 8.78 | $ 10.24 | |||||||||||||||
|
| |||||||||||||||||||
Total Return | ||||||||||||||||||||
Total investment return based on net asset value(d) | 4.42 | % | 11.59 | %* | 23.36 | %* | (9.78 | )%* | 5.10 | %* | ||||||||||
Ratios/Supplemental Data | ||||||||||||||||||||
Net assets, end of period (000’s omitted) | $715 | $1,348 | $5,095 | $5,115 | $5,368 | |||||||||||||||
Ratio to average net | ||||||||||||||||||||
Expenses, net of waivers/reimbursements | .55 | % | .67 | %(e) | .59 | % | .55 | % | .68 | % | ||||||||||
Expenses, net of waivers/reimbursements, excluding interest expense and TALF administration fee | .55 | % | .55 | %(e) | .55 | % | .55 | % | .68 | % | ||||||||||
Expenses, before waivers/reimbursements | .68 | % | .81 | %(e) | .72 | % | .64 | % | 1.09 | % | ||||||||||
Expenses, before waivers/reimbursements, excluding interest expense and TALF administration fee | .68 | % | .69 | %(e) | .68 | % | .64 | % | 1.09 | % | ||||||||||
Net investment income(b) | 3.76 | % | 4.60 | %(e) | 5.02 | % | 4.98 | % | 4.44 | % | ||||||||||
Portfolio turnover rate | 115 | % | 99 | % | 95 | % | 184 | % | 173 | % | ||||||||||
See footnote summary on page 59.
| 58 | • ALLIANCEBERNSTEIN BOND FUND INTERMEDIATE BOND PORTFOLIO |
Financial Highlights
| (a) | Based on average shares outstanding. |
| (b) | Net of fees waived and expenses reimbursed by the Adviser. |
| (c) | Amount is less than $.005. |
| (d) | Total investment return is calculated assuming an initial investment made at the net asset value at the beginning of the period, reinvestment of all dividends and distributions at net asset value during the period, and redemption on the last day of the period. Initial sales charges or contingent deferred sales charges are not reflected in the calculation of total investment return. Total return does not reflect the deduction of taxes that a shareholder would pay on portfolio distributions or the redemption of portfolio shares. Total investment return calculated for a period of less than one year is not annualized. |
| (e) | The ratio includes expenses attributable to costs of proxy solicitation. |
| (f) | Net of fees and expenses waived by Distributor. |
| * | Includes the impact of proceeds received and credited to the Portfolio resulting from class action settlements, which enhanced the Portfolio’s performance for the years ended October 31, 2010, October 31, 2009, October 31, 2008 and October 31, 2007 by 0.01%, 0.01%, 0.21% and 0.61%, respectively. |
See notes to financial statements.
| ALLIANCEBERNSTEIN BOND FUND INTERMEDIATE BOND PORTFOLIO • | 59 |
Financial Highlights
REPORT OF INDEPENDENT REGISTERED
PUBLIC ACCOUNTING FIRM
To the Board of Directors of AllianceBernstein Bond Fund, Inc. and the Shareholders of AllianceBernstein Intermediate Bond Portfolio
We have audited the accompanying statement of assets and liabilities, including the portfolio of investments, of the AllianceBernstein Intermediate Bond Portfolio (the “Portfolio”) (one of the portfolios constituting the AllianceBernstein Bond Fund, Inc.) as of October 31, 2011, and the related statement of operations for the year then ended, the statements of changes in net assets for each of the two years in the period then ended, and the financial highlights for each of the five years in the period then ended. These financial statements and financial highlights are the responsibility of the Portfolio’s management. Our responsibility is to express an opinion on these financial statements and financial highlights based on our audits.
We conducted our audits in accordance with the standards of the Public Company Accounting Oversight Board (United States). Those standards require that we plan and perform the audit to obtain reasonable assurance about whether the financial statements and financial highlights are free of material misstatement. We were not engaged to perform an audit of the Portfolio’s internal control over financial reporting. Our audits included consideration of internal control over financial reporting as a basis for designing audit procedures that are appropriate in the circumstances, but not for the purpose of expressing an opinion on the effectiveness of the Portfolio’s internal control over financial reporting. Accordingly, we express no such opinion. An audit also includes examining, on a test basis, evidence supporting the amounts and disclosures in the financial statements and financial highlights, assessing the accounting principles used and significant estimates made by management, and evaluating the overall financial statement presentation. Our procedures included confirmation of securities owned as of October 31, 2011 by correspondence with the custodian and others, or by other appropriate auditing procedures where replies from others were not received. We believe that our audits provide a reasonable basis for our opinion.
In our opinion, the financial statements and financial highlights referred to above present fairly, in all material respects, the financial position of the AllianceBernstein Intermediate Bond Portfolio of the AllianceBernstein Bond Fund, Inc. at October 31, 2011, the results of its operations for the year then ended, the changes in its net assets for each of the two years in the period then ended, and the financial highlights for each of the five years in the period then ended, in conformity with U.S. generally accepted accounting principles.

New York, New York
December 29, 2011
| 60 | • ALLIANCEBERNSTEIN BOND FUND INTERMEDIATE BOND PORTFOLIO |
Report of Independent Registered Public Accounting Firm
2011 FEDERAL TAX INFORMATION
(unaudited)
For Federal income tax purposes, the following information is furnished with respect to the distributions paid by the Portfolio during the taxable year ended October 31, 2011.
For foreign shareholders, 94.97% of ordinary income dividends paid may be considered to be qualifying to be taxed as interest-related dividends.
Shareholders should not use the above information to prepare their income tax returns. The information necessary to complete your income tax returns will be included with your Form 1099-DIV which will be sent to you separately in January 2012.
| ALLIANCEBERNSTEIN BOND FUND INTERMEDIATE BOND PORTFOLIO • | 61 |
2011 Federal Tax Information
BOARD OF DIRECTORS
William H. Foulk, Jr.(1), Chairman John H. Dobkin(1) Michael J. Downey(1) D. James Guzy(1) Nancy P. Jacklin(1) | Robert M. Keith, President and Chief Executive Officer Garry L. Moody(1) Marshall C. Turner, Jr.(1) Earl D. Weiner(1) |
OFFICERS
Philip L. Kirstein, Senior Vice President and Independent Compliance Officer Paul J. DeNoon(2), Vice President Shawn E. Keegan(2) , Vice President Alison M. Martier(2) , Vice President Douglas J. Peebles(2), Vice President | Greg J. Wilensky(2), Vice President Emilie D. Wrapp, Secretary Joseph J. Mantineo, Treasurer and Chief Financial Officer Phyllis J. Clarke, Controller |
Custodian and Accounting Agent State Street Bank and One Lincoln Street Boston, MA 02111
Principal Underwriter AllianceBernstein Investments, Inc. 1345 Avenue of the Americas New York, NY 10105
Transfer Agent AllianceBernstein Investor Services, Inc. P.O. Box 786003 San Antonio, TX 78278-6003 Toll-Free (800) 221-5672 | Independent Registered Public Ernst & Young LLP 5 Times Square New York, NY 10036
Legal Counsel Seward & Kissel LLP One Battery Park Plaza New York, NY 10004 |
| (1) | Member of the Audit Committee, the Governance and Nominating Committee, and the Independent Directors Committee. Mr. Foulk is the sole member of the Fair Value Pricing Committee. |
| (2) | The day-to-day management of, and investment decisions for, the Fund’s portfolio are made by the U.S. Investment Grade Core Fixed Income Team. Mr. Paul J. DeNoon, Mr. Shawn E. Keegan, Ms. Alison M. Martier, Mr. Douglas J. Peebles and Mr. Greg J. Wilensky are the investment professionals with the most significant responsibility for the day-to-day management of the Fund’s portfolio. |
| 62 | • ALLIANCEBERNSTEIN BOND FUND INTERMEDIATE BOND PORTFOLIO |
Board of Directors
MANAGEMENT OF THE FUND
Board of Directors Information
The business and affairs of the Fund are managed under the direction of the Board of Directors. Certain information concerning the Fund’s Directors is set forth below.
NAME, ADDRESS* AND AGE (YEAR FIRST ELECTED**) | PRINCIPAL DURING PAST FIVE YEARS | PORTFOLIOS IN FUND COMPLEX OVERSEEN BY DIRECTOR | OTHER DIRECTORSHIPS HELD BY DIRECTOR IN THE PAST FIVE YEARS | |||||
| INTERESTED DIRECTOR | ||||||||
Robert M. Keith, + 1345 Avenue of the Americas New York, New York 10105 51 (2010) | Senior Vice President of AllianceBernstein L.P. (the “Adviser”) and head of AllianceBernstein Investments, Inc. (“ABI”) since July 2008; Director of ABI and President of the AllianceBernstein Mutual Funds. Previously, he served as Executive Managing Director of ABI from December 2006 to June 2008. Prior to joining ABI in 2006, Executive Managing Director of Bernstein Global Wealth Management, and prior thereto, Senior Managing Director and Global Head of Client Service and Sales of the Adviser’s institutional investment management business since 2004. Prior thereto, Managing Director and Head of North American Client Service and Sales in the Adviser’s institutional investment management business, with which he had been associated since prior to 2004. | 102 | None | |||||
| ALLIANCEBERNSTEIN BOND FUND INTERMEDIATE BOND PORTFOLIO • | 63 |
Management of the Fund
NAME, ADDRESS* AND AGE (YEAR FIRST ELECTED**) | PRINCIPAL DURING PAST FIVE YEARS | PORTFOLIOS IN FUND COMPLEX OVERSEEN BY DIRECTOR | OTHER DIRECTORSHIPS HELD BY DIRECTOR IN THE PAST FIVE YEARS | |||||
| DISINTERESTED DIRECTORS | ||||||||
William H. Foulk, Jr., ++, # Chairman of the Board 79 (1998) | Investment Adviser and an Independent Consultant since prior to 2006. Previously, he was Senior Manager of Barrett Associates, Inc., a registered investment adviser. He was formerly Deputy Comptroller and Chief Investment Officer of the State of New York and, prior thereto, Chief Investment Officer of the New York Bank for Savings. He has served as a director or trustee of various AllianceBernstein Funds since 1983 and has been Chairman of the AllianceBernstein Funds and of the Independent Directors Committee of such Funds since 2003. He is also active in a number of mutual fund organizations and committees. | 102 | None | |||||
John H. Dobkin, # 69 (1998) | Independent Consultant since prior to 2006. Formerly, President of Save Venice, Inc. (preservation organization) from 2001-2002, Senior Advisor from June 1999-June 2000 and President of Historic Hudson Valley (historic preservation) from December 1989-May 1999. Previously, Director of the National Academy of Design. He has served as a director or trustee of various AllianceBernstein Funds since 1992, and as Chairman of the Audit Committees of a number of such Funds from 2001-2008. | 102 | None | |||||
| 64 | • ALLIANCEBERNSTEIN BOND FUND INTERMEDIATE BOND PORTFOLIO |
Management of the Fund
NAME, ADDRESS* AND AGE (YEAR FIRST ELECTED**) | PRINCIPAL DURING PAST FIVE YEARS | PORTFOLIOS IN FUND COMPLEX OVERSEEN BY DIRECTOR | OTHER DIRECTORSHIPS HELD BY DIRECTOR IN THE PAST FIVE YEARS | |||||
DISINTERESTED DIRECTORS (continued) | ||||||||
Michael J. Downey, # 67 (2005) | Private Investor since prior to 2006. Formerly, managing partner of Lexington Capital, LLC (investment advisory firm) from December 1997 until December 2003. From 1987 until 1993, Chairman and CEO of Prudential Mutual Fund Management, director of the Prudential Mutual funds and member of the Executive Committee of Prudential Securities Inc. He has served as a director or trustee of the AllianceBernstein Funds since 2005 and is a director of two other registered investment companies (and Chairman of one of them). | 102 | Asia Pacific Fund, Inc. and The Merger Fund since prior to 2006 and Prospect Acquisition Corp. (financial services) since 2007 until 2009 | |||||
D. James Guzy, # 75 (2005) | Chairman of the Board of PLX Technology (semi-conductors) and of SRC Computers Inc., with which he has been associated since prior to 2006. He was a director of Intel Corporation (semi-conductors) from 1969 until 2008 and served as Chairman of the Finance Committee of such company for several years until May 2008. He has served as a director or trustee of one or more of the AllianceBernstein Funds since 1982. | 102 | Cirrus Logic Corporation (semi-conductors) and PLX Technology (semi-conductors) since prior to 2006 and Intel Corporation (semi-conductors) since prior to 2006 until 2008 | |||||
| ALLIANCEBERNSTEIN BOND FUND INTERMEDIATE BOND PORTFOLIO • | 65 |
Management of the Fund
NAME, ADDRESS* AND AGE (YEAR FIRST ELECTED**) | PRINCIPAL DURING PAST FIVE YEARS | PORTFOLIOS IN FUND COMPLEX OVERSEEN BY DIRECTOR | OTHER DIRECTORSHIPS HELD BY DIRECTOR IN THE PAST FIVE YEARS | |||||
DISINTERESTED DIRECTORS (continued) | ||||||||
Nancy P. Jacklin, # 63 (2006) | Professorial Lecturer at the Johns Hopkins School of Advanced International Studies since 2008. Formerly, U.S. Executive Director of the International Monetary Fund (December 2002-May 2006); Partner, Clifford Chance (1992-2002); Sector Counsel, International Banking and Finance, and Associate General Counsel, Citicorp (1985-1992); Assistant General Counsel (International), Federal Reserve Board of Governors (1982-1985); and Attorney Advisor, U.S. Department of the Treasury (1973-1982). Member of the Bar of the District of Columbia and of New York; and member of the Council on Foreign Relations. She has served as a director or trustee of the AllianceBernstein Funds since 2006. | 102 | None | |||||
| 66 | • ALLIANCEBERNSTEIN BOND FUND INTERMEDIATE BOND PORTFOLIO |
Management of the Fund
NAME, ADDRESS* AND AGE (YEAR FIRST ELECTED**) | PRINCIPAL DURING PAST FIVE YEARS | PORTFOLIOS IN FUND COMPLEX OVERSEEN BY DIRECTOR | OTHER DIRECTORSHIPS HELD BY DIRECTOR IN THE PAST FIVE YEARS | |||||
DISINTERESTED DIRECTORS (continued) | ||||||||
Garry L. Moody, # 59 (2008) | Independent Consultant. Formerly, Partner, Deloitte & Touche LLP (1995-2008) where he held a number of senior positions, including Vice Chairman, and U.S. and Global Investment Management Practice Managing Partner; President, Fidelity Accounting and Custody Services Company (1993-1995); and Partner, Ernst & Young LLP (1975-1993), where he served as the National Director of Mutual Fund Tax Services. He is also a member of the Governing Council of the Independent Directors Council (IDC), an organization of independent directors of mutual funds. He has served as a director or trustee, and as Chairman of the Audit Committee, of most of the AllianceBernstein Funds since 2008. | 102 | None | |||||
| ALLIANCEBERNSTEIN BOND FUND INTERMEDIATE BOND PORTFOLIO • | 67 |
Management of the Fund
NAME, ADDRESS* AND AGE (YEAR FIRST ELECTED**) | PRINCIPAL DURING PAST FIVE YEARS | PORTFOLIOS IN FUND COMPLEX OVERSEEN BY DIRECTOR | OTHER DIRECTORSHIPS HELD BY DIRECTOR IN THE PAST FIVE YEARS | |||||
DISINTERESTED DIRECTORS (continued) | ||||||||
Marshall C. Turner, Jr., # 70 (2005) | Private Investor since prior to 2006. Interim CEO of MEMC Electronic Materials, Inc. (semi-conductor and solar cell substrates) from November 2008 until March 2009. He was Chairman and CEO of Dupont Photomasks, Inc. (components of semi-conductor manufacturing), 2003-2005, and President and CEO, 2005-2006, after the company was acquired and renamed Toppan Photomasks, Inc. He has extensive experience in venture capital investing including prior service as general partner of three institutional venture capital partnerships, and serves on the boards of a number of education and science-related non-profit organizations. He has served as a director or trustee of one or more of the AllianceBernstein Funds since 1992. | 102 | Xilinx, Inc. (programmable logic semi-conductors) and MEMC Electronic Materials, Inc. (semi-conductor and solar cell substrates) since prior to 2006 | |||||
Earl D. Weiner, # 72 (2007) | Of Counsel, and Partner prior to January 2007, of the law firm Sullivan & Cromwell LLP and member of ABA Federal Regulation of Securities Committee Task Force to draft editions of the Fund Director’s Guidebook. He also serves as a director or trustee of various non-profit organizations and has served as Chairman or Vice Chairman of a number of them. He has served as a director or trustee of the AllianceBernstein Funds since 2007 and is Chairman of the Governance and Nominating Committees of most of the Funds. | 102 | None | |||||
| 68 | • ALLIANCEBERNSTEIN BOND FUND INTERMEDIATE BOND PORTFOLIO |
Management of the Fund
| * | The address for each of the Fund’s disinterested Directors is c/o AllianceBernstein L.P., Attention: Philip L. Kirstein, 1345 Avenue of the Americas, New York, NY 10105. |
| ** | There is no stated term of office for the Fund’s Directors. |
| *** | The information above includes each Director’s principal occupation during the last five years and other information relating to the experience, attributes and skills relevant to each Director’s qualifications to serve as a Director, which led to the conclusion that each Director should serve as a Director for the Fund. |
| + | Mr. Keith is an “interested person” of the Fund as defined in the “40 Act”, due to his position as a Senior Vice President of the Adviser. |
| ++ | Member of the Fair Value Pricing Committee. |
| # | Member of the Audit Committee, the Governance and Nominating Committee and the Independent Directors Committee. |
| ALLIANCEBERNSTEIN BOND FUND INTERMEDIATE BOND PORTFOLIO • | 69 |
Management of the Fund
Officer Information
Certain information concerning the Fund’s Officers is set forth below.
| NAME, ADDRESS* AND AGE | PRINCIPAL POSITION(S) HELD WITH FUND | PRINCIPAL OCCUPATION DURING PAST 5 YEARS | ||
Robert M. Keith 51 | President and Chief Executive Officer | See biography above. | ||
| Philip L. Kirstein 66 | Senior Vice President and Independent Compliance Officer | Senior Vice President and Independent Compliance Officer of the AllianceBernstein Funds, with which he has been associated since October 2004. Prior thereto, he was Of Counsel to Kirkpatrick & Lockhart, LLP from October 2003 to October 2004, and General Counsel of Merrill Lynch Investment Managers, L.P. since prior to March 2003. | ||
| Paul J. DeNoon 49 | Vice President | Senior Vice President of the Adviser**, with which he has been associated since prior to 2006. | ||
| Shawn E. Keegan 40 | Vice President | Vice President of the Adviser**, with which he has been associated since prior to 2006. | ||
| Alison M. Martier 54 | Vice President | Senior Vice President of the Adviser**, with which she has been associated since prior to 2006. | ||
| Douglas J. Peebles 46 | Vice President | Senior Vice President of the Adviser**, with which he has been associated since prior to 2006. | ||
| Greg J. Wilensky 44 | Vice President | Senior Vice President of the Adviser**, with which he has been associated since prior to 2006. | ||
| Emilie D. Wrapp 56 | Secretary | Senior Vice President, Assistant General Counsel and Assistant Secretary of ABI**, with which she has been associated since prior to 2006. | ||
| Joseph J. Mantineo 52 | Treasurer and Chief Financial Officer | Senior Vice President of AllianceBernstein Investor Services, Inc. (“ABIS”)**, with which he has been associated since prior to 2006. | ||
| Phyllis J. Clarke 50 | Controller | Vice President of ABIS**, with which she has been associated since prior to 2006. |
| * | The address for each of the Fund’s Officers is 1345 Avenue of the Americas, New York, NY 10105. |
| ** | The Adviser, ABI and ABIS are affiliates of the Fund. |
| The Fund’s Statement of Additional Information (“SAI”) has additional information about the Fund’s Directors and Officers and is available without charge upon request. Contact your financial representative or AllianceBernstein at 1-800-227-4618, or visit www.alliancebernstein.com, for a free prospectus or SAI. |
| 70 | • ALLIANCEBERNSTEIN BOND FUND INTERMEDIATE BOND PORTFOLIO |
Management of the Fund
THE FOLLOWING IS NOT PART OF THE SHAREHOLDER REPORT OR THE FINANCIAL STATEMENTS
SUMMARY OF SENIOR OFFICER’S EVALUATION OF INVESTMENT ADVISORY AGREEMENT1
The following is a summary of the evaluation of the Investment Advisory Agreement between AllianceBernstein L.P. (the “Adviser”) and AllianceBernstein Bond Fund, Inc. (the “Fund”) with respect to AllianceBernstein Intermediate Bond Portfolio (the “Portfolio”).2 The evaluation of the Investment Advisory Agreement was prepared by Philip L. Kirstein, the Senior Officer of the Fund, for the Directors of the Fund, as required by the September 1, 2004 Assurance of Discontinuance (“AoD”) between the Adviser and the New York State Attorney General (the “NYAG”). The Senior Officer’s evaluation of the Investment Advisory Agreement is not meant to diminish the responsibility or authority of the Board of Directors of the Fund to perform its duties pursuant to Section 15 of the Investment Company Act of 1940 (the “40 Act”) and applicable state law. The purpose of the summary is to provide shareholders with a synopsis of the independent evaluation of the reasonableness of the advisory fees proposed to be paid by the Portfolio which was provided to the Directors in connection with their review of the proposed approval of the continuance of the Investment Advisory Agreement. The Senior Officer’s evaluation considered the following factors:
| 1. | Advisory fees charged to institutional and other clients of the Adviser for like services; |
| 2. | Advisory fees charged by other mutual fund companies for like services; |
| 3. | Costs to the Adviser and its affiliates of supplying services pursuant to the advisory agreement, excluding any intra-corporate profit; |
| 4. | Profit margins of the Adviser and its affiliates from supplying such services; |
| 5. | Possible economies of scale as the Portfolio grows larger; and |
| 6. | Nature and quality of the Adviser’s services including the performance of the Portfolio. |
These factors, with the exception of the first factor, are generally referred to as the “Gartenberg factors,” which were articulated by the United States Court of Appeals for the Second Circuit in 1982. Gartenberg v. Merrill Lynch Asset Management, Inc., 694 F. 2d 923 (2d Cir. 1982). On March 30, 2010, the Supreme Court held the Gartenberg decision was correct in its basic formulation
| 1 | The Senior Officer’s fee evaluation was completed on October 20, 2011 and discussed with the Board of Directors on November 1-3, 2011. |
| 2 | Future references to the Portfolio do not include “AllianceBernstein.” References in the fee summary pertaining to performance and expense ratios refer to the Class A shares of the Portfolio. |
| ALLIANCEBERNSTEIN BOND FUND INTERMEDIATE BOND PORTFOLIO • | 71 |
of what §36(b) requires: to face liability under §36(b), “an investment adviser must charge a fee that is so disproportionately large that it bears no reasonable relationship to the services rendered and could not have been the product of arm’s length bargaining” Jones v. Harris Associates L.P., 130 S. Ct. 1418 (2010). In Jones, the Court stated the Gartenberg approach fully incorporates the correct understanding of fiduciary duty within the context of section 36(b) and noted with approval that “Gartenberg insists that all relevant circumstances be taken into account” and “uses the range of fees that might result from arm’s-length bargaining as the benchmark for reviewing challenged fees.”3
PORTFOLIO ADVISORY FEES, EXPENSE CAPS, REIMBURSEMENTS & RATIOS
The Adviser proposed that the Portfolio pay the advisory fee set forth in the table below for receiving the services to be provided pursuant to the Investment Advisory Agreement. The fee schedule below, implemented in January 2004 in connection with the Adviser’s settlement with the NYAG in December 2003, is based on a master schedule that contemplates eight categories of funds with almost all funds in each category having the same advisory fee schedule.4
| Category | Net Assets 09/30/11 | Advisory Fee Based on % of Average Daily Net Assets | Portfolio | |||
| Low Risk Income | $542.4 | 45 bp on 1st $2.5 billion 40 bp on next $2.5 billion 35 bp on the balance | Intermediate Bond Portfolio |
The Adviser is reimbursed as specified in the Investment Advisory Agreement for certain clerical, legal, accounting, administrative and other services provided to the Portfolio. During the Portfolio’s most recently completed fiscal year, the Adviser received $82,651 (0.01% of the Portfolio’s average daily net assets) for such services.
The Adviser agreed to waive that portion of its advisory fees and/or reimburse the Portfolio for that portion of the Portfolio’s total operating expenses to the degree necessary to limit the Portfolio’s expense ratios to the amounts set forth below for the Portfolio’s current fiscal year. The waiver is terminable by the
| 3 | Jones v. Harris at 1427. |
| 4 | Most of the AllianceBernstein Mutual Funds, which the Adviser manages, were affected by the Adviser’s settlement with the NYAG. |
| 72 | • ALLIANCEBERNSTEIN BOND FUND INTERMEDIATE BOND PORTFOLIO |
Adviser at the end of the Portfolio’s fiscal year upon at least 60 days written notice. In addition, set forth below are the Portfolio’s gross expense ratios, annualized for the most recent semi-annual period:
| Portfolio | Expense Cap Pursuant to Expense Limitation Undertaking | Gross Ratio5 (04/30/11) | Fiscal Year End | |||||||||
| Intermediate Bond Portfolio | Advisor Class A Class B Class C Class R Class K Class I |
| 0.55 0.85 1.55 1.55 1.05 0.80 0.55 | % % % % % % % |
| 0.70 1.00 1.76 1.72 1.32 1.01 0.68 | % % % % % % % | October 31 | ||||
| I. | ADVISORY FEES CHARGED TO INSTITUTIONAL AND OTHER CLIENTS. |
The advisory fees charged to investment companies which the Adviser manages and sponsors are normally higher than those charged to similar sized institutional accounts, including pension plans and sub-advised investment companies. The fee differential reflects, among other things, different services provided to such clients, and different liabilities assumed. Services provided by the Adviser to the Portfolio that are not provided to non-investment company clients include providing office space and personnel to serve as Fund Officers, who among other responsibilities make the certifications required under the Sarbanes–Oxley Act of 2002, and coordinating with and monitoring the Portfolio’s third party service providers such as Fund counsel, auditors, custodians, transfer agents and pricing services. The accounting, administrative, legal and compliance requirements for the Portfolio are more costly than those for institutional client assets due to the greater complexities and time required for investment companies, although as previously noted, the Adviser is reimbursed for providing some of these services. Also, retail mutual funds managed by the Adviser are widely held and accordingly, servicing the Portfolio’s investors is more time consuming and labor intensive compared to servicing institutional clients since the Adviser needs to communicate with a more extensive network of financial intermediaries and shareholders. The Adviser also believes that it incurs substantial entrepreneurial risk when offering a new mutual fund since establishing a new mutual fund requires a large upfront investment and it may take a long time for the fund to achieve profitability since the fund must be priced to scale from inception in order to be competitive and assets are acquired one account at a time. In addition, managing the cash flow of an investment company may be more difficult than that of a stable pool of assets, such as an institutional account with little cash movement in either direction, particularly if the Portfolio is in net redemption and the Adviser is frequently forced to sell securities to raise cash for redemptions. However, managing a fund with positive cash flow may be easier at times than managing a stable pool of assets. Finally, in recent years, investment
| 5 | Annualized. |
| ALLIANCEBERNSTEIN BOND FUND INTERMEDIATE BOND PORTFOLIO • | 73 |
advisers have been sued by institutional clients and have suffered reputational damage both by the attendant publicity and outcomes other than complete victories. Accordingly, the legal and reputational risks associated with institutional accounts are greater than previously thought, although arguably still not equal to those related to the mutual fund industry.
Notwithstanding the Adviser’s view that managing an investment company is not comparable to managing other institutional accounts because the services provided are different, the Supreme Court has indicated consideration should be given to the advisory fees charged to institutional accounts with a similar investment style as the Portfolio.6 In addition to the AllianceBernstein Institutional fee schedule, set forth below is what would have been the effective advisory fee for the Portfolio had the AllianceBernstein Institutional fee schedule been applicable to the Portfolio versus the Portfolio’s advisory fees based on September 30, 2011 net assets.7
| Portfolio | Net Assets 09/30/11 ($MM) | AllianceBernstein (“AB”) Fee Schedule | Effective AB Inst. Adv. Fee | Portfolio Advisory Fee | ||||||||
| Intermediate Bond Portfolio | $542.4 | U.S. Strategic Core Plus Schedule 50 bp on 1st $30 million 20 bp on the balance Minimum Account Size: $25m | 0.217% | 0.450% | ||||||||
The Adviser manages Sanford C. Bernstein Fund, Inc. (“SCB Fund”), an open-end management investment company. The Intermediate Duration Portfolio of SCB Fund has a similar investment style as the Portfolio. Set forth below is Intermediate Duration Portfolio’s advisory fee schedule and what would have been the effective advisory fee of the Portfolio had the fee schedule
| 6 | The Supreme Court stated that “courts may give such comparisons the weight that they merit in light of the similarities and differences between the services that the clients in question require, but the courts must be wary of inapt comparisons.” Among the significant differences the Supreme Court noted that may exist between services provided to mutual funds and institutional accounts are “higher marketing costs.” Jones v. Harris at 1428. |
| 7 | The Adviser has indicated that with respect to institutional accounts with assets greater than $300 million, it will negotiate a fee schedule. Discounts that are negotiated vary based upon each client relationship. |
| 74 | • ALLIANCEBERNSTEIN BOND FUND INTERMEDIATE BOND PORTFOLIO |
of Intermediate Duration Portfolio been applicable to the Portfolio versus the Portfolio’s advisory fees based on September 30, 2011 net assets:
| Portfolio | SCB Fund Portfolio | Fee Schedule | SCB Fund Effective Fee | Portfolio Advisory Fee | ||||||
| Intermediate Bond Portfolio | Intermediate Duration Portfolio | 50 bp on 1st $1 billion 45 bp on next $2 billion 40 bp on next $2 billion 35 bp on next $2 billion 30 bp thereafter | 0.500% | 0.450% | ||||||
The adviser also manages the AllianceBernstein Variable Products Series Fund, Inc. (“AVPS”), which is available through variable annuity and variable life contracts offered by other financial institutions and offers policyholders the option to utilize certain AVPS portfolios as the investment option underlying their insurance contracts. Set forth below is the fee schedule of the AVPS portfolio that has a substantially similar investment style as the Portfolio.8 Also shown is what would have been the effective advisory fee of the Portfolio had the AVPS fee schedule been applicable to the Portfolio and the Portfolio’s advisory fees based on September 30, 2011 net assets:
| Portfolio | AVPS Portfolio | Fee Schedule | AVPS Effective Fee | Portfolio Advisory Fee | ||||||
| Intermediate Bond Fund | Intermediate Bond Portfolio | 0.45% on first $2.5 billion 0.40% on next $2.5 billion 0.35% on the balance | 0.450% | 0.450% | ||||||
The Adviser provides sub-advisory investment services to certain other investment companies managed by other fund families. The Adviser charges the following fee for the sub-advisory relationship that has a somewhat similar investment style as the Portfolio. Also shown is the Portfolio’s advisory fee and what would have been the effective advisory fee of the Portfolio had the fee schedule of the sub-advisory relationship been applicable to the Portfolio based on September 30, 2011 net assets:
| Portfolio | Sub-advised Fund | Sub-advised Fund Fee Schedule | Sub-Advised Management Fee | Portfolio Advisory Fee | ||||||||
| Intermediate Bond Portfolio | Client #1 | 0.29% on first $100 million 0.20% thereafter | 0.217% | 0.450% | ||||||||
| 8 | It should be noted that the AVPS portfolio was also affected by the settlement between the Adviser and the NYAG. As a result, the Portfolio has the same breakpoints in its advisory fee schedule as the AVPS portfolio. |
| ALLIANCEBERNSTEIN BOND FUND INTERMEDIATE BOND PORTFOLIO • | 75 |
It is fair to note that the services the Adviser provides pursuant to sub-advisory agreements are generally confined to the services related to the investment process; in other words, they are not as comprehensive as the services provided to the Portfolio by the Adviser. In addition to the extent that the sub-advisory relationship is with an affiliate of the Adviser, the fee schedule may not reflect arm’s-length bargaining or negotiations.
While it appears that the sub-advisory relationship is paying a lower fee than investment companies managed by the Adviser, it is difficult to evaluate the relevance of such fees due to the differences in the services provided, risks involved and other competitive factors between the investment companies and the sub-advisory relationship. There could be various business reasons why an investment adviser would be willing to provide a sub-advised relationship investment related services at a different fee level than an investment company it is sponsoring where the investment adviser is provided all the services, not just investment services, generally required by a registered investment company.
| II. | MANAGEMENT FEES CHARGED BY OTHER MUTUAL FUND COMPANIES FOR LIKE SERVICES. |
Lipper, Inc., an analytical service that is not affiliated with the Adviser, compared the fees charged to the Portfolio with fees charged to other investment companies for similar services by other investment advisers.9 Lipper’s analysis included the comparison of the Portfolio’s contractual management fee,10,11 estimated at the approximate current asset level of the subject Portfolio, to the median of the Portfolio’s Lipper Expense Group (“EG”) and the Portfolio’s contractual management fee ranking.
Lipper describes an EG as a representative sample of comparable funds. Lipper’s standard methodology for screening funds to be included in an EG entails the consideration of several fund criteria, including fund type, investment
| 9 | The Supreme Court cautioned against accepting mutual fund fee comparisons without careful scrutiny since “these comparisons are problematic because these fees, like those challenged, may not be the product of negotiations conducted at arm’s length.” Jones v. Harris at 1429. |
| 10 | The contractual management fee is calculated by Lipper using the Portfolio’s contractual management fee rate at a hypothetical asset level. The hypothetical asset level is based on the combined net assets of all classes of the Portfolio, rounded up to the next $25 million. Lipper’s total expense ratio information is based on the most recent annual report except as otherwise noted. A ranking of “1” means that the Portfolio has the lowest effective fee rate in the Lipper peer group. |
| 11 | The contractual management fee does not reflect any expense reimbursements made by the Portfolio to the Adviser for certain clerical, legal, accounting, administrative, and other services. In addition, the contractual management fee does not reflect any advisory fee waivers or expense reimbursements made by the Adviser that would effectively reduce the actual effective management fee. |
| 76 | • ALLIANCEBERNSTEIN BOND FUND INTERMEDIATE BOND PORTFOLIO |
classification/objective, load type and similar 12b-1/non-12b-1 service fees, asset (size) comparability, expense components and attributes. An EG will typically consist of seven to twenty funds.
| Portfolio | Contractual Management Fee (%) | Lipper Expense Median (%) | Rank | |||||||||
| Intermediate Bond Portfolio | 0.450 | 0.549 | 3/13 | |||||||||
Lipper also compared the Portfolio’s total expense ratio to the medians of the Portfolio’s EG and Lipper Expense Universe (“EU”). The EU12 is a broader group compared to the EG, consisting of all funds that have the same investment classification/objective and load type as the subject Portfolio.
| Portfolio | Expense Ratio | Lipper Exp. Group Median (%) | Lipper Group Rank | Lipper Exp. Median (%) | Lipper Rank | |||||||||||||||
| Intermediate Bond Portfolio | 0.849 | 0.873 | 4/13 | 0.881 | 19/66 | |||||||||||||||
Based on this analysis, the Portfolio has a more favorable ranking on a management fee basis than on a total expense ratio basis.
| III. | COSTS TO THE ADVISER AND ITS AFFILIATES OF SUPPLYING SERVICES PURSUANT TO THE ADVISORY FEE ARRANGEMENT, EXCLUDING ANY INTRA-CORPORATE PROFIT. |
The Adviser utilizes two profitability reporting systems, which operate independently but are aligned with each other, to estimate the Adviser’s profitability in connection with investment advisory services provided to the Portfolio. The Senior Officer has retained an independent consultant to provide independent advice regarding the alignment of the two profitability systems as well as the methodologies and allocations utilized by both profitability systems. See Section IV for additional discussion.
| IV. | PROFIT MARGINS OF THE ADVISER AND ITS AFFILIATES FOR SUPPLYING SUCH SERVICES. |
The profitability information for the Portfolio, prepared by the Adviser for the Board of Directors, was reviewed by the Senior Officer and the independent consultant. The Adviser’s profitability from providing investment advisory services to the Portfolio decreased during calendar year 2010 relative to 2009.
| 12 | Except for asset (size) comparability, Lipper uses the same criteria for selecting an EG when selecting an EU. Unlike the EG, the EU allows for the same adviser to be represented by more than just one fund. |
| 13 | Most recently completed fiscal year Class A share total expense ratio. |
| ALLIANCEBERNSTEIN BOND FUND INTERMEDIATE BOND PORTFOLIO • | 77 |
In addition to the Adviser’s direct profits from managing the Portfolio, certain of the Adviser’s affiliates have business relationships with the Portfolio and may earn a profit from providing other services to the Portfolio. The courts have referred to this type of business opportunity as “fall-out benefits” to the Adviser and indicated that such benefits should be factored into the evaluation of the total relationship between the Portfolio and the Adviser. Neither case law nor common business practice precludes the Adviser’s affiliates from earning a reasonable profit on this type of relationship provided the affiliates’ charges and services are competitive. These affiliates provide transfer agent and distribution related services to the Portfolio and receive transfer agent fees, front-end sales loads, Rule 12b-1 payments and contingent deferred sales charges (“CDSC”). During the Portfolio’s most recently completed fiscal year, ABI received from the Portfolio $18,946, $2,076,151 and $21,054 in front-end sales charges, Rule 12b-1 and CDSC fees, respectively.
AllianceBernstein Investments, Inc. (“ABI”), an affiliate of the Adviser, is the Portfolio’s principal underwriter. ABI and the Adviser have disclosed in the Portfolio’s prospectus that they may make revenue sharing payments from their own resources, in addition to revenues derived from sales loads and Rule 12b-1 fees, to firms that sell shares of the Portfolio. In 2010, ABI paid approximately 0.04% of the average monthly assets of the AllianceBernstein Mutual Funds or approximately $13.8 million for distribution services and educational support (revenue sharing payments).
Fees and reimbursements for out of pocket expenses charged by AllianceBernstein Investor Services, Inc. (“ABIS”), the affiliated transfer agent for the Portfolio, are charged on a per account basis, based on the level of service provided and the class of share held by the account. ABIS also receives a fee per shareholder sub-account for each account maintained by an intermediary on an omnibus basis. During the Portfolio’s most recently completed fiscal year, ABIS received $552,804 in fees from the Portfolio.
| V. | POSSIBLE ECONOMIES OF SCALE. |
The Adviser has indicated that economies of scale are being shared with shareholders through fee structures,14 subsidies and enhancement to services. Based on some of the professional literature that has considered economies of scale in the mutual fund industry, it is thought that to the extent economies of scale exist, they may more often exist across a fund family as opposed to a specific fund. This is because the costs incurred by the Adviser, such as investment research or technology for trading or compliance systems, can be spread across a greater asset base as the fund family increases in size. It is also possible that as the level of services required to operate a successful investment company has
| 14 | Fee structures include fee reductions, pricing at scale and breakpoints in advisory fee schedules. |
| 78 | • ALLIANCEBERNSTEIN BOND FUND INTERMEDIATE BOND PORTFOLIO |
increased over time, and advisory firms have made such investments in their business to provide services, there may be a sharing of economies of scale without a reduction in advisory fees.
In February 2008, an independent consultant, retained by the Senior Officer, provided the Board of Directors an update of the Deli15 study on advisory fees and various fund characteristics.16 The independent consultant first reiterated the results of his previous two dimensional comparison analysis (fund size and family size) with the Board of Directors.17 The independent consultant then discussed the results of the regression model that was utilized to study the effects of various factors on advisory fees. The regression model output indicated that the bulk of the variation in fees predicted were explained by various factors, but substantially by fund assets under management (“AUM”), family AUM, index fund indicator and investment style. The independent consultant also compared the advisory fees of the AllianceBernstein Mutual Funds to similar funds managed by 19 other large asset managers, regardless of fund size and the large asset manager’s proportion of mutual fund assets to non-mutual fund assets.
| VI. | NATURE AND QUALITY OF THE ADVISER’S SERVICES INCLUDING THE PERFORMANCE OF THE PORTFOLIO. |
With assets under management of approximately $402 billion as of September 30, 2011, the Adviser has the investment experience to manage and provide non-investment services (described in Section I) to the Portfolio.
| 15 | The Deli study, originally published in 2002 based on 1997 data and updated for the February 2008 presentation, may be of diminished value due to the age of the data used in the presentation and the changes experienced in the industry over the last four years. |
| 16 | As mentioned previously, the Supreme Court cautioned against accepting mutual fund fee comparisons without careful scrutiny since the fees may not be the product of negotiations conducted at arm’s length. See Jones V. Harris at 1429. |
| 17 | The two dimensional analysis showed patterns of lower advisory fees for funds with larger asset sizes and funds from larger family sizes compared to funds with smaller asset sizes and funds from smaller family sizes, which according to the independent consultant is indicative of a sharing of economies of scale and scope. However, in less liquid and active markets, such is not the case, as the empirical analysis showed potential for diseconomies of scale in those markets. The empirical analysis also showed diminishing economies of scale and scope as funds surpassed a certain high level of assets. |
| ALLIANCEBERNSTEIN BOND FUND INTERMEDIATE BOND PORTFOLIO • | 79 |
The information below shows the 1, 3, 5 and 10 year performance returns and rankings of the Portfolio18 relative to its Lipper Performance Group (“PG”) and Lipper Performance Universe (“PU”)19 for the periods ended July 31, 2011.20
| Portfolio | Portfolio Return (%) | PG Median (%) | PU Median (%) | PG Rank | PU Rank | |||||||||||||||
| Intermediate Bond Portfolio | ||||||||||||||||||||
1 year | 5.74 | 5.93 | 5.27 | 8/13 | 31/84 | |||||||||||||||
3 year | 8.26 | 8.39 | 7.95 | 8/13 | 26/74 | |||||||||||||||
5 year | 6.43 | 6.88 | 6.45 | 9/11 | 33/63 | |||||||||||||||
10 year | 5.16 | 5.62 | 5.16 | 7/10 | 22/43 | |||||||||||||||
Set forth below are the 1, 3, 5, 10 year and since inception net performance returns of the Portfolio (in bold)21 versus its benchmark.22 Portfolio and benchmark volatility and reward-to-variability ratio (“Sharpe Ratio”) information is also shown.23
| Periods Ending July 31, 2011 Annualized Performance | ||||||||||||||||||||||||||||||||
| Annualized | Risk Period (Year) | |||||||||||||||||||||||||||||||
1 Year | 3 Year | 5 Year | 10 Year (%) | Since Inception (%) | Volatility (%) | Sharpe (%) | ||||||||||||||||||||||||||
| Intermediate Bond Portfolio | 5.74 | 8.16 | 6.38 | 5.14 | 5.63 | 4.58 | 0.66 | 10 | ||||||||||||||||||||||||
| Barclays Capital U.S. Aggregate Bond Index | 4.44 | 7.05 | 6.57 | 5.68 | 6.18 | 3.77 | 0.93 | 10 | ||||||||||||||||||||||||
| Inception Date: July 1, 1999 | ||||||||||||||||||||||||||||||||
| 18 | The performance returns and rankings are for the Class A shares of the Portfolio. The performance returns of the Portfolios were provided Lipper. Lipper maintains its own database that includes the Portfolio’s performance returns. |
| 19 | The Portfolio’s PG is identical to the Portfolio’s EG. The Portfolio’s PU is not identical to the Portfolio’s EU as the criteria for including/excluding a portfolio in/from a PU are somewhat different from that of an EU. |
| 20 | Note that the current Lipper investment classification/objective dictates the PG and PU throughout the life of the Portfolio even if the Portfolio may have had a different investment classification/objective at different points in time. |
| 21 | The performance returns and risk measures shown in the table are for the Class A shares of the Portfolio. |
| 22 | The Adviser provided Portfolio and benchmark performance return information for the periods through July 31, 2011. |
| 23 | Portfolio and benchmark volatility and Sharpe Ratio information was obtained through Lipper LANA, a database maintained by Lipper. Volatility is a statistical measure of the tendency of a market price or yield to vary over time. A Sharpe Ratio is a risk adjusted measure of return that divides a fund’s return in excess of the riskless return by the fund’s standard deviation. A portfolio with a greater volatility would be viewed as more risky than a portfolio with equivalent performance but lower volatility; for that reason, a greater return would be demanded for the more risky fund. A portfolio with a higher Sharpe Ratio would be regarded as better performing than a fund with a lower Sharpe Ratio. |
| 80 | • ALLIANCEBERNSTEIN BOND FUND INTERMEDIATE BOND PORTFOLIO |
CONCLUSION:
Based on the factors discussed above the Senior Officer’s conclusion is that the proposed advisory fee for the Portfolio is reasonable and within the range of what would have been negotiated at arm’s-length in light of all the surrounding circumstances. This conclusion in respect of the Portfolio is based on an evaluation of all of these factors and no single factor was dispositive.
Dated: November 28, 2011
| ALLIANCEBERNSTEIN BOND FUND INTERMEDIATE BOND PORTFOLIO • | 81 |
THIS PAGE IS NOT PART OF THE SHAREHOLDER REPORT OR THE FINANCIAL STATEMENTS
ALLIANCEBERNSTEIN FAMILY OF FUNDS
Wealth Strategies Funds
Balanced Wealth Strategy
Conservative Wealth Strategy
Wealth Appreciation Strategy
Tax-Managed Balanced Wealth Strategy
Tax-Managed Conservative Wealth Strategy
Tax-Managed Wealth Appreciation Strategy
Asset Allocation/Multi-Asset
Emerging Markets Multi-Asset
International Portfolio
Real Asset Strategy
Tax-Managed International Portfolio
Growth Funds
Domestic
Growth Fund
Large Cap Growth Fund
Small Cap Growth Portfolio
Small/Mid Cap Growth Fund
U.S. Strategic Research Portfolio
Global & International
Global Thematic Growth Fund
Greater China ’97 Fund
International Discovery Equity Portfolio
International Focus 40 Portfolio
International Growth Fund
Value Funds
Domestic
Core Opportunities Fund
Equity Income Fund
Growth & Income Fund
Small/Mid Cap Value Fund
Value Fund
Global & International
Global Real Estate Investment Fund
Global Value Fund
International Value Fund
Taxable Bond Funds
Bond Inflation Strategy
Global Bond Fund
High Income Fund
Intermediate Bond Portfolio
Short Duration Portfolio
Unconstrained Bond Fund*
Municipal Bond Funds
Arizona California High Income Massachusetts Michigan Minnesota Municipal Bond Inflation Strategy | National New Jersey New York Ohio Pennsylvania Virginia |
Intermediate Municipal Bond Funds
Intermediate California
Intermediate Diversified
Intermediate New York
Closed-End Funds
Alliance California Municipal Income Fund
Alliance New York Municipal Income Fund
AllianceBernstein Global High Income Fund
AllianceBernstein Income Fund
AllianceBernstein National Municipal Income Fund
Alternatives
Market Neutral Strategy-Global
Market Neutral Strategy-U.S.
Balanced
Balanced Shares
Retirement Strategies Funds
2000 Retirement Strategy | 2020 Retirement Strategy | 2040 Retirement Strategy | ||
2005 Retirement Strategy | 2025 Retirement Strategy | 2045 Retirement Strategy | ||
2010 Retirement Strategy | 2030 Retirement Strategy | 2050 Retirement Strategy | ||
2015 Retirement Strategy | 2035 Retirement Strategy | 2055 Retirement Strategy |
We also offer Exchange Reserves,** which serves as the money market fund exchange vehicle for the AllianceBernstein mutual funds.
You should consider the investment objectives, risks, charges and expenses of any AllianceBernstein fund/portfolio carefully before investing. For free copies of our prospectuses, which contain this and other information, visit us online at www.alliancebernstein.com or contact your financial advisor. Please read the prospectus carefully before investing.
| * | Prior to February 3, 2011, Unconstrained Bond Fund was named Diversified Yield Fund. |
| ** | An investment in the Fund is not a deposit in a bank and is not insured or guaranteed by the Federal Deposit Insurance Corporation or any other government agency. Although the Fund seeks to preserve the value of your investment at $1.00 per share, it is possible to lose money by investing in the Fund. |
| 82 | • ALLIANCEBERNSTEIN BOND FUND INTERMEDIATE BOND PORTFOLIO |
AllianceBernstein Family of Funds
NOTES
| ALLIANCEBERNSTEIN BOND FUND INTERMEDIATE BOND PORTFOLIO • | 83 |
NOTES
| 84 | • ALLIANCEBERNSTEIN BOND FUND INTERMEDIATE BOND PORTFOLIO |
ALLIANCEBERNSTEIN BOND FUND INTERMEDIATE BOND PORTFOLIO
1345 Avenue of the Americas
New York, NY 10105
800.221.5672
| IB-0151-1011 |  | |
ANNUAL REPORT
AllianceBernstein
Bond Inflation Strategy

October 31, 2011
Annual Report
Investment Products Offered
| • | Are Not FDIC Insured |
| • | May Lose Value |
| • | Are Not Bank Guaranteed |
Investors should consider the investment objectives, risks, charges and expenses of the Fund carefully before investing. For copies of our prospectus or summary prospectus, which contain this and other information, visit us online at www.alliancebernstein.com or contact your AllianceBernstein Investments representative. Please read the prospectus and/or summary prospectus carefully before investing.
This shareholder report must be preceded or accompanied by the Fund’s prospectus for individuals who are not current shareholders of the Fund.
You may obtain a description of the Fund’s proxy voting policies and procedures, and information regarding how the Fund voted proxies relating to portfolio securities during the most recent 12-month period ended June 30, without charge. Simply visit AllianceBernstein’s website at www.alliancebernstein.com, or go to the Securities and Exchange Commission’s (the “Commission”) website at www.sec.gov, or call AllianceBernstein at (800) 227-4618.
The Fund files its complete schedule of portfolio holdings with the Commission for the first and third quarters of each fiscal year on Form N-Q. The Fund’s Forms N-Q are available on the Commission’s website at www.sec.gov. The Fund’s Forms N-Q may also be reviewed and copied at the Commission’s Public Reference Room in Washington, DC; information on the operation of the Public Reference Room may be obtained by calling (800) SEC-0330. AllianceBernstein publishes full portfolio holdings for the Fund monthly at www.alliancebernstein.com.
AllianceBernstein Investments, Inc. (ABI) is the distributor of the AllianceBernstein family of mutual funds. ABI is a member of FINRA and is an affiliate of AllianceBernstein L.P., the manager of the funds.
AllianceBernstein® and the AB Logo are registered trademarks and service marks used by permission of the owner, AllianceBernstein L.P.
December 14, 2011
Annual Report
This report provides management’s discussion of fund performance for AllianceBernstein Bond Inflation Strategy (the “Strategy”) for the annual reporting period ended October 31, 2011.
Investment Objectives and Policies
The Strategy seeks to maximize real return without assuming what AllianceBernstein L.P. (the “Adviser”) considers to be undue risk. Real return is the rate of return after adjusting for inflation.
The Strategy pursues its objective by investing principally in Treasury Inflation-Protected Securities (“TIPS”) directly or by gaining indirect exposure to TIPS through derivatives transactions such as total return swaps linked to TIPS. In deciding whether to take direct or indirect exposure, the Adviser will consider the relative costs and efficiency of each method. In addition, in seeking to maximize real return, the Strategy may invest in other fixed income investments such as U.S. and non-U.S. government securities, corporate fixed income securities and mortgage-related securities, as well as derivatives linked to such securities. Under normal circumstances, the Strategy invests at least 80% of its net assets in fixed income securities. While the Strategy expects to invest principally in investment-grade securities, it may invest up to 15% of its total assets in fixed income securities rated BB or B or the equivalent by at least one national ratings agency (or deemed by the Adviser to be of comparable credit quality), which are not investment grade (“junk bonds”).
Inflation-protected securities are fixed income securities structured to provide protection against inflation. Their principal value and/or the interest paid on them are adjusted to reflect official inflation measures. The inflation measure for TIPS is the Consumer Price Index for Urban Consumers. The Strategy may also invest in other inflation-indexed securities, issued by both U.S. and non-U.S. issuers, and in derivative instruments linked to these securities.
The Strategy may invest to the extent permitted by applicable law in derivatives, such as options, futures, forwards, or swap agreements. The Strategy intends to use leverage for investment purposes. To do this, the Strategy expects to enter into (i) reverse repurchase agreement transactions and use the cash made available from these transactions to make additional investments in fixed income securities in accordance with the Strategy’s investment policies and (ii) total return swaps. In determining when and to what extent to employ leverage or enter into derivatives transactions, the Adviser will consider factors such as the relative risks and returns expected of potential investments and the cost of such transactions. The Adviser will consider the impact of reverse repurchase agreements, swap agreements and other derivatives in making its assessments of the Strategy’s risks. The resulting exposures to markets, sectors, issuers or specific securities will be continuously monitored by the Adviser.
The Adviser selects securities for purchase or sale based on its assessment of the securities’ risk and
| ALLIANCEBERNSTEIN BOND INFLATION STRATEGY • | 1 |
return characteristics as well as the securities’ impact on the overall risk and return characteristics of the Strategy. In making this assessment, the Adviser takes into account various factors including the credit quality and sensitivity to interest rates of the securities under consideration and of the Strategy’s other holdings.
The Strategy may also invest in loan participations, structured securities, asset-backed securities, variable, floating, and inverse floating rate instruments, and preferred stock, and may use other investment techniques. The Strategy may invest in fixed income securities of any maturity and duration. If the rating of a fixed income security falls below investment-grade, the Strategy will not be obligated to sell the security and may continue to hold it if, in the Adviser’s opinion, the investment is appropriate under the circumstances.
Investment Results
The table on page 6 shows the Strategy’s performance compared to its benchmark, the Barclays Capital 1-10 Year TIPS Index, and to the Lipper TIPS Fund Average (the “Lipper Average”).
The Strategy underperformed its benchmark and Lipper Average for both the six- and 12-month periods, before sales charges. For both periods, the Strategy’s exposure to investment-grade and high yield corporates, and commercial mortgage-backed securities (“CMBS”) detracted from performance. As part of the Strategy’s credit position, credit default swaps
were held as a substitute for buying individual corporate bonds. During the 12-month period, credit default swap positions had a slightly negative impact on performance; there was no material impact for the six-month period.
Overall currency positioning contributed positively for the 12-month period and was a slight negative for the six-month period. The Strategy utilized currency forwards during both periods for hedging and non-hedging purposes. During both periods, the Strategy utilized derivative instruments including Treasury futures and interest rate swaps in order to manage duration and yield curve positioning. Overall yield curve positioning, specifically an overweight to the intermediate part of the yield curve, was a positive contributor for both periods.
Market Review and Investment Strategy
The global economic recovery that was underway slowed early in the year, resulting from a myriad of global events. Social unrest in North Africa and the Middle East, supply disruptions from the natural disaster in Japan and a spike in commodity prices, particularly oil, all provided headwinds for the global economy early in the year. During the six-month period ended October 31, 2011, renewed fears of a double-dip recession roiled the global capital markets, driving up risk aversion, sending equities sharply lower and widening credit spreads. Fiscal
| 2 | • ALLIANCEBERNSTEIN BOND INFLATION STRATEGY |
challenges—ranging from the contentious debate over the U.S. debt ceiling to the ongoing sovereign debt woes of Greece and the peripheral European nations—were at the forefront of investors’ worries. The mounting fear and uncertainty led to a spike in financial market volatility.
TIPS yields fell dramatically across the curve for the annual period. The rate shift resulted in positive absolute returns on TIPS securities with maturities beyond one year, with the benchmark returning a strong 7.02%. The combination of a rise in break-even inflation rates (i.e., the difference between the yield on TIPS and a comparable maturity Treasury bond), particularly in 1-10 year maturity TIPS, and the relatively high inflation accruals during the period, resulted in TIPS significantly outperforming Treasuries. TIPS in the 1-10 year maturity range outperformed comparable Treasury bonds by approximately 2.5%.
Other fixed income markets posted solid positive absolute returns for the annual period. In 2011 to date, the broad investment-grade fixed income market posted positive returns every month with the exception of June, as investors preferred fixed income over equity assets. The Barclays Capital U.S. Aggregate Bond Index, a widely used index of U.S. investment-grade
bonds, returned 5.00% for the 12-month period. Non-government sectors generally outperformed in the first six months of the period, with Treasuries rallying toward the end of period as risk aversion set in and investors preferred safety. Although fixed income absolute returns were positive for the period, volatility was elevated and returns swung month to month between risk assets and safer Treasuries dependent on investors’ risk tolerance. Investor concerns over the health of the economy and worries emanating from the European sovereign debt crisis led to the exacerbated financial market volatility.
For the annual period, investment grade corporates and high yield corporates led positive returns, followed by agency mortgage-backed securities, CMBS and asset-backed securities. Agency mortgage-backed securities were supported by government purchases while CMBS benefited from a stabilization of property fundamentals and investor appetite for yield. Corporate securities were helped by continued strong revenue and earnings growth. U.S. Treasury securities, which were in negative territory early in the period, rallied strongly in response to increased global uncertainties to post 5.27% for the annual period. During the period, government yields declined across the maturity spectrum.
| ALLIANCEBERNSTEIN BOND INFLATION STRATEGY • | 3 |
HISTORICAL PERFORMANCE
An Important Note About Historical Performance
The investment return and principal value of an investment in the Strategy will fluctuate, so that shares, when redeemed, may be worth more or less than their original cost. Performance shown on the following pages represents past performance and does not guarantee future results. Current performance may be lower or higher than the performance information shown. You may obtain performance information current to the most recent month-end by visiting www.alliancebernstein.com. For Class 1 shares, click on “Private Clients”, then “Investments”, then “Stocks” or “Bonds”, then “Mutual Fund Performance at a Glance”.
Investors should consider the investment objectives, risks, charges and expenses of the Strategy carefully before investing. For copies of our prospectus or summary prospectus, which contain this and other information, visit us online at www.alliancebernstein.com. For Class 1 shares, Click on “Private Clients”, then “Investments”, then “Stocks” or “Bonds”, then “Prospectuses, SAIs, and Shareholder Reports”. Please read the prospectus and/or summary prospectus carefully before investing.
All fees and expenses related to the operation of the Strategy have been deducted. NAV returns do not reflect sales charges; if sales charges were reflected, the Strategy’s quoted performance would be lower. SEC returns reflect the applicable sales charges for each share class: a 4.25% maximum front-end sales charge for Class A shares; a 1% 1-year contingent deferred sales charge for Class C shares. Returns for the different share classes will vary due to different expenses associated with each class. Performance assumes reinvestment of distributions and does not account for taxes.
Benchmark Disclosure
Both the unmanaged Barclays Capital 1-10 Year TIPS Index and the Barclays Capital U.S. Aggregate Bond Index do not reflect fees and expenses associated with the active management of a fund portfolio. The Barclays Capital 1-10 Year TIPS Index represents the performance of Inflation-Protected securities issued by the U.S. Treasury. The Barclays Capital U.S. Aggregate Bond Index represents the performance of securities within the U.S. investment-grade fixed rate bond market, with index components for government and corporate securities, mortgage pass-through securities, asset-backed securities, and commercial mortgage-backed securities. An investor cannot invest directly in an index, and its results are not indicative of the performance for any specific investment, including the Strategy.
A Word About Risk
Market Risk: The market values of the portfolio’s holdings rise and fall from day to day, so investments may lose value.
Interest Rate Risk: As interest rates rise, bond prices fall and vice versa—long-term securities tend to rise and fall more than short-term securities.
Credit Risk: A bond’s credit rating reflects the issuer’s ability to make timely payments of interest or principal—the lower the rating, the higher the risk of default. If the issuer’s financial strength deteriorates, the issuer’s rating may be lowered and the bond’s value may decline.
Inflation Risk: Prices for goods and services tend to rise over time, which may erode the purchasing power of investments.
Foreign (non-U.S.) Risk: Non-U.S. securities may be more volatile because of political, regulatory, market and economic uncertainties associated with such
(Historical Performance continued on next page)
| 4 | • ALLIANCEBERNSTEIN BOND INFLATION STRATEGY |
Historical Performance
HISTORICAL PERFORMANCE
(continued from previous page)
securities. Fluctuations in currency exchange risk may negatively affect the value of the investment or reduce returns. These risks are magnified in emerging or developing markets.
Liquidity Risk: Liquidity risk involves the difficulty of purchasing or selling a security at an advantageous time or price.
Derivatives Risk: Investing in derivative instruments such as options, futures, forwards or swaps can be riskier than traditional investments, and may be more volatile, especially in a down market.
Leverage Risk: Trying to enhance investment returns by borrowing money or using other leverage tools—magnify both gains and losses, resulting in greater volatility.
These risks are fully discussed in the Strategy’s prospectus.
(Historical Performance continued on next page)
| ALLIANCEBERNSTEIN BOND INFLATION STRATEGY • | 5 |
Historical Performance
HISTORICAL PERFORMANCE
(continued from previous page)
THE STRATEGY VS. ITS BENCHMARK PERIODS ENDED OCTOBER 31, 2011 | NAV Returns | |||||||||
| 6 Months | 12 Months | |||||||||
AllianceBernstein Bond Inflation Strategy | �� | |||||||||
Class 1* | 2.81% | 6.01% | ||||||||
| ||||||||||
Class 2* | 2.86% | 6.01% | ||||||||
| ||||||||||
Class A | 2.66% | 5.75% | ||||||||
| ||||||||||
Class C | 2.45% | 5.03% | ||||||||
| ||||||||||
Advisor Class** | 2.89% | 6.07% | ||||||||
| ||||||||||
Class R** | 2.60% | 5.59% | ||||||||
| ||||||||||
Class K** | 2.73% | 5.75% | ||||||||
| ||||||||||
Class I** | 2.95% | 6.11% | ||||||||
| ||||||||||
Barclays Capital 1-10 Year TIPS Index | 3.97% | 7.02% | ||||||||
| ||||||||||
Lipper TIPS Fund Average | 5.79% | 7.31% | ||||||||
| ||||||||||
* Class 1 shares are only available to private clients of Sanford C. Bernstein & Co. LLC. Class 2 shares are only available to the Adviser’s institutional clients or through other limited arrangements.
** Please note that these share classes are for investors purchasing shares through accounts established under certain fee-based programs sponsored and maintained by certain broker-dealers and financial intermediaries, institutional pension plans and/or investment advisory clients of, and certain other persons associated with, the Adviser and its affiliates or the Funds. | ||||||||||
See Historical Performance and Benchmark disclosures on pages 4-5.
(Historical Performance continued on next page)
| 6 | • ALLIANCEBERNSTEIN BOND INFLATION STRATEGY |
Historical Performance
HISTORICAL PERFORMANCE
(continued from previous page)
GROWTH OF A $10,000 INVESTMENT IN THE FUND
1/26/10† TO 10/31/11
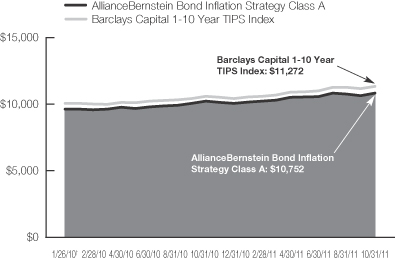
| † | Since the Strategy’s inception on 1/26/10. |
This chart illustrates the total value of an assumed $10,000 investment in AllianceBernstein Bond Inflation Strategy Class A shares (from 1/26/10 to 10/31/11) as compared to the performance of the Strategy’s composite benchmark. The chart reflects the deduction of the maximum 4.25% sales charge from the initial $10,000 investment in the Strategy and assumes the reinvestment of dividends and capital gains distributions.
See Historical Performance and Benchmark disclosures on pages 4-5.
(Historical Performance continued on next page)
| ALLIANCEBERNSTEIN BOND INFLATION STRATEGY • | 7 |
Historical Performance
HISTORICAL PERFORMANCE
(continued from previous page)
| AVERAGE ANNUAL RETURNS AS OF OCTOBER 31, 2011 | ||||||||||||
| NAV Returns | SEC Returns | SEC Yields* | ||||||||||
| Class 1 Shares† | ||||||||||||
1 Year | 6.01 | % | 6.01 | % | 2.29 | % | ||||||
Since Inception** | 7.07 | % | 7.07 | % | ||||||||
| Class 2 Shares† | ||||||||||||
1 Year | 6.01 | % | 6.01 | % | 2.39 | % | ||||||
Since Inception** | 7.10 | % | 7.10 | % | ||||||||
| Class A Shares | ||||||||||||
1 Year | 5.75 | % | 1.23 | % | 2.07 | % | ||||||
Since Inception** | 6.78 | % | 4.20 | % | ||||||||
| Class C Shares | ||||||||||||
1 Year | 5.03 | % | 4.03 | % | 1.47 | % | ||||||
Since Inception** | 6.06 | % | 6.06 | % | ||||||||
| Advisor Class Shares†† | ||||||||||||
1 Year | 6.07 | % | 6.07 | % | 2.46 | % | ||||||
Since Inception** | 7.15 | % | 7.15 | % | ||||||||
| Class R Shares†† | ||||||||||||
1 Year | 5.59 | % | 5.59 | % | 1.68 | % | ||||||
Since Inception** | 6.62 | % | 6.62 | % | ||||||||
| Class K Shares†† | ||||||||||||
1 Year | 5.75 | % | 5.75 | % | 1.98 | % | ||||||
Since Inception** | 6.82 | % | 6.82 | % | ||||||||
| Class I Shares†† | ||||||||||||
1 Year | 6.11 | % | 6.11 | % | 2.32 | % | ||||||
Since Inception** | 7.16 | % | 7.16 | % | ||||||||
The Strategy’s prospectus fee table shows the Strategy’s total annual operating expense ratios as 5.29%, 5.18%, 4.63%, 4.80%, 4.50%, 5.74%, 3.53% and 5.19% for Class 1, Class 2, Class A, Class C, Advisor Class, Class R, Class K and Class I shares, respectively, gross of any fee waivers or expense reimbursements. Contractual fee waivers and/or expense reimbursements limit the Strategy’s annual operating expenses (exclusive of interest expense) to 0.55%, 0.45%, 0.75%, 1.45%, 0.45%, 0.95%, 0.70% and 0.45% for Class 1, Class 2, Class A, Class C, Advisor Class, Class R, Class K and Class I shares, respectively. These waivers/reimbursements extend through the Strategy’s current fiscal year and may be extended by the Adviser for additional one-year terms. Absent reimbursements or waivers, performance would have been lower. The Financial Highlights section of this report sets forth expense ratio data for the current reporting period; the expense ratios shown above may differ from the expense ratios in the Financial Highlights sections since they are based on different time periods.
| * | SEC yields are calculated based on SEC guidelines for the 30-day period ended October 31, 2011. |
| ** | Inception date: 1/26/10. |
| † | Class 1 shares are sold only to the private clients of Sanford C. Bernstein & Co. LLC by Bernstein registered representatives. Class 2 shares are only available to the Adviser’s institutional clients or through other limited arrangements. |
| †† | These share classes are offered at net asset value (NAV) to eligible investors and their SEC returns are the same as the NAV returns. Please note that these share classes are for investors purchasing shares through accounts established under certain fee-based programs sponsored and maintained by certain broker-dealers and financial intermediaries, institutional pension plans and/or investment advisory clients of, and certain other persons associated with, the Adviser and its affiliates or the Funds. The inception date for these share classes is listed above. |
See Historical Performance disclosures on pages 4-5.
(Historical Performance continued on next page)
| 8 | • ALLIANCEBERNSTEIN BOND INFLATION STRATEGY |
Historical Performance
HISTORICAL PERFORMANCE
(continued from previous page)
| SEC AVERAGE ANNUAL RETURNS (WITH ANY APPLICABLE SALES CHARGES) AS OF THE MOST RECENT CALENDAR QUARTER-END (SEPTEMBER 30, 2011) | ||||
| SEC Returns | ||||
| Class 1 Shares† | ||||
1 Year | 6.24 | % | ||
Since Inception* | 6.47 | % | ||
| Class 2 Shares† | ||||
1 Year | 6.22 | % | ||
Since Inception* | 6.50 | % | ||
| Class A Shares | ||||
1 Year | 1.41 | % | ||
Since Inception* | 3.51 | % | ||
| Class C Shares | ||||
1 Year | 4.08 | % | ||
Since Inception* | 5.37 | % | ||
| Advisor Class Shares†† | ||||
1 Year | 6.20 | % | ||
Since Inception* | 6.50 | % | ||
| Class R Shares†† | ||||
1 Year | 5.63 | % | ||
Since Inception* | 5.96 | % | ||
| Class K Shares†† | ||||
1 Year | 5.84 | % | ||
Since Inception* | 6.20 | % | ||
| Class I Shares†† | ||||
1 Year | 6.22 | % | ||
Since Inception* | 6.51 | % | ||
| * | Inception date: 1/26/10. |
| † | Class 1 shares are sold only to the private clients of Sanford C. Bernstein & Co. LLC by Bernstein registered representatives. Class 2 shares are only available to the Adviser’s institutional clients or through other limited arrangements. |
| †† | Please note that these share classes are for investors purchasing shares through accounts established under certain fee-based programs sponsored and maintained by certain broker-dealers and financial intermediaries, institutional pension plans and/or investment advisory clients of, and certain other persons associated with, the Adviser and its affiliates or the Funds. The inception date for these share classes is listed above. |
See Historical Performance disclosures on pages 4-5.
| ALLIANCEBERNSTEIN BOND INFLATION STRATEGY • | 9 |
Historical Performance
FUND EXPENSES
(unaudited)
As a shareholder of a mutual fund, you may incur two types of costs: (1) transaction costs, including sales charges (loads) on purchase payments, contingent deferred sales charges on redemptions and (2) ongoing costs, including management fees; distribution (12b-1) fees; and other fund expenses. This example is intended to help you understand your ongoing costs (in dollars) of investing in the Fund and to compare these costs with the ongoing costs of investing in other mutual funds.
The Example is based on an investment of $1,000 invested at the beginning of the period and held for the entire period as indicated below.
Actual Expenses
The table below provides information about actual account values and actual expenses. You may use the information in this line, together with the amount you invested, to estimate the expenses that you paid over the period. Simply divide your account value by $1,000 (for example, an $8,600 account value divided by $1,000 = 8.6), then multiply the result by the number in the first line under the heading entitled “Expenses Paid During Period” to estimate the expenses you paid on your account during this period.
Hypothetical Example for Comparison Purposes
The table below provides information about hypothetical account values and hypothetical expenses based on the Fund’s actual expense ratio and an assumed annual rate of return of 5% before expenses, which is not the Fund’s actual return. The hypothetical account values and expenses may not be used to estimate the actual ending account balance or expenses you paid for the period. You may use this information to compare the ongoing costs of investing in the Fund and other funds by comparing this 5% hypothetical example with the 5% hypothetical examples that appear in the shareholder reports of other funds.
Please note that the expenses shown in the table are meant to highlight your ongoing costs only and do not reflect any transactional costs, such as sales charges (loads), or contingent deferred sales charges on redemptions. Therefore, the hypothetical example is useful in comparing ongoing costs only, and will not help you determine the relative total costs of owning different funds. In addition, if these transactional costs were included, your costs would have been higher.
| Beginning Account Value May 1, 2011 | Ending Account Value October 31, 2011 | Expenses Paid During Period* | Annualized Expense Ratio* | |||||||||||||
| Class A | ||||||||||||||||
Actual | $ | 1,000 | $ | 1,026.60 | $ | 3.93 | 0.77 | % | ||||||||
Hypothetical** | $ | 1,000 | $ | 1,021.32 | $ | 3.92 | 0.77 | % | ||||||||
| Class C | ||||||||||||||||
Actual | $ | 1,000 | $ | 1,024.50 | $ | 7.50 | 1.47 | % | ||||||||
Hypothetical** | $ | 1,000 | $ | 1,017.80 | $ | 7.48 | 1.47 | % | ||||||||
| Advisor Class | ||||||||||||||||
Actual | $ | 1,000 | $ | 1,028.90 | $ | 2.45 | 0.48 | % | ||||||||
Hypothetical** | $ | 1,000 | $ | 1,022.79 | $ | 2.45 | 0.48 | % | ||||||||
| Class R | ||||||||||||||||
Actual | $ | 1,000 | $ | 1,026.00 | $ | 4.95 | 0.97 | % | ||||||||
Hypothetical** | $ | 1,000 | $ | 1,020.32 | $ | 4.94 | 0.97 | % | ||||||||
| Class K | ||||||||||||||||
Actual | $ | 1,000 | $ | 1,027.30 | $ | 3.68 | 0.72 | % | ||||||||
Hypothetical** | $ | 1,000 | $ | 1,021.58 | $ | 3.67 | 0.72 | % | ||||||||
| 10 | • ALLIANCEBERNSTEIN BOND INFLATION STRATEGY |
Fund Expenses
| Beginning Account Value May 1, 2011 | Ending Account Value October 31, 2011 | Expenses Paid During Period* | Annualized Expense Ratio* | |||||||||||||
| Class I | ||||||||||||||||
Actual | $ | 1,000 | $ | 1,029.50 | $ | 2.40 | 0.47 | % | ||||||||
Hypothetical** | $ | 1,000 | $ | 1,022.84 | $ | 2.40 | 0.47 | % | ||||||||
| Class 1 | ||||||||||||||||
Actual | $ | 1,000 | $ | 1,028.10 | $ | 2.96 | 0.58 | % | ||||||||
Hypothetical** | $ | 1,000 | $ | 1,022.28 | $ | 2.96 | 0.58 | % | ||||||||
| Class 2 | ||||||||||||||||
Actual | $ | 1,000 | $ | 1,028.60 | $ | 2.45 | 0.48 | % | ||||||||
Hypothetical** | $ | 1,000 | $ | 1,022.79 | $ | 2.45 | 0.48 | % | ||||||||
| * | Expenses are equal to the classes’ annualized expense ratios multiplied by the average account value over the period, multiplied by 184/365 (to reflect the one-half year period). |
| ** | Assumes 5% return before expenses. |
| ALLIANCEBERNSTEIN BOND INFLATION STRATEGY • | 11 |
Fund Expenses
PORTFOLIO SUMMARY
October 31, 2011 (unaudited)
PORTFOLIO STATISTICS
Net Assets ($mil): $141.7
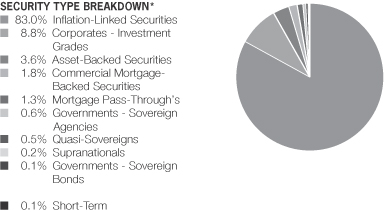
| * | All data are as of October 31, 2011. The Strategy’s security type breakdown is expressed as a percentage of total investments and may vary over time. The Strategy also enters into derivative transactions, which may be used for hedging or investment purposes (see “Portfolio of Investments” section of the report for additional details). |
| 12 | • ALLIANCEBERNSTEIN BOND INFLATION STRATEGY |
Portfolio Summary
PORTFOLIO OF INVESTMENTS
October 31, 2011
| Principal Amount (000) | U.S. $ Value | |||||||||
|
|
| ||||||||
INFLATION-LINKED SECURITIES – 95.7% | ||||||||||
United States – 95.7% | ||||||||||
U.S. Treasury Inflation Index | U.S.$ | 1,735 | $ | 1,828,430 | ||||||
0.625%, 7/15/21 (TIPS)(a) | 11,051 | 11,637,700 | ||||||||
1.125%, 1/15/21 (TIPS) | 4,385 | 4,822,302 | ||||||||
1.25%, 7/15/20 (TIPS)(a) | 9,696 | 10,796,189 | ||||||||
1.375%, 7/15/18-1/15/20 (TIPS) | 8,489 | 9,520,269 | ||||||||
1.625%, 1/15/15-1/15/18 (TIPS)(a) | 16,069 | 17,781,830 | ||||||||
1.875%, 7/15/13-7/15/19 (TIPS) | 25,851 | 28,540,826 | ||||||||
2.00%, 1/15/14-1/15/16 (TIPS) | 5,520 | 6,174,704 | ||||||||
2.00%, 7/15/14 (TIPS)(a) | 16,446 | 17,902,812 | ||||||||
2.125%, 1/15/19 (TIPS) | 4,758 | 5,590,390 | ||||||||
2.375%, 1/15/17-1/15/25 (TIPS) | 4,746 | 5,526,026 | ||||||||
2.50%, 7/15/16 (TIPS)(a) | 10,017 | 11,654,477 | ||||||||
2.625%, 7/15/17 (TIPS) | 3,230 | 3,846,656 | ||||||||
|
| |||||||||
Total Inflation-Linked Securities | 135,622,611 | |||||||||
|
| |||||||||
CORPORATES - INVESTMENT GRADES – 10.1% | ||||||||||
Financial Institutions – 4.7% | ||||||||||
Banking – 2.0% | ||||||||||
Bank of America Corp. | 90 | 85,836 | ||||||||
5.00%, 5/13/21 | 90 | 84,502 | ||||||||
7.625%, 6/01/19 | 135 | 146,695 | ||||||||
Bank of Scotland PLC | EUR | 50 | 71,245 | |||||||
Barclays Bank PLC | U.S.$ | 100 | 104,058 | |||||||
5.45%, 9/12/12 | 150 | 154,224 | ||||||||
Series 1 | 100 | 106,218 | ||||||||
BBVA Senior Finance SAU | EUR | 50 | 69,317 | |||||||
BBVA US Senior SAU | U.S.$ | 265 | 258,273 | |||||||
Capital One Financial Corp. | 150 | 161,462 | ||||||||
Citigroup, Inc. | 75 | 80,125 | ||||||||
5.50%, 4/11/13 | �� | 150 | 155,639 | |||||||
Goldman Sachs Group, Inc. (The) | 120 | 126,378 | ||||||||
JPMorgan Chase & Co. | 55 | 56,198 | ||||||||
4.25%, 10/15/20 | 55 | 54,736 | ||||||||
| ALLIANCEBERNSTEIN BOND INFLATION STRATEGY • | 13 |
Portfolio of Investments
| Principal Amount (000) | U.S. $ Value | |||||||||
|
|
| ||||||||
4.40%, 7/22/20 | U.S.$ | 165 | $ | 167,078 | ||||||
6.40%, 5/15/38 | 50 | 60,214 | ||||||||
Macquarie Group Ltd. | 65 | 68,067 | ||||||||
Morgan Stanley | 50 | 51,298 | ||||||||
National Capital Trust II | 45 | 40,706 | ||||||||
Royal Bank of Scotland PLC (The) | 155 | 153,969 | ||||||||
4.875%, 3/16/15 | 100 | 101,624 | ||||||||
6.125%, 1/11/21 | 90 | 95,036 | ||||||||
UBS AG/Stamford CT | 145 | 149,791 | ||||||||
Union Bank NA | 250 | 269,339 | ||||||||
|
| |||||||||
| 2,872,028 | ||||||||||
|
| |||||||||
Brokerage – 0.2% | ||||||||||
Jefferies Group, Inc. | 272 | 245,567 | ||||||||
6.875%, 4/15/21 | 54 | 52,041 | ||||||||
|
| |||||||||
| 297,608 | ||||||||||
|
| |||||||||
Finance – 0.1% | ||||||||||
HSBC Finance Corp. | 25 | 25,705 | ||||||||
SLM Corp. | 155 | 155,775 | ||||||||
|
| |||||||||
| 181,480 | ||||||||||
|
| |||||||||
Insurance – 2.2% | ||||||||||
Allstate Corp. (The) | 37 | 34,132 | ||||||||
American International Group, Inc. | 205 | 214,706 | ||||||||
Coventry Health Care, Inc. | 235 | 257,544 | ||||||||
Genworth Financial, Inc. | 205 | 185,002 | ||||||||
Hartford Financial Services Group, Inc. | 24 | 24,607 | ||||||||
6.10%, 10/01/41 | 165 | 156,105 | ||||||||
Humana, Inc. | 40 | 45,022 | ||||||||
7.20%, 6/15/18 | 155 | 181,026 | ||||||||
Lincoln National Corp. | 175 | 213,517 | ||||||||
Markel Corp. | 289 | 331,232 | ||||||||
| 14 | • ALLIANCEBERNSTEIN BOND INFLATION STRATEGY |
Portfolio of Investments
| Principal Amount (000) | U.S. $ Value | |||||||||
|
|
| ||||||||
Marsh & McLennan Cos., Inc. | U.S.$ | 207 | $ | 224,700 | ||||||
MetLife, Inc. | 90 | 103,018 | ||||||||
7.717%, 2/15/19 | 180 | 225,715 | ||||||||
Nationwide Financial Services, Inc. | 165 | 164,389 | ||||||||
Nationwide Mutual Insurance Co. | 125 | 153,368 | ||||||||
Principal Financial Group, Inc. | 120 | 136,476 | ||||||||
Prudential Financial, Inc. | 215 | 218,096 | ||||||||
XL Group PLC | 151 | 160,188 | ||||||||
|
| |||||||||
| 3,028,843 | ||||||||||
|
| |||||||||
Other Finance – 0.0% | ||||||||||
ORIX Corp. | 46 | 47,187 | ||||||||
|
| |||||||||
REITS – 0.2% | ||||||||||
HCP, Inc. | 214 | 219,785 | ||||||||
|
| |||||||||
| 6,646,931 | ||||||||||
|
| |||||||||
Industrial – 3.8% | ||||||||||
Basic – 0.5% | ||||||||||
AngloGold Ashanti Holdings PLC | 225 | 220,984 | ||||||||
ArcelorMittal | 110 | 106,295 | ||||||||
6.125%, 6/01/18 | 205 | 210,559 | ||||||||
Dow Chemical Co. (The) | 25 | 28,370 | ||||||||
8.55%, 5/15/19 | 67 | 87,039 | ||||||||
Packaging Corp. of America | 40 | 42,907 | ||||||||
|
| |||||||||
| 696,154 | ||||||||||
|
| |||||||||
Capital Goods – 0.1% | ||||||||||
Republic Services, Inc. | 8 | 8,365 | ||||||||
5.25%, 11/15/21 | 150 | 171,025 | ||||||||
|
| |||||||||
| 179,390 | ||||||||||
|
| |||||||||
Communications - Media – 1.0% | ||||||||||
CBS Corp. | 185 | 209,263 | ||||||||
8.875%, 5/15/19 | 25 | 32,302 | ||||||||
Comcast Corp. | 210 | 239,967 | ||||||||
| ALLIANCEBERNSTEIN BOND INFLATION STRATEGY • | 15 |
Portfolio of Investments
| Principal Amount (000) | U.S. $ Value | |||||||||
|
|
| ||||||||
News America, Inc. | U.S.$ | 216 | $ | 237,216 | ||||||
Reed Elsevier Capital, Inc. | 45 | 56,068 | ||||||||
Time Warner Cable, Inc. | 180 | 186,601 | ||||||||
5.00%, 2/01/20 | 35 | 38,454 | ||||||||
7.50%, 4/01/14 | 70 | 79,466 | ||||||||
8.75%, 2/14/19 | 25 | 32,517 | ||||||||
WPP Finance UK | 205 | 220,431 | ||||||||
|
| |||||||||
| 1,332,285 | ||||||||||
|
| |||||||||
Communications - Telecommunications – 0.6% | ||||||||||
American Tower Corp. | 35 | 36,975 | ||||||||
Bell Canada | CAD | 25 | 26,649 | |||||||
Deutsche Telekom International Finance BV | U.S.$ | 150 | 211,404 | |||||||
Koninklijke KPN NV | EUR | 50 | 71,341 | |||||||
Telecom Italia Capital SA | U.S.$ | 145 | 141,201 | |||||||
7.175%, 6/18/19 | 170 | 178,618 | ||||||||
United States Cellular Corp. | 220 | 213,063 | ||||||||
|
| |||||||||
| 879,251 | ||||||||||
|
| |||||||||
Consumer Cyclical - Automotive – 0.0% | ||||||||||
Harley-Davidson Funding Corp. | 30 | 32,700 | ||||||||
|
| |||||||||
Consumer Cyclical - Entertainment – 0.2% | ||||||||||
Viacom, Inc. | 80 | 91,806 | ||||||||
6.25%, 4/30/16 | 120 | 138,455 | ||||||||
|
| |||||||||
| 230,261 | ||||||||||
|
| |||||||||
Consumer Cyclical - Other – 0.1% | ||||||||||
Marriott International, Inc./DE | 125 | 129,637 | ||||||||
|
| |||||||||
Consumer Non-Cyclical – 0.3% | ||||||||||
Ahold Finance USA LLC | 25 | 31,158 | ||||||||
Bunge Ltd. Finance Corp. | 125 | 130,949 | ||||||||
8.50%, 6/15/19 | 75 | 91,745 | ||||||||
Delhaize Group SA | 205 | 224,611 | ||||||||
|
| |||||||||
| 478,463 | ||||||||||
|
| |||||||||
| 16 | • ALLIANCEBERNSTEIN BOND INFLATION STRATEGY |
Portfolio of Investments
| Principal Amount (000) | U.S. $ Value | |||||||||
|
|
| ||||||||
Energy – 0.5% | ||||||||||
Marathon Petroleum Corp. | U.S.$ | 9 | $ | 9,233 | ||||||
5.125%, 3/01/21(b) | 15 | 16,211 | ||||||||
Nabors Industries, Inc. | 175 | 220,393 | ||||||||
Noble Energy, Inc. | 175 | 230,230 | ||||||||
Valero Energy Corp. | 80 | 91,863 | ||||||||
Weatherford International Ltd./Bermuda | 70 | 91,282 | ||||||||
|
| |||||||||
| 659,212 | ||||||||||
|
| |||||||||
Technology – 0.3% | ||||||||||
Agilent Technologies, Inc. | 7 | 7,630 | ||||||||
Motorola Solutions, Inc. | 195 | 227,288 | ||||||||
Xerox Corp. | 195 | 222,010 | ||||||||
|
| |||||||||
| 456,928 | ||||||||||
|
| |||||||||
Transportation - Airlines – 0.0% | ||||||||||
Southwest Airlines Co. | 35 | 37,464 | ||||||||
|
| |||||||||
Transportation - Services – 0.2% | ||||||||||
Asciano Finance Ltd. | 47 | 49,968 | ||||||||
Ryder System, Inc. | 105 | 106,694 | ||||||||
5.85%, 11/01/16 | 105 | 120,622 | ||||||||
7.20%, 9/01/15 | 10 | 11,825 | ||||||||
|
| |||||||||
| 289,109 | ||||||||||
|
| |||||||||
| 5,400,854 | ||||||||||
|
| |||||||||
Utility – 1.3% | ||||||||||
Electric – 0.7% | ||||||||||
Allegheny Energy Supply Co. LLC | 130 | 141,553 | ||||||||
Constellation Energy Group, Inc. | 215 | 220,875 | ||||||||
FirstEnergy Solutions Corp. | 80 | 90,566 | ||||||||
6.80%, 8/15/39 | 80 | 93,048 | ||||||||
Nisource Finance Corp. | 95 | 109,579 | ||||||||
6.15%, 3/01/13 | 125 | 132,504 | ||||||||
6.80%, 1/15/19 | 75 | 89,704 | ||||||||
| ALLIANCEBERNSTEIN BOND INFLATION STRATEGY • | 17 |
Portfolio of Investments
| Principal Amount (000) | U.S. $ Value | |||||||||
|
|
| ||||||||
Ohio Power Co. | U.S.$ | 16 | $ | 16,745 | ||||||
TECO Finance, Inc. | 45 | 47,374 | ||||||||
|
| |||||||||
| 941,948 | ||||||||||
|
| |||||||||
Natural Gas – 0.6% | ||||||||||
DCP Midstream LLC | 20 | 26,262 | ||||||||
Energy Transfer Partners LP | 150 | 162,560 | ||||||||
6.125%, 2/15/17 | 145 | 160,187 | ||||||||
EQT Corp. | 62 | 73,770 | ||||||||
Kinder Morgan Energy Partners LP | 115 | 117,860 | ||||||||
Spectra Energy Capital LLC | 265 | 298,411 | ||||||||
8.00%, 10/01/19 | 25 | 31,404 | ||||||||
|
| |||||||||
| 870,454 | ||||||||||
|
| |||||||||
| 1,812,402 | ||||||||||
|
| |||||||||
Non Corporate Sectors – 0.3% | ||||||||||
Agencies - Not Government Guaranteed – 0.3% | ||||||||||
Gazprom OAO Via Gaz Capital SA | 320 | 344,400 | ||||||||
Petrobras International Finance Co. - PifCo | 105 | 112,766 | ||||||||
|
| |||||||||
| 457,166 | ||||||||||
|
| |||||||||
Total Corporates - Investment Grades | 14,317,353 | |||||||||
|
| |||||||||
ASSET-BACKED SECURITIES – 4.2% | ||||||||||
Autos - Fixed Rate – 2.1% | ||||||||||
AmeriCredit Automobile Receivables Trust | 1,125 | 1,123,737 | ||||||||
Series 2011-4, Class A2 | 200 | 199,902 | ||||||||
Ford Credit Auto Lease Trust | 320 | 319,793 | ||||||||
Series 2011-B, Class A2 | 449 | 448,959 | ||||||||
Huntington Auto Trust | 187 | 186,848 | ||||||||
| 18 | • ALLIANCEBERNSTEIN BOND INFLATION STRATEGY |
Portfolio of Investments
| Principal Amount (000) | U.S. $ Value | |||||||||
|
|
| ||||||||
Hyundai Auto Lease Securitization Trust | U.S.$ | 214 | $ | 213,795 | ||||||
Santander Drive Auto Receivables Trust | 189 | 189,082 | ||||||||
SMART Trust/Australia | 350 | 349,858 | ||||||||
|
| |||||||||
| 3,031,974 | ||||||||||
|
| |||||||||
Credit Cards - Floating Rate – 1.4% | ||||||||||
American Express Credit Account Master Trust | 680 | 680,000 | ||||||||
GE Capital Credit Card Master Note Trust | 165 | 166,142 | ||||||||
Series 2011-2, Class A | 580 | 580,079 | ||||||||
Penarth Master Issuer PLC | 480 | 479,183 | ||||||||
|
| |||||||||
| 1,905,404 | ||||||||||
|
| |||||||||
Autos - Floating Rate – 0.6% | ||||||||||
Ford Credit Floorplan Master Owner Trust | 690 | 696,669 | ||||||||
Hyundai Floorplan Master Owner Trust | 160 | 159,925 | ||||||||
|
| |||||||||
| 856,594 | ||||||||||
|
| |||||||||
Other ABS - Fixed Rate – 0.1% | ||||||||||
GE Equipment Midticket LLC | 145 | 144,901 | ||||||||
|
| |||||||||
Total Asset-Backed Securities | 5,938,873 | |||||||||
|
| |||||||||
COMMERCIAL MORTGAGE-BACKED SECURITIES – 2.1% | ||||||||||
Non-Agency Fixed Rate CMBS – 2.1% | ||||||||||
Banc of America Merrill Lynch Commercial Mortgage, Inc. | 80 | 86,053 | ||||||||
Bear Stearns Commercial Mortgage Securities | 75 | 84,163 | ||||||||
| ALLIANCEBERNSTEIN BOND INFLATION STRATEGY • | 19 |
Portfolio of Investments
| Principal Amount (000) | U.S. $ Value | |||||||||
|
|
| ||||||||
Commercial Mortgage Pass Through Certificates | U.S.$ | 55 | $ | 58,996 | ||||||
Credit Suisse First Boston Mortgage Securities Corp. | 380 | 413,064 | ||||||||
Greenwich Capital Commercial Funding Corp. | 530 | 567,058 | ||||||||
GS Mortgage Securities Corp. II | 28 | 28,001 | ||||||||
JP Morgan Chase Commercial Mortgage Securities Corp. | 503 | 543,369 | ||||||||
Series 2006-CB16, Class A4 | 80 | 87,154 | ||||||||
Series 2007-LDPX, Class A3 | 435 | 462,231 | ||||||||
LB-UBS Commercial Mortgage Trust | 70 | 75,916 | ||||||||
Series 2006-C1, Class A4 | 38 | 42,064 | ||||||||
Series 2006-C4, Class A4 | 60 | 67,058 | ||||||||
Series 2007-C1, Class A4 | 290 | 308,320 | ||||||||
Merrill Lynch/Countrywide Commercial Mortgage Trust | 25 | 27,264 | ||||||||
Series 2007-9, Class A4 | 125 | 130,374 | ||||||||
|
| |||||||||
Total Commercial Mortgage-Backed Securities | 2,981,085 | |||||||||
|
| |||||||||
MORTGAGE PASS-THROUGH’S – 1.5% | ||||||||||
Agency Fixed Rate 30-Year – 1.5% | ||||||||||
Federal National Mortgage Association | 2,020 | 2,053,930 | ||||||||
|
| |||||||||
| 20 | • ALLIANCEBERNSTEIN BOND INFLATION STRATEGY |
Portfolio of Investments
| Principal Amount (000) | U.S. $ Value | |||||||||
|
|
| ||||||||
GOVERNMENTS - SOVEREIGN AGENCIES – 0.7% | ||||||||||
Australia – 0.0% | ||||||||||
Suncorp-Metway Ltd. | U.S.$ | 45 | $ | 45,473 | ||||||
|
| |||||||||
Netherlands – 0.2% | ||||||||||
NIBC Bank NV | EUR | 110 | 153,166 | |||||||
SNS Bank NV | 110 | 152,791 | ||||||||
|
| |||||||||
| 305,957 | ||||||||||
|
| |||||||||
United Kingdom – 0.1% | ||||||||||
Lloyds TSB Bank PLC | GBP | 50 | 80,948 | |||||||
Yorkshire Building Society | 50 | 80,689 | ||||||||
|
| |||||||||
| 161,637 | ||||||||||
|
| |||||||||
United States – 0.4% | ||||||||||
Goldman Sachs Group, Inc. (The) - FDIC Insured | EUR | 375 | 520,032 | |||||||
|
| |||||||||
Total Governments - Sovereign Agencies | 1,033,099 | |||||||||
|
| |||||||||
QUASI-SOVEREIGNS – 0.5% | ||||||||||
Quasi-Sovereign Bonds – 0.5% | ||||||||||
Kazakhstan – 0.1% | ||||||||||
KazMunayGas National Co. | U.S.$ | 124 | 135,780 | |||||||
|
| |||||||||
Malaysia – 0.2% | ||||||||||
Petronas Capital Ltd. | 310 | 350,574 | ||||||||
|
| |||||||||
Russia – 0.2% | ||||||||||
Russian Agricultural Bank OJSC Via RSHB Capital SA | 250 | 275,937 | ||||||||
|
| |||||||||
Total Quasi-Sovereigns | 762,291 | |||||||||
|
| |||||||||
SUPRANATIONALS – 0.2% | ||||||||||
European Bank for Reconstruction & Development | BRL | 425 | 249,717 | |||||||
European Investment Bank | U.S.$ | 50 | 50,055 | |||||||
|
| |||||||||
Total Supranationals | 299,772 | |||||||||
|
| |||||||||
| ALLIANCEBERNSTEIN BOND INFLATION STRATEGY • | 21 |
Portfolio of Investments
| Principal Amount (000) | U.S. $ Value | |||||||||
|
|
| ||||||||
GOVERNMENTS - SOVEREIGN BONDS – 0.1% | ||||||||||
Poland – 0.0% | ||||||||||
Poland Government International Bond | U.S.$ | 16 | $ | 16,400 | ||||||
|
| |||||||||
Russia – 0.1% | ||||||||||
Russian Foreign Bond - Eurobond | 79 | 94,119 | ||||||||
|
| |||||||||
Total Governments - Sovereign Bonds | 110,519 | |||||||||
|
| |||||||||
COLLATERALIZED MORTGAGE OBLIGATIONS – 0.0% | ||||||||||
Non-Agency Fixed Rate – 0.0% | ||||||||||
Merrill Lynch Mortgage Investors, Inc. | 2 | 2,014 | ||||||||
|
| |||||||||
| Shares | ||||||||||
SHORT-TERM INVESTMENTS – 0.1% | ||||||||||
Investment Companies – 0.1% | ||||||||||
AllianceBernstein Fixed-Income Shares, Inc. - Government STIF Portfolio, | 195,462 | 195,462 | ||||||||
|
| |||||||||
Total Investments – 115.2% | 163,317,009 | |||||||||
Other assets less liabilities – (15.2)% | (21,597,013 | ) | ||||||||
|
| |||||||||
Net Assets – 100.0% | $ | 141,719,996 | ||||||||
|
| |||||||||
FUTURES CONTRACTS (see Note D)
| Type | Number of Contracts | Expiration Month | Original Value | Value at October 31, 2011 | Unrealized Appreciation/ (Depreciation) | |||||||||||||||
Sold Contracts | ||||||||||||||||||||
U.S. T-Bond 30 Yr Futures | 14 | December 2011 | $ | 1,984,797 | $ | 1,946,438 | $ | 38,359 | ||||||||||||
U.S. T-Note 5 Yr Futures | 18 | December 2011 | 2,205,728 | 2,206,969 | (1,241 | ) | ||||||||||||||
U.S. T-Note 10 Yr Futures | 35 | December 2011 | 4,535,614 | 4,517,188 | 18,426 | |||||||||||||||
|
| |||||||||||||||||||
| $ | 55,544 | |||||||||||||||||||
|
| |||||||||||||||||||
| 22 | • ALLIANCEBERNSTEIN BOND INFLATION STRATEGY |
Portfolio of Investments
FORWARD CURRENCY EXCHANGE CONTRACTS (see Note D)
| Counterparty & Description | Contract Amount (000) | U.S. $ Value on Origination Date | U.S. $ Value at October 31, 2011 | Unrealized Appreciation/ (Depreciation) | ||||||||||||
Buy Contracts | ||||||||||||||||
State Street Bank and Trust Co.: | ||||||||||||||||
Brazilian Real settling 11/03/11 | 458 | $ | 259,746 | $ | 266,653 | $ | 6,907 | |||||||||
Sale Contracts | ||||||||||||||||
State Street Bank and Trust Co.: | ||||||||||||||||
Brazilian Real settling 11/03/11 | 458 | 252,483 | 266,652 | (14,169 | ) | |||||||||||
Brazilian Real settling 12/02/11 | 458 | 258,063 | 264,746 | (6,683 | ) | |||||||||||
Euro settling 11/17/11 | 910 | 1,249,331 | 1,259,445 | (10,114 | ) | |||||||||||
Great British Pound settling 11/09/11 | 102 | 157,002 | 163,384 | (6,382 | ) | |||||||||||
|
| |||||||||||||||
| $ | (30,441 | ) | ||||||||||||||
|
| |||||||||||||||
INTEREST RATE SWAP TRANSACTIONS (see Note D)
| Rate Type | ||||||||||||||||||||
| Swap Counterparty | Notional Amount (000) | Termination Date | Payments made by the Portfolio | Payments received by the Portfolio | Unrealized Appreciation/ (Depreciation) | |||||||||||||||
Barclays Bank PLC | $ | 7,310 | 6/7/13 | 0.627 | % | 3 Month LIBOR | $ | (24,810 | ) | |||||||||||
Barclays Bank PLC | 1,000 | 11/17/13 | 1.059 | % | 3 Month LIBOR | (14,238 | ) | |||||||||||||
Deutsche Bank AG | 910 | 10/13/21 | 3 Month LIBOR | 2.352 | % | 2,164 | ||||||||||||||
JPMorgan Chase Bank, N.A. | 7,780 | 10/13/13 | 0.687 | % | 3 Month LIBOR | (20,483 | ) | |||||||||||||
|
| |||||||||||||||||||
| $ | (57,367 | ) | ||||||||||||||||||
|
| |||||||||||||||||||
CREDIT DEFAULT SWAP CONTRACTS ON INDICES (see Note D)
| Swap Counterparty & Referenced Obligation | Fixed Deal (Pay) Receive Rate | Implied Credit Spread at October 31, 2011 | Notional Amount (000) | Market Value | Upfront Premiums Paid (Received) | Unrealized Appreciation/ (Depreciation) | ||||||||||||||||||
Buy Contracts | ||||||||||||||||||||||||
Morgan Stanley Capital Services Inc.: | ||||||||||||||||||||||||
ITRAXX-FINSENS16V1-5 Year Index, 12/20/16* | (1.00) | % | 2.25 | % | EUR | 1,790 | $ | 137,108 | $ | 215,634 | $ | (78,526) | ||||||||||||
Sale Contracts | ||||||||||||||||||||||||
Morgan Stanley Capital Services Inc.: | ||||||||||||||||||||||||
CDX-NAIGS17V1-5 Year Index, 12/20/16* | 1.00 | 1.21 | $ | 3,090 | (27,391) | (59,168) | 31,777 | |||||||||||||||||
|
| |||||||||||||||||||||||
| $ | (46,749) | |||||||||||||||||||||||
|
| |||||||||||||||||||||||
| * | Termination date |
| ALLIANCEBERNSTEIN BOND INFLATION STRATEGY • | 23 |
Portfolio of Investments
REVERSE REPURCHASE AGREEMENTS (see Note D)
| Broker | Interest Rate | Maturity | U.S. $ Value at October 31, 2011 | |||||||||
Bank of America† | 0.11 | % | – 0 | – | $ | 12,684,532 | ||||||
Bank of America | 0.23 | % | 1/05/12 | 8,436,577 | ||||||||
|
| |||||||||||
| $ | 21,121,109 | |||||||||||
|
| |||||||||||
| † | The reverse repurchase agreement matures on demand. The interest rate shown is a variable rate and was in effect on October 31, 2011. |
| (a) | Position, or a portion thereof, has been segregated to collateralize reverse repurchase agreements. The market value of the collateral amounted to $21,392,598. |
| (b) | Security is exempt from registration under Rule 144A of the Securities Act of 1933. These securities are considered liquid and may be resold in transactions exempt from registration, normally to qualified institutional buyers. At October 31, 2011, the aggregate market value of these securities amounted to $3,338,349 or 2.4% of net assets. |
| (c) | Floating Rate Security. Stated interest rate was in effect at October 31, 2011. |
| (d) | Investment in affiliated money market mutual fund. The rate shown represents the 7-day yield as of period end. |
Currency Abbreviations:
BRL – Brazilian Real
CAD – Canadian Dollar
EUR – Euro
GBP – Great British Pound
Glossary:
ABS – Asset-Backed Securities
CMBS – Commercial Mortgage-Backed Securities
FDIC – Federal Deposit Insurance Corporation
LIBOR – London Interbank Offered Rates
OJSC – Open Joint Stock Company
REIT – Real Estate Investment Trust
TIPS – Treasury Inflation Protected Security
See notes to financial statements.
| 24 | • ALLIANCEBERNSTEIN BOND INFLATION STRATEGY |
Portfolio of Investments
STATEMENT OF ASSETS & LIABILITIES
October 31, 2011
| Assets | ||||
Investments in securities, at value | ||||
Unaffiliated issuers (cost $159,583,475) | $ | 163,121,547 | ||
Affiliated issuers (cost $195,462) | 195,462 | |||
Cash | 115,600 | (a) | ||
Receivable for capital stock sold | 1,205,334 | |||
Interest receivable | 896,092 | |||
Premium paid on credit default swap contracts | 215,634 | |||
Unrealized appreciation on credit default swap contracts | 31,777 | |||
Receivable due from Adviser | 8,180 | |||
Unrealized appreciation of forward currency exchange contracts | 6,907 | |||
Receivable for foreign currency transactions | 4,477 | |||
Unrealized appreciation on interest rate swap contracts | 2,164 | |||
|
| |||
Total assets | 165,803,174 | |||
|
| |||
| Liabilities | ||||
Due to custodian | 1,668 | |||
Payable for reverse repurchase agreements | 21,121,109 | |||
Payable for investment securities purchased and foreign currency transactions | 2,072,796 | |||
Payable for capital stock redeemed | 440,636 | |||
Unrealized depreciation on credit default swap contracts | 78,526 | |||
Payable for variation margin on futures contracts | 73,937 | |||
Unrealized depreciation on interest rate swap contracts | 59,531 | |||
Premium received on credit default swap contracts | 59,168 | |||
Unrealized depreciation of forward currency exchange contracts | 37,348 | |||
Distribution fee payable | 16,186 | |||
Accrued expenses | 122,273 | |||
|
| |||
Total liabilities | 24,083,178 | |||
|
| |||
Net Assets | $ | 141,719,996 | ||
|
| |||
| Composition of Net Assets | ||||
Capital stock, at par | $ | 131,404 | ||
Additional paid-in capital | 138,737,765 | |||
Undistributed net investment income | 352,468 | |||
Accumulated net realized loss on investment | (960,454 | ) | ||
Net unrealized appreciation on investments | 3,458,813 | |||
|
| |||
| $ | 141,719,996 | |||
|
|
| ALLIANCEBERNSTEIN BOND INFLATION STRATEGY • | 25 |
Statement of Assets & Liabilities
Net Asset Value Per Share—24 billion shares of capital stock authorized, $.01 par value
| Class | Net Assets | Shares Outstanding | Net Asset Value | |||||||||
| A | $ | 9,731,799 | 899,847 | $ | 10.81 | * | ||||||
| ||||||||||||
| C | $ | 6,782,097 | 629,417 | $ | 10.78 | |||||||
| ||||||||||||
| Advisor | $ | 2,325,336 | 214,783 | $ | 10.83 | |||||||
| ||||||||||||
| R | $ | 488,387 | 45,272 | $ | 10.79 | |||||||
| ||||||||||||
| K | $ | 565,554 | 52,394 | $ | 10.79 | |||||||
| ||||||||||||
| I | $ | 75,950 | 7,046 | $ | 10.78 | |||||||
| ||||||||||||
| 1 | $ | 105,201,204 | 9,755,595 | $ | 10.78 | |||||||
| ||||||||||||
| 2 | $ | 16,549,669 | 1,536,095 | $ | 10.77 | |||||||
| ||||||||||||
| * | The maximum offering price per share for Class A shares was $11.29 which reflects a sales charge of 4.25%. |
| (a) | An amount of $115,600 has been segregated to collateralize margin requirements for open futures contracts outstanding at October 31, 2011. |
See notes to financial statements.
| 26 | • ALLIANCEBERNSTEIN BOND INFLATION STRATEGY |
Statement of Assets & Liabilities
STATEMENT OF OPERATIONS
Year Ended October 31, 2011
| Investment Income | ||||||||
Interest | $ | 2,726,243 | ||||||
Dividends—Affiliated issuers | 1,108 | $ | 2,727,351 | |||||
|
| |||||||
| Expenses | ||||||||
Advisory fee (see Note B) | 340,213 | |||||||
Distribution fee—Class A | 15,316 | |||||||
Distribution fee—Class C | 56,248 | |||||||
Distribution fee—Class R | 1,739 | |||||||
Distribution fee—Class K | 1,221 | |||||||
Distribution fee—Class 1 | 39,558 | |||||||
Transfer agency—Class A | 5,157 | |||||||
Transfer agency—Class C | 6,622 | |||||||
Transfer agency—Advisor Class | 1,924 | |||||||
Transfer agency—Class R | 705 | |||||||
Transfer agency—Class K | 748 | |||||||
Transfer agency—Class I | 2 | |||||||
Transfer agency—Class 1 | 7,663 | |||||||
Transfer agency—Class 2 | 2,975 | |||||||
Registration fees | 138,395 | |||||||
Custodian | 131,338 | |||||||
Administrative | 66,574 | |||||||
Amortization of offering expenses | 63,052 | |||||||
Audit | 53,698 | |||||||
Legal | 47,253 | |||||||
Printing | 40,757 | |||||||
Directors’ fees | 13,029 | |||||||
Miscellaneous | 4,081 | |||||||
|
| |||||||
Total expenses before interest expense | 1,038,268 | |||||||
Interest expense | 22,661 | |||||||
|
| |||||||
Total expenses | 1,060,929 | |||||||
Less: expenses waived and reimbursed by the Adviser (see Note B) | (617,995 | ) | ||||||
|
| |||||||
Net expenses | 442,934 | |||||||
|
| |||||||
Net investment income | 2,284,417 | |||||||
|
| |||||||
| Realized and Unrealized Gain (Loss) on Investment and Foreign Currency Transactions | ||||||||
Net realized gain (loss) on: | ||||||||
Investment transactions | 144,613 | |||||||
Futures contracts | (679,693 | ) | ||||||
Swap contracts | (200,247 | ) | ||||||
Foreign currency transactions | (1,270 | ) | ||||||
Net change in unrealized appreciation/depreciation of: | ||||||||
Investments | 2,690,876 | |||||||
Futures contracts | 61,733 | |||||||
Swap contracts | (66,816 | ) | ||||||
Foreign currency denominated assets and liabilities | (13,116 | ) | ||||||
|
| |||||||
Net gain on investment and foreign currency transactions | 1,936,080 | |||||||
|
| |||||||
Net Increase in Net Assets from | $ | 4,220,497 | ||||||
|
|
See notes to financial statements.
| ALLIANCEBERNSTEIN BOND INFLATION STRATEGY • | 27 |
Statement of Operations
STATEMENT OF CHANGES IN NET ASSETS
| Year Ended October 31, 2011 | January 26, 2010(a) to October 31, 2010 | |||||||
| Increase (Decrease) in Net Assets from Operations | ||||||||
Net investment income | $ | 2,284,417 | $ | 192,729 | ||||
Net realized loss on investment and foreign currency transactions | (736,597 | ) | (68,001 | ) | ||||
Net change in unrealized appreciation/depreciation of investments and foreign currency denominated assets and liabilities | 2,672,677 | 786,136 | ||||||
|
|
|
| |||||
Net increase in net assets from operations | 4,220,497 | 910,864 | ||||||
| Dividends and Distributions to Shareholders from | ||||||||
Net investment income | ||||||||
Class A | (157,776 | ) | (6,913 | ) | ||||
Class C | (134,028 | ) | (6,337 | ) | ||||
Advisor Class | (57,766 | ) | (6,220 | ) | ||||
Class R | (11,992 | ) | (94 | ) | ||||
Class K | (11,295 | ) | (1,661 | ) | ||||
Class I | (359 | ) | (123 | ) | ||||
Class 1 | (1,251,995 | ) | (116 | ) | ||||
Class 2 | (519,549 | ) | (120,917 | ) | ||||
Tax return of capital | ||||||||
Class A | – 0 | – | (342 | ) | ||||
Class C | – 0 | – | (314 | ) | ||||
Advisor Class | – 0 | – | (308 | ) | ||||
Class R | – 0 | – | (5 | ) | ||||
Class K | – 0 | ��– | (82 | ) | ||||
Class I | – 0 | – | (6 | ) | ||||
Class 1 | – 0 | – | (6 | ) | ||||
Class 2 | – 0 | – | (5,989 | ) | ||||
| Capital Stock Transactions | ||||||||
Net increase | 121,908,504 | 16,974,324 | ||||||
|
|
|
| |||||
Total increase | 123,984,241 | 17,735,755 | ||||||
| Net Assets | ||||||||
Beginning of period | 17,735,755 | – 0 | – | |||||
|
|
|
| |||||
End of period (including undistributed net investment income of $352,468 and $4,829, respectively) | $ | 141,719,996 | $ | 17,735,755 | ||||
|
|
|
| |||||
| (a) | Commencement of operations. |
See notes to financial statements.
| 28 | • ALLIANCEBERNSTEIN BOND INFLATION STRATEGY |
Statement of Changes in Net Assets
STATEMENT OF CASH FLOWS
Year Ended October 31, 2011
| Increase (Decrease) in Cash from Operating Activities: | ||||||||
Interest and dividends received | $ | 1,159,222 | ||||||
Interest expense paid | (22,661 | ) | ||||||
Operating expenses paid | (379,307 | ) | ||||||
Purchases of long-term investments | (167,368,826 | ) | ||||||
Proceeds from disposition of long-term investments | 31,254,117 | |||||||
Proceeds from disposition of short-term investments, net | 471,712 | |||||||
Payments on swap contracts, net | (367,854 | ) | ||||||
Variation margin paid on futures contracts, net | (545,467 | ) | ||||||
|
| |||||||
Net decrease in cash from operating activities | $ | (135,799,064 | ) | |||||
| Financing Activities: | ||||||||
Cash dividends paid (net of dividend reinvestments) | (1,591,387 | ) | ||||||
Subscriptions of capital stock, net | 120,553,470 | |||||||
Increase in reverse repurchase agreements | 16,839,722 | |||||||
|
| |||||||
Net increase in cash from financing activities | 135,801,805 | |||||||
Effect of exchange rate on cash | 104,297 | |||||||
|
| |||||||
Net increase in cash | 107,038 | |||||||
Cash at beginning of period | 6,894 | |||||||
|
| |||||||
Cash at end of period | $ | 113,932 | ||||||
|
| |||||||
| Reconciliation of Net Increase in Net Assets from Operations to Net Increase in Cash from Operating Activities: | ||||||||
Net increase in net assets from operations | $ | 4,220,497 | ||||||
| Adjustments: | ||||||||
Increase in interest and dividends receivable | $ | (719,976 | ) | |||||
Net accretion of bond discount and amortization of bond premium | 1,347,319 | |||||||
Inflation Index Adjustment | (2,195,472 | ) | ||||||
Increase in accrued expenses | 40,966 | |||||||
Purchases of long-term investments | (167,368,826) | |||||||
Proceeds from disposition of long-term investments | 31,254,117 | |||||||
Proceeds from disposition of short-term investments, net | 471,712 | |||||||
Payments on swap contracts, net | (367,854) | |||||||
Variation margin paid on futures contracts, net | (545,467) | |||||||
Net realized loss on investment and foreign currency transactions | 736,597 | |||||||
Net change in unrealized appreciation/depreciation of investments and foreign currency denominated assets and liabilities | (2,672,677 | ) | ||||||
|
| |||||||
Total adjustments | (140,019,561 | ) | ||||||
|
| |||||||
Net decrease in cash from operating activities | $ | (135,799,064) | ||||||
|
|
See notes to financial statements.
| ALLIANCEBERNSTEIN BOND INFLATION STRATEGY • | 29 |
Statement of Cash Flows
NOTES TO FINANCIAL STATEMENTS
October 31, 2011
NOTE A
Significant Accounting Policies
AllianceBernstein Bond Fund, Inc. (the “Fund”) is registered under the Investment Company Act of 1940 as a diversified, open-end management investment company. The Fund, which is a Maryland corporation, operates as a series company currently comprised of four portfolios: the Intermediate Bond Portfolio, the Bond Inflation Strategy Portfolio, the Municipal Bond Inflation Strategy Portfolio and the Real Asset Strategy Portfolio. The Bond Inflation Strategy Portfolio commenced operations on January 26, 2010. This report relates only to the Bond Inflation Strategy Portfolio. The Bond Inflation Strategy Portfolio (the “Strategy”) offers Class A, Class C, Advisor Class, Class R, Class K, Class I, Class 1 and Class 2 shares. Class 1 shares are sold only to the private clients of Sanford C. Bernstein & Co. LLC by its registered representatives. Class A shares are sold with a front-end sales charge of up to 4.25% for purchases not exceeding $1,000,000. With respect to purchases of $1,000,000 or more, Class A shares redeemed within one year of purchase may be subject to a contingent deferred sales charge of 1%. Class C shares are subject to a contingent deferred sales charge of 1% on redemptions made within the first year after purchase. Class R, Class K, and Class 1 shares are sold without an initial or contingent deferred sales charge. Advisor Class, Class I, and Class 2 shares are sold without an initial or contingent deferred sales charge and are not subject to ongoing distribution expenses. All eight classes of shares have identical voting, dividend, liquidation and other rights, except that the classes bear different distribution and transfer agency expenses. Each class has exclusive voting rights with respect to its distribution plan. The financial statements have been prepared in conformity with U.S. generally accepted accounting principles (“U.S. GAAP”) which require management to make certain estimates and assumptions that affect the reported amounts of assets and liabilities in the financial statements and amounts of income and expenses during the reporting period. Actual results could differ from those estimates. The following is a summary of significant accounting policies followed by the Strategy.
1. Security Valuation
Portfolio securities are valued at their current market value determined on the basis of market quotations or, if market quotations are not readily available or are deemed unreliable, at “fair value” as determined in accordance with procedures established by and under the general supervision of the Fund’s Board of Directors.
In general, the market value of securities which are readily available and deemed reliable are determined as follows: Securities listed on a national securities exchange (other than securities listed on the NASDAQ Stock Market, Inc. (“NASDAQ”)) or on a foreign securities exchange are valued at the last sale price at the close of the exchange or foreign securities exchange. If there has been no sale on such day, the securities are valued at the mean of the closing bid
| 30 | • ALLIANCEBERNSTEIN BOND INFLATION STRATEGY |
Notes to Financial Statements
and ask prices on such day. Securities listed on more than one exchange are valued by reference to the principal exchange on which the securities are traded; securities listed only on NASDAQ are valued in accordance with the NASDAQ Official Closing Price; listed or over the counter market (“OTC”) put or call options are valued at the mid level between the current bid and ask prices. If either a current bid or current ask price is unavailable, the Adviser will have discretion to determine the best valuation (e.g. last trade price); open futures contracts and options thereon are valued using the closing settlement price or, in the absence of such a price, the most recent quoted bid price. If there are no quotations available for the day of valuation, the last available closing settlement price is used; U.S. government securities and other debt instruments having 60 days or less remaining until maturity are valued at amortized cost if their original maturity was 60 days or less; or by amortizing their fair value as of the 61st day prior to maturity if their original term to maturity exceeded 60 days; fixed-income securities, including mortgage backed and asset backed securities, may be valued on the basis of prices provided by a pricing service or at a price obtained from one or more of the major broker/dealers. In cases where broker/dealer quotes are obtained, the Adviser may establish procedures whereby changes in market yields or spreads are used to adjust, on a daily basis, a recently obtained quoted price on a security; and swaps and other derivatives are valued daily, primarily using independent pricing services, independent pricing models using market inputs, as well as third party broker-dealers or counterparties, which are approved by the Board of Directors. Investments in money market funds are valued at their net asset value each day.
Securities for which market quotations are not readily available (including restricted securities) or are deemed unreliable are valued at fair value. Factors considered in making this determination may include, but are not limited to, information obtained by contacting the issuer, analysts, analysis of the issuer’s financial statements or other available documents. In addition, the Strategy may use fair value pricing for securities primarily traded in non-U.S. markets because most foreign markets close well before the Strategy values its securities at 4:00 p.m., Eastern Time. The earlier close of these foreign markets gives rise to the possibility that significant events, including broad market moves, may have occurred in the interim and may materially affect the value of those securities.
2. Fair Value Measurements
In accordance with U.S. GAAP regarding fair value measurements, fair value is defined as the price that the Strategy would receive to sell an asset or pay to transfer a liability in an orderly transaction between market participants at the measurement date. The U.S. GAAP disclosure requirements establish a framework for measuring fair value, and a three-level hierarchy for fair value measurements based upon the transparency of inputs to the valuation of an asset or liability. Inputs may be observable or unobservable and refer broadly to the assumptions that market participants would use in pricing the asset or liability.
| ALLIANCEBERNSTEIN BOND INFLATION STRATEGY • | 31 |
Notes to Financial Statements
Observable inputs reflect the assumptions market participants would use in pricing the asset or liability based on market data obtained from sources independent of the Strategy. Unobservable inputs reflect the Strategy’s own assumptions about the assumptions that market participants would use in pricing the asset or liability based on the best information available in the circumstances. Each investment is assigned a level based upon the observability of the inputs which are significant to the overall valuation. The three-tier hierarchy of inputs is summarized below.
| • | Level 1—quoted prices in active markets for identical investments |
| • | Level 2—other significant observable inputs (including quoted prices for similar investments, interest rates, prepayment speeds, credit risk, etc.) |
| • | Level 3—significant unobservable inputs (including the Strategy’s own assumptions in determining the fair value of investments) |
The following table summarizes the valuation of the Strategy’s investments by the above fair value hierarchy levels as of October 31, 2011:
Investments in | Level 1 | Level 2 | Level 3 | Total | ||||||||||||
Assets: | ||||||||||||||||
Inflation-Linked Securities | $ | – 0 | – | $ | 135,622,611 | $ | – 0 | – | $ | 135,622,611 | ||||||
Corporates – Investment Grades | – 0 | – | 14,317,353 | – 0 | – | 14,317,353 | ||||||||||
Asset-Backed Securities | – 0 | – | 5,793,972 | 144,901 | 5,938,873 | |||||||||||
Commercial Mortgage-Backed Securities | – 0 | – | 2,542,391 | 438,694 | 2,981,085 | |||||||||||
Mortgage Pass-Through’s | – 0 | – | 2,053,930 | – 0 | – | 2,053,930 | ||||||||||
Governments – Sovereign Agencies | – 0 | – | 1,033,099 | – 0 | – | 1,033,099 | ||||||||||
Quasi-Sovereigns | – 0 | – | 762,291 | – 0 | – | 762,291 | ||||||||||
Supranationals | – 0 | – | 299,772 | – 0 | – | 299,772 | ||||||||||
Governments – Sovereign Bonds | – 0 | – | 110,519 | – 0 | – | 110,519 | ||||||||||
Collateralized Mortgage Obligations | – 0 | – | – 0 | – | 2,014 | 2,014 | ||||||||||
Short-Term Investments | 195,462 | – 0 | – | – 0 | – | 195,462 | ||||||||||
|
|
|
|
|
|
|
| |||||||||
Total Investments in Securities | 195,462 | 162,535,938 | + | 585,609 | 163,317,009 | |||||||||||
Other Financial Instruments*: | ||||||||||||||||
Assets: | ||||||||||||||||
Futures Contracts | 56,785 | – 0 | – | – 0 | – | 56,785 | # | |||||||||
Forward Currency Exchange Contracts | – 0 | – | 6,907 | – 0 | – | 6,907 | ||||||||||
Interest Rate Swap Contracts | – 0 | – | 2,164 | – 0 | – | 2,164 | ||||||||||
Credit Default Swap Contracts | – 0 | – | 31,777 | – 0 | – | 31,777 | ||||||||||
Liabilities: | ||||||||||||||||
Futures Contracts | (1,241 | ) | – 0 | – | – 0 | – | (1,241 | )# | ||||||||
Forward Currency Exchange Contracts | – 0 | – | (37,348 | ) | – 0 | – | (37,348 | ) | ||||||||
Interest Rate Swap Contracts | – 0 | – | (59,531 | ) | – 0 | – | (59,531 | ) | ||||||||
Credit Default Swap Contracts | – 0 | – | (78,526 | ) | – 0 | – | (78,526 | ) | ||||||||
|
|
|
|
|
|
|
| |||||||||
Total | $ | 251,006 | $ | 162,401,381 | $ | 585,609 | $ | 163,237,996 | ||||||||
|
|
|
|
|
|
|
| |||||||||
| * | Other financial instruments are derivative instruments, such as futures, forwards and swap contracts, which are valued at the unrealized appreciation/depreciation on the instrument. |
| 32 | • ALLIANCEBERNSTEIN BOND INFLATION STRATEGY |
Notes to Financial Statements
| + | A significant portion of the Strategy’s foreign equity investments are categorized as Level 2 investments since they are valued using fair value prices based on third party vendor modeling tools to the extent available, see Note A.1. |
| # | Only variation margin receivable/payable at period end is reported within the statement of assets and liabilities. This amount reflects cumulative appreciation/(depreciation) of futures contracts as reported in the portfolio of investments. |
Following is a reconciliation of investments in which significant unobservable inputs (Level 3) were used in determining fair value. The transfers between levels of the fair value hierarchy assumes the financial instrument was transferred at the beginning of the reporting period.
| Asset- Backed Securities | Commercial Mortgage- Backed Securities | Collateralized Mortgage Obligations | ||||||||||
Balance as of 10/31/10 | $ | – 0 | – | $ | 120,523 | $ | 8,944 | |||||
Accrued discounts/(premiums) | – 0 | – | (1,522 | ) | 20 | |||||||
Realized gain (loss) | – 0 | – | 18,489 | 711 | ||||||||
Change in unrealized appreciation/depreciation | – 0 | – | (22,389 | ) | (493 | ) | ||||||
Purchases | 144,901 | 495,355 | – 0 | – | ||||||||
Sales | – 0 | – | (171,762 | ) | (7,168 | ) | ||||||
Transfers in to Level 3 | – 0 | – | – 0 | – | – 0 | – | ||||||
Transfers out of Level 3 | – 0 | – | – 0 | – | – 0 | – | ||||||
|
|
|
|
|
| |||||||
Balance as of 10/31/11 | $ | 144,901 | $ | 438,694 | $ | 2,014 | ||||||
|
|
|
|
|
| |||||||
Net change in unrealized | $ | – 0 | – | $ | (3,145 | ) | $ | (493 | ) | |||
| Total | ||||||||||||
Balance as of 10/31/10 | $ | 129,467 | ||||||||||
Accrued discounts/(premiums) | (1,502 | ) | ||||||||||
Realized gain (loss) | 19,200 | |||||||||||
Change in unrealized appreciation/depreciation | (22,882 | ) | ||||||||||
Purchases | 640,256 | |||||||||||
Sales | (178,930 | ) | ||||||||||
Transfers in to Level 3 | – 0 | – | ||||||||||
Transfers out of Level 3 | – 0 | – | ||||||||||
|
| |||||||||||
Balance as of 10/31/11 | $ | 585,609 | ||||||||||
|
| |||||||||||
Net change in unrealized | $ | (3,638 | ) | |||||||||
| * | The unrealized appreciation/depreciation is included in net change in unrealized appreciation/depreciation of investments in the accompanying statement of operations. |
3. Currency Translation
Assets and liabilities denominated in foreign currencies and commitments under forward currency exchange contracts are translated into U.S. dollars at the mean
| ALLIANCEBERNSTEIN BOND INFLATION STRATEGY • | 33 |
Notes to Financial Statements
of the quoted bid and asked prices of such currencies against the U.S. dollar. Purchases and sales of portfolio securities are translated into U.S. dollars at the rates of exchange prevailing when such securities were acquired or sold. Income and expenses are translated into U.S. dollars at rates of exchange prevailing when accrued.
Net realized gain or loss on foreign currency transactions represents foreign exchange gains and losses from sales and maturities of foreign fixed income investments, foreign currency exchange contracts, holding of foreign currencies, currency gains or losses realized between the trade and settlement dates on foreign investment transactions, and the difference between the amounts of dividends, interest and foreign withholding taxes recorded on the Strategy’s books and the U.S. dollar equivalent amounts actually received or paid. Net unrealized currency gains and losses from valuing foreign currency denominated assets and liabilities at period end exchange rates are reflected as a component of net unrealized appreciation or depreciation of investments and foreign currency denominated assets and liabilities.
4. Taxes
It is the Strategy’s policy to meet the requirements of the Internal Revenue Code applicable to regulated investment companies and to distribute all of its investment company taxable income and net realized gains, if any, to shareholders. Therefore, no provisions for federal income or excise taxes are required. The Strategy may be subject to taxes imposed by countries in which it invests. Such taxes are generally based on income and/or capital gains earned or repatriated. Taxes are accrued and applied to net investment income, net realized gains and net unrealized appreciation/depreciation as such income and/or gains are earned.
In accordance with U.S. GAAP requirements regarding accounting for uncertainties in income taxes, management has analyzed the Strategy’s tax positions taken or expected to be taken on federal and state income tax returns for all open tax years (all years since inception of the Strategy) and has concluded that no provision for income tax is required in the Strategy’s financial statements.
5. Investment Income and Investment Transactions
Dividend income is recorded on the ex-dividend date or as soon as the Strategy is informed of the dividend. Interest income is accrued daily. Investment transactions are accounted for on the date the securities are purchased or sold. Investment gains or losses are determined on the identified cost basis. The Strategy amortizes premiums and accretes discounts as adjustments to interest income.
| 34 | • ALLIANCEBERNSTEIN BOND INFLATION STRATEGY |
Notes to Financial Statements
6. Class Allocations
All income earned and expenses incurred by the Strategy are borne on a pro-rata basis by each outstanding class of shares, based on the proportionate interest in the Strategy represented by the net assets of such class, except for class specific expenses which are allocated to the respective class. Expenses of the Fund are charged to each Strategy in proportion to net assets. Realized and unrealized gains and losses are allocated among the various share classes based on respective net assets.
7. Dividends and Distributions
Dividends and distributions to shareholders, if any, are recorded on the ex-dividend date. Income dividends and capital gains distributions are determined in accordance with federal tax regulations and may differ from those determined in accordance with U.S. GAAP. To the extent these differences are permanent, such amounts are reclassified within the capital accounts based on their federal tax basis treatment; temporary differences do not require such reclassification.
8. Offering Expenses
Offering expenses of $218,328 had been deferred and were amortized on a straight line basis over a one year period.
NOTE B
Advisory Fee and Other Transactions with Affiliates
Under the terms of the investment advisory agreement, the Strategy pays the Adviser an advisory fee at an annual rate of .50% of the first $2.5 billion, .45% of the next $2.5 billion and .40% in excess of $5 billion, of the Strategy’s average daily net assets. The Adviser has agreed to waive its fees and bear certain expenses to the extent necessary to limit total operating expenses on an annual basis to .75%, 1.45%, .45%, .95%, .70%, .45%, .55% and .45% of the daily average net assets for the Class A, Class C, Advisor Class, Class R, Class K, Class I, Class 1, and Class 2 shares, respectively. Under the agreement, fees waived and expenses borne by the Adviser are subject to repayment by the Strategy until January 26, 2013. No repayment will be made that would cause the Strategy’s total annualized operating expenses to exceed the net fee percentage set forth above on or before January 26, 2013, or would have exceeded the amount of offering expenses as recorded by the Strategy before January 26, 2011. This fee waiver and/or expense reimbursement agreement may not be terminated before March 1, 2012, after which it may be terminated by either party. For the year ended October 31, 2011, such reimbursement amounted to $551,421, which is subject to repayment, not to exceed the amount of offering expenses.
Pursuant to the investment advisory agreement, the Strategy may reimburse the Adviser for certain legal and accounting services provided to the Strategy by the Adviser. For the year ended October 31, 2011, the Adviser voluntarily agreed to waive such fees in the amount of $66,574.
| ALLIANCEBERNSTEIN BOND INFLATION STRATEGY • | 35 |
Notes to Financial Statements
The Strategy compensates AllianceBernstein Investor Services, Inc. (“ABIS”), a wholly-owned subsidiary of the Adviser, under a Transfer Agency Agreement for providing personnel and facilities to perform transfer agency services for the Strategy. ABIS may make payments to intermediaries that provide omnibus account services, sub-accounting services and/or networking services. Such compensation retained by ABIS amounted to $17,888 for the year ended October 31, 2011.
AllianceBernstein Investments, Inc. (the “Distributor”), a wholly-owned subsidiary of the Adviser, serves as the distributor of the Strategy’s shares. The Distributor has advised the Strategy that it has retained front-end sales charges of $3,922 from the sale of Class A shares and received $858 and 4,992 in contingent deferred sales charges imposed upon redemptions by shareholders of Class A and Class C shares, respectively, for the year ended October 31, 2011.
The Strategy may invest in the AllianceBernstein Fixed-Income Shares, Inc. – Government STIF Portfolio (“Government STIF Portfolio”), an open-end management investment company managed by the Adviser. The Government STIF Portfolio is offered as a cash management option to mutual funds and other institutional accounts of the Adviser, and is not available for direct purchase by members of the public. The Government STIF Portfolio pays no investment management fees but does bear its own expenses. A summary of the Strategy’s transactions in shares of the Government STIF Portfolio for the year ended October 31, 2011 is as follows:
Market Value | Purchases at Cost (000) | Sales Proceeds (000) | Market Value October 31, 2011 (000) | Dividend Income (000) | ||||||||||||
| $ 667 | $ | 75,611 | $ | 76,083 | $ | 195 | $ | 1 | ||||||||
Brokerage commissions paid on investment transactions for the year ended October 31, 2011 amounted to $1,284, of which $0 and $0, respectively, was paid to Sanford C. Bernstein & Co. LLC and Sanford C. Bernstein Limited, affiliates of the Adviser.
NOTE C
Distribution Services Agreement
The Strategy has adopted a Distribution Services Agreement (the “Agreement”) pursuant to Rule 12b-1 under the Investment Company Act of 1940. Under the Agreement, the Strategy pays distribution and servicing fees to the Distributor at an annual rate of up to .30% of the Strategy’s average daily net assets attributable to Class A shares, 1% of the Strategy’s average daily net assets attributable to Class C shares, .50% of the Strategy’s average daily net assets attributable to Class R shares, .25% of the Strategy’s average daily net assets attributable to Class K shares and .10% of the Strategy’s average daily net assets attributable to Class 1 shares. There are no distribution and servicing fees on the Advisor Class,
| 36 | • ALLIANCEBERNSTEIN BOND INFLATION STRATEGY |
Notes to Financial Statements
Class I, and Class 2 shares. The fees are accrued daily and paid monthly. The Agreement provides that the Distributor will use such payments in their entirety for distribution assistance and promotional activities. Since the commencement of the Strategy’s operations, the Distributor has incurred expenses in excess of the distribution costs reimbursed by the Strategy in the amounts of $210,492, $13,871, $11,031 and $431,087 for Class C, Class R, Class K and Class 1 shares, respectively. While such costs may be recovered from the Strategy in future periods so long as the Agreement is in effect, the rate of the distribution and servicing fees payable under the Agreement may not be increased without a shareholder vote. In accordance with the Agreement, there is no provision for recovery of unreimbursed distribution costs incurred by the Distributor beyond the current fiscal year for Class A shares. The Agreement also provides that the Adviser may use its own resources to finance the distribution of the Strategy’s shares.
NOTE D
Investment Transactions
Purchases and sales of investment securities (excluding short-term investments) for the year ended October 31, 2011 were as follows:
| Purchases | Sales | |||||||
Investment securities (excluding | $ | 36,165,663 | $ | 14,889,708 | ||||
U.S. government securities | 131,990,967 | 16,345,411 | ||||||
The cost of investments for federal income tax purposes, gross unrealized appreciation and unrealized depreciation (excluding futures, foreign currency and swap transactions) are as follows:
Cost | $ | 159,779,353 | ||
|
| |||
Gross unrealized appreciation | $ | 3,826,159 | ||
Gross unrealized depreciation | (288,503 | ) | ||
|
| |||
Net unrealized appreciation | $ | 3,537,656 | ||
|
|
1. Derivative Financial Instruments
The Strategy may use derivatives to earn income and enhance returns, to hedge or adjust the risk profile of its portfolio, to replace more traditional direct investments, or to obtain exposure to otherwise inaccessible markets.
The principal types of derivatives utilized by the Strategy, as well as the methods in which they may be used are:
| • | Futures Contracts |
The Strategy may buy or sell futures contracts for the purpose of hedging its portfolio against adverse effects of anticipated movements in the market or for investment purposes. The Strategy bears the market risk that arises
| ALLIANCEBERNSTEIN BOND INFLATION STRATEGY • | 37 |
Notes to Financial Statements
from changes in the value of these instruments and the imperfect correlation between movements in the price of the futures contracts and movements in the price of the securities hedged or used for cover. The Strategy may also purchase or sell futures contracts for foreign currencies or options thereon for non-hedging purposes as a means of making direct investment in foreign currencies, as described below under “Currency Transactions”.
At the time the Strategy enters into a futures contract, the Strategy deposits and maintains as collateral an initial margin with the broker, as required by the exchange on which the transaction is effected. Pursuant to the contract, the Strategy agrees to receive from or pay to the broker an amount of cash equal to the daily fluctuation in the value of the contract. Such receipts or payments are known as variation margin and are recorded by the Strategy as unrealized gains or losses. Risks may arise from the potential inability of a counterparty to meet the terms of the contract. The credit/counterparty risk for exchange-traded futures contracts is generally less than privately negotiated futures contracts, since the clearinghouse, which is the issuer or counterparty to each exchange-traded future, provides a guarantee of performance. This guarantee is supported by a daily payment system (i.e., margin requirements). When the contract is closed, the Strategy records a realized gain or loss equal to the difference between the value of the contract at the time it was opened and the time it was closed.
Use of long futures contracts subjects the Strategy to risk of loss in excess of the amounts shown on the statement of assets and liabilities, up to the notional value of the futures contracts. Use of short futures contracts subjects the Strategy to unlimited risk of loss. Under some circumstances, futures exchanges may establish daily limits on the amount that the price of a futures contract can vary from the previous day’s settlement price, which could effectively prevent liquidation of unfavorable positions.
During the year ended October 31, 2011, the Strategy held futures contracts for hedging and non-hedging purposes.
| • | Forward Currency Exchange Contracts |
The Strategy may enter into forward currency exchange contracts in order to hedge its exposure to changes in foreign currency exchange rates on its foreign portfolio holdings, to hedge certain firm purchase and sale commitments denominated in foreign currencies and for non-hedging purposes as a means of making direct investments in foreign currencies, as described below under “Currency Transactions”.
A forward currency exchange contract is a commitment to purchase or sell a foreign currency at a future date at a negotiated forward rate. The gain or loss arising from the difference between the original contract and the
| 38 | • ALLIANCEBERNSTEIN BOND INFLATION STRATEGY |
Notes to Financial Statements
closing of such contract would be included in net realized gain or loss on foreign currency transactions. Fluctuations in the value of open forward currency exchange contracts are recorded for financial reporting purposes as unrealized appreciation and/or depreciation by the Strategy. Risks may arise from the potential inability of a counterparty to meet the terms of a contract and from unanticipated movements in the value of a foreign currency relative to the U.S. dollar. The face or contract amount, in U.S. dollars reflects the total exposure the Strategy has in that particular currency contract.
During the year ended October 31, 2011, the Strategy held forward currency exchange contracts for hedging and non-hedging purposes.
| • | Swap Agreements |
The Strategy may enter into swaps to hedge its exposure to interest rates, credit risk, or currencies. The Strategy may also enter into swaps for non-hedging purposes as a means of gaining market exposures including by making direct investments in foreign currencies, as described below under “Currency Transactions”. A swap is an agreement that obligates two parties to exchange a series of cash flows at specified intervals based upon or calculated by reference to changes in specified prices or rates for a specified amount of an underlying asset. The payment flows are usually netted against each other, with the difference being paid by one party to the other. In addition, collateral may be pledged or received by the Strategy in accordance with the terms of the respective swap agreements to provide value and recourse to the Strategy or its counterparties in the event of default, bankruptcy or insolvency by one of the parties to the swap agreement.
Risks may arise as a result of the failure of the counterparty to the swap contract to comply with the terms of the swap contract. The loss incurred by the failure of a counterparty is generally limited to the net interim payment to be received by the Strategy, and/or the termination value at the end of the contract. Therefore, the Strategy considers the creditworthiness of each counterparty to a swap contract in evaluating potential counterparty risk. This risk is mitigated by having a netting arrangement between the Strategy and the counterparty and by the posting of collateral by the counterparty to the Strategy to cover the Strategy exposure to the counterparty. Additionally, risks may arise from unanticipated movements in interest rates or in the value of the underlying securities. The Strategy accrues for the interim payments on swap contracts on a daily basis, with the net amount recorded within unrealized appreciation/depreciation of swap contracts on the statement of assets and liabilities, where applicable. Once the interim payments are settled in cash, the net amount is recorded as realized gain/(loss) on swaps on the statement of operations, in addition to any realized gain/(loss) recorded
| ALLIANCEBERNSTEIN BOND INFLATION STRATEGY • | 39 |
Notes to Financial Statements
upon the termination of swap contracts. Fluctuations in the value of swap contracts are recorded as a component of net change in unrealized appreciation/depreciation of swap contracts on the statement of operations.
Interest Rate Swaps:
The Strategy is subject to interest rate risk exposure in the normal course of pursuing its investment objectives. Because the Strategy holds fixed rate bonds, the value of these bonds may decrease if interest rates rise. To help hedge against this risk and to maintain its ability to generate income at prevailing market rates, the Strategy may enter into interest rate swap contracts. Interest rate swaps are agreements between two parties to exchange cash flows based on a notional amount. The Strategy may elect to pay a fixed rate and receive a floating rate, or, receive a fixed rate and pay a floating rate on a notional amount.
In addition, the Strategy may also enter into interest rate swap transactions to preserve a return or spread on a particular investment or portion of its portfolio, or protecting against an increase in the price of securities the Strategy anticipates purchasing at a later date. Interest rate swaps involve the exchange by a Strategy with another party of their respective commitments to pay or receive interest (e.g., an exchange of floating rate payments for fixed rate payments) computed based on a contractually-based principal (or “notional”) amount. Interest rate swaps are entered into on a net basis (i.e., the two payment streams are netted out, with the Strategy receiving or paying, as the case may be, only the net amount of the two payments).
During the year ended October 31, 2011, the Strategy held interest rate swap contracts for hedging and non-hedging purposes.
Credit Default Swaps:
The Strategy may enter into credit default swaps, including to manage its exposure to the market or certain sectors of the market, to reduce its risk exposure to defaults by corporate and sovereign issuers held by the Strategy, or to create exposure to corporate or sovereign issuers to which it is not otherwise exposed. The Strategy may purchase credit protection (“Buy Contract”) or provide credit protection (“Sale Contract”) on the referenced obligation of the credit default swap. During the term of the swap agreement, the Strategy receives/(pays) fixed payments from/(to) the respective counterparty, calculated at the agreed upon rate applied to the notional amount. The accrual for these interim payments is recorded within unrealized appreciation/depreciation of swap contracts on the statement of assets and liabilities. Upfront premiums paid or received in connection with credit default swap contracts are recognized as cost or proceeds on the statement of assets and liabilities and are amortized on a straight line basis over the life of the contract. Amortized upfront
| 40 | • ALLIANCEBERNSTEIN BOND INFLATION STRATEGY |
Notes to Financial Statements
premiums are included in net realized gain/(loss) from swaps on the statement of operations. If the Strategy is a buyer/(seller) of protection and a credit event occurs, as defined under the terms of the swap agreement, the Strategy will either (i) receive from the seller/(pay to the buyer) of protection an amount equal to the notional amount of the swap contract (the “Maximum Payout Amount”) and deliver/(take delivery of) the referenced obligation or (ii) receive/(pay) a net settlement amount in the form of cash or securities equal to the notional amount of the swap less the recovery value of the referenced obligation.
During the year ended October 31, 2011, the Strategy held credit default swap contracts for hedging and non-hedging purposes.
Credit default swaps may involve greater risks than if a Strategy had invested in the referenced obligation directly. Credit default swaps are subject to general market risk, liquidity risk, counterparty risk and credit risk. If the Strategy is a buyer of protection and no credit event occurs, it will lose the payments it made to its counterparty. If the Strategy is a seller of protection and a credit event occurs, the value of the referenced obligation received by the Strategy coupled with the periodic payments previously received, may be less than the Maximum Payout Amount it pays to the buyer, resulting in a net loss to the Strategy.
Implied credit spreads utilized in determining the market value of credit default swaps on issuers as of period end are disclosed in the portfolio of investments. The implied spreads serve as an indicator of the current status of the payment/performance risk and typically reflect the likelihood of default by the issuer of the referenced obligation. The implied credit spread of a particular reference obligation also reflects the cost of buying/selling protection and may reflect upfront payments required to be made to enter into the agreement. Widening credit spreads typically represent a deterioration of the referenced obligation’s credit soundness and greater likelihood of default or other credit event occurring as defined under the terms of the agreement. A credit spread identified as “Defaulted” indicates a credit event has occurred for the referenced obligation.
At October 31, 2011, the Strategy had a Sale Contract outstanding with a Maximum Payout Amount of $3,090,000, with net unrealized appreciation of $31,777, and a term of less than 6 years, as reflected in the portfolio of investments.
In certain circumstances Maximum Payout Amounts may be partially offset by recovery values of the respective referenced obligations, upfront premium received upon entering into the agreement, or net amounts received from settlement of buy protection credit default swap agreements entered into by the Strategy for the same reference obligation with the same counterparty.
| ALLIANCEBERNSTEIN BOND INFLATION STRATEGY • | 41 |
Notes to Financial Statements
Documentation governing the Strategy swap transactions may contain provisions for early termination of a swap in the event the net assets of the Strategy decline below specific levels set forth in the documentation (“net asset contingent features”). If these levels are triggered, the Strategy’s counterparty has the right to terminate the swap and require the Strategy to pay or receive a settlement amount in connection with the terminated swap transaction. As of October 31, 2011, the Strategy had interest rate swap contracts and credit default swap contracts in net liability positions with net asset contingent features. The fair value of such interest rate contracts amounted to $59,531 and credit default swap contracts amounted to $46,749 at October 31, 2011.
At October 31, 2011, the Strategy had entered into the following derivatives:
Asset Derivatives | Liability Derivatives | |||||||||||
Derivative Type | Statement of | Fair Value | Statement of | Fair Value | ||||||||
Foreign exchange contracts | Unrealized appreciation of forward currency exchange contracts | $ | 6,907 |
| Unrealized depreciation of forward currency exchange contracts | $ | 37,348 |
| ||||
Credit contracts | Unrealized appreciation on credit default swap contracts | 31,777 | Unrealized depreciation on credit default swap contracts | 78,526 | ||||||||
Interest rate contracts | Unrealized appreciation on interest rate swap contracts |
| 2,164 |
| Unrealized depreciation on interest rate swap contracts |
| 59,531 |
| ||||
Interest rate contracts | Receivable/Payable for variation margin on futures contracts |
| 55,544 | * | ||||||||
|
|
|
| |||||||||
Total | $ | 96,392 | $ | 175,405 | ||||||||
|
|
|
| |||||||||
| * | Only variation margin receivable/payable at period end is reported within the statement of assets and liabilities. This amount reflects cumulative appreciation/(depreciation) of futures contracts as reported in the portfolio of investments. |
| 42 | • ALLIANCEBERNSTEIN BOND INFLATION STRATEGY |
Notes to Financial Statements
The effect of derivative instruments on the statement of operations for the year ended October 31, 2011:
Derivative Type | Location of Gain | Realized Gain or (Loss) on Derivatives | Change in Unrealized Appreciation or (Depreciation) | |||||||
Foreign exchange contracts | Net realized gain (loss) on foreign currency transactions; Net change in unrealized appreciation/depreciation of foreign currency denominated assets and liabilities | $ | 204,272 |
| $ | (10,653 | ) | |||
Credit contracts | Net realized gain (loss) on swap contracts; Net change in unrealized appreciation/depreciation of swap contracts | (118,195 | ) | (49,465 | ) | |||||
Interest rate contracts | Net realized gain (loss) on swap contracts; Net change in unrealized appreciation/depreciation of swap contracts | (82,052 | ) | (17,351 | ) | |||||
Interest rate contracts | Net realized gain (loss) on futures contracts; Net change in unrealized appreciation/depreciation of futures contracts | (679,693 | ) | 61,733 | ||||||
|
|
|
| |||||||
Total | $ | (675,668 | ) | $ | (15,736 | ) | ||||
|
|
|
| |||||||
For the year ended October 31, 2011, the average monthly principal amount of foreign exchange contracts was $5,688,154, the average monthly original value of futures contracts was $6,061,870, the average monthly notional amount of interest rate swaps was $4,643,077 and the average monthly notional amount of credit default swaps was $3,539,673.
2. Currency Transactions
The Strategy may invest in non-U.S. Dollar securities on a currency hedged or unhedged basis. The Strategy may seek investment opportunities by taking long or short positions in currencies through the use of currency-related derivatives, including forward currency exchange contracts, futures and options on futures, swaps, and other options. The Strategy may enter into transactions for investment opportunities when it anticipates that a foreign currency will appreciate or depreciate in value but securities denominated in that currency are not held by
| ALLIANCEBERNSTEIN BOND INFLATION STRATEGY • | 43 |
Notes to Financial Statements
the Strategy and do not present attractive investment opportunities. Such transactions may also be used when the Adviser believes that it may be more efficient than a direct investment in a foreign currency-denominated security. The Strategy may also conduct currency exchange contracts on a spot basis (i.e., for cash at the spot rate prevailing in the currency exchange market for buying or selling currencies).
3. Dollar Rolls
The Strategy may enter into dollar rolls. Dollar rolls involve sales by the Strategy of securities for delivery in the current month and the Strategy simultaneously contracting to repurchase substantially similar (same type and coupon) securities on a specified future date. During the roll period, the Strategy forgoes principal and interest paid on the securities. The Strategy is compensated by the difference between the current sales price and the lower forward price for the future purchase (often referred to as the “drop”) as well as by the interest earned on the cash proceeds of the initial sale. Dollar rolls involve the risk that the market value of the securities the Strategy is obligated to repurchase under the agreement may decline below the repurchase price. Dollar rolls are speculative techniques and may be considered to be borrowings by the Strategy. For the year ended October 31, 2011, the Strategy earned drop income of $3,676 which is included in interest income in the accompanying statement of operations.
4. Reverse Repurchase Agreements
Under a reverse repurchase agreement, the Strategy sells securities and agrees to repurchase them at a mutually agreed upon date and price. At the time the Strategy enters into a reverse repurchase agreement, it will establish a segregated account with the custodian containing liquid assets having a value at least equal to the repurchase price. For the year ended October 31, 2011, the average amount of reverse repurchase agreements outstanding was $15,780,332 and the daily weighted average interest rate was 0.14%.
| 44 | • ALLIANCEBERNSTEIN BOND INFLATION STRATEGY |
Notes to Financial Statements
NOTE E
Capital Stock
Each class consists of 3,000,000,000 authorized shares. Transactions in capital shares for each class were as follows:
| Shares | Amount | |||||||||||||||||||
| Year Ended October 31, 2011 | January 26, 2010(a) to October 31, 2010 | Year Ended October 31, 2011 | January 26, 2010(a) to October 31, 2010 | |||||||||||||||||
| Class A | ||||||||||||||||||||
Shares sold | 1,032,165 | 206,876 | $ | 10,994,239 | $ | 2,101,534 | ||||||||||||||
| ||||||||||||||||||||
Shares issued in reinvestment of dividends and distributions | 10,506 | 601 | 111,667 | 6,053 | ||||||||||||||||
| ||||||||||||||||||||
Shares redeemed | (332,822 | ) | (17,479 | ) | (3,567,603 | ) | (181,797 | ) | ||||||||||||
| ||||||||||||||||||||
Net increase | 709,849 | 189,998 | $ | 7,538,303 | $ | 1,925,790 | ||||||||||||||
| ||||||||||||||||||||
| Class C | ||||||||||||||||||||
Shares sold | 408,141 | 326,492 | $ | 4,291,840 | $ | 3,331,995 | ||||||||||||||
| ||||||||||||||||||||
Shares issued in reinvestment of dividends and distributions | 11,342 | 631 | 120,164 | 6,355 | ||||||||||||||||
| ||||||||||||||||||||
Shares redeemed | (111,834 | ) | (5,355 | ) | (1,193,140 | ) | (54,442 | ) | ||||||||||||
| ||||||||||||||||||||
Net increase | 307,649 | 321,768 | $ | 3,218,864 | $ | 3,283,908 | ||||||||||||||
| ||||||||||||||||||||
| Advisor Class | ||||||||||||||||||||
Shares sold | 126,758 | 109,064 | $ | 1,352,392 | $ | 1,102,344 | ||||||||||||||
| ||||||||||||||||||||
Shares issued in reinvestment of dividends and distributions | 3,896 | 638 | 41,346 | 6,437 | ||||||||||||||||
| ||||||||||||||||||||
Shares redeemed | (20,362 | ) | (5,211 | ) | (218,302 | ) | (52,876 | ) | ||||||||||||
| ||||||||||||||||||||
Net increase | 110,292 | 104,491 | $ | 1,175,436 | $ | 1,055,905 | ||||||||||||||
| ||||||||||||||||||||
| Class R | ||||||||||||||||||||
Shares sold | 51,419 | 1,000 | $ | 537,332 | $ | 10,000 | ||||||||||||||
| ||||||||||||||||||||
Shares issued in reinvestment of dividends and distributions | 1,103 | – 0 | – | 11,705 | – 0 | – | ||||||||||||||
| ||||||||||||||||||||
Shares redeemed | (8,250 | ) | – 0 | – | (87,747 | ) | – 0 | – | ||||||||||||
| ||||||||||||||||||||
Net increase | 44,272 | 1,000 | $ | 461,290 | $ | 10,000 | ||||||||||||||
| ||||||||||||||||||||
| ALLIANCEBERNSTEIN BOND INFLATION STRATEGY • | 45 |
Notes to Financial Statements
| Shares | Amount | |||||||||||||||||||
| Year Ended October 31, 2011 | January 26, 2010(a) to October 31, 2010 | Year Ended October 31, 2011 | January 26, 2010(a) to October 31, 2010 | |||||||||||||||||
| Class K | ||||||||||||||||||||
Shares sold | 38,162 | 74,549 | $ | 406,275 | $ | 748,094 | ||||||||||||||
| ||||||||||||||||||||
Shares issued in reinvestment of dividends and distributions | 1,059 | 162 | 11,180 | 1,627 | ||||||||||||||||
| ||||||||||||||||||||
Shares redeemed | (61,443 | ) | (95 | ) | (629,566 | ) | (1,000 | ) | ||||||||||||
| ||||||||||||||||||||
Net increase (decrease) | (22,222 | ) | 74,616 | $ | (212,111 | ) | $ | 748,721 | ||||||||||||
| ||||||||||||||||||||
| Class I | ||||||||||||||||||||
Shares sold | 8,810 | 1,000 | $ | 94,772 | $ | 10,000 | ||||||||||||||
| ||||||||||||||||||||
Shares issued in reinvestment of dividends and distributions | – 0 | –(b) | – 0 | – | 1 | – 0 | – | |||||||||||||
| ||||||||||||||||||||
Shares redeemed | (2,764 | ) | – 0 | – | (29,936 | ) | – 0 | – | ||||||||||||
| ||||||||||||||||||||
Net increase | 6,046 | 1,000 | $ | 64,837 | $ | 10,000 | ||||||||||||||
| ||||||||||||||||||||
| Class 1 | ||||||||||||||||||||
Shares sold | 10,366,559 | 1,000 | $ | 110,542,299 | $ | 10,000 | ||||||||||||||
| ||||||||||||||||||||
Shares issued in reinvestment of dividends and distributions | 4,503 | – 0 | – | 47,964 | – 0 | – | ||||||||||||||
| ||||||||||||||||||||
Shares redeemed | (616,467 | ) | – 0 | – | (6,605,107 | ) | – 0 | – | ||||||||||||
| ||||||||||||||||||||
Net increase | 9,754,595 | 1,000 | $ | 103,985,156 | $ | 10,000 | ||||||||||||||
| ||||||||||||||||||||
| Class 2 | ||||||||||||||||||||
Shares sold | 1,614,483 | 993,000 | $ | 17,013,084 | $ | 9,930,000 | ||||||||||||||
| ||||||||||||||||||||
Shares issued in reinvestment of dividends and distributions | 19,819 | – 0 | – | 209,346 | – 0 | – | ||||||||||||||
| ||||||||||||||||||||
Shares redeemed | (1,091,207 | ) | – 0 | – | (11,545,701 | ) | – 0 | – | ||||||||||||
| ||||||||||||||||||||
Net increase | 543,095 | 993,000 | $ | 5,676,729 | $ | 9,930,000 | ||||||||||||||
| ||||||||||||||||||||
| (a) | Commencement of operations. |
| (b) | Share amount is less than one full share. |
NOTE F
Risks Involved in Investing in the Strategy
Interest Rate Risk and Credit Risk—Interest rate risk is the risk that changes in interest rates will affect the value of the Strategy’s investments in fixed-income debt securities such as bonds or notes. Increases in interest rates may cause the value of the Strategy’s investments to decline. Credit risk is the risk that the issuer or guarantor of a debt security, or the counterparty to a derivative contract, will be unable or unwilling to make timely principal and/or interest payments, or to otherwise honor its obligations. The degree of risk for a particular
| 46 | • ALLIANCEBERNSTEIN BOND INFLATION STRATEGY |
Notes to Financial Statements
security may be reflected in its credit risk rating. Credit risk is greater for medium quality and lower-rated securities. Lower-rated debt securities and similar unrated securities (commonly known as “junk bonds”) have speculative elements or are predominantly speculative risks.
Foreign Securities Risk—Investing in securities of foreign companies or foreign governments involve special risks which include changes in foreign currency exchange rates and the possibility of future political and economic developments which could adversely affect the value of such securities. Moreover, securities of many foreign companies or foreign governments and their markets may be less liquid and their prices more volatile than those of comparable U.S. companies or of the U.S. government.
Currency Risk—This is the risk that changes in foreign currency exchange rates may negatively affect the value of the Strategy’s investments or reduce the returns of the Strategy. For example, the value of the Strategy’s investments in foreign currency-denominated securities or currencies may decrease if the U.S. Dollar is strong (i.e., gaining value relative to other currencies) and other currencies are weak (i.e., losing value relative to the U.S. Dollar). Currency markets are generally not as regulated as securities markets. Independent of the Strategy’s investments denominated in foreign currencies, the Strategy’s positions in various foreign currencies may cause the Strategy to experience investment losses due to the changes in exchange rates and interest rates.
Derivatives Risk—The Strategy may enter into derivative transactions such as forwards, options, futures and swaps. Derivatives may be illiquid, difficult to price, and leveraged so that small changes may produce disproportionate losses for the Strategy, and subject to counterparty risk to a greater degree than more traditional investments. Derivatives may result in significant losses, including losses that are far greater than the value of the derivatives reflected in the statement of assets and liabilities.
Leverage Risk—When the Strategy borrows money or otherwise leverages its Strategy, it may be volatile because leverage tends to exaggerate the effect of any increase or decrease in the value of the Strategy’s investments. The Strategy may create leverage through the use of reverse repurchase arrangements, forward currency exchange contracts, forward commitments, dollar rolls or futures contracts or by borrowing money. The use of derivative instruments by the Strategy, such as forwards, futures, options and swaps, may also result in a form of leverage. Leverage may result in higher returns to the Strategy than if the Strategy were not leveraged, but may also adversely affect returns, particularly if the market is declining.
Indemnification Risk—In the ordinary course of business, the Strategy enters into contracts that contain a variety of indemnifications. The Strategy’s maximum exposure under these arrangements is unknown. However, the Strategy
| ALLIANCEBERNSTEIN BOND INFLATION STRATEGY • | 47 |
Notes to Financial Statements
has not had prior claims or losses pursuant to these indemnification provisions and expects the risk of loss thereunder to be remote. Therefore, the Strategy has not accrued any liability in connection with these indemnification provisions.
NOTE G
Joint Credit Facility
A number of open-end mutual funds managed by the Adviser, including the Strategy, participate in a $140 million revolving credit facility (the “Facility”) intended to provide short-term financing, if necessary, subject to certain restrictions in connection with abnormal redemption activity. Commitment fees related to the Facility are paid by the participating funds and are included in miscellaneous expenses in the statement of operations. The Strategy did not utilize the Facility during the year ended October 31, 2011.
NOTE H
Distributions to Shareholders
The tax character of distributions paid during the fiscal years ended October 31, 2011 and October 31, 2010 were as follows:
| 2011 | 2010 | |||||||
Distributions paid from: | ||||||||
Ordinary income | $ | 2,144,760 | $ | 142,381 | ||||
|
|
|
| |||||
Total taxable distributions | 2,144,760 | 142,381 | ||||||
Tax return of capital | – 0 | – | 7,052 | |||||
|
|
|
| |||||
Total distributions paid | $ | 2,144,760 | $ | 149,433 | ||||
|
|
|
| |||||
As of October 31, 2011, the components of accumulated earnings/(deficit) on a tax basis were as follows:
Undistributed ordinary income | $ | 275,693 | ||
Accumulated capital and other gains/losses | (904,494 | )(a) | ||
Unrealized appreciation/(depreciation) | 3,499,054 | (b) | ||
|
| |||
Total accumulated earnings/(deficit) | $ | 2,870,253 | (c) | |
|
|
| (a) | On October 31, 2011, the Strategy had a net capital loss carryforward of $904,494 which expires in the year 2019. To the extent future capital gains are offset by the capital loss carryforward, such gains will not be distributed. |
| (b) | The differences between book-basis and tax-basis unrealized appreciation/(depreciation) are primarily due to the tax deferral of losses on wash sales, the tax treatment of swap income, and the mark to market of forward foreign currency contracts and futures contracts. |
| (c) | The difference between book-basis and tax-basis components of accumulated earnings/(deficit) is attributable to amortization of offering costs. |
During the current fiscal year, permanent differences primarily due to the tax treatment of swaps, paydown reclassification, foreign currency reclassification, the tax treatment of organizational costs, and reclassifications on futures and swaps resulted in a net increase in undistributed net investment income, a net
| 48 | • ALLIANCEBERNSTEIN BOND INFLATION STRATEGY |
Notes to Financial Statements
increase in accumulated net realized loss on investment and foreign currency transactions, and a net increase in additional paid-in-capital. These reclassifications had no effect on net assets.
NOTE I
Recent Accounting Pronouncements
In April 2011, the Financial Accounting Standards Board (“FASB”) issued an Accounting Standard Update (“ASU”) related to the accounting for repurchase agreements and similar agreements that both entitle and obligate a transferor to repurchase or redeem financial assets before their maturity. The ASU modifies the criteria for determining effective control of transferred assets and, as a result, certain agreements may now be accounted for as secured borrowings. The ASU is effective prospectively for new transfers and existing transactions that are modified in the first interim or annual period beginning on or after December 15, 2011. At this time, management is evaluating the implications of this ASU and its impact on the financial statements has not been determined.
In May 2011, the Financial Accounting Standards Board (“FASB”) issued an Accounting Standards Update (“ASU”) to develop common requirements for measuring fair value and for disclosing information about fair value measurements in U.S. GAAP and International Financial Reporting Standards (“IFRS”). The amendments are intended to improve the comparability of fair value measurements presented and disclosed in the financial statements prepared in accordance with U.S. GAAP and IFRS. The ASU is effective during interim or annual periods beginning after December 15, 2011. At this time, management is evaluating the implication of this ASU and its impact on the financial statements has not been determined.
NOTE J
Subsequent Events
Management has evaluated subsequent events for possible recognition or disclosure in the financial statements through the date the financial statements are issued. Management has determined that there are no material events that would require disclosure in the Strategy’s financial statements through this date.
| ALLIANCEBERNSTEIN BOND INFLATION STRATEGY • | 49 |
Notes to Financial Statements
FINANCIAL HIGHLIGHTS
Selected Data For A Share Of Capital Stock Outstanding Throughout Each Period
| Class A | ||||||||
| Year Ended October 31, 2011 | January 26, 2010(a) to October 31, 2010 | |||||||
|
| |||||||
Net asset value, beginning of period | $ 10.53 | $ 10.00 | ||||||
|
| |||||||
Income From Investment Operations | ||||||||
Net investment income(b)(c) | .38 | .14 | ||||||
Net realized and unrealized gain on investment and foreign currency transactions | .21 | .47 | ||||||
|
| |||||||
Net increase in net asset value from operations | .59 | .61 | ||||||
|
| |||||||
Less: Dividends and Distributions | ||||||||
Dividends from net investment income | (.31 | ) | (.08 | ) | ||||
Tax return of capital | – 0 | – | (.00 | )(d) | ||||
|
| |||||||
Total dividends and distributions | (.31 | ) | (.08 | ) | ||||
|
| |||||||
Net asset value, end of period | $ 10.81 | $ 10.53 | ||||||
|
| |||||||
Total Return | ||||||||
Total investment return based on net asset value(e) | 5.75 | % | 6.15 | % | ||||
Ratios/Supplemental Data | ||||||||
Net assets, end of period | $9,732 | $2,000 | ||||||
Ratio to average net assets of: | ||||||||
Expenses, net of waivers/reimbursements | .78 | % | .80 | %(f)(g) | ||||
Expenses, net of waivers/reimbursements, excluding interest expense | .75 | % | .75 | %(f)(g) | ||||
Expenses, before waivers/reimbursements | 1.87 | % | 4.63 | %(f)(g) | ||||
Expenses, before waivers/reimbursements, excluding interest expense | 1.83 | % | 4.58 | %(f)(g) | ||||
Net investment income(c) | 3.59 | % | 1.76 | %(f)(g) | ||||
Portfolio turnover rate | 38 | % | 34 | % | ||||
See footnote summary on page 57.
| 50 | • ALLIANCEBERNSTEIN BOND INFLATION STRATEGY |
Financial Highlights
Selected Data For A Share Of Capital Stock Outstanding Throughout Each Period
| Class C | ||||||||
| Year Ended October 31, 2011 | January 26, 2010(a) to October 31, 2010 | |||||||
|
| |||||||
Net asset value, beginning of period | $ 10.50 | $ 10.00 | ||||||
|
| |||||||
Income From Investment Operations | ||||||||
Net investment income(b)(c) | .30 | .08 | ||||||
Net realized and unrealized gain on investment and foreign currency transactions | .22 | .48 | ||||||
|
| |||||||
Net increase in net asset value from operations | .52 | .56 | ||||||
|
| |||||||
Less: Dividends and Distributions | ||||||||
Dividends from net investment income | (.24 | ) | (.06 | ) | ||||
Tax return of capital | – 0 | – | (.00 | )(d) | ||||
|
| |||||||
Total dividends and distributions | (.24 | ) | (.06 | ) | ||||
|
| |||||||
Net asset value, end of period | $ 10.78 | $ 10.50 | ||||||
|
| |||||||
Total Return | ||||||||
Total investment return based on net asset value(e) | 5.03 | % | 5.61 | % | ||||
Ratios/Supplemental Data | ||||||||
Net assets, end of period | $6,782 | $3,378 | ||||||
Ratio to average net assets of: | ||||||||
Expenses, net of waivers/reimbursements | 1.49 | % | 1.50 | %(f)(g) | ||||
Expenses, net of waivers/reimbursements, excluding interest expense | 1.45 | % | 1.45 | %(f)(g) | ||||
Expenses, before waivers/reimbursements | 2.84 | % | 4.80 | %(f)(g) | ||||
Expenses, before waivers/reimbursements, excluding interest expense | 2.80 | % | 4.75 | %(f)(g) | ||||
Net investment income(c) | 2.82 | % | 1.12 | %(f)(g) | ||||
Portfolio turnover rate | 38 | % | 34 | % | ||||
See footnote summary on page 57.
| ALLIANCEBERNSTEIN BOND INFLATION STRATEGY • | 51 |
Financial Highlights
Selected Data For A Share Of Capital Stock Outstanding Throughout Each Period
| Advisor Class | ||||||||
| Year Ended October 31, 2011 | January 26, 2010(a) to October 31, 2010 | |||||||
|
| |||||||
Net asset value, beginning of period | $ 10.55 | $ 10.00 | ||||||
|
| |||||||
Income From Investment Operations | ||||||||
Net investment income(b)(c) | .39 | .17 | ||||||
Net realized and unrealized gain on investment and foreign currency transactions | .24 | .47 | ||||||
|
| |||||||
Net increase in net asset value from operations | .63 | .64 | ||||||
|
| |||||||
Less: Dividends and Distributions | ||||||||
Dividends from net investment income | (.35 | ) | (.09 | ) | ||||
Tax return of capital | – 0 | – | (.00 | )(d) | ||||
|
| |||||||
Total dividends and distributions | (.35 | ) | (.09 | ) | ||||
|
| |||||||
Net asset value, end of period | $ 10.83 | $ 10.55 | ||||||
|
| |||||||
Total Return | ||||||||
Total investment return based on net asset value(e) | 6.07 | % | 6.46 | % | ||||
Ratios/Supplemental Data | ||||||||
Net assets, end of period | $2,325 | $1,102 | ||||||
Ratio to average net assets of: | ||||||||
Expenses, net of waivers/reimbursements | .49 | % | .50 | %(f)(g) | ||||
Expenses, net of waivers/reimbursements, excluding interest expense | .45 | % | .45 | %(f)(g) | ||||
Expenses, before waivers/reimbursements | 1.80 | % | 4.50 | %(f)(g) | ||||
Expenses, before waivers/reimbursements, excluding interest expense | 1.76 | % | 4.44 | %(f)(g) | ||||
Net investment income(c) | 3.70 | % | 2.13 | %(f)(g) | ||||
Portfolio turnover rate | 38 | % | 34 | % | ||||
See footnote summary on page 57.
| 52 | • ALLIANCEBERNSTEIN BOND INFLATION STRATEGY |
Financial Highlights
Selected Data For A Share Of Capital Stock Outstanding Throughout Each Period
| Class R | ||||||||
| Year Ended October 31, 2011 | January 26, 2010(a) to October 31, 2010 | |||||||
|
| |||||||
Net asset value, beginning of period | $ 10.50 | $ 10.00 | ||||||
|
| |||||||
Income From Investment Operations | ||||||||
Net investment income(b)(c) | .43 | .12 | ||||||
Net realized and unrealized gain on investment and foreign currency transactions | .15 | .48 | ||||||
|
| |||||||
Net increase in net asset value from operations | .58 | .60 | ||||||
|
| |||||||
Less: Dividends and Distributions | ||||||||
Dividends from net investment income | (.29 | ) | (.09 | ) | ||||
Tax return of capital | – 0 | – | (.01 | ) | ||||
|
| |||||||
Total dividends and distributions | (.29 | ) | (.10 | ) | ||||
|
| |||||||
Net asset value, end of period | $ 10.79 | $ 10.50 | ||||||
|
| |||||||
Total Return | ||||||||
Total investment return based on net asset value(e) | 5.59 | % | 6.04 | % | ||||
Ratios/Supplemental Data | ||||||||
Net assets, end of period | $488 | $11 | ||||||
Ratio to average net assets of: | ||||||||
Expenses, net of waivers/reimbursements | .98 | % | 1.00 | %(f)(g) | ||||
Expenses, net of waivers/reimbursements, excluding interest expense | .95 | % | .95 | %(f)(g) | ||||
Expenses, before waivers/reimbursements | 2.16 | % | 5.74 | %(f)(g) | ||||
Expenses, before waivers/reimbursements, excluding interest expense | 2.13 | % | 5.69 | %(f)(g) | ||||
Net investment income(c) | 4.16 | % | 1.53 | %(f)(g) | ||||
Portfolio turnover rate | 38 | % | 34 | % | ||||
See footnote summary on page 57.
| ALLIANCEBERNSTEIN BOND INFLATION STRATEGY • | 53 |
Financial Highlights
Selected Data For A Share Of Capital Stock Outstanding Throughout Each Period
| Class K | ||||||||
| Year Ended October 31, 2011 | January 26, 2010(a) to October 31, 2010 | |||||||
|
| |||||||
Net asset value, beginning of period | $ 10.50 | $ 10.00 | ||||||
|
| |||||||
Income From Investment Operations | ||||||||
Net investment income(b)(c) | .28 | .09 | ||||||
Net realized and unrealized gain on investment and foreign currency transactions | .31 | .53 | ||||||
|
| |||||||
Net increase in net asset value from operations | .59 | .62 | ||||||
|
| |||||||
Less: Dividends and Distributions | ||||||||
Dividends from net investment income | (.30 | ) | (.12 | ) | ||||
Tax return of capital | – 0 | – | (.00 | )(d) | ||||
|
| |||||||
Total dividends and distributions | (.30 | ) | (.12 | ) | ||||
|
| |||||||
Net asset value, end of period | $ 10.79 | $ 10.50 | ||||||
|
| |||||||
Total Return | ||||||||
Total investment return based on net asset value(e) | 5.75 | % | 6.22 | % | ||||
Ratios/Supplemental Data | ||||||||
Net assets, end of period | $566 | $784 | ||||||
Ratio to average net assets of: | ||||||||
Expenses, net of waivers/reimbursements | .75 | % | .75 | %(f)(g) | ||||
Expenses, net of waivers/reimbursements, excluding interest expense | .70 | % | .70 | %(f)(g) | ||||
Expenses, before waivers/reimbursements | 2.39 | % | 3.53 | %(f)(g) | ||||
Expenses, before waivers/reimbursements, excluding interest expense | 2.34 | % | 3.48 | %(f)(g) | ||||
Net investment income(c) | 2.76 | % | 1.12 | %(f)(g) | ||||
Portfolio turnover rate | 38 | % | 34 | % | ||||
See footnote summary on page 57.
| 54 | • ALLIANCEBERNSTEIN BOND INFLATION STRATEGY |
Financial Highlights
Selected Data For A Share Of Capital Stock Outstanding Throughout Each Period
| Class I | ||||||||
| Year Ended October 31, 2011 | January 26, 2010(a) to October 31, 2010 | |||||||
|
| |||||||
Net asset value, beginning of period | $ 10.51 | $ 10.00 | ||||||
|
| |||||||
Income From Investment Operations | ||||||||
Net investment income(b)(c) | .27 | .16 | ||||||
Net realized and unrealized gain on investment and foreign currency transactions | .36 | .48 | ||||||
|
| |||||||
Net increase in net asset value from operations | .63 | .64 | ||||||
|
| |||||||
Less: Dividends and Distributions | ||||||||
Dividends from net investment income | (.36 | ) | (.12 | ) | ||||
Tax return of capital | – 0 | – | (.01 | ) | ||||
|
| |||||||
Total dividends and distributions | (.36 | ) | (.13 | ) | ||||
|
| |||||||
Net asset value, end of period | $ 10.78 | $ 10.51 | ||||||
|
| |||||||
Total Return | ||||||||
Total investment return based on net asset value(e) | 6.11 | % | 6.46 | % | ||||
Ratios/Supplemental Data | ||||||||
Net assets, end of period | $76 | $11 | ||||||
Ratio to average net assets of: | ||||||||
Expenses, net of waivers/reimbursements | .50 | % | .49 | %(f)(g) | ||||
Expenses, net of waivers/reimbursements, excluding interest expense | .45 | % | .45 | %(f)(g) | ||||
Expenses, before waivers/reimbursements | 1.91 | % | 5.19 | %(f)(g) | ||||
Expenses, before waivers/reimbursements, excluding interest expense | 1.86 | % | 5.16 | %(f)(g) | ||||
Net investment income(c) | 3.67 | % | 2.03 | %(f)(g) | ||||
Portfolio turnover rate | 38 | % | 34 | % | ||||
See footnote summary on page 57.
| ALLIANCEBERNSTEIN BOND INFLATION STRATEGY • | 55 |
Financial Highlights
Selected Data For A Share Of Capital Stock Outstanding Throughout Each Period
| Class 1 | ||||||||
| Year Ended October 31, 2011 | January 26, 2010(a) to October 31, 2010 | |||||||
|
| |||||||
Net asset value, beginning of period | $ 10.51 | $ 10.00 | ||||||
|
| |||||||
Income From Investment Operations | ||||||||
Net investment income(b)(c) | .34 | .15 | ||||||
Net realized and unrealized gain on investment and foreign currency transactions | .28 | .48 | ||||||
|
| |||||||
Net increase in net asset value from operations | .62 | .63 | ||||||
|
| |||||||
Less: Dividends and Distributions | ||||||||
Dividends from net investment income | (.35 | ) | (.11 | ) | ||||
Tax return of capital | – 0 | – | (.01 | ) | ||||
|
| |||||||
Total dividends and distributions | (.35 | ) | (.12 | ) | ||||
|
| |||||||
Net asset value, end of period | $ 10.78 | $ 10.51 | ||||||
|
| |||||||
Total Return | ||||||||
Total investment return based on net asset value(e) | 6.01 | % | 6.39 | % | ||||
Ratios/Supplemental Data | ||||||||
Net assets, end of period | $105,201 | $11 | ||||||
Ratio to average net assets of: | ||||||||
Expenses, net of waivers/reimbursements | .58 | % | .58 | %(f)(g) | ||||
Expenses, net of waivers/reimbursements, excluding interest expense | .55 | % | .55 | %(f)(g) | ||||
Expenses, before waivers/reimbursements | 1.20 | % | 5.29 | %(f)(g) | ||||
Expenses, before waivers/reimbursements, excluding interest expense | 1.18 | % | 5.25 | %(f)(g) | ||||
Net investment income(c) | 3.24 | % | 1.93 | %(f)(g) | ||||
Portfolio turnover rate | 38 | % | 34 | % | ||||
See footnote summary on page 57.
| 56 | • ALLIANCEBERNSTEIN BOND INFLATION STRATEGY |
Financial Highlights
Selected Data For A Share Of Capital Stock Outstanding Throughout Each Period
| Class 2 | ||||||||
| Year Ended October 31, 2011 | January 26, 2010(a) to October 31, 2010 | |||||||
|
| |||||||
Net asset value, beginning of period | $ 10.51 | $ 10.00 | ||||||
|
| |||||||
Income From Investment Operations | ||||||||
Net investment income(b)(c) | .39 | .16 | ||||||
Net realized and unrealized gain on investment and foreign currency transactions | .23 | .48 | ||||||
|
| |||||||
Net increase in net asset value from operations | .62 | .64 | ||||||
|
| |||||||
Less: Dividends and Distributions | ||||||||
Dividends from net investment income | (.36 | ) | (.12 | ) | ||||
Tax return of capital | – 0 | – | (.01 | ) | ||||
|
| |||||||
Total dividends and distributions | (.36 | ) | (.13 | ) | ||||
|
| |||||||
Net asset value, end of period | $ 10.77 | $ 10.51 | ||||||
|
| |||||||
Total Return | ||||||||
Total investment return based on net asset value(e) | 6.01 | % | 6.44 | % | ||||
Ratios/Supplemental Data | ||||||||
Net assets, end of period | $16,550 | $10,439 | ||||||
Ratio to average net assets of: | ||||||||
Expenses, net of waivers/reimbursements | .49 | % | .49 | %(f)(g) | ||||
Expenses, net of waivers/reimbursements, excluding interest expense | .45 | % | .45 | %(f)(g) | ||||
Expenses, before waivers/reimbursements | 1.84 | % | 5.18 | %(f)(g) | ||||
Expenses, before waivers/reimbursements, excluding interest expense | 1.80 | % | 5.13 | %(f)(g) | ||||
Net investment income(c) | 3.73 | % | 2.05 | %(f)(g) | ||||
Portfolio turnover rate | 38 | % | 34 | % | ||||
| (a) | Commencement of operations. |
| (b) | Based on average shares outstanding. |
| (c) | Net of fees waived and expenses reimbursed by the Adviser. |
| (d) | Amount is less than $.005. |
| (e) | Total investment return is calculated assuming an initial investment made at the net asset value at the beginning of the period, reinvestment of all dividends and distributions at net asset value during the period, and redemption on the last day of the period. Initial sales charges or contingent deferred sales charges are not reflected in the calculation of total investment return. Total return does not reflect the deduction of taxes that a shareholder would pay on fund distributions or the redemption of fund shares. Total investment return calculated for a period of less than one year is not annualized. |
| (f) | Annualized. |
| (g) | The ratio includes expenses attributable to costs of proxy solicitation. |
See notes to financial statements.
| ALLIANCEBERNSTEIN BOND INFLATION STRATEGY • | 57 |
Financial Highlights
REPORT OF INDEPENDENT REGISTERED
PUBLIC ACCOUNTING FIRM
To the Board of Directors of AllianceBernstein Bond Fund, Inc.
and Shareholders of the AllianceBernstein Bond Inflation Strategy Portfolio
We have audited the accompanying statement of assets and liabilities of AllianceBernstein Bond Inflation Strategy Portfolio (one of the portfolios constituting the AllianceBernstein Bond Fund, Inc.) (the “Strategy”), including the portfolio of investments, as of October 31, 2011, and the related statement of operations and cash flows for the year then ended, and the statement of changes in net assets and the financial highlights for the year then ended and the period January 26, 2010 (commencement of operations) through October 31, 2010. These financial statements and financial highlights are the responsibility of the Strategy’s management. Our responsibility is to express an opinion on these financial statements and financial highlights based on our audits.
We conducted our audits in accordance with the standards of the Public Company Accounting Oversight Board (United States). Those standards require that we plan and perform the audit to obtain reasonable assurance about whether the financial statements and financial highlights are free of material misstatement. We were not engaged to perform an audit of the Strategy’s internal control over financial reporting. Our audit included consideration of internal control over financial reporting as a basis for designing audit procedures that are appropriate in the circumstances, but not for the purpose of expressing an opinion on the effectiveness of the Strategy’s internal control over financial reporting. Accordingly, we express no such opinion. An audit also includes examining, on a test basis, evidence supporting the amounts and disclosures in the financial statements and financial highlights, assessing the accounting principles used and significant estimates made by management, and evaluating the overall financial statement presentation. Our procedures included confirmation of securities owned as of October 31, 2011 by correspondence with the custodian and others or by other appropriate auditing procedures where replies from others were not received. We believe that our audits provide a reasonable basis for our opinion.
In our opinion, the financial statements and financial highlights referred to above present fairly, in all material respects, the financial position of AllianceBernstein Bond Inflation Strategy Portfolio of the AllianceBernstein Bond Fund, Inc. at October 31, 2011, the results of its operations and its cash flows for the year then ended, and changes in its net assets and the financial highlights for the year then ended and the period January 26, 2010 (commencement of operations) through October 31, 2010, in conformity with U.S. generally accepted accounting principles.

New York, New York
December 29, 2011
| 58 | • ALLIANCEBERNSTEIN BOND INFLATION STRATEGY |
Report of Independent Registered Public Accounting Firm
2011 FEDERAL TAX INFORMATION
(unaudited)
For Federal income tax purposes, the following information is furnished with respect to the distributions paid by the Strategy during the taxable year ended October 31, 2011.
For foreign shareholders, 89.97% of ordinary income dividends paid may be considered to be qualifying to be taxed as interest-related dividends.
Shareholders should not use the above information to prepare their income tax returns. The information necessary to complete your income tax returns will be included with your Form 1099-DIV which will be sent to you separately in January 2012.
| ALLIANCEBERNSTEIN BOND INFLATION STRATEGY • | 59 |
2011 Federal Tax Information
BOARD OF DIRECTORS
William H. Foulk, Jr.(1) , Chairman John H. Dobkin(1) Michael J. Downey(1) D. James Guzy(1) Nancy P. Jacklin(1) | Robert M. Keith, President and Chief Executive Officer Garry L. Moody(1) Marshall C. Turner, Jr.(1) Earl D. Weiner(1) |
OFFICERS
Philip L. Kirstein, Paul J. DeNoon(2), Vice President Rajen B. Jadav(2), Vice President Shawn E. Keegan(2) , Vice President Douglas J. Peebles(2) , Vice President | Greg J. Wilensky(2), Vice President Emilie D. Wrapp, Secretary Joseph J. Mantineo, Treasurer and Chief Financial Officer Phyllis J. Clarke, Controller |
Custodian and Accounting Agent State Street Bank and Trust Company One Lincoln Street Boston, MA 02111
Principal Underwriter AllianceBernstein Investments, Inc. 1345 Avenue of the Americas New York, NY 10105
Transfer Agent AllianceBernstein Investor Services, Inc. P.O. Box 786003 San Antonio, TX 78278-6003 Toll-Free (800) 221-5672 | Independent Registered Public Ernst & Young LLP 5 Times Square New York, NY 10036
Legal Counsel Seward & Kissel LLP One Battery Park Plaza New York, NY 10004 |
| (1) | Member of the Audit Committee, the Governance and Nominating Committee, and the Independent Directors Committee. Mr. Foulk is the sole member of the Fair Value Pricing Committee. |
| (2) | The day-to-day management of, and investment decisions for, the Strategy’s portfolio are made by the U.S. Core Fixed-Income Team. Mr. Paul J. DeNoon, Mr. Rajen B. Jadav, Mr. Shawn E. Keegan, Mr. Douglas J. Peebles and Mr. Greg J. Wilensky are the investment professionals with the most significant responsibility for the day-to-day management of the Strategy’s portfolio. |
| 60 | • ALLIANCEBERNSTEIN BOND INFLATION STRATEGY |
Board of Directors
MANAGEMENT OF THE FUND
Board of Directors Information
The business and affairs of the Strategy are managed under the direction of the Board of Directors. Certain information concerning the Strategy’s Directors is set forth below.
NAME, ADDRESS* and AGE (YEAR FIRST ELECTED**) | PRINCIPAL DURING PAST FIVE | PORTFOLIOS IN FUND COMPLEX OVERSEEN BY DIRECTOR | OTHER DIRECTORSHIPS HELD BY DIRECTOR IN THE PAST FIVE YEARS | |||||
| INTERESTED DIRECTOR | ||||||||
Robert M. Keith, + 1345 Avenue of the Americas New York, New York 10105 51 (2010) | Senior Vice President of AllianceBernstein L.P. (the “Adviser”) and head of AllianceBernstein Investments, Inc. (“ABI”) since July 2008; Director of ABI and President of the AllianceBernstein Mutual Funds. Previously, he served as Executive Managing Director of ABI from December 2006 to June 2008. Prior to joining ABI in 2006, Executive Managing Director of Bernstein Global Wealth Management, and prior thereto, Senior Managing Director and Global Head of Client Service and Sales of the Adviser’s institutional investment management business since 2004. Prior thereto, Managing Director and Head of North American Client Service and Sales in the Adviser’s institutional investment management business, with which he had been associated since prior to 2004. | 102 | None | |||||
| ALLIANCEBERNSTEIN BOND INFLATION STRATEGY • | 61 |
Management of the Fund
NAME, ADDRESS* and AGE (YEAR FIRST ELECTED**) | PRINCIPAL DURING PAST FIVE | PORTFOLIOS IN FUND COMPLEX OVERSEEN BY DIRECTOR | OTHER DIRECTORSHIPS HELD BY DIRECTOR IN THE PAST FIVE YEARS | |||||
| DISINTERESTED DIRECTORS | ||||||||
William H. Foulk, Jr., ++, # Chairman of the Board 79 (1998) | Investment Adviser and an Independent Consultant since prior to 2006. Previously, he was Senior Manager of Barrett Associates, Inc., a registered investment adviser. He was formerly Deputy Comptroller and Chief Investment Officer of the State of New York and, prior thereto, Chief Investment Officer of the New York Bank for Savings. He has served as a director or trustee of various AllianceBernstein Funds since 1983 and has been Chairman of the AllianceBernstein Funds and of the Independent Directors Committee of such Funds since 2003. He is also active in a number of mutual fund organizations and committees. | 102 | None | |||||
John H. Dobkin, # 69 (1998) | Independent Consultant since prior to 2006. Formerly, President of Save Venice, Inc. (preservation organization) from 2001-2002, Senior Advisor from June 1999-June 2000 and President of Historic Hudson Valley (historic preservation) from December 1989-May 1999. Previously, Director of the National Academy of Design. He has served as a director or trustee of various AllianceBernstein Funds since 1992, and as Chairman of the Audit Committees of a number of such Funds from 2001-2008. | 102 | None | |||||
| 62 | • ALLIANCEBERNSTEIN BOND INFLATION STRATEGY |
Management of the Fund
NAME, ADDRESS* and AGE (YEAR FIRST ELECTED**) | PRINCIPAL DURING PAST FIVE | PORTFOLIOS IN FUND COMPLEX OVERSEEN BY DIRECTOR | OTHER DIRECTORSHIPS HELD BY DIRECTOR IN THE PAST FIVE YEARS | |||||
| DISINTERESTED DIRECTORS (continued) | ||||||||
Michael J. Downey, # 67 (2005) | Private Investor since prior to 2006. Formerly, managing partner of Lexington Capital, LLC (investment advisory firm) from December 1997 until December 2003. From 1987 until 1993, Chairman and CEO of Prudential Mutual Fund Management, Director of the Prudential Mutual funds and member of the Executive Committee of Prudential Securities Inc. He has served as a director or trustee of the AllianceBernstein Funds since 2005 and is a director of two other registered investment companies (and Chairman of one of them). | 102 | Asia Pacific Fund, Inc. and The Merger Fund since prior to 2006 and Prospect Acquisition Corp. (financial services) since 2007 until 2009 | |||||
D. James Guzy, # 75 (2005) | Chairman of the Board of PLX Technology (semi-conductors) and of SRC Computers Inc., with which he has been associated since prior to 2006. He was a director of Intel Corporation (semi-conductors) from 1969 until 2008, and served as Chairman of the Finance Committee of such company for several years until May 2008. He has served as a director or trustee of one or more of the AllianceBernstein Funds since 1982. | 102 | Cirrus Logic Corporation (semi-conductors) and PLX Technology (semi-conductors) since prior to 2006 and Intel Corporation (semi-conductors) since prior to 2006 until 2008 | |||||
| ALLIANCEBERNSTEIN BOND INFLATION STRATEGY • | 63 |
Management of the Fund
NAME, ADDRESS* and AGE (YEAR FIRST ELECTED**) | PRINCIPAL DURING PAST FIVE | PORTFOLIOS IN FUND COMPLEX OVERSEEN BY DIRECTOR | OTHER DIRECTORSHIPS HELD BY DIRECTOR IN THE PAST FIVE YEARS | |||||
| DISINTERESTED DIRECTORS (continued) | ||||||||
Nancy P. Jacklin, # 63 (2006) | Professorial Lecturer at the Johns Hopkins School of Advanced International Studies since 2008. Formerly, U.S. Executive Director of the International Monetary Fund (December 2002-May 2006); Partner, Clifford Chance (1992-2002); Sector Counsel, International Banking and Finance, and Associate General Counsel, Citicorp (1985-1992); Assistant General Counsel (International), Federal Reserve Board of Governors (1982-1985); and Attorney Advisor, U.S. Department of the Treasury (1973-1982). Member of the Bar of the District of Columbia and of New York; and member of the Council on Foreign Relations. She has served as a director or trustee of the AllianceBernstein Funds since 2006. | 102 | None | |||||
| 64 | • ALLIANCEBERNSTEIN BOND INFLATION STRATEGY |
Management of the Fund
NAME, ADDRESS* and AGE (YEAR FIRST ELECTED**) | PRINCIPAL DURING PAST FIVE | PORTFOLIOS IN FUND COMPLEX OVERSEEN BY DIRECTOR | OTHER DIRECTORSHIPS HELD BY DIRECTOR IN THE PAST FIVE YEARS | |||||
| DISINTERESTED DIRECTORS (continued) | ||||||||
Garry L. Moody, # 59 (2008) | Independent Consultant. Formerly, Partner, Deloitte & Touche LLP (1995-2008) where he held a number of senior positions, including Vice Chairman, and U.S. and Global Investment Management Practice Managing Partner; President, Fidelity Accounting and Custody Services Company (1993-1995); and Partner, Ernst & Young LLP (1975-1993), where he served as the National Director of Mutual Fund Tax Services. He is also a member of the Governing Council of the Independent Directors Council (IDC), an organization of independent directors of mutual funds. He has served as a director or trustee, and as Chairman of the Audit Committee, of most of the AllianceBernstein Funds since 2008. | 102 | None | |||||
| ALLIANCEBERNSTEIN BOND INFLATION STRATEGY • | 65 |
Management of the Fund
NAME, ADDRESS* and AGE (YEAR FIRST ELECTED**) | PRINCIPAL DURING PAST FIVE | PORTFOLIOS IN FUND COMPLEX OVERSEEN BY DIRECTOR | OTHER DIRECTORSHIPS HELD BY DIRECTOR IN THE PAST FIVE YEARS | |||||
| DISINTERESTED DIRECTORS (continued) | ||||||||
Marshall C. Turner, Jr., # 70 (2005) | Private Investor since prior to 2006. Interim CEO of MEMC Electronic Materials, Inc. (semi-conductor and solar cell substrates) from November 2008 until March 2009. He was Chairman and CEO of Dupont Photomasks, Inc. (components of semi-conductor manufacturing), 2003-2005, and President and CEO, 2005-2006, after the company was acquired and renamed Toppan Photomasks, Inc. He has extensive experience in venture capital investing including prior service as general partner of three institutional venture capital partnerships, and serves on the boards of a number of education and science-related non-profit organizations. He has served as a director or trustee of one or more of the AllianceBernstein Funds since 1992. | 102 | Xilinx, Inc. (programmable logic semi-conductors) and MEMC Electronic Materials, Inc. (semi-conductor and solar cell substrates) since prior to 2006. | |||||
Earl D. Weiner, # 72 (2007) | Of Counsel, and Partner prior to January 2007, of the law firm Sullivan & Cromwell LLP, and member of ABA Federal Regulation of Securities Committee Task Force to draft editions of the Fund Director’s Guidebook. He also serves as a director or trustee of various non-profit organizations and has served as Chairman or Vice Chairman of a number of them. He has served as a director or trustee of the AllianceBernstein Funds since 2007 and is Chairman of the Governance and Nominating Committees of most of the Funds. | 102 | None | |||||
| 66 | • ALLIANCEBERNSTEIN BOND INFLATION STRATEGY |
Management of the Fund
| * | The address for each of the Strategy’s disinterested Directors is c/o AllianceBernstein L.P., Attention: Philip L. Kirstein, 1345 Avenue of the Americas, New York, NY 10105. |
| ** | There is no stated term of office for the Strategy’s Directors. |
| *** | The information above includes each Director’s principal occupation during the last five years and other information relating to the experience, attributes and skills relevant to each Director’s qualifications to serve as a Director, which led to the conclusion that each Director should serve as a Director for the Strategy. |
| + | Mr. Keith is an “interested person” of the Strategy as defined in the “40 Act”, due to his position as a Senior Vice President of the Adviser. |
| ++ | Member of the Fair Value Pricing Committee. |
| # | Member of the Audit Committee, the Governance and Nominating Committee and the Independent Directors Committee. |
| ALLIANCEBERNSTEIN BOND INFLATION STRATEGY • | 67 |
Management of the Fund
Officer Information
Certain information concerning the Strategy’s Officers is listed below.
| NAME, ADDRESS* AND AGE | PRINCIPAL HELD WITH FUND | PRINCIPAL OCCUPATION DURING PAST 5 YEARS | ||
| Robert M. Keith 51 | President and Chief Executive Officer | See biography above. | ||
| Philip L. Kirstein 66 | Senior Vice President and Independent Compliance Officer | Senior Vice President and Independent Compliance Officer of the AllianceBernstein Funds, with which he has been associated since October 2004. Prior thereto, he was Of Counsel to Kirkpatrick & Lockhart, LLP from October 2003 to October 2004, and General Counsel of Merrill Lynch Investment Managers, L.P. since prior to March 2003. | ||
Paul J. DeNoon 49 | Vice President | Senior Vice President of the Adviser,** with which he has been associated since prior to 2006. | ||
Rajen B. Jadav 36 | Vice President | Vice President of the Adviser,** with which he has been associated since prior to 2006. | ||
Shawn E. Keegan 40 | Vice President | Vice President of the Adviser,** with which he has been associated since prior to 2006. | ||
Douglas J. Peebles 46 | Vice President | Senior Vice President of the Adviser,** with which he has been associated since prior to 2006. | ||
Greg J. Wilensky 44 | Vice President | Senior Vice President of the Adviser,** with which he has been associated since prior to 2006. | ||
| Emilie D. Wrapp 56 | Secretary | Senior Vice President, Assistant General Counsel and Assistant Secretary of ABI,** with which she has been associated since prior to 2006. | ||
| Joseph J. Mantineo 52 | Treasurer and Chief Financial Officer | Senior Vice President of AllianceBernstein Investor Services, Inc. (“ABIS”),** with which he has been associated since prior to 2006. | ||
| Phyllis J. Clarke 50 | Controller | Vice President of ABIS,** with which she has been associated since prior to 2006. |
| * | The address for each of the Fund’s Officers is 1345 Avenue of the Americas, New York, NY 10105. |
| ** | The Adviser, ABI and ABIS are affiliates of the Strategy. |
| The Fund’s Statement of Additional Information (“SAI”) has additional information about the Strategy’s Directors and Officers and is available without charge upon request. Contact your financial representative or AllianceBernstein at 1-800-227-4618, or visit www.alliancebernstein.com, for a free prospectus or SAI. |
| 68 | • ALLIANCEBERNSTEIN BOND INFLATION STRATEGY |
Management of the Fund
THE FOLLOWING IS NOT PART OF THE SHAREHOLDER REPORT OR THE FINANCIAL STATEMENTS
SUMMARY OF SENIOR OFFICER’S EVALUATION OF INVESTMENT ADVISORY AGREEMENT1
The following is a summary of the evaluation of the Investment Advisory Agreement between AllianceBernstein L.P. (the “Adviser”) and AllianceBernstein Bond Fund, Inc. (the “Fund”) in respect of AllianceBernstein Bond Inflation Strategy (the “Strategy”).2 The evaluation of the Investment Advisory Agreement was prepared by Philip L. Kirstein, the Senior Officer of the Fund, for the Directors of the Fund, as required by the September 1, 2004 Assurance of Discontinuance (“AoD”) between the Adviser and the New York State Attorney General (the “NYAG”). The Senior Officer’s evaluation of the Investment Advisory Agreement is not meant to diminish the responsibility or authority of the Board of Directors of the Fund to perform its duties pursuant to Section 15 of the Investment Company Act of 1940 (the “40 Act”) and applicable state law. The purpose of the summary is to provide shareholders with a synopsis of the independent evaluation of the reasonableness of the advisory fees proposed to be paid by the Strategy which was provided to the Directors in connection with their review of the proposed approval of the continuance of the Investment Advisory Agreement. The Senior Officer’s evaluation considered the following factors:
| 1. | Advisory fees charged to institutional and other clients of the Adviser for like services; |
| 2. | Advisory fees charged by other mutual fund companies for like services; |
| 3. | Costs to the Adviser and its affiliates of supplying services pursuant to the advisory agreement, excluding any intra-corporate profit; |
| 4. | Profit margins of the Adviser and its affiliates from supplying such services; |
| 5. | Possible economies of scale as the Strategy grows larger; and |
| 6. | Nature and quality of the Adviser’s services including the performance of the Strategy. |
These factors, with the exception of the first factor, are generally referred to as the “Gartenberg factors,” which were articulated by the United States Court of Appeals for the Second Circuit in 1982. Gartenberg v. Merrill Lynch Asset Management, Inc., 694 F. 2d 923 (2d Cir. 1982). On March 30, 2010, the Supreme Court held the Gartenberg decision was correct in its basic formulation
| 1 | The Senior Officer’s fee evaluation was completed on October 20, 2011 and discussed with the Board of Directors on November 1-3, 2011. |
| 2 | Future references to the Fund or the Strategy do not include “AllianceBernstein.” |
| ALLIANCEBERNSTEIN BOND INFLATION STRATEGY • | 69 |
of what §36(b) requires: to face liability under §36(b), “an investment adviser must charge a fee that is so disproportionately large that it bears no reasonable relationship to the services rendered and could not have been the product of arm’s length bargaining” Jones v. Harris Associates L.P., 130 S. Ct. 1418 (2010). In Jones, the Court stated the Gartenberg approach fully incorporates the correct understanding of fiduciary duty within the context of section 36(b) and noted with approval that “Gartenberg insists that all relevant circumstances be taken into account” and “uses the range of fees that might result from arm’s-length bargaining as the benchmark for reviewing challenged fees.”3
PORTFOLIO ADVISORY FEES, EXPENSE CAPS, REIMBURSEMENTS & RATIOS
The Adviser proposed that the Strategy pay the advisory fee set forth in the table below for receiving the services to be provided pursuant to the Investment Advisory Agreement. The fee schedule below, implemented in January 2004 in connection with the Adviser’s settlement with the NYAG in December 2003, is based on a master schedule that contemplates eight categories of funds with almost all funds in each category having the same advisory fee schedule.4
| Category | Net Assets 09/30/11 | Advisory Fee Based on % of Average Daily Net Assets | Strategy | |||
| High Income | $136.8 | 50 bp on 1st $2.5 billion 45 bp on next $2.5 billion 40 bp on the balance | Bond Inflation Strategy |
The Adviser is reimbursed as specified in the Investment Advisory Agreement for certain clerical, legal, accounting, administrative and other services provided to the Strategy. During the Strategy’s most recently completed fiscal year, the Adviser was entitled to receive $55,000 (0.42% of the Strategy’s average daily net assets) for providing such services, but waived the amount in its entirety.
The Adviser agreed to waive that portion of its advisory fees and/or reimburse the Strategy for that portion of the Strategy’s total operating expenses to the degree necessary to limit the Strategy’s expense ratios to the amounts set forth below for the Strategy’s current fiscal year. The waiver is terminable by the Adviser at the end of the Strategy’s fiscal year upon at least 60 days written
| 3 | Jones v. Harris at 1427. |
| 4 | Most of the AllianceBernstein Mutual Funds, which the Adviser manages, were affected by the Adviser’s settlement with the NYAG. |
| 70 | • ALLIANCEBERNSTEIN BOND INFLATION STRATEGY |
notice. In addition, set forth below are the Strategy’s gross expense ratios, annualized for the most recent semi-annual period:
| Strategy | Expense Cap Pursuant to Expense Limitation Undertaking | Gross Ratio5 (04/30/11) | Fiscal Year End | |||||||||
| Bond Inflation Strategy | Advisor | 0.45% | 2.83% | October 31 | ||||||||
| Class A | 0.75% | 3.11% | ||||||||||
| Class C | 1.45% | 3.80% | ||||||||||
| Class R | 0.95% | 3.58% | ||||||||||
| Class K | 0.70% | 3.05% | ||||||||||
| Class I | 0.45% | 2.68% | ||||||||||
| Class 1 | 0.55% | 3.22% | ||||||||||
| Class 2 | 0.45% | 2.65% | ||||||||||
| I. | ADVISORY FEES CHARGED TO INSTITUTIONAL AND OTHER CLIENTS |
The advisory fees charged to investment companies which the Adviser manages and sponsors are normally higher than those charged to similar sized institutional accounts, including pension plans and sub-advised investment companies. The fee differential reflects, among other things, different services provided to such clients, and different liabilities assumed. Services provided by the Adviser to the Strategy that are not provided to non-investment company clients include providing office space and personnel to serve as Fund Officers, who among other responsibilities make the certifications required under the Sarbanes-Oxley Act of 2002, and coordinating with and monitoring the Portfolio’s third party service providers such as Fund counsel, auditors, custodians, transfer agents and pricing services. The accounting, administrative, legal and compliance requirements for the Strategy are more costly than those for institutional client assets due to the greater complexities and time required for investment companies, although as previously noted, the Adviser is entitled to be reimbursed for providing some of these services. Also, retail mutual funds managed by the Adviser are widely held and accordingly, servicing the Strategy’s investors is more time consuming and labor intensive compared to servicing institutional clients since the Adviser needs to communicate with a more extensive network of financial intermediaries and shareholders. The Adviser also believes that it incurs substantial entrepreneurial risk when offering a new mutual fund since establishing a new mutual fund requires a large upfront investment and it may take a long time for the fund to achieve profitability since the fund must be priced to scale from inception in order to be competitive and assets are acquired one account at a time. In addition, managing the cash flow of an investment company may be more difficult than that of a stable pool of assets, such as an institutional account with little cash movement in either direction, particularly if the Strategy is in net redemption and the Adviser is frequently forced to sell securities to raise cash for redemptions. However, managing a fund with positive cash flow may be easier at times than managing a stable pool of assets. Finally, in recent years, investment
| 5 | Annualized. |
| ALLIANCEBERNSTEIN BOND INFLATION STRATEGY • | 71 |
advisers have been sued by institutional clients and have suffered reputational damage both by the attendant publicity and outcomes other than complete victories. Accordingly, the legal and reputational risks associated with institutional accounts are greater than previously thought, although arguably still not equal to those related to the mutual fund industry.
Notwithstanding the Adviser’s view that managing an investment company is not comparable to managing other institutional accounts because the services provided are different, the Supreme Court has indicated consideration should be given to the advisory fees charged to institutional accounts with a similar investment style as the Strategy.6 In addition to the AllianceBernstein Institutional fee schedule, set forth below is what would have been the effective advisory fee for the Strategy had the AllianceBernstein Institutional fee schedule been applicable to the Strategy versus the Strategy’s advisory fees based on September 30, 2011 net assets.7
| Strategy | Net Assets 09/30/11 ($MM) | AllianceBernstein (“AB”) Fee Schedule | Effective AB Inst. Adv. Fee | Strategy Fee | ||||||||
| Bond Inflation Strategy | $136.8 | TIPS Plus Schedule 50 bp on 1st $30 million 20 bp on the balance Minimum account size: $25m | 0.305% | 0.500% | ||||||||
The Adviser represented that it does not sub-advise any registered investment companies that have a similar investment strategy as the Strategy.
| II. | MANAGEMENT FEES CHARGED BY OTHER MUTUAL FUND COMPANIES FOR LIKE SERVICES. |
Lipper, Inc., an analytical service that is not affiliated with the Adviser, compared the fees charged to the Strategy with fees charged to other investment companies for similar services by other investment advisers.8 Lipper’s analysis included
| 6 | The Supreme Court stated that “courts may give such comparisons the weight that they merit in light of the similarities and differences between the services that the clients in question require, but the courts must be wary of inapt comparisons.” Among the significant differences the Supreme Court noted that may exist between services provided to mutual funds and institutional accounts are “higher marketing costs.” Jones v. Harris at 1428. |
| 7 | The Adviser has indicated that with respect to institutional accounts with assets greater than $300 million, it will negotiate a fee schedule. Discounts that are negotiated vary based upon each client relationship. |
| 8 | The Supreme Court cautioned against accepting mutual fund fee comparisons without careful scrutiny since “these comparisons are problematic because these fees, like those challenged, may not be the product of negotiations conducted at arm’s length.” Jones v. Harris at 1429. |
| 72 | • ALLIANCEBERNSTEIN BOND INFLATION STRATEGY |
the comparison of the Strategy’s contractual management fee,9,10 estimated at the approximate current asset level of the subject Strategy, to the median of the Strategy’s Lipper Expense Group (“EG”) and the Strategy’s contractual management fee ranking.
Lipper describes an EG as a representative sample of comparable funds. Lipper’s standard methodology for screening funds to be included in an EG entails the consideration of several fund criteria, including fund type, investment classification/objective, load type and similar 12b-1/non-12b-1 service fees, asset (size) comparability, expense components and attributes. An EG will typically consist of seven to twenty funds.
| Strategy | Contractual Management Fee (%) | Lipper Expense Median (%) | Rank | |||||||||
| Bond Inflation Strategy | 0.500 | 0.525 | 5/10 | |||||||||
Lipper also compared the Strategy’s total expense ratio to the medians of the Strategy’s EG and Lipper Expense Universe (“EU”). The EU11 is a broader group compared to the EG, consisting of all funds that have the same investment classification/objective and load type as the subject Strategy.
| Strategy | Expense Ratio | Lipper Exp. Group Median (%) | Lipper Group Rank | Lipper Exp. Median (%) | Lipper Rank | |||||||||||||||
| Bond Inflation Strategy | 0.750 | 0.815 | 4/10 | 0.848 | 4/18 | |||||||||||||||
Based on this analysis, the Strategy has a more favorable ranking on a total expense ratio basis than on a management fee basis.
| 9 | The contractual management fee is calculated by Lipper using the Strategy’s contractual management fee rate at a hypothetical asset level. The hypothetical asset level is based on the combined net assets of all classes of the Fund, rounded up to the next $25 million. Lipper’s total expense ratio information is based on the most recent annual report except as otherwise noted. A ranking of “1” means that the Strategy has the lowest effective fee rate in the Lipper peer group. |
| 10 | The contractual management fee does not reflect any expense reimbursements made by the Strategy to the Adviser for certain clerical, legal, accounting, administrative, and other services. In addition, the contractual management fee does not reflect any advisory fee waivers or expense reimbursements made by the Adviser that would effectively reduce the actual effective management fee. |
| 11 | Except for asset (size) comparability, Lipper uses the same criteria for selecting an EG when selecting an EU. Unlike the EG, the EU allows for the same adviser to be represented by more than just one fund. |
| 12 | Most recently completed fiscal year Class A share total expense ratio. |
| ALLIANCEBERNSTEIN BOND INFLATION STRATEGY • | 73 |
| III. | COSTS TO THE ADVISER AND ITS AFFILIATES OF SUPPLYING SERVICES PURSUANT TO THE ADVISORY FEE ARRANGEMENT, EXCLUDING ANY INTRA-CORPORATE PROFIT. |
The Adviser utilizes two profitability reporting systems, which operate independently but are aligned with each other, to estimate the Adviser’s profitability in connection with investment advisory services provided to the Strategy. The Senior Officer has retained an independent consultant to provide independent advice regarding the alignment of the two profitability systems as well as the methodologies and allocations utilized by both profitability systems. See Section IV for additional discussion.
| IV. | PROFIT MARGINS OF THE ADVISER AND ITS AFFILIATES FOR SUPPLYING SUCH SERVICES. |
The profitability information for the Strategy, prepared by the Adviser for the Board of Directors, was reviewed by the Senior Officer and the independent consultant. The Adviser’s profitability from providing investment advisory services to the Strategy in 2010 was negative.
In addition to the Adviser’s direct profits from managing the Strategy, certain of the Adviser’s affiliates have business relationships with the Strategy and may earn a profit from providing other services to the Strategy. The courts have referred to this type of business opportunity as “fall-out benefits” to the Adviser and indicated that such benefits should be factored into the evaluation of the total relationship between the Strategy and the Adviser. Neither case law nor common business practice precludes the Adviser’s affiliates from earning a reasonable profit on this type of relationship provided the affiliates’ charges and services are competitive. These affiliates provide transfer agent and distribution related services to the Strategy and receive transfer agent fees, front-end sales loads, Rule 12b-1 payments and contingent deferred sales charges (“CDSC”). During the Strategy’s most recently completed fiscal year, ABI received from the Portfolio $1,291, $12,218 and $0 in front-end sales charges, Rule 12b-1 and CDSC fees, respectively.
AllianceBernstein Investments, Inc. (“ABI”), an affiliate of the Adviser, is the Strategy’s principal underwriter. ABI and the Adviser have disclosed in the Strategy’s prospectus that they may make revenue sharing payments from their own resources, in addition to revenues derived from sales loads and Rule 12b-1 fees, to firms that sell shares of the Strategy. In 2010, ABI paid approximately 0.04% of the average monthly assets of the AllianceBernstein Mutual Funds or approximately $13.8 million for distribution services and educational support (revenue sharing payments).
Fees and reimbursements for out of pocket expenses charged by AllianceBernstein Investor Services, Inc. (“ABIS”), the affiliated transfer agent for the Strategy, are charged on a per account basis, based on the level of service
| 74 | • ALLIANCEBERNSTEIN BOND INFLATION STRATEGY |
provided and the class of share held by the account. ABIS also receives a fee per shareholder sub-account for each account maintained by an intermediary on an omnibus basis. During the Strategy’s most recently completed fiscal year, ABIS received $9,211 in fees from the Strategy.
| V. | POSSIBLE ECONOMIES OF SCALE |
The Adviser has indicated that economies of scale are being shared with shareholders through fee structures,13 subsidies and enhancement to services. Based on some of the professional literature that has considered economies of scale in the mutual fund industry, it is thought that to the extent economies of scale exist, they may more often exist across a fund family as opposed to a specific fund. This is because the costs incurred by the Adviser, such as investment research or technology for trading or compliance systems, can be spread across a greater asset base as the fund family increases in size. It is also possible that as the level of services required to operate a successful investment company has increased over time, and advisory firms have made such investments in their business to provide services, there may be a sharing of economies of scale without a reduction in advisory fees.
In February 2008, an independent consultant, retained by the Senior Officer, provided the Board of Directors an update of the Deli14 study on advisory fees and various fund characteristics.15 The independent consultant first reiterated the results of his previous two dimensional comparison analysis (fund size and family size) with the Board of Directors.16 The independent consultant then discussed the results of the regression model that was utilized to study the effects of various factors on advisory fees. The regression model output indicated that the bulk of the variation in fees predicted were explained by various factors, but substantially by fund assets under management (“AUM”), family AUM, index fund indicator and investment style. The independent consultant also compared the advisory fees of the AllianceBernstein Mutual Funds to similar funds managed by 19 other large asset managers, regardless of fund size and the large asset manager’s proportion of mutual fund assets to non-mutual fund assets.
| 13 | Fee structures include fee reductions, pricing at scale and breakpoints in advisory fee schedules. |
| 14 | The Deli study, originally published in 2002 based on 1997 data and updated for the February 2008 presentation, may be of diminished value due to the age of the data used in the presentation and the changes experienced in the industry over the last four years. |
| 15 | As mentioned previously, the Supreme Court cautioned against accepting mutual fund fee comparisons without careful scrutiny since the fees may not be the product of negotiations conducted at arm’s length. See Jones V. Harris at 1429. |
| 16 | The two dimensional analysis showed patterns of lower advisory fees for funds with larger asset sizes and funds from larger family sizes compared to funds with smaller asset sizes and funds from smaller family sizes, which according to the independent consultant is indicative of a sharing of economies of scale and scope. However, in less liquid and active markets, such is not the case, as the empirical analysis showed potential for diseconomies of scale in those markets. The empirical analysis also showed diminishing economies of scale and scope as funds surpassed a certain high level of assets. |
| ALLIANCEBERNSTEIN BOND INFLATION STRATEGY • | 75 |
| VI. | NATURE AND QUALITY OF THE ADVISER’S SERVICES INCLUDING THE PERFORMANCE OF THE PORTFOLIO. |
With assets under management of approximately $402 billion as of September 30, 2011, the Adviser has the investment experience to manage and provide non-investment services (described in Section I) to the Strategy.
The information below shows the 1 year performance return and rankings of the Strategy17 relative to its Lipper Performance Group (“PG”) and Lipper Performance Universe (“PU”)18 for the periods ended July 31, 2011.19
| Strategy | Strategy Return (%) | PG Median (%) | PU Median (%) | PG Rank | PU Rank | |||||||||||||||
| Bond Inflation Strategy | ||||||||||||||||||||
1 year | 10.19 | 10.98 | 10.79 | 8/10 | 17/24 | |||||||||||||||
Set forth below are the 1year and since inception net performance returns of the Strategy (in bold)20 versus its benchmark.21 Strategy and benchmark volatility and reward-to-variability ratio (“Sharpe Ratio”) information is also shown.22
Periods Ending July 31, 2011 Annualized Performance | ||||||||||||||||||||
| Annualized | Risk Period (Year) | |||||||||||||||||||
| 1 Year (%) | Since Inception (%) | Volatility (%) | Sharpe (%) | |||||||||||||||||
| Bond Inflation Strategy | 9.89 | 8.11 | 3.65 | 2.53 | 1 | |||||||||||||||
| Barclays Capital 1-10yr TIPS Index | 9.63 | 7.78 | 3.25 | 2.69 | 1 | |||||||||||||||
| Inception Date: January 26, 2010 | ||||||||||||||||||||
| 17 | The performance returns and rankings are for the Class A shares of the Strategy. The performance returns of the Strategy were provided Lipper. Lipper maintains its own database that includes the Strategy’s performance returns. |
| 18 | The Strategy’s PG is identical to the Strategy’s EG. The Strategy’s PU is not identical to the Strategy’s EU as the criteria for including/excluding a strategy in/from a PU are somewhat different from that of an EU. |
| 19 | Note that the current Lipper investment classification/objective dictates the PG and PU throughout the life of the Strategy even if the Strategy may have had a different investment classification/objective at different points in time. |
| 20 | The performance returns and risk measures shown in the table are for the Class A shares of the Strategy. |
| 21 | The Adviser provided Strategy and benchmark performance return information for the periods through July 31, 2011. |
| 22 | Strategy and benchmark volatility and Sharpe Ratio information was obtained through Lipper LANA, a database maintained by Lipper. Volatility is a statistical measure of the tendency of a market price or yield to vary over time. A Sharpe Ratio is a risk adjusted measure of return that divides a fund’s return in excess of the riskless return by the fund’s standard deviation. A strategy with a greater volatility would be viewed as more risky than a strategy with equivalent performance but lower volatility; for that reason, a greater return would be demanded for the more risky fund. A strategy with a higher Sharpe Ratio would be regarded as better performing than a strategy with a lower Sharpe Ratio. |
| 76 | • ALLIANCEBERNSTEIN BOND INFLATION STRATEGY |
CONCLUSION:
Based on the factors discussed above the Senior Officer’s conclusion is that the proposed advisory fee for the Strategy is reasonable and within the range of what would have been negotiated at arm’s-length in light of all the surrounding circumstances. This conclusion in respect of the Strategy is based on an evaluation of all of these factors and no single factor was dispositive.
Dated: November 28, 2011
| ALLIANCEBERNSTEIN BOND INFLATION STRATEGY • | 77 |
THIS PAGE IS NOT PART OF THE SHAREHOLDER REPORT OR THE FINANCIAL STATEMENTS
ALLIANCEBERNSTEIN FAMILY OF FUNDS
Wealth Strategies Funds
Balanced Wealth Strategy
Conservative Wealth Strategy
Wealth Appreciation Strategy
Tax-Managed Balanced Wealth Strategy
Tax-Managed Conservative Wealth Strategy
Tax-Managed Wealth Appreciation Strategy
Asset Allocation/Multi-Asset
Emerging Markets Multi-Asset
International Portfolio
Real Asset Strategy
Tax-Managed International Portfolio
Growth Funds
Domestic
Growth Fund
Large Cap Growth Fund
Small Cap Growth Portfolio
Small/Mid Cap Growth Fund
U.S. Strategic Research Portfolio
Global & International
Global Thematic Growth Fund
Greater China ’97 Fund
International Discovery Equity Portfolio
International Focus 40 Portfolio
International Growth Fund
Value Funds
Domestic
Core Opportunities Fund
Equity Income Fund
Growth & Income Fund
Small/Mid Cap Value Fund
Value Fund
Global & International
Global Real Estate Investment Fund
Global Value Fund
International Value Fund
Taxable Bond Funds
Bond Inflation Strategy
Global Bond Fund
High Income Fund
Intermediate Bond Portfolio
Short Duration Portfolio
Unconstrained Bond Fund*
Municipal Bond Funds
Arizona California High Income Massachusetts Michigan Minnesota Municipal Bond Inflation Strategy | National New Jersey New York Ohio Pennsylvania Virginia |
Intermediate Municipal Bond Funds
Intermediate California
Intermediate Diversified
Intermediate New York
Closed-End Funds
Alliance California Municipal Income Fund
Alliance New York Municipal Income Fund
AllianceBernstein Global High Income Fund
AllianceBernstein Income Fund
AllianceBernstein National Municipal Income Fund
Alternatives
Market Neutral Strategy-Global
Market Neutral Strategy-U.S.
Balanced
Balanced Shares
Retirement Strategies Funds
2000 Retirement Strategy | 2020 Retirement Strategy | 2040 Retirement Strategy | ||
2005 Retirement Strategy | 2025 Retirement Strategy | 2045 Retirement Strategy | ||
2010 Retirement Strategy | 2030 Retirement Strategy | 2050 Retirement Strategy | ||
2015 Retirement Strategy | 2035 Retirement Strategy | 2055 Retirement Strategy |
We also offer Exchange Reserves,** which serves as the money market fund exchange vehicle for the AllianceBernstein mutual funds.
You should consider the investment objectives, risks, charges and expenses of any AllianceBernstein fund/portfolio carefully before investing. For free copies of our prospectuses, which contain this and other information, visit us online at www.alliancebernstein.com or contact your financial advisor. Please read the prospectus carefully before investing.
| * | Prior to February 3, 2011, Unconstrained Bond Fund was named Diversified Yield Fund. |
| ** | An investment in the Fund is not a deposit in a bank and is not insured or guaranteed by the Federal Deposit Insurance Corporation or any other government agency. Although the Fund seeks to preserve the value of your investment at $1.00 per share, it is possible to lose money by investing in the Fund. |
| 78 | • ALLIANCEBERNSTEIN BOND INFLATION STRATEGY |
AllianceBernstein Family of Funds
NOTES
| ALLIANCEBERNSTEIN BOND INFLATION STRATEGY • | 79 |
NOTES
| 80 | • ALLIANCEBERNSTEIN BOND INFLATION STRATEGY |
NOTES
| ALLIANCEBERNSTEIN BOND INFLATION STRATEGY • | 81 |
NOTES
| 82 | • ALLIANCEBERNSTEIN BOND INFLATION STRATEGY |
NOTES
| ALLIANCEBERNSTEIN BOND INFLATION STRATEGY • | 83 |
NOTES
| 84 | • ALLIANCEBERNSTEIN BOND INFLATION STRATEGY |
ALLIANCEBERNSTEIN BOND INFLATION STRATEGY
1345 Avenue of the Americas
New York, NY 10105
800.221.5672
| BIS-0151-1011 |  | |
ANNUAL REPORT
AllianceBernstein
Municipal Bond Inflation Strategy
October 31, 2011
Annual Report

Investment Products Offered
| • | Are Not FDIC Insured |
| • | May Lose Value |
| • | Are Not Bank Guaranteed |
Investors should consider the investment objectives, risks, charges and expenses of the Fund carefully before investing. For copies of our prospectus or summary prospectus, which contain this and other information, visit us online at www.alliancebernstein.com or contact your AllianceBernstein Investments representative. Please read the prospectus and/or summary prospectus carefully before investing.
This shareholder report must be preceded or accompanied by the Fund’s prospectus for individuals who are not current shareholders of the Fund.
You may obtain a description of the Fund’s proxy voting policies and procedures, and information regarding how the Fund voted proxies relating to portfolio securities during the most recent 12-month period ended June 30, without charge. Simply visit AllianceBernstein’s website at www.alliancebernstein.com, or go to the Securities and Exchange Commission’s (the “Commission”) website at www.sec.gov, or call AllianceBernstein at (800) 227-4618.
The Fund files its complete schedule of portfolio holdings with the Commission for the first and third quarters of each fiscal year on Form N-Q. The Fund’s Forms N-Q are available on the Commission’s website at www.sec.gov. The Fund’s Forms N-Q may also be reviewed and copied at the Commission’s Public Reference Room in Washington, DC; information on the operation of the Public Reference Room may be obtained by calling (800) SEC-0330. AllianceBernstein publishes full portfolio holdings for the Fund monthly at www.alliancebernstein.com.
AllianceBernstein Investments, Inc. (ABI) is the distributor of the AllianceBernstein family of mutual funds. ABI is a member of FINRA and is an affiliate of AllianceBernstein L.P., the manager of the funds.
AllianceBernstein® and the AB Logo are registered trademarks and service marks used by permission of the owner, AllianceBernstein L.P.
December 15, 2011
Annual Report
This report provides management’s discussion of fund performance for AllianceBernstein Municipal Bond Inflation Strategy (the “Strategy”) for the annual period ended October 31, 2011.
Investment Objectives and Policies
The Strategy seeks to maximize real after-tax return for investors subject to federal income taxes, without undue risk to principal. Real return is the rate of return after adjusting for inflation. The Strategy pursues its objective by investing principally in high-quality, predominantly investment grade, municipal securities, that pay interest exempt from federal taxation. As a fundamental policy, the Strategy will invest at least 80% of its net assets in municipal securities. These securities may be subject to the federal alternative minimum tax (“AMT”) for some taxpayers.
The Strategy will invest at least 80% of its total assets in fixed-income securities rated A or better or the equivalent by one or more national rating agencies or deemed to be of comparable credit quality by AllianceBernstein L.P. (the “Adviser”). In deciding whether to take direct or indirect exposure, the Strategy may invest up to 20% of its total assets in fixed-income securities rated BB or B or the equivalent by one or more national rating agencies (or deemed to be of comparable credit quality by the Adviser), which are not investment grade (“junk bonds”). If the rating of a fixed-income security falls below investment grade, the
Strategy will not be obligated to sell the security and may continue to hold it if, in the Adviser’s opinion, the investment is appropriate under the circumstances. The Strategy may invest in fixed-income securities with any maturity and duration.
To provide inflation protection, the Strategy will typically enter into inflation swap agreements. The Strategy may use other inflation-protected instruments. Payments to the Strategy pursuant to swap agreements will result in taxable income, either ordinary income or capital gains, rather than income exempt from federal income taxation. It is expected that the Strategy’s primary use of derivatives will be for the purpose of inflation protection.
The Strategy may also invest in forward commitments; zero coupon municipal securities and variable, floating and inverse floating rate municipal securities; certain types of mortgage related securities; and derivatives, such as options, futures, forwards and swaps.
The Strategy may also utilize leverage for investment purposes through the use of tender option bond (“TOB”) transactions. The Adviser will consider the impact of TOB’s, swap agreements and other derivatives in making its assessments of the Strategy’s risks. The resulting exposures to markets, sectors, issuers or specific securities will be continuously monitored by the Adviser.
| ALLIANCEBERNSTEIN MUNICIPAL BOND INFLATION STRATEGY • | 1 |
Investment Results
The table on page 5 shows the Strategy’s performance compared to its benchmark, the Barclays Capital 1-10 year Treasury Inflation-Protected Securities (TIPS) Index and to the Lipper Intermediate Municipal Debt Funds Average (the “Lipper Average”).
Class A shares of the Strategy underperformed their benchmark for both the six- and 12-month periods ended October 31, 2011, before sales charges. Class A shares underperformed the Lipper Average for the six-month period, but outperformed for the 12-month period. The objective of the Strategy is to maximize real (net of inflation) after-tax return without undue risk to principal. In pursuit of this objective, the Strategy invests in municipal bonds that are exempt from federal income tax and typically enters into derivatives, such as inflation swap agreements, in order to provide inflation protection. The result of this is generally less overall interest rate exposure.
As U.S. Treasury yields fell over the six- and 12-month periods, municipal securities had lower returns than U.S. Treasuries, causing the Strategy to underperform its benchmark. Furthermore, the Strategy had less interest rate risk than its benchmark, which detracted from performance as rates generally fell. Relative to the Lipper Average, an allocation to inflation swaps added to performance over the 12-month period as inflation came in higher than market expectations. However, recent market turmoil lowered the forecast of inflation implied by securities in the market and as a
result inflation hedges detracted from the Strategy’s performance relative to the Lipper Average over the last six months.
Interest rate swaps were also used for hedging purposes and these had no material impact on performance for the six- or 12-month periods.
Market Review and Investment Strategy
Municipal bond markets drew strength from a very tight supply of issuance and continued improved tax collections, and having risen over the six-month period ended October 31, 2011, as investor panic concerning defaults sweeping the nation appeared to have subsided. New municipal bond issuance fell sharply in the first nine months of 2011, to the lowest level in a decade. Mayors and governors were reluctant to commit to large capital expenditures while they were slashing their operating budgets. Nevertheless, the need to issue bonds to fund critical capital improvements grew, which points to the likelihood of increased issuance ahead.
The Municipal Bond Investment Team (the “Team”) estimates that state tax revenues climbed to approximately 70% of their peak reached in September 2008 after the largest drop ever seen. For fiscal year 2012, revenues were conservatively projected by the states to increase by about 2% on average; a growth rate that the Team expects may be exceeded. State and local tax collections are highly correlated with the rate of economic growth. Uncertainty surrounding the
| 2 | • ALLIANCEBERNSTEIN MUNICIPAL BOND INFLATION STRATEGY |
domestic economic outlook due to the deteriorating economic outlook for Europe, coupled with the fallout of the European debt crisis, worked together during the summer to cloud the outlook for tax collections going forward.
While the change in the tax collections of state and local governments is highly uncertain at the moment, the Team does not envision a rash of defaults should tax collections be less than expected. Most state and local governments made progress this summer in addressing their budget shortfalls going forward. States and municipalities continued to face their most serious fiscal difficulties since the Great Depression, but, in general, substantial progress was made during the summer to balance their budgets, reducing the risk of widespread defaults.
The Strategy may purchase municipal securities that are insured under policies issued by certain insurance companies. Historically, insured
municipal securities typically received a higher credit rating, which meant that the issuer of the securities paid a lower interest rate. As a result of declines in the credit quality and associated downgrades of most fund insurers, insurance has less value than it did in the past. The market now values insured municipal securities primarily based on the credit quality of the issuer of the security with little value given to the insurance feature. In purchasing such insured securities, the Adviser evaluates the risk and return of municipal securities through its own research. The ratings of most insurance companies have been downgraded and it is possible that some insurers may become insolvent. If an insurance company’s rating is downgraded or the company becomes insolvent, the prices of municipal securities insured by the insurance company may decline. As of October 31, 2011, 12.8% of the Strategy’s total investments were in insured bonds and 0.4% of total investments were in insured pre-refunded/escrowed to maturity bonds.
| ALLIANCEBERNSTEIN MUNICIPAL BOND INFLATION STRATEGY • | 3 |
HISTORICAL PERFORMANCE
An Important Note About Historical Performance
The investment return and principal value of an investment in the Fund will fluctuate, so that shares, when redeemed, may be worth more or less than their original cost. Performance shown on the following pages represents past performance and does not guarantee future results. Current performance may be lower or higher than the performance information shown. You may obtain performance information current to the most recent month-end by visiting www.alliancebernstein.com. For Class 1 shares, click on “Private Clients”, then “Investments”, then “Stocks” or “Bonds”, then “Mutual Fund Performance at a Glance”.
All fees and expenses related to the operation of the Fund have been deducted. NAV returns do not reflect sales charges; if sales charges were reflected, the Fund’s quoted performance would be lower. SEC returns reflect the applicable sales charges for each share class: a 3.00% maximum front-end sales charge for Class A shares; and a 1% 1-year contingent deferred sales charge for Class C shares. Returns for the different share classes will vary due to different expenses associated with each class. Performance assumes reinvestment of distributions and does not account for taxes.
Benchmark Disclosure
The Barclays Capital 1-10 year TIPS Index does not reflect fees and expenses associated with the active management of a portfolio. The Barclays Capital 1-10 year TIPS Index represents the performance of inflation-protected securities issued by the U.S. Treasury. An investor cannot invest directly in an index, and its results are not indicative of the performance for any specific investment, including the Strategy.
A Word About Risk
Market Risk: The market values of the portfolio’s holdings rise and fall from day to day, so investments may lose value.
Interest Rate Risk: As interest rates rise, bond prices fall and vice versa—long-term securities tend to rise and fall more than short-term securities.
Credit Risk: A bond’s credit rating reflects the issuer’s ability to make timely payments of interest or principal—the lower the rating, the higher the risk of default. If the issuer’s financial strength deteriorates, the issuer’s rating may be lowered and the bond’s value may decline.
Inflation Risk: Prices for goods and services tend to rise over time, which may erode the purchasing power of investments.
Municipal Market Risk: Debt securities issued by state or local governments may be subject to special political, legal, economic and market factors that can have a significant effect on the portfolio’s yield or value.
Liquidity Risk: The difficulty of purchasing or selling a security at an advantageous time or price.
Derivatives Risk: Investing in derivative instruments such as options, futures, forwards or swaps can be riskier than traditional investments, and may be more volatile, especially in a down market.
Leverage Risk: Trying to enhance investment returns by borrowing money or using other leverage tools—magnify both gains and losses, resulting in greater volatility.
These risks are more fully discussed in the Strategy’s prospectus.
(Historical Performance continued on next page)
| 4 | • ALLIANCEBERNSTEIN MUNICIPAL BOND INFLATION STRATEGY |
Historical Performance
HISTORICAL PERFORMANCE
(continued from previous page)
THE STRATEGY VS. ITS BENCHMARK PERIODS ENDED OCTOBER 31, 2011 | NAV Returns | |||||||||
| 6 Months | 12 Months | |||||||||
AllianceBernstein Municipal Bond Inflation Strategy | ||||||||||
Class 1* | 1.53% | 4.40% | ||||||||
| ||||||||||
Class 2* | 1.57% | 4.54% | ||||||||
| ||||||||||
Class A | 1.42% | 4.24% | ||||||||
| ||||||||||
Class C | 1.09% | 3.45% | ||||||||
| ||||||||||
Advisor Class** | 1.57% | 4.44% | ||||||||
| ||||||||||
Barclays Capital 1-10 Year TIPS Index | 3.97% | 7.02% | ||||||||
| ||||||||||
Lipper Intermediate Municipal Debt Funds Average | 3.72% | 3.04% | ||||||||
| ||||||||||
* Class 1 shares are only available to private clients of Sanford C. Bernstein & Co. LLC. Class 2 shares are only available to the Adviser’s institutional clients or through other limited arrangements. ** Please note that this share class is for investors purchasing shares through accounts established under certain fee-based programs sponsored and maintained by certain broker-dealers and financial intermediaries, institutional pension plans and/or investment advisory clients of, and certain other persons associated with, the Adviser and its affiliates or the Funds. | ||||||||||
GROWTH OF A $10,000 INVESTMENT IN THE STRATEGY
1/26/10* TO 10/31/11
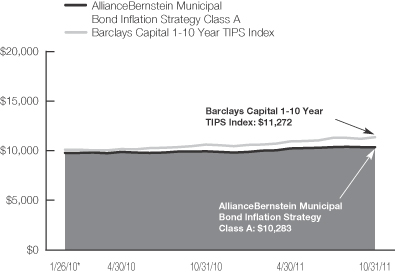
| * | Inception date: 1/26/10. |
This chart illustrates the total value of an assumed $10,000 investment in AllianceBernstein Municipal Bond Inflation Strategy Class A shares (from 1/26/10 to 10/31/11) as compared to the performance of its benchmark. The chart reflects the deduction of the maximum 3.00% sales charge from the initial $10,000 investment in the Fund and assumes the reinvestment of dividends and capital gains distributions.
See Historical Performance and Benchmark disclosures on page 4.
(Historical Performance continued on next page)
| ALLIANCEBERNSTEIN MUNICIPAL BOND INFLATION STRATEGY • | 5 |
Historical Performance
HISTORICAL PERFORMANCE
(continued from previous page)
| AVERAGE ANNUAL RETURNS AS OF OCTOBER 31, 2011 | ||||||||||||
| NAV Returns | SEC Returns | SEC Yields** | ||||||||||
| Class 1 Shares† | ||||||||||||
1 Year | 4.40 | % | 4.40 | % | 0.85 | % | ||||||
Since Inception* | 3.50 | % | 3.50 | % | ||||||||
| Class 2 Shares† | ||||||||||||
1 Year | 4.54 | % | 4.54 | % | 0.94 | % | ||||||
Since Inception* | 3.63 | % | 3.63 | % | ||||||||
| Class A Shares | ||||||||||||
1 Year | 4.24 | % | 1.14 | % | 0.69 | % | ||||||
Since Inception* | 3.37 | % | 1.59 | % | ||||||||
| Class C Shares | ||||||||||||
1 Year | 3.45 | % | 2.45 | % | 0.02 | % | ||||||
Since Inception* | 2.66 | % | 2.66 | % | ||||||||
| Advisor Class Shares†† | ||||||||||||
1 Year | 4.44 | % | 4.44 | % | 1.00 | % | ||||||
Since Inception* | 3.64 | % | 3.64 | % | ||||||||
The Fund’s current prospectus fee table shows the Fund’s total annual operating expense ratios as 2.70%, 2.61%, 2.15%, 2.76%, and 1.57% for Class 1, Class 2, Class A, and Class C, Advisor Class shares, respectively, gross of any fee waivers or expense reimbursements. Contractual fee waivers and/or expense reimbursements limit the Fund’s annual operating expense ratios, exclusive of interest expense, to 0.60%, 0.50%, 0.80%, 1.50%, and 0.50% for Class 1, Class 2, Class A, Class C, and Advisor Class shares, respectively. These waivers/reimbursements extend throughout the Fund’s current fiscal year and may be extended by the Adviser for additional one-year terms. Absent reimbursements or waivers, performance would have been lower. The Financial Highlights section of this report sets forth expense ratio data for the current reporting period; the expense ratios shown above may differ from the expense ratios in the Financial Highlights sections since they are based on different time periods.
| * | Inception date: 1/26/10. |
| ** | SEC Yields are calculated based on SEC guidelines for the 30-day period ended October 31, 2011. |
| † | Class 1 shares are sold only to the private clients of Sanford C. Bernstein & Co. LLC by Bernstein registered representatives. Class 2 shares are only available to the Adviser’s institutional clients or through other limited arrangements. |
| †† | This share class is offered at net asset value (NAV) to eligible investors and its SEC returns are the same as the NAV returns. Please note that this share class is for investors purchasing shares through accounts established under certain fee-based programs sponsored and maintained by certain broker-dealers and financial intermediaries, institutional pension plans and/or investment advisory clients of, and certain other persons associated with, the Adviser and its affiliates or the Funds. The inception date for this share class is listed above. |
See Historical Performance disclosures on page 4.
(Historical Performance continued on next page)
| 6 | • ALLIANCEBERNSTEIN MUNICIPAL BOND INFLATION STRATEGY |
Historical Performance
HISTORICAL PERFORMANCE
(continued from previous page)
SEC AVERAGE ANNUAL RETURNS (WITH ANY APPLICABLE SALES CHARGES) AS OF THE MOST RECENT CALENDAR QUARTER-END (SEPTEMBER 30, 2011) | ||||
| SEC Returns | ||||
| Class 1 Shares† | ||||
1 Year | 4.83 | % | ||
Since Inception | 3.67 | % | ||
| Class 2 Shares† | ||||
1 Year | 4.88 | % | ||
Since Inception | 3.74 | % | ||
| Class A Shares | ||||
1 Year | 1.44 | % | ||
Since Inception | 1.61 | % | ||
| Class C Shares | ||||
1 Year | 2.88 | % | ||
Since Inception | 2.76 | % | ||
| Advisor Class Shares†† | ||||
1 Year | 4.97 | % | ||
Since Inception | 3.81 | % | ||
| * | Inception date: 1/26/10. |
| † | Class 1 shares are sold only to the private clients of Sanford C. Bernstein & Co. LLC by Bernstein registered representatives. Class 2 shares are only available to the Adviser’s institutional clients or through other limited arrangements. |
| †† | Please note that this share class is for investors purchasing shares through accounts established under certain fee-based programs sponsored and maintained by certain broker-dealers and financial intermediaries, institutional pension plans and/or investment advisory clients of, and certain other persons associated with, the Adviser and its affiliates or the Funds. The inception date for this share class is listed above. |
See Historical Performance disclosures on page 4.
| ALLIANCEBERNSTEIN MUNICIPAL BOND INFLATION STRATEGY • | 7 |
Historical Performance
FUND EXPENSES
(unaudited)
As a shareholder of a mutual fund, you may incur two types of costs: (1) transaction costs, including sales charges (loads) on purchase payments, contingent deferred sales charges on redemptions and (2) ongoing costs, including management fees; distribution (12b-1) fees; and other fund expenses. This example is intended to help you understand your ongoing costs (in dollars) of investing in the Fund and to compare these costs with the ongoing costs of investing in other mutual funds.
The Example is based on an investment of $1,000 invested at the beginning of the period and held for the entire period as indicated below.
Actual Expenses
The table below provides information about actual account values and actual expenses. You may use the information in this line, together with the amount you invested, to estimate the expenses that you paid over the period. Simply divide your account value by $1,000 (for example, an $8,600 account value divided by $1,000 = 8.6), then multiply the result by the number in the first line under the heading entitled “Expenses Paid During Period” to estimate the expenses you paid on your account during this period.
Hypothetical Example for Comparison Purposes
The table below provides information about hypothetical account values and hypothetical expenses based on the Fund’s actual expense ratio and an assumed annual rate of return of 5% before expenses, which is not the Fund’s actual return. The hypothetical account values and expenses may not be used to estimate the actual ending account balance or expenses you paid for the period. You may use this information to compare the ongoing costs of investing in the Fund and other funds by comparing this 5% hypothetical example with the 5% hypothetical examples that appear in the shareholder reports of other funds.
Please note that the expenses shown in the table are meant to highlight your ongoing costs only and do not reflect any transactional costs, such as sales charges (loads), or contingent deferred sales charges on redemptions. Therefore, the hypothetical example is useful in comparing ongoing costs only, and will not help you determine the relative total costs of owning different funds. In addition, if these transactional costs were included, your costs would have been higher.
| Beginning Account Value May 1, 2011 | Ending Account Value October 31, 2011 | Expenses Paid During Period* | Annualized Expense Ratio* | |||||||||||||
| Class A | ||||||||||||||||
Actual | $ | 1,000 | $ | 1,014.20 | $ | 4.06 | 0.80 | % | ||||||||
Hypothetical** | $ | 1,000 | $ | 1,021.17 | $ | 4.08 | 0.80 | % | ||||||||
| Class C | ||||||||||||||||
Actual | $ | 1,000 | $ | 1,010.90 | $ | 7.55 | 1.50 | % | ||||||||
Hypothetical** | $ | 1,000 | $ | 1,017.69 | $ | 7.58 | 1.50 | % | ||||||||
| Advisor Class | ||||||||||||||||
Actual | $ | 1,000 | $ | 1,015.70 | $ | 2.54 | 0.50 | % | ||||||||
Hypothetical** | $ | 1,000 | $ | 1,022.68 | $ | 2.55 | 0.50 | % | ||||||||
| Class 1 | ||||||||||||||||
Actual | $ | 1,000 | $ | 1,015.30 | $ | 3.05 | 0.60 | % | ||||||||
Hypothetical** | $ | 1,000 | $ | 1,022.18 | $ | 3.06 | 0.60 | % | ||||||||
| Class 2 | ||||||||||||||||
Actual | $ | 1,000 | $ | 1,015.70 | $ | 2.54 | 0.50 | % | ||||||||
Hypothetical** | $ | 1,000 | $ | 1,022.68 | $ | 2.55 | 0.50 | % | ||||||||
| * | Expenses are equal to the classes’ annualized expense ratios, multiplied by the average account value over the period, multiplied by 184/365 (to reflect the one-half year period). |
| ** | Assumes 5% return before expenses. |
| 8 | • ALLIANCEBERNSTEIN MUNICIPAL BOND INFLATION STRATEGY |
Fund Expenses
PORTFOLIO SUMMARY
October 31, 2011 (unaudited)
PORTFOLIO STATISTICS
Net Assets ($mil): $285.4
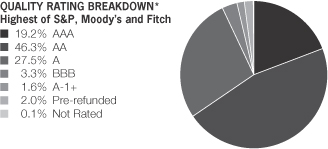
| * | All data are as of October 31, 2011. The Strategy’s quality rating breakdown is expressed as a percentage of the Strategy’s total investments in municipal securities and may vary over time. The Strategy also enters into derivative transactions, which may be used for hedging or investment purposes (see “Portfolio of Investments” section of the report for additional details). The quality ratings are determined by using the Standard & Poor’s Ratings Services (“S&P”), Moody’s Investors Services, Inc. (“Moody’s”) and Fitch Ratings, Ltd. (“Fitch”). A measure of the quality and safety of a bond or portfolio, based on the issuer’s financial condition. AAA is highest (best) and D is lowest (worst). If applicable, the pre-refunded category includes bonds which are secured by U.S. Government Securities and therefore have been deemed high-quality investment grade by the Adviser. If applicable, Not Applicable (N/A) includes non credit worthy investments; such as, equities, currency contracts, futures and options. If applicable, the Not Rated category includes bonds that are not rated by a Nationally Recognized Statistical Rating Organization. |
| ALLIANCEBERNSTEIN MUNICIPAL BOND INFLATION STRATEGY • | 9 |
Portfolio Summary
PORTFOLIO OF INVESTMENTS
October 31, 2011
| Principal Amount (000) | U.S. $ Value | |||||||
| ||||||||
MUNICIPAL OBLIGATIONS – 94.4% | ||||||||
Long-Term Municipal Bonds – 92.9% | ||||||||
Alabama – 0.4% | ||||||||
Alabama GO | $ | 1,040 | $ | 1,097,127 | ||||
|
| |||||||
Alaska – 1.4% | ||||||||
Alaska Ind Dev & Export Auth | 400 | 451,820 | ||||||
Valdez AK Marine Terminal | 3,140 | 3,510,237 | ||||||
|
| |||||||
| 3,962,057 | ||||||||
|
| |||||||
Arizona – 3.0% | ||||||||
Pima Cnty AZ Swr | 1,765 | 2,047,011 | ||||||
Pima Cnty AZ USD #1 GO | 2,825 | 3,016,959 | ||||||
Salt River Proj Agric Impt & Pwr Dist AZ | 3,140 | 3,647,016 | ||||||
|
| |||||||
| 8,710,986 | ||||||||
|
| |||||||
Arkansas – 0.5% | ||||||||
Arkansas GO | 1,500 | 1,542,030 | ||||||
|
| |||||||
California – 5.5% | ||||||||
California Dept Wtr Res Pwr | 1,225 | 1,306,022 | ||||||
Series 2011N | 7,125 | 7,596,247 | ||||||
California GO | 275 | 310,379 | ||||||
Series 2011A | 5,000 | 5,569,750 | ||||||
San Francisco City/Cnty CA Arpt Commn | 290 | 334,715 | ||||||
Series C | 450 | 512,919 | ||||||
|
| |||||||
| 15,630,032 | ||||||||
|
| |||||||
| 10 | • ALLIANCEBERNSTEIN MUNICIPAL BOND INFLATION STRATEGY |
Portfolio of Investments
| Principal Amount (000) | U.S. $ Value | |||||||
| ||||||||
Colorado – 2.1% | ||||||||
Denver CO City & Cnty Arpt | $ | 375 | $ | 414,263 | ||||
Series 2011B | 4,730 | 5,047,383 | ||||||
Denver CO Urban Renewal Auth | 200 | 213,884 | ||||||
Regional Trnsp Dist CO | 440 | 440,880 | ||||||
|
| |||||||
| 6,116,410 | ||||||||
|
| |||||||
Connecticut – 0.6% | ||||||||
Connecticut GO | 1,750 | 1,728,808 | ||||||
|
| |||||||
District of Columbia – 0.6% | ||||||||
Metro Washington Arpt Auth VA | 1,495 | 1,603,477 | ||||||
|
| |||||||
Florida – 9.8% | ||||||||
Citizens Ppty Ins Corp. FL | 315 | 338,543 | ||||||
Series 2011A-1 | 1,720 | 1,851,580 | ||||||
NPFGC Series A | 275 | 294,085 | ||||||
Florida Brd of Ed GO | 1,970 | 2,077,582 | ||||||
Florida Brd of Ed Lottery | 2,140 | 2,190,226 | ||||||
5.00%, 7/01/13 | 1,000 | 1,071,230 | ||||||
Series 2010 C | 550 | 627,017 | ||||||
Florida Hurricane Catastr Fd Fin Corp. | 665 | 703,257 | ||||||
Series 2010A | 700 | 763,658 | ||||||
| ALLIANCEBERNSTEIN MUNICIPAL BOND INFLATION STRATEGY • | 11 |
Portfolio of Investments
| Principal Amount (000) | U.S. $ Value | |||||||
| ||||||||
Florida Mun Pwr Agy | $ | 2,890 | $ | 3,219,576 | ||||
Florida Ports Fin Commn | 1,900 | 2,073,147 | ||||||
Florida St | 3,055 | 3,269,766 | ||||||
Greater Orlando Aviation FL | 420 | 447,749 | ||||||
Jacksonville FL Elec Auth | 3,900 | 4,221,672 | ||||||
Jacksonville FL Sales Tax | 1,720 | 1,900,738 | ||||||
Lee Cnty FL Port Auth Arpt | 1,000 | 1,053,060 | ||||||
Tampa FL Wtr & Swr Sys | 1,565 | 1,753,160 | ||||||
|
| |||||||
| 27,856,046 | ||||||||
|
| |||||||
Georgia – 4.8% | ||||||||
Atlanta GA Arpt PFC | 2,500 | 2,830,325 | ||||||
Catoosa Cnty GA SD GO | 2,380 | 2,484,482 | ||||||
4.00%, 8/01/14 | 4,470 | 4,872,792 | ||||||
Georgia Mun Elec Auth | 3,045 | 3,458,998 | ||||||
|
| |||||||
| 13,646,597 | ||||||||
|
| |||||||
Hawaii – 0.4% | ||||||||
Honolulu HI City & Cnty GO | 1,035 | 1,180,552 | ||||||
|
| |||||||
Illinois – 6.0% | ||||||||
Chicago IL Brd of Ed GO | 1,690 | 1,890,417 | ||||||
| 12 | • ALLIANCEBERNSTEIN MUNICIPAL BOND INFLATION STRATEGY |
Portfolio of Investments
| Principal Amount (000) | U.S. $ Value | |||||||
| ||||||||
Chicago IL GO | $ | 1,165 | $ | 1,256,289 | ||||
Series 2010A | 1,975 | 2,078,924 | ||||||
Chicago IL O’Hare Intl Arpt | 1,930 | 2,064,579 | ||||||
Chicago IL Transit Auth Fed Hwy Grant | 2,425 | 2,674,581 | ||||||
Cook Cnty IL GO | 2,200 | 2,319,284 | ||||||
Illinois Finance Auth | 160 | 160,310 | ||||||
Illinois GO | 500 | 554,370 | ||||||
Illinois Sales Tax | 1,450 | 1,663,368 | ||||||
Springfield ILL Metro San Dist | 2,170 | 2,373,286 | ||||||
|
| |||||||
| 17,035,408 | ||||||||
|
| |||||||
Indiana – 2.8% | ||||||||
Indiana Mun Pwr Agy | 4,965 | 5,580,375 | ||||||
Indianapolis IN Loc Bond Bank | 2,260 | 2,416,030 | ||||||
|
| |||||||
| 7,996,405 | ||||||||
|
| |||||||
Kansas – 0.0% | ||||||||
Wyandotte Cnty/Kansas City KS Uni Govt | 180 | 108,355 | ||||||
|
| |||||||
Louisiana – 0.3% | ||||||||
Orleans Parish LA Par SD GO | 910 | 961,015 | ||||||
|
| |||||||
| ALLIANCEBERNSTEIN MUNICIPAL BOND INFLATION STRATEGY • | 13 |
Portfolio of Investments
| Principal Amount (000) | U.S. $ Value | |||||||
| ||||||||
Massachusetts – 5.2% | ||||||||
Massachusetts GO | $ | 1,000 | $ | 1,017,190 | ||||
AGM Series 2006C | 5,400 | 5,200,902 | ||||||
Massachusetts Spl Obl | 3,000 | 2,993,250 | ||||||
Metropolitan Boston Trnsp Pkg Corp. MA | 5,025 | 5,543,553 | ||||||
|
| |||||||
| 14,754,895 | ||||||||
|
| |||||||
Minnesota – 0.8% | ||||||||
Minnesota Hgr Ed Fac Auth | 1,295 | 1,444,288 | ||||||
Minnesota Pub Fac Auth | 750 | 795,532 | ||||||
|
| |||||||
| 2,239,820 | ||||||||
|
| |||||||
Missouri – 2.2% | ||||||||
Bi-State Dev Agy MO | 5,900 | 6,176,533 | ||||||
|
| |||||||
Nevada – 0.5% | ||||||||
Clark Cnty NV Arpt | 775 | 849,763 | ||||||
Clark Cnty NV SD GO | 450 | 495,900 | ||||||
|
| |||||||
| 1,345,663 | ||||||||
|
| |||||||
New Jersey – 1.5% | ||||||||
New Jersey EDA | 480 | 545,328 | ||||||
Tobacco Settlement Fin Corp. NJ | 3,440 | 3,780,319 | ||||||
|
| |||||||
| 4,325,647 | ||||||||
|
| |||||||
| 14 | • ALLIANCEBERNSTEIN MUNICIPAL BOND INFLATION STRATEGY |
Portfolio of Investments
| Principal Amount (000) | U.S. $ Value | |||||||
| ||||||||
New York – 12.4% | ||||||||
Long Island Pwr Auth NY | $ | 3,500 | $ | 3,482,780 | ||||
New York NY GO | 1,700 | 1,721,743 | ||||||
New York NY Mun Wtr Fin Auth | 500 | 506,550 | ||||||
5.00%, 6/15/26 | 3,875 | 4,362,863 | ||||||
New York St Dormitory Auth | 6,800 | 7,135,172 | ||||||
Series 2011C | 3,000 | 3,397,590 | ||||||
Series 2011E | 2,790 | 3,107,781 | ||||||
New York St Envrn Fac Corp. | 3,000 | 3,406,620 | ||||||
New York St Loc Govt Asst Corp. | 1,475 | 1,368,928 | ||||||
New York St Thruway Auth | 6,720 | 7,051,296 | ||||||
|
| |||||||
| 35,541,323 | ||||||||
|
| |||||||
Ohio – 0.5% | ||||||||
Cleveland OH COP | 700 | 771,449 | ||||||
Toledo OH City Svcs Spl Assmt Notes | 725 | 740,087 | ||||||
|
| |||||||
| 1,511,536 | ||||||||
|
| |||||||
Oregon – 1.8% | ||||||||
Tri-Cnty Met Trnsp Dist OR Grant Prog | 4,605 | 5,061,678 | ||||||
|
| |||||||
Pennsylvania – 5.0% | ||||||||
Allegheny Cnty PA Sani Auth | 2,250 | 2,551,320 | ||||||
Montgomery Cnty PA IDA | 475 | 538,090 | ||||||
| ALLIANCEBERNSTEIN MUNICIPAL BOND INFLATION STRATEGY • | 15 |
Portfolio of Investments
| Principal Amount (000) | U.S. $ Value | |||||||
| ||||||||
Pennsylvania GO | $ | 5,290 | $ | 5,854,390 | ||||
Series 2006 | 700 | 742,399 | ||||||
Philadelphia PA Gas Works | 1,900 | 2,068,131 | ||||||
Philadelphia PA SD GO | 1,800 | 1,961,658 | ||||||
Philadelphia PA Wtr & WstWtr | 550 | 624,739 | ||||||
|
| |||||||
| 14,340,727 | ||||||||
|
| |||||||
Puerto Rico – 3.4% | ||||||||
Puerto Rico Elec Pwr Auth | 2,000 | 2,099,280 | ||||||
Series 2010AAA | 1,830 | 1,977,864 | ||||||
Puerto Rico GO | 2,970 | 3,174,158 | ||||||
Puerto Rico Govt Dev Bank | 1,000 | 1,052,500 | ||||||
Puerto Rico Hwy & Trnsp Auth | 1,500 | 1,088,475 | ||||||
Puerto Rico Pub Bldgs Auth | 275 | 300,149 | ||||||
|
| |||||||
| 9,692,426 | ||||||||
|
| |||||||
Texas – 12.5% | ||||||||
Conroe TX ISD GO | 6,240 | 7,081,513 | ||||||
Garland TX GO | 500 | 561,915 | ||||||
Harris Cnty TX GO | 400 | 447,204 | ||||||
Houston TX Arpt Sys | 2,105 | 2,275,800 | ||||||
| 16 | • ALLIANCEBERNSTEIN MUNICIPAL BOND INFLATION STRATEGY |
Portfolio of Investments
| Principal Amount (000) | U.S. $ Value | |||||||
| ||||||||
Houston TX Util Sys | $ | 2,225 | $ | 2,423,982 | ||||
Series 2011E | 6,900 | 7,726,965 | ||||||
Katy TX ISD GO | 700 | 731,668 | ||||||
Lower Colorado River Auth TX | 2,615 | 2,910,338 | ||||||
Midlothian TX ISD GO | 5,000 | 5,166,000 | ||||||
San Antonio TX ISD GO | 1,710 | 1,951,024 | ||||||
Texas GO | 2,230 | 2,421,066 | ||||||
Texas Trnsp Comm | 655 | 658,694 | ||||||
Univ of Texas | 1,070 | 1,253,259 | ||||||
|
| |||||||
| 35,609,428 | ||||||||
|
| |||||||
Virginia – 5.2% | ||||||||
Fairfax Cnty VA Econ Dev Dist | 6,000 | 6,742,140 | ||||||
Virginia Lease Pub Fac | 3,525 | 3,804,004 | ||||||
Virginia Pub Bldg Auth | 4,050 | 4,290,043 | ||||||
|
| |||||||
| 14,836,187 | ||||||||
|
| |||||||
Washington – 3.4% | ||||||||
Chelan Cnty WA PUD #1 | 3,305 | 3,687,620 | ||||||
Energy Northwest WA | 680 | 806,147 | ||||||
Series 2012A | 1,250 | 1,313,900 | ||||||
| ALLIANCEBERNSTEIN MUNICIPAL BOND INFLATION STRATEGY • | 17 |
Portfolio of Investments
| Principal Amount (000) | U.S. $ Value | |||||||
| ||||||||
King Cnty WA Swr | $ | 2,230 | $ | 2,429,250 | ||||
Seattle WA GO | 700 | 719,565 | ||||||
Washington St GO | 710 | 830,565 | ||||||
|
| |||||||
| 9,787,047 | ||||||||
|
| |||||||
Wisconsin – 0.3% | ||||||||
Badger Tob Asset Sec Corp. WI | 700 | 724,444 | ||||||
|
| |||||||
Total Long-Term Municipal Bonds | 265,122,659 | |||||||
|
| |||||||
Short-Term Municipal Notes – 1.5% | ||||||||
Colorado – 0.9% | ||||||||
Colorado Edl & Cultural Facs Auth | 1,100 | 1,100,000 | ||||||
Series D | 1,340 | 1,340,000 | ||||||
|
| |||||||
| 2,440,000 | ||||||||
|
| |||||||
Louisiana – 0.3% | ||||||||
Louisiana Pub Fac Auth | 950 | 950,000 | ||||||
|
| |||||||
Washington – 0.3% | ||||||||
Washington St HFC | 1,000 | 1,000,000 | ||||||
|
| |||||||
Total Short-Term Municipal Notes | 4,390,000 | |||||||
|
| |||||||
Total Municipal Obligations | 269,512,659 | |||||||
|
| |||||||
AGENCIES – 2.2% | ||||||||
Federal Home Loan Bank | 5,315 | 6,310,223 | ||||||
|
| |||||||
| 18 | • ALLIANCEBERNSTEIN MUNICIPAL BOND INFLATION STRATEGY |
Portfolio of Investments
| Shares | U.S. $ Value | |||||||
| ||||||||
SHORT-TERM INVESTMENTS – 2.3% | ||||||||
Investment Companies – 2.0% | ||||||||
AllianceBernstein Fixed-Income Shares, Inc. – | 5,807,154 | $ | 5,807,154 | |||||
|
| |||||||
| Principal Amount (000) | ||||||||
U.S. Treasury Bill – 0.3% | ||||||||
U.S. Treasury Bill | $ | 730 | 729,976 | |||||
|
| |||||||
Total Short-Term Investments | 6,537,130 | |||||||
|
| |||||||
Total Investments – 98.9% | 282,360,012 | |||||||
Other assets less liabilities – 1.1% | 3,050,440 | |||||||
|
| |||||||
Net Assets – 100.0% | $ | 285,410,452 | ||||||
|
| |||||||
INTEREST RATE SWAP TRANSACTIONS (see Note D)
| Rate Type | ||||||||||||||||||||
| Swap Counterparty | Notional Amount (000) | Termination Date | Payments made by the Portfolio | Payments received by the Portfolio | Unrealized Appreciation/ (Depreciation) | |||||||||||||||
Barclays Bank PLC | $ | 10,000 | 9/28/12 | 1.09 | % | CPI | # | $ | 324,851 | |||||||||||
Barclays Bank PLC | 7,000 | 3/16/13 | 1.795 | % | CPI | # | 80,456 | |||||||||||||
Barclays Bank PLC | 2,000 | 4/8/15 | 2.22 | % | CPI | # | (10,015 | ) | ||||||||||||
Barclays Bank PLC | 5,500 | 6/1/15 | 2.038 | % | CPI | # | 35,231 | |||||||||||||
Barclays Bank PLC | 6,000 | 2/26/17 | 2.37 | % | CPI | # | (61,267 | ) | ||||||||||||
Barclays Bank PLC | 3,000 | 7/19/17 | 2.038 | % | CPI | # | 61,130 | |||||||||||||
Barclays Bank PLC | 5,500 | 6/2/19 | 2.58 | % | CPI | # | (106,528 | ) | ||||||||||||
Barclays Bank PLC | 4,000 | 6/15/20 | 2.48 | % | CPI | # | (20,461 | ) | ||||||||||||
Barclays Bank PLC | 1,500 | 8/4/20 | 2.038 | % | CPI | # | 22,904 | |||||||||||||
Barclays Bank PLC | 2,000 | 11/10/20 | 2.50 | % | CPI | # | 3,756 | |||||||||||||
Barclays Bank PLC | 6,000 | 5/4/21 | 2.845 | % | CPI | # | (216,837 | ) | ||||||||||||
Barclays Bank PLC | 3,000 | 5/12/21 | 2.815 | % | CPI | # | (103,519 | ) | ||||||||||||
Citibank, N.A. | 2,000 | 4/15/14 | 2.06 | % | CPI | # | 4,264 | |||||||||||||
Citibank, N.A. | 10,000 | 5/4/16 | 2.71 | % | CPI | # | (255,612 | ) | ||||||||||||
Deutsche Bank AG | 16,300 | 6/30/14 | 1.998 | % | CPI | # | (61,177 | ) | ||||||||||||
Deutsche Bank AG | 14,200 | 7/21/14 | 2.155 | % | CPI | # | (139,094 | ) | ||||||||||||
Deutsche Bank AG | 11,000 | 6/20/21 | 2.655 | % | CPI | # | (271,018) | |||||||||||||
Deutsche Bank AG | 9,800 | 9/7/21 | 2.4 | % | CPI | # | 28,055 | |||||||||||||
JPMorgan Chase Bank, N.A. | 1,000 | 7/29/20 | 2.305 | % | CPI | # | 14,976 | |||||||||||||
| ALLIANCEBERNSTEIN MUNICIPAL BOND INFLATION STRATEGY • | 19 |
Portfolio of Investments
| Rate Type | ||||||||||||||||||||
| Swap Counterparty | Notional Amount (000) | Termination Date | Payments made by the | Payments received by the | Unrealized Appreciation/ (Depreciation) | |||||||||||||||
JPMorgan Chase Bank, N.A. | $ | 1,400 | 6/30/26 | 2.89 | % | CPI | # | $ | (75,845 | ) | ||||||||||
JPMorgan Chase Bank, N.A. | 3,300 | 7/21/26 | 2.935 | % | CPI | # | (204,581 | ) | ||||||||||||
JPMorgan Chase Bank, N.A. | 2,400 | 10/3/26 | 2.485 | % | CPI | # | 10,337 | |||||||||||||
Morgan Stanley Capital Services Inc. | 7,000 | 6/25/12 | 0.99 | % | CPI | # | 213,159 | |||||||||||||
Morgan Stanley Capital Services Inc. | 1,000 | 5/6/13 | 1.95 | % | CPI | # | 8,458 | |||||||||||||
Morgan Stanley Capital Services LLC | 9,000 | 10/27/13 | 1.61 | % | CPI | # | 218,226 | |||||||||||||
Morgan Stanley Capital Services LLC | 22,000 | 10/3/14 | 1.53 | % | CPI | # | 230,741 | |||||||||||||
Morgan Stanley Capital Services LLC | 6,000 | 4/5/16 | 2.535 | % | CPI | # | (88,738 | ) | ||||||||||||
Morgan Stanley Capital Services LLC | 2,000 | 10/14/20 | 2.37 | % | CPI | # | 27,149 | |||||||||||||
Morgan Stanley Capital Services LLC | 13,000 | 5/23/21 | 2.68 | % | CPI | # | (318,162 | ) | ||||||||||||
Morgan Stanley Capital Services LLC | 5,000 | 8/15/26 | 2.885 | % | CPI | # | (271,474 | ) | ||||||||||||
|
| |||||||||||||||||||
| $ | (920,635 | ) | ||||||||||||||||||
|
| |||||||||||||||||||
| † | An amount of $1,231,316 has been segregated to collateralize open interest rate swap agreements for the Municipal Bond Inflation Strategy Fund. |
| # | Variable interest rate based on the rate of inflation as determined by the Consumer Price Index (CPI). |
| (a) | Variable rate coupon, rate shown as of October 31, 2011. |
| (b) | Illiquid security. |
| (c) | When-Issued or delayed delivery security. |
| (d) | Variable Rate Demand Notes are instruments whose interest rates change on a specific date (such as coupon date or interest payment date) or whose interest rates vary with changes in a designated base rate (such as the prime interest rate). This instrument is payable on demand and is secured by letters of credit or other credit support agreements from major banks. |
| (e) | Investment in affiliated money market mutual fund. The rate shown represents the 7-day yield as of period end. |
As of October 31, 2011, the Strategy held 12.7% of net assets in insured bonds (of this amount 2.8% represents the Strategy’s holding in pre-refunded or escrowed to maturity bonds).
| 20 | • ALLIANCEBERNSTEIN MUNICIPAL BOND INFLATION STRATEGY |
Portfolio of Investments
Glossary:
AGM – Assured Guaranty Municipal
AMBAC – Ambac Assurance Corporation
COP – Certificate of Participation
EDA – Economic Development Agency
ETM – Escrowed to Maturity
GO – General Obligation
HFC – Housing Finance Corporation
IDA – Industrial Development Authority/Agency
ISD – Independent School District
NPFGC – National Public Finance Guarantee Corporation
NPFGC-RE – National Public Finance Guarantee Corporation Reinsuring FGIC
PFC – Passenger Facility Charge
PUD – Public Utility District
SD – School District
USD – Unified School District
See notes to financial statements.
| ALLIANCEBERNSTEIN MUNICIPAL BOND INFLATION STRATEGY • | 21 |
Portfolio of Investments
STATEMENT OF ASSETS & LIABILITIES
October 31, 2011
| Assets | ||||
Investments in securities, at value | ||||
Unaffiliated issuers (cost $273,151,903) | $ | 276,552,858 | ||
Affiliated issuers (cost $5,807,154) | 5,807,154 | |||
Receivable for capital stock sold | 2,963,989 | |||
Interest and dividends receivable | 2,705,625 | |||
Unrealized appreciation on interest rate swap contracts | 1,283,693 | |||
Receivable for investment securities sold | 234,795 | |||
Receivable due from Adviser | 49,185 | |||
|
| |||
Total assets | 289,597,299 | |||
|
| |||
| Liabilities | ||||
Unrealized depreciation on interest rate swap contracts | 2,204,328 | |||
Payable for investment securities purchased | 1,305,288 | |||
Payable for capital stock redeemed | 524,709 | |||
Distribution fee payable | 42,602 | |||
Transfer Agent fee payable | 2,633 | |||
Accrued expenses | 107,287 | |||
|
| |||
Total liabilities | 4,186,847 | |||
|
| |||
Net Assets | $ | 285,410,452 | ||
|
| |||
| Composition of Net Assets | ||||
Capital stock, at par | $ | 27,691 | ||
Additional paid-in capital | 282,230,879 | |||
Undistributed net investment income | 114,377 | |||
Accumulated net realized gain on investment transactions | 557,185 | |||
Net unrealized appreciation on investments | 2,480,320 | |||
|
| |||
| $ | 285,410,452 | |||
|
|
Net Asset Value Per Share—24 billion shares of capital stock authorized, $.001 par value
| Class | Net Assets | Shares Outstanding | Net Asset Value | |||||||||
| A | $ | 64,342,043 | 6,237,642 | $ | 10.32 | * | ||||||
| ||||||||||||
| C | $ | 23,918,825 | 2,323,343 | $ | 10.30 | |||||||
| ||||||||||||
| Advisor | $ | 41,923,863 | 4,062,280 | $ | 10.32 | |||||||
| ||||||||||||
| 1 | $ | 111,857,123 | 10,859,740 | $ | 10.30 | |||||||
| ||||||||||||
| 2 | $ | 43,368,598 | 4,208,409 | $ | 10.31 | |||||||
| ||||||||||||
| * | The maximum offering price per share for Class A shares was $10.64 which reflects a sales charge of 3.0%. |
See notes to financial statements.
| 22 | • ALLIANCEBERNSTEIN MUNICIPAL BOND INFLATION STRATEGY |
Statement of Assets & Liabilities
STATEMENT OF OPERATIONS
Year Ended October 31, 2011
| Investment Income | ||||||||
Interest | $ | 3,451,679 | ||||||
Dividends—Affiliated issuers | 1,988 | $ | 3,453,667 | |||||
|
| |||||||
| Expenses | ||||||||
Advisory fee (see Note B) | 743,259 | |||||||
Distribution fee—Class A | 139,832 | |||||||
Distribution fee—Class C | 163,331 | |||||||
Distribution fee—Class 1 | 44,161 | |||||||
Transfer agency—Class A | 10,124 | |||||||
Transfer agency—Class C | 4,169 | |||||||
Transfer agency—Advisor Class | 5,262 | |||||||
Transfer agency—Class 1 | 9,812 | |||||||
Transfer agency—Class 2 | 3,583 | |||||||
Registration fees | 147,336 | |||||||
Custodian | 106,334 | |||||||
Administrative | 75,639 | |||||||
Audit | 44,262 | |||||||
Printing | 40,716 | |||||||
Amortization of offering expenses | 40,437 | |||||||
Legal | 39,812 | |||||||
Directors’ fees | 10,335 | |||||||
Miscellaneous | 6,680 | |||||||
|
| |||||||
Total expenses | 1,635,084 | |||||||
Less: expenses waived and reimbursed by the Adviser (see Note B) | (544,501 | ) | ||||||
|
| |||||||
Net expenses | 1,090,583 | |||||||
|
| |||||||
Net investment income | 2,363,084 | |||||||
|
| |||||||
| Realized and Unrealized Gain (Loss) on Investment Transactions | ||||||||
Net realized gain on investment transactions | 563,350 | |||||||
Net change in unrealized appreciation/ | ||||||||
Investments | 2,625,742 | |||||||
Swap contracts | (368,906 | ) | ||||||
|
| |||||||
Net gain on investment transactions | 2,820,186 | |||||||
|
| |||||||
Net Increase in Net Assets from | $ | 5,183,270 | ||||||
|
|
See notes to financial statements.
| ALLIANCEBERNSTEIN MUNICIPAL BOND INFLATION STRATEGY • | 23 |
Statement of Operations
STATEMENT OF CHANGES IN NET ASSETS
| Year Ended October 31, 2011 | January 26, 2010(a) to October, 31 2010 | |||||||
| Increase in Net Assets from Operations | ||||||||
Net investment income | $ | 2,363,084 | $ | 340,455 | ||||
Net realized gain on investment transactions | 563,350 | 122,813 | ||||||
Net change in unrealized | 2,256,836 | 223,484 | ||||||
|
|
|
| |||||
Net increase in net assets from operations | 5,183,270 | 686,752 | ||||||
| Dividends and Distributions to Shareholders from | ||||||||
Net investment income | ||||||||
Class A | (739,996 | ) | (143,027 | ) | ||||
Class C | (157,851 | ) | (32,940 | ) | ||||
Advisor Class | (459,343 | ) | (36,724 | ) | ||||
Class 1 | (657,636 | ) | (97 | ) | ||||
Class 2 | (282,095 | ) | (103,484 | ) | ||||
Net realized gain on investment transactions | ||||||||
Class A | (60,961 | ) | – 0 | – | ||||
Class C | (23,413 | ) | – 0 | – | ||||
Advisor Class | (24,872 | ) | – 0 | – | ||||
Class 1 | (18 | ) | – 0 | – | ||||
Class 2 | (10,009 | ) | – 0 | – | ||||
| Capital Stock Transactions | ||||||||
Net increase | 220,275,764 | 61,997,132 | ||||||
|
|
|
| |||||
Total increase | 223,042,840 | 62,367,612 | ||||||
| Net Assets | ||||||||
Beginning of period | 62,367,612 | – 0 | – | |||||
|
|
|
| |||||
End of period (including undistributed net investment income of $114,377 and $75,828, respectively) | $ | 285,410,452 | $ | 62,367,612 | ||||
|
|
|
| |||||
| (a) | Commencement of operations. |
See notes to financial statements.
| 24 | • ALLIANCEBERNSTEIN MUNICIPAL BOND INFLATION STRATEGY |
Statement of Changes in Net Assets
NOTES TO FINANCIAL STATEMENTS
October 31, 2011
NOTE A
Significant Accounting Policies
AllianceBernstein Bond Fund, Inc. (the “Fund”) is registered under the Investment Company Act of 1940 as a diversified, open-end management investment company. The Fund, which is a Maryland corporation, operates as a series company currently comprised of four portfolios: the Intermediate Bond Portfolio, the Bond Inflation Strategy Portfolio, the Municipal Bond Inflation Strategy Portfolio and the Real Asset Strategy Portfolio. The Municipal Bond Inflation Strategy Portfolio commenced operations on January 26, 2010. This report relates only to the Municipal Bond Inflation Strategy Portfolio. The Municipal Bond Inflation Strategy Portfolio (the “Strategy”) offers Class A, Class C, Advisor Class, Class 1, and Class 2 shares. Class 1 shares are sold only to the private clients of Sanford C. Bernstein & Co. LLC by its registered representatives. Class R, Class K and Class I shares have been authorized by the Strategy but are not currently being offered. Class A shares are sold with a front-end sales charge of up to 3.0% for purchases not exceeding $500,000. With respect to purchases of $500,000 or more, Class A shares redeemed within one year of purchase may be subject to a contingent deferred sales charge of 1%. Class C shares are subject to a contingent deferred sales charge of 1% on redemptions made within the first year after purchase. Class R, Class K, and Class 1 shares are sold without an initial or contingent deferred sales charge. Advisor Class, Class I, and Class 2 shares are sold without an initial or contingent deferred sales charge and are not subject to ongoing distribution expenses. All eight classes of shares have identical voting, dividend, liquidation and other rights, except that the classes bear different distribution and transfer agency expenses. Each class has exclusive voting rights with respect to its distribution plan. The financial statements have been prepared in conformity with U.S. generally accepted accounting principles (“U.S. GAAP”) which require management to make certain estimates and assumptions that affect the reported amounts of assets and liabilities in the financial statements and amounts of income and expenses during the reporting period. Actual results could differ from those estimates. The following is a summary of significant accounting policies followed by the Strategy.
1. Security Valuation
Portfolio securities are valued at their current market value determined on the basis of market quotations or, if market quotations are not readily available or are deemed unreliable, at “fair value” as determined in accordance with procedures established by and under the general supervision of the Fund’s Board of Directors.
In general, the market value of securities which are readily available and deemed reliable are determined as follows: Securities listed on a national securities exchange (other than securities listed on the NASDAQ Stock Market, Inc. (“NASDAQ”)) or on a foreign securities exchange are valued at the last sale price at the close of the exchange or foreign securities exchange. If there has
| ALLIANCEBERNSTEIN MUNICIPAL BOND INFLATION STRATEGY • | 25 |
Notes to Financial Statements
been no sale on such day, the securities are valued at the mean of the closing bid and ask prices on such day. Securities listed on more than one exchange are valued by reference to the principal exchange on which the securities are traded; securities listed only on NASDAQ are valued in accordance with the NASDAQ Official Closing Price; listed or over the counter market (“OTC”) put or call options are valued at the mid level between the current bid and ask prices. If either a current bid or current ask price is unavailable, AllianceBernstein L.P. (the “Adviser”) will have discretion to determine the best valuation (e.g. last trade price); open futures contracts and options thereon are valued using the closing settlement price or, in the absence of such a price, the most recent quoted bid price. If there are no quotations available for the day of valuation, the last available closing settlement price is used; U.S. government securities and other debt instruments having 60 days or less remaining until maturity are valued at amortized cost if their original maturity was 60 days or less; or by amortizing their fair value as of the 61st day prior to maturity if their original term to maturity exceeded 60 days; fixed-income securities, including mortgage backed and asset backed securities, may be valued on the basis of prices provided by a pricing service or at a price obtained from one or more of the major broker/dealers. In cases where broker/dealer quotes are obtained, the Adviser may establish procedures whereby changes in market yields or spreads are used to adjust, on a daily basis, a recently obtained quoted price on a security; and swaps and other derivatives are valued daily, primarily using independent pricing services, independent pricing models using market inputs, as well as third party broker-dealers or counterparties, which are approved by the Board of Directors. Investments in money market funds are valued at their net asset value each day.
Securities for which market quotations are not readily available (including restricted securities) or are deemed unreliable are valued at fair value. Factors considered in making this determination may include, but are not limited to, information obtained by contacting the issuer, analysts, analysis of the issuer’s financial statements or other available documents. In addition, the Strategy may use fair value pricing for securities primarily traded in non-U.S. markets because most foreign markets close well before the Strategy values its securities at 4:00 p.m., Eastern Time. The earlier close of these foreign markets gives rise to the possibility that significant events, including broad market moves, may have occurred in the interim and may materially affect the value of those securities.
2. Fair Value Measurements
In accordance with U.S. GAAP regarding fair value measurements, fair value is defined as the price that the Strategy would receive to sell an asset or pay to transfer a liability in an orderly transaction between market participants at the measurement date. The U.S. GAAP disclosure requirements establish a framework for measuring fair value, and a three-level hierarchy for fair value measurements based upon the transparency of inputs to the valuation of an asset or liability. Inputs may be observable or unobservable and refer broadly to the
| 26 | • ALLIANCEBERNSTEIN MUNICIPAL BOND INFLATION STRATEGY |
Notes to Financial Statements
assumptions that market participants would use in pricing the asset or liability. Observable inputs reflect the assumptions market participants would use in pricing the asset or liability based on market data obtained from sources independent of the Strategy. Unobservable inputs reflect the Strategy’s own assumptions about the assumptions that market participants would use in pricing the asset or liability based on the best information available in the circumstances. Each investment is assigned a level based upon the observability of the inputs which are significant to the overall valuation. The three-tier hierarchy of inputs is summarized below.
| • | Level 1—quoted prices in active markets for identical investments |
| • | Level 2—other significant observable inputs (including quoted prices for similar investments, interest rates, prepayment speeds, credit risk, etc.) |
| • | Level 3—significant unobservable inputs (including the Strategy’s own assumptions in determining the fair value of investments) |
The following table summarizes the valuation of the Strategy’s investments by the above fair value hierarchy levels as of October 31, 2011:
Investments in Securities: | Level 1 | Level 2 | Level 3 | Total | ||||||||||||
Assets: | ||||||||||||||||
Long-Term Municipal Bonds | $ | – 0 | – | $ | 264,853,994 | $ | 268,665 | $ | 265,122,659 | |||||||
Short-Term Municipal Notes | – 0 | – | 4,390,000 | – 0 | – | 4,390,000 | ||||||||||
Agencies | – 0 | – | 6,310,223 | – 0 | – | 6,310,223 | ||||||||||
Short-Term Investments | ||||||||||||||||
Investment Companies | 5,807,154 | – 0 | – | – 0 | – | 5,807,154 | ||||||||||
U.S. Treasury Bill | – 0 | – | 729,976 | – 0 | – | 729,976 | ||||||||||
|
|
|
|
|
|
|
| |||||||||
Total Investments in Securities | 5,807,154 | 276,284,193 | 268,665 | 282,360,012 | ||||||||||||
Other Financial Instruments*: | ||||||||||||||||
Assets: | ||||||||||||||||
Interest Rate Swap Contracts | – 0 | – | 1,283,693 | – 0 | – | 1,283,693 | ||||||||||
Liabilities: | ||||||||||||||||
Interest Rate Swap Contracts | – 0 | – | (2,204,328 | ) | – 0 | – | (2,204,328 | ) | ||||||||
|
|
|
|
|
|
|
| |||||||||
Total | $ | 5,807,154 | $ | 275,363,558 | $ | 268,665 | $ | 281,439,377 | ||||||||
|
|
|
|
|
|
|
| |||||||||
| * | Other financial instruments are derivative instruments, such as futures, forwards and swap contracts, which are valued at the unrealized appreciation/depreciation on the instrument. |
Following is a reconciliation of investments in which significant unobservable inputs (Level 3) were used in determining fair value. The transfers between levels of the fair value hierarchy assumes the financial instrument was transferred at the beginning of the reporting period.
| ALLIANCEBERNSTEIN MUNICIPAL BOND INFLATION STRATEGY • | 27 |
Notes to Financial Statements
| Long-Term Municipal Bonds | Total | |||||||
Balance as of 10/31/10 | $ | – 0 | – | $ | – 0 | – | ||
Accrued discounts/(premiums) | 6,204 | 6,204 | ||||||
Realized gain (loss) | – 0 | – | – 0 | – | ||||
Change in unrealized appreciation/depreciation | 5,206 | 5,206 | ||||||
Purchases | 157,000 | 157,000 | ||||||
Sales | – 0 | – | – 0 | – | ||||
Transfers in to Level 3 | 100,255 | 100,255 | ||||||
Transfers out of Level 3 | – 0 | – | – 0 | – | ||||
|
|
|
| |||||
Balance as of 10/31/11 | $ | 268,665 | $ | 268,665 | ||||
|
|
|
| |||||
Net change in unrealized appreciation/depreciation from Investments held as of 10/31/11* | $ | 5,206 | $ | 5,206 | ||||
|
|
|
| |||||
| * | The unrealized appreciation/depreciation is included in net change in unrealized appreciation/depreciation of investments in the accompanying statement of operations. |
3. Taxes
It is the Strategy’s policy to meet the requirements of the Internal Revenue Code applicable to regulated investment companies and to distribute all of its investment company taxable income and net realized gains, if any, to shareholders. Therefore, no provisions for federal income or excise taxes are required.
In accordance with U.S. GAAP requirements regarding accounting for uncertainties in income taxes, management has analyzed the Strategy’s tax positions taken or expected to be taken on federal and state income tax returns for all open tax years (all years since inception of the Strategy) and has concluded that no provision for income tax is required in the Strategy’s financial statements.
4. Investment Income and Investment Transactions
Dividend income is recorded on the ex-dividend date or as soon as the Strategy is informed of the dividend. Interest income is accrued daily. Investment transactions are accounted for on the date the securities are purchased or sold. Investment gains or losses are determined on the identified cost basis. The Strategy amortizes premiums and accretes original issue discounts and market discounts as adjustments to interest income.
5. Class Allocations
All income earned and expenses incurred by the Strategy are borne on a pro-rata basis by each outstanding class of shares, based on the proportionate interest in the Strategy represented by the net assets of such class, except for class specific expenses which are allocated to the respective class. Expenses of the Fund are charged to each Strategy in proportion to net assets. Realized and unrealized gains and losses are allocated among the various share classes based on respective net assets.
6. Dividends and Distributions
Dividends and distributions to shareholders, if any, are recorded on the ex-dividend date. Income dividends and capital gains distributions are
| 28 | • ALLIANCEBERNSTEIN MUNICIPAL BOND INFLATION STRATEGY |
Notes to Financial Statements
determined in accordance with federal tax regulations and may differ from those determined in accordance with U.S. GAAP. To the extent these differences are permanent, such amounts are reclassified within the capital accounts based on their federal tax basis treatment; temporary differences do not require such reclassification.
7. Offering Expenses
Offering expenses of $169,985 had been deferred and were amortized on a straight line basis over a one year period starting from January 26, 2010 (commencement of operations).
NOTE B
Advisory Fee and Other Transactions with Affiliates
Under the terms of the investment advisory agreement, the Strategy pays the Adviser an advisory fee at an annual rate of .50% of the first $2.5 billion, .45% of the next $2.5 billion and .40% in excess of $5 billion, of the Strategy’s average daily net assets. The fee is accrued daily and paid monthly. Effective January 26, 2010, the Adviser has agreed to waive its fees and bear certain expenses to the extent necessary to limit total operating expenses on an annual basis to .80%, 1.50%, .50%, .60% and .50% of the daily average net assets for the Class A, Class C, Advisor Class, Class 1 and Class 2 shares, respectively. Under the agreement, fees waived and expenses borne by the Adviser are subject to repayment by the Strategy until January 26, 2013. No repayment will be made that would cause the Strategy’s total annualized operating expenses to exceed the net fee percentage set forth above on or before January 26, 2013, or would have exceeded the amount of offering expenses as recorded by the Strategy before January 26, 2011. This fee waiver and/or expense reimbursement agreement may not be terminated before October 31, 2011, after which it may be terminated by either party. For the year ended October 31, 2011, such reimbursement amounted to $468,862, which is subject to repayment, not to exceed the amount of offering expenses.
Pursuant to the investment advisory agreement, the Strategy may reimburse the Adviser for certain legal and accounting services provided to the Strategy by the Adviser. For the year ended October 31, 2011, the Adviser voluntarily agreed to waive such fees in the amount of $75,639.
The Strategy compensates AllianceBernstein Investor Services, Inc. (“ABIS”), a wholly-owned subsidiary of the Adviser, under a Transfer Agency Agreement for providing personnel and facilities to perform transfer agency services for the Strategy. ABIS may make payments to intermediaries that provide omnibus account services, sub-accounting services and/or networking services. Such compensation retained by ABIS amounted to $18,000 for the year ended October 31, 2011.
| ALLIANCEBERNSTEIN MUNICIPAL BOND INFLATION STRATEGY • | 29 |
Notes to Financial Statements
AllianceBernstein Investments, Inc. (the “Distributor”), a wholly-owned subsidiary of the Adviser, serves as the distributor of the Strategy’s shares. The Distributor has advised the Strategy that it has retained front-end sales charges of $0 from the sale of Class A shares and received $14,518 and $4,766 in contingent deferred sales charges imposed upon redemptions by shareholders of Class A and Class C shares, respectively, for the year ended October 31, 2011.
The Strategy may invest in the AllianceBernstein Fixed-Income Shares, Inc. – Government STIF Portfolio (“Government STIF Portfolio”), an open-end management investment company managed by the Adviser. The Government STIF Portfolio is offered as a cash management option to mutual funds and other institutional accounts of the Adviser, and is not available for direct purchase by members of the public. The Government STIF Portfolio pays no investment management fees but does bear its own expenses. A summary of the Strategy’s transactions in shares of the Government STIF Portfolio for the year ended October 31, 2011 is as follows:
Market Value October 31, 2010 (000) | Purchases at Cost (000) | Sales Proceeds (000) | Market Value October 31, 2011 (000) | Dividend Income (000) | ||||||||||||
| $ – 0 – | $ | 125,587 | $ | 119,780 | $ | 5,807 | $ | 2 | ||||||||
NOTE C
Distribution Services Agreement
The Strategy has adopted a Distribution Services Agreement (the “Agreement”) pursuant to Rule 12b-1 under the Investment Company Act of 1940. Under the Agreement, the Strategy pays distribution and servicing fees to the Distributor at an annual rate of up to .30% of the Strategy’s average daily net assets attributable to Class A shares, 1% of the Strategy’s average daily net assets attributable to Class C shares and .10% of the Strategy’s average daily net assets attributable to Class 1 shares. There are no distribution and servicing fees on the Advisor Class and Class 2 shares. The fees are accrued daily and paid monthly. The Agreement provides that the Distributor will use such payments in their entirety for distribution assistance and promotional activities. Since the commencement of the Strategy’s operations, the Distributor has incurred expenses in excess of the distribution costs reimbursed by the Strategy in the amount of $215,030 and $0 for Class C shares and Class 1 shares, respectively. While such costs may be recovered from the Strategy in future periods so long as the Agreement is in effect, the rate of the distribution and servicing fees payable under the Agreement may not be increased without a shareholder vote. In accordance with the Agreement, there is no provision for recovery of unreimbursed distribution costs incurred by the Distributor beyond the current fiscal year for Class A shares. The Agreement also provides that the Adviser may use its own resources to finance the distribution of the Strategy’s shares.
| 30 | • ALLIANCEBERNSTEIN MUNICIPAL BOND INFLATION STRATEGY |
Notes to Financial Statements
NOTE D
Investment Transactions
Purchases and sales of investment securities (excluding short-term investments) for the year ended October 31, 2011 were as follows:
| Purchases | Sales | |||||||
Investment securities (excluding | $ | 223,669,321 | $ | 7,960,259 | ||||
U.S. government securities | 26,958,338 | 25,978,096 | ||||||
The cost of investments for federal income tax purposes, gross unrealized appreciation and unrealized depreciation (excluding swap transactions) are as follows:
Cost | $ | 278,959,057 | ||
|
| |||
Gross unrealized appreciation | $ | 3,932,899 | ||
Gross unrealized depreciation | (531,944 | ) | ||
|
| |||
Net unrealized appreciation | $ | 3,400,955 | ||
|
|
1. Derivative Financial Instruments
The Strategy may use derivatives to earn income and enhance returns, to hedge or adjust the risk profile of its portfolio, to replace more traditional direct investments, or to obtain exposure to otherwise inaccessible markets.
The principal type of derivatives utilized by the Strategy, as well as the methods in which they may be used are:
| • | Swap Agreements |
The Strategy may enter into swaps to hedge its exposure to interest rates or credit risk. A swap is an agreement that obligates two parties to exchange a series of cash flows at specified intervals based upon or calculated by reference to changes in specified prices or rates for a specified amount of an underlying asset. The payment flows are usually netted against each other, with the difference being paid by one party to the other. In addition, collateral may be pledged or received by the Strategy in accordance with the terms of the respective swap agreements to provide value and recourse to the Strategy or its counterparties in the event of default, bankruptcy or insolvency by one of the parties to the swap agreement.
Risks may arise as a result of the failure of the counterparty to the swap contract to comply with the terms of the swap contract. The loss incurred by the failure of a counterparty is generally limited to the net interim payment to be received by the Strategy, and/or the termination value at the end of the contract. Therefore, the Strategy considers the creditworthiness of each counterparty to a swap contract in evaluating potential counterparty risk. This risk is mitigated by having a netting arrangement between the Strategy and the counterparty and by the posting of collateral by the counterparty to the Strategy to cover the Strategy exposure to the counterparty. Additionally, risks may arise from unanticipated movements in interest rates or in the value of the underlying
| ALLIANCEBERNSTEIN MUNICIPAL BOND INFLATION STRATEGY • | 31 |
Notes to Financial Statements
securities. The Strategy accrues for the interim payments on swap contracts on a daily basis, with the net amount recorded within unrealized appreciation/depreciation of swap contracts on the statement of assets and liabilities, where applicable. Once the interim payments are settled in cash, the net amount is recorded as realized gain/(loss) on swaps on the statement of operations, in addition to any realized gain/(loss) recorded upon the termination of swap contracts. Fluctuations in the value of swap contracts are recorded as a component of net change in unrealized appreciation/depreciation of swap contracts on the statement of operations.
Interest Rate Swaps:
The Strategy is subject to interest rate risk exposure in the normal course of pursuing its investment objectives. Because the Strategy holds fixed rate bonds, the value of these bonds may decrease if interest rates rise. To help hedge against this risk and to maintain its ability to generate income at prevailing market rates, the Strategy may enter into interest rate swap contracts. Interest rate swaps are agreements between two parties to exchange cash flows based on a notional amount. The Strategy may elect to pay a fixed rate and receive a floating rate, or, receive a fixed rate and pay a floating rate on a notional amount.
In addition, a Strategy may also enter into interest rate swap transactions to preserve a return or spread on a particular investment or portion of its portfolio, or protecting against an increase in the price of securities the Strategy anticipates purchasing at a later date. Interest rate swaps involve the exchange by the Strategy with another party of their respective commitments to pay or receive interest (e.g., an exchange of floating rate payments for fixed rate payments) computed based on a contractually-based principal (or “notional”) amount. Interest rate swaps are entered into on a net basis (i.e., the two payment streams are netted out, with the Strategy receiving or paying, as the case may be, only the net amount of the two payments).
During the year ended October 31, 2011, the Strategy held interest rate swaps for hedging purposes.
Documentation governing the Strategy’s swap transactions may contain provisions for early termination of a swap in the event the net assets of the Strategy decline below specific levels set forth in the documentation (“net asset contingent features”). If these levels are triggered, the Strategy’s counterparty has the right to terminate the swap and require the Strategy to pay or receive a settlement amount in connection with the terminated swap transaction. As of October 31, 2011, the Strategy had interest rate swap contracts in liability positions with net asset contingent features. The fair value of such interest rate swaps amounts to $2,204,328 at October 31, 2011.
| 32 | • ALLIANCEBERNSTEIN MUNICIPAL BOND INFLATION STRATEGY |
Notes to Financial Statements
At October 31, 2011, the Strategy had entered into the following derivatives:
Asset Derivatives | Liability Derivatives | |||||||||||
Derivative Type | Statement of | Fair Value | Statement of | Fair Value | ||||||||
Interest rate contracts | Unrealized appreciation on interest rate swap contracts | $ | 1,283,693 | | Unrealized depreciation on interest rate swap contracts | $ | 2,204,328 | | ||||
|
|
|
| |||||||||
Total | $ | 1,283,693 | $ | 2,204,328 | ||||||||
|
|
|
| |||||||||
The effect of derivative instruments on the statement of operations for the year ended October 31, 2011:
Derivative Type | Location of Gain | Realized Gain or (Loss) on Derivatives | Change in Unrealized Appreciation or (Depreciation) | |||||||
Interest rate contracts | Net realized gain (loss) on swap contracts; Net change in unrealized appreciation/depreciation of swap contracts | $ | – 0 | – | $ | (368,906 | ) | |||
|
|
|
| |||||||
Total | $ | – 0 | – | $ | (368,906 | ) | ||||
|
|
|
| |||||||
For the year ended October 31, 2011, the average monthly notional amount of interest rate swaps was $107,030,769.
NOTE E
Capital Stock
Each class consists of 3,000,000,000 authorized shares. Transactions in capital shares for Class A, Class C, Advisor Class, Class 1 and Class 2 were as follows:
| Shares | Amount | |||||||||||||||||||
| Year Ended October 31, 2011 | January 26, 2010(a) to October, 31 2010 | Year Ended October 31, 2011 | January 26, 2010(a) to October, 31 2010 | |||||||||||||||||
|
| |||||||||||||||||||
| Class A | ||||||||||||||||||||
Shares sold | 5,142,328 | 3,163,536 | $ | 52,360,160 | $ | 31,733,618 | ||||||||||||||
| ||||||||||||||||||||
Shares issued in reinvestment of dividends and distributions | 54,868 | 10,166 | 553,410 | 101,948 | ||||||||||||||||
| ||||||||||||||||||||
Shares redeemed | (1,753,553 | ) | (379,703 | ) | (17,863,298 | ) | (3,797,745 | ) | ||||||||||||
| ||||||||||||||||||||
Net increase | 3,443,643 | 2,793,999 | $ | 35,050,272 | $ | 28,037,821 | ||||||||||||||
| ||||||||||||||||||||
| ALLIANCEBERNSTEIN MUNICIPAL BOND INFLATION STRATEGY • | 33 |
Notes to Financial Statements
| Shares | Amount | |||||||||||||||||||
| Year Ended October 31, 2011 | January 26, 2010(a) to October, 31 2010 | Year Ended October 31, 2011 | January 26, 2010(a) to October, 31 2010 | |||||||||||||||||
| Class C | ||||||||||||||||||||
Shares sold | 1,500,701 | 1,219,122 | $ | 15,313,770 | $ | 12,200,973 | ||||||||||||||
| ||||||||||||||||||||
Shares issued in reinvestment of dividends and distributions | 14,956 | 2,858 | 149,935 | 28,605 | ||||||||||||||||
| ||||||||||||||||||||
Shares redeemed | (363,624 | ) | (50,670 | ) | (3,648,199 | ) | (508,193 | ) | ||||||||||||
| ||||||||||||||||||||
Net increase | 1,152,033 | 1,171,310 | $ | 11,815,506 | $ | 11,721,385 | ||||||||||||||
| ||||||||||||||||||||
| Advisor Class | ||||||||||||||||||||
Shares sold | 3,278,789 | 1,274,214 | $ | 33,508,137 | $ | 12,824,351 | ||||||||||||||
| ||||||||||||||||||||
Shares issued in reinvestment of dividends and distributions | 33,958 | 2,854 | 344,191 | 28,710 | ||||||||||||||||
| ||||||||||||||||||||
Shares redeemed | (469,384 | ) | (58,151 | ) | (4,799,372 | ) | (585,135 | ) | ||||||||||||
| ||||||||||||||||||||
Net increase | 2,843,363 | 1,218,917 | $ | 29,052,956 | $ | 12,267,926 | ||||||||||||||
| ||||||||||||||||||||
| Class 1 | ||||||||||||||||||||
Shares sold | 11,632,224 | 1,000 | $ | 119,044,000 | $ | 10,000 | ||||||||||||||
| ||||||||||||||||||||
Shares issued in reinvestment of dividends and distributions | 4,161 | – 0 | – | $ | 42,866 | $ | – 0 | – | ||||||||||||
| ||||||||||||||||||||
Shares redeemed | (777,645 | ) | – 0 | – | $ | (8,021,647 | ) | $ | – 0 | – | ||||||||||
| ||||||||||||||||||||
Net increase | 10,858,740 | 1,000 | $ | 111,065,219 | $ | 10,000 | ||||||||||||||
| ||||||||||||||||||||
|
| |||||||||||||||||||
| Class 2 | ||||||||||||||||||||
Shares sold | 4,736,196 | 996,000 | $ | 48,492,929 | $ | 9,960,000 | ||||||||||||||
| ||||||||||||||||||||
Shares issued in reinvestment of dividends and distributions | 7,316 | – 0 | – | $ | 73,754 | $ | – 0 | – | ||||||||||||
| ||||||||||||||||||||
Shares redeemed | (1,531,103 | ) | – 0 | – | $ | (15,274,872 | ) | $ | – 0 | – | ||||||||||
| ||||||||||||||||||||
Net increase | 3,212,409 | 996,000 | $ | 33,291,811 | $ | 9,960,000 | ||||||||||||||
| ||||||||||||||||||||
| (a) | Commencement of operations. |
NOTE F
Risks Involved in Investing in the Strategy
Interest Rate Risk and Credit Risk—Interest rate risk is the risk that changes in interest rates will affect the value of the Strategy’s investments in fixed-income debt securities such as bonds or notes. Increases in interest rates may cause the value of the Strategy’s investments to decline. Credit risk is the risk that the issuer or guarantor of a debt security, or the counterparty to a derivative contract, will be unable or unwilling to make timely principal and/or interest payments, or to otherwise honor its obligations. The degree of risk for a particular
| 34 | • ALLIANCEBERNSTEIN MUNICIPAL BOND INFLATION STRATEGY |
Notes to Financial Statements
security may be reflected in its credit risk rating. Credit risk is greater for medium quality and lower-rated securities. Lower-rated debt securities and similar unrated securities (commonly known as “junk bonds”) have speculative elements or are predominantly speculative risks.
Municipal Market Risk—This is the risk that special factors may adversely affect the value of municipal securities and have a significant effect on the yield or value of the Strategy’s investments in municipal securities. These factors include economic conditions, political or legislative changes, uncertainties related to the tax status of municipal securities, or the rights of investors in these securities. To the extent that the Strategy invests more of its assets in a particular state’s municipal securities, the Strategy may be vulnerable to events adversely affecting that state, including economic, political and regulatory occurrences, court decisions, terrorism and catastrophic natural disasters, such as hurricanes or earthquakes. The Strategy’s investments in certain municipal securities with principal and interest payments that are made from the revenues of a specific project or facility, and not general tax revenues, may have increased risks. Factors affecting the project or facility, such as local business or economic conditions, could have a significant effect on the project’s ability to make payments of principal and interest on these securities.
Derivatives Risk—The Strategy may enter into derivative transactions such as forwards, options, futures and swaps. Derivatives may be illiquid, difficult to price, and leveraged so that small changes may produce disproportionate losses for the Strategy, and subject to counterparty risk to a greater degree than more traditional investments. Derivatives may result in significant losses, including losses that are far greater than the value of the derivatives reflected in the statement of assets and liabilities.
Indemnification Risk—In the ordinary course of business, the Strategy enters into contracts that contain a variety of indemnifications. The Strategy’s maximum exposure under these arrangements is unknown. However, the Strategy has not had prior claims or losses pursuant to these indemnification provisions and expects the risk of loss thereunder to be remote. Therefore, the Strategy has not accrued any liability in connection with these indemnification provisions.
NOTE G
Joint Credit Facility
A number of open-end mutual funds managed by the Adviser, including the Strategy, participate in a $140 million revolving credit facility (the “Facility”) intended to provide short-term financing, if necessary, subject to certain restrictions in connection with abnormal redemption activity. Commitment fees related to the Facility are paid by the participating funds and are included in miscellaneous expenses in the statement of operations. The Strategy did not utilize the Facility during the year ended October 31, 2011.
| ALLIANCEBERNSTEIN MUNICIPAL BOND INFLATION STRATEGY • | 35 |
Notes to Financial Statements
NOTE H
Distributions to Shareholders
The tax character of distributions paid during the fiscal years ended October 31, 2011 and October 31, 2010 were as follows:
| 2011 | 2010 | |||||||
Distributions paid from: | ||||||||
Ordinary income | $ | 233,340 | $ | 57,510 | ||||
Tax-exempt income | 2,182,854 | 258,762 | ||||||
|
|
|
| |||||
Total distributions paid | $ | 2,416,194 | $ | 316,272 | ||||
|
|
|
| |||||
As of October 31, 2011, the components of accumulated earnings/(deficit) on a tax basis were as follows:
Undistributed tax-exempt income | $ | 156,242 | ||
Undistributed ordinary income | 548,290 | |||
Undistributed capital gains | 8,895 | |||
Unrealized appreciation/(depreciation) | 2,480,320 | |||
|
| |||
Total accumulated earnings/(deficit) | $ | 3,193,747 | (a) | |
|
|
| (a) | The difference between book-basis and tax-basis components of accumulated earnings/(deficit) is attributable primarily to the amortization of offering costs. |
During the current fiscal year, permanent differences primarily due to nondeductible offering costs resulted in a net decrease in undistributed net investment income and a net increase in additional paid-in capital. This reclassification had no effect on net assets.
NOTE I
Recent Accounting Pronouncement
In May 2011, the Financial Accounting Standards Board (“FASB”) issued an Accounting Standards Update (“ASU”) to develop common requirements for measuring fair value and for disclosing information about fair value measurements in U.S. GAAP and International Financial Reporting Standards (“IFRS”). The amendments are intended to improve the comparability of fair value measurements presented and disclosed in the financial statements prepared in accordance with U.S. GAAP and IFRS. The ASU is effective during interim or annual periods beginning after December 15, 2011. At this time, management is evaluating the implication of this ASU and its impact on the financial statements has not been determined.
NOTE J
Subsequent Events
Management has evaluated subsequent events for possible recognition or disclosure in the financial statements through the date the financial statements are issued. Management has determined that there are no material events that would require disclosure in the Strategy’s financial statements through this date.
| 36 | • ALLIANCEBERNSTEIN MUNICIPAL BOND INFLATION STRATEGY |
Notes to Financial Statements
FINANCIAL HIGHLIGHTS
Selected Data For A Share Of Capital Stock Outstanding Throughout Each Period
| Class A | ||||||||
Year Ended 2011 | January 26, October 31, | |||||||
|
| |||||||
Net asset value, beginning of period | $ 10.09 | $ 10.00 | ||||||
|
| |||||||
Income From Investment Operations | ||||||||
Net investment income(b)(c) | .16 | .11 | ||||||
Net realized and unrealized gain on investment transactions | .26 | .06 | ||||||
|
| |||||||
Net increase in net asset value from operations | .42 | .17 | ||||||
|
| |||||||
Less: Dividends and Distributions | ||||||||
Dividends from net investment income | (.17 | ) | (.08 | ) | ||||
Distributions from net realized gain on investment transactions | (.02 | ) | – 0 | – | ||||
|
| |||||||
Total dividends and distributions | (.19 | ) | (.08 | ) | ||||
|
| |||||||
Net asset value, end of period | $ 10.32 | $ 10.09 | ||||||
|
| |||||||
Total Return | ||||||||
Total investment return based on net asset value(d) | 4.24 | % | 1.70 | % | ||||
Ratios/Supplemental Data | ||||||||
Net assets, end of period (000’s omitted) | $64,342 | $28,200 | ||||||
Ratio to average net assets of: | ||||||||
Expenses, net of waivers/reimbursements | .80 | % | .80 | %(e) | ||||
Expenses, before waivers/reimbursements | 1.20 | % | 2.15 | %(e) | ||||
Net investment income(b) | 1.57 | % | 1.43 | %(e) | ||||
Portfolio turnover rate | 26 | % | 1 | % | ||||
See footnote summary on page 41.
| ALLIANCEBERNSTEIN MUNICIPAL BOND INFLATION STRATEGY • | 37 |
Financial Highlights
Selected Data For A Share Of Capital Stock Outstanding Throughout Each Period
| Class C | ||||||||
Year Ended 2011 | January 26, October 31, | |||||||
|
| |||||||
Net asset value, beginning of period | $ 10.08 | $ 10.00 | ||||||
|
| |||||||
Income From Investment Operations | ||||||||
Net investment income(b)(c) | .09 | .06 | ||||||
Net realized and unrealized gain on investment transactions | .25 | .06 | ||||||
|
| |||||||
Net increase in net asset value from operations | .34 | .12 | ||||||
|
| |||||||
Less: Dividends and Distributions | ||||||||
Dividends from net investment income | (.10 | ) | (.04 | ) | ||||
Distributions from net realized gain on investment transactions | (.02 | ) | – 0 | – | ||||
|
| |||||||
Total dividends and distributions | (.12 | ) | (.04 | ) | ||||
|
| |||||||
Net asset value, end of period | $ 10.30 | $ 10.08 | ||||||
|
| |||||||
Total Return | ||||||||
Total investment return based on net asset value(d) | 3.45 | % | 1.23 | % | ||||
Ratios/Supplemental Data | ||||||||
Net assets, end of period (000’s omitted) | $23,919 | $11,804 | ||||||
Ratio to average net assets of: | ||||||||
Expenses, net of waivers/reimbursements | 1.50 | % | 1.50 | %(e) | ||||
Expenses, before waivers/reimbursements | 1.91 | % | 2.76 | %(e) | ||||
Net investment income(b) | .87 | % | .78 | %(e) | ||||
Portfolio turnover rate | 26 | % | 1 | % | ||||
See footnote summary on page 41.
| 38 | • ALLIANCEBERNSTEIN MUNICIPAL BOND INFLATION STRATEGY |
Financial Highlights
Selected Data For A Share Of Capital Stock Outstanding Throughout Each Period
| Advisor Class | ||||||||
Year Ended 2011 | January 26, October 31, | |||||||
|
| |||||||
Net asset value, beginning of period | $ 10.10 | $ 10.00 | ||||||
|
| |||||||
Income From Investment Operations | ||||||||
Net investment income(b)(c) | .19 | .12 | ||||||
Net realized and unrealized gain on investment transactions | .25 | .08 | ||||||
|
| |||||||
Net increase in net asset value from operations | .44 | .20 | ||||||
|
| |||||||
Less: Dividends and Distributions | ||||||||
Dividends from net investment income | (.20 | ) | (.10 | ) | ||||
Distributions from net realized gain on investment transactions | (.02 | ) | – 0 | – | ||||
|
| |||||||
Total dividends and distributions | (.22 | ) | (.10 | ) | ||||
|
| |||||||
Net asset value, end of period | $ 10.32 | $ 10.10 | ||||||
|
| |||||||
Total Return | ||||||||
Total investment return based on net asset value(d) | 4.44 | % | 1.97 | % | ||||
Ratios/Supplemental Data | ||||||||
Net assets, end of period (000’s omitted) | $41,924 | $12,310 | ||||||
Ratio to average net assets of: | ||||||||
Expenses, net of waivers/reimbursements | .50 | % | .50 | %(e) | ||||
Expenses, before waivers/reimbursements | .88 | % | 1.57 | %(e) | ||||
Net investment income(b) | 1.85 | % | 1.81 | %(e) | ||||
Portfolio turnover rate | 26 | % | 1 | % | ||||
See footnote summary on page 41.
| ALLIANCEBERNSTEIN MUNICIPAL BOND INFLATION STRATEGY • | 39 |
Financial Highlights
Selected Data For A Share Of Capital Stock Outstanding Throughout Each Period
| Class 1 | ||||||||
Year Ended 2011 | January 26, October 31, | |||||||
|
| |||||||
Net asset value, beginning of period | $ 10.08 | $ 10.00 | ||||||
|
| |||||||
Income From Investment Operations | ||||||||
Net investment income(b)(c) | .17 | .11 | ||||||
Net realized and unrealized gain on investment transactions | .27 | .07 | ||||||
|
| |||||||
Net increase in net asset value from operations | .44 | .18 | ||||||
|
| |||||||
Less: Dividends and Distributions | ||||||||
Dividends from net investment income | (.20 | ) | (.10 | ) | ||||
Distributions from net realized gain on investment transactions | (.02 | ) | – 0 | – | ||||
|
| |||||||
Total dividends and distributions | (.22 | ) | (.10 | ) | ||||
|
| |||||||
Net asset value, end of period | $ 10.30 | $ 10.08 | ||||||
|
| |||||||
Total Return | ||||||||
Total investment return based on net asset value(d) | 4.40 | % | 1.78 | % | ||||
Ratios/Supplemental Data | ||||||||
Net assets, end of period (000’s omitted) | $111,857 | $10 | ||||||
Ratio to average net assets of: | ||||||||
Expenses, net of waivers/reimbursements | .60 | % | .60 | %(e) | ||||
Expenses, before waivers/reimbursements | .92 | % | 2.70 | %(e) | ||||
Net investment income(b) | 1.66 | % | 1.38 | %(e) | ||||
Portfolio turnover rate | 26 | % | 1 | % | ||||
See footnote summary on page 41.
| 40 | • ALLIANCEBERNSTEIN MUNICIPAL BOND INFLATION STRATEGY |
Financial Highlights
Selected Data For A Share Of Capital Stock Outstanding Throughout Each Period
| Class 2 | ||||||||
Year Ended 2011 | January 26, October 31, | |||||||
|
| |||||||
Net asset value, beginning of period | $ 10.08 | $ 10.00 | ||||||
|
| |||||||
Income From Investment Operations | ||||||||
Net investment income(b)(c) | .17 | .11 | ||||||
Net realized and unrealized gain on investment transactions | .28 | .07 | ||||||
|
| |||||||
Net increase in net asset value from operations | .45 | .18 | ||||||
|
| |||||||
Less: Dividends and Distributions | ||||||||
Dividends from net investment income | (.20 | ) | (.10 | ) | ||||
Distributions from net realized gain on investment transactions | (.02 | ) | – 0 | – | ||||
|
| |||||||
Total dividends and distributions | (.22 | ) | (.10 | ) | ||||
|
| |||||||
Net asset value, end of period | $ 10.31 | $ 10.08 | ||||||
|
| |||||||
Total Return | ||||||||
Total investment return based on net asset value(d) | 4.54 | % | 1.85 | % | ||||
Ratios/Supplemental Data | ||||||||
Net assets, end of period (000’s omitted) | $43,368 | $10,044 | ||||||
Ratio to average net assets of: | ||||||||
Expenses, net of waivers/reimbursements | .50 | % | .50 | %(e) | ||||
Expenses, before waivers/reimbursements | .85 | % | 2.61 | %(e) | ||||
Net investment income(b) | 1.77 | % | 1.49 | %(e) | ||||
Portfolio turnover rate | 26 | % | 1 | % | ||||
| (a) | Commencement of operations. |
| (b) | Net of fees waived and expenses reimbursed by the Adviser. |
| (c) | Based on average shares outstanding. |
| (d) | Total investment return is calculated assuming an initial investment made at the net asset value at the beginning of the period, reinvestment of all dividends and distributions at net asset value during the period, and redemption on the last day of the period. Initial sales charges or contingent deferred sales charges are not reflected in the calculation of total investment return. Total return does not reflect the deduction of taxes that a shareholder would pay on portfolio distributions or the redemption of portfolio shares. Total investment return calculated for a period of less than one year is not annualized. |
| (e) | Annualized. |
See notes to financial statements.
| ALLIANCEBERNSTEIN MUNICIPAL BOND INFLATION STRATEGY • | 41 |
Financial Highlights
REPORT OF INDEPENDENT REGISTERED
PUBLIC ACCOUNTING FIRM
To the Board of Directors of AllianceBernstein Bond Fund, Inc.
and Shareholders of the AllianceBernstein Municipal Bond Inflation Strategy Portfolio
We have audited the accompanying statement of assets and liabilities of AllianceBernstein Municipal Bond Inflation Strategy Portfolio (the “Strategy”) (one of the portfolios constituting AllianceBernstein Bond Fund, Inc.), including the portfolio of investments, as of October 31, 2011, and the related statement of operations for the year then ended and the statements of changes in net assets and the financial highlights for the year then ended and the period January 26, 2010 (commencement of operations) through October 31, 2010. These financial statements and financial highlights are the responsibility of the Strategy’s management. Our responsibility is to express an opinion on these financial statements and financial highlights based on our audits.
We conducted our audits in accordance with the standards of the Public Company Accounting Oversight Board (United States). Those standards require that we plan and perform the audit to obtain reasonable assurance about whether the financial statements and financial highlights are free of material misstatement. We were not engaged to perform an audit of the Strategy’s internal control over financial reporting. Our audit included consideration of internal control over financial reporting as a basis for designing audit procedures that are appropriate in the circumstances, but not for the purpose of expressing an opinion on the effectiveness of the Strategy’s internal control over financial reporting. Accordingly, we express no such opinion. An audit also includes examining, on a test basis, evidence supporting the amounts and disclosures in the financial statements and financial highlights, assessing the accounting principles used and significant estimates made by management, and evaluating the overall financial statement presentation. Our procedures included confirmation of securities owned as of October 31, 2011 by correspondence with the custodian and others or by other appropriate auditing procedures where replies from others were not received. We believe that our audits provide a reasonable basis for our opinion.
In our opinion, the financial statements and financial highlights referred to above present fairly, in all material respects, the financial position of the AllianceBernstein Municipal Bond Inflation Strategy Portfolio of AllianceBernstein Bond Fund, Inc. at October 31, 2011, the results of its operations for the year then ended, and the changes in its net assets and the financial highlights for the year then ended and the period January 26, 2010 (commencement of operations) through October 31, 2010, in conformity with U.S. generally accepted accounting principles.

New York, New York
December 29, 2011
| 42 | • ALLIANCEBERNSTEIN MUNICIPAL BOND INFLATION STRATEGY |
Report of Independent Registered Public Accounting Firm
BOARD OF DIRECTORS
William H. Foulk, Jr.(1), Chairman John H. Dobkin(1) Michael J. Downey(1) D. James Guzy(1) Nancy P. Jacklin(1) | Robert M. Keith, President and Chief Executive Officer Garry L. Moody(1) Marshall C. Turner, Jr.(1) Earl D. Weiner(1) |
OFFICERS
Philip L. Kirstein, Michael G. Brooks(2), Vice President Robert (Guy) B. Davidson III(2), Vice President | Wayne D. Godlin(2), Vice President Terrance T. Hults(2), Vice President Emilie D. Wrapp, Secretary Joseph J. Mantineo, Treasurer and Chief Financial Officer Phyllis J. Clarke, Controller |
Custodian and Accounting Agent State Street Bank and Trust Company One Lincoln Street Boston, MA 02111
Principal Underwriter AllianceBernstein Investments, Inc. 1345 Avenue of the Americas New York, NY 10105
Transfer Agent AllianceBernstein Investor Services, Inc. P.O. Box 786003 San Antonio, TX 78278-6003 Toll-Free (800) 221-5672 | Independent Registered Public Ernst & Young LLP 5 Times Square New York, NY 10036
Legal Counsel Seward & Kissel LLP One Battery Park Plaza New York, NY 10004 |
| (1) | Member of the Audit Committee, the Governance and Nominating Committee, and the Independent Directors Committee. Mr. Foulk is the sole member of the Fair Value Pricing Committee. |
| (2) | The day-to-day management of, and investment decisions for, the Strategy’s portfolio are made by the Municipal Bond Investment Team. Messrs. Michael G. Brooks, Robert (Guy) B. Davidson III, Wayne D. Godlin and Terrance T. Hults are the investment professionals with the most significant responsibility for the day-to-day management of the Strategy’s portfolio. |
| ALLIANCEBERNSTEIN MUNICIPAL BOND INFLATION STRATEGY • | 43 |
Board of Directors
MANAGEMENT OF THE FUND
Board of Directors Information
The business and affairs of the Strategy are managed under the direction of the Board of Directors. Certain information concerning the Strategy’s Directors is set forth below.
NAME, ADDRESS* and AGE (YEAR FIRST ELECTED**) | PRINCIPAL DURING PAST FIVE | PORTFOLIOS IN FUND COMPLEX OVERSEEN BY DIRECTOR | OTHER DIRECTORSHIPS HELD BY DIRECTOR IN THE PAST FIVE YEARS | |||||
| INTERESTED DIRECTOR | ||||||||
Robert M. Keith, + 1345 Avenue of the Americas New York, New York 10105 51 (2010) | Senior Vice President of AllianceBernstein L.P. (the “Adviser”) Adviser and head of AllianceBernstein Investments, Inc. (“ABI”) since July 2008; Director of ABI and President of the AllianceBernstein Mutual Funds. Previously, he served as Executive Managing Director of ABI from December 2006 to June 2008. Prior to joining ABI in 2006, Executive Managing Director of Bernstein Global Wealth Management, and prior thereto, Senior Managing Director and Global Head of Client Service and Sales of the Adviser’s institutional investment management business since 2004. Prior thereto, Managing Director and Head of North American Client Service and Sales in the Adviser’s institutional investment management business, with which he had been associated since prior to 2004. | 102 | None | |||||
| 44 | • ALLIANCEBERNSTEIN MUNICIPAL BOND INFLATION STRATEGY |
Management of the Fund
NAME, ADDRESS* and AGE (YEAR FIRST ELECTED**) | PRINCIPAL DURING PAST FIVE | PORTFOLIOS IN FUND COMPLEX OVERSEEN BY DIRECTOR | OTHER DIRECTORSHIPS HELD BY DIRECTOR IN THE PAST FIVE YEARS | |||||
| DISINTERESTED DIRECTORS | ||||||||
William H. Foulk, Jr., ++, # Chairman of the Board (1998) | Investment Adviser and an Independent Consultant since prior to 2006. Previously, he was Senior Manager of Barrett Associates, Inc., a registered investment adviser. He was formerly Deputy Comptroller and Chief Investment Officer of the State of New York and, prior thereto, Chief Investment Officer of the New York Bank for Savings. He has served as a director or trustee of various AllianceBernstein Funds since 1983 and has been Chairman of the AllianceBernstein Funds and of the Independent Directors Committee of such Funds since 2003. He is also active in a number of mutual fund organizations and committees. | 102 | None | |||||
John H. Dobkin, # 69 (1998) | Independent Consultant since prior to 2006. Formerly, President of Save Venice, Inc. (preservation organization) from 2001-2002, Senior Advisor from June 1999 – June 2000 and President of Historic Hudson Valley (historic preservation) from December 1989 – May 1999. Previously, Director of the National Academy of Design. He has served as a director or trustee of various AllianceBernstein Funds since 1992, and as Chairman of the Audit Committees of a number of such Funds from 2001-2008. | 102 | None | |||||
| ALLIANCEBERNSTEIN MUNICIPAL BOND INFLATION STRATEGY • | 45 |
Management of the Fund
NAME, ADDRESS* and AGE (YEAR FIRST ELECTED**) | PRINCIPAL DURING PAST FIVE | PORTFOLIOS IN FUND COMPLEX OVERSEEN BY DIRECTOR | OTHER DIRECTORSHIPS HELD BY DIRECTOR IN THE PAST FIVE YEARS | |||||
| DISINTERESTED DIRECTORS (continued) | ||||||||
Michael J. Downey, # 67 (2005) | Private Investor since prior to 2006. Formerly, managing partner of Lexington Capital, LLC (investment advisory firm) from December 1997 until December 2003. From 1987 until 1993, Chairman and CEO of Prudential Mutual Fund Management, Director of the Prudential Mutual funds and member of the Executive Committee of Prudential Securities, Inc. He has served as a director or trustee of the AllianceBernstein Funds since 2005 and is a director of two other registered investment companies (and Chairman of one of them). | 102 | Asia Pacific Fund, Inc. and The Merger Fund since prior to 2006 and Prospect Acquisition Corp. (financial services) since 2007 until 2009 | |||||
D. James Guzy, # 75 (2005) | Chairman of the Board of PLX Technology (semi-conductors) and of SRC Computers Inc., with which he has been associated since prior to 2006. He was a director of Intel Corporation (semi-conductors) from 1969 until 2008, and served as Chairman of the Finance Committee of such company for several years until May 2008. He has served as a director or trustee of one or more of the AllianceBernstein Funds since 1982. | 102 | Cirrus Logic Corporation (semi-conductors) and PLX Technology (semi-conductors) since prior to 2006 and Intel Corporation (semi-conductors) since prior to 2006 until 2008 | |||||
| 46 | • ALLIANCEBERNSTEIN MUNICIPAL BOND INFLATION STRATEGY |
Management of the Fund
NAME, ADDRESS* and AGE (YEAR FIRST ELECTED**) | PRINCIPAL DURING PAST FIVE | PORTFOLIOS IN FUND COMPLEX OVERSEEN BY DIRECTOR | OTHER DIRECTORSHIPS HELD BY DIRECTOR IN THE PAST FIVE YEARS | |||||
| DISINTERESTED DIRECTORS (continued) | ||||||||
Nancy P. Jacklin, # 63 (2006) | Professorial Lecturer at the Johns Hopkins School of Advanced International Studies since 2008. Formerly, U.S. Executive Director of the International Monetary Fund (December 2002 – May 2006); Partner, Clifford Chance (1992-2002); Sector Counsel, International Banking and Finance, and Associate General Counsel, Citicorp (1985-1992); Assistant General Counsel (International), Federal Reserve Board of Governors (1982-1985); and Attorney Advisor, U.S. Department of the Treasury (1973-1982). Member of the Bar of the District of Columbia and of New York; and member of the Council on Foreign Relations. She has served as a director or trustee of the AllianceBernstein Funds since 2006. | 102 | None | |||||
| ALLIANCEBERNSTEIN MUNICIPAL BOND INFLATION STRATEGY • | 47 |
Management of the Fund
NAME, ADDRESS* and AGE (YEAR FIRST ELECTED**) | PRINCIPAL DURING PAST FIVE | PORTFOLIOS IN FUND COMPLEX OVERSEEN BY DIRECTOR | OTHER DIRECTORSHIPS HELD BY DIRECTOR IN THE PAST FIVE YEARS | |||||
| DISINTERESTED DIRECTORS (continued) | ||||||||
Garry L. Moody, # 59 (2008) | Independent Consultant. Formerly, Partner, Deloitte & Touche LLP (1995-2008) where he held a number of senior positions, including Vice Chairman, and U.S. and Global Investment Management Practice Managing Partner; President, Fidelity Accounting and Custody Services Company (1993-1995); and Partner, Ernst & Young LLP (1975-1993), where he served as the National Director of Mutual Fund Tax Services. He is also a member of the Governing Council of the Independent Directors Council (IDC), an organization of independent directors of mutual funds. He has served as a director or trustee, and as Chairman of the Audit Committee, of most of the AllianceBernstein Funds since 2008. | 102 | None | |||||
| 48 | • ALLIANCEBERNSTEIN MUNICIPAL BOND INFLATION STRATEGY |
Management of the Fund
NAME, ADDRESS* and AGE (YEAR FIRST ELECTED**) | PRINCIPAL DURING PAST FIVE | PORTFOLIOS IN FUND COMPLEX OVERSEEN BY DIRECTOR | OTHER DIRECTORSHIPS HELD BY DIRECTOR IN THE PAST FIVE YEARS | |||||
| DISINTERESTED DIRECTORS (continued) | ||||||||
Marshall C. Turner, Jr., # 70 (2005) | Private Investor since prior to 2006. Interim CEO of MEMC Electronic Materials, Inc. (semi-conductor and solar cell substrates) from November 2008 until March 2009. He was Chairman and CEO of Dupont Photomasks, Inc. (components of semi-conductor manufacturing), 2003-2005, and President and CEO, 2005-2006, after the company was acquired and renamed Toppan Photomasks, Inc. He has extensive experience in venture capital investing including prior service as general partner of three institutional venture capital partnerships, and serves on the boards of a number of education and science-related non-profit organizations. He has served as a director or trustee of one or more of the AllianceBernstein Funds since 1992. | 102 | Xilinx, Inc. (programmable logic semi-conductors) and MEMC Electronic Materials, Inc. (semi-conductor and solar cell substrates) since prior to 2006 | |||||
Earl D. Weiner, # 72 (2007) | Of Counsel, and Partner prior to January 2007, of the law firm Sullivan & Cromwell LLP, and member of ABA Federal Regulation of Securities Committee Task Force to draft editions of the Fund Director’s Guidebook. He also serves as a director or trustee of various non-profit organizations and has served as Chairman or Vice Chairman of a number of them. He has served as a director or trustee of the AllianceBernstein Funds since 2007 and is Chairman of the Governance and Nominating Committees of most of the Funds. | 102 | None | |||||
| ALLIANCEBERNSTEIN MUNICIPAL BOND INFLATION STRATEGY • | 49 |
Management of the Fund
| * | The address for each of the Strategy’s disinterested Directors is c/o AllianceBernstein L.P., Attention: Philip L. Kirstein, 1345 Avenue of the Americas, New York, NY 10105. |
| ** | There is no stated term of office for the Strategy’s Directors. |
| *** | The information above includes each Director’s principal occupation during the last five years and other information relating to the experience, attributes and skills relevant to each Director’s qualifications to serve as a Director, which led to the conclusion that each Director should serve as a Director for the Strategy. |
| + | Mr. Keith is an “interested person” of the Strategy as defined in the “40 Act,” due to his position as a Senior Vice President of the Adviser. |
| ++ | Member of the Fair Value Pricing Committee. |
| # | Member of the Audit Committee, the Governance and Nominating Committee and the Independent Directors Committee. |
| 50 | • ALLIANCEBERNSTEIN MUNICIPAL BOND INFLATION STRATEGY |
Management of the Fund
Officer Information
Certain information concerning the Strategy’s Officers is listed below.
| NAME, ADDRESS* AND AGE | PRINCIPAL POSITION(S) HELD WITH FUND | PRINCIPAL OCCUPATION DURING PAST 5 YEARS | ||
| Robert M. Keith 51 | President and Chief Executive Officer | See biography above. | ||
| Philip L. Kirstein 66 | Senior Vice President and Independent Compliance Officer | Senior Vice President and Independent Compliance Officer of the AllianceBernstein Funds, with which he has been associated since October 2004. Prior thereto, he was Of Counsel to Kirkpatrick & Lockhart, LLP from October 2003 to October 2004, and General Counsel of Merrill Lynch Investment Managers, L.P. since prior to March 2003. | ||
Michael G. Brooks 63 | Vice President | Senior Vice President of the Adviser,** with which he has been associated since prior to 2006. | ||
Robert (Guy) B. Davidson III, 50 | Vice President | Senior Vice President of the Adviser,** with which he has been associated since prior to 2006. | ||
| Wayne D. Godlin 50 | Vice President | Senior Vice President of the Adviser,** with which he has been associated since December 2009. Prior thereto, he was an investment manager and a Managing Director of Van Kampen Asset Management with which he had been associated since prior to 2006. | ||
| Terrance T. Hults 45 | Vice President | Senior Vice President of the Adviser,** with which he has been associated since prior to 2006. | ||
| Emilie D. Wrapp 56 | Secretary | Senior Vice President, Assistant General Counsel and Assistant Secretary of ABI,** with which she has been associated since prior to 2006. | ||
| Joseph J. Mantineo 52 | Treasurer and Chief Financial Officer | Senior Vice President of AllianceBernstein Investor Services, Inc. (“ABIS”),** with which he has been associated since prior to 2006. | ||
| Phyllis J. Clarke 50 | Controller | Vice President of ABIS,** with which she has been associated since prior to 2006. |
| * | The address for each of the Fund’s Officers is 1345 Avenue of the Americas, New York, NY 10105. |
| ** | The Adviser, ABI and ABIS are affiliates of the Strategy. |
| The Fund’s Statement of Additional Information (“SAI”) has additional information about the Strategy’s Directors and Officers and is available without charge upon request. Contact your financial representative or AllianceBernstein at 1-800-227-4618, or visit www.alliancebernstein.com, for a free prospectus or SAI. |
| ALLIANCEBERNSTEIN MUNICIPAL BOND INFLATION STRATEGY • | 51 |
Management of the Fund
THE FOLLOWING IS NOT PART OF THE SHAREHOLDER REPORT OR THE FINANCIAL STATEMENTS
SUMMARY OF SENIOR OFFICER’S EVALUATION OF INVESTMENT ADVISORY AGREEMENT1
The following is a summary of the evaluation of the Investment Advisory Agreement between AllianceBernstein L.P. (the “Adviser”) and AllianceBernstein Bond Fund, Inc. (the “Fund”) in respect of AllianceBernstein Municipal Bond Inflation Strategy (“Strategy”).2 The evaluation of the Investment Advisory Agreement was prepared by Philip L. Kirstein, the Senior Officer of the Fund, for the Directors of the Fund, as required by the September 1, 2004 Assurance of Discontinuance (“AoD”) between the Adviser and the New York State Attorney General (the “NYAG”). The Senior Officer’s evaluation of the Investment Advisory Agreement is not meant to diminish the responsibility or authority of the Board of Directors of the Fund to perform its duties pursuant to Section 15 of the Investment Company Act of 1940 (the “40 Act”) and applicable state law. The purpose of the summary is to provide shareholders with a synopsis of the independent evaluation of the reasonableness of the advisory fees proposed to be paid by the Strategy which was provided to the Directors in connection with their review of the proposed approval of the continuance of the Investment Advisory Agreement. The Senior Officer’s evaluation considered the following factors:
| 1. | Advisory fees charged to institutional and other clients of the Adviser for like services; |
| 2. | Advisory fees charged by other mutual fund companies for like services; |
| 3. | Costs to the Adviser and its affiliates of supplying services pursuant to the advisory agreement, excluding any intra-corporate profit; |
| 4. | Profit margins of the Adviser and its affiliates from supplying such services; |
| 5. | Possible economies of scale as the Strategy grows larger; and |
| 6. | Nature and quality of the Adviser’s services including the performance of the Strategy. |
These factors, with the exception of the first factor, are generally referred to as the “Gartenberg factors,” which were articulated by the United States Court of Appeals for the Second Circuit in 1982. Gartenberg v. Merrill Lynch Asset Management, Inc., 694 F. 2d 923 (2d Cir. 1982). On March 30, 2010, the Supreme Court held the Gartenberg decision was correct in its basic formulation of what §36(b) requires: to face liability under §36(b), “an investment adviser
| 1 | The Senior Officer’s fee evaluation was completed on October 20, 2011 and discussed with the Board of Directors on November 1-3, 2011. |
| 2 | Future references to the Fund or the Strategy do not include “AllianceBernstein.” |
| 52 | • ALLIANCEBERNSTEIN MUNICIPAL BOND INFLATION STRATEGY |
must charge a fee that is so disproportionately large that it bears no reasonable relationship to the services rendered and could not have been the product of arm’s length bargaining” Jones v. Harris Associates L.P., 130 S. Ct. 1418 (2010). In Jones, the Court stated the Gartenberg approach fully incorporates the correct understanding of fiduciary duty within the context of section 36(b) and noted with approval that “Gartenberg insists that all relevant circumstances be taken into account” and “uses the range of fees that might result from arm’s-length bargaining as the benchmark for reviewing challenged fees.”3
PORTFOLIO ADVISORY FEES, EXPENSE CAPS, REIMBURSEMENTS & RATIOS
The Adviser proposed that the Strategy pay the advisory fee set forth in the table below for receiving the services to be provided pursuant to the Investment Advisory Agreement. The fee schedule below, implemented in January 2004 in connection with the Adviser’s settlement with the NYAG in December 2003, is based on a master schedule that contemplates eight categories of funds with almost all funds in each category having the same advisory fee schedule.4
| Category | Net Assets 09/30/11 | Advisory Fee Based on % of Average Daily Net Assets | Strategy | |||
| High Income | $274.4 | 50 bp on 1st $2.5 billion 45 bp on next $2.5 billion 40 bp on the balance | Municipal Bond Inflation Strategy |
The Adviser is reimbursed as specified in the Investment Advisory Agreement for certain clerical, legal, accounting, administrative and other services provided to the Strategy. During the Strategy’s most recently completed fiscal year, the Adviser was entitled to receive $55,000 (0.17% of the Strategy’s average daily net assets) for such services, but waived the amount in its entirety.
The Adviser agreed to waive that portion of its advisory fees and/or reimburse the Strategy for that portion of the Strategy’s total operating expenses to the degree necessary to limit the Strategy’s expense ratios to the amounts set forth below for the Strategy’s current fiscal year. The waiver is terminable by the Adviser at the end of the Strategy’s fiscal year upon at least 60 days written
| 3 | Jones v. Harris at 1427. |
| 4 | Most of the AllianceBernstein Mutual Funds, which the Adviser manages, were affected by the Adviser’s settlement with the NYAG. |
| ALLIANCEBERNSTEIN MUNICIPAL BOND INFLATION STRATEGY • | 53 |
notice. In addition, set forth below are the Strategy’s gross expense ratios, annualized for the most recent semi-annual period:
| Strategy | Expense Cap Pursuant to Expense Limitation Undertaking | Gross Ratio5 (04/30/11) | Fiscal Year End | |||||||||
| Municipal Bond Inflation Strategy | Advisor Class A Class C Class 1 Class 2 |
| 0.50% 0.80% 1.50% 0.60% 0.50% |
|
| 1.14% 1.44% 2.14% 1.34% 1.10% |
| October 31 | ||||
| I. | ADVISORY FEES CHARGED TO INSTITUTIONAL AND OTHER CLIENTS |
The advisory fees charged to investment companies which the Adviser manages and sponsors are normally higher than those charged to similar sized institutional accounts, including pension plans and sub-advised investment companies. The fee differential reflects, among other things, different services provided to such clients, and different liabilities assumed. Services provided by the Adviser to the Strategy that are not provided to non-investment company clients include providing office space and personnel to serve as Fund Officers, who among other responsibilities make the certifications required under the Sarbanes–Oxley Act of 2002, and coordinating with and monitoring the Strategy’s third party service providers such as Fund counsel, auditors, custodians, transfer agents and pricing services. The accounting, administrative, legal and compliance requirements for the Strategy are more costly than those for institutional client assets due to the greater complexities and time required for investment companies, although as previously noted, the Adviser is entitled to be reimbursed for providing some of these services. Also, retail mutual funds managed by the Adviser are widely held and accordingly, servicing the Strategy’s investors is more time consuming and labor intensive compared to servicing institutional clients since the Adviser needs to communicate with a more extensive network of financial intermediaries and shareholders. The Adviser also believes that it incurs substantial entrepreneurial risk when offering a new mutual fund since establishing a new mutual fund requires a large upfront investment and it may take a long time for the fund to achieve profitability since the fund must be priced to scale from inception in order to be competitive and assets are acquired one account at a time. In addition, managing the cash flow of an investment company may be more difficult than that of a stable pool of assets, such as an institutional account with little cash movement in either direction, particularly if the Strategy is in net redemption and the Adviser is frequently forced to sell securities to raise cash for redemptions. However, managing a fund with positive cash flow may be easier at times than managing a stable pool of assets. Finally, in recent years, investment advisers have been sued by institutional clients and have suffered reputational damage both by the attendant publicity and outcomes other than complete
| 5 | Annualized. |
| 54 | • ALLIANCEBERNSTEIN MUNICIPAL BOND INFLATION STRATEGY |
victories. Accordingly, the legal and reputational risks associated with institutional accounts are greater than previously thought, although arguably still not equal to those related to the mutual fund industry.
Notwithstanding the Adviser’s view that managing an investment company is not comparable to managing other institutional accounts because the services provided are different, the Supreme Court has indicated consideration should be given to the advisory fees charged to institutional accounts with a similar investment style as the Strategy.6 However, with respect to the Strategy, the Adviser represented that there is no category in the Form ADV for institutional products that have a substantially similar investment styles as the Strategy.
The Adviser represented that it does not sub-advise any registered investment companies that have a similar investment strategy as the Strategy.
| II. | MANAGEMENT FEES CHARGED BY OTHER MUTUAL FUND COMPANIES FOR LIKE SERVICES. |
Lipper, Inc., an analytical service that is not affiliated with the Adviser, compared the fees charged to the Strategy with fees charged to other investment companies for similar services by other investment advisers.7 Lipper’s analysis included the comparison of the Strategy’s contractual management fee,8, 9 estimated at the approximate current asset level of the subject Strategy, to the median of the Strategy’s Lipper Expense Group (“EG”) and the Strategy’s contractual management fee ranking.
Lipper describes an EG as a representative sample of comparable funds. Lipper’s standard methodology for screening funds to be included in an EG entails the
| 6 | The Supreme Court stated that “courts may give such comparisons the weight that they merit in light of the similarities and differences between the services that the clients in question require, but the courts must be wary of inapt comparisons.” Among the significant differences the Supreme Court noted that may exist between services provided to mutual funds and institutional accounts are “higher marketing costs.” Jones v. Harris at 1428. |
| 7 | The Supreme Court cautioned against accepting mutual fund fee comparisons without careful scrutiny since “these comparisons are problematic because these fees, like those challenged, may not be the product of negotiations conducted at arm’s length.” Jones v. Harris at 1429. |
| 8 | The contractual management fee is calculated by Lipper using the Strategy’s contractual management fee rate at a hypothetical asset level. The hypothetical asset level is based on the combined net assets of all classes of the Fund, rounded up to the next $25 million. Lipper’s total expense ratio information is based on the most recent annual report except as otherwise noted. A ranking of “1” means that the Strategy has the lowest effective fee rate in the Lipper peer group. |
| 9 | The contractual management fee does not reflect any expense reimbursements made by the Strategy to the Adviser for certain clerical, legal, accounting, administrative, and other services. In addition, the contractual management fee does not reflect any advisory fee waivers or expense reimbursements made by the Adviser that would effectively reduce the actual effective management fee. |
| ALLIANCEBERNSTEIN MUNICIPAL BOND INFLATION STRATEGY • | 55 |
consideration of several fund criteria, including fund type, investment classification/objective, load type and similar 12b-1/non-12b-1 service fees, asset (size) comparability, expense components and attributes. An EG will typically consist of seven to twenty funds.
| Strategy | Contractual Management Fee (%) | Lipper Expense Median (%) | Rank | |||||||||
| Municipal Bond Inflation Strategy | 0.500 | 0.550 | 4/10 | |||||||||
Lipper also compared the Strategy’s total expense ratio to the medians of the Strategy’s EG and Lipper Expense Universe (“EU”). The EU10 is a broader group compared to the EG, consisting of all funds that have the same investment classification/objective and load type as the subject Strategy.
| Strategy | Expense Ratio | Lipper Exp. Group Median (%) | Lipper Group Rank | Lipper Exp. Median (%) | Lipper Rank | |||||||||||||||
| Municipal Bond Inflation Strategy | 0.800 | 0.853 | 3/10 | 0.760 | 24/37 | |||||||||||||||
Based on this analysis, the Strategy has a more favorable ranking on a total expense ratio basis than on a management fee basis.
| III. | COSTS TO THE ADVISER AND ITS AFFILIATES OF SUPPLYING SERVICES PURSUANT TO THE ADVISORY FEE ARRANGEMENT, EXCLUDING ANY INTRA-CORPORATE PROFIT. |
The Adviser utilizes two profitability reporting systems, which operate independently but are aligned with each other, to estimate the Adviser’s profitability in connection with investment advisory services provided to the Strategy. The Senior Officer has retained an independent consultant to provide independent advice regarding the alignment of the two profitability systems as well as the methodologies and allocations utilized by both profitability systems. See Section IV for additional discussion.
| IV. | PROFIT MARGINS OF THE ADVISER AND ITS AFFILIATES FOR SUPPLYING SUCH SERVICES. |
The profitability information for the Strategy, prepared by the Adviser for the Board of Directors, was reviewed by the Senior Officer and the independent consultant. The Adviser’s profitability from providing investment advisory services to the Strategy in 2010 was negative.
| 10 | Except for asset (size) comparability, Lipper uses the same criteria for selecting an EG when selecting an EU. Unlike the EG, the EU allows for the same adviser to be represented by more than just one fund. |
| 11 | Most recently completed fiscal year Class A share total expense ratio. |
| 56 | • ALLIANCEBERNSTEIN MUNICIPAL BOND INFLATION STRATEGY |
In addition to the Adviser’s direct profits from managing the Strategy, certain of the Adviser’s affiliates have business relationships with the Strategy and may earn a profit from providing other services to the Strategy. The courts have referred to this type of business opportunity as “fall-out benefits” to the Adviser and indicated that such benefits should be factored into the evaluation of the total relationship between the Strategy and the Adviser. Neither case law nor common business practice precludes the Adviser’s affiliates from earning a reasonable profit on this type of relationship provided the affiliates’ charges and services are competitive. These affiliates provide transfer agent and distribution related services to the Strategy and receive transfer agent fees, front-end sales loads, Rule 12b-1 payments and contingent deferred sales charges (“CDSC”). During the Strategy’s most recently completed fiscal year, ABI received from the Portfolio $0, $74,837 and $7032 in front-end sales charges, Rule 12b-1 and CDSC fees, respectively.
AllianceBernstein Investments, Inc. (“ABI”), an affiliate of the Adviser, is the Strategy’s principal underwriter. ABI and the Adviser have disclosed in the Strategy’s prospectus that they may make revenue sharing payments from their own resources, in addition to revenues derived from sales loads and Rule 12b-1 fees, to firms that sell shares of the Strategy. In 2010, ABI paid approximately 0.04% of the average monthly assets of the AllianceBernstein Mutual Funds or approximately $13.8 million for distribution services and educational support (revenue sharing payments).
Fees and reimbursements for out of pocket expenses charged by AllianceBernstein Investor Services, Inc. (“ABIS”), the affiliated transfer agent for the Strategy, are charged on a per account basis, based on the level of service provided and the class of share held by the account. ABIS also receives a fee per shareholder sub-account for each account maintained by an intermediary on an omnibus basis. During the Strategy’s most recently completed fiscal year, ABIS received $9,322 in fees from the Strategy.
| V. | POSSIBLE ECONOMIES OF SCALE |
The Adviser has indicated that economies of scale are being shared with shareholders through fee structures,12 subsidies and enhancement to services. Based on some of the professional literature that has considered economies of scale in the mutual fund industry, it is thought that to the extent economies of scale exist, they may more often exist across a fund family as opposed to a specific fund. This is because the costs incurred by the Adviser, such as investment research or technology for trading or compliance systems, can be spread across a greater asset base as the fund family increases in size. It is also possible that as the level of services required to operate a successful investment company has increased over time, and advisory firms have made such investments in their
| 12 | Fee structures include fee reductions, pricing at scale and breakpoints in advisory fee schedules. |
| ALLIANCEBERNSTEIN MUNICIPAL BOND INFLATION STRATEGY • | 57 |
business to provide services, there may be a sharing of economies of scale without a reduction in advisory fees.
In February 2008, an independent consultant, retained by the Senior Officer, provided the Board of Directors an update of the Deli13 study on advisory fees and various fund characteristics.14 The independent consultant first reiterated the results of his previous two dimensional comparison analysis (fund size and family size) with the Board of Directors.15 The independent consultant then discussed the results of the regression model that was utilized to study the effects of various factors on advisory fees. The regression model output indicated that the bulk of the variation in fees predicted were explained by various factors, but substantially by fund assets under management (“AUM”), family AUM, index fund indicator and investment style. The independent consultant also compared the advisory fees of the AllianceBernstein Mutual Funds to similar funds managed by 19 other large asset managers, regardless of fund size and the large asset manager’s proportion of mutual fund assets to non-mutual fund assets.
| VI. | NATURE AND QUALITY OF THE ADVISER’S SERVICES INCLUDING THE PERFORMANCE OF THE PORTFOLIO. |
With assets under management of approximately $402 billion as of September 30, 2011, the Adviser has the investment experience to manage and provide non-investment services (described in Section I) to the Strategy.
| 13 | The Deli study, originally published in 2002 based on 1997 data and updated for the February 2008 presentation, may be of diminished value due to the age of the data used in the presentation and the changes experienced in the industry over the last four years. |
| 14 | As mentioned previously, the Supreme Court cautioned against accepting mutual fund fee comparisons without careful scrutiny since the fees may not be the product of negotiations conducted at arm’s length. See Jones V. Harris at 1429. |
| 15 | The two dimensional analysis showed patterns of lower advisory fees for funds with larger asset sizes and funds from larger family sizes compared to funds with smaller asset sizes and funds from smaller family sizes, which according to the independent consultant is indicative of a sharing of economies of scale and scope. However, in less liquid and active markets, such is not the case, as the empirical analysis showed potential for diseconomies of scale in those markets. The empirical analysis also showed diminishing economies of scale and scope as funds surpassed a certain high level of assets. |
| 58 | • ALLIANCEBERNSTEIN MUNICIPAL BOND INFLATION STRATEGY |
The information below shows the 1 year performance return and rankings of the Strategy16 relative to its Lipper Performance Group (“PG”) and Lipper Performance Universe (“PU”)17 for the periods ended July 31, 2011.18
| Strategy | Strategy Return (%) | PG Median (%) | PU Median (%) | PG Rank | PU Rank | |||||||||||
| Municipal Bond Inflation Strategy | ||||||||||||||||
1 year | 5.87 | 3.25 | 3.25 | 1/10 | 3/41 | |||||||||||
Set forth below are the 1 year and since inception net performance returns of the Strategy (in bold)19 versus its benchmark.20 Strategy and benchmark volatility and reward-to-variability ratio (“Sharpe Ratio”) information is also shown.21
Periods Ending July 31, 2011 Annualized Performance | ||||||||||||||||||||
| 1 Year (%) | Since Inception (%) | Annualized | Risk Period (Year) | |||||||||||||||||
| Volatility (%) | Sharpe (%) | |||||||||||||||||||
| Municipal Bond Inflation Strategy | 5.72 | 3.92 | 2.53 | 2.13 | 1 | |||||||||||||||
| Barclays Capital 1-10 yr TIPS Index | 9.63 | 7.78 | 3.25 | 2.69 | 1 | |||||||||||||||
| Inception Date: January 26, 2010 | ||||||||||||||||||||
| 16 | The performance returns and rankings are for the Class A shares of the Strategy. The performance returns of the Strategy were provided Lipper. Lipper maintains its own database that includes the Strategy’s performance returns. |
| 17 | The Strategy’s PG is identical to the Strategy’s EG. The Strategy’s PU is not identical to the Strategy’s EU as the criteria for including/excluding a strategy in/from a PU are somewhat different from that of an EU. |
| 18 | Note that the current Lipper investment classification/objective dictates the PG and PU throughout the life of the Strategy even if the Strategy may have had a different investment classification/objective at different points in time. |
| 19 | The performance returns and risk measures shown in the table are for the Class A shares of the Strategy. |
| 20 | The Adviser provided Strategy and benchmark performance return information for the periods through July 31, 2011. |
| 21 | Strategy and benchmark volatility and Sharpe Ratio information was obtained through Lipper LANA, a database maintained by Lipper. Volatility is a statistical measure of the tendency of a market price or yield to vary over time. A Sharpe Ratio is a risk adjusted measure of return that divides a fund’s return in excess of the riskless return by the fund’s standard deviation. A strategy with a greater volatility would be viewed as more risky than a strategy with equivalent performance but lower volatility; for that reason, a greater return would be demanded for the more risky fund. A strategy with a higher Sharpe Ratio would be regarded as better performing than a strategy with a lower Sharpe Ratio. |
| ALLIANCEBERNSTEIN MUNICIPAL BOND INFLATION STRATEGY • | 59 |
CONCLUSION:
Based on the factors discussed above the Senior Officer’s conclusion is that the proposed advisory fee for the Strategy is reasonable and within the range of what would have been negotiated at arm’s-length in light of all the surrounding circumstances. This conclusion in respect of the Strategy is based on an evaluation of all of these factors and no single factor was dispositive.
Dated: November 28, 2011
| 60 | • ALLIANCEBERNSTEIN MUNICIPAL BOND INFLATION STRATEGY |
THIS PAGE IS NOT PART OF THE SHAREHOLDER REPORT OR THE FINANCIAL STATEMENTS
ALLIANCEBERNSTEIN FAMILY OF FUNDS
Wealth Strategies Funds
Balanced Wealth Strategy
Conservative Wealth Strategy
Wealth Appreciation Strategy
Tax-Managed Balanced Wealth Strategy
Tax-Managed Conservative Wealth Strategy
Tax-Managed Wealth Appreciation Strategy
Asset Allocation/Multi-Asset
Emerging Markets Multi-Asset
International Portfolio
Real Asset Strategy
Tax-Managed International Portfolio
Growth Funds
Domestic
Growth Fund
Large Cap Growth Fund
Small Cap Growth Portfolio
Small/Mid Cap Growth Fund
U.S. Strategic Research Portfolio
Global & International
Global Thematic Growth Fund
Greater China ’97 Fund
International Discovery Equity Portfolio
International Focus 40 Portfolio
International Growth Fund
Value Funds
Domestic
Core Opportunities Fund
Equity Income Fund
Growth & Income Fund
Small/Mid Cap Value Fund
Value Fund
Global & International
Global Real Estate Investment Fund
Global Value Fund
International Value Fund
Taxable Bond Funds
Bond Inflation Strategy
Global Bond Fund
High Income Fund
Intermediate Bond Portfolio
Short Duration Portfolio
Unconstrained Bond Fund*
Municipal Bond Funds
Arizona California High Income Massachusetts Michigan Minnesota Municipal Bond Inflation Strategy | National New Jersey New York Ohio Pennsylvania Virginia |
Intermediate Municipal Bond Funds
Intermediate California
Intermediate Diversified
Intermediate New York
Closed-End Funds
Alliance California Municipal Income Fund
Alliance New York Municipal Income Fund
AllianceBernstein Global High Income Fund
AllianceBernstein Income Fund
AllianceBernstein National Municipal Income Fund
Alternatives
Market Neutral Strategy-Global
Market Neutral Strategy-U.S.
Balanced
Balanced Shares
Retirement Strategies Funds
2000 Retirement Strategy | 2020 Retirement Strategy | 2040 Retirement Strategy | ||
2005 Retirement Strategy | 2025 Retirement Strategy | 2045 Retirement Strategy | ||
2010 Retirement Strategy | 2030 Retirement Strategy | 2050 Retirement Strategy | ||
2015 Retirement Strategy | 2035 Retirement Strategy | 2055 Retirement Strategy |
We also offer Exchange Reserves,** which serves as the money market fund exchange vehicle for the AllianceBernstein mutual funds.
You should consider the investment objectives, risks, charges and expenses of any AllianceBernstein fund/portfolio carefully before investing. For free copies of our prospectuses, which contain this and other information, visit us online at www.alliancebernstein.com or contact your financial advisor. Please read the prospectus carefully before investing.
| * | Prior to February 3, 2011, Unconstrained Bond Fund was named Diversified Yield Fund. |
| ** | An investment in the Fund is not a deposit in a bank and is not insured or guaranteed by the Federal Deposit Insurance Corporation or any other government agency. Although the Fund seeks to preserve the value of your investment at $1.00 per share, it is possible to lose money by investing in the Fund. |
| ALLIANCEBERNSTEIN MUNICIPAL BOND INFLATION STRATEGY • | 61 |
AllianceBernstein Family of Funds
NOTES
| 62 | • ALLIANCEBERNSTEIN MUNICIPAL BOND INFLATION STRATEGY |
NOTES
| ALLIANCEBERNSTEIN MUNICIPAL BOND INFLATION STRATEGY • | 63 |
NOTES
| 64 | • ALLIANCEBERNSTEIN MUNICIPAL BOND INFLATION STRATEGY |
NOTES
| ALLIANCEBERNSTEIN MUNICIPAL BOND INFLATION STRATEGY • | 65 |
NOTES
| 66 | • ALLIANCEBERNSTEIN MUNICIPAL BOND INFLATION STRATEGY |
NOTES
| ALLIANCEBERNSTEIN MUNICIPAL BOND INFLATION STRATEGY • | 67 |
NOTES
| 68 | • ALLIANCEBERNSTEIN MUNICIPAL BOND INFLATION STRATEGY |
ALLIANCEBERNSTEIN MUNICIPAL BOND INFLATION STRATEGY
1345 Avenue of the Americas
New York, NY 10105
800.221.5672
| MBIS-0151-1011 |  | |
ANNUAL REPORT
AllianceBernstein
Real Asset Strategy
October 31, 2011
Annual Report

Investment Products Offered
| • | Are Not FDIC Insured |
| • | May Lose Value |
| • | Are Not Bank Guaranteed |
Investors should consider the investment objectives, risks, charges and expenses of the Fund carefully before investing. For copies of our prospectus or summary prospectus, which contain this and other information, visit us online at www.alliancebernstein.com or contact your AllianceBernstein Investments representative. Please read the prospectus and/or summary prospectus carefully before investing.
This shareholder report must be preceded or accompanied by the Fund’s prospectus for individuals who are not current shareholders of the Fund.
You may obtain a description of the Fund’s proxy voting policies and procedures, and information regarding how the Fund voted proxies relating to portfolio securities during the most recent 12-month period ended June 30, without charge. Simply visit AllianceBernstein’s website at www.alliancebernstein.com, or go to the Securities and Exchange Commission’s (the “Commission”) website at www.sec.gov, or call AllianceBernstein at (800) 227-4618.
The Fund files its complete schedule of portfolio holdings with the Commission for the first and third quarters of each fiscal year on Form N-Q. The Fund’s Forms N-Q are available on the Commission’s website at www.sec.gov. The Fund’s Forms N-Q may also be reviewed and copied at the Commission’s Public Reference Room in Washington, DC; information on the operation of the Public Reference Room may be obtained by calling (800) SEC-0330. AllianceBernstein publishes full portfolio holdings for the Fund monthly at www.alliancebernstein.com.
AllianceBernstein Investments, Inc. (ABI) is the distributor of the AllianceBernstein family of mutual funds. ABI is a member of FINRA and is an affiliate of AllianceBernstein L.P., the manager of the funds.
AllianceBernstein® and the AB Logo are registered trademarks and service marks used by permission of the owner, AllianceBernstein L.P.
December 9, 2011
Annual Report
This report provides management’s discussion of fund performance for AllianceBernstein Real Asset Strategy (the “Strategy”) for the annual reporting period ended October 31, 2011.
Investment Objective and Policies
The Strategy’s investment objective is to maximize real return. Real return is the rate of return after adjusting for inflation.
The Strategy pursues an aggressive investment strategy involving a variety of asset classes. The Strategy invests primarily in instruments that AllianceBernstein L.P. (the “Adviser”) expects to outperform broad equity indices during periods of rising inflation. Under normal circumstances, the Strategy expects to invest its assets principally in the following instruments that, in the judgment of the Adviser, are affected directly or indirectly by the level and change in the rate of inflation: inflation-protected fixed income securities, such as Treasury Inflation-Protected Securities (“TIPS”) and similar bonds issued by governments outside of the U.S., commodities, equity securities such as commodity-related stocks, real estate securities, utility securities, infrastructure-related securities, and securities and derivatives linked to the price of other assets (such as commodities, stock indices and real estate) and currencies.
The Strategy expects its investments in fixed income securities to have a broad range of maturities and quality levels. The Strategy will seek inflation protection from investments around the
globe, both in developed and emerging market countries. In selecting securities for purchase and sale, the Adviser will utilize its qualitative and quantitative resources to determine overall inflation sensitivity, asset allocation, and security selection. When its analysis indicates that changes are necessary, the Adviser intends to implement them through a combination of changes to underlying positions and the use of inflation swaps and other types of derivatives, such as interest rate swaps. The Strategy anticipates that its investments, other than its investments in inflation-protected securities, will focus roughly equally on commodity-related equity securities, commodities and commodity derivatives, and real estate equity securities to provide a balance between expected return and inflation protection. Its commodities investments will include significant exposure to energy commodities, but will also include agricultural products, industrial and precious metals, such as gold. The Strategy’s investments in real estate equity securities will include real estate investment trusts (“REITs”), other real estate-related securities, and infrastructure-related securities.
The Strategy will invest in both U.S. and non-U.S. dollar-denominated equity or fixed income securities. The Strategy may invest in currencies for hedging or for investment purposes, both in the spot market and through long- or short positions in currency-related derivatives. The Strategy does not ordinarily expect to hedge its foreign currency exposure because it will be balanced by investments in
| ALLIANCEBERNSTEIN REAL ASSET STRATEGY • | 1 |
U.S. dollar-denominated securities, although it may hedge the exposure under certain circumstances. The Strategy may invest significantly, to the extent permitted by applicable law, in derivatives such as options, futures, forwards, swap agreements or structured notes. The Strategy intends to use leverage for investment purposes. In determining when and to what extent to employ leverage or enter into derivatives transactions, the Adviser will consider factors such as the relative risks and returns expected of potential investments and the cost of such transactions. The Adviser will consider the impact of derivatives in making its assessments of the Strategy’s risks. The resulting exposures to markets, sectors, issuers or specific securities will be continuously monitored by the Adviser.
The Strategy may seek to gain exposure to physical commodities traded in the commodities markets through investments in a variety of derivative instruments, including investments in commodity index-linked notes. The Adviser expects that the Strategy will seek to gain exposure to commodities and commodities-related instruments and derivatives primarily through investments in AllianceBernstein Cayman Inflation Strategy, Ltd., a wholly-owned subsidiary of the Strategy organized under the laws of the Cayman Islands (the “Subsidiary”). The Subsidiary is advised by the Adviser and has the same investment objective and substantially similar investment policies and restrictions as the Strategy. The Subsidiary, unlike the Strategy, may invest, without limitation, in
commodities and commodities-related instruments. The Strategy will be subject to the risks associated with the commodities, derivatives and other instruments in which the Subsidiary invests, to the extent of its investment in the Subsidiary. The Strategy limits its investment in the Subsidiary to no more than 25% of its net assets. The Strategy is non-diversified, which means that it may concentrate its assets in a smaller number of issuers than a diversified fund.
Investment Results
The table on page 6 shows the Strategy’s performance compared to its benchmark, the Morgan Stanley Capital International (“MSCI”) All Country (“AC”) World Commodity Producers Index (Net). The Strategy’s Class A shares underperformed its benchmark over the 12-month period ended October 31, 2011, yet outperformed over the six-month period, before sales charges. During the 12-month period, a strategic allocation to global real estate stocks was the main detractor. Security selection within that sector, as well as within natural resource stocks, also detracted from performance. A strategic allocation to commodity-linked derivatives was the largest contributor, driven primarily by tactical curve positioning strategies in commodities, with a modest offset coming from security selection within commodity futures. Tactical asset allocation and risk management strategies also contributed to relative performance, after accounting for a small negative impact from collateral management.
| 2 | • ALLIANCEBERNSTEIN REAL ASSET STRATEGY |
During the six-month period, security selection was the main detractor from performance, particularly in global natural resource stocks, global real estate stocks and commodity futures. This was more than offset, however, by the positive contribution from strategic allocations to global real estate stocks and commodity-linked derivatives. Relative performance was also favorably impacted by both tactical curve positioning in commodities and top-down tactical asset allocation and risk management strategies. Management of collateral underlying commodity-linked derivative positions also provided a small positive contribution to performance.
Due to both strategic and tactical asset allocation decisions, the Strategy typically exhibits a high tracking error (i.e., the volatility of the difference in the returns generated by the Strategy and the benchmark.)
The Strategy makes regular use of notional derivatives, primarily commodity-linked swaps and commodity futures, with the aim of gaining cost-effective exposure to the commodity futures markets. The swaps had a positive material impact on relative performance over both periods. Commodity futures, however, detracted from performance in both periods, representing negative security selection within the commodities portion of the Strategy. The Strategy also
occasionally utilizes derivatives, such as futures and options for risk management and tactical asset allocation purposes, which contributed to performance over the six-month period, but had little impact over the 12-month period.
Market Review and Investment Strategy
Over the 12-month period ended October 31, 2011, and the past six months of the period in particular, global capital markets have faced the most volatile conditions since 2008, as markets experienced periodic bouts of flights to safety amid growing fears that the European sovereign debt crisis, worries of a hard landing in China and renewed economic weakness could push the global economy into recession. Natural resource stocks have been the hardest hit in recent months, followed closely by commodities among real assets. However, as risk assets have swung between overly optimistic to overly pessimistic as reflected in their pricing, this has provided opportunities for the Real Asset Strategy Team (the “Team”) to increase its weightings in risk assets overall and to exploit security- and sector-level opportunities. Given the macroeconomic concerns in the short-run and current asset pricing levels, the Team is close to its neutral positioning in risk assets overall and continues to look for opportunities to adjust that positioning.
| ALLIANCEBERNSTEIN REAL ASSET STRATEGY • | 3 |
HISTORICAL PERFORMANCE
An Important Note About Historical Performance
The investment return and principal value of an investment in the Fund will fluctuate, so that shares, when redeemed, may be worth more or less than their original cost. Performance shown on the following pages represents past performance and does not guarantee future results. Current performance may be lower or higher than the performance information shown. You may obtain performance information current to the most recent month-end by visiting www.alliancebernstein.com. For Class 1 shares, click on “Private Clients”, then “Investments”, then “Stocks” or “Bonds”, then “Mutual Fund Performance at a Glance”.
Investors should consider the investment objectives, risks, charges and expenses of the Strategy carefully before investing. For copies of our prospectus or summary prospectus, which contain this and other information, visit us online at www.alliancebernstein.com. For Class 1 shares, click on “Private Clients”, then “Investments”, then “Stocks” or “Bonds”, then “Prospectuses, SAIs, and Shareholder Reports”. Please read the prospectus and/or summary prospectus carefully before investing.
All fees and expenses related to the operation of the Strategy have been deducted. NAV returns do not reflect sales charges; if sales charges were reflected, the Strategy’s quoted performance would be lower. SEC returns reflect the applicable sales charges for each share class: a 4.25% maximum front-end sales charge for Class A shares; a 1% 1-year contingent deferred sales charge for Class C shares. Returns for the different share classes will vary due to different expenses associated with each class. Performance assumes reinvestment of distributions and does not account for taxes.
Benchmark Disclosure
The unmanaged MSCI AC World Commodity Producers Index (Net) does not reflect fees and expenses associated with the active management of a mutual fund portfolio. The MSCI AC World Commodity Producers Index is a free float-adjusted, market capitalization index designed to track the performance of global listed commodity producers, including emerging markets. Net returns include the reinvestment of dividends after deduction of non-U.S. withholding tax. MSCI makes no express or implied warranties or representations, and shall have no liability whatsoever with respect to any MSCI data contained herein. The MSCI data may not be further redistributed or used as a basis for other indices, any securities or financial products. This report is not approved, reviewed or produced by MSCI. An investor cannot invest directly in an index, and its results are not indicative of the performance for any specific investment, including the Strategy.
A Word About Risk
Market Risk: The market values of the Strategy’s holdings rise and fall from day to day, so investments may lose value.
Liquidity Risk: Liquidity risk involves the difficulty of purchasing or selling a security at an advantageous time or price. Portfolios that hold a smaller number of securities may be more volatile than more diversified portfolios, since gains or losses from each security will have a greater impact on the portfolio’s overall value.
Real Estate Risk: The Strategy’s investments in the real estate market have many of the same risks as direct ownership of real estate, including the risk that the value of real estate could decline due to a variety of factors that affect the real estate market generally. Investments in REITs may have additional risks. REITs are dependent on the capability of their managers, may have limited diversification, and could be significantly affected by changes in tax laws.
(Historical Performance continued on next page)
| 4 | • ALLIANCEBERNSTEIN REAL ASSET STRATEGY |
Historical Performance
HISTORICAL PERFORMANCE
(continued from previous page)
Derivatives Risk: Investing in derivative instruments such as options, futures, forwards or swaps can be riskier than traditional investments, and may be more volatile, especially in a down market.
Leverage Risk: Trying to enhance investment returns by borrowing money or using other leverage tools—magnify both gains and losses, resulting in greater volatility.
Foreign (Non-U.S.) Risk: Non-U.S. securities may be more volatile because of political, regulatory, market and economic uncertainties associated with such securities. Fluctuations in currency exchange rates may negatively affect the value of the investment or reduce returns. These risks are magnified in emerging or developing markets.
Interest Rate Risk: As interest rates rise, bond prices fall and vice versa—long-term securities tend to rise and fall more than short-term securities.
Credit Risk: A bond’s credit rating reflects the issuer’s ability to make timely payments of interest or principal—the lower the rating, the higher the risk of default. If the issuer’s financial strength deteriorates, the issuer’s rating may be lowered and the bond’s value may decline.
Commodity Risk: Commodity-linked investments may experience greater volatility than investments in traditional securities. The value of commodity-linked investments may be affected by financial factors, political developments and natural disasters.
Diversification Risk: Portfolios that hold a smaller number of securities may be more volatile than more diversified portfolios, since gains or losses from each security will have a greater impact on the portfolio’s overall value.
These risks are fully discussed in the Strategy’s prospectus.
(Historical Performance continued on next page)
| ALLIANCEBERNSTEIN REAL ASSET STRATEGY • | 5 |
Historical Performance
HISTORICAL PERFORMANCE
(continued from previous page)
THE STRATEGY VS. ITS BENCHMARK PERIODS ENDED OCTOBER 31, 2011 | NAV Returns | |||||||||
| 6 Months | 12 Months | |||||||||
AllianceBernstein Real Asset Strategy | ||||||||||
Class 1 | -12.69% | 1.25% | ||||||||
| ||||||||||
Class 2 | -12.56% | 1.50% | ||||||||
| ||||||||||
Class A | -12.65% | 1.32% | ||||||||
| ||||||||||
Class C | -12.98% | 0.61% | ||||||||
| ||||||||||
Advisor Class† | -12.62% | 1.55% | ||||||||
| ||||||||||
Class R† | -12.82% | 1.03% | ||||||||
| ||||||||||
Class K† | -12.65% | 1.33% | ||||||||
| ||||||||||
Class I† | -12.56% | 1.53% | ||||||||
| ||||||||||
MSCI AC World Commodity Producers Index (Net) | -16.39% | 1.87% | ||||||||
| ||||||||||
† Please note that these share classes are for investors purchasing shares through accounts established under certain fee-based programs sponsored and maintained by certain broker-dealers and financial intermediaries, institutional pension plans and/or investment advisory clients of, and certain other persons associated with, the Adviser and its affiliates or the Funds. | ||||||||||
See Historical Performance and Benchmark disclosures on pages 4-5.
(Historical Performance continued on next page)
| 6 | • ALLIANCEBERNSTEIN REAL ASSET STRATEGY |
Historical Performance
HISTORICAL PERFORMANCE
(continued from previous page)
GROWTH OF A $10,000 INVESTMENT IN THE STRATEGY 3/8/10* TO 10/31/11
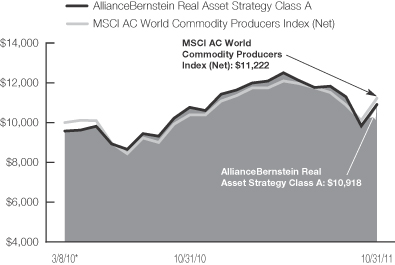
| * | Since the Strategy’s inception on 3/8/10. |
This chart illustrates the total value of an assumed $10,000 investment in AllianceBernstein Real Asset Strategy’s Class A shares (from 3/8/10* to 10/31/11) as compared to the performance of its benchmark. The chart reflects the deduction of the maximum 4.25% sales charge from the initial $10,000 investment in the Strategy and assumes the reinvestment of dividends and capital gains distributions.
See Historical Performance and Benchmark disclosures on pages 4-5.
(Historical Performance continued on next page)
| ALLIANCEBERNSTEIN REAL ASSET STRATEGY • | 7 |
Historical Performance
HISTORICAL PERFORMANCE
(continued from previous page)
| AVERAGE ANNUAL RETURNS AS OF OCTOBER 31, 2011 | ||||||||
| NAV Returns | SEC Returns | |||||||
| Class 1 Shares | ||||||||
1 Year | 1.25 | % | 1.25 | % | ||||
Since Inception* | 8.21 | % | 8.21 | % | ||||
| Class 2 Shares | ||||||||
1 Year | 1.50 | % | 1.50 | % | ||||
Since Inception* | 8.49 | % | 8.49 | % | ||||
| Class A Shares | ||||||||
1 Year | 1.32 | % | -3.00 | % | ||||
Since Inception* | 8.26 | % | 5.47 | % | ||||
| Class C Shares | ||||||||
1 Year | 0.61 | % | -0.37 | % | ||||
Since Inception* | 7.45 | % | 7.45 | % | ||||
| Advisor Class Shares** | ||||||||
1 Year | 1.55 | % | 1.55 | % | ||||
Since Inception* | 8.47 | % | 8.47 | % | ||||
| Class R Shares** | ||||||||
1 Year | 1.03 | % | 1.03 | % | ||||
Since Inception* | 7.95 | % | 7.95 | % | ||||
| Class K Shares** | ||||||||
1 Year | 1.33 | % | 1.33 | % | ||||
Since Inception* | 8.26 | % | 8.26 | % | ||||
| Class I Shares** | ||||||||
1 Year | 1.53 | % | 1.53 | % | ||||
Since Inception* | 8.51 | % | 8.51 | % | ||||
The Strategy’s prospectus fee table shows the Strategy’s total annual operating expense ratios as 8.39%, 8.14%, 7.68%, 11.21%, 8.89%, 8.66%, 8.39% and 8.11% for Class 1, Class 2, Class A, Class C, Advisor Class, Class R, Class K and Class I shares, respectively, gross of any fee waivers or expense reimbursements. Contractual fee waivers and/or expense reimbursements limit the Strategy’s annual operating expense ratios to 1.00%, 0.75%, 1.05%, 1.75%, 0.75%, 1.25%, 1.00% and 0.75% for Class 1, Class 2, Class A, Class C, Advisor Class, Class R, Class K and Class I shares, respectively. These waivers/reimbursements extend through the Strategy’s current fiscal year and may be extended by the Adviser for additional one-year terms. Absent reimbursements or waivers, performance would have been lower. The Financial Highlights section of this report sets forth expense ratio data for the current reporting period; the expense ratios shown above may differ from the expense ratios in the Financial Highlights sections since they are based on different time periods.
| * | Inception date: 3/8/10. |
| ** | These share classes are offered at net asset value (NAV) to eligible investors and their SEC returns are the same as the NAV returns. Please note that these share classes are for investors purchasing shares through accounts established under certain fee-based programs sponsored and maintained by certain broker-dealers and financial intermediaries, institutional pension plans and/or investment advisory clients of, and certain other persons associated with, the Adviser and its affiliates or the Funds. |
See Historical Performance disclosures on pages 4-5.
(Historical Performance continued on next page)
| 8 | • ALLIANCEBERNSTEIN REAL ASSET STRATEGY |
Historical Performance
HISTORICAL PERFORMANCE
(continued from previous page)
| SEC AVERAGE ANNUAL RETURNS (WITH ANY APPLICABLE SALES CHARGES) AS OF THE MOST RECENT CALENDAR QUARTER-END (SEPTEMBER 30, 2011) | ||||
| SEC Returns | ||||
| Class 1 Shares | ||||
1 Year | -3.63 | % | ||
Since Inception* | 1.74 | % | ||
| Class 2 Shares | ||||
1 Year | -3.44 | % | ||
Since Inception* | 1.99 | % | ||
| Class A Shares | ||||
1 Year | -7.78 | % | ||
Since Inception* | -1.02 | % | ||
| Class C Shares | ||||
1 Year | -5.30 | % | ||
Since Inception* | 0.99 | % | ||
| Advisor Class Shares† | ||||
1 Year | -3.37 | % | ||
Since Inception* | 2.03 | % | ||
| Class R Shares† | ||||
1 Year | -3.91 | % | ||
Since Inception* | 1.49 | % | ||
| Class K Shares† | ||||
1 Year | -3.61 | % | ||
Since Inception* | 1.75 | % | ||
| Class I Shares† | ||||
1 Year | -3.41 | % | ||
Since Inception* | 2.01 | % | ||
| * | Inception date: 3/8/10. |
| † | Please note that these share classes are for investors purchasing shares through accounts established under certain fee-based programs sponsored and maintained by certain broker-dealers and financial intermediaries, institutional pension plans and/or investment advisory clients of, and certain other persons associated with, the Adviser and its affiliates or the Funds. |
See Historical Performance disclosures on pages 4-5.
| ALLIANCEBERNSTEIN REAL ASSET STRATEGY • | 9 |
Historical Performance
FUND EXPENSES
(unaudited)
As a shareholder of a mutual fund, you may incur two types of costs: (1) transaction costs, including sales charges (loads) on purchase payments, contingent deferred sales charges on redemptions and (2) ongoing costs, including management fees; distribution (12b-1) fees; and other fund expenses. This example is intended to help you understand your ongoing costs (in dollars) of investing in the Fund and to compare these costs with the ongoing costs of investing in other mutual funds.
The Example is based on an investment of $1,000 invested at the beginning of the period and held for the entire period as indicated below.
Actual Expenses
The table below provides information about actual account values and actual expenses. You may use the information in this line, together with the amount you invested, to estimate the expenses that you paid over the period. Simply divide your account value by $1,000 (for example, an $8,600 account value divided by $1,000 = 8.6), then multiply the result by the number in the first line under the heading entitled “Expenses Paid During Period” to estimate the expenses you paid on your account during this period.
Hypothetical Example for Comparison Purposes
The table below provides information about hypothetical account values and hypothetical expenses based on the Fund’s actual expense ratio and an assumed annual rate of return of 5% before expenses, which is not the Fund’s actual return. The hypothetical account values and expenses may not be used to estimate the actual ending account balance or expenses you paid for the period. You may use this information to compare the ongoing costs of investing in the Fund and other funds by comparing this 5% hypothetical example with the 5% hypothetical examples that appear in the shareholder reports of other funds.
Please note that the expenses shown in the table are meant to highlight your ongoing costs only and do not reflect any transactional costs, such as sales charges (loads), or contingent deferred sales charges on redemptions. Therefore, the hypothetical example is useful in comparing ongoing costs only, and will not help you determine the relative total costs of owning different funds. In addition, if these transactional costs were included, your costs would have been higher.
| Beginning Account Value May 1, 2011 | Ending Account Value October 31, 2011 | Expenses Paid During Period* | Annualized Expense Ratio* | |||||||||||||
| Class A | ||||||||||||||||
Actual | $ | `1,000 | $ | 873.50 | $ | 4.96 | 1.05 | % | ||||||||
Hypothetical** | $ | 1,000 | $ | 1,019.80 | $ | 5.35 | 1.05 | % | ||||||||
| Class C | ||||||||||||||||
Actual | $ | 1,000 | $ | 870.20 | $ | 8.20 | 1.75 | % | ||||||||
Hypothetical** | $ | 1,000 | $ | 1,016.29 | $ | 8.84 | 1.75 | % | ||||||||
| Advisor Class | ||||||||||||||||
Actual | $ | 1,000 | $ | 873.80 | $ | 3.54 | 0.75 | % | ||||||||
Hypothetical** | $ | 1,000 | $ | 1,021.31 | $ | 3.82 | 0.75 | % | ||||||||
| Class R | ||||||||||||||||
Actual | $ | 1,000 | $ | 871.80 | $ | 5.90 | 1.25 | % | ||||||||
Hypothetical** | $ | 1,000 | $ | 1,018.80 | $ | 6.36 | 1.25 | % | ||||||||
| Class K | ||||||||||||||||
Actual | $ | 1,000 | $ | 873.50 | $ | 4.72 | 1.00 | % | ||||||||
Hypothetical** | $ | 1,000 | $ | 1,020.05 | $ | 5.09 | 1.00 | % | ||||||||
| 10 | • ALLIANCEBERNSTEIN REAL ASSET STRATEGY |
Fund Expenses
FUND EXPENSES
(unaudited)
(continued from previous page)
| Beginning Account Value May 1, 2011 | Ending Account Value October 31, 2011 | Expenses Paid During Period* | Annualized Expense Ratio* | |||||||||||||
| Class I | ||||||||||||||||
Actual | $ | 1,000 | $ | 874.40 | $ | 3.54 | 0.75 | % | ||||||||
Hypothetical** | $ | 1,000 | $ | 1,021.31 | $ | 3.82 | 0.75 | % | ||||||||
| Class 1 | ||||||||||||||||
Actual | $ | 1,000 | $ | 873.10 | $ | 4.72 | 1.00 | % | ||||||||
Hypothetical** | $ | 1,000 | $ | 1,020.05 | $ | 5.09 | 1.00 | % | ||||||||
| Class 2 | ||||||||||||||||
Actual | $ | 1,000 | $ | 874.40 | $ | 3.54 | 0.75 | % | ||||||||
Hypothetical** | $ | 1,000 | $ | 1,021.31 | $ | 3.82 | 0.75 | % | ||||||||
| * | Expenses are equal to the Strategy’s annualized expense ratio multiplied by the average account value over the period, multiplied by 184/365 (to reflect the one-half year period). |
| ** | Assumes 5% return before expenses. |
| ALLIANCEBERNSTEIN REAL ASSET STRATEGY • | 11 |
Fund Expenses
PORTFOLIO SUMMARY
October 31, 2011 (unaudited)
PORTFOLIO STATISTICS
Net Assets ($mil): $337.0
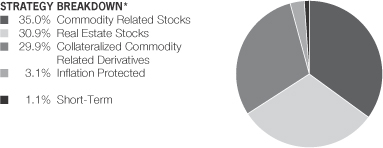
TEN LARGEST EQUITY HOLDINGS**
| Company | U.S. $ Value | Percent of Net Assets | ||||||
Exxon Mobil Corp. | $ | 12,121,442 | 3.6 | % | ||||
Royal Dutch Shell PLC | 8,291,782 | 2.5 | ||||||
Simon Property Group, Inc. | 6,657,045 | 2.0 | ||||||
BP PLC | 6,094,515 | 1.8 | ||||||
Petroleo Brasileiro SA | 5,050,242 | 1.5 | ||||||
Chevron Corp. | 4,682,078 | 1.4 | ||||||
Sun Hung Kai Properties Ltd. | 4,352,622 | 1.3 | ||||||
Unibail-Rodamco SE | 4,281,360 | 1.3 | ||||||
Rio Tinto PLC | 4,203,485 | 1.2 | ||||||
ConocoPhillips | 3,945,673 | 1.2 | ||||||
| $ | 59,680,244 | 17.8 | % | |||||
| * | All data are as of October 31, 2011. The Strategy breakdown is expressed as an approximate percentage of the Strategy’s total investments inclusive of derivative exposure, based on the Adviser’s internal classification guidelines. |
| ** | Long-term investments. |
| 12 | • ALLIANCEBERNSTEIN REAL ASSET STRATEGY |
Portfolio Summary and Ten Largest Equity Holdings
CONSOLIDATED PORTFOLIO OF INVESTMENTS
October 31, 2011
| Company | Shares | U.S. $ Value | ||||||
| ||||||||
COMMON STOCKS – 65.2% | ||||||||
Energy – 22.7% | ||||||||
Coal & Consumable Fuels – 0.3% | ||||||||
Banpu PCL | 50,300 | $ | 1,036,356 | |||||
|
| |||||||
Integrated Oil & Gas – 17.2% | ||||||||
BG Group PLC | 130,850 | 2,837,353 | ||||||
BP PLC | 828,190 | 6,094,515 | ||||||
Chevron Corp. | 44,570 | 4,682,078 | ||||||
China Petroleum & Chemical Corp. – Class H | 2,478,000 | 2,340,368 | ||||||
ConocoPhillips | 56,650 | 3,945,673 | ||||||
Exxon Mobil Corp. | 155,224 | 12,121,442 | ||||||
Gazprom OAO (Sponsored ADR) | 338,160 | 3,926,038 | ||||||
LUKOIL OAO (London) (Sponsored ADR) | 39,920 | 2,303,384 | ||||||
Petroleo Brasileiro SA (ADR) | 135,320 | 3,654,993 | ||||||
Petroleo Brasileiro SA (Sponsored ADR) | 55,170 | 1,395,249 | ||||||
PTT PCL | 104,200 | 1,036,917 | ||||||
Royal Dutch Shell PLC (Euronext Amsterdam) – Class A | 174,748 | 6,196,498 | ||||||
Royal Dutch Shell PLC – Class B | 58,400 | 2,095,284 | ||||||
Suncor Energy, Inc. (Toronto) | 101,180 | 3,222,940 | ||||||
Total SA | 38,510 | 2,009,345 | ||||||
|
| |||||||
| 57,862,077 | ||||||||
|
| |||||||
Oil & Gas Drilling – 0.9% | ||||||||
Seadrill Ltd. | 44,440 | 1,472,297 | ||||||
Transocean Ltd./Switzerland | 26,770 | 1,529,906 | ||||||
|
| |||||||
| 3,002,203 | ||||||||
|
| |||||||
Oil & Gas Equipment & Services – 0.4% | ||||||||
Schlumberger Ltd. | 16,020 | 1,176,989 | ||||||
|
| |||||||
Oil & Gas Exploration & Production – 3.4% | ||||||||
Anadarko Petroleum Corp. | 38,120 | 2,992,420 | ||||||
Devon Energy Corp. | 30,950 | 2,010,203 | ||||||
EOG Resources, Inc. | 19,610 | 1,753,722 | ||||||
Nexen, Inc. (Toronto) | 66,163 | 1,123,792 | ||||||
Noble Energy, Inc. | 16,150 | 1,442,841 | ||||||
Occidental Petroleum Corp. | 9,510 | 883,859 | ||||||
Penn West Petroleum Ltd. | 43,713 | 781,067 | ||||||
Stone Energy Corp.(a) | 24,250 | 589,033 | ||||||
|
| |||||||
| 11,576,937 | ||||||||
|
| |||||||
Oil & Gas Refining & Marketing – 0.5% | ||||||||
Marathon Petroleum Corp. | 49,985 | 1,794,461 | ||||||
|
| |||||||
| 76,449,023 | ||||||||
|
| |||||||
Equity: Other – 12.4% | ||||||||
Diversified/Specialty – 10.7% | ||||||||
American Assets Trust, Inc. | 21,400 | 433,778 | ||||||
BioMed Realty Trust, Inc. | 105,340 | 1,907,707 | ||||||
British Land Co. PLC | 181,532 | 1,485,135 | ||||||
Dexus Property Group | 1,118,834 | 995,271 | ||||||
Digital Realty Trust, Inc. | 42,640 | 2,657,751 | ||||||
Dundee Real Estate Investment Trust | 47,800 | 1,582,543 | ||||||
| ALLIANCEBERNSTEIN REAL ASSET STRATEGY • | 13 |
Consolidated Portfolio of Investments
| Company | Shares | U.S. $ Value | ||||||
| ||||||||
Fonciere Des Regions | 8,150 | $ | 600,611 | |||||
Forest City Enterprises, Inc.(a) | 39,695 | 543,028 | ||||||
Hysan Development Co., Ltd. | 217,199 | 753,791 | ||||||
Kerry Properties Ltd. | 246,500 | 904,638 | ||||||
Land Securities Group PLC | 948 | 10,375 | ||||||
Lend Lease Group | 58,630 | 477,032 | ||||||
Mitsubishi Estate Co., Ltd. | 101,000 | 1,710,639 | ||||||
Mitsui Fudosan Co., Ltd. | 230,000 | 3,824,964 | ||||||
Overseas Union Enterprise Ltd. | 317,000 | 581,967 | ||||||
Rayonier, Inc. | 13,350 | 557,095 | ||||||
Soho China Ltd. | 2,006,000 | 1,422,580 | ||||||
Sumitomo Realty & Development Co., Ltd. | 79,000 | 1,637,443 | ||||||
Sun Hung Kai Properties Ltd. | 317,000 | 4,352,622 | ||||||
Telecity Group PLC(a) | 132,267 | 1,267,195 | ||||||
Tokyu Land Corp. | 125,000 | 526,206 | ||||||
Unibail-Rodamco SE | 21,535 | 4,281,360 | ||||||
UOL Group Ltd. | 223,000 | 788,358 | ||||||
Weyerhaeuser Co. | 33,800 | 607,724 | ||||||
Wharf Holdings Ltd. | 300,000 | 1,595,773 | ||||||
Wheelock & Co., Ltd. | 120,000 | 352,570 | ||||||
|
| |||||||
| 35,858,156 | ||||||||
|
| |||||||
Health Care – 1.4% | ||||||||
Health Care REIT, Inc. | 35,850 | 1,888,936 | ||||||
Ventas, Inc. | 50,000 | 2,780,500 | ||||||
|
| |||||||
| 4,669,436 | ||||||||
|
| |||||||
Triple Net – 0.3% | ||||||||
Entertainment Properties Trust | 24,510 | 1,098,048 | ||||||
|
| |||||||
| 41,625,640 | ||||||||
|
| |||||||
Materials – 10.7% | ||||||||
Aluminum – 0.6% | ||||||||
Alcoa, Inc. | 194,200 | 2,089,592 | ||||||
|
| |||||||
Diversified Metals & Mining – 2.7% | ||||||||
BHP Billiton Ltd. | 18,790 | 735,527 | ||||||
BHP Billiton PLC | 69,480 | 2,187,889 | ||||||
Borneo Lumbung Energi & Metal Tbk PT(a) | 9,686,500 | 1,112,578 | ||||||
Exxaro Resources Ltd. | 19,800 | 443,882 | ||||||
Rio Tinto Ltd. | 5,400 | 387,688 | ||||||
Rio Tinto PLC | 77,700 | 4,203,485 | ||||||
|
| |||||||
| 9,071,049 | ||||||||
|
| |||||||
Fertilizers & Agricultural Chemicals – 1.0% | ||||||||
Agrium, Inc. (Toronto) | 10,800 | 890,438 | ||||||
Monsanto Co. | 22,900 | 1,665,975 | ||||||
Potash Corp. of Saskatchewan, Inc. | 17,470 | 826,855 | ||||||
|
| |||||||
| 3,383,268 | ||||||||
|
| |||||||
Gold – 2.3% | ||||||||
Goldcorp, Inc. | 50,470 | 2,455,776 | ||||||
IAMGOLD Corp. | 77,700 | 1,670,540 | ||||||
Kinross Gold Corp. | 121,920 | 1,738,132 | ||||||
| 14 | • ALLIANCEBERNSTEIN REAL ASSET STRATEGY |
Consolidated Portfolio of Investments
| Company | Shares | U.S. $ Value | ||||||
| ||||||||
Koza Altin Isletmeleri AS | 66,246 | $ | 908,429 | |||||
New Gold, Inc.(a) | 58,700 | 727,309 | ||||||
Real Gold Mining Ltd. | 124,500 | 95,561 | ||||||
|
| |||||||
| 7,595,747 | ||||||||
|
| |||||||
Paper Products – 0.2% | ||||||||
Mondi PLC(b) | 105,600 | 803,158 | ||||||
|
| |||||||
Specialty Chemicals – 0.7% | ||||||||
Koninklijke DSM NV | 23,660 | 1,210,726 | ||||||
LyondellBasell Industries NV | 36,010 | 1,183,289 | ||||||
|
| |||||||
| 2,394,015 | ||||||||
|
| |||||||
Steel – 3.2% | ||||||||
ArcelorMittal (Euronext Amsterdam) | 102,780 | 2,130,940 | ||||||
Commercial Metals Co. | 99,620 | 1,238,277 | ||||||
JFE Holdings, Inc. | 105,600 | 2,009,838 | ||||||
OneSteel Ltd. | 831,347 | 1,057,287 | ||||||
ThyssenKrupp AG | 51,130 | 1,464,801 | ||||||
Vale SA (Sponsored ADR) (Local Preference Shares) | 120,020 | 2,832,472 | ||||||
|
| |||||||
| 10,733,615 | ||||||||
|
| |||||||
| 36,070,444 | ||||||||
|
| |||||||
Retail – 6.5% | ||||||||
Regional Mall – 4.3% | ||||||||
CapitaMall Trust | 780,000 | 1,158,906 | ||||||
CFS Retail Property Trust | 665,200 | 1,268,066 | ||||||
General Growth Properties, Inc. | 131,740 | 1,936,578 | ||||||
Glimcher Realty Trust | 140,173 | 1,283,985 | ||||||
Multiplan Empreendimentos Imobiliarios SA | 40,500 | 819,035 | ||||||
Simon Property Group, Inc. | 51,830 | 6,657,045 | ||||||
Westfield Group | 199,025 | 1,602,227 | ||||||
|
| |||||||
| 14,725,842 | ||||||||
|
| |||||||
Shopping Center/Other Retail – 2.2% | ||||||||
Corio NV | 10,420 | 529,527 | ||||||
Excel Trust, Inc. | 52,520 | 551,985 | ||||||
Hammerson PLC | 202,260 | 1,321,385 | ||||||
Klepierre | 28,250 | 880,543 | ||||||
Link REIT (The) | 567,664 | 1,949,495 | ||||||
Tanger Factory Outlet Centers | 30,030 | 845,645 | ||||||
Weingarten Realty Investors | 54,753 | 1,270,817 | ||||||
|
| |||||||
| 7,349,397 | ||||||||
|
| |||||||
| 22,075,239 | ||||||||
|
| |||||||
Residential – 5.1% | ||||||||
Multi-Family – 2.6% | ||||||||
BRE Properties, Inc. | 10,500 | 526,260 | ||||||
Camden Property Trust | 8,325 | 504,828 | �� | |||||
Colonial Properties Trust | 27,450 | 556,686 | ||||||
Essex Property Trust, Inc. | 11,050 | 1,577,498 | ||||||
GSW Immobilien AG(a) | 28,216 | 916,710 | ||||||
Mid-America Apartment Communities, Inc. | 16,225 | 1,012,440 | ||||||
| ALLIANCEBERNSTEIN REAL ASSET STRATEGY • | 15 |
Consolidated Portfolio of Investments
| Company | Shares | U.S. $ Value | ||||||
| ||||||||
PDG Realty SA Empreendimentos e Participacoes | 98,400 | $ | 433,869 | |||||
Post Properties, Inc. | 27,350 | 1,123,538 | ||||||
Rossi Residencial SA | 126,000 | 796,284 | ||||||
Stockland | 402,370 | 1,328,708 | ||||||
|
| |||||||
| 8,776,821 | ||||||||
|
| |||||||
Self Storage – 1.9% | ||||||||
Big Yellow Group PLC | 307,509 | 1,291,301 | ||||||
Extra Space Storage, Inc. | 60,850 | 1,370,950 | ||||||
Public Storage | 21,855 | 2,820,388 | ||||||
Sovran Self Storage, Inc. | 17,810 | 787,202 | ||||||
|
| |||||||
| 6,269,841 | ||||||||
|
| |||||||
Student Housing – 0.6% | ||||||||
American Campus Communities, Inc. | 56,300 | 2,191,759 | ||||||
|
| |||||||
| 17,238,421 | ||||||||
|
| |||||||
Office – 3.9% | ||||||||
Office – 3.9% | ||||||||
Allied Properties Real Estate Investment Trust | 21,100 | 511,861 | ||||||
Boston Properties, Inc. | 25,140 | 2,488,609 | ||||||
Castellum AB | 85,930 | 1,163,308 | ||||||
Cominar Real Estate Investment Trust | 45,987 | 1,041,311 | ||||||
Douglas Emmett, Inc. | 99,450 | 1,939,275 | ||||||
Duke Realty Corp. | 111,600 | 1,370,448 | ||||||
Great Portland Estates PLC | 225,800 | 1,349,847 | ||||||
Hongkong Land Holdings Ltd. | 119,000 | 625,349 | ||||||
Hufvudstaden AB – Class A | 48,787 | 529,289 | ||||||
Kilroy Realty Corp. | 25,853 | 948,547 | ||||||
SL Green Realty Corp. | 15,964 | 1,101,356 | ||||||
|
| |||||||
| 13,069,200 | ||||||||
|
| |||||||
Lodging – 2.0% | ||||||||
Lodging – 2.0% | ||||||||
Ashford Hospitality Trust, Inc. | 149,137 | 1,327,320 | ||||||
Great Eagle Holdings Ltd. | 348,000 | 767,585 | ||||||
Host Hotels & Resorts, Inc. | 15,930 | 227,321 | ||||||
InnVest Real Estate Investment Trust | 86,314 | 356,773 | ||||||
Intercontinental Hotels Group PLC | 76,100 | 1,404,505 | ||||||
LaSalle Hotel Properties | 35,690 | 853,348 | ||||||
Pebblebrook Hotel Trust | 16,600 | 315,898 | ||||||
RLJ Lodging Trust | 34,071 | 504,932 | ||||||
Wyndham Worldwide Corp. | 30,500 | 1,026,935 | ||||||
|
| |||||||
| 6,784,617 | ||||||||
|
| |||||||
Food Beverage & Tobacco – 1.0% | ||||||||
Agricultural Products – 0.6% | ||||||||
Bunge Ltd. | 34,850 | 2,152,685 | ||||||
|
| |||||||
Packaged Foods & Meats – 0.4% | ||||||||
Tyson Foods, Inc. – Class A | 61,520 | 1,187,336 | ||||||
|
| |||||||
| 3,340,021 | ||||||||
|
| |||||||
| 16 | • ALLIANCEBERNSTEIN REAL ASSET STRATEGY |
Consolidated Portfolio of Investments
| Company | Shares | U.S. $ Value | ||||||
| ||||||||
Industrials – 0.9% | ||||||||
Industrial Warehouse Distribution – 0.4% | ||||||||
Ascendas Real Estate Investment Trust | 123,000 | $ | 200,114 | |||||
EastGroup Properties, Inc. | 18,920 | 825,101 | ||||||
Global Logistic Properties Ltd.(a) | 376,000 | 523,516 | ||||||
|
| |||||||
| 1,548,731 | ||||||||
|
| |||||||
Mixed Office Industrial – 0.5% | ||||||||
Goodman Group | 2,453,930 | 1,594,664 | ||||||
|
| |||||||
| 3,143,395 | ||||||||
|
| |||||||
Total Common Stocks | 219,796,000 | |||||||
|
| |||||||
| Principal Amount (000) | ||||||||
INFLATION-LINKED SECURITIES – 32.1% | ||||||||
United States – 32.1% | ||||||||
U.S. Treasury Inflation Index | ||||||||
0.625%, 4/15/13 (TIPS) | $ | 10,932 | 11,192,161 | |||||
1.25%, 4/15/14 (TIPS) | 12,143 | 12,855,349 | ||||||
1.875%, 7/15/13 (TIPS) | 15,392 | 16,221,032 | ||||||
2.00%, 4/15/12 (TIPS)(d) | 13,822 | 13,956,259 | ||||||
3.00%, 7/15/12 (TIPS)(d) | 20,657 | 21,262,085 | ||||||
3.375%, 1/15/12 (TIPS)(c)(d) | 32,267 | 32,473,955 | ||||||
|
| |||||||
Total Inflation-Linked Securities | 107,960,841 | |||||||
|
| |||||||
| Contracts | ||||||||
OPTIONS PURCHASED - PUTS – 0.2% | ||||||||
Aluminum HG Futures | 105 | 329,533 | ||||||
Copper London Metal Exchange Futures | 30 | 316,209 | ||||||
S+P 500 Index Futures | 51 | 109,140 | ||||||
|
| |||||||
Total Options Purchased - Puts | 754,882 | |||||||
|
| |||||||
| Shares | ||||||||
SHORT-TERM INVESTMENTS – 0.9% | ||||||||
Investment Companies – 0.9% | ||||||||
AllianceBernstein Fixed-Income Shares, Inc. – Government STIF Portfolio, 0.09%(g) | 2,944,283 | 2,944,283 | ||||||
|
| |||||||
Total Investments – 98.4% | 331,456,006 | |||||||
Other assets less liabilities – 1.6% | 5,554,160 | |||||||
|
| |||||||
Net Assets – 100.0% | $ | 337,010,166 | ||||||
|
| |||||||
| ALLIANCEBERNSTEIN REAL ASSET STRATEGY • | 17 |
Consolidated Portfolio of Investments
FUTURES CONTRACTS (see Note D)
| Type | Number of Contracts | Expiration Month | Original Value | Value at October 31, 2011 | Unrealized Appreciation/ (Depreciation) | |||||||||||||||
Purchased Contracts |
| |||||||||||||||||||
Aluminum HG Futures | 11 | November 2011 | $ | 709,029 | $ | 605,620 | $ | (103,409 | ) | |||||||||||
Copper London Metal Exchange Futures | 7 | November 2011 | 1,250,292 | 1,397,550 | 147,258 | |||||||||||||||
Corn Futures | 63 | December 2011 | 2,214,077 | 2,038,050 | (176,027 | ) | ||||||||||||||
Gasoline RBOB Futures | 6 | January 2012 | 639,073 | 653,965 | 14,892 | |||||||||||||||
Lean Hogs Futures | 19 | December 2011 | 660,331 | 664,810 | 4,479 | |||||||||||||||
Lean Hogs Futures | 17 | February 2012 | 614,447 | 614,380 | (67 | ) | ||||||||||||||
Live Cattle Futures | 42 | December 2011 | 2,029,960 | 1,992,480 | (37,480 | ) | ||||||||||||||
Live Cattle Futures | 39 | February 2012 | 1,946,168 | 1,893,450 | (52,718 | ) | ||||||||||||||
Natural Gas Futures | 6 | December 2011 | 252,238 | 243,360 | (8,878 | ) | ||||||||||||||
Nickel Futures | 3 | November 2011 | 433,506 | 352,062 | (81,444 | ) | ||||||||||||||
Platinum Futures | 77 | January 2012 | 6,747,129 | 6,189,260 | (557,869 | ) | ||||||||||||||
Sugar 11 Futures | 12 | March 2012 | 377,530 | 346,349 | (31,181 | ) | ||||||||||||||
Sold Contracts |
| |||||||||||||||||||
Aluminum HG Futures | 11 | November 2011 | 653,667 | 605,618 | 48,049 | |||||||||||||||
Coffee C Futures | 11 | December 2011 | 956,630 | 936,169 | 20,461 | |||||||||||||||
Copper London Metal Exchange Futures | 7 | November 2011 | 1,568,181 | 1,397,550 | 170,631 | |||||||||||||||
Copper London Metal Exchange Futures | 14 | December 2011 | 2,504,020 | 2,797,550 | (293,530 | ) | ||||||||||||||
Gold 100 OZ Futures | 29 | December 2011 | 4,896,464 | 5,003,080 | (106,616 | ) | ||||||||||||||
Nickel Futures | 3 | November 2011 | 391,230 | 352,062 | 39,168 | |||||||||||||||
Soybean Oil Futures | 6 | January 2012 | 178,506 | 185,148 | (6,642 | ) | ||||||||||||||
Wheat Futures | 93 | December 2011 | 3,523,551 | 2,921,363 | 602,188 | |||||||||||||||
|
| |||||||||||||||||||
| $ | (408,735 | ) | ||||||||||||||||||
|
| |||||||||||||||||||
FORWARD CURRENCY EXCHANGE CONTRACTS (see Note D)
| Counterparty & Description | Contract Amount (000) | U.S. $ Value on Origination Date | U.S. $ Value at October 31, 2011 | Unrealized Appreciation/ (Depreciation) | ||||||||||||
Buy Contracts |
| |||||||||||||||
Barclays Bank PLC Wholesale: | ||||||||||||||||
Euro settling 12/15/11 | 546 | $ | 727,370 | $ | 755,221 | $ | 27,851 | |||||||||
Great British Pound settling 12/15/11 | 1,157 | 1,807,951 | 1,859,508 | 51,557 | ||||||||||||
Hong Kong Dollar settling 12/15/11 | 11,949 | 1,536,193 | 1,538,464 | 2,271 | ||||||||||||
Japanese Yen settling 12/15/11 | 106,947 | 1,400,361 | 1,369,082 | (31,279 | ) | |||||||||||
| 18 | • ALLIANCEBERNSTEIN REAL ASSET STRATEGY |
Consolidated Portfolio of Investments
| Counterparty & Description | Contract Amount (000) | U.S. $ Value on Origination Date | U.S. $ Value at October 31, 2011 | Unrealized Appreciation/ (Depreciation) | ||||||||||||
Citibank N.A.: | ||||||||||||||||
Japanese Yen settling 12/15/11 | 84,273 | $ | 1,098,950 | $ | 1,078,821 | $ | (20,129 | ) | ||||||||
South African Rand settling 11/18/11 | 21,408 | 2,731,497 | 2,691,311 | (40,186 | ) | |||||||||||
Credit Suisse London Branch (GFX): | ||||||||||||||||
Euro settling 12/15/11 | 4,760 | 6,757,519 | 6,583,968 | (173,551 | ) | |||||||||||
Deutsche Bank AG London: | ||||||||||||||||
Brazilian Real settling 11/18/11 | 1,885 | 1,061,792 | 1,093,864 | 32,072 | ||||||||||||
Great British Pound settling 12/15/11 | 682 | 1,099,793 | 1,096,097 | (3,696 | ) | |||||||||||
Mexican Nuevo Peso settling 11/18/11 | 10,500 | 777,559 | 786,781 | 9,222 | ||||||||||||
Morgan Stanley and Co., Inc.: | ||||||||||||||||
Euro settling 12/15/11 | 935 | 1,344,408 | 1,293,279 | (51,129 | ) | |||||||||||
Great British Pound settling 12/15/11 | 1,482 | 2,444,263 | 2,381,842 | (62,421 | ) | |||||||||||
Royal Bank of Scotland PLC: | ||||||||||||||||
Canadian Dollar settling 12/15/11 | 1,191 | 1,199,154 | 1,193,683 | (5,471 | ) | |||||||||||
Chinese Yuan Renminbi settling 12/15/11 | 68,075 | 10,730,612 | 10,713,951 | (16,661 | ) | |||||||||||
Great British Pound settling 12/15/11 | 510 | 806,667 | 819,662 | 12,995 | ||||||||||||
Standard Chartered Bank: | ||||||||||||||||
Chinese Yuan Renminbi settling 12/15/11 | 23,843 | 3,737,147 | 3,752,518 | 15,371 | ||||||||||||
Chinese Yuan Renminbi settling 12/15/11 | 5,296 | 832,573 | 833,508 | 935 | ||||||||||||
Malaysian Ringgit settling 11/18/11 | 2,611 | 836,725 | 850,245 | 13,520 | ||||||||||||
South Korean Won settling 11/18/11 | 931,615 | 805,025 | 839,646 | 34,621 | ||||||||||||
State Street Bank and Trust Co.: | ||||||||||||||||
Australian Dollar settling 12/15/11 | 6,640 | 6,837,872 | 6,961,608 | 123,736 | ||||||||||||
Japanese Yen settling 12/15/11 | 204,423 | 2,610,600 | 2,616,922 | 6,322 | ||||||||||||
Norwegian Krone settling 12/15/11 | 5,819 | 1,053,102 | 1,042,630 | (10,472 | ) | |||||||||||
Singapore Dollar settling 12/15/11 | 2,598 | 2,132,357 | 2,070,460 | (61,897 | ) | |||||||||||
Swedish Krona settling 12/15/11 | 4,738 | 728,134 | 725,313 | (2,821 | ) | |||||||||||
Swiss Franc settling 12/15/11 | 1,550 | 2,029,141 | 1,767,009 | (262,132 | ) | |||||||||||
UBS AG: | ||||||||||||||||
Chinese Yuan Renminbi settling 12/15/11 | 5,883 | 924,056 | 925,893 | 1,837 | ||||||||||||
Westpac Banking Corp.: | ||||||||||||||||
Canadian Dollar settling 12/15/11 | 894 | 847,719 | 896,014 | 48,295 | ||||||||||||
| ALLIANCEBERNSTEIN REAL ASSET STRATEGY • | 19 |
Consolidated Portfolio of Investments
| Counterparty & Description | Contract Amount (000) | U.S. $ Value on Origination Date | U.S. $ Value at October 31, 2011 | Unrealized Appreciation/ (Depreciation) | ||||||||||||
Sale Contracts |
| |||||||||||||||
Barclays Bank PLC Wholesale: | ||||||||||||||||
Chinese Yuan Renminbi settling 12/15/11 | 10,135 | $ | 1,584,336 | $ | 1,595,091 | $ | (10,755 | ) | ||||||||
Russian Rubles settling 11/18/11 | 30,330 | 976,026 | 997,187 | (21,161 | ) | |||||||||||
Citibank N.A.: | ||||||||||||||||
Canadian Dollar settling 12/15/11 | 1,383 | 1,315,827 | 1,386,115 | (70,288 | ) | |||||||||||
Euro settling 12/15/11 | 859 | 1,219,144 | 1,188,157 | 30,987 | ||||||||||||
Euro settling 12/15/11 | 2,471 | 3,371,680 | 3,417,854 | (46,174 | ) | |||||||||||
Japanese Yen settling 12/15/11 | 69,889 | 911,157 | 894,685 | 16,472 | ||||||||||||
Russian Rubles settling 11/18/11 | 32,038 | 1,023,327 | 1,053,343 | (30,016 | ) | |||||||||||
Credit Suisse London Branch (GFX): | ||||||||||||||||
Great British Pound settling 12/15/11 | 1,706 | 2,819,199 | 2,741,850 | 77,349 | ||||||||||||
Japanese Yen settling 12/15/11 | 89,581 | 1,160,045 | 1,146,771 | 13,274 | ||||||||||||
Deutsche Bank AG London: | ||||||||||||||||
Canadian Dollar settling 12/15/11 | 1,019 | 994,317 | 1,021,295 | (26,978 | ) | |||||||||||
Great British Pound settling 12/15/11 | 541 | 851,326 | 869,485 | (18,159 | ) | |||||||||||
Swedish Krona settling 12/15/11 | 4,738 | 719,222 | 725,313 | (6,091 | ) | |||||||||||
Goldman Sachs International: | ||||||||||||||||
Brazilian Real settling 11/18/11 | 3,844 | 2,175,439 | 2,230,671 | (55,232 | ) | |||||||||||
Euro settling 12/15/11 | 1,192 | 1,576,492 | 1,648,759 | (72,267 | ) | |||||||||||
Morgan Stanley and Co., Inc.: | ||||||||||||||||
Australian Dollar settling 12/15/11 | 6,640 | 6,934,916 | 6,961,609 | (26,693 | ) | |||||||||||
Euro settling 12/15/11 | 651 | 921,744 | 900,454 | 21,290 | ||||||||||||
Royal Bank of Canada: | ||||||||||||||||
Euro settling 12/15/11 | 659 | 904,036 | 911,520 | (7,484 | ) | |||||||||||
Royal Bank of Scotland PLC: | ||||||||||||||||
Norwegian Krone settling 12/15/11 | 5,819 | 1,067,060 | 1,042,630 | 24,430 | ||||||||||||
Standard Chartered Bank: | ||||||||||||||||
Canadian Dollar settling 12/15/11 | 7,272 | 7,363,864 | 7,288,381 | 75,483 | ||||||||||||
Euro settling 12/15/11 | 4,194 | 5,727,243 | 5,801,085 | (73,842 | ) | |||||||||||
Singapore Dollar settling 12/15/11 | 968 | 757,742 | 771,442 | (13,700 | ) | |||||||||||
State Street Bank and Trust Co.: | ||||||||||||||||
Australian Dollar settling 12/15/11 | 1,237 | 1,298,726 | 1,296,914 | 1,812 | ||||||||||||
Australian Dollar settling 12/15/11 | 805 | 840,814 | 843,990 | (3,176 | ) | |||||||||||
Euro settling 12/15/11 | 5,134 | 7,260,914 | 7,101,280 | 159,634 | ||||||||||||
Euro settling 12/15/11 | 814 | 1,109,588 | 1,125,914 | (16,326 | ) | |||||||||||
Great British Pound settling 12/15/11 | 885 | 1,441,408 | 1,422,355 | 19,053 | ||||||||||||
Great British Pound settling 12/15/11 | 724 | 1,154,353 | 1,163,599 | (9,246 | ) | |||||||||||
Great British Pound settling 12/15/11 | 791 | 1,237,646 | 1,271,280 | (33,634 | ) | |||||||||||
Hong Kong Dollar settling 12/15/11 | 11,949 | 1,532,110 | 1,538,464 | (6,354 | ) | |||||||||||
Japanese Yen settling 12/15/11 | 97,084 | 1,263,605 | 1,242,822 | 20,783 | ||||||||||||
Thailand Baht settling 11/18/11 | 27,621 | 893,074 | 896,999 | (3,925 | ) | |||||||||||
|
| |||||||||||||||
| $ | (452,174 | ) | ||||||||||||||
|
| |||||||||||||||
| 20 | • ALLIANCEBERNSTEIN REAL ASSET STRATEGY |
Consolidated Portfolio of Investments
TOTAL RETURN SWAP CONTRACTS ON INDICES (see Note D)
Receive/ Total Return on | Index | # of Shares or Units | Rate Paid the Fund | Notional Amount (000) | Maturity Date | Counterparty | Unrealized Appreciation/ (Depreciation) | |||||||||||||||||
Receive | Dow Jones- UBS 3 Month Forward Grains Excess Return Commodity Index | 27,969 | 0.30 | % | $ | 2,901 | 12/15/11 | Citibank, N.A. | $ | (16,643 | ) | |||||||||||||
Receive | Dow Jones- UBS Commodity Index 2 Month Forward | 11,576 | 0.20 | 3,628 | 11/15/11 | Citibank, N.A. | 57,131 | |||||||||||||||||
Receive | Dow Jones- UBS Commodity Index 2 Month Forward | 208,565 | 0.20 | 65,368 | 12/15/11 | Citibank, N.A. | 1,029,336 | |||||||||||||||||
Receive | Dow Jones- UBS Commodity Index 2 Month Forward | 11,291 | 0.20 | 3,450 | 12/15/11 | Citibank, N.A. | 144,528 | |||||||||||||||||
Receive | Dow Jones- UBS Commodity Index 2 Month Forward | 7,688 | 0.20 | 2,410 | 12/15/11 | Citibank, N.A. | 37,943 | |||||||||||||||||
Receive | Dow Jones- UBS Commodity Index 2 Month Forward | 7,133 | 0.20 | 2,236 | 12/15/11 | Citibank, N.A. | 35,204 | |||||||||||||||||
Receive | Dow Jones- UBS Commodity Index 2 Month Forward | 4,221 | 0.20 | 1,323 | 12/15/11 | Citibank, N.A. | 20,832 | |||||||||||||||||
| ALLIANCEBERNSTEIN REAL ASSET STRATEGY • | 21 |
Consolidated Portfolio of Investments
Receive/ Total Return on | Index | # of Shares or Units | Rate Paid the Fund | Notional Amount (000) | Maturity Date | Counterparty | Unrealized Appreciation/ (Depreciation) | |||||||||||||||||
Receive | Dow Jones- UBS Commodity Index 2 Month Forward | 3,213 | 0.20 | % | $ | 1,007 | 12/15/11 | Citibank, N.A. | $ | 15,868 | ||||||||||||||
Receive | Dow Jones- UBS Commodity Index 2 Month Forward | 2,820 | 0.20 | 884 | 12/15/11 | Citibank, N.A. | 13,382 | |||||||||||||||||
Receive | Dow Jones- UBS Commodity Index 2 Month Forward | 2,674 | 0.20 | 838 | 12/15/11 | Citibank, N.A. | 13,197 | |||||||||||||||||
Receive | Dow Jones- UBS Commodity Index | 65,283 | 0.13 | 9,607 | 12/15/11 | JPMorgan Chase Bank, N.A. | 151,110 | |||||||||||||||||
Receive | Dow Jones- UBS Commodity Index | 41,044 | 0.13 | 6,043 | 12/15/11 | JPMorgan Chase Bank, N.A. | 91,988 | |||||||||||||||||
Receive | Dow Jones- UBS Commodity Index | 4,404 | 0.13 | 648 | 12/15/11 | JPMorgan Chase Bank, N.A. | 10,194 | |||||||||||||||||
|
| |||||||||||||||||||||||
| $ | 1,604,070 | |||||||||||||||||||||||
|
| |||||||||||||||||||||||
PUT OPTIONS WRITTEN (see Note D)
| Description | Contracts(e) | Exercise Price | Expiration Month | U.S. $ Value | ||||||||||||
CopperLondon Metal Exchange Futures | 30 | 8,000.00 | December 2011 | $ | 316,209 | |||||||||||
Aluminum HG Futures | 105 | 2,300.00 | December 2011 | 329,533 | ||||||||||||
|
| |||||||||||||||
(premium received $1,239,997) | $ | 645,742 | ||||||||||||||
|
| |||||||||||||||
| (a) | Non-income producing security. |
| (b) | When-Issued or delayed delivery security. |
| (c) | Position, or a portion thereof, has been segregated to collateralize margin requirements for open futures contracts. The market value of the collateral amounted to $2,222,435. |
| (d) | Position, or a portion thereof, has been segregated to collateralize total return swaps. The aggregate market value of these securities amounted to $6,261,909. |
| (e) | One contract relates to 25 shares. |
| 22 | • ALLIANCEBERNSTEIN REAL ASSET STRATEGY |
Consolidated Portfolio of Investments
| (f) | One contract relates to 100 shares. |
| (g) | Investment in affiliated money market mutual fund. The rate shown represents the 7-day yield as of period end. |
Glossary:
ADR – American Depositary Receipt
REIT – Real Estate Investment Trust
TIPS – Treasury Inflation Protected Security
See notes to consolidated financial statements.
| ALLIANCEBERNSTEIN REAL ASSET STRATEGY • | 23 |
Consolidated Portfolio of Investments
CONSOLIDATED STATEMENT OF ASSETS & LIABILITIES
October 31, 2011
| Assets | ||||
Investments in securities, at value | ||||
Unaffiliated issuers (cost $334,147,149) | $ | 328,511,723 | ||
Affiliated issuers (cost $2,944,283) | 2,944,283 | (a) | ||
Cash | 2,090,481 | |||
Foreign currencies, at value (cost $830,519) | 829,656 | |||
Receivable for investment securities sold and foreign currency transactions | 11,747,841 | |||
Receivable for capital stock sold | 2,929,301 | |||
Unrealized appreciation on total return swap contracts | 1,620,713 | |||
Interest and dividends receivable | 891,177 | |||
Unrealized appreciation of forward currency exchange contracts | 841,172 | |||
Receivable due from Adviser | 26,727 | |||
Receivable for variation margin on futures contracts | 24,067 | |||
|
| |||
Total assets | 352,457,141 | |||
|
| |||
| Liabilities | ||||
Options written, at value (premium received $1,239,997) | 645,742 | |||
Payable for investment securities purchased and foreign currency transactions | 10,631,775 | |||
Collateral received from broker | 2,140,000 | |||
Unrealized depreciation of forward currency exchange contracts | 1,293,346 | |||
Payable for capital stock redeemed | 487,010 | |||
Distribution fee payable | 62,715 | |||
Unrealized depreciation on total return swap contracts | 16,643 | |||
Transfer Agent fee payable | 8,236 | |||
Accrued expenses and other liabilities | 161,508 | |||
|
| |||
Total liabilities | 15,446,975 | |||
|
| |||
Net Assets | $ | 337,010,166 | ||
|
| |||
| Composition of Net Assets | ||||
Capital stock, at par | $ | 305,557 | ||
Additional paid-in capital | 350,781,782 | |||
Undistributed net investment income | 1,120,945 | |||
Accumulated net realized loss on investment | (10,874,174 | ) | ||
Net unrealized depreciation on investments | (4,323,944 | ) | ||
|
| |||
| $ | 337,010,166 | |||
|
|
Net Asset Value Per Share—24 billion shares of capital stock authorized, $.01 par value
| Class | Net Assets | Shares Outstanding | Net Asset Value | |||||||||
| A | $ | 70,081,196 | 6,343,769 | $ | 11.05 | * | ||||||
| ||||||||||||
| C | $ | 17,413,853 | 1,593,554 | $ | 10.93 | |||||||
| ||||||||||||
| Advisor | $ | 50,794,859 | 4,582,544 | $ | 11.08 | |||||||
| ||||||||||||
| R | $ | 11,341 | 1,029 | $ | 11.02 | |||||||
| ||||||||||||
| K | $ | 128,389 | 11,621 | $ | 11.05 | |||||||
| ||||||||||||
| I | $ | 15,850,073 | 1,431,460 | $ | 11.07 | |||||||
| ||||||||||||
| 1 | $ | 182,719,382 | 16,590,716 | $ | 11.01 | |||||||
| ||||||||||||
| 2 | $ | 11,073 | 1,000 | $ | 11.07 | |||||||
| ||||||||||||
| * | The maximum offering price per share for Class A shares was $11.54 which reflects a sales charge of 4.25%. |
| (a) | Includes investment of cash collateral of $2,140,000 received from broker for total return swap contracts. |
See notes to consolidated financial statements.
| 24 | • ALLIANCEBERNSTEIN REAL ASSET STRATEGY |
Consolidated Statement of Assets & Liabilities
CONSOLIDATED STATEMENT OF OPERATIONS
Year Ended October 31, 2011
| Investment Income | ||||||||
Dividends | ||||||||
Unaffiliated issuers (net of foreign taxes withheld of $131,222) | $ | 2,562,163 | ||||||
Affiliated issuers | 3,433 | |||||||
Interest | 1,308,879 | $ | 3,874,475 | |||||
|
| |||||||
| Expenses | ||||||||
Management fee (see Note B) | 1,204,973 | |||||||
Distribution fee—Class A | 115,785 | |||||||
Distribution fee—Class C | 96,327 | |||||||
Distribution fee—Class R | 58 | |||||||
Distribution fee—Class K | 106 | |||||||
Distribution fee—Class 1 | 192,499 | |||||||
Transfer agency—Class A | 20,187 | |||||||
Transfer agency—Class C | 5,060 | |||||||
Transfer agency—Advisor Class | 13,551 | |||||||
Transfer agency—Class R | 9 | |||||||
Transfer agency—Class K | 65 | |||||||
Transfer agency—Class I | 1,375 | |||||||
Transfer agency—Class 1 | 25,852 | |||||||
Transfer agency—Class 2 | 2,366 | |||||||
Custodian | 237,163 | |||||||
Registration fees | 199,225 | |||||||
Amortization of offering expenses | 163,994 | |||||||
Administrative | 72,866 | |||||||
Audit | 68,804 | |||||||
Legal | 61,121 | |||||||
Printing | 57,382 | |||||||
Directors’ fees | 10,932 | |||||||
Miscellaneous | 20,769 | |||||||
|
| |||||||
Total expenses | 2,570,469 | |||||||
Less: expenses waived and reimbursed by the Adviser (see Note B) | (960,721 | ) | ||||||
|
| |||||||
Net expenses | 1,609,748 | |||||||
|
| |||||||
Net investment income | 2,264,727 | |||||||
|
| |||||||
| Realized and Unrealized Gain (Loss) on Investment and Foreign Currency Transactions | ||||||||
Net realized loss on: | ||||||||
Investment transactions | (11,218,947 | )(a) | ||||||
Futures contracts | (623,320 | ) | ||||||
Swap contracts | (9,561,354 | ) | ||||||
Foreign currency transactions | (392,089 | ) | ||||||
Net change in unrealized appreciation/depreciation of: | ||||||||
Investments | (6,659,973 | )(b) | ||||||
Futures contracts | (375,074 | ) | ||||||
Options written | 594,255 | |||||||
Swap contracts | 1,558,565 | |||||||
Foreign currency denominated assets and liabilities | (477,844 | ) | ||||||
|
| |||||||
Net loss on investment and foreign currency transactions | (27,155,781 | ) | ||||||
|
| |||||||
Net Decrease in Net Assets from Operations | $ | (24,891,054 | ) | |||||
|
|
| (a) | Net of foreign capital gains taxes of $421. |
| (b) | Net of increase in accrued foreign capital gains taxes of $57. |
See notes to consolidated financial statements.
| ALLIANCEBERNSTEIN REAL ASSET STRATEGY • | 25 |
Consolidated Statement of Operations
CONSOLIDATED STATEMENT OF CHANGES IN NET ASSETS
| Year Ended October 31, 2011 | March 8, 2010(a) to October 31, 2010 | |||||||
| Increase (Decrease) in Net Assets from Operations | ||||||||
Net investment income | $ | 2,264,727 | $ | 134,727 | ||||
Net realized gain (loss) on investment and foreign currency transactions | (21,795,710 | ) | 262,604 | |||||
Net change in unrealized appreciation/depreciation of investments and foreign currency denominated assets and liabilities | (5,360,071 | ) | 1,036,127 | |||||
Contributions from Adviser (see Note B) | – 0 | – | 289 | |||||
|
|
|
| |||||
Net increase (decrease) in net assets from operations | (24,891,054 | ) | 1,433,747 | |||||
| Dividends to Shareholders from | ||||||||
Net investment income | ||||||||
Class A | (92,210 | ) | – 0 | – | ||||
Class C | (20,530 | ) | – 0 | – | ||||
Advisor Class | (45,116 | ) | – 0 | – | ||||
Class R | (328 | ) | – 0 | – | ||||
Class K | (351 | ) | – 0 | – | ||||
Class I | (374 | ) | – 0 | – | ||||
Class 1 | (35,343 | ) | – 0 | – | ||||
Class 2 | (367,410 | ) | – 0 | – | ||||
| Capital Stock Transactions | ||||||||
Net increase | 348,866,052 | 12,163,083 | ||||||
|
|
|
| |||||
Total increase | 323,413,336 | 13,596,830 | ||||||
| Net Assets | ||||||||
Beginning of period | 13,596,830 | – 0 | – | |||||
|
|
|
| |||||
End of period (including undistributed net investment income of $1,120,945 and $205,073, respectively) | $ | 337,010,166 | $ | 13,596,830 | ||||
|
|
|
| |||||
| (a) | Commencement of operations. |
See notes to consolidated financial statements.
| 26 | • ALLIANCEBERNSTEIN REAL ASSET STRATEGY |
Consolidated Statement of Changes in Net Assets
NOTES TO CONSOLIDATED FINANCIAL STATEMENTS
October 31, 2011
NOTE A
Significant Accounting Policies
AllianceBernstein Bond Fund, Inc. (the “Fund”) is registered under the Investment Company Act of 1940 as a diversified, open-end management investment company. The Fund, which is a Maryland corporation, operates as a series company currently comprised of four portfolios: the Intermediate Bond Portfolio, the Bond Inflation Strategy Portfolio, the Municipal Bond Inflation Strategy Portfolio and the Real Asset Strategy Portfolio (the “Strategy”). The Intermediate Bond Portfolio commenced operations on July 1, 1999. The Bond Inflation Strategy and Municipal Bond Inflation Strategy commenced operations on January 26, 2010. As part of the Strategy’s investment strategy, the Strategy seeks to gain exposure to commodities and commodities-related instruments and derivatives primarily through investments in AllianceBernstein Cayman Inflation Strategy, Ltd., a wholly-owned subsidiary of the Strategy organized under the laws of the Cayman Islands (the “Subsidiary”). The Strategy and the Subsidiary commenced operations on March 8, 2010. The Subsidiary was incorporated on February 1, 2010. The Strategy is the sole shareholder of the Subsidiary and it is intended that the Strategy will remain the sole shareholder and will continue to control the Subsidiary. Under the Articles of Association of the Subsidiary, shares issued by the Subsidiary confer upon a shareholder the right to receive notice of, to attend and to vote at general meetings of the Subsidiary and shall confer upon the shareholder rights in a winding-up or repayment of capital and the right to participate in the profits or assets of the Subsidiary. As of October 31, 2011, net assets of the Strategy were $337,010,166, of which $53,795,200, or approximately 16%, represented the Strategy’s ownership of all issued shares and voting rights of the Subsidiary. This report presents the consolidated financial statements of AllianceBernstein Real Asset Strategy and the Subsidiary. All intercompany transactions and balances have been eliminated in consolidation. The Strategy offers Class A, Class C, Advisor Class, Class R, Class K, Class I, Class 1 and Class 2. Class 1 shares are sold only to the private clients of Sanford C. Bernstein & Co. LLC by its registered representatives. Class A shares are sold with a front-end sales charge of up to 4.25% for purchases not exceeding $1,000,000. With respect to purchases of $1,000,000 or more, Class A shares redeemed within one year of purchase may be subject to a contingent deferred sales charge of 1%. Class C shares are subject to a contingent deferred sales charge of 1% on redemptions made within the first year after purchase. Class R, Class K, and Class 1 shares are sold without an initial or contingent deferred sales charge. Advisor Class, Class I, and Class 2 shares are sold without an initial or contingent deferred sales charge and are not subject to ongoing distribution expenses. All eight classes of shares have identical voting, dividend, liquidation and other rights, except that the classes bear different distribution and transfer agency expenses. Each class has exclusive voting rights with respect to its distribution plan. The consolidated financial statements have been prepared in conformity with U.S. generally accepted accounting principles (“U.S. GAAP”) which require management to make certain estimates and assumptions that affect the reported amounts of assets and liabilities in the
| ALLIANCEBERNSTEIN REAL ASSET STRATEGY • | 27 |
Notes to Consolidated Financial Statements
consolidated financial statements and amounts of income and expenses during the reporting period. Actual results could differ from those estimates. The following is a summary of significant accounting policies followed by the Strategy.
1. Security Valuation
Portfolio securities are valued at their current market value determined on the basis of market quotations or, if market quotations are not readily available or are deemed unreliable, at “fair value” as determined in accordance with procedures established by and under the general supervision of the Fund’s Board of Directors.
In general, the market value of securities which are readily available and deemed reliable are determined as follows: Securities listed on a national securities exchange (other than securities listed on the NASDAQ Stock Market, Inc. (“NASDAQ”)) or on a foreign securities exchange are valued at the last sale price at the close of the exchange or foreign securities exchange. If there has been no sale on such day, the securities are valued at the mean of the closing bid and ask prices on such day. Securities listed on more than one exchange are valued by reference to the principal exchange on which the securities are traded; securities listed only on NASDAQ are valued in accordance with the NASDAQ Official Closing Price; listed or over the counter market (“OTC”) put or call options are valued at the mid level between the current bid and ask prices. If either a current bid or current ask price is unavailable, AllianceBernstein L.P. (the “Adviser”) will have discretion to determine the best valuation (e.g. last trade price); open futures contracts and options thereon are valued using the closing settlement price or, in the absence of such a price, the most recent quoted bid price. If there are no quotations available for the day of valuation, the last available closing settlement price is used; U.S. government securities and other debt instruments having 60 days or less remaining until maturity are valued at amortized cost if their original maturity was 60 days or less; or by amortizing their fair value as of the 61st day prior to maturity if their original term to maturity exceeded 60 days; fixed-income securities, including mortgage backed and asset backed securities, may be valued on the basis of prices provided by a pricing service or at a price obtained from one or more of the major broker/dealers. In cases where broker/dealer quotes are obtained, the Adviser may establish procedures whereby changes in market yields or spreads are used to adjust, on a daily basis, a recently obtained quoted price on a security; and swaps and other derivatives are valued daily, primarily using independent pricing services, independent pricing models using market inputs, as well as third party broker-dealers or counterparties, which are approved by the Board of Directors. Investments in money market funds are valued at their net asset value each day.
Securities for which market quotations are not readily available (including restricted securities) or are deemed unreliable are valued at fair value. Factors considered in making this determination may include, but are not limited to, information obtained by contacting the issuer, analysts, analysis of the issuer’s
| 28 | • ALLIANCEBERNSTEIN REAL ASSET STRATEGY |
Notes to Consolidated Financial Statements
financial statements or other available documents. In addition, the Strategy may use fair value pricing for securities primarily traded in non-U.S. markets because most foreign markets close well before the Strategy values its securities at 4:00 p.m., Eastern Time. The earlier close of these foreign markets gives rise to the possibility that significant events, including broad market moves, may have occurred in the interim and may materially affect the value of those securities.
2. Fair Value Measurements
In accordance with U.S. GAAP regarding fair value measurements, fair value is defined as the price that the Strategy would receive to sell an asset or pay to transfer a liability in an orderly transaction between market participants at the measurement date. The U.S. GAAP disclosure requirements establish a framework for measuring fair value, and a three-level hierarchy for fair value measurements based upon the transparency of inputs to the valuation of an asset or liability. Inputs may be observable or unobservable and refer broadly to the assumptions that market participants would use in pricing the asset or liability. Observable inputs reflect the assumptions market participants would use in pricing the asset or liability based on market data obtained from sources independent of the Strategy. Unobservable inputs reflect the Strategy’s own assumptions about the assumptions that market participants would use in pricing the asset or liability based on the best information available in the circumstances. Each investment is assigned a level based upon the observability of the inputs which are significant to the overall valuation. The three-tier hierarchy of inputs is summarized below.
| • | Level 1—quoted prices in active markets for identical investments |
| • | Level 2—other significant observable inputs (including quoted prices for similar investments, interest rates, prepayment speeds, credit risk, etc.) |
| • | Level 3—significant unobservable inputs (including the Strategy’s own assumptions in determining the fair value of investments) |
The following table summarizes the valuation of the Strategy’s investments by the above fair value hierarchy levels as of October 31, 2011:
Investments in Securities: | Level 1 | Level 2 | Level 3 | Total | ||||||||||||
Assets: | ||||||||||||||||
Common Stocks | ||||||||||||||||
Energy | $ | 52,802,387 | $ | 22,609,719 | $ | 1,036,917 | $ | 76,449,023 | ||||||||
Equity:Other | 14,057,110 | 27,568,530 | – 0 | – | 41,625,640 | |||||||||||
Materials | 18,322,645 | 17,747,799 | – 0 | – | 36,070,444 | |||||||||||
Retail | 13,365,090 | 8,710,149 | – 0 | – | 22,075,239 | |||||||||||
Residential | 13,701,702 | 3,536,719 | – 0 | – | 17,238,421 | |||||||||||
Office | 9,401,407 | 3,667,793 | – 0 | – | 13,069,200 | |||||||||||
Lodging | 4,612,527 | 2,172,090 | – 0 | – | 6,784,617 | |||||||||||
Food Beverage & Tobacco | 3,340,021 | – 0 | – | – 0 | – | 3,340,021 | ||||||||||
Industrials | 825,101 | 2,318,294 | – 0 | – | 3,143,395 | |||||||||||
Inflation-Linked Securities | – 0 | – | 107,960,841 | – 0 | – | 107,960,841 | ||||||||||
Options Purchased – Puts | – 0 | – | 754,882 | – 0 | – | 754,882 | ||||||||||
Short-Term Investments | 2,944,283 | – 0 | – | – 0 | – | 2,944,283 | ||||||||||
|
|
|
|
|
|
|
| |||||||||
Total Investments in Securities | 133,372,273 | 197,046,816 | + | 1,036,917 | 331,456,006 | |||||||||||
| ALLIANCEBERNSTEIN REAL ASSET STRATEGY • | 29 |
Notes to Consolidated Financial Statements
Investments in Securities: | Level 1 | Level 2 | Level 3 | Total | ||||||||||||
Other Financial Instruments*: | ||||||||||||||||
Assets: | ||||||||||||||||
Futures Contracts | 1,047,126 | – 0 | – | – 0 | – | 1,047,126 | # | |||||||||
Forward Currency Exchange Contracts | – 0 | – | 841,172 | – 0 | – | 841,172 | ||||||||||
Total Return Swap Contracts | – 0 | – | 1,620,713 | – 0 | – | 1,620,713 | ||||||||||
Liabilities: | ||||||||||||||||
Futures Contracts | (1,455,861 | ) | – 0 | – | – 0 | – | (1,455,861 | )# | ||||||||
Forward Currency Exchange Contracts | – 0 | – | (1,293,346 | ) | – 0 | – | (1,293,346 | ) | ||||||||
Total Return Swap Contracts | – 0 | – | (16,643 | ) | – 0 | – | (16,643 | ) | ||||||||
Put Options Written | – 0 | – | (645,742 | ) | – 0 | – | (645,742 | ) | ||||||||
|
|
|
|
|
|
|
| |||||||||
Total | $ | 132,963,538 | $ | 197,552,970 | $ | 1,036,917 | $ | 331,553,425 | ||||||||
|
|
|
|
|
|
|
| |||||||||
| * | Other financial instruments are derivative instruments, such as futures, forwards and swap contracts, which are valued at the unrealized appreciation/depreciation on the instrument. Other financial instruments may also include options written which are valued at market value. |
| + | A significant portion of the Strategy’s foreign equity investments are categorized as Level 2 investments since they are valued using fair value prices based on third party vendor modeling tools to the extent available, see Note A.1. |
| # | Only variation margin receivable/payable at period end is reported within the consolidated statement of assets and liabilities. This amount reflects cumulative appreciation/(depreciation) of futures contracts as reported in the consolidated portfolio of investments. |
Following is a reconciliation of investments in which significant unobservable inputs (Level 3) were used in determining fair value. The transfers between levels of the fair value hierarchy assumes the financial instrument was transferred at the beginning of the reporting period.
| Energy | Warrants | Total | ||||||||||
Balance as of 10/31/10 | $ | 15,160 | $ | 33,191 | $ | 48,351 | ||||||
Accrued discounts/(premiums) | – 0 | – | (43 | ) | (43 | ) | ||||||
Realized gain (loss) | 1,721 | (388,743 | ) | (387,022 | ) | |||||||
Change in unrealized appreciation/depreciation | (147,720 | ) | (294 | ) | (148,014 | ) | ||||||
Purchases | 1,193,742 | 1,342,442 | 2,536,184 | |||||||||
Sales | (25,986 | ) | (986,553 | ) | (1,012,539 | ) | ||||||
Transfers in to Level 3 | – 0 | – | – 0 | – | – 0 | – | ||||||
Transfers out of Level 3 | – 0 | – | – 0 | – | – 0 | – | ||||||
|
|
|
|
|
| |||||||
Balance as of 10/31/11 | $ | 1,036,917 | $ | – 0 | – | $ | 1,036,917 | |||||
|
|
|
|
|
| |||||||
Net change in unrealized appreciation/depreciation from Investments held as of 10/31/11* | $ | (147,720 | ) | $ | – 0 | – | $ | (147,720 | ) | |||
| * | The unrealized appreciation/depreciation is included in net change in unrealized appreciation/depreciation of investments in the accompanying consolidated statement of operations. |
3. Currency Translation
Assets and liabilities denominated in foreign currencies and commitments under forward currency exchange contracts are translated into U.S. dollars at the mean of the quoted bid and asked prices of such currencies against the U.S. dollar.
| 30 | • ALLIANCEBERNSTEIN REAL ASSET STRATEGY |
Notes to Consolidated Financial Statements
Purchases and sales of portfolio securities are translated into U.S. dollars at the rates of exchange prevailing when such securities were acquired or sold. Income and expenses are translated into U.S. dollars at rates of exchange prevailing when accrued.
Net realized gain or loss on foreign currency transactions represents foreign exchange gains and losses from sales and maturities of foreign fixed income investments, foreign currency exchange contracts, holding of foreign currencies, currency gains or losses realized between the trade and settlement dates on foreign investment transactions, and the difference between the amounts of dividends, interest and foreign withholding taxes recorded on the Strategy’s books and the U.S. dollar equivalent amounts actually received or paid. Net unrealized currency gains and losses from valuing foreign currency denominated assets and liabilities at period end exchange rates are reflected as a component of net unrealized appreciation or depreciation of investments and foreign currency denominated assets and liabilities.
4. Taxes
It is the Strategy’s policy to meet the requirements of the Internal Revenue Code applicable to regulated investment companies and to distribute all of its investment company taxable income and net realized gains, if any, to shareholders. Therefore, no provisions for federal income or excise taxes are required. The Strategy may be subject to taxes imposed by countries in which it invests. Such taxes are generally based on income and/or capital gains earned or repatriated. Taxes are accrued and applied to net investment income, net realized gains and net unrealized appreciation/depreciation as such income and/or gains are earned.
If, during a taxable year, the Subsidiary’s taxable losses (and other deductible items) exceed its income and gains, the net loss will not pass through to the Strategy as a deductible amount for Federal income tax purposes. Note that the loss from the Subsidiary’s contemplated activities also cannot be carried forward to reduce future Subsidiary’s income in subsequent years. However, if the Subsidiary’s taxable gains exceed its losses and other deductible items during a taxable year, the net gain will pass through to the Strategy as income for Federal income tax purposes.
In accordance with U.S. GAAP requirements regarding accounting for uncertainties in income taxes, management has analyzed the Strategy’s tax positions taken or expected to be taken on federal and state income tax returns for all open tax years (all years since inception of the Strategy) and has concluded that no provision for income tax is required in the Strategy’s financial statements.
| ALLIANCEBERNSTEIN REAL ASSET STRATEGY • | 31 |
Notes to Consolidated Financial Statements
5. Investment Income and Investment Transactions
Dividend income is recorded on the ex-dividend date or as soon as the Strategy is informed of the dividend. Interest income is accrued daily. Investment transactions are accounted for on the date the securities are purchased or sold. Investment gains or losses are determined on the identified cost basis. The Strategy amortizes premiums and accretes discounts as adjustments to interest income.
6. Class Allocations
All income earned and expenses incurred by the Strategy are borne on a pro-rata basis by each outstanding class of shares, based on the proportionate interest in the Strategy represented by the net assets of such class, except for class specific expenses which are allocated to the respective class. Expenses of the Fund are charged to each Strategy in proportion to net assets. Realized and unrealized gains and losses are allocated among the various share classes based on respective net assets.
7. Dividends and Distributions
Dividends and distributions to shareholders, if any, are recorded on the ex-dividend date. Income dividends and capital gains distributions are determined in accordance with federal tax regulations and may differ from those determined in accordance with U.S. GAAP. To the extent these differences are permanent, such amounts are reclassified within the capital accounts based on their federal tax basis treatment; temporary differences do not require such reclassification.
8. Offering Expenses
Offering expenses of $337,025 have been deferred and are being amortized on a straight line basis over a one year period starting from March 8, 2010 (commencement of operations).
NOTE B
Management Fee and Other Transactions with Affiliates
Under the terms of the investment advisory agreement, the Strategy pays the Adviser an advisory fee at an annual rate of .75% of the Strategy’s average daily net assets. The Adviser has agreed to waive its fees and bear certain expenses to the extent necessary to limit total operating expenses on an annual basis to 1.05%, 1.75%, 0.75%, 1.25%, 1.00%, 0.75%, 1.00% and 0.75% of daily average net assets for Class A, Class C, Advisor Class, Class R, Class K, Class I, Class 1 and Class 2 shares, respectively. Under the agreement, fees waived and expenses borne by the Adviser are subject to repayment by the Strategy until March 8, 2013. No repayment will be made that would cause the Strategy’s total annualized operating expenses to exceed the net fee percentage set forth above or would exceed the amount of offering expenses as recorded by the Strategy on or before March 8, 2011. This fee waiver and/or expense reimbursement agreement may not be terminated before March 1, 2012, after which it may be
| 32 | • ALLIANCEBERNSTEIN REAL ASSET STRATEGY |
Notes to Consolidated Financial Statements
terminated by either party. For the year ended October 31, 2011, the amount of such fees waived was $887,855, that is subject to repayment, not to exceed the amount of offering expenses.
The Subsidiary has entered into a separate agreement with the Adviser for the management of the Subsidiary’s portfolio. The Adviser receives no compensation from the Subsidiary for its services under the agreement.
During the year ended October 31, 2010, the Adviser reimbursed the Strategy $289 for trading losses incurred due to a trade entry error.
Pursuant to the investment advisory agreement, the Strategy may reimburse the Adviser for certain legal and accounting services provided to the Strategy by the Adviser. For the year ended October 31, 2011, the Adviser voluntarily waived such fee in the amount of $72,866.
The Strategy compensates AllianceBernstein Investor Services, Inc. (“ABIS”), a wholly-owned subsidiary of the Adviser, under a Transfer Agency Agreement for providing personnel and facilities to perform transfer agency services for the Strategy. ABIS may make payments to intermediaries that provide omnibus account services, sub-accounting services and/or networking services. Such compensation retained by ABIS amounted to $29,579 for the year ended October 31, 2011.
AllianceBernstein Investments, Inc. (the “Distributor”), a wholly-owned subsidiary of the Adviser, serves as the distributor of the Strategy’s shares. The Distributor has advised the Strategy that it has retained front-end sales charges of $46,956 from the sale of Class A shares and received $0 and $2,017 in contingent deferred sales charges imposed upon redemptions by shareholders of Class A and Class C shares, respectively, for the year ended October 31, 2011.
The Strategy may invest in the AllianceBernstein Fixed-Income Shares, Inc. – Government STIF Portfolio (“Government STIF Portfolio”), an open-end management investment company managed by the Adviser. The Government STIF Portfolio is offered as a cash management option to mutual funds and other institutional accounts of the Adviser, and is not available for direct purchase by members of the public. The Government STIF Portfolio pays no investment management fees but does bear its own expenses. A summary of the Portfolio’s transactions in shares of the Government STIF Portfolio for the year ended October 31, 2011 is as follows:
Market Value October 31, 2010 (000) | Purchases at Cost (000) | Sales Proceeds (000) | Market Value October 31, 2011 (000) | Dividend Income (000) | ||||||||||||
| $ 323 | $ | 106,115 | $ | 103,494 | $ | 2,944 | $ | 3 | ||||||||
| ALLIANCEBERNSTEIN REAL ASSET STRATEGY • | 33 |
Notes to Consolidated Financial Statements
Brokerage commissions paid on investment transactions for the year ended October 31, 2011 amounted to $320,171, of which $0 and $2,181, respectively, was paid to Sanford C. Bernstein & Co. LLC and Sanford C. Bernstein Limited, affiliates of the Adviser.
NOTE C
Distribution Services Agreement
The Strategy has adopted a Distribution Services Agreement (the “Agreement”) pursuant to Rule 12b-1 under the Investment Company Act of 1940. Under the Agreement, the Strategy pays distribution and servicing fees to AllianceBernstein Investments, Inc. (the “Distributor”) at an annual rate of up to .30% of the Strategy’s average daily net assets attributable to Class A shares, 1% of the Strategy’s average daily net assets attributable to Class C shares, .50% of the Strategy’s average daily net assets attributable to Class R shares , .25% of the Strategy’s average daily net assets attributable to Class K shares and .25% of the Strategy’s average daily net assets attributable to Class 1 shares. There are no distribution and servicing fees on the Advisor Class, Class I, and Class 2 shares. The fees are accrued daily and paid monthly. The Agreement provides that the Distributor will use such payments in their entirety for distribution assistance and promotional activities. Since the commencement of the Strategy’s operations, the Distributor has incurred expenses in excess of the distribution costs reimbursed by the Strategy in the amounts of $166,003, $13,871, $13,971 and $646,963 for Class C, Class R, Class K and Class 1 shares, respectively. While such costs may be recovered from the Strategy in future periods so long as the Agreement is in effect, the rate of the distribution and servicing fees payable under the Agreement may not be increased without a shareholder vote. In accordance with the Agreement, there is no provision for recovery of unreimbursed distribution costs incurred by the Distributor beyond the current fiscal year for Class A shares. The Agreement also provides that the Adviser may use its own resources to finance the distribution of the Strategy’s shares.
NOTE D
Investment Transactions
Purchases and sales of investment securities (excluding short-term investments) for the year ended October 31, 2011 were as follows:
| Purchases | Sales | |||||||
Investment securities (excluding U.S. government securities) | $ | 328,825,150 | $ | 100,259,335 | ||||
U.S. government securities | 194,975,721 | 89,850,272 | ||||||
| 34 | • ALLIANCEBERNSTEIN REAL ASSET STRATEGY |
Notes to Consolidated Financial Statements
The cost of investments for federal income tax purposes, gross unrealized appreciation and unrealized depreciation (excluding futures and swap transactions) are as follows:
Cost | $ | 350,365,792 | ||
|
| |||
Gross unrealized appreciation | $ | 163,855 | ||
Gross unrealized depreciation | (17,019,814 | ) | ||
|
| |||
Net unrealized depreciation | $ | (16,855,959 | ) | |
|
|
1. Derivative Financial Instruments
The Strategy may use derivatives to earn income and enhance returns, to hedge or adjust the risk profile of its portfolio, to replace more traditional direct investments, or to obtain exposure to otherwise inaccessible markets.
The principal types of derivatives utilized by the Strategy, as well as the methods in which they may be used are:
| • | Futures Contracts |
The Strategy may buy or sell futures contracts for the purpose of hedging its portfolio against adverse effects of anticipated movements in the market or for investment purposes. The Strategy bears the market risk that arises from changes in the value of these instruments and the imperfect correlation between movements in the price of the futures contracts and movements in the price of the securities hedged or used for cover. The Strategy may also purchase or sell futures contracts for foreign currencies or options thereon for non-hedging purposes as a means of making direct investment in foreign currencies, as described below under “Currency Transactions”.
At the time the Strategy enters into a futures contract, the Strategy deposits and maintains as collateral an initial margin with the broker, as required by the exchange on which the transaction is effected. Pursuant to the contract, the Strategy agrees to receive from or pay to the broker an amount of cash equal to the daily fluctuation in the value of the contract. Such receipts or payments are known as variation margin and are recorded by the Strategy as unrealized gains or losses. Risks may arise from the potential inability of a counterparty to meet the terms of the contract. The credit/counterparty risk for exchange-traded futures contracts is generally less than privately negotiated futures contracts, since the clearinghouse, which is the issuer or counterparty to each exchange-traded future, provides a guarantee of performance. This guarantee is supported by a daily payment system (i.e., margin requirements). When the contract is closed, the Strategy records a realized gain or loss equal to the difference between the value of the contract at the time it was opened and the time it was closed.
| ALLIANCEBERNSTEIN REAL ASSET STRATEGY • | 35 |
Notes to Consolidated Financial Statements
Use of long futures contracts subjects the Strategy to risk of loss in excess of the amounts shown on the consolidated statement of assets and liabilities, up to the notional value of the futures contracts. Use of short futures contracts subjects the Strategy to unlimited risk of loss. Under some circumstances, futures exchanges may establish daily limits on the amount that the price of a futures contract can vary from the previous day’s settlement price, which could effectively prevent liquidation of unfavorable positions.
During the year ended October 31, 2011, the Strategy held futures contracts for hedging and non-hedging purposes.
| • | Forward Currency Exchange Contracts |
The Strategy may enter into forward currency exchange contracts in order to hedge its exposure to changes in foreign currency exchange rates on its foreign portfolio holdings, to hedge certain firm purchase and sale commitments denominated in foreign currencies and for non-hedging purposes as a means of making direct investments in foreign currencies, as described below under “Currency Transactions”.
A forward currency exchange contract is a commitment to purchase or sell a foreign currency at a future date at a negotiated forward rate. The gain or loss arising from the difference between the original contract and the closing of such contract would be included in net realized gain or loss on foreign currency transactions. Fluctuations in the value of open forward currency exchange contracts are recorded for financial reporting purposes as unrealized appreciation and/or depreciation by the Strategy. Risks may arise from the potential inability of a counterparty to meet the terms of a contract and from unanticipated movements in the value of a foreign currency relative to the U.S. dollar. The face or contract amount, in U.S. dollars reflects the total exposure the Strategy has in that particular currency contract.
During the year ended October 31, 2011, the Strategy held forward currency exchange contracts for hedging and non-hedging purposes.
| • | Option Transactions |
For hedging and investment purposes, the Strategy may purchase and write (sell) put and call options on U.S. and foreign securities, including government securities, and foreign currencies that are traded on U.S. and foreign securities exchanges and over-the-counter markets. The Strategy may also use options transactions for non-hedging purposes as a means of making direct investments in foreign currencies, as described below under “Currency Transactions”.
The risk associated with purchasing an option is that the Strategy pays a premium whether or not the option is exercised. Additionally, the Strategy bears the risk of loss of the premium and change in market value
| 36 | • ALLIANCEBERNSTEIN REAL ASSET STRATEGY |
Notes to Consolidated Financial Statements
should the counterparty not perform under the contract. Put and call options purchased are accounted for in the same manner as portfolio securities. The cost of securities acquired through the exercise of call options is increased by premiums paid. The proceeds from securities sold through the exercise of put options are decreased by the premiums paid.
When the Strategy writes an option, the premium received by the Strategy is recorded as a liability and is subsequently adjusted to the current market value of the option written. Premiums received from written options which expire unexercised are recorded by the Strategy on the expiration date as realized gains from options written. The difference between the premium received and the amount paid on effecting a closing purchase transaction, including brokerage commissions, is also treated as a realized gain, or if the premium received is less than the amount paid for the closing purchase transaction, as a realized loss. If a call option is exercised, the premium received is added to the proceeds from the sale of the underlying security or currency in determining whether the Strategy has realized a gain or loss. If a put option is exercised, the premium received reduces the cost basis of the security or currency purchased by the Strategy. In writing an option, the Strategy bears the market risk of an unfavorable change in the price of the security or currency underlying the written option. Exercise of an option written by the Strategy could result in the Strategy selling or buying a security or currency at a price different from the current market value.
During the year ended October 31, 2011, the Strategy held options for hedging and non-hedging purposes.
For the year ended October 31, 2011, the Strategy had the following transactions in written options:
| Number of Contracts | Premiums Received | |||||||
Options written outstanding as of 10/31/10 | – 0 | – | $ | – 0 | – | |||
Options written | 135 | 1,239,997 | ||||||
Options expired | – 0 | – | – 0 | – | ||||
Options bought back | – 0 | – | – 0 | – | ||||
Options exercised | – 0 | – | – 0 | – | ||||
|
|
|
| |||||
Options written outstanding as of 10/31/11 | 135 | $ | 1,239,997 | |||||
|
|
|
| |||||
| • | Swap Agreements |
The Strategy may enter into swaps to hedge its exposure to interest rates, credit risk, equity markets and currencies. The Strategy may also enter into swaps for non-hedging purposes as a means of gaining market exposures, making direct investments in foreign currencies, as described below under “Currency Transactions” or in order to take a “long” or “short” position with respect to an underlying referenced asset described below under “Total Return Swaps”. A swap is an agreement that obligates
| ALLIANCEBERNSTEIN REAL ASSET STRATEGY • | 37 |
Notes to Consolidated Financial Statements
two parties to exchange a series of cash flows at specified intervals based upon or calculated by reference to changes in specified prices or rates for a specified amount of an underlying asset. The payment flows are usually netted against each other, with the difference being paid by one party to the other. In addition, collateral may be pledged or received by the Strategy in accordance with the terms of the respective swap agreements to provide value and recourse to the Strategy or its counterparties in the event of default, bankruptcy or insolvency by one of the parties to the swap agreement.
Risks may arise as a result of the failure of the counterparty to the swap contract to comply with the terms of the swap contract. The loss incurred by the failure of a counterparty is generally limited to the net interim payment to be received by the Strategy, and/or the termination value at the end of the contract. Therefore, the Strategy considers the creditworthiness of each counterparty to a swap contract in evaluating potential counterparty risk. This risk is mitigated by having a netting arrangement between the Strategy and the counterparty and by the posting of collateral by the counterparty to the Strategy to cover the Strategy’s exposure to the counterparty. Additionally, risks may arise from unanticipated movements in interest rates or in the value of the underlying securities. The Strategy accrues for the interim payments on swap contracts on a daily basis, with the net amount recorded within unrealized appreciation/depreciation of swap contracts on the consolidated statement of assets and liabilities, where applicable. Once the interim payments are settled in cash, the net amount is recorded as realized gain/(loss) on swaps on the consolidated statement of operations, in addition to any realized gain/(loss) recorded upon the termination of swap contracts. Fluctuations in the value of swap contracts are recorded as a component of net change in unrealized appreciation/depreciation of swap contracts on the consolidated statement of operations.
Total Return Swaps:
The Strategy may enter into total return swaps in order take a “long” or “short” position with respect to an underlying referenced asset. The Strategy is subject to market price volatility of the underlying referenced asset. A total return swap involves commitments to pay interest in exchange for a market linked return based on a notional amount. To the extent that the total return of the security, group of securities or index underlying the transaction exceeds or falls short of the offsetting interest obligation, the Strategy will receive a payment from or make a payment to the counterparty.
During the year ended October 31, 2011, the Strategy held total return swaps for hedging and non-hedging purposes.
| 38 | • ALLIANCEBERNSTEIN REAL ASSET STRATEGY |
Notes to Consolidated Financial Statements
Documentation governing the Strategy’s swap transactions may contain provisions for early termination of a swap in the event the net assets of the Strategy decline below specific levels set forth in the documentation (“net asset contingent features”). If these levels are triggered, the Strategy’s counterparty has the right to terminate the swap and require the Strategy to pay or receive a settlement amount in connection with the terminated swap transaction. As of October 31, 2011, the Strategy had total return swap contracts in liability positions with net asset contingent features. The fair value of such total return swaps amounted to $16,643 at October 31, 2011.
At October 31, 2011, the Strategy had entered into the following derivatives:
Asset Derivatives | Liability Derivatives | |||||||||||
Derivative Type | Statement of | Fair Value | Statement of | Fair Value | ||||||||
Foreign exchange contracts |
Unrealized appreciation of forward currency exchange contracts |
$ |
841,172 |
|
Unrealized depreciation of forward currency exchange contracts |
$ |
1,293,346 |
| ||||
Commodity contracts | Receivable/Payable for variation margin on futures contracts |
| 408,735 | * | ||||||||
Commodity contracts | Options written, at value |
| 645,742 |
| ||||||||
Commodity contracts | Investments in securities, at value |
| 645,742 |
| ||||||||
Equity contracts | Investments in securities, at value |
| 109,140 |
| ||||||||
Equity contracts | Unrealized appreciation on total return swap contracts |
| 1,620,713 |
| Unrealized depreciation on total return swap contracts |
| 16,643 |
| ||||
|
|
|
| |||||||||
Total | $ | 3,216,767 | $ | 2,364,466 | ||||||||
|
|
|
| |||||||||
| * | Only variation margin receivable/payable at period end is reported within the consolidated statement of assets and liabilities. This amount reflects cumulative appreciation/(depreciation) of futures contracts as reported in the consolidated portfolio of investments. |
| ALLIANCEBERNSTEIN REAL ASSET STRATEGY • | 39 |
Notes to Consolidated Financial Statements
The effect of derivative instruments on the consolidated statement of operations for the year ended October 31, 2011:
Derivative Type | Location of Gain | Realized Gain or (Loss) on Derivatives | Change in Unrealized Appreciation or (Depreciation) | |||||||
Foreign exchange contracts | Net realized gain (loss) on foreign currency transactions; Net change in unrealized appreciation/depreciation of foreign currency denominated assets and liabilities | $ | (205,953 | ) | $ | (452,174 | ) | |||
Commodity contracts | Net realized gain (loss) on futures contracts; Net change in unrealized appreciation/depreciation of futures contracts | (973,259 | ) | (375,074 | ) | |||||
Equity contracts | Net realized gain (loss) on futures contracts; Net change in unrealized appreciation/depreciation of futures contracts | 349,939 | – 0 | – | ||||||
Commodity contracts | Net realized gain (loss) on options written; Net change in unrealized appreciation/depreciation of options written | – 0 | – | 594,255 | ||||||
Commodity contracts | Net realized gain (loss) on investment transactions; Net change in unrealized appreciation/depreciation of investments | 153,798 | 263,544 | |||||||
Equity contracts | Net realized gain (loss) on investment transactions; Net change in unrealized appreciation/depreciation of investments | (152,080 | ) | (54,214 | ) | |||||
Equity contracts | Net realized gain (loss) on swap contracts; Net change in unrealized appreciation/depreciation of swap contracts | (9,561,354 | ) | 1,558,565 | ||||||
|
|
|
| |||||||
Total | $ | (10,388,909 | ) | $ | 1,534,902 | |||||
|
|
|
| |||||||
| 40 | • ALLIANCEBERNSTEIN REAL ASSET STRATEGY |
Notes to Consolidated Financial Statements
For the year ended October 31, 2011, the average monthly original value of futures contracts was $15,291,017, the average monthly cost of purchased options contracts was $314,700, and the average monthly notional amount of total return swaps was $48,306,666. For eight months of the year, the average monthly principal amount of foreign currency exchange contracts was $39,637,291.
2. Currency Transactions
The Strategy may invest in non-U.S. Dollar securities on a currency hedged or unhedged basis. The Strategy may seek investment opportunities by taking long or short positions in currencies through the use of currency-related derivatives, including forward currency exchange contracts, futures and options on futures, swaps, and other options. The Strategy may enter into transactions for investment opportunities when it anticipates that a foreign currency will appreciate or depreciate in value but securities denominated in that currency are not held by the Strategy and do not present attractive investment opportunities. Such transactions may also be used when the Adviser believes that it may be more efficient than a direct investment in a foreign currency-denominated security. The Strategy may also conduct currency exchange contracts on a spot basis (i.e., for cash at the spot rate prevailing in the currency exchange market for buying or selling currencies).
NOTE E
Capital Stock
Each class consists of 3,000,000,000 authorized shares. Transactions in capital shares for each class were as follows:
| Shares | Amount | |||||||||||||||||||
| Year Ended October 31, 2011 | March 8, 2010(a) to October 31, 2010 | Year Ended October 31, 2011 | March 8, 2010(a) to October 31, 2010 | |||||||||||||||||
|
| |||||||||||||||||||
| Class A | ||||||||||||||||||||
Shares sold | 7,572,792 | 99,826 | $ | 89,862,351 | $ | 1,054,527 | ||||||||||||||
| ||||||||||||||||||||
Shares issued in reinvestment of dividends | 6,878 | – 0 | – | 76,413 | – 0 | – | ||||||||||||||
| ||||||||||||||||||||
Shares redeemed | (1,335,679 | ) | (48 | ) | (14,766,683 | ) | (538 | ) | ||||||||||||
| ||||||||||||||||||||
Net increase | 6,243,991 | 99,778 | $ | 75,172,081 | $ | 1,053,989 | ||||||||||||||
| ||||||||||||||||||||
| Class C | ||||||||||||||||||||
Shares sold | 1,706,584 | 24,974 | $ | 20,345,953 | $ | 250,712 | ||||||||||||||
| ||||||||||||||||||||
Shares issued in reinvestment of dividends | 1,493 | – 0 | – | 16,512 | – 0 | – | ||||||||||||||
| ||||||||||||||||||||
Shares redeemed | (139,497 | ) | – 0 | – | (1,576,503 | ) | – 0 | – | ||||||||||||
| ||||||||||||||||||||
Net increase | 1,568,580 | 24,974 | $ | 18,785,962 | $ | 250,712 | ||||||||||||||
| ||||||||||||||||||||
| ALLIANCEBERNSTEIN REAL ASSET STRATEGY • | 41 |
Notes to Consolidated Financial Statements
| Shares | Amount | |||||||||||||||||||
| Year Ended October 31, 2011 | March 8, 2010(a) to October 31, 2010 | Year Ended October 31, 2011 | March 8, 2010(a) to October 31, 2010 | |||||||||||||||||
| Advisor Class | ||||||||||||||||||||
Shares sold | 5,812,158 | 85,510 | $ | 69,445,733 | $ | 888,382 | ||||||||||||||
| ||||||||||||||||||||
Shares issued in reinvestment of dividends | 1,871 | – 0 | – | 20,804 | – 0 | – | ||||||||||||||
| ||||||||||||||||||||
Shares redeemed | (1,316,995 | ) | – 0 | – | (14,466,357 | ) | – 0 | – | ||||||||||||
| ||||||||||||||||||||
Net increase | 4,497,034 | 85,510 | $ | 55,000,180 | $ | 888,382 | ||||||||||||||
| ||||||||||||||||||||
| Class R | ||||||||||||||||||||
Shares sold | 29 | 1,000 | $ | 317 | $ | 10,000 | ||||||||||||||
| ||||||||||||||||||||
Net increase | 29 | 1,000 | $ | 317 | $ | 10,000 | ||||||||||||||
| ||||||||||||||||||||
| Class K | ||||||||||||||||||||
Shares sold | 10,805 | 1,000 | $ | 126,879 | $ | 10,000 | ||||||||||||||
| ||||||||||||||||||||
Shares redeemed | (184 | ) | – 0 | – | (1,956 | ) | – 0 | – | ||||||||||||
| ||||||||||||||||||||
Net increase | 10,621 | 1,000 | $ | 124,923 | $ | 10,000 | ||||||||||||||
| ||||||||||||||||||||
| Class I | ||||||||||||||||||||
Shares sold | 1,430,460 | 1,000 | $ | 16,124,567 | $ | 10,000 | ||||||||||||||
| ||||||||||||||||||||
Net increase | 1,430,460 | 1,000 | $ | 16,124,567 | $ | 10,000 | ||||||||||||||
| ||||||||||||||||||||
| Class 1 | ||||||||||||||||||||
Shares sold | 17,974,641 | 1,000 | $ | 211,154,367 | $ | 10,000 | ||||||||||||||
| ||||||||||||||||||||
Shares issued in reinvestment of dividends | 3,044 | – 0 | – | $ | 33,729 | $ | – 0 | – | ||||||||||||
| ||||||||||||||||||||
Shares redeemed | (1,387,969 | ) | – 0 | – | $ | (15,327,431 | ) | $ | – 0 | – | ||||||||||
| ||||||||||||||||||||
Net increase | 16,589,716 | 1,000 | $ | 195,860,665 | $ | 10,000 | ||||||||||||||
| ||||||||||||||||||||
| Class 2 | ||||||||||||||||||||
Shares sold | 341,297 | 993,000 | $ | 4,000,000 | $ | 9,930,000 | ||||||||||||||
| ||||||||||||||||||||
Shares redeemed | (1,333,297 | ) | – 0 | – | $ | (16,202,643 | ) | $ | – 0 | – | ||||||||||
| ||||||||||||||||||||
Net increase (decrease) | (992,000 | ) | 993,000 | $ | (12,202,643 | ) | $ | 9,930,000 | ||||||||||||
| ||||||||||||||||||||
| (a) | Commencement of operations. |
NOTE F
Risks Involved in Investing in the Strategy
Interest Rate Risk and Credit Risk—Interest rate risk is the risk that changes in interest rates will affect the value of the Strategy’s investments in fixed-income debt securities such as bonds or notes. Increases in interest rates may cause the value of the Strategy’s investments to decline. Credit risk is the risk that the issuer or guarantor of a debt security, or the counterparty to a derivative contract, will be unable or unwilling to make timely principal and/or interest payments, or to otherwise honor its obligations. The degree of risk for a particular security may be reflected in its credit risk rating. Credit risk is greater for medium quality and lower-rated securities. Lower-rated debt securities and
| 42 | • ALLIANCEBERNSTEIN REAL ASSET STRATEGY |
Notes to Consolidated Financial Statements
similar unrated securities (commonly known as “junk bonds”) have speculative elements or are predominantly speculative risks.
Foreign Securities Risk—Investing in securities of foreign companies or foreign governments involve special risks which include changes in foreign currency exchange rates and the possibility of future political and economic developments which could adversely affect the value of such securities. Moreover, securities of many foreign companies or foreign governments and their markets may be less liquid and their prices more volatile than those of comparable U.S. companies or of the U.S. government.
Currency Risk—This is the risk that changes in foreign currency exchange rates may negatively affect the value of the Strategy’s investments or reduce the returns of the Strategy. For example, the value of the Strategy’s investments in foreign currency-denominated securities or currencies may decrease if the U.S. Dollar is strong (i.e., gaining value relative to other currencies) and other currencies are weak (i.e., losing value relative to the U.S. Dollar). Currency markets are generally not as regulated as securities markets. Independent of the Strategy’s investments denominated in foreign currencies, the Strategy’s positions in various foreign currencies may cause the Strategy to experience investment losses due to the changes in exchange rates and interest rates.
Commodity Risk—Investing in commodity-linked derivative instruments may subject the Strategy to greater volatility than investments in traditional securities. The value of commodity-linked derivative instruments may be affected by changes in overall market movements, commodity index volatility, changes in interest rates, or factors affecting a particular industry or commodity, such as drought, floods, weather, livestock disease, embargoes, tariffs and international economic, political and regulatory developments.
Derivatives Risk—The Strategy may enter into derivative transactions such as forwards, options, futures and swaps. Derivatives may be illiquid, difficult to price, and leveraged so that small changes may produce disproportionate losses for the Strategy, and subject to counterparty risk to a greater degree than more traditional investments. Derivatives may result in significant losses, including losses that are far greater than the value of the derivatives reflected in the consolidated statement of assets and liabilities.
Leverage Risk—When the Strategy borrows money or otherwise leverages its portfolio, it may be volatile because leverage tends to exaggerate the effect of any increase or decrease in the value of the Strategy’s investments. The Strategy may create leverage through the use of reverse repurchase arrangements, forward currency exchange contracts, forward commitments, dollar rolls or futures contracts or by borrowing money. The use of derivative instruments by the Strategy, such as forwards, futures, options and swaps, may also result in a form of leverage. Leverage may result in higher returns to the Strategy than if the
| ALLIANCEBERNSTEIN REAL ASSET STRATEGY • | 43 |
Notes to Consolidated Financial Statements
Strategy were not leveraged, but may also adversely affect returns, particularly if the market is declining.
Indemnification Risk—In the ordinary course of business, the Strategy enters into contracts that contain a variety of indemnifications. The Strategy’s maximum exposure under these arrangements is unknown. However, the Strategy has not had prior claims or losses pursuant to these indemnification provisions and expects the risk of loss thereunder to be remote. Therefore, the Strategy has not accrued any liability in connection with these indemnification provisions.
NOTE G
Joint Credit Facility
A number of open-end mutual funds managed by the Adviser, including the Strategy, participate in a $140 million revolving credit facility (the “Facility”) intended to provide short-term financing, if necessary, subject to certain restrictions in connection with abnormal redemption activity. Commitment fees related to the Facility are paid by the participating funds and are included in miscellaneous expenses in the statement of operations. The Strategy did not utilize the Facility during the year ended October 31, 2011.
NOTE H
Distributions to Shareholders
The tax character of distributions paid during the fiscal years ended October 31, 2011 and October 31, 2010 were as follows:
| 2011 | 2010 | |||||||
Distributions paid from: | ||||||||
Ordinary income | $ | 561,662 | $ | – 0 | – | |||
|
|
|
| |||||
Total distributions paid | $ | 561,662 | $ | – 0 | – | |||
|
|
|
| |||||
As of October 31, 2011, the components of accumulated earnings/(deficit) on a tax basis were as follows:
Undistributed ordinary income | $ | 1,316,389 | ||
Accumulated capital and other losses | (8,328,228 | )(a) | ||
Unrealized appreciation/(depreciation) | (16,855,959 | )(b) | ||
|
| |||
Total accumulated earnings/(deficit) | $ | (23,867,798 | ) | |
|
|
| (a) | On October 31, 2011, the Strategy had a net capital loss carryforward of $8,328,228 of which $8,227 expires in the year 2018 and $8,320,001 expires in the year 2019. To the extent future capital gains are offset by capital loss carryforwards, such gains will not be distributed. |
| (b) | The differences between book-basis and tax-basis unrealized appreciation/(depreciation) are primarily due to the tax deferral of losses on wash sales, the tax treatment of passive foreign investment companies (PFICs), the realization for tax purposes of gains/losses on certain derivative instruments, and the tax treatment of earnings from the Subsidiary. |
During the current fiscal year, permanent differences primarily due to the tax treatment of swap income, foreign currency reclassification, the book/tax
| 44 | • ALLIANCEBERNSTEIN REAL ASSET STRATEGY |
Notes to Consolidated Financial Statements
differences associated with the treatment of earnings from the Subsidiary, and the tax treatment of passive foreign investment companies (PFICs) resulted in a net decrease in undistributed net investment income, a net decrease in accumulated net realized loss on investment and foreign currency transactions, and a net decrease in additional paid-in capital. These reclassifications had no effect on net assets.
NOTE I
Recent Accounting Pronouncement
In May 2011, the Financial Accounting Standards Board (“FASB”) issued an Accounting Standards Update (“ASU”) to develop common requirements for measuring fair value and for disclosing information about fair value measurements in U.S. GAAP and International Financial Reporting Standards (“IFRS”). The amendments are intended to improve the comparability of fair value measurements presented and disclosed in the financial statements prepared in accordance with U.S. GAAP and IFRS. The ASU is effective during interim or annual periods beginning after December 15, 2011. At this time, management is evaluating the implication of this ASU and its impact on the financial statements has not been determined.
NOTE J
Subsequent Events
Management has evaluated subsequent events for possible recognition or disclosure in the financial statements through the date the financial statements are issued. Management has determined that there are no material events that would require disclosure in the Strategy’s financial statements through this date.
| ALLIANCEBERNSTEIN REAL ASSET STRATEGY • | 45 |
Notes to Consolidated Financial Statements
CONSOLIDATED FINANCIAL HIGHLIGHTS
Selected Data For A Share Of Capital Stock Outstanding Throughout Each Period
| Class A | ||||||||
| Year Ended October 31, 2011 | March 8, 2010(a) to October 31, 2010 | |||||||
Net asset value, beginning of period | $ 11.25 | $ 10.00 | ||||||
|
| |||||||
Income From Investment Operations | ||||||||
Net investment income(b)(c) | .16 | .04 | ||||||
Net realized and unrealized gain (loss) on investment and foreign currency transactions | (.01 | ) | 1.21 | |||||
Contributions from Adviser | – 0 | – | .00 | (d) | ||||
|
| |||||||
Net increase in net asset value from operations | .15 | 1.25 | ||||||
|
| |||||||
Less: Dividends | ||||||||
Dividends from net investment income | (.35 | ) | – 0 | – | ||||
|
| |||||||
Net asset value, end of period | $ 11.05 | $ 11.25 | ||||||
|
| |||||||
Total Return | ||||||||
Total investment return based on net asset value(e) | 1.32 | % | 12.50 | % | ||||
Ratios/Supplemental Data | ||||||||
Net assets, end of period (000’s omitted) | $70,081 | $1,123 | ||||||
Ratio to average net assets of: | ||||||||
Expenses, net of waivers/reimbursements | 1.05 | % | 1.05 | %(f)(g) | ||||
Expenses, before waivers/reimbursements | 1.61 | % | 7.68 | %(f)(g) | ||||
Net investment income(c) | 1.44 | % | .80 | %(f)(g) | ||||
Portfolio turnover rate | 120 | % | 42 | % | ||||
See footnote summary on page 53.
| 46 | • ALLIANCEBERNSTEIN REAL ASSET STRATEGY |
Consolidated Financial Highlights
Selected Data For A Share Of Capital Stock Outstanding Throughout Each Period
| Class C | ||||||||
| Year Ended October 31, 2011 | March 8, 2010(a) to October 31, 2010 | |||||||
Net asset value, beginning of period | $ 11.19 | $ 10.00 | ||||||
|
| |||||||
Income From Investment Operations | ||||||||
Net investment income(b)(c) | .08 | .04 | ||||||
Net realized and unrealized gain (loss) on investment and foreign currency transactions | (.01 | ) | 1.15 | |||||
Contributions from Adviser | – 0 | – | .00 | (d) | ||||
|
| |||||||
Net increase in net asset value from operations | .07 | 1.19 | ||||||
|
| |||||||
Less: Dividends | ||||||||
Dividends from net investment income | (.33 | ) | – 0 | – | ||||
|
| |||||||
Net asset value, end of period | $ 10.93 | $ 11.19 | ||||||
|
| |||||||
Total Return | ||||||||
Total investment return based on net asset value(e) | .61 | % | 11.90 | % | ||||
Ratios/Supplemental Data | ||||||||
Net assets, end of period (000’s omitted) | $17,414 | $280 | ||||||
Ratio to average net assets of: | ||||||||
Expenses, net of waivers/reimbursements | 1.75 | % | 1.75 | %(f)(g) | ||||
Expenses, before waivers/reimbursements | 2.31 | % | 11.21 | %(f)(g) | ||||
Net investment income(c) | .73 | % | .65 | %(f)(g) | ||||
Portfolio turnover rate | 120 | % | 42 | % | ||||
See footnote summary on page 53.
| ALLIANCEBERNSTEIN REAL ASSET STRATEGY • | 47 |
Consolidated Financial Highlights
Selected Data For A Share Of Capital Stock Outstanding Throughout Each Period
| Advisor Class | ||||||||
| Year Ended October 31, 2011 | March 8, 2010(a) to October 31, 2010 | |||||||
Net asset value, beginning of period | $ 11.26 | $ 10.00 | ||||||
|
| |||||||
Income From Investment Operations | ||||||||
Net investment income(b)(c) | .19 | .08 | ||||||
Net realized and unrealized gain (loss) on investment and foreign currency transactions | (.01 | ) | 1.18 | |||||
Contributions from Adviser | – 0 | – | .00 | (d) | ||||
|
| |||||||
Net increase in net asset value from operations | .18 | 1.26 | ||||||
|
| |||||||
Less: Dividends | ||||||||
Dividends from net investment income | (.36 | ) | – 0 | – | ||||
|
| |||||||
Net asset value, end of period | $ 11.08 | $ 11.26 | ||||||
|
| |||||||
Total Return | ||||||||
Total investment return based on net asset value(e) | 1.55 | % | 12.60 | % | ||||
Ratios/Supplemental Data | ||||||||
Net assets, end of period (000’s omitted) | $50,795 | $963 | ||||||
Ratio to average net assets of: | ||||||||
Expenses, net of waivers/reimbursements | .75 | % | .75 | %(f)(g) | ||||
Expenses, before waivers/reimbursements | 1.29 | % | 8.89 | %(f)(g) | ||||
Net investment income(c) | 1.69 | % | 1.46 | %(f)(g) | ||||
Portfolio turnover rate | 120 | % | 42 | % | ||||
See footnote summary on page 53.
| 48 | • ALLIANCEBERNSTEIN REAL ASSET STRATEGY |
Consolidated Financial Highlights
Selected Data For A Share Of Capital Stock Outstanding Throughout Each Period
| Class R | ||||||||
| Year Ended October 31, 2011 | March 8, 2010(a) to October 31, 2010 | |||||||
Net asset value, beginning of period | $ 11.23 | $ 10.00 | ||||||
|
| |||||||
Income From Investment Operations | ||||||||
Net investment income(b)(c) | .16 | .10 | ||||||
Net realized and unrealized gain (loss) on investment and foreign currency transactions | (.04 | ) | 1.13 | |||||
Contributions from Adviser | – 0 | – | .00 | (d) | ||||
|
| |||||||
Net increase in net asset value from operations | .12 | 1.23 | ||||||
|
| |||||||
Less: Dividends | ||||||||
Dividends from net investment income | (.33 | ) | – 0 | – | ||||
|
| |||||||
Net asset value, end of period | $ 11.02 | $ 11.23 | ||||||
|
| |||||||
Total Return | ||||||||
Total investment return based on net asset value(e) | 1.03 | % | 12.30 | % | ||||
Ratios/Supplemental Data | ||||||||
Net assets, end of period (000’s omitted) | $11 | $11 | ||||||
Ratio to average net assets of: | ||||||||
Expenses, net of waivers/reimbursements | 1.25 | % | 1.25 | %(f)(g) | ||||
Expenses, before waivers/reimbursements | 2.87 | % | 8.66 | %(f)(g) | ||||
Net investment income(c) | 1.39 | % | 1.50 | %(f)(g) | ||||
Portfolio turnover rate | 120 | % | 42 | % | ||||
See footnote summary on page 53.
| ALLIANCEBERNSTEIN REAL ASSET STRATEGY • | 49 |
Consolidated Financial Highlights
Selected Data For A Share Of Capital Stock Outstanding Throughout Each Period
| Class K | ||||||||
| Year Ended October 31, 2011 | March 8, 2010(a) to October 31, 2010 | |||||||
Net asset value, beginning of period | $ 11.25 | $ 10.00 | ||||||
|
| |||||||
Income From Investment Operations | ||||||||
Net investment income(b)(c) | .15 | .12 | ||||||
Net realized and unrealized gain on investment and foreign currency transactions | – 0 | – | 1.13 | |||||
Contributions from Adviser | – 0 | – | .00 | (d) | ||||
|
| |||||||
Net increase in net asset value from operations | .15 | 1.25 | ||||||
|
| |||||||
Less: Dividends | ||||||||
Dividends from net investment income | (.35 | ) | – 0 | – | ||||
|
| |||||||
Net asset value, end of period | $ 11.05 | $ 11.25 | ||||||
|
| |||||||
Total Return | ||||||||
Total investment return based on net asset value(e) | 1.33 | % | 12.50 | % | ||||
Ratios/Supplemental Data | ||||||||
Net assets, end of period (000’s omitted) | $128 | $11 | ||||||
Ratio to average net assets of: | ||||||||
Expenses, net of waivers/reimbursements | 1.00 | % | 1.00 | %(f)(g) | ||||
Expenses, before waivers/reimbursements | 1.91 | % | 8.39 | %(f)(g) | ||||
Net investment income(c) | 1.38 | % | 1.76 | %(f)(g) | ||||
Portfolio turnover rate | 120 | % | 42 | % | ||||
See footnote summary on page 53.
| 50 | • ALLIANCEBERNSTEIN REAL ASSET STRATEGY |
Consolidated Financial Highlights
Selected Data For A Share Of Capital Stock Outstanding Throughout Each Period
| Class I | ||||||||
| Year Ended October 31, 2011 | March 8, 2010(a) to October 31, 2010 | |||||||
Net asset value, beginning of period | $ 11.27 | $ 10.00 | ||||||
|
| |||||||
Income From Investment Operations | ||||||||
Net investment income(b)(c) | .15 | .13 | ||||||
Net realized and unrealized gain on investment and foreign currency transactions | .02 | (h) | 1.14 | |||||
Contributions from Adviser | – 0 | – | .00 | (d) | ||||
|
| |||||||
Net increase in net asset value from operations | .17 | 1.27 | ||||||
|
| |||||||
Less: Dividends | ||||||||
Dividends from net investment income | (.37 | ) | – 0 | – | ||||
|
| |||||||
Net asset value, end of period | $ 11.07 | $ 11.27 | ||||||
|
| |||||||
Total Return | ||||||||
Total investment return based on net asset value(e) | 1.53 | % | 12.70 | % | ||||
Ratios/Supplemental Data | ||||||||
Net assets, end of period (000’s omitted) | $15,850 | $11 | ||||||
Ratio to average net assets of: | ||||||||
Expenses, net of waivers/reimbursements | .75 | % | .75 | %(f)(g) | ||||
Expenses, before waivers/reimbursements | 1.38 | % | 8.11 | %(f)(g) | ||||
Net investment income(c) | 1.42 | % | 1.99 | %(f)(g) | ||||
Portfolio turnover rate | 120 | % | 42 | % | ||||
See footnote summary on page 53.
| ALLIANCEBERNSTEIN REAL ASSET STRATEGY • | 51 |
Consolidated Financial Highlights
Selected Data For A Share Of Capital Stock Outstanding Throughout Each Period
| Class 1 | ||||||||
| Year Ended October 31, 2011 | March 8, 2010(a) to October 31, 2010 | |||||||
Net asset value, beginning of period | $ 11.25 | $ 10.00 | ||||||
|
| |||||||
Income From Investment Operations | ||||||||
Net investment income(b)(c) | .15 | .12 | ||||||
Net realized and unrealized gain (loss) on investment and foreign currency transactions | (.01 | ) | 1.13 | |||||
Contributions from Adviser | – 0 | – | .00 | (d) | ||||
|
| |||||||
Net increase in net asset value from operations | .14 | 1.25 | ||||||
|
| |||||||
Less: Dividends | ||||||||
Dividends from net investment income | (.38 | ) | – 0 | – | ||||
|
| |||||||
Net asset value, end of period | $ 11.01 | $ 11.25 | ||||||
|
| |||||||
Total Return | ||||||||
Total investment return based on net asset value(e) | 1.25 | % | 12.50 | % | ||||
Ratios/Supplemental Data | ||||||||
Net assets, end of period (000’s omitted) | $182,720 | $11 | ||||||
Ratio to average net assets of: | ||||||||
Expenses, net of waivers/reimbursements | 1.00 | % | 1.00 | %(f)(g) | ||||
Expenses, before waivers/reimbursements | 1.47 | % | 8.39 | %(f)(g) | ||||
Net investment income(c) | 1.40 | % | 1.78 | %(f)(g) | ||||
Portfolio turnover rate | 120 | % | 42 | % | ||||
See footnote summary on page 53.
| 52 | • ALLIANCEBERNSTEIN REAL ASSET STRATEGY |
Consolidated Financial Highlights
Selected Data For A Share Of Capital Stock Outstanding Throughout Each Period
| Class 2 | ||||||||
| Year Ended October 31, 2011 | March 8, 2010(a) to October 31, 2010 | |||||||
Net asset value, beginning of period | $ 11.27 | $ 10.00 | ||||||
|
| |||||||
Income From Investment Operations | ||||||||
Net investment income(b)(c) | .14 | .13 | ||||||
Net realized and unrealized gain on investment and foreign currency transactions | .03 | (h) | 1.14 | |||||
Contributions from Adviser | – 0 | – | .00 | (d) | ||||
|
| |||||||
Net increase in net asset value from operations | .17 | 1.27 | ||||||
|
| |||||||
Less: Dividends | ||||||||
Dividends from net investment income | (.37 | ) | – 0 | – | ||||
|
| |||||||
Net asset value, end of period | $ 11.07 | $ 11.27 | ||||||
|
| |||||||
Total Return | ||||||||
Total investment return based on net asset value(e) | 1.50 | % | 12.70 | % | ||||
Ratios/Supplemental Data | ||||||||
Net assets, end of period (000’s omitted) | $11 | $11,187 | ||||||
Ratio to average net assets of: | ||||||||
Expenses, net of waivers/reimbursements | .75 | % | .75 | %(f)(g) | ||||
Expenses, before waivers/reimbursements | 3.72 | % | 8.14 | %(f)(g) | ||||
Net investment income(c) | 1.19 | % | 2.01 | %(f)(g) | ||||
Portfolio turnover rate | 120 | % | 42 | % | ||||
| (a) | Commencement of operations. |
| (b) | Based on average shares outstanding. |
| (c) | Net of fees and expenses waived/reimbursed by the Adviser. |
| (d) | Amount is less than $.005. |
| (e) | Total investment return is calculated assuming an initial investment made at the net asset value at the beginning of the period, reinvestment of all dividends and distributions at net asset value during the period, and redemption on the last day of the period. Initial sales charges or contingent deferred sales charges are not reflected in the calculation of total investment return. Total return does not reflect the deduction of taxes that a shareholder would pay on portfolio distributions or the redemption of portfolio shares. Total investment return calculated for a period of less than one year is not annualized. |
| (f) | The ratio includes expenses attributable to costs of proxy solicitation. |
| (g) | Annualized. |
| (h) | Due to timing of sales and repurchase of capital shares, the net realized and unrealized gain (loss) per share is not in accord with the Strategy’s change in net realized and unrealized gain (loss) on investment transactions for the period. |
See notes to consolidated financial statements.
| ALLIANCEBERNSTEIN REAL ASSET STRATEGY • | 53 |
Consolidated Financial Highlights
REPORT OF INDEPENDENT REGISTERED
PUBLIC ACCOUNTING FIRM
To the Board of Directors of AllianceBernstein Bond Fund, Inc.
and Shareholders of the AllianceBernstein Real Asset Strategy Portfolio
We have audited the accompanying consolidated statement of assets and liabilities of AllianceBernstein Real Asset Strategy Portfolio (one of the portfolios constituting AllianceBernstein Bond Fund, Inc.) (the “Strategy”), formerly known as AllianceBernstein Multi Asset Inflation Strategy Portfolio, including the consolidated portfolio of investments, as of October 31, 2011, and the related consolidated statement of operations for the year then ended, and the consolidated statements of changes in net assets and the financial highlights for the year then ended and the period March 8, 2010 (commencement of operations) through October 31, 2010. These financial statements and financial highlights are the responsibility of the Strategy’s management. Our responsibility is to express an opinion on these financial statements and financial highlights based on our audits.
We conducted our audits in accordance with the standards of the Public Company Accounting Oversight Board (United States). Those standards require that we plan and perform the audit to obtain reasonable assurance about whether the financial statements and financial highlights are free of material misstatement. We were not engaged to perform an audit of the Strategy’s internal control over financial reporting. Our audit included consideration of internal control over financial reporting as a basis for designing audit procedures that are appropriate in the circumstances, but not for the purpose of expressing an opinion on the effectiveness of the Strategy’s internal control over financial reporting. Accordingly, we express no such opinion. An audit also includes examining, on a test basis, evidence supporting the amounts and disclosures in the financial statements and financial highlights, assessing the accounting principles used and significant estimates made by management, and evaluating the overall financial statement presentation. Our procedures included confirmation of securities owned as of October 31, 2011 by correspondence with the custodian and others or by other appropriate auditing procedures where replies from others were not received. We believe that our audits provide a reasonable basis for our opinion.
In our opinion, the financial statements and financial highlights referred to above present fairly, in all material respects, the consolidated financial position of AllianceBernstein Real Asset Strategy Portfolio of AllianceBernstein Bond Fund, Inc. at October 31, 2011, the consolidated results of their operations for the year then ended, and the changes in their net assets and the financial highlights for the year then ended and the period March 8, 2010 (commencement of operations) through October 31, 2010, in conformity with U.S. generally accepted accounting principles.

New York, New York
December 29, 2011
| 54 | • ALLIANCEBERNSTEIN REAL ASSET STRATEGY |
Report of Independent Registered Public Accounting Firm
2011 FEDERAL TAX INFORMATION
(unaudited)
For Federal income tax purposes, the following information is furnished with respect to the distributions paid by the Strategy during the taxable year ended October 31, 2011. For corporate shareholders, 6.32% of dividends paid qualify for the dividends received deduction. For foreign shareholders, 6.74% of ordinary income dividends paid may be considered to be qualifying to be taxed as interest-related dividends.
For the taxable year ended October 31, 2011, the Strategy designates $1,041,927 as the maximum amount that may be considered qualified dividend income for individual shareholders.
Shareholders should not use the above information to prepare their income tax returns. The information necessary to complete your income tax returns will be included with your Form 1099-DIV which will be sent to you separately in January 2012.
| ALLIANCEBERNSTEIN REAL ASSET STRATEGY • | 55 |
2011 Federal Tax Information
BOARD OF DIRECTORS
William H. Foulk, Jr.(1), Chairman John H. Dobkin(1) Michael J. Downey(1) D. James Guzy(1) Nancy P. Jacklin(1) | Robert M. Keith, President and Chief Executive Officer Garry L. Moody(1) Marshall C. Turner, Jr.(1) Earl D. Weiner(1) |
OFFICERS
Philip L. Kirstein, Senior Vice President and Independent Compliance Officer Drew W. Demakis(2), Vice President Joshua B. Lisser(2), Vice President Teresa Marziano(2), Vice President | Jonathan E. Ruff(2), Vice President Greg J. Wilensky(2) , Vice President Emilie D. Wrapp, Secretary Joseph J. Mantineo, Treasurer and Chief Financial Officer Phyllis J. Clarke, Controller |
Custodian and Accounting Agent State Street Bank and Trust Company One Lincoln Street Boston, MA 02111
Principal Underwriter AllianceBernstein Investments, Inc. 1345 Avenue of the Americas New York, NY 10105
Transfer Agent AllianceBernstein Investor Services, Inc. P.O. Box 786003 San Antonio, TX 78278-6003 Toll-Free (800) 221-5672 | Independent Registered Public Ernst & Young LLP 5 Times Square New York, NY 10036
Legal Counsel Seward & Kissel LLP One Battery Park Plaza New York, NY 10004 |
| (1) | Member of the Audit Committee, the Governance and Nominating Committee, and the Independent Directors Committee. Mr. Foulk is the sole member of the Fair Value Pricing Committee. |
| (2) | The day-to-day management of, and investment decisions for, the Strategy’s portfolio are made by the Adviser’s Real Asset Strategy Team. Ms. Teresa Marziano and Messrs. Drew W. Demakis, Joshua B. Lisser, Jonathan E. Ruff and Mr. Greg J. Wilensky are the investment professionals with the most significant responsibility for the day-to-day management of the Strategy’s portfolio. |
| 56 | • ALLIANCEBERNSTEIN REAL ASSET STRATEGY |
Board of Directors
MANAGEMENT OF THE FUND
Board of Directors Information
The business and affairs of the Strategy are managed under the direction of the Board of Directors. Certain information concerning the Strategy’s Directors is set forth below.
| NAME, ADDRESS* and AGE (YEAR FIRST ELECTED**) | PRINCIPAL OCCUPATION(S) DURING PAST FIVE YEARS AND OTHER RELEVANT QUALIFICATIONS*** | PORTFOLIOS IN FUND COMPLEX OVERSEEN BY DIRECTOR | OTHER DIRECTORSHIPS HELD BY DIRECTOR IN THE PAST FIVE YEARS | |||||
| INTERESTED DIRECTOR | ||||||||
| Robert M. Keith, + 1345 Avenue of the Americas NewYork, New York 10105 51 (2010) | Senior Vice President of AllianceBernstein L.P. (the “Adviser”) and head of AllianceBernstein Investments, Inc. (“ABI”) since July 2008; Director of ABI and President of the AllianceBernstein Mutual Funds. Previously, he served as Executive Managing Director of ABI from December 2006 to June 2008. Prior to joining ABI in 2006, Executive Managing Director of Bernstein Global Wealth Management, and prior thereto, Senior Managing Director and Global Head of Client Service and Sales of the Adviser’s institutional investment management business since 2004. Prior thereto, Managing Director and Head of North American Client Service and Sales in the Adviser’s institutional investment management business, with which he had been associated since prior to 2004. | 102 | None | |||||
| ALLIANCEBERNSTEIN REAL ASSET STRATEGY • | 57 |
Management of the Fund
| NAME, ADDRESS* and AGE (YEAR FIRST ELECTED**) | PRINCIPAL OCCUPATION(S) DURING PAST FIVE YEARS AND OTHER RELEVANT QUALIFICATIONS*** | PORTFOLIOS IN FUND COMPLEX OVERSEEN BY DIRECTOR | OTHER DIRECTORSHIPS HELD BY DIRECTOR IN THE PAST FIVE YEARS | |||||
| DISINTERESTED DIRECTORS | ||||||||
| William H. Foulk, Jr., ++, # Chairman of the Board 79 (1998) | Investment Adviser and an Independent Consultant since prior to 2006. Previously, he was Senior Manager of Barrett Associates, Inc., a registered investment adviser. He was formerly Deputy Comptroller and Chief Investment Officer of the State of New York and, prior thereto, Chief Investment Officer of the New York Bank for Savings. He has served as a director or trustee of various AllianceBernstein Funds since 1983 and has been Chairman of the AllianceBernstein Funds and of the Independent Directors Committee of such Funds since 2003. He is also active in a number of mutual fund organizations and committees. | 102 | None | |||||
| John H. Dobkin, # 69 (1998) | Independent Consultant since prior to 2006. Formerly, President of Save Venice, Inc. (preservation organization) from 2001-2002, Senior Advisor from June 1999 – June 2000 and President of Historic Hudson Valley (historic preservation) from December 1989 – May 1999. Previously, Director of the National Academy of Design. He has served as a director or trustee of various AllianceBernstein Funds since 1992, and as Chairman of the Audit Committees of a number of such Funds from 2001-2008. | 102 | None | |||||
| 58 | • ALLIANCEBERNSTEIN REAL ASSET STRATEGY |
Management of the Fund
| NAME, ADDRESS* and AGE (YEAR FIRST ELECTED**) | PRINCIPAL OCCUPATION(S) DURING PAST FIVE YEARS AND OTHER RELEVANT QUALIFICATIONS*** | PORTFOLIOS IN FUND COMPLEX OVERSEEN BY DIRECTOR | OTHER DIRECTORSHIPS HELD BY DIRECTOR IN THE PAST FIVE YEARS | |||||
| DISINTERESTED DIRECTORS (continued) | ||||||||
| Michael J. Downey, # 67 (2005) | Private Investor since prior to 2006. Formerly, managing partner of Lexington Capital, LLC (investment advisory firm) from December 1997 until December 2003. From 1987 until 1993, Chairman and CEO of Prudential Mutual Fund Management, director of the Prudential Mutual funds and member of the Executive Committee of Prudential Securities Inc. He has served as a director or trustee of the AllianceBernstein Funds since 2005 and is a director of two other registered investment companies (and Chairman of one of them). | 102 | Asia Pacific Fund, Inc. and The Merger Fund since prior to 2006 and Prospect Acquisition Corp. (financial services) since 2007 until 2009 | |||||
| D. James Guzy, # 75 (2005) | Chairman of the Board of PLX Technology (semi-conductors) and of SRC Computers Inc., with which he has been associated since prior to 2006. He was a director of Intel Corporation (semi-conductors) from 1969 until 2008, and served as Chairman of the Finance Committee of such company for several years until May 2008. He has served as a director or trustee of one or more of the AllianceBernstein Funds since 1982. | 102 | Cirrus Logic Corporation (semi-conductors) and PLX Technology (semi-conductors) since prior to 2006 and Intel Corporation (semi-conductors) since prior to 2006 until 2008 | |||||
| ALLIANCEBERNSTEIN REAL ASSET STRATEGY • | 59 |
Management of the Fund
| NAME, ADDRESS* and AGE (YEAR FIRST ELECTED**) | PRINCIPAL QUALIFICATIONS*** | PORTFOLIOS IN FUND COMPLEX OVERSEEN BY DIRECTOR | OTHER DIRECTORSHIPS HELD BY DIRECTOR IN THE PAST FIVE YEARS | |||||
| DISINTERESTED DIRECTORS (continued) | ||||||||
| Nancy P. Jacklin, # 63 (2006) | Professorial Lecturer at the Johns Hopkins School of Advanced International Studies since 2008. Formerly, U.S. Executive Director of the International Monetary Fund (December 2002 – May 2006); Partner, Clifford Chance (1992-2002); Sector Counsel, International Banking and Finance, and Associate General Counsel, Citicorp (1985-1992); Assistant General Counsel (International), Federal Reserve Board of Governors (1982-1985); and Attorney Advisor, U.S. Department of the Treasury (1973-1982). Member of the Bar of the District of Columbia and of New York; and member of the Council on Foreign Relations. She has served as a director or trustee of the AllianceBernstein Funds since 2006. | 102 | None | |||||
| Garry L. Moody, # 59 (2008) | Independent Consultant. Formerly, Partner, Deloitte & Touche LLP (1995-2008) where he held a number of senior positions, including Vice Chairman, and U.S. and Global Investment Management Practice Managing Partner; President, Fidelity Accounting and Custody Services Company (1993-1995); and Partner, Ernst & Young LLP (1975-1993), where he served as the National Director of Mutual Fund Tax Services. He is also a member of the Governing Council of the Independent Directors Council (IDC), an organization of independent directors of mutual funds. He has served as a director or trustee, and as Chairman of the Audit Committee, of most of the AllianceBernstein Funds since 2008. | 102 | None | |||||
| 60 | • ALLIANCEBERNSTEIN REAL ASSET STRATEGY |
Management of the Fund
| NAME, ADDRESS* and AGE (YEAR FIRST ELECTED**) | PRINCIPAL QUALIFICATIONS*** | PORTFOLIOS IN FUND COMPLEX OVERSEEN BY DIRECTOR | OTHER DIRECTORSHIPS HELD BY DIRECTOR IN THE PAST FIVE YEARS | |||||
| DISINTERESTED DIRECTORS (continued) | ||||||||
| Marshall C. Turner, Jr., # 70 (2005) | Private Investor since prior to 2006. Interim CEO of MEMC Electronic Materials, Inc. (semi-conductor and solar cell substrates) from November 2008 until March 2009. He was Chairman and CEO of Dupont Photomasks, Inc. (components of semi-conductor manufacturing), 2003-2005, and President and CEO, 2005-2006, after the company was acquired and renamed Toppan Photomasks, Inc. He has extensive experience in venture capital investing including prior service as general partner of three institutional venture capital partnerships, and serves on the boards of a number of education and science-related non-profit organizations. He has served as a director or trustee of one or more of the AllianceBernstein Funds since 1992. | 102 | Xilinx, Inc. (programmable logic semi-conductors) and MEMC Electronic Materials, Inc. (semi-conductor and solar cell substrates) since prior to 2006 | |||||
| Earl D. Weiner, # 72 (2007) | Of Counsel, and Partner prior to January 2007, of the law firm Sullivan & Cromwell LLP and member of ABA Federal Regulation of Securities Committee Task Force to draft editions of the Fund Director’s Guidebook. He also serves as a director or trustee of various non-profit organizations and has served as Chairman or Vice Chairman of a number of them. He has served as a director or trustee of the AllianceBernstein Funds since 2007 and is Chairman of the Governance and Nominating Committees of most of the Funds. | 102 | None | |||||
| * | The address for each of the Strategy’s disinterested Directors is c/o AllianceBernstein L.P., Attention: Philip L. Kirstein, 1345 Avenue of the Americas, New York, NY 10105. |
| ** | There is no stated term of office for the Strategy’s Directors. |
| *** | The information above includes each Director’s principal occupation during the last five years and other information relating to the experience, attributes and skills relevant to each Director’s qualifications to serve as a Director, which led to the conclusion that each Director should serve as a Director for the Strategy. |
| + | Mr. Keith is an “interested person” of the Strategy as defined in the “40 Act”, due to his position as a Senior Vice President of the Adviser. |
| ++ | Member of the Fair Value Pricing Committee. |
| # | Member of the Audit Committee, the Governance and Nominating Committee and the Independent Directors Committee. |
| ALLIANCEBERNSTEIN REAL ASSET STRATEGY • | 61 |
Management of the Fund
Officer Information
Certain information concerning the Strategy’s Officers is listed below.
| NAME, ADDRESS* AND AGE | PRINCIPAL POSITION(S) HELD WITH FUND | PRINCIPAL OCCUPATION DURING PAST 5 YEARS | ||
Robert M. Keith 51 | President and Chief Executive Officer | See biography above. | ||
Philip L. Kirstein 66 | Senior Vice President and Independent Compliance Officer | Senior Vice President and Independent Compliance Officer of the AllianceBernstein Funds, with which he has been associated since October 2004. Prior thereto, he was Of Counsel to Kirkpatrick & Lockhart, LLP from October 2003 to October 2004, and General Counsel of Merrill Lynch Investment Managers, L.P. since prior to March 2003. | ||
Drew W. Demakis 48 | Vice President | Senior Vice President of the Adviser,** with which he has been associated since prior to 2006. | ||
Joshua B. Lisser 45 | Vice President | Senior Vice President of the Adviser,** with which he has been associated since prior to 2006. | ||
Teresa Marziano 57 | Vice President | Senior Vice President of the Adviser,** with which she has been associated since prior to 2006. | ||
Jonathan E. Ruff 41 | Vice President | Senior Vice President of the Adviser,** with which he has been associated since prior to 2006. | ||
Greg J. Wilensky 44 | Vice President | Senior Vice President of the Adviser,** with which he has been associated since prior to 2006. | ||
Emilie D. Wrapp 56 | Secretary | Senior Vice President, Assistant General Counsel and Assistant Secretary of ABI,** with which she has been associated since prior to 2006. | ||
Joseph J. Mantineo 52 | Treasurer and Chief Financial Officer | Senior Vice President of AllianceBernstein Investor Services, Inc, (“ABIS”),** with which he has been associated since prior to 2006. | ||
Phyllis J. Clarke 50 | Controller | Vice President of ABIS,** with which she has been associated since prior to 2006. |
| * | The address for each of the Fund’s Officers is 1345 Avenue of the Americas, New York, NY 10105. |
| ** | The Adviser, ABI and ABIS are affiliates of the Strategy. |
| The Fund’s Statement of Additional Information (“SAI”) has additional information about the Strategy’s Directors and Officers and is available without charge upon request. Contact your financial representative or AllianceBernstein at 1-800-227-4618, or visit www.alliancebernstein.com, for a free prospectus or SAI. |
| 62 | • ALLIANCEBERNSTEIN REAL ASSET STRATEGY |
Management of the Fund
THE FOLLOWING IS NOT PART OF THE SHAREHOLDER REPORT OR THE FINANCIAL STATEMENTS
SUMMARY OF SENIOR OFFICER’S EVALUATION OF INVESTMENT ADVISORY AGREEMENT1
The following is a summary of the evaluation of the Investment Advisory Agreement between AllianceBernstein L.P. (the “Adviser”) and The AllianceBernstein Bond Fund, Inc. (the “Fund”), in respect of AllianceBernstein Real Asset Strategy (the “Strategy”).2 The evaluation of the investment Advisory Agreement was prepared by Philip L. Kirstein, the Senior Officer of the Fund for the Directors of the Fund, as required by the August 2004 agreement between the Adviser and the New York State Attorney General (the “NYAG”). The Senior Officer’s evaluation of the Investment Advisory Agreement is not meant to diminish the responsibility or authority of the Board of Directors of the Fund to perform its duties pursuant to Section 15 of the Investment Company Act of 1940 (the “40 Act”) and applicable state law. The purpose of the summary is to provide shareholders with a synopsis of the independent evaluation of the reasonableness of the advisory fees proposed to be paid by the Strategy which was provided to the Directors in connection with their review of the proposed initial approval of the Investment Advisory Agreement. The Senior Officer’s evaluation considered the following factors:
| 1. | Advisory fees charged to institutional and other clients of the Adviser for like services; |
| 2. | Advisory fees charged by other mutual fund companies for like services; |
| 3. | Costs to the Adviser and its affiliates of supplying services pursuant to the advisory agreement, excluding any intra-corporate profit; |
| 4. | Profit margins of the Adviser and its affiliates from supplying such services; |
| 5. | Possible economies of scale as the Strategy grows larger; and |
| 6. | Nature and quality of the Adviser’s services including the performance of the Strategy. |
These factors, with the exception of the first factor, are generally referred to as the “Gartenberg factors,” which were articulated by the United States Court of Appeals for the Second Circuit in 1982. Gartenberg v. Merrill Lynch Asset Management, Inc., 694 F. 2d 923 (2d Cir. 1982). On March 30, 2010, the Supreme Court held the Gartenberg decision was correct in its basic formulation of what §36(b) requires: to face liability under §36(b), “an investment adviser must charge a fee that is so disproportionately large that it bears no reasonable relationship to the services rendered and could not have
| 1 | The Senior Officer’s fee evaluation was completed on October 20, 2011 and presented to the Board of Directors on November 1-3, 2011. |
| 2 | Future references to the Fund or the Strategy do not include “AllianceBernstein.” |
| ALLIANCEBERNSTEIN REAL ASSET STRATEGY • | 63 |
been the product of arm’s length bargaining” Jones v. Harris Associates L.P., 130 S. Ct. 1418 (2010). In Jones, the Court stated the Gartenberg approach fully incorporates the correct understanding of fiduciary duty within the context of section 36(b) and noted with approval that “Gartenberg insists that all relevant circumstances be taken into account” and “uses the range of fees that might result from arm’s-length bargaining as the benchmark for reviewing challenged fees.”3
ADVISORY FEES, NET ASSETS, & EXPENSE RATIOS
The Adviser proposed that the Strategy pays the advisory fee set forth below for receiving the services to be provided pursuant to the Investment Advisory Agreement.
| Strategy | Net Assets 09/30/11 ($MM) | Advisory Fee Schedule Based on the Average Daily Net Assets of the Portfolio | ||
| Real Asset Strategy | $296.1 | 75 bp (flat fee) |
The Adviser is reimbursed as specified in the Investment Advisory Agreement for certain clerical, legal, accounting, administrative and other services provided to the Strategy. During the Strategy’s most recently completed fiscal year, the Adviser was entitled to receive $60,000 (0.57% of the Strategy’s average daily net assets) for such services, but waived the amount in its entirety.
The Adviser agreed to waive that portion of its advisory fees and/or reimburse the Strategy for that portion of the Strategy’s total operating expenses to the degree necessary to limit the Strategy’s expense ratios to the amounts set forth below for the Strategy’s current fiscal year. The waiver is terminable by the Adviser at the end of the Strategy’s fiscal year upon at least 60 days written notice. In addition, set forth below are the Strategy’s gross expense ratios, annualized for the most recent semi-annual period:
| Strategy | Expense Cap Pursuant to Expense Limitation Undertaking | Gross Ratio4 | Fiscal Year End | |||||||||||
| Real Asset Strategy | Advisor Class A Class C Class R Class K Class I Class 1 Class 2 |
| 0.75 1.05 1.75 1.25 1.00 0.75 1.00 0.75 | % % % % % % % % |
| 2.55 2.71 3.50 4.14 3.88 3.61 2.36 3.79 | % % % % % % % % | October 31 | ||||||
| 3 | Jones v. Harris at 1427. |
| 4 | Annualized. |
| 64 | • ALLIANCEBERNSTEIN REAL ASSET STRATEGY |
| I. | ADVISORY FEES CHARGED TO INSTITUTIONAL AND OTHER CLIENTS |
The advisory fees charged to investment companies which the Adviser manages and sponsors are normally higher than those charged to similar sized institutional accounts, including pension plans and sub-advised investment companies. The fee differential reflects, among other things, different services provided to such clients, and different liabilities assumed. Services provided by the Adviser to the Strategy that are not provided to non-investment company clients include providing office space and personnel to serve as Fund Officers, who among other responsibilities make the certifications required under the Sarbanes–Oxley Act of 2002, and coordinating with and monitoring the Strategy’s third party service providers such as Fund counsel, auditors, custodians, transfer agents and pricing services. The accounting, administrative, legal and compliance requirements for the Strategy are more costly than those for institutional client assets due to the greater complexities and time required for investment companies, although as previously noted, the Adviser is entitled to be reimbursed for providing some of these services. Also, retail mutual funds managed by the Adviser are widely held and accordingly, servicing the Strategy’s investors is more time consuming and labor intensive compared to servicing institutional clients since the Adviser needs to communicate with a more extensive network of financial intermediaries and shareholders. The Adviser also believes that it incurs substantial entrepreneurial risk when offering a new mutual fund since establishing a new mutual fund requires a large upfront investment and it may take a long time for the fund to achieve profitability since the fund must be priced to scale from inception in order to be competitive and assets are acquired one account at a time. In addition, managing the cash flow of an investment company may be more difficult than that of a stable pool of assets, such as an institutional account with little cash movement in either direction, particularly if the Strategy is in net redemption and the Adviser is frequently forced to sell securities to raise cash for redemptions. However, managing a fund with positive cash flow may be easier at times than managing a stable pool of assets. Finally, in recent years, investment advisers have been sued by institutional clients and have suffered reputational damage both by the attendant publicity and outcomes other than complete victories. Accordingly, the legal and reputational risks associated with institutional accounts are greater than previously thought, although arguably still not equal to those related to the mutual fund industry.
Notwithstanding the Adviser’s view that managing an investment company is not comparable to managing other institutional accounts because the services provided are different, the Supreme Court has indicated consideration should be given to the advisory fees charged to institutional accounts with a similar investment style as the Strategy.5 In addition to the AllianceBernstein
| 5 | The Supreme Court stated that “courts may give such comparisons the weight that they merit in light of the similarities and differences between the services that the clients in question require, but the courts must be wary of inapt comparisons.” Among the significant differences the Supreme Court noted that may exist between services provided to mutual funds and institutional accounts are “higher marketing costs.” Jones v. Harris at 1428. |
| ALLIANCEBERNSTEIN REAL ASSET STRATEGY • | 65 |
Institutional fee schedule, set forth below is what would have been the effective advisory fee for the Strategy had the AllianceBernstein Institutional fee schedule been applicable to the Strategy versus the Strategy’s advisory fees based on September 30, 2011 net assets.6
| Strategy | Net Assets 09/30/11 ($MM) | AllianceBernstein (“AB”) Fee Schedule | Effective AB Inst. Adv. Fee | Strategy Advisory Fee | ||||||||||
| Real Asset Strategy | $296.1 | Real Asset Strategy Schedule 75 bp on 1st $150 million 60 bp on next $150 million 50 bp on the balance Minimum Acct Size: $150 million | 0.530% | 0.750% | ||||||||||
The Adviser has represented that it does not sub-advise any registered investment companies with a substantially similar investment style as the Strategy.
| II. | MANAGEMENT FEES CHARGED BY OTHER MUTUAL FUND COMPANIES FOR LIKE SERVICES. |
Lipper, Inc., an analytical service that is not affiliated with the Adviser, compared the fees charged to the Strategy with fees charged to other investment companies for similar services by other investment advisers.7 Lipper’s analysis included the comparison of the Strategy’s contractual management fee,8,9 estimated at the approximate current asset level of the subject Strategy, to the median of the Strategy’s Lipper Expense Group (“EG”) and the Strategy’s contractual management fee ranking.
Lipper describes an EG as a representative sample of comparable funds. Lipper’s standard methodology for screening funds to be included in an EG entails the consideration of several fund criteria, including fund type, investment classification/objective, load type and similar 12b-1/non-12b-1 service fees, asset
| 6 | The Adviser has indicated that with respect to institutional accounts with assets greater than $300 million, it will negotiate a fee schedule. Discounts that are negotiated vary based upon each client relationship. |
| 7 | The Supreme Court cautioned against accepting mutual fund fee comparisons without careful scrutiny since “these comparisons are problematic because these fees, like those challenged, may not be the product of negotiations conducted at arm’s length.” Jones v. Harris at 1429. |
| 8 | The contractual management fee is calculated by Lipper using the Strategy’s contractual management fee rate at a hypothetical asset level. The hypothetical asset level is based on the combined net assets of all classes of the Strategy, rounded up to the next $25 million. Lipper’s total expense ratio information is based on the most recent annual report except as otherwise noted. A ranking of “1” means that the Strategy has the lowest effective fee rate in the Lipper peer group. |
| 9 | The contractual management fee does not reflect any expense reimbursements made by the Strategy to the Adviser for certain clerical, legal, accounting, administrative, and other services. In addition, the contractual management fee does not reflect any advisory fee waivers or expense reimbursements made by the Adviser that would effectively reduce the actual effective management fee. |
| 66 | • ALLIANCEBERNSTEIN REAL ASSET STRATEGY |
(size) comparability, expense components and attributes. An EG will typically consist of seven to twenty funds.
| Strategy | Contractual Management Fee (%) | Lipper Expense Median | Rank | |||||||
| Real Asset Strategy | 0.750 | 1.000 | 2/9 | |||||||
Lipper also compared the Strategy’s total expense ratio to the medians of the Strategy’s EG and Lipper Expense Universe (“EU”). The EU10 is a broader group compared to the EG, consisting of all funds that have the same investment classification/objective and load type as the subject Strategy.
| Strategy | Expense Ratio (%) | Lipper Exp. Group Median (%) | Lipper Group Rank | Lipper Exp. Median (%) | Lipper Rank | |||||||||||||||
| Real Asset Strategy | 1.050 | 1.468 | 1/9 | 1.279 | 5/26 | |||||||||||||||
Based on this analysis, the Portfolio has a more favorable ranking on a total expense ratio basis than on a contractual management fee basis.
| III. | COSTS TO THE ADVISER AND ITS AFFILIATES OF SUPPLYING SERVICES PURSUANT TO THE MANAGEMENT FEE ARRANGEMENT, EXCLUDING ANY INTRA-CORPORATE PROFIT. |
The Adviser utilizes two profitability reporting systems, which operate independently but are aligned with each other, to estimate the Adviser’s profitability in connection with investment advisory services provided to the Strategy. The Senior Officer has retained a consultant to provide independent advice regarding the alignment of the two profitability systems as well as the methodologies and allocations utilized by both profitability systems. See Section IV for additional discussion.
| IV. | PROFIT MARGINS OF THE ADVISER AND ITS AFFILIATES FOR SUPPLYING SUCH SERVICES. |
The profitability information for the Strategy, prepared by the Adviser for the Board of Directors, was reviewed by the Senior Officer and the independent consultant. The Adviser’s profitability from providing investment advisory services to the Strategy in 2010 was negative.
In addition to the Adviser’s direct profits from managing the Strategy, certain of the Adviser’s affiliates have business relationships with the Strategy and may earn a profit from providing other services to the Strategy. The courts have referred to this type of business opportunity as “fall-out benefits” to the Adviser and indicated that such benefits should be factored into the evaluation of the total
| 10 | Except for asset (size) comparability, Lipper uses the same criteria for selecting an EG when selecting an EU. Unlike the EG, the EU allows for the same adviser to be represented by more than just one fund. |
| ALLIANCEBERNSTEIN REAL ASSET STRATEGY • | 67 |
relationship between the Strategy and the Adviser. Neither case law nor common business practice precludes the Adviser’s affiliates from earning a reasonable profit on this type of relationship provided the affiliates’ charges and services are competitive. These affiliates provide transfer agent, distribution and brokerage related services to the Strategy and receive transfer agent fees, front-end sales loads, Rule 12b-1 payments, contingent deferred sales charges (“CDSC”) and brokerage commissions. In addition, the Adviser benefits from soft dollar arrangements which offset expenses the Adviser would otherwise incur. During the Strategy’s most recently completed fiscal year, ABI received from the Portfolio $628, $1,160 and $0 in front-end sales charges, Rule 12b-1 and CDSC fees, respectively.
AllianceBernstein Investments, Inc. (“ABI”), an affiliate of the Adviser, is the Strategy’s principal underwriter. ABI and the Adviser have disclosed in the Strategy’s prospectus that they may make revenue sharing payments from their own resources, in addition to revenues derived from sales loads and Rule 12b-1 fees, to firms that sell shares of the Strategy. In 2010, ABI paid approximately 0.04% of the average monthly assets of the AllianceBernstein Mutual Funds or approximately $13.8 million for distribution services and educational support (revenue sharing payments).
Fees and reimbursements for out of pocket expenses charged by AllianceBernstein Investor Services, Inc. (“ABIS”), the affiliated transfer agent for the Strategy, are charged on a per account basis, based on the level of service provided and the class of share held by the account. ABIS also receives a fee per shareholder sub-account for each account maintained by an intermediary on an omnibus basis. During the Strategy’s most recently completed fiscal year, ABIS received $9,082 in fees from the Strategy.
The Strategy effected brokerage transactions through the Adviser’s affiliate, Sanford C. Bernstein & Co., LLC (“SCB & Co.”) and/or its U.K. affiliate, Sanford C. Bernstein Limited (“SCB Ltd.”), collectively “SCB,” and paid commissions for such transactions during the Strategy’s most recently completed fiscal year. The Adviser represented that SCB’s profitability from business conducted with the Strategy is comparable to the profitability of SCB’s dealings with other similar third party clients. In the ordinary course of business, SCB receives and pays liquidity rebates from electronic communications networks (“ECNs”) derived from trading for its clients, including the Strategy. These credits and charges are not being passed onto to any SCB client. The Adviser also receives certain soft dollar benefits from brokers that execute agency trades for its clients. These soft dollar benefits reduce the Adviser’s research expense and increase its profitability.
| 68 | • ALLIANCEBERNSTEIN REAL ASSET STRATEGY |
| V. | POSSIBLE ECONOMIES OF SCALE |
The Adviser has indicated that economies of scale are being shared with shareholders through fee structures,11 subsidies and enhancement to services. Based on some of the professional literature that has considered economies of scale in the mutual fund industry, it is thought that to the extent economies of scale exist, they may more often exist across a fund family as opposed to a specific fund. This is because the costs incurred by the Adviser, such as investment research or technology for trading or compliance systems, can be spread across a greater asset base as the fund family increases in size. It is also possible that as the level of services required to operate a successful investment company has increased over time, and advisory firms have made such investments in their business to provide services, there may be a sharing of economies of scale without a reduction in advisory fees.
In February 2008, an independent consultant, retained by the Senior Officer, provided the Board of Directors an update of the Deli12 study on advisory fees and various fund characteristics.13 The independent consultant first reiterated the results of his previous two dimensional comparison analysis (fund size and family size) with the Board of Directors.14 The independent consultant then discussed the results of the regression model that was utilized to study the effects of various factors on advisory fees. The regression model output indicated that the bulk of the variation in fees predicted were explained by various factors, but substantially by fund assets under management (“AUM”), family AUM, index fund indicator and investment style. The independent consultant also compared the advisory fees of the AllianceBernstein Mutual Funds to similar funds managed by 19 other large asset managers, regardless of fund size and the large asset manager’s proportion of mutual fund assets to non-mutual fund assets.
| 11 | Fee structures include fee reductions, pricing at scale and breakpoints in advisory fee schedules. |
| 12 | The Deli study, originally published in 2002 based on 1997 data and updated for the February 2008 presentation, may be of diminished value due to the age of the data used in the presentation and the changes experienced in the industry over the last four years. |
| 13 | As mentioned previously, the Supreme Court cautioned against accepting mutual fund fee comparisons without careful scrutiny since the fees may not be the product of negotiations conducted at arm’s length. See Jones V. Harris at 1429. |
| 14 | The two dimensional analysis showed patterns of lower advisory fees for funds with larger asset sizes and funds from larger family sizes compared to funds with smaller asset sizes and funds from smaller family sizes, which according to the independent consultant is indicative of a sharing of economies of scale and scope. However, in less liquid and active markets, such is not the case, as the empirical analysis showed potential for diseconomies of scale in those markets. The empirical analysis also showed diminishing economies of scale and scope as funds surpassed a certain high level of assets. |
| ALLIANCEBERNSTEIN REAL ASSET STRATEGY • | 69 |
| VI. | NATURE AND QUALITY OF THE ADVISER’S SERVICES, INCLUDING THE PERFORMANCE OF THE FUND |
With assets under management of approximately $402 billion as of September 30, 2011, the Adviser has the investment experience to manage and provide non-investment services (described in Section I) to the Strategy.
The information below shows the 1 year performance return and rankings of the Strategy15 relative to its Lipper Performance Group (“PG”) and Lipper Performance Universe (“PU”)16 for the periods ended July 31, 2011.17
| Strategy | Strategy Return (%) | PG Median (%) | PU Median (%) | PG Rank | PU Rank | |||||||||||||||
| Real Asset Strategy | ||||||||||||||||||||
1 year | 24.97 | 22.51 | 13.77 | 2/9 | 2/44 | |||||||||||||||
Set forth below are the 1 year and since inception net performance returns of the Strategy (in bold)18 versus its benchmark.19 Strategy and benchmark volatility and reward-to-variability ratio (“Sharpe Ratio”) information is also shown.20
Periods Ending July 31, 2011 Annualized Performance | ||||||||||||||||||||
| 1 Year (%) | Since Inception (%) | Annualized | Risk Period (Year) | |||||||||||||||||
| Volatility (%) | Sharpe (%) | |||||||||||||||||||
| Real Asset Strategy | 24.97 | 16.29 | 13.49 | 1.65 | 1 | |||||||||||||||
| MSCI AC World Commodity Producers Index | 27.23 | 12.11 | 16.09 | 1.58 | 1 | |||||||||||||||
| Inception Date: March 8, 2010 | ||||||||||||||||||||
| 15 | The performance returns and rankings are for the Class A shares of the Strategy. The performance returns of the Strategy were provided Lipper. Lipper maintains its own database that includes the Strategy’s performance returns. |
| 16 | The Strategy’s PG is identical to the Strategy’s EG. The Strategy’s PU is not identical to the Strategy’s EU as the criteria for including/excluding a strategy in/from a PU are somewhat different from that of an EU. |
| 17 | Note that the current Lipper investment classification/objective dictates the PG and PU throughout the life of the Strategy even if the Strategy may have had a different investment classification/objective at different points in time. |
| 18 | The performance returns and risk measures shown in the table are for the Class A shares of the Strategy. |
| 19 | The Adviser provided Strategy and benchmark performance return information for the periods through July 31, 2011. |
| 20 | Strategy and benchmark volatility and Sharpe Ratio information was obtained through Lipper LANA, a database maintained by Lipper. Volatility is a statistical measure of the tendency of a market price or yield to vary over time. A Sharpe Ratio is a risk adjusted measure of return that divides a fund’s return in excess of the riskless return by the fund’s standard deviation. A strategy with a greater volatility would be viewed as more risky than a strategy with equivalent performance but lower volatility; for that reason, a greater return would be demanded for the more risky fund. A strategy with a higher Sharpe Ratio would be regarded as better performing than a strategy with a lower Sharpe Ratio. |
| 70 | • ALLIANCEBERNSTEIN REAL ASSET STRATEGY |
CONCLUSION:
Based on the factors discussed above the Senior Officer’s conclusion is that the proposed advisory fee for the Strategy is reasonable and within the range of what would have been negotiated at arm’s-length in light of all the surrounding circumstances. This conclusion in respect of the Strategy is based on an evaluation of all of these factors and no single factor was dispositive.
Dated: November 28, 2011
| ALLIANCEBERNSTEIN REAL ASSET STRATEGY • | 71 |
THIS PAGE IS NOT PART OF THE SHAREHOLDER REPORT OR THE FINANCIAL STATEMENTS
ALLIANCEBERNSTEIN FAMILY OF FUNDS
Wealth Strategies Funds
Balanced Wealth Strategy
Conservative Wealth Strategy
Wealth Appreciation Strategy
Tax-Managed Balanced Wealth Strategy
Tax-Managed Conservative Wealth Strategy
Tax-Managed Wealth Appreciation Strategy
Asset Allocation/Multi-Asset
Emerging Markets Multi-Asset
International Portfolio
Real Asset Strategy
Tax-Managed International Portfolio
Growth Funds
Domestic
Growth Fund
Large Cap Growth Fund
Small Cap Growth Portfolio
Small/Mid Cap Growth Fund
U.S. Strategic Research Portfolio
Global & International
Global Thematic Growth Fund
Greater China ’97 Fund
International Discovery Equity Portfolio
International Focus 40 Portfolio
International Growth Fund
Value Funds
Domestic
Core Opportunities Fund
Equity Income Fund
Growth & Income Fund
Small/Mid Cap Value Fund
Value Fund
Global & International
Global Real Estate Investment Fund
Global Value Fund
International Value Fund
Taxable Bond Funds
Bond Inflation Strategy
Global Bond Fund
High Income Fund
Intermediate Bond Portfolio
Short Duration Portfolio
Unconstrained Bond Fund*
Municipal Bond Funds
Arizona California High Income Massachusetts Michigan Minnesota Municipal Bond Inflation Strategy | National New Jersey New York Ohio Pennsylvania Virginia |
Intermediate Municipal Bond Funds
Intermediate California
Intermediate Diversified
Intermediate New York
Closed-End Funds
Alliance California Municipal Income Fund
Alliance New York Municipal Income Fund
AllianceBernstein Global High Income Fund
AllianceBernstein Income Fund
AllianceBernstein National Municipal Income Fund
Alternatives
Market Neutral Strategy-Global
Market Neutral Strategy-U.S.
Balanced
Balanced Shares
Retirement Strategies Funds
2000 Retirement Strategy | 2020 Retirement Strategy | 2040 Retirement Strategy | ||
2005 Retirement Strategy | 2025 Retirement Strategy | 2045 Retirement Strategy | ||
2010 Retirement Strategy | 2030 Retirement Strategy | 2050 Retirement Strategy | ||
2015 Retirement Strategy | 2035 Retirement Strategy | 2055 Retirement Strategy |
We also offer Exchange Reserves,** which serves as the money market fund exchange vehicle for the AllianceBernstein mutual funds.
You should consider the investment objectives, risks, charges and expenses of any AllianceBernstein fund/portfolio carefully before investing. For free copies of our prospectuses, which contain this and other information, visit us online at www.alliancebernstein.com or contact your financial advisor. Please read the prospectus carefully before investing.
| * | Prior to February 3, 2011, Unconstrained Bond Fund was named Diversified Yield Fund. |
| ** | An investment in the Fund is not a deposit in a bank and is not insured or guaranteed by the Federal Deposit Insurance Corporation or any other government agency. Although the Fund seeks to preserve the value of your investment at $1.00 per share, it is possible to lose money by investing in the Fund. |
| 72 | • ALLIANCEBERNSTEIN REAL ASSET STRATEGY |
AllianceBernstein Family of Funds
NOTES
| ALLIANCEBERNSTEIN REAL ASSET STRATEGY • | 73 |
NOTES
| 74 | • ALLIANCEBERNSTEIN REAL ASSET STRATEGY |
NOTES
| ALLIANCEBERNSTEIN REAL ASSET STRATEGY • | 75 |
NOTES
| 76 | • ALLIANCEBERNSTEIN REAL ASSET STRATEGY |
ALLIANCEBERNSTEIN REAL ASSET STRATEGY
1345 Avenue of the Americas
New York, NY 10105
800.221.5672
| RAS-0151-1011 |  | |
| ITEM 2. | CODE OF ETHICS. |
(a) The registrant has adopted a code of ethics that applies to its principal executive officer, principal financial officer and principal accounting officer. A copy of the registrant’s code of ethics is filed herewith as Exhibit 12(a)(1).
(b) During the period covered by this report, no material amendments were made to the provisions of the code of ethics adopted in 2(a) above.
(c) During the period covered by this report, no implicit or explicit waivers to the provisions of the code of ethics adopted in 2(a) above were granted.
| ITEM 3. | AUDIT COMMITTEE FINANCIAL EXPERT. |
The registrant’s Board of Directors has determined that independent directors Garry L. Moody and William H. Foulk, Jr. qualify as audit committee financial experts.
| ITEM 4. | PRINCIPAL ACCOUNTANT FEES AND SERVICES. |
(a) - (c) The following table sets forth the aggregate fees billed by the independent registered public accounting firm Ernst & Young LLP, for the Fund’s last two fiscal years for professional services rendered for: (i) the audit of the Fund’s annual financial statements included in the Fund’s annual report to stockholders; (ii) assurance and related services that are reasonably related to the performance of the audit of the Fund’s financial statements and are not reported under (i), which include advice and education related to accounting and auditing issues and quarterly press release review (for those Funds which issue press releases), and preferred stock maintenance testing (for those Funds that issue preferred stock); and (iii) tax compliance, tax advice and tax return preparation.
| Audit Fees | Audit - Related Fees | Tax Fees | ||||||||||||||
AB Intermediate Bond | 2010 | $ | 44,500 | $ | — | $ | 11,924 | |||||||||
| 2011 | $ | 44,500 | $ | 295 | $ | 12,844 | ||||||||||
AB Bond Inflation Strategy | 2010 | $ | 33,375 | $ | — | $ | 11,089 | |||||||||
| 2011 | $ | 40,500 | $ | 295 | $ | 12,843 | ||||||||||
AB Municipal Bond Inflation Strategy | 2010 | $ | 23,468 | $ | — | $ | 11,089 | |||||||||
| 2011 | $ | 31,290 | $ | 295 | $ | 12,466 | ||||||||||
AB Real Asset Strategy | 2010 | $ | 26,250 | $ | 20,742 | |||||||||||
| 2011 | $ | 42,000 | $ | 295 | $ | 32,159 | ||||||||||
(d) Not applicable.
(e) (1) Beginning with audit and non-audit service contracts entered into on or after May 6, 2003, the Fund’s Audit Committee policies and procedures require the pre-approval of all audit and non-audit services provided to the Fund by the Fund’s independent
registered public accounting firm. The Fund’s Audit Committee policies and procedures also require pre-approval of all audit and non-audit services provided to the Adviser and Service Affiliates to the extent that these services are directly related to the operations or financial reporting of the Fund.
(e) (2) All of the amounts for Audit Fees, Audit-Related Fees and Tax Fees in the table under Item 4 (a) – (c) are for services pre-approved by the Fund’s Audit Committee.
(f) Not applicable.
(g) The following table sets forth the aggregate non-audit services provided to the Fund, the Fund’s Adviser and entities that control, are controlled by or under common control with the Adviser that provide ongoing services to the Fund, which include preparing an annual internal control report pursuant to Statement on Auditing Standards No. 70 (“Service Affiliates”):
| All Fees for Non-Audit Services Provided to the Portfolio, the Adviser and Service Affiliates | Pre-approved by the Audit Committee (Portion Comprised of Audit Related Fees) (Portion Comprised of Tax Fees) | |||||||||||
AB Intermediate Bond | 2010 | $ | 704,104 | $ | 139,639 | |||||||
| $ | (127,715 | ) | ||||||||||
| $ | (11,924 | ) | ||||||||||
| 2011 | $ | 688,805 | $ | 13,139 | ||||||||
| $ | (295 | ) | ||||||||||
| $ | (12,844 | ) | ||||||||||
AB Bond Inflation Strategy | 2010 | $ | 575,554 | $ | 11,089 | |||||||
| $ | — | |||||||||||
| $ | (11,089 | ) | ||||||||||
| 2011 | $ | 688,804 | $ | 13,138 | ||||||||
| $ | (295 | ) | ||||||||||
| $ | (12,843 | ) | ||||||||||
AB Municipal Bond Inflation Strategy | 2010 | $ | 575,554 | $ | 11,089 | |||||||
| $ | — | |||||||||||
| $ | (11,089 | ) | ||||||||||
| 2011 | $ | 688,427 | $ | 12,761 | ||||||||
| $ | (295 | ) | ||||||||||
| $ | (12,466 | ) | ||||||||||
AB Real Asset Strategy | 2010 | $ | 585,207 | $ | 20,742 | |||||||
| $ | — | |||||||||||
| $ | (20,742 | ) | ||||||||||
| 2011 | $ | 708,120 | $ | 32,454 | ||||||||
| $ | (295 | ) | ||||||||||
| $ | (32,159 | ) | ||||||||||
(h) The Audit Committee of the Fund has considered whether the provision of any non-audit services not pre-approved by the Audit Committee provided by the Fund’s independent registered public accounting firm to the Adviser and Service Affiliates is compatible with maintaining the auditor’s independence.
| ITEM 5. | AUDIT COMMITTEE OF LISTED REGISTRANTS. |
Not applicable to the registrant.
| ITEM 6. | SCHEDULE OF INVESTMENTS. |
Please see Schedule of Investments contained in the Report to Shareholders included under Item 1 of this Form N-CSR.
| ITEM 7. | DISCLOSURE OF PROXY VOTING POLICIES AND PROCEDURES FOR CLOSED-END MANAGEMENT INVESTMENT COMPANIES. |
Not applicable to the registrant.
| ITEM 8. | PORTFOLIO MANAGERS OF CLOSED-END MANAGEMENT INVESTMENT COMPANIES. |
Not applicable to the registrant.
| ITEM 9. | PURCHASES OF EQUITY SECURITIES BY CLOSED-END MANAGEMENT INVESTMENT COMPANY AND AFFILIATED PURCHASERS. |
Not applicable to the registrant.
| ITEM 10. | SUBMISSION OF MATTERS TO A VOTE OF SECURITY HOLDERS. |
There have been no material changes to the procedures by which shareholders may recommend nominees to the Fund’s Board of Directors since the Fund last provided disclosure in response to this item.
| ITEM 11. | CONTROLS AND PROCEDURES. |
(a) The registrant’s principal executive officer and principal financial officer have concluded that the registrant’s disclosure controls and procedures (as defined in Rule 30a-3 (c) under the Investment Company Act of 1940, as amended) are effective at the reasonable assurance level based on their evaluation of these controls and procedures as of a date within 90 days of the filing date of this document.
(b) There were no changes in the registrant’s internal controls over financial reporting that occurred during the second fiscal quarter of the period that has materially affected, or is reasonably likely to materially affect, the registrant’s internal control over financial reporting.
| ITEM 12. | EXHIBITS. |
The following exhibits are attached to this Form N-CSR:
EXHIBIT NO. | DESCRIPTION OF EXHIBIT | |
| 12 (a) (1) | Code of Ethics that is subject to the disclosure of Item 2 hereof | |
| 12 (b) (1) | Certification of Principal Executive Officer Pursuant to Section 302 of the Sarbanes-Oxley Act of 2002 | |
| 12 (b) (2) | Certification of Principal Financial Officer Pursuant to Section 302 of the Sarbanes-Oxley Act of 2002 | |
| 12 (c) | Certification of Principal Executive Officer and Principal Financial Officer Pursuant to Section 906 of the Sarbanes-Oxley Act of 2002 | |
SIGNATURES
Pursuant to the requirements of the Securities Exchange Act of 1934 and the Investment Company Act of 1940, the registrant has duly caused this report to be signed on its behalf by the undersigned, thereunto duly authorized.
(Registrant): AllianceBernstein Bond Fund, Inc.
| By: | /s/ Robert M. Keith | |
| Robert M. Keith | ||
President
| ||
| Date: | December 22, 2011 |
Pursuant to the requirements of the Securities Exchange Act of 1934 and the Investment Company Act of 1940, this report has been signed below by the following persons on behalf of the registrant and in the capacities and on the dates indicated.
| By: | /s/ Robert M. Keith | |
| Robert M. Keith | ||
President
| ||
| Date: | December 22, 2011 |
| By: | /s/ Joseph J. Mantineo | |
| Joseph J. Mantineo | ||
Treasurer and Chief Financial Officer
| ||
| Date: | December 22, 2011 |