UNITED STATES
SECURITIES AND EXCHANGE COMMISSION
WASHINGTON, D.C. 20549
FORM N-CSR
CERTIFIED SHAREHOLDER REPORT OF REGISTERED
MANAGEMENT INVESTMENT COMPANIES
Investment Company Act file number: 811-02383
ALLIANCEBERNSTEIN BOND FUND, INC.
(Exact name of registrant as specified in charter)
1345 Avenue of the Americas, New York, New York 10105
(Address of principal executive offices) (Zip code)
Joseph J. Mantineo
AllianceBernstein L.P.
1345 Avenue of the Americas
New York, New York 10105
(Name and address of agent for service)
Registrant’s telephone number, including area code: (800) 221-5672
Date of fiscal year end: October 31, 2014
Date of reporting period: October 31, 2014
ITEM 1. REPORTS TO STOCKHOLDERS.
ANNUAL REPORT
AllianceBernstein
Bond Inflation Strategy
October 31, 2014
Annual Report

Investment Products Offered
• Are Not FDIC Insured • May Lose Value • Are Not Bank Guaranteed |
Investors should consider the investment objectives, risks, charges and expenses of the Fund carefully before investing. For copies of our prospectus or summary prospectus, which contain this and other information, visit us online at www.alliancebernstein.com or contact your AllianceBernstein Investments representative. Please read the prospectus and/or summary prospectus carefully before investing.
This shareholder report must be preceded or accompanied by the Fund’s prospectus for individuals who are not current shareholders of the Fund.
You may obtain a description of the Fund’s proxy voting policies and procedures, and information regarding how the Fund voted proxies relating to portfolio securities during the most recent 12-month period ended June 30, without charge. Simply visit AllianceBernstein’s website at www.alliancebernstein.com, or go to the Securities and Exchange Commission’s (the “Commission”) website at www.sec.gov, or call AllianceBernstein at (800) 227-4618.
The Fund files its complete schedule of portfolio holdings with the Commission for the first and third quarters of each fiscal year on Form N-Q. The Fund’s Forms N-Q are available on the Commission’s website at www.sec.gov. The Fund’s Forms N-Q may also be reviewed and copied at the Commission’s Public Reference Room in Washington, DC; information on the operation of the Public Reference Room may be obtained by calling (800) SEC-0330. AllianceBernstein publishes full portfolio holdings for the Fund monthly at www.alliancebernstein.com.
AllianceBernstein Investments, Inc. (ABI) is the distributor of the AllianceBernstein family of mutual funds. ABI is a member of FINRA and is an affiliate of AllianceBernstein L.P., the manager of the funds.
AllianceBernstein® and the AB Logo are registered trademarks and service marks used by permission of the owner, AllianceBernstein L.P.
December 11, 2014
Annual Report
This report provides management’s discussion of fund performance for AllianceBernstein Bond Inflation Strategy (the “Strategy”) for the annual reporting period ended October 31, 2014.
Investment Objectives and Policies
The Strategy seeks to maximize real return without assuming what AllianceBernstein L.P. (the “Adviser”) considers to be undue risk. Real return is the rate of return after adjusting for inflation.
The Strategy pursues its objective by investing principally in inflation-indexed securities (such as Treasury Inflation-Protected Securities or “TIPS”, or inflation-indexed securities from issuers other than the U.S. Treasury) or by gaining inflation protection through derivatives transactions, such as inflation (“CPI”) swaps or total return swaps linked to TIPS. In deciding whether to purchase inflation-indexed securities or use inflation-linked derivatives transactions, the Adviser will consider the relative costs and efficiency of each method. In addition, in seeking to maximize real return, the Strategy may invest in other fixed-income investments such as U.S. and non-U.S. government securities, corporate fixed-income securities and mortgage-related securities, as well as derivatives linked to such securities.
Under normal circumstances, the Strategy invests at least 80% of its net assets in fixed-income securities. While the Strategy expects to invest principally in investment-grade securities, it may invest up to 15% of its total assets in
fixed-income securities rated BB or B or the equivalent by at least one national rating agency (or deemed by the Adviser to be of comparable credit quality), which are not investment-grade (“junk bonds”).
Inflation-indexed securities are fixed-income securities structured to provide protection against inflation. Their principal value and/or the interest paid on them are adjusted to reflect official inflation measures. The inflation measure for TIPS is the Consumer Price Index for Urban Consumers. The Strategy may also invest in other inflation-indexed securities, issued by both U.S. and non-U.S. issuers, and in derivative instruments linked to these securities.
The Strategy may invest to the extent permitted by applicable law in derivatives, such as options, futures, forwards, or swaps. The Strategy intends to use leverage for investment purposes. To do this, the Strategy expects to enter into (i) reverse repurchase agreement transactions and use the cash made available from these transactions to make additional investments in fixed-income securities in accordance with the Strategy’s investment policies and (ii) total return swaps. In determining when and to what extent to employ leverage or enter into derivatives transactions, the Adviser will consider factors such as the relative risks and returns expected of potential investments and the costs of such transactions. The Adviser will consider the impact of reverse repurchase agreements, swaps and other derivatives in making its assessments of the Strategy’s risks. The resulting exposures to markets, sectors, issuers or specific securities will be continuously monitored by the Adviser.
| ALLIANCEBERNSTEIN BOND INFLATION STRATEGY • | 1 |
The Adviser selects securities for purchase or sale based on its assessment of the securities’ risk and return characteristics as well as the securities’ impact on the overall risk and return characteristics of the Strategy. In making this assessment, the Adviser takes into account various factors, including the credit quality and sensitivity to interest rates of the securities under consideration and of the Strategy’s other holdings.
The Strategy may also invest in loan participations, structured securities, asset-backed securities, variable, floating, and inverse floating-rate instruments, and preferred stock, and may use other investment techniques. The Strategy may invest in fixed-income securities of any maturity and duration. If the rating of a fixed-income security falls below investment grade, the Strategy will not be obligated to sell the security and may continue to hold it if, in the Adviser’s opinion, the investment is appropriate under the circumstances.
Investment Results
The table on page 6 shows the Strategy’s performance compared to its benchmark, the Barclays 1-10 Year TIPS Index, and to the Lipper TIPS Fund Average (the “Lipper Average”) for the six- and 12-month periods ended October 31, 2014. Funds in the Lipper Average have generally similar investment objectives to the Strategy, although some of the funds may have different investment policies and sales and management fees and fund expenses.
For the 12-month period, all share classes of the Strategy outperformed the benchmark excluding Class C;
Classes 1, 2, I and Advisor Class shares outperformed the Lipper Average; all other share classes underperformed. For the six-month period, all share classes outperformed the benchmark excluding Classes A, C and R; all share classes underperformed the Lipper Average. Non-Treasury sectors benefited performance during the 12-month period, from the low-yield environment and continued ample global liquidity. For both periods, exposure to commercial mortgage-backed and asset-backed securities, and select emerging-market corporates, all contributed to performance. Investment-grade and high-yield corporate exposure contributed for the 12-month period, yet detracted for the six-month period as market volatility rose in the final months of the period. Currency exposure, specifically an overweight to the U.S. dollar versus short positions in several developed-market currencies, also contributed.
During both periods, the Strategy utilized derivatives including currency forwards for hedging purposes, as well as to manage active currency positions. As part of the Strategy’s credit position, credit default swaps were utilized as a substitute for corporate bonds and for hedging purposes, which in aggregate had an immaterial impact on performance during both periods. Treasury futures, and interest rate and CPI swaps, were utilized to manage duration, inflation protection, country exposure and yield curve positioning of the Strategy; duration, inflation protection and yield curve positioning detracted during both periods. The Strategy also utilized leverage through reverse repurchase agreements.
| 2 | • ALLIANCEBERNSTEIN BOND INFLATION STRATEGY |
Market Review and Investment Strategy
During the 12-month period, markets remained heavily focused on the direction of interest rates, central bank monetary policy and global growth. Early in the period, volatility increased as the U.S. Federal Reserve (the “Fed”) began to taper its asset purchase program and investors worried about the impact of higher interest rates. However, fixed-income markets stabilized in the first quarter of 2014 and bond fund flows turned positive once again, as U.S. economic data cooled, blamed mostly on winter weather. Ongoing geopolitical concerns, specifically the conflict between Ukraine and Russia, as well as continued violence in the Middle East, contributed to periodic safe haven rallies into U.S. Treasuries, keeping a lid on yields.
Contrary to expectations, interest rates continued to decline toward the end of the period as investors became increasingly wary regarding global growth, particularly in Europe and China. Worries about Europe increased as core inflation moved closer to zero and the European Central Bank (“ECB”) cut key interest rates, announcing plans to repurchase asset-backed securities and covered bonds to further stimulate the struggling economy. Low yields in the euro area and further easing by the ECB helped anchor U.S. Treasury yields.
The U.S. Federal Open Market Committee (“FOMC”) also announced no changes to the stance of U.S. monetary policy after its mid-September meeting, easing concerns for higher interest rates. The FOMC reaffirmed its views that U.S. interest rates will remain low until
unemployment and inflation are more closely aligned with Fed targets. However, the Fed did end its monthly bond purchase program at the end of October, and dropped a characterization of U.S. labor market slack as “significant” in a show of confidence in the economy’s prospects. The Fed largely dismissed financial market volatility, dimming growth in Europe and a weak inflation outlook as unlikely to undercut progress toward its unemployment and inflation goals. Despite the intra-period volatility, the ten-year U.S. Treasury yield declined only 0.22% during the 12-month period to end at a yield of 2.34%. The U.S. Treasury curve flattened, as intermediate yields rose and longer-term yields declined.
Against this backdrop, fixed-income sectors benefited from the low-yield environment, with major U.S. fixed-income sectors posting positive returns. Credit-sensitive securities generally outperformed Treasuries with corporate sectors, both investment-grade and high-yield, posting the strongest returns. Corporate fundamentals, as well as earnings, remained favorable amid ample global liquidity and tighter spreads.
For the 12-month period, the TIPS 1-10 year yield curve rose (until rolled out near 10-year maturities), resulting in the modest returns for the benchmark. Inflation accruals were modest and break-evens (the difference between the yield on TIPS and a comparable-maturity Treasury bond) experienced a meaningful decrease across the curve, resulting in TIPS underperforming comparable-maturity Treasury bonds.
| ALLIANCEBERNSTEIN BOND INFLATION STRATEGY • | 3 |
DISCLOSURES AND RISKS
Benchmark Disclosure
The unmanaged Barclays 1-10 Year TIPS Index does not reflect fees and expenses associated with the active management of a mutual fund portfolio. The Barclays 1-10 Year TIPS Index represents the performance of inflation-protected securities issued by the U.S. Treasury. An investor cannot invest directly in an index, and its results are not indicative of the performance for any specific investment, including the Strategy.
A Word About Risk
Market Risk: The value of the Strategy’s assets will fluctuate as the bond market fluctuates. The value of the Strategy’s investments may decline, sometimes rapidly and unpredictably, simply because of economic changes or other events that affect large portions of the market.
Credit Risk: An issuer or guarantor of a fixed-income security, or the counterparty to a derivatives or other contract, may be unable or unwilling to make timely payments of interest or principal, or to otherwise honor its obligations. The issuer or guarantor may default, causing a loss of the full principal amount of a security. The degree of risk for a particular security may be reflected in its credit rating. There is the possibility that the credit rating of a fixed-income security may be downgraded after purchase, which may adversely affect the value of the security. Investments in fixed-income securities with lower ratings tend to have a higher probability that an issuer will default or fail to meet its payment obligations.
Interest Rate Risk: Changes in interest rates will affect the value of investments in fixed-income securities. When interest rates rise, the value of investments in fixed-income securities tends to fall and this decrease in value may not be offset by higher income from new investments. Interest rate risk is generally greater for fixed-income securities with longer maturities or durations.
Duration Risk: Duration is a measure that relates the expected price volatility of a fixed-income security to changes in interest rates. The duration of a fixed-income security may be shorter than or equal to full maturity of a fixed-income security. Fixed-income securities with longer durations have more risk and will decrease in price as interest rates rise. For example, a fixed-income security with a duration of three years will decrease in value by approximately 3% if interest rates increase by 1%.
Inflation Risk: This is the risk that the value of assets or income from investments will be less in the future as inflation decreases the value of money. As inflation increases, the value of the Strategy’s assets can decline as can the value of the Strategy’s distributions. This risk is significantly greater for fixed-income securities with longer maturities. Although the Strategy invests principally in inflation-indexed securities, the value of its securities may be vulnerable to changes in expectations of inflation or interest rates.
Derivatives Risk: Derivatives may be illiquid, difficult to price, and leveraged so that small changes may produce disproportionate losses for the Strategy, and may be subject to counterparty risk to a greater degree than more traditional investments.
Foreign (Non-U.S.) Risk: Investments in securities of non-U.S. issuers may involve more risk than those of U.S. issuers. These securities may fluctuate more widely in price and may be less liquid due to adverse market, economic, political, regulatory or other factors.
Currency Risk: Fluctuations in currency exchange rates may negatively affect the value of the Strategy’s investments or reduce its returns.
(Disclosures, Risks and Note about Historical Performance continued on next page)
| 4 | • ALLIANCEBERNSTEIN BOND INFLATION STRATEGY |
Disclosures and Risks
DISCLOSURES AND RISKS
(continued from previous page)
Leverage Risk: To the extent the Strategy uses leveraging techniques, its net asset value (“NAV”) may be more volatile because leverage tends to exaggerate the effect of changes in interest rates and any increase or decrease in the value of the Strategy’s investments.
Liquidity Risk: Liquidity risk exists when particular investments are difficult to purchase or sell, possibly preventing the Strategy from selling out of these illiquid securities at an advantageous price. Derivatives and securities involving substantial market and credit risk tend to involve greater liquidity risk.
Management Risk: The Strategy is subject to management risk because it is an actively managed investment fund. The Adviser will apply its investment techniques and risk analyses in making investment decisions, but there is no guarantee that its techniques will produce the intended results.
These risks are fully discussed in the Strategy’s prospectus.
An Important Note About Historical Performance
The investment return and principal value of an investment in the Strategy will fluctuate, so that shares, when redeemed, may be worth more or less than their original cost. Performance shown on the following pages represents past performance and does not guarantee future results. Current performance may be lower or higher than the performance information shown. You may obtain performance information current to the most recent month-end by visiting www.alliancebernstein.com. For Class 1 shares, click on “Private Clients”, then “Investments”, then “Stocks” or “Bonds”, then “Mutual Fund Performance at a Glance”.
All fees and expenses related to the operation of the Strategy have been deducted. NAV returns do not reflect sales charges; if sales charges were reflected, the Strategy’s quoted performance would be lower. SEC returns reflect the applicable sales charges for each share class: a 4.25% maximum frontend sales charge for Class A shares; a 1% 1-year contingent deferred sales charge for Class C shares. Class 1 and Class 2 shares do not carry sales charges. Returns for the different share classes will vary due to different expenses associated with each class. Performance assumes reinvestment of distributions and does not account for taxes.
| ALLIANCEBERNSTEIN BOND INFLATION STRATEGY • | 5 |
Disclosures and Risks
HISTORICAL PERFORMANCE
THE STRATEGY VS. ITS BENCHMARK PERIODS ENDED OCTOBER 31, 2014 (unaudited) | NAV Returns | |||||||||
| 6 Months | 12 Months | |||||||||
| AllianceBernstein Bond Inflation Strategy | ||||||||||
Class 1* | 0.43% | 1.38% | ||||||||
| ||||||||||
Class 2* | 0.47% | 1.55% | ||||||||
| ||||||||||
Class A | 0.29% | 1.16% | ||||||||
| ||||||||||
Class C | -0.05% | 0.50% | ||||||||
| ||||||||||
Advisor Class† | 0.49% | 1.50% | ||||||||
| ||||||||||
Class R† | 0.29% | 1.10% | ||||||||
| ||||||||||
Class K† | 0.40% | 1.31% | ||||||||
| ||||||||||
Class I† | 0.45% | 1.52% | ||||||||
| ||||||||||
| Barclays 1-10 Year TIPS Index | 0.37% | 0.60% | ||||||||
| ||||||||||
| Lipper TIPS Fund Average | 0.70% | 1.33% | ||||||||
| ||||||||||
* Class 1 shares are only available to Bernstein Global Wealth Management private client accounts. Class 2 shares are only available to large Bernstein Global Wealth Management private client accounts and the Adviser’s institutional clients or through other limited arrangements.
† Please note that these share classes are for investors purchasing shares through accounts established under certain fee-based programs sponsored and maintained by certain broker-dealers and financial intermediaries, institutional pension plans and/or investment advisory clients of, and certain other persons associated with, the Adviser and its affiliates or the Strategy. | ||||||||||
See Disclosures, Risks and Note about Historical Performance on pages 4-5.
(Historical Performance continued on next page)
| 6 | • ALLIANCEBERNSTEIN BOND INFLATION STRATEGY |
Historical Performance
HISTORICAL PERFORMANCE
(continued from previous page)
GROWTH OF A $10,000 INVESTMENT IN THE STRATEGY 1/26/10* TO 10/31/14 (unaudited)
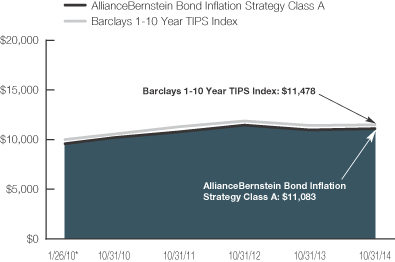
This chart illustrates the total value of an assumed $10,000 investment in AllianceBernstein Bond Inflation Strategy Class A shares (from 1/26/10 to 10/31/14) as compared to the performance of the Strategy’s composite benchmark. The chart reflects the deduction of the maximum 4.25% sales charge from the initial $10,000 investment in the Strategy and assumes the reinvestment of dividends and capital gains distributions.
| * | Inception date: 1/26/2010. |
See Disclosures, Risks and Note about Historical Performance on pages 4-5.
(Historical Performance continued on next page)
| ALLIANCEBERNSTEIN BOND INFLATION STRATEGY • | 7 |
Historical Performance
HISTORICAL PERFORMANCE
(continued from previous page)
| AVERAGE ANNUAL RETURNS AS OF OCTOBER 31, 2014 (unaudited) | ||||||||||||
| NAV Returns | SEC Returns (reflects applicable sales charges) | SEC Yields* | ||||||||||
| Class 1 Shares† | 0.30 | % | ||||||||||
1 Year | 1.38 | % | 1.38 | % | ||||||||
Since Inception‡ | 3.34 | % | 3.34 | % | ||||||||
| Class 2 Shares† | 0.44 | % | ||||||||||
1 Year | 1.55 | % | 1.55 | % | ||||||||
Since Inception‡ | 3.43 | % | 3.43 | % | ||||||||
| Class A Shares | -0.13 | % | ||||||||||
1 Year | 1.16 | % | -3.15 | % | ||||||||
Since Inception‡ | 3.11 | % | 2.18 | % | ||||||||
| Class C Shares | -0.83 | % | ||||||||||
1 Year | 0.50 | % | -0.49 | % | ||||||||
Since Inception‡ | 2.39 | % | 2.39 | % | ||||||||
| Advisor Class Shares^ | 0.16 | % | ||||||||||
1 Year | 1.50 | % | 1.50 | % | ||||||||
Since Inception‡ | 3.41 | % | 3.41 | % | ||||||||
| Class R Shares^ | -0.31 | % | ||||||||||
1 Year | 1.10 | % | 1.10 | % | ||||||||
Since Inception‡ | 2.93 | % | 2.93 | % | ||||||||
| Class K Shares^ | 0.01 | % | ||||||||||
1 Year | 1.31 | % | 1.31 | % | ||||||||
Since Inception‡ | 3.17 | % | 3.17 | % | ||||||||
| Class I Shares^ | 0.43 | % | ||||||||||
1 Year | 1.52 | % | 1.52 | % | ||||||||
Since Inception‡ | 3.43 | % | 3.43 | % | ||||||||
The Strategy’s prospectus fee table shows the Strategy’s total annual operating expense ratios as 0.81%, 0.71%, 1.18%, 1.86%, 0.87%, 1.44%, 1.12% and 0.83% for Class 1, Class 2, Class A, Class C, Advisor Class, Class R, Class K and Class I shares, respectively, gross of any fee waivers or expense reimbursements. Contractual fee waivers and/or expense reimbursements limit the Strategy’s annual operating expenses (exclusive of interest expense) to 0.60%, 0.50%, 0.80%, 1.50%, 0.50%, 1.00%, 0.75% and 0.50% for Class 1, Class 2, Class A, Class C, Advisor Class, Class R, Class K and Class I shares, respectively. These waivers/reimbursements may not be terminated before January 31, 2015 and may be extended by the Adviser for additional one-year terms. Absent reimbursements or waivers, performance would have been lower. The Financial Highlights section of this report sets forth expense ratio data for the current reporting period; the expense ratios shown above may differ from the expense ratios in the Financial Highlights sections since they are based on different time periods.
| * | SEC yields are calculated based on SEC guidelines for the 30-day period ended October 31, 2014. |
| † | Class 1 shares are only available to Bernstein Global Wealth Management private client accounts. Class 2 shares are only available to large Bernstein Global Wealth Management private client accounts and the Adviser’s institutional clients or through other limited arrangements. These share classes do not carry front end sales charges; therefore their respective NAV and SEC returns are the same. |
| ‡ | Inception date: 1/26/2010. |
| ^ | These share classes are offered at NAV to eligible investors and their SEC returns are the same as their NAV returns. Please note that these share classes are for investors purchasing shares through accounts established under certain fee-based programs sponsored and maintained by certain broker-dealers and financial intermediaries, institutional pension plans and/or investment advisory clients of, and certain other persons associated with, the Adviser and its affiliates or the Strategy. The inception date for these share classes is listed above. |
See Disclosures, Risks and Note about Historical Performance on pages 4-5.
(Historical Performance continued on next page)
| 8 | • ALLIANCEBERNSTEIN BOND INFLATION STRATEGY |
Historical Performance
HISTORICAL PERFORMANCE
(continued from previous page)
| SEC AVERAGE ANNUAL RETURNS AS OF THE MOST RECENT CALENDAR QUARTER-END SEPTEMBER 30, 2014 (unaudited) | ||||
| SEC Returns (reflects applicable sales charges) | ||||
| Class 1 Shares† | ||||
1 Year | 1.71 | % | ||
Since Inception‡ | 3.34 | % | ||
| Class 2 Shares† | ||||
1 Year | 1.89 | % | ||
Since Inception‡ | 3.43 | % | ||
| Class A Shares | ||||
1 Year | -2.80 | % | ||
Since Inception‡ | 2.16 | % | ||
| Class C Shares | ||||
1 Year | -0.12 | % | ||
Since Inception‡ | 2.39 | % | ||
| Advisor Class Shares^ | ||||
1 Year | 1.82 | % | ||
Since Inception‡ | 3.41 | % | ||
| Class R Shares^ | ||||
1 Year | 1.38 | % | ||
Since Inception‡ | 2.93 | % | ||
| Class K Shares^ | ||||
1 Year | 1.51 | % | ||
Since Inception‡ | 3.15 | % | ||
| Class I Shares^ | ||||
1 Year | 1.85 | % | ||
Since Inception‡ | 3.43 | % | ||
| † | Class 1 shares are only available to Bernstein Global Wealth Management private client accounts. Class 2 shares are only available to large Bernstein Global Wealth Management private client accounts and the Adviser’s institutional clients or through other limited arrangements. |
| ‡ | Inception date: 1/26/2010. |
| ^ | These share classes are offered at NAV to eligible investors and their SEC returns are the same as their NAV returns. Please note that these share classes are for investors purchasing shares through accounts established under certain fee-based programs sponsored and maintained by certain broker-dealers and financial intermediaries, institutional pension plans and/or investment advisory clients of, and certain other persons associated with, the Adviser and its affiliates or the Strategy. The inception date for these share classes is listed above. |
See Disclosures, Risks and Note about Historical Performance on pages 4-5.
| ALLIANCEBERNSTEIN BOND INFLATION STRATEGY • | 9 |
Historical Performance
EXPENSE EXAMPLE
(unaudited)
As a shareholder of a mutual fund, you may incur two types of costs: (1) transaction costs, including sales charges (loads) on purchase payments, contingent deferred sales charges on redemptions and (2) ongoing costs, including management fees; distribution (12b-1) fees; and other fund expenses. This example is intended to help you understand your ongoing costs (in dollars) of investing in the Fund and to compare these costs with the ongoing costs of investing in other mutual funds.
The Example is based on an investment of $1,000 invested at the beginning of the period and held for the entire period as indicated below.
Actual Expenses
The table below provides information about actual account values and actual expenses. You may use the information in this line, together with the amount you invested, to estimate the expenses that you paid over the period. Simply divide your account value by $1,000 (for example, an $8,600 account value divided by $1,000 = 8.6), then multiply the result by the number in the first line under the heading entitled “Expenses Paid During Period” to estimate the expenses you paid on your account during this period.
Hypothetical Example for Comparison Purposes
The table below provides information about hypothetical account values and hypothetical expenses based on the Fund’s actual expense ratio and an assumed annual rate of return of 5% before expenses, which is not the Fund’s actual return. The hypothetical account values and expenses may not be used to estimate the actual ending account balance or expenses you paid for the period. You may use this information to compare the ongoing costs of investing in the Fund and other funds by comparing this 5% hypothetical example with the 5% hypothetical examples that appear in the shareholder reports of other funds.
Please note that the expenses shown in the table are meant to highlight your ongoing costs only and do not reflect any transactional costs, such as sales charges (loads), or contingent deferred sales charges on redemptions. Therefore, the hypothetical example is useful in comparing ongoing costs only, and will not help you determine the relative total costs of owning different funds. In addition, if these transactional costs were included, your costs would have been higher.
| Beginning Account Value May 1, 2014 | Ending Account Value October 31, 2014 | Expenses Paid During Period* | Annualized Expense Ratio* | |||||||||||||
| Class A | ||||||||||||||||
Actual | $ | 1,000 | $ | 1,002.90 | $ | 4.14 | 0.82 | % | ||||||||
Hypothetical** | $ | 1,000 | $ | 1,021.07 | $ | 4.18 | 0.82 | % | ||||||||
| Class C | ||||||||||||||||
Actual | $ | 1,000 | $ | 999.50 | $ | 7.61 | 1.51 | % | ||||||||
Hypothetical** | $ | 1,000 | $ | 1,017.59 | $ | 7.68 | 1.51 | % | ||||||||
| Advisor Class | ||||||||||||||||
Actual | $ | 1,000 | $ | 1,004.90 | $ | 2.63 | 0.52 | % | ||||||||
Hypothetical** | $ | 1,000 | $ | 1,022.58 | $ | 2.65 | 0.52 | % | ||||||||
| Class R | ||||||||||||||||
Actual | $ | 1,000 | $ | 1,002.90 | $ | 5.15 | 1.02 | % | ||||||||
Hypothetical** | $ | 1,000 | $ | 1,020.06 | $ | 5.19 | 1.02 | % | ||||||||
| Class K | ||||||||||||||||
Actual | $ | 1,000 | $ | 1,004.00 | $ | 3.89 | 0.77 | % | ||||||||
Hypothetical** | $ | 1,000 | $ | 1,021.32 | $ | 3.92 | 0.77 | % | ||||||||
| 10 | • ALLIANCEBERNSTEIN BOND INFLATION STRATEGY |
Expense Example
| Beginning Account Value May 1, 2014 | Ending Account Value October 31, 2014 | Expenses Paid During Period* | Annualized Expense Ratio* | |||||||||||||
| Class I | ||||||||||||||||
Actual | $ | 1,000 | $ | 1,004.50 | $ | 2.63 | 0.52 | % | ||||||||
Hypothetical** | $ | 1,000 | $ | 1,022.58 | $ | 2.65 | 0.52 | % | ||||||||
| Class 1 | ||||||||||||||||
Actual | $ | 1,000 | $ | 1,004.30 | $ | 3.13 | 0.62 | % | ||||||||
Hypothetical** | $ | 1,000 | $ | 1,022.08 | $ | 3.16 | 0.62 | % | ||||||||
| Class 2 | ||||||||||||||||
Actual | $ | 1,000 | $ | 1,004.70 | $ | 2.63 | 0.52 | % | ||||||||
Hypothetical** | $ | 1,000 | $ | 1,022.58 | $ | 2.65 | 0.52 | % | ||||||||
| * | Expenses are equal to each classes’ annualized expense ratios, multiplied by the average account value over the period, multiplied by 184/365 (to reflect the one-half year period). |
| ** | Assumes 5% annual return before expenses. |
| ALLIANCEBERNSTEIN BOND INFLATION STRATEGY • | 11 |
Expense Example
PORTFOLIO SUMMARY
October 31, 2014 (unaudited)
PORTFOLIO STATISTICS
Net Assets ($mil): $374.8
Total Investments ($mil): $458.7
| INFLATION PROTECTION BREAKDOWN* | ||||||
U.S. Inflation-Protected Exposure | 100.9 | % | ||||
Non-U.S | — | |||||
Non-Inflation Exposure | (0.9 | )% | ||||
|
| |||||
| 100.0 | % | |||||
| SECTOR BREAKDOWN OF NET PORTFOLIO ASSETS, EXCLUDING TREASURY SECURITIES, TIPS, INTEREST RATE DERIVATIVES AND NET CASH EQUIVALENTS* | ||||||
Corporates – Investment Grade | 15.3 | % | ||||
Asset-Backed Securities | 9.3 | % | ||||
Commercial Mortgage-Backed Securities | 8.2 | % | ||||
Corporates – Non-Investment Grade | 1.5 | % | ||||
Collateralized Mortgage Obligations | 1.0 | % | ||||
Quasi-Sovereigns | 0.8 | % | ||||
Emerging Markets – Corporate Bonds | 0.2 | % | ||||
Governments – Sovereign Agencies | 0.2 | % | ||||
Governments – Sovereign Bonds | 0.1 | % | ||||
| SECTOR BREAKDOWN OF TOTAL PORTFOLIO INVESTMENT, EXCLUDING DERIVATIVES† | ||||||
Inflation-Linked Securities | 67.7 | % | ||||
Corporates – Investment Grade | 11.5 | % | ||||
Asset-Backed Securities | 7.6 | % | ||||
Commercial Mortgage-Backed Securities | 6.7 | % | ||||
Corporates – Non-Investment Grade | 3.0 | % | ||||
Governments – Treasuries | 0.8 | % | ||||
Collateralized Mortgage Obligations | 0.8 | % | ||||
Quasi-Sovereigns | 0.7 | % | ||||
Emerging Markets – Corporate Bonds | 0.2 | % | ||||
Governments – Sovereign Agencies | 0.1 | % | ||||
Governments – Sovereign Bonds | 0.1 | % | ||||
Short-Term | 0.8 | % | ||||
| 12 | • ALLIANCEBERNSTEIN BOND INFLATION STRATEGY |
Portfolio Summary
PORTFOLIO SUMMARY
October 31, 2014 (unaudited)
| * | All data are as of October 31, 2014. The Strategy’s sector and inflation protection exposure breakdowns are expressed as an approximate percentage of the Strategy’s total net assets (and may vary over time) inclusive of derivative exposure except as noted, based on the Adviser’s internal classification. |
| † | The Strategy’s sector breakdown is expressed, based on the Adviser’s internal classification, as a percentage of total investments and may vary over time. The Strategy also enters into derivative transactions (not reflected in the table), which may be used for hedging or investment purposes or to adjust the risk profile or exposures of the Strategy (see “Portfolio of investments” section of the report for additional details). Derivative transactions may result in a form of leverage for the Strategy. The Strategy uses leverage for investment purposes by entering into reverse repurchase agreements. As a result, the Strategy’s total investments will generally exceed its net assets. |
| ALLIANCEBERNSTEIN BOND INFLATION STRATEGY • | 13 |
Portfolio Summary
PORTFOLIO OF INVESTMENTS
October 31, 2014
| Principal Amount (000) | U.S. $ Value | |||||||||
|
|
| ||||||||
INFLATION-LINKED SECURITIES – 82.9% |
| |||||||||
United States – 82.9% | ||||||||||
U.S. Treasury Inflation Index | U.S.$ | 91,600 | $ | 90,660,122 | ||||||
0.125%, 4/15/17-1/15/23 (TIPS)(a) | 89,940 | 90,446,123 | ||||||||
0.375%, 7/15/23 (TIPS) | 19,871 | 19,875,685 | ||||||||
0.625%, 7/15/21 (TIPS)(a) | 22,690 | 23,317,119 | ||||||||
0.625%, 1/15/24 (TIPS) | 19,469 | 19,785,447 | ||||||||
1.125%, 1/15/21 (TIPS) | 13,234 | 13,977,782 | ||||||||
1.25%, 7/15/20 (TIPS)(a) | 21,717 | 23,187,902 | ||||||||
1.375%, 1/15/20 (TIPS) | 8,158 | 8,715,546 | ||||||||
1.875%, 7/15/15-7/15/19 (TIPS)(a) | 13,617 | 14,265,066 | ||||||||
2.125%, 1/15/19 (TIPS) | 1,978 | 2,166,091 | ||||||||
2.50%, 7/15/16 (TIPS) | 4,104 | 4,347,849 | ||||||||
|
| |||||||||
Total Inflation-Linked Securities | 310,744,732 | |||||||||
|
| |||||||||
CORPORATES – INVESTMENT | ||||||||||
Industrial – 8.9% | ||||||||||
Basic – 1.4% | ||||||||||
Basell Finance Co. BV | 205 | 274,837 | ||||||||
Cia Minera Milpo SAA | 412 | 414,681 | ||||||||
Dow Chemical Co. (The) | 67 | 84,386 | ||||||||
Glencore Funding LLC | 1,720 | 1,736,340 | ||||||||
International Paper Co. | 800 | 867,527 | ||||||||
LyondellBasell Industries NV | 405 | 472,774 | ||||||||
Minsur SA | 869 | 957,407 | ||||||||
Sociedad Quimica y Minera de Chile SA | 393 | 377,336 | ||||||||
|
| |||||||||
| 5,185,288 | ||||||||||
|
| |||||||||
Capital Goods – 0.3% | ||||||||||
Odebrecht Finance Ltd. | 426 | 406,830 | ||||||||
Yamana Gold, Inc. | 853 | 834,305 | ||||||||
|
| |||||||||
| 1,241,135 | ||||||||||
|
| |||||||||
Communications - Media – 1.2% | ||||||||||
21st Century Fox America, Inc. | 1,095 | 1,076,870 | ||||||||
6.15%, 3/01/37-2/15/41 | 331 | 405,352 | ||||||||
| 14 | • ALLIANCEBERNSTEIN BOND INFLATION STRATEGY |
Portfolio of Investments
| Principal Amount (000) | U.S. $ Value | |||||||||
|
|
| ||||||||
CBS Corp. | U.S.$ | 325 | $ | 371,857 | ||||||
DirecTV Holdings LLC/DirecTV Financing Co., Inc. | 274 | 279,108 | ||||||||
4.45%, 4/01/24 | 372 | 388,119 | ||||||||
5.20%, 3/15/20 | 114 | 127,477 | ||||||||
Globo Comunicacao e Participacoes SA | 415 | 439,900 | ||||||||
NBCUniversal Enterprise, Inc. | 409 | 426,052 | ||||||||
Omnicom Group, Inc. | 163 | 167,035 | ||||||||
Reed Elsevier Capital, Inc. | 460 | 569,565 | ||||||||
Time Warner Cable, Inc. | ||||||||||
5.00%, 2/01/20 | 35 | 39,172 | ||||||||
8.75%, 2/14/19 | 25 | 31,402 | ||||||||
Viacom, Inc. | 339 | 339,125 | ||||||||
|
| |||||||||
| 4,661,034 | ||||||||||
|
| |||||||||
Communications - | ||||||||||
American Tower Corp. | ||||||||||
3.50%, 1/31/23 | 300 | 287,109 | ||||||||
4.70%, 3/15/22 | 395 | 410,676 | ||||||||
5.05%, 9/01/20 | 35 | 38,144 | ||||||||
AT&T, Inc. | ||||||||||
3.00%, 2/15/22 | 1,255 | 1,240,798 | ||||||||
5.35%, 9/01/40 | 280 | 298,948 | ||||||||
Rogers Communications, Inc. | CAD | 55 | 50,872 | |||||||
SBA Tower Trust | U.S.$ | 851 | 853,261 | |||||||
Telefonica Emisiones SAU | 400 | 448,916 | ||||||||
Verizon Communications, Inc. | ||||||||||
5.15%, 9/15/23 | 1,001 | 1,121,008 | ||||||||
7.35%, 4/01/39 | 300 | 404,459 | ||||||||
|
| |||||||||
| 5,154,191 | ||||||||||
|
| |||||||||
Consumer Cyclical - Automotive – 0.3% | ||||||||||
Ford Motor Credit Co. LLC | ||||||||||
2.597%, 11/04/19 | 400 | 397,896 | ||||||||
5.875%, 8/02/21 | 640 | 739,687 | ||||||||
Harley-Davidson Funding Corp. | 30 | 30,181 | ||||||||
|
| |||||||||
| 1,167,764 | ||||||||||
|
| |||||||||
| ALLIANCEBERNSTEIN BOND INFLATION STRATEGY • | 15 |
Portfolio of Investments
| Principal Amount (000) | U.S. $ Value | |||||||||
|
|
| ||||||||
Consumer Cyclical - Other – 0.1% | ||||||||||
Host Hotels & Resorts LP | U.S.$ | 175 | $ | 191,139 | ||||||
|
| |||||||||
Consumer Non-Cyclical – 1.0% | ||||||||||
Actavis Funding SCS | 278 | 270,578 | ||||||||
Altria Group, Inc. | 195 | 214,776 | ||||||||
Bayer US Finance LLC | 374 | 375,094 | ||||||||
Bunge Ltd. Finance Corp. | ||||||||||
5.10%, 7/15/15 | 125 | 128,773 | ||||||||
8.50%, 6/15/19 | 75 | 92,788 | ||||||||
Grupo Bimbo SAB de CV | 648 | 644,954 | ||||||||
Kroger Co. (The) | 624 | 631,574 | ||||||||
Reynolds American, Inc. | 284 | 277,345 | ||||||||
Thermo Fisher Scientific, Inc. | 363 | 380,014 | ||||||||
Tyson Foods, Inc. | 199 | 200,897 | ||||||||
3.95%, 8/15/24 | 650 | 662,939 | ||||||||
|
| |||||||||
| 3,879,732 | ||||||||||
|
| |||||||||
Energy – 2.0% | ||||||||||
DCP Midstream LLC | 405 | 436,124 | ||||||||
Diamond Offshore Drilling, Inc. | 350 | 314,725 | ||||||||
Energy Transfer Partners LP | 510 | 558,044 | ||||||||
6.125%, 2/15/17 | 145 | 159,300 | ||||||||
Enterprise Products Operating LLC | 335 | 376,018 | ||||||||
Kinder Morgan Energy Partners LP | 846 | 843,712 | ||||||||
4.15%, 3/01/22 | 104 | 106,303 | ||||||||
Marathon Petroleum Corp. | 280 | 313,339 | ||||||||
Nabors Industries, Inc. | 167 | 178,701 | ||||||||
Nisource Finance Corp. | 75 | 88,653 | ||||||||
Noble Energy, Inc. | 127 | 135,449 | ||||||||
8.25%, 3/01/19 | 387 | 476,918 | ||||||||
| 16 | • ALLIANCEBERNSTEIN BOND INFLATION STRATEGY |
Portfolio of Investments
| Principal Amount (000) | U.S. $ Value | |||||||||
|
|
| ||||||||
Reliance Holding USA, Inc. | U.S.$ | 1,060 | $ | 1,161,540 | ||||||
Spectra Energy Capital LLC | 8 | 9,915 | ||||||||
Transocean, Inc. | 2 | 2,102 | ||||||||
6.50%, 11/15/20 | 740 | 761,153 | ||||||||
Valero Energy Corp. | 476 | 554,400 | ||||||||
Weatherford International Ltd./Bermuda | 70 | 89,453 | ||||||||
Williams Partners LP | 350 | 347,219 | ||||||||
4.125%, 11/15/20 | 300 | 315,461 | ||||||||
5.25%, 3/15/20 | 201 | 223,145 | ||||||||
|
| |||||||||
| 7,451,674 | ||||||||||
|
| |||||||||
Other Industrial – 0.1% | ||||||||||
Hutchison Whampoa International 14 Ltd. | 356 | 355,396 | ||||||||
|
| |||||||||
Technology – 1.0% | ||||||||||
Agilent Technologies, Inc. | 7 | 7,658 | ||||||||
Baidu, Inc. | 254 | 254,929 | ||||||||
3.25%, 8/06/18 | 399 | 410,244 | ||||||||
Kla-tencor Corp. | 887 | 893,821 | ||||||||
Motorola Solutions, Inc. | 320 | 318,545 | ||||||||
7.50%, 5/15/25 | 505 | 642,398 | ||||||||
Seagate HDD Cayman | 398 | 402,477 | ||||||||
Telefonaktiebolaget LM Ericsson | 50 | 52,291 | ||||||||
Tencent Holdings Ltd. | 626 | 636,506 | ||||||||
Total System Services, Inc. | 259 | 257,998 | ||||||||
|
| |||||||||
| 3,876,867 | ||||||||||
|
| |||||||||
Transportation - Services – 0.1% | ||||||||||
Asciano Finance Ltd. | 47 | 50,776 | ||||||||
Ryder System, Inc. | 105 | 105,876 | ||||||||
5.85%, 11/01/16 | 105 | 114,497 | ||||||||
7.20%, 9/01/15 | 10 | 10,532 | ||||||||
|
| |||||||||
| 281,681 | ||||||||||
|
| |||||||||
| 33,445,901 | ||||||||||
|
| |||||||||
| ALLIANCEBERNSTEIN BOND INFLATION STRATEGY • | 17 |
Portfolio of Investments
| Principal Amount (000) | U.S. $ Value | |||||||||
|
|
| ||||||||
Financial Institutions – 4.2% | ||||||||||
Banking – 2.2% | ||||||||||
Barclays Bank PLC | EUR | 190 | $ | 300,599 | ||||||
BPCE SA | U.S.$ | 670 | 719,486 | |||||||
Capital One Financial Corp. | 150 | 162,984 | ||||||||
Credit Suisse AG | 621 | 684,720 | ||||||||
Goldman Sachs Group, Inc. (The) | 810 | 833,102 | ||||||||
ING Bank NV | 600 | 606,611 | ||||||||
JPMorgan Chase & Co. | 55 | 59,031 | ||||||||
Macquarie Group Ltd. | 65 | 78,274 | ||||||||
Mizuho Financial Group Cayman 3 Ltd. | 816 | 849,458 | ||||||||
Morgan Stanley | 456 | 519,921 | ||||||||
Murray Street Investment Trust I | 52 | 55,516 | ||||||||
National Capital Trust II Delaware | 45 | 45,394 | ||||||||
Nordea Bank AB | 201 | 201,422 | ||||||||
PNC Bank NA | 940 | 968,638 | ||||||||
Rabobank Capital Funding Trust III | 375 | 393,750 | ||||||||
Standard Chartered PLC | 725 | 745,104 | ||||||||
Turkiye Garanti Bankasi AS | 354 | 358,751 | ||||||||
UBS AG/Stamford CT | 465 | 548,773 | ||||||||
|
| |||||||||
| 8,131,534 | ||||||||||
|
| |||||||||
Brokerage – 0.2% | ||||||||||
Nomura Holdings, Inc. | 809 | 819,117 | ||||||||
|
| |||||||||
Insurance – 1.1% | ||||||||||
American International Group, Inc. | 625 | 697,119 | ||||||||
6.40%, 12/15/20 | 205 | 244,801 | ||||||||
| 18 | • ALLIANCEBERNSTEIN BOND INFLATION STRATEGY |
Portfolio of Investments
| Principal Amount (000) | U.S. $ Value | |||||||||
|
|
| ||||||||
Coventry Health Care, Inc. | U.S.$ | 415 | $ | 475,550 | ||||||
Dai-ichi Life Insurance Co., Ltd. (The) | 415 | 424,130 | ||||||||
Hartford Financial Services Group, Inc. (The) | 535 | 597,850 | ||||||||
5.50%, 3/30/20 | 24 | 27,211 | ||||||||
6.10%, 10/01/41 | 165 | 205,628 | ||||||||
Lincoln National Corp. | 175 | 222,260 | ||||||||
MetLife, Inc. | 90 | 108,976 | ||||||||
7.717%, 2/15/19 | 180 | 220,004 | ||||||||
Nationwide Financial Services, Inc. | 360 | 404,908 | ||||||||
Nationwide Mutual Insurance Co. | 125 | 192,646 | ||||||||
Prudential Financial, Inc. | 340 | 352,750 | ||||||||
|
| |||||||||
| 4,173,833 | ||||||||||
|
| |||||||||
Other Finance – 0.0% | ||||||||||
ORIX Corp. | 37 | 37,675 | ||||||||
|
| |||||||||
REITS – 0.7% | ||||||||||
HCP, Inc. | 739 | 826,180 | ||||||||
Health Care REIT, Inc. | 890 | 986,470 | ||||||||
Trust F/1401 | 825 | 870,375 | ||||||||
|
| |||||||||
| 2,683,025 | ||||||||||
|
| |||||||||
| 15,845,184 | ||||||||||
|
| |||||||||
Non Corporate Sectors – 0.5% | ||||||||||
ABS - Other – 0.2% | ||||||||||
Rio Oil Finance Trust | 487 | 506,480 | ||||||||
|
| |||||||||
Agencies - Not Government Guaranteed – 0.3% | ||||||||||
CNOOC Finance 2013 Ltd. | 621 | 589,074 | ||||||||
CNOOC Nexen Finance 2014 ULC | 239 | 246,922 | ||||||||
OCP SA | 330 | 346,153 | ||||||||
|
| |||||||||
| 1,182,149 | ||||||||||
|
| |||||||||
| 1,688,629 | ||||||||||
|
| |||||||||
| ALLIANCEBERNSTEIN BOND INFLATION STRATEGY • | 19 |
Portfolio of Investments
| Principal Amount (000) | U.S. $ Value | |||||||||
|
|
| ||||||||
Utility – 0.5% | ||||||||||
Electric – 0.3% | ||||||||||
Berkshire Hathaway Energy Co. | U.S.$ | 340 | $ | 426,768 | ||||||
CMS Energy Corp. | 144 | 161,344 | ||||||||
Constellation Energy Group, Inc. | 91 | 101,365 | ||||||||
Exelon Generation Co. LLC | 416 | 434,132 | ||||||||
|
| |||||||||
| 1,123,609 | ||||||||||
|
| |||||||||
Natural Gas – 0.2% | ||||||||||
Talent Yield Investments Ltd. | 480 | 499,488 | ||||||||
|
| |||||||||
| 1,623,097 | ||||||||||
|
| |||||||||
Total Corporates – Investment Grade | 52,602,811 | |||||||||
|
| |||||||||
ASSET-BACKED SECURITIES – 9.3% | ||||||||||
Autos - Fixed Rate – 6.3% | ||||||||||
Ally Master Owner Trust | 805 | 807,566 | ||||||||
Series 2014-1, Class A2 | ||||||||||
1.29%, 1/15/19 | 1,398 | 1,400,572 | ||||||||
AmeriCredit Automobile Receivables Trust | 265 | 265,714 | ||||||||
Series 2013-3, Class A3 | 1,245 | 1,247,326 | ||||||||
Series 2013-4, Class A3 | 535 | 536,334 | ||||||||
ARI Fleet Lease Trust | ||||||||||
Series 2013-A, Class A2 | 383 | 383,470 | ||||||||
Series 2014-A, Class A2 | 448 | 447,546 | ||||||||
Avis Budget Rental Car Funding AESOP LLC | ||||||||||
Series 2012-3A, Class A | 420 | 423,097 | ||||||||
Series 2013-2A, Class A | 289 | 297,076 | ||||||||
Series 2014-1A, Class A | 1,689 | 1,695,976 | ||||||||
California Republic Auto Receivables Trust | 850 | 850,083 | ||||||||
| 20 | • ALLIANCEBERNSTEIN BOND INFLATION STRATEGY |
Portfolio of Investments
| Principal Amount (000) | U.S. $ Value | |||||||||
|
|
| ||||||||
Capital Auto Receivables Asset Trust | ||||||||||
Series 2013-3, Class A2 | U.S.$ | 1,115 | $ | 1,118,562 | ||||||
Series 2014-1, Class B | ||||||||||
2.22%, 1/22/19 | 200 | 202,260 | ||||||||
Capital Auto Receivables Asset Trust/Ally | 306 | 306,134 | ||||||||
Carfinance Capital Auto Trust | 183 | 183,772 | ||||||||
Chrysler Capital Auto Receivables Trust | 1,512 | 1,512,534 | ||||||||
CPS Auto Receivables Trust | ||||||||||
Series 2013-B, Class A | ||||||||||
1.82%, 9/15/20(b) | 609 | 610,938 | ||||||||
Series 2014-B, Class A | ||||||||||
1.11%, 11/15/18(b) | 594 | 593,247 | ||||||||
Enterprise Fleet Financing LLC | 426 | 426,077 | ||||||||
Exeter Automobile Receivables Trust | ||||||||||
Series 2012-2A, Class A | ||||||||||
1.30%, 6/15/17(b) | 83 | 83,009 | ||||||||
Series 2013-1A, Class A | ||||||||||
1.29%, 10/16/17(b) | 159 | 159,529 | ||||||||
Series 2014-1A, Class A | ||||||||||
1.29%, 5/15/18(b) | 344 | 344,160 | ||||||||
Series 2014-2A, Class A | ||||||||||
1.06%, 8/15/18(b) | 345 | 344,036 | ||||||||
Flagship Credit Auto Trust | 169 | 169,512 | ||||||||
Ford Auto Securitization Trust | ||||||||||
Series 2013-R1A, Class A2 | ||||||||||
1.676%, 9/15/16(b) | CAD | 290 | 257,330 | |||||||
Series 2013-R4A, Class A1 | ||||||||||
1.487%, 8/15/15(b) | 22 | 19,102 | ||||||||
Series 2014-R2A, Class A1 | ||||||||||
1.353%, 3/15/16(b) | 443 | 392,659 | ||||||||
Ford Credit Auto Owner Trust | U.S.$ | 225 | 224,228 | |||||||
Ford Credit Auto Owner Trust/Ford Credit | 728 | 730,621 | ||||||||
| ALLIANCEBERNSTEIN BOND INFLATION STRATEGY • | 21 |
Portfolio of Investments
| Principal Amount (000) | U.S. $ Value | |||||||||
|
|
| ||||||||
Ford Credit Floorplan Master Owner Trust | U.S.$ | 993 | $ | 993,667 | ||||||
Harley-Davidson Motorcycle Trust | 415 | 415,797 | ||||||||
Hertz Vehicle Financing LLC | 2,185 | 2,186,833 | ||||||||
Hyundai Auto Receivables Trust | 165 | 168,099 | ||||||||
Mercedes-Benz Auto Lease Trust | ||||||||||
Series 2013-A, Class A3 | ||||||||||
0.59%, 2/15/16 | 583 | 582,633 | ||||||||
Series 2014-A, Class A2A | ||||||||||
0.48%, 6/15/16 | 668 | 667,998 | ||||||||
Mercedes-Benz Master Owner Trust | 1,193 | 1,195,396 | ||||||||
Santander Drive Auto Receivables Trust | ||||||||||
Series 2013-4, Class A3 | ||||||||||
1.11%, 12/15/17 | 1,020 | 1,022,528 | ||||||||
Series 2013-5, Class A2A | ||||||||||
0.64%, 4/17/17 | 210 | 210,484 | ||||||||
|
| |||||||||
| 23,475,905 | ||||||||||
|
| |||||||||
Autos - Floating Rate – 1.2% | ||||||||||
Ally Master Owner Trust | 810 | 810,463 | ||||||||
BMW Floorplan Master Owner Trust | 809 | 810,374 | ||||||||
Ford Credit Floorplan Master Owner Trust | 797 | 798,251 | ||||||||
GE Dealer Floorplan Master Note Trust | 600 | 600,209 | ||||||||
Hertz Fleet Lease Funding LP | 1,324 | 1,326,324 | ||||||||
|
| |||||||||
| 4,345,621 | ||||||||||
|
| |||||||||
Credit Cards - Fixed Rate – 0.7% | ||||||||||
American Express Credit Account Master Trust | 474 | 474,758 | ||||||||
| 22 | • ALLIANCEBERNSTEIN BOND INFLATION STRATEGY |
Portfolio of Investments
| Principal Amount (000) | U.S. $ Value | |||||||||
|
|
| ||||||||
Barclays Dryrock Issuance Trust | U.S.$ | 523 | $ | 527,793 | ||||||
Chase Issuance Trust | 825 | 826,705 | ||||||||
World Financial Network Credit Card Master Trust | 370 | 373,290 | ||||||||
Series 2013-A, Class A | 373 | 371,583 | ||||||||
|
| |||||||||
| 2,574,129 | ||||||||||
|
| |||||||||
Credit Cards - Floating Rate – 0.6% | ||||||||||
Cabela’s Master Credit Card Trust | 600 | 599,699 | ||||||||
First National Master Note Trust | 794 | 796,405 | ||||||||
World Financial Network Credit Card Master Trust | 910 | 911,638 | ||||||||
|
| |||||||||
| 2,307,742 | ||||||||||
|
| |||||||||
Other ABS - Floating Rate – 0.3% | ||||||||||
GE Dealer Floorplan Master Note Trust | 1,068 | 1,066,832 | ||||||||
|
| |||||||||
Other ABS - Fixed Rate – 0.2% | ||||||||||
GE Equipment Small Ticket LLC | 924 | 924,555 | ||||||||
|
| |||||||||
Total Asset-Backed Securities | 34,694,784 | |||||||||
|
| |||||||||
COMMERCIAL MORTGAGE-BACKED SECURITIES – 8.2% | ||||||||||
Non-Agency Fixed Rate CMBS – 7.1% | ||||||||||
Banc of America Commercial Mortgage Trust | 1,725 | 1,896,583 | ||||||||
Series 2007-5, Class AM | 258 | 276,460 | ||||||||
Bear Stearns Commercial Mortgage Securities Trust | 74 | 78,031 | ||||||||
| ALLIANCEBERNSTEIN BOND INFLATION STRATEGY • | 23 |
Portfolio of Investments
| Principal Amount (000) | U.S. $ Value | |||||||||
|
|
| ||||||||
Series 2006-PW13, Class AJ | U.S.$ | 571 | $ | 589,943 | ||||||
BHMS Mortgage Trust | 1,070 | 1,074,480 | ||||||||
CGRBS Commercial Mortgage Trust | 885 | 895,601 | ||||||||
Citigroup Commercial Mortgage Trust | 274 | 289,168 | ||||||||
COBALT CMBS Commercial Mortgage Trust | 467 | 511,319 | ||||||||
Commercial Mortgage Pass-Through Certificates | 664 | 714,445 | ||||||||
Series 2007-GG9, Class AM | 598 | 631,191 | ||||||||
Series 2013-SFS, Class A1 | 404 | 394,718 | ||||||||
Credit Suisse Commercial Mortgage Trust | 463 | 488,727 | ||||||||
Credit Suisse First Boston Mortgage Securities Corp. | 158 | 158,524 | ||||||||
Extended Stay America Trust | 515 | 507,122 | ||||||||
Greenwich Capital Commercial Funding Corp. | 54 | 54,029 | ||||||||
GS Mortgage Securities Corp. II | 815 | 823,909 | ||||||||
GS Mortgage Securities Trust | 722 | 713,714 | ||||||||
JP Morgan Chase Commercial Mortgage Securities Trust | 255 | 253,852 | ||||||||
Series 2006-CB15, Class A4 | 432 | 457,232 | ||||||||
Series 2007-CB19, Class AM | 295 | 312,604 | ||||||||
| 24 | • ALLIANCEBERNSTEIN BOND INFLATION STRATEGY |
Portfolio of Investments
| Principal Amount (000) | U.S. $ Value | |||||||||
|
|
| ||||||||
Series 2007-LD12, Class AM | U.S.$ | 245 | $ | 269,687 | ||||||
Series 2007-LDPX, Class A1A | ||||||||||
5.439%, 1/15/49 | 1,902 | 2,059,201 | ||||||||
Series 2007-LDPX, Class A3 | 411 | 443,633 | ||||||||
Series 2008-C2, Class A1A | 851 | 940,131 | ||||||||
Series 2010-C2, Class A1 | 256 | 260,197 | ||||||||
LB-UBS Commercial Mortgage Trust | 1,744 | 1,800,047 | ||||||||
Series 2007-C1, Class A4 | 1,083 | 1,167,601 | ||||||||
LSTAR Commercial Mortgage Trust | 633 | 639,864 | ||||||||
Merrill Lynch Mortgage Trust | 610 | 651,743 | ||||||||
Merrill Lynch/Countrywide Commercial Mortgage Trust | 2,256 | 2,399,925 | ||||||||
Series 2007-9, Class A4 | 125 | 136,435 | ||||||||
Motel 6 Trust | 553 | 552,455 | ||||||||
UBS-Barclays Commercial Mortgage Trust | 277 | 278,427 | ||||||||
Series 2012-C4, Class A5 | 2,309 | 2,274,156 | ||||||||
WF-RBS Commercial Mortgage Trust | 862 | 877,188 | ||||||||
Series 2014-C20, Class A2 | 648 | 672,036 | ||||||||
|
| |||||||||
| 26,544,378 | ||||||||||
|
| |||||||||
Non-Agency Floating Rate CMBS – 1.1% | ||||||||||
Commercial Mortgage Pass Through Certificates | 775 | 773,575 | ||||||||
| ALLIANCEBERNSTEIN BOND INFLATION STRATEGY • | 25 |
Portfolio of Investments
| Principal Amount (000) | U.S. $ Value | |||||||||
|
|
| ||||||||
Commercial Mortgage Pass-Through Certificates | U.S.$ | 664 | $ | 663,926 | ||||||
Extended Stay America Trust | 405 | 404,960 | ||||||||
JP Morgan Chase Commercial Mortgage Securities Trust | 1,068 | 1,066,352 | ||||||||
PFP III Ltd. | 850 | 846,750 | ||||||||
Resource Capital Corp., Ltd. | 452 | 451,500 | ||||||||
|
| |||||||||
| 4,207,063 | ||||||||||
|
| |||||||||
Total Commercial Mortgage-Backed Securities | 30,751,441 | |||||||||
|
| |||||||||
CORPORATES – NON-INVESTMENT | ||||||||||
Industrial – 1.8% | ||||||||||
Basic – 0.0% | ||||||||||
Novelis, Inc. | 90 | 94,050 | ||||||||
|
| |||||||||
Capital Goods – 0.1% | ||||||||||
Sealed Air Corp. | 331 | 340,103 | ||||||||
|
| |||||||||
Communications - Media – 0.3% | ||||||||||
CSC Holdings LLC | 146 | 171,368 | ||||||||
Numericable Group SA | EUR | 231 | 300,605 | |||||||
Sirius XM Radio, Inc. | U.S.$ | 416 | 401,440 | |||||||
Univision Communications, Inc. | 326 | 342,707 | ||||||||
|
| |||||||||
| 1,216,120 | ||||||||||
|
| |||||||||
Communications - | ||||||||||
Sprint Corp. | 400 | 433,000 | ||||||||
Telecom Italia Capital SA | 170 | 193,800 | ||||||||
|
| |||||||||
| 626,800 | ||||||||||
|
| |||||||||
| 26 | • ALLIANCEBERNSTEIN BOND INFLATION STRATEGY |
Portfolio of Investments
| Principal Amount (000) | U.S. $ Value | |||||||||
| �� |
|
| |||||||
Consumer Cyclical - Automotive – 0.2% | ||||||||||
Dana Holding Corp. | U.S.$ | 147 | $ | 154,350 | ||||||
General Motors Co. | 425 | 437,750 | ||||||||
Goodyear Tire & Rubber Co. (The) | 190 | 204,250 | ||||||||
|
| |||||||||
| 796,350 | ||||||||||
|
| |||||||||
Consumer Cyclical - Other – 0.2% | ||||||||||
KB Home | 345 | 342,413 | ||||||||
MCE Finance Ltd. | 405 | 401,962 | ||||||||
|
| |||||||||
| 744,375 | ||||||||||
|
| |||||||||
Consumer Non-Cyclical – 0.0% | ||||||||||
CHS/Community Health Systems, Inc. | 174 | 180,960 | ||||||||
|
| |||||||||
Energy – 0.6% | ||||||||||
Access Midstream Partners LP/ACMP Finance Corp. | 406 | 424,270 | ||||||||
California Resources Corp. | 277 | 282,540 | ||||||||
Cimarex Energy Co. | 303 | 307,924 | ||||||||
5.875%, 5/01/22 | 134 | 144,050 | ||||||||
ONEOK, Inc. | 463 | 457,298 | ||||||||
Paragon Offshore PLC | 62 | 47,275 | ||||||||
7.25%, 8/15/24(b) | 360 | 275,400 | ||||||||
Regency Energy Partners LP/Regency Energy Finance Corp. | 115 | 114,137 | ||||||||
SM Energy Co. | 41 | 42,332 | ||||||||
|
| |||||||||
| 2,095,226 | ||||||||||
|
| |||||||||
Services – 0.1% | ||||||||||
Sabre GLBL, Inc. | 381 | 409,575 | ||||||||
|
| |||||||||
Transportation - Services – 0.1% | ||||||||||
Hertz Corp. (The) | 375 | 390,938 | ||||||||
|
| |||||||||
| 6,894,497 | ||||||||||
|
| |||||||||
| ALLIANCEBERNSTEIN BOND INFLATION STRATEGY • | 27 |
Portfolio of Investments
| Principal Amount (000) | U.S. $ Value | |||||||||
|
|
| ||||||||
Financial Institutions – 1.6% | ||||||||||
Banking – 1.4% | ||||||||||
Bank of America Corp. | U.S.$ | 374 | $ | 384,285 | ||||||
Bank of Ireland | CAD | 560 | 476,997 | |||||||
Barclays Bank PLC | U.S.$ | 137 | 151,728 | |||||||
7.75%, 4/10/23 | 372 | 407,805 | ||||||||
BNP Paribas SA | 257 | 259,570 | ||||||||
Credit Agricole SA | 248 | 255,440 | ||||||||
Danske Bank A/S | GBP | 287 | 471,740 | |||||||
HBOS Capital Funding LP | EUR | 951 | 1,190,471 | |||||||
Intesa Sanpaolo SpA | U.S.$ | 689 | 673,369 | |||||||
Royal Bank of Scotland PLC (The) | 102 | 116,576 | ||||||||
Skandinaviska Enskilda Banken AB | 233 | 235,330 | ||||||||
Societe Generale SA | EUR | 202 | 253,136 | |||||||
5.922%, 4/05/17(b)(d) | U.S.$ | 115 | 121,325 | |||||||
Unicredit Luxembourg Finance SA | 325 | 350,396 | ||||||||
|
| |||||||||
| 5,348,168 | ||||||||||
|
| |||||||||
Finance – 0.2% | ||||||||||
AerCap Aviation Solutions BV | 200 | 212,000 | ||||||||
International Lease Finance Corp. | 294 | 316,785 | ||||||||
Navient Corp. | 54 | 60,345 | ||||||||
|
| |||||||||
| 589,130 | ||||||||||
|
| |||||||||
| 5,937,298 | ||||||||||
|
| |||||||||
Utility – 0.2% | ||||||||||
Electric – 0.2% | ||||||||||
AES Corp./VA | 377 | 430,133 | ||||||||
NRG Energy, Inc. | 287 | 296,328 | ||||||||
|
| |||||||||
| 726,461 | ||||||||||
|
| |||||||||
Total Corporates – Non-Investment Grade | 13,558,256 | |||||||||
|
| |||||||||
| 28 | • ALLIANCEBERNSTEIN BOND INFLATION STRATEGY |
Portfolio of Investments
| Principal Amount (000) | U.S. $ Value | |||||||||
|
|
| ||||||||
GOVERNMENTS – TREASURIES – 1.0% | ||||||||||
Mexico – 1.0% | ||||||||||
Mexican Bonos | MXN | 50,615 | $ | 3,768,357 | ||||||
|
| |||||||||
COLLATERALIZED MORTGAGE OBLIGATIONS – 1.0% | ||||||||||
GSE Risk Share Floating Rate – 1.0% | ||||||||||
Federal Home Loan Mortgage Corp. Structured Agency Credit Risk Debt Notes | U.S.$ | 1,030 | 1,061,750 | |||||||
Series 2014-DN3, Class M3 | 1,055 | 1,017,065 | ||||||||
Series 2014-HQ3, Class M3 | 425 | 425,938 | ||||||||
Federal National Mortgage Association Connecticut Avenue Securities | 495 | 519,121 | ||||||||
Series 2014-C03, Class 1M1 | 394 | 390,083 | ||||||||
Structured Agency Credit Risk Debt Notes | 320 | 300,331 | ||||||||
|
| |||||||||
Total Collateralized Mortgage Obligations | 3,714,288 | |||||||||
|
| |||||||||
QUASI-SOVEREIGNS – 0.8% | ||||||||||
Quasi-Sovereign Bonds – 0.8% | ||||||||||
Chile – 0.1% | ||||||||||
Empresa de Transporte de Pasajeros Metro SA | 358 | 377,160 | ||||||||
|
| |||||||||
China – 0.3% | ||||||||||
Sinopec Group Overseas Development 2013 Ltd. | 995 | 1,042,256 | ||||||||
|
| |||||||||
Kazakhstan – 0.1% | ||||||||||
KazMunayGas National Co. JSC | 324 | 364,986 | ||||||||
|
| |||||||||
Malaysia – 0.1% | ||||||||||
Petronas Capital Ltd. | 310 | 348,205 | ||||||||
|
| |||||||||
| ALLIANCEBERNSTEIN BOND INFLATION STRATEGY • | 29 |
Portfolio of Investments
| Principal Amount (000) | U.S. $ Value | |||||||||
|
|
| ||||||||
Mexico – 0.1% | ||||||||||
Petroleos Mexicanos | U.S.$ | 439 | $ | 454,365 | ||||||
|
| |||||||||
South Korea – 0.1% | ||||||||||
Korea National Oil Corp. | 450 | 465,390 | ||||||||
|
| |||||||||
Total Quasi-Sovereigns | 3,052,362 | |||||||||
|
| |||||||||
EMERGING MARKETS – CORPORATE BONDS – 0.2% | ||||||||||
Industrial – 0.2% | ||||||||||
Communications - | ||||||||||
Comcel Trust | 208 | 222,560 | ||||||||
|
| |||||||||
Consumer Non-Cyclical – 0.1% | ||||||||||
Marfrig Overseas Ltd. | 370 | 390,812 | ||||||||
Virgolino de Oliveira Finance SA | 655 | 160,475 | ||||||||
|
| |||||||||
| 551,287 | ||||||||||
|
| |||||||||
Total Emerging Markets – Corporate Bonds | 773,847 | |||||||||
|
| |||||||||
GOVERNMENTS – SOVEREIGN | ||||||||||
Canada – 0.1% | ||||||||||
NOVA Chemicals Corp. | 391 | 408,595 | ||||||||
|
| |||||||||
Colombia – 0.1% | ||||||||||
Ecopetrol SA | 292 | 299,338 | ||||||||
|
| |||||||||
Total Governments – Sovereign Agencies | 707,933 | |||||||||
|
| |||||||||
GOVERNMENTS – SOVEREIGN | ||||||||||
Poland – 0.0% | ||||||||||
Poland Government International Bond | 16 | 16,372 | ||||||||
|
| |||||||||
| 30 | • ALLIANCEBERNSTEIN BOND INFLATION STRATEGY |
Portfolio of Investments
| Principal Amount (000) | U.S. $ Value | |||||||||
|
|
| ||||||||
Qatar – 0.1% | ||||||||||
Qatar Government International Bond | U.S.$ | 360 | $ | 398,232 | ||||||
|
| |||||||||
Total Governments – Sovereign Bonds | 414,604 | |||||||||
|
| |||||||||
| Shares | ||||||||||
PREFERRED STOCKS – 0.0% | ||||||||||
Financial Institutions – 0.0% | ||||||||||
Insurance – 0.0% | ||||||||||
Allstate Corp. (The) | 2,100 | 51,618 | ||||||||
|
| |||||||||
SHORT-TERM INVESTMENTS – 1.0% | ||||||||||
Investment Companies – 1.0% | ||||||||||
AllianceBernstein Fixed-Income Shares, Inc. –Government STIF Portfolio, 0.07%(f)(g) | 3,846,482 | 3,846,482 | ||||||||
|
| |||||||||
Total Investments – 122.4% | 458,681,515 | |||||||||
Other assets less liabilities – (22.4)% | (83,912,744 | ) | ||||||||
|
| |||||||||
Net Assets – 100.0% | $ | 374,768,771 | ||||||||
|
| |||||||||
FUTURES (see Note D)
| Type | Number of Contracts | Expiration Month | Original Value | Value at October 31, 2014 | Unrealized Appreciation/ (Depreciation) | |||||||||||||||
Purchased Contracts | ||||||||||||||||||||
U.S. Ultra Bond (CBT) Futures | 19 | December 2014 | $ | 2,895,566 | $ | 2,979,437 | $ | 83,871 | ||||||||||||
Sold Contracts | ||||||||||||||||||||
U.S. Long Bond (CBT) Futures | 14 | December 2014 | 1,945,980 | 1,975,313 | (29,333 | ) | ||||||||||||||
U.S. T-Note 5 Yr (CBT) Futures | 39 | December 2014 | 4,638,694 | 4,657,758 | (19,064 | ) | ||||||||||||||
U.S. T-Note 10 Yr (CBT) Futures | 219 | December 2014 | 27,431,224 | 27,672,703 | (241,479 | ) | ||||||||||||||
|
| |||||||||||||||||||
| $ | (206,005 | ) | ||||||||||||||||||
|
| |||||||||||||||||||
FORWARD CURRENCY EXCHANGE CONTRACTS (see Note D)
| Counterparty | Contracts to Deliver (000) | In Exchange (000) | Settlement Date | Unrealized Appreciation/ (Depreciation) | ||||||||||||
Deutsche Bank AG | USD 357 | AUD 408 | 12/12/14 | $ | 791 | |||||||||||
Goldman Sachs Bank USA | JPY 199,663 | USD 1,845 | 12/05/14 | 67,452 | ||||||||||||
JPMorgan Chase Bank | CAD 4,949 | USD 4,417 | 11/21/14 | 27,895 | ||||||||||||
| ALLIANCEBERNSTEIN BOND INFLATION STRATEGY • | 31 |
Portfolio of Investments
| Counterparty | Contracts to Deliver (000) | In Exchange (000) | Settlement Date | Unrealized Appreciation/ (Depreciation) | ||||||||||||
Royal Bank of Scotland PLC | GBP 247 | USD 399 | 11/14/14 | $ | 4,119 | |||||||||||
Royal Bank of Scotland PLC | EUR 4,105 | USD 5,203 | 11/21/14 | 58,831 | ||||||||||||
Royal Bank of Scotland PLC | AUD 3,618 | USD 3,176 | 12/12/14 | 1,017 | ||||||||||||
State Street Bank & Trust Co. | MXN 51,758 | USD 3,814 | 11/20/14 | (25,809 | ) | |||||||||||
State Street Bank & Trust Co. | USD 125 | CAD 141 | 11/21/14 | (330 | ) | |||||||||||
|
| |||||||||||||||
| $ | 133,966 | |||||||||||||||
|
| |||||||||||||||
CENTRALLY CLEARED CREDIT DEFAULT SWAPS (see Note D)
| Clearing Broker/ (Exchange) & Referenced Obligation | Fixed Rate (Pay) Receive | Implied Credit Spread at October 31, 2014 | Notional Amount (000) | Market Value | Unrealized Appreciation/ (Depreciation) | |||||||||||||||
Buy Contracts | ||||||||||||||||||||
Morgan Stanley & Co., |
| |||||||||||||||||||
CDX-NAHY Series 21, | (5.00 | )% | 2.88 | % | 3,267 | $ | (275,558 | ) | $ | (166,719 | ) | |||||||||
Citigroup Global Markets, Inc./(INTRCONX): | ||||||||||||||||||||
CDX-NAHY Series 21, | (5.00 | ) | 2.88 | 4,079 | (344,029 | ) | (104,527 | ) | ||||||||||||
|
|
|
| |||||||||||||||||
| $ | (619,587 | ) | $ | (271,246 | ) | |||||||||||||||
|
|
|
| |||||||||||||||||
| * | Termination Date |
CENTRALLY CLEARED INTEREST RATE SWAPS (see Note D)
| Rate Type | ||||||||||||||||||
Clearing Broker/ (Exchange) | Notional Amount (000) | Termination Date | Payments made by the Fund | Payments received by the Fund | Unrealized Appreciation/ (Depreciation) | |||||||||||||
Citigroup Global Markets, Inc./(CME Group) | $ | 1,940 | 6/25/21 | 2.247% | 3 Month LIBOR | $ | (35,832 | ) | ||||||||||
Morgan Stanley & Co., LLC/(CME Group) | NZD | 5,770 | 9/25/19 | 3 Month BKBM | 4.390% | 50,493 | ||||||||||||
Morgan Stanley & Co., LLC/(CME Group) | CAD | 7,010 | 10/03/19 | 1.993% | 3 Month CDOR | (26,849 | ) | |||||||||||
Morgan Stanley & Co., LLC/(CME Group) | $ | 5,360 | 10/07/19 | 3 Month LIBOR | 1.935% | 58,069 | ||||||||||||
Morgan Stanley & Co., LLC/(CME Group) | 6,980 | 10/31/19 | 3 Month LIBOR | 1.747% | 366 | |||||||||||||
Morgan Stanley & Co., LLC/(CME Group) | 2,610 | 1/14/24 | 2.980% | 3 Month LIBOR | (151,342 | ) | ||||||||||||
Morgan Stanley & Co., LLC/(CME Group) | 2,300 | 2/14/24 | 2.889% | 3 Month LIBOR | (107,605 | ) | ||||||||||||
Morgan Stanley & Co., LLC/(CME Group) | 3,280 | 4/28/24 | 2.817% | 3 Month LIBOR | (112,775 | ) | ||||||||||||
Morgan Stanley & Co., LLC/(CME Group) | 4,670 | 5/06/24 | 2.736% | 3 Month LIBOR | (185,445 | ) | ||||||||||||
Morgan Stanley & Co., LLC/(CME Group) | 1,890 | 5/29/24 | 3 Month LIBOR | 2.628% | 52,540 | |||||||||||||
| 32 | • ALLIANCEBERNSTEIN BOND INFLATION STRATEGY |
Portfolio of Investments
| Rate Type | ||||||||||||||||
Clearing Broker/ (Exchange) | Notional Amount (000) | Termination Date | Payments by the Fund | Payments by the Fund | Unrealized Appreciation/ (Depreciation) | |||||||||||
Morgan Stanley & Co., LLC/(CME Group) | $ | 3,790 | 6/05/24 | 2.710% | 3 Month LIBOR | $ | (131,768 | ) | ||||||||
Morgan Stanley & Co., LLC/(CME Group) | 3,330 | 7/02/24 | 2.632% | 3 Month LIBOR | (84,642 | ) | ||||||||||
Morgan Stanley & Co., LLC/(CME Group) | 2,370 | 7/10/24 | 2.674% | 3 Month LIBOR | (67,881 | ) | ||||||||||
Morgan Stanley & Co., LLC/(CME Group) | 1,900 | 7/18/24 | 3 Month LIBOR | 2.668% | 52,150 | |||||||||||
Morgan Stanley & Co., LLC/(CME Group) | 2,810 | 9/24/24 | 3 Month LIBOR | 2.691% | 65,246 | |||||||||||
Morgan Stanley & Co., LLC/(CME Group) | NZD | 3,880 | 9/25/24 | 4.628% | 3 Month BKBM | (59,647 | ) | |||||||||
|
| |||||||||||||||
| $ | (684,922 | ) | ||||||||||||||
|
| |||||||||||||||
CREDIT DEFAULT SWAPS (see Note D)
| Swap Counterparty & Referenced Obligation | Fixed Rate (Pay) Receive | Implied Credit Spread at October 31, 2014 | Notional Amount (000) | Market Value | Upfront Premiums Paid (Received) | Unrealized Appreciation/ (Depreciation) | ||||||||||||||||||
Sale Contracts | ||||||||||||||||||||||||
Bank of America, NA: | ||||||||||||||||||||||||
CDX-NAIG Series 19, | 1.00 | % | 0.35 | % | $ | 3,200 | $ | 68,659 | $ | 1,919 | $ | 66,740 | ||||||||||||
Credit Suisse International: | ||||||||||||||||||||||||
Kohl’s Corp., | 1.00 | 0.97 | 446 | 450 | (5,596 | ) | 6,046 | |||||||||||||||||
Kohl’s Corp., | 1.00 | 0.97 | 262 | 264 | (2,945 | ) | 3,208 | |||||||||||||||||
Kohl’s Corp., | 1.00 | 0.97 | 182 | 183 | (2,279 | ) | 2,462 | |||||||||||||||||
Kohl’s Corp., | 1.00 | 0.97 | 180 | 182 | (2,261 | ) | 2,443 | |||||||||||||||||
Deutsche Bank AG: | ||||||||||||||||||||||||
Anadarko Petroleum Corp., | 1.00 | 0.46 | 440 | 7,189 | (8,938 | ) | 16,127 | |||||||||||||||||
|
|
|
|
|
| |||||||||||||||||||
| $ | 76,927 | $ | (20,100 | ) | $ | 97,026 | ||||||||||||||||||
|
|
|
|
|
| |||||||||||||||||||
| * | Termination Date |
| ALLIANCEBERNSTEIN BOND INFLATION STRATEGY • | 33 |
Portfolio of Investments
INFLATION (CPI) SWAPS (see Note D)
| Rate Type | ||||||||||||||||
Swap Counterparty | Notional Amount (000) | Termination Date | Payments made by the Fund | Payments received by the Fund | Unrealized Appreciation/ (Depreciation) | |||||||||||
Barclays Bank PLC | $ | 21,900 | 7/15/16 | 1.984% | CPI# | $ | (207,608 | ) | ||||||||
Barclays Bank PLC | 12,100 | 1/15/18 | 2.069% | CPI# | (208,608 | ) | ||||||||||
Citibank, NA | 7,000 | 7/15/16 | 2.075% | CPI# | (97,111 | ) | ||||||||||
Morgan Stanley Capital Services LLC | 26,500 | 7/15/17 | 2.110% | CPI# | (360,318 | ) | ||||||||||
|
| |||||||||||||||
| $ | (873,645 | ) | ||||||||||||||
|
| |||||||||||||||
| # | Variable interest rate based on the rate of inflation as determined by the Consumer Price Index (CPI). |
INTEREST RATE SWAPS (see Note D)
| Rate Type | ||||||||||||||||
Swap Counterparty | Notional Amount (000) | Termination Date | Payments made by the Fund | Payments by the Fund | Unrealized Appreciation/ (Depreciation) | |||||||||||
Barclays Bank PLC | $ | 850 | 1/17/22 | 2.050% | 3 Month LIBOR | $ | 1,372 | |||||||||
Morgan Stanley Capital Services LLC | 1,100 | 2/21/42 | 2.813% | 3 Month LIBOR | 41,328 | |||||||||||
Morgan Stanley Capital Services LLC | 830 | 3/06/42 | 2.804% | 3 Month LIBOR | 33,598 | |||||||||||
|
| |||||||||||||||
| $ | 76,298 | |||||||||||||||
|
| |||||||||||||||
REVERSE REPURCHASE AGREEMENTS (see Note D)
| Broker | Interest Rate | Maturity | U.S. $ Value at October 31, 2014 | |||||||||
Bank of America | (0.10 | )%* | 11/05/14 | $ | 8,620,572 | |||||||
Bank of America† | 0.22 | % | — | 11,389,824 | ||||||||
Barclays Capital, Inc.† | 0.19 | % | — | 7,987,606 | ||||||||
HSBC | 0.14 | % | 12/09/14 | 27,832,090 | ||||||||
HSBC | 0.15 | % | 11/17/14 | 21,379,097 | ||||||||
JPMorgan Chase | 0.14 | % | 1/08/15 | 8,173,898 | ||||||||
|
| |||||||||||
| $ | 85,383,087 | |||||||||||
|
| |||||||||||
| * | Interest payment due from counterparty. |
| † | The reverse repurchase agreement matures on demand. Interest rate resets daily and the rate shown is the rate in effect on October 31, 2014 |
| (a) | Position, or a portion thereof, has been segregated to collateralize reverse repurchase agreements. |
| (b) | Security is exempt from registration under Rule 144A of the Securities Act of 1933. These securities are considered liquid and may be resold in transactions exempt from registration, normally to qualified institutional buyers. At October 31, 2014, the aggregate market value of these securities amounted to $55,025,812 or 14.7% of net assets. |
| (c) | Coupon rate adjusts periodically based upon a predetermined schedule. Stated interest rate in effect at October 31, 2014. |
| (d) | Securities are perpetual and, thus, do not have a predetermined maturity date. The date shown, if applicable, reflects the next call date. |
| 34 | • ALLIANCEBERNSTEIN BOND INFLATION STRATEGY |
Portfolio of Investments
| (e) | Floating Rate Security. Stated interest rate was in effect at October 31, 2014. |
| (f) | To obtain a copy of the fund’s financial statements, please go to the Securities and Exchange Commission’s website at www.sec.gov, or call AllianceBernstein at (800) 227-4618. |
| (g) | Investment in affiliated money market mutual fund. The rate shown represents the 7-day yield as of period end. |
Currency Abbreviations:
AUD – Australian Dollar
CAD – Canadian Dollar
EUR – Euro
GBP – Great British Pound
JPY – Japanese Yen
MXN – Mexican Peso
NZD – New Zealand Dollar
USD – United States Dollar
Glossary:
ABS – Asset-Backed Securities
ARMs – Adjustable Rate Mortgages
BKBM – Bank Bill Benchmark (New Zealand)
CBT – Chicago Board of Trade
CDOR – Canadian Dealer Offered Rate
CDX-NAHY – North American High Yield Credit Default Swap Index
CDX-NAIG – North American Investment Grade Credit Default Swap Index
CFC – Customer Facility Charge
CMBS – Commercial Mortgage-Backed Securities
CME – Chicago Mercantile Exchange
CPI – Consumer Price Index
GSE – Government-Sponsored Enterprise
INTRCONX – Inter-Continental Exchange
JSC – Joint Stock Company
LIBOR – London Interbank Offered Rates
REIT – Real Estate Investment Trust
TBA – To Be Announced
TIPS – Treasury Inflation Protected Security
See notes to financial statements.
| ALLIANCEBERNSTEIN BOND INFLATION STRATEGY • | 35 |
Portfolio of Investments
STATEMENT OF ASSETS & LIABILITIES
October 31, 2014
| Assets | ||||
Investments in securities, at value | ||||
Investments in securities, at value (cost $455,642,621) | $ | 454,835,033 | ||
Affiliated issuers (cost $3,846,482) | 3,846,482 | |||
Cash | 4,155 | |||
Due from broker | 895,331 | (a) | ||
Foreign currencies, at value (cost $154) | 245 | |||
Receivable for investment securities sold | 8,885,837 | |||
Interest receivable | 1,424,332 | |||
Receivable for capital stock sold | 1,113,363 | |||
Unrealized appreciation on forward currency exchange contracts | 160,105 | |||
Unrealized appreciation on credit default swaps | 97,026 | |||
Receivable for variation margin on exchange-traded derivatives | 83,584 | |||
Unrealized appreciation on interest rate swaps | 76,298 | |||
|
| |||
Total assets | 471,421,791 | |||
|
| |||
| Liabilities | ||||
Payable for reverse repurchase agreements | 85,383,087 | |||
Payable for investment securities purchased | 9,732,308 | |||
Unrealized depreciation on inflation swaps | 873,645 | |||
Payable for capital stock redeemed | 288,745 | |||
Advisory fee payable | 128,090 | |||
Distribution fee payable | 34,748 | |||
Unrealized depreciation on forward currency exchange contracts | 26,139 | |||
Upfront premium received on credit default swaps | 20,100 | |||
Administrative fee payable | 16,889 | |||
Transfer Agent fee payable | 6,219 | |||
Accrued expenses and other liabilities | 143,050 | |||
|
| |||
Total liabilities | 96,653,020 | |||
|
| |||
Net Assets | $ | 374,768,771 | ||
|
| |||
| Composition of Net Assets | ||||
Capital stock, at par | $ | 34,964 | ||
Additional paid-in capital | 381,983,570 | |||
Undistributed net investment income | 1,795,374 | |||
Accumulated net realized loss on investment and foreign | (6,505,950 | ) | ||
Net unrealized depreciation on investments and foreign | (2,539,187 | ) | ||
|
| |||
| $ | 374,768,771 | |||
|
|
See notes to financial statements.
| 36 | • ALLIANCEBERNSTEIN BOND INFLATION STRATEGY |
Statement of Assets & Liabilities
Net Asset Value Per Share—27 billion shares of capital stock authorized, $.001 par value
| Class | Net Assets | Shares Outstanding | Net Asset Value | |||||||||
| ||||||||||||
| A | $ | 15,859,283 | 1,472,123 | $ | 10.77 | * | ||||||
| ||||||||||||
| C | $ | 3,596,447 | 337,967 | $ | 10.64 | |||||||
| ||||||||||||
| Advisor | $ | 16,144,373 | 1,496,013 | $ | 10.79 | |||||||
| ||||||||||||
| R | $ | 229,681 | 21,316 | $ | 10.78 | |||||||
| ||||||||||||
| K | $ | 2,218,782 | 206,064 | $ | 10.77 | |||||||
| ||||||||||||
| I | $ | 840,603 | 78,313 | $ | 10.73 | |||||||
| ||||||||||||
| 1 | $ | 288,565,280 | 26,934,523 | $ | 10.71 | |||||||
| ||||||||||||
| 2 | $ | 47,314,322 | 4,417,801 | $ | 10.71 | |||||||
| ||||||||||||
| (a) | Represents amounts on deposit at the broker as collateral for open derivative contracts. |
| * | The maximum offering price per share for Class A shares was $11.25 which reflects a sales charge of 4.25%. |
See notes to financial statements.
| ALLIANCEBERNSTEIN BOND INFLATION STRATEGY • | 37 |
Statement of Assets & Liabilities
STATEMENT OF OPERATIONS
Year Ended October 31, 2014
| Investment Income | ||||||||
Interest | $ | 9,784,776 | ||||||
Dividends | ||||||||
Unaffiliated issuers | 33,181 | |||||||
Affiliated issuers | 5,388 | |||||||
Consent fee income | 2,396 | $ | 9,825,741 | |||||
|
| |||||||
| Expenses | ||||||||
Advisory fee (see Note B) | 2,079,818 | |||||||
Distribution fee—Class A | 62,827 | |||||||
Distribution fee—Class C | 44,011 | |||||||
Distribution fee—Class R | 1,043 | |||||||
Distribution fee—Class K | 4,676 | |||||||
Distribution fee—Class 1 | 326,244 | |||||||
Transfer agency—Class A | 40,140 | |||||||
Transfer agency—Class C | 8,834 | |||||||
Transfer agency—Advisor Class | 21,439 | |||||||
Transfer agency—Class R | 500 | |||||||
Transfer agency—Class K | 3,000 | |||||||
Transfer agency—Class I | 824 | |||||||
Transfer agency—Class 1 | 19,369 | |||||||
Transfer agency—Class 2 | 2,816 | |||||||
Custodian | 207,638 | |||||||
Registration fees | 96,083 | |||||||
Audit and tax | 85,921 | |||||||
Printing | 60,106 | |||||||
Administrative | 51,054 | |||||||
Legal | 39,955 | |||||||
Directors’ fees | 6,107 | |||||||
Miscellaneous | 20,528 | |||||||
|
| |||||||
Total expenses before interest expense | 3,182,933 | |||||||
Interest expense | 100,586 | |||||||
|
| |||||||
Total expenses | 3,283,519 | |||||||
Less: expenses waived and reimbursed by the Adviser (see Note B) | (715,454 | ) | ||||||
|
| |||||||
Net expenses | 2,568,065 | |||||||
|
| |||||||
Net investment income | 7,257,676 | |||||||
|
| |||||||
| Realized and Unrealized Gain (Loss) on Investment and Foreign Currency Transactions | ||||||||
Net realized gain (loss) on: | ||||||||
Investment transactions | (2,802,272 | ) | ||||||
Futures | (1,028,131 | ) | ||||||
Swaps | (526,571 | ) | ||||||
Foreign currency transactions | 1,025,281 | |||||||
Net change in unrealized appreciation/depreciation of: | ||||||||
Investments | 3,482,495 | |||||||
Futures | (138,881 | ) | ||||||
Swaps | (1,099,481 | ) | ||||||
Foreign currency denominated assets and liabilities | 158,389 | |||||||
|
| |||||||
Net loss on investment and foreign currency transactions | (929,171 | ) | ||||||
|
| |||||||
Net Increase in Net Assets from Operations | $ | 6,328,505 | ||||||
|
|
See notes to financial statements.
| 38 | • ALLIANCEBERNSTEIN BOND INFLATION STRATEGY |
Statement of Operations
STATEMENT OF CHANGES IN NET ASSETS
| Year Ended October 31, 2014 | Year Ended October 31, 2013 | |||||||
| Increase (Decrease) in Net Assets from Operations | ||||||||
Net investment income | $ | 7,257,676 | $ | 3,471,793 | ||||
Net realized loss on investment and | (3,331,693 | ) | (1,227,759 | ) | ||||
Net change in unrealized appreciation/depreciation of investments and foreign currency denominated assets and liabilities | 2,402,522 | (17,735,854 | ) | |||||
|
|
|
| |||||
Net increase (decrease) in net assets from operations | 6,328,505 | (15,491,820 | ) | |||||
| Dividends and Distributions to Shareholders from | ||||||||
Net investment income | ||||||||
Class A | (324,609 | ) | (128,297 | ) | ||||
Class C | (47,997 | ) | (4,178 | ) | ||||
Advisor Class | (187,729 | ) | (57,090 | ) | ||||
Class R | (2,783 | ) | (683 | ) | ||||
Class K | (29,968 | ) | (12,054 | ) | ||||
Class I | (52,380 | ) | (3,856 | ) | ||||
Class 1 | (6,051,926 | ) | (2,543,031 | ) | ||||
Class 2 | (949,413 | ) | (535,851 | ) | ||||
Net realized gain on investment transactions | ||||||||
Class A | – 0 | – | (3,042 | ) | ||||
Class C | – 0 | – | (1,390 | ) | ||||
Advisor Class | – 0 | – | (905 | ) | ||||
Class R | – 0 | – | (90 | ) | ||||
Class K | – 0 | – | (355 | ) | ||||
Class I | – 0 | – | (45 | ) | ||||
Class 1 | – 0 | – | (33,481 | ) | ||||
Class 2 | – 0 | – | (8,262 | ) | ||||
| Capital Stock Transactions | ||||||||
Net increase (decrease) | (27,646,661 | ) | 147,564,135 | |||||
|
|
|
| |||||
Total increase (decrease) | (28,964,961 | ) | 128,739,705 | |||||
| Net Assets | ||||||||
Beginning of period | 403,733,732 | 274,994,027 | ||||||
|
|
|
| |||||
End of period (including undistributed net investment income of $1,795,374 and $1,025,229, respectively) | $ | 374,768,771 | $ | 403,733,732 | ||||
|
|
|
| |||||
See notes to financial statements.
| ALLIANCEBERNSTEIN BOND INFLATION STRATEGY • | 39 |
Statement of Changes in Net Assets
STATEMENT OF CASH FLOWS
For the Year Ended October 31, 2014
| Cash flows from operating activities | ||||||||
Net increase in net assets from operations | $ | 6,328,505 | ||||||
| Reconciliation of Net Increase in Net Assets from Operations to Net Increase in Cash from Operating Activities: | ||||||||
Decrease in interest and dividends receivable | $ | 276,823 | ||||||
Increase in receivable for investments sold | (8,606,974 | ) | ||||||
Net accretion of bond discount and amortization of bond premium | 3,683,444 | |||||||
Inflation index adjustment | (6,164,331 | ) | ||||||
Increase in payable for investments purchased | 9,214,818 | |||||||
Decrease in accrued expenses and other liabilities | (5,755 | ) | ||||||
Decrease in due from broker | 184,390 | |||||||
Purchases of long-term investments | (399,597,206 | ) | ||||||
Purchases of short-term investments | (404,262,989 | ) | ||||||
Proceeds from disposition of long-term investments | 388,020,574 | |||||||
Proceeds from disposition of short-term investments | 436,667,195 | |||||||
Proceeds on swaps, net | (810,526 | ) | ||||||
Payments for exchange-traded derivatives settlements | (2,125,086 | ) | ||||||
Variation margin received on exchange-traded derivatives | (205,855 | ) | ||||||
Net realized loss on investment and foreign currency transactions | 3,331,693 | |||||||
Net change in unrealized appreciaton/depreciation of investments and foreign currency denominated assets and liabilities | (2,402,522 | ) | ||||||
|
| |||||||
Total adjustments | 17,197,693 | |||||||
|
| |||||||
Net increase in cash from operating activities | $ | 23,526,198 | ||||||
|
| |||||||
| Financing Activities: | ||||||||
Redemptions of capital stock, net | (33,558,231 | ) | ||||||
Decrease in due to custodian | (30,072,307 | ) | ||||||
Cash dividends paid (net of dividend reinvestments)* | (1,745,194 | ) | ||||||
Increase in reverse repurchase agreements | 40,670,037 | |||||||
|
| |||||||
Net decrease in cash from financing activities | (24,705,695 | ) | ||||||
Effect of exchange rate on cash | 1,183,670 | |||||||
|
| |||||||
Net increase in cash | 4,173 | |||||||
Net change in cash | ||||||||
Cash at beginning of year | 227 | |||||||
|
| |||||||
Cash at end of year | $ | 4,400 | ||||||
|
| |||||||
* Reinvestment of dividends | 5,901,611 | |||||||
Supplemental disclosure of cash flow information: | ||||||||
Interest expense paid during the year | 96,263 |
In accordance with U.S. GAAP, the Strategy has included a Statement of Cash Flows as a result of its significant investments in reverse repurchase agreements throughout the year.
See notes to financial statements.
| 40 | • ALLIANCEBERNSTEIN BOND INFLATION STRATEGY |
Statement of Cash Flows
NOTES TO FINANCIAL STATEMENTS
October 31, 2014
NOTE A
Significant Accounting Policies
AllianceBernstein Bond Fund, Inc. (the “Fund”) is registered under the Investment Company Act of 1940 as an open-end management investment company. The Fund, which is a Maryland corporation, operates as a series company comprised of nine portfolios currently in operation: the Intermediate Bond Portfolio, the Bond Inflation Strategy Portfolio, the Municipal Bond Inflation Strategy Portfolio, the Real Asset Strategy Portfolio, the Government Reserves Portfolio, the Tax-Aware Fixed Income Portfolio, the Limited Duration High Income Portfolio, the AllianceBernstein Credit Long/Short Portfolio and the AllianceBernstein High Yield Portfolio. They are each diversified Portfolios, with the exception of the Limited Duration High Income Portfolio, which is non-diversified. The Government Reserves Portfolio commenced operations on May 1, 2013. The Tax-Aware Fixed Income Portfolio commenced operations on December 11, 2013. The AllianceBernstein Credit Long/Short Portfolio commenced operations on May 7, 2014. The AllianceBernstein High Yield Portfolio commenced operations July 15, 2014. Each Portfolio is considered to be a separate entity for financial reporting and tax purposes. This report relates only to the Bond Inflation Strategy Portfolio (the “Strategy”). The Strategy has authorized the issuance of Class A, Class B, Class C, Advisor Class, Class R, Class K, Class I, Class 1 and Class 2 shares. Class B shares are not currently being offered. Class 1 shares are sold only to the private clients of Sanford C. Bernstein & Co. LLC by its registered representatives. Class A shares are sold with a front-end sales charge of up to 4.25% for purchases not exceeding $1,000,000. With respect to purchases of $1,000,000 or more, Class A shares redeemed within one year of purchase may be subject to a contingent deferred sales charge of 1%. Class C shares are subject to a contingent deferred sales charge of 1% on redemptions made within the first year after purchase. Class R, Class K, and Class 1 shares are sold without an initial or contingent deferred sales charge. Advisor Class, Class I, and Class 2 shares are sold without an initial or contingent deferred sales charge and are not subject to ongoing distribution expenses. All nine classes of shares have identical voting, dividend, liquidation and other rights, except that the classes bear different distribution and transfer agency expenses. Each class has exclusive voting rights with respect to its distribution plan. The financial statements have been prepared in conformity with U.S. generally accepted accounting principles (“U.S. GAAP”) which require management to make certain estimates and assumptions that affect the reported amounts of assets and liabilities in the financial statements and amounts of income and expenses during the reporting period. Actual results could differ from those estimates. The following is a summary of significant accounting policies followed by the Strategy.
1. Security Valuation
Portfolio securities are valued at their current market value determined on the basis of market quotations or, if market quotations are not readily available or
| ALLIANCEBERNSTEIN BOND INFLATION STRATEGY • | 41 |
Notes to Financial Statements
are deemed unreliable, at “fair value” as determined in accordance with procedures established by and under the general supervision of the Fund’s Board of Directors (the “Board”).
In general, the market values of securities which are readily available and deemed reliable are determined as follows: securities listed on a national securities exchange (other than securities listed on the NASDAQ Stock Market, Inc. (“NASDAQ”)) or on a foreign securities exchange are valued at the last sale price at the close of the exchange or foreign securities exchange. If there has been no sale on such day, the securities are valued at the last traded price from the previous day. Securities listed on more than one exchange are valued by reference to the principal exchange on which the securities are traded; securities listed only on NASDAQ are valued in accordance with the NASDAQ Official Closing Price; listed or over the counter (“OTC”) market put or call options are valued at the mid level between the current bid and ask prices. If either a current bid or current ask price is unavailable, AllianceBernstein L.P. (the “Adviser”) will have discretion to determine the best valuation (e.g. last trade price in the case of listed options); open futures are valued using the closing settlement price or, in the absence of such a price, the most recent quoted bid price. If there are no quotations available for the day of valuation, the last available closing settlement price is used; U.S. government securities and other debt instruments having 60 days or less remaining until maturity are valued at amortized cost if their original maturity was 60 days or less. If the original term to maturity exceeded 60 days, the securities are valued by a pricing service, if a market price is available. If a market price is not available, the securities are valued by using amortized cost as of the 61st day prior to maturity. Fixed-income securities, including mortgage-backed and asset-backed securities, may be valued on the basis of prices provided by a pricing service or at a price obtained from one or more of the major broker-dealers. In cases where broker-dealer quotes are obtained, the Adviser may establish procedures whereby changes in market yields or spreads are used to adjust, on a daily basis, a recently obtained quoted price on a security. Swaps and other derivatives are valued daily, primarily using independent pricing services, independent pricing models using market inputs, as well as third party broker-dealers or counterparties. Investment companies are valued at their net asset value each day.
Securities for which market quotations are not readily available (including restricted securities) or are deemed unreliable are valued at fair value. Factors considered in making this determination may include, but are not limited to, information obtained by contacting the issuer, analysts, analysis of the issuer’s financial statements or other available documents. In addition, the Strategy may use fair value pricing for securities primarily traded in non-U.S. markets because most foreign markets close well before the Strategy values its securities at 4:00 p.m., Eastern Time. The earlier close of these foreign markets gives rise to the possibility that significant events, including broad market moves, may have occurred in the interim and may materially affect the value of those securities.
| 42 | • ALLIANCEBERNSTEIN BOND INFLATION STRATEGY |
Notes to Financial Statements
2. Fair Value Measurements
In accordance with U.S. GAAP regarding fair value measurements, fair value is defined as the price that the Strategy would receive to sell an asset or pay to transfer a liability in an orderly transaction between market participants at the measurement date. U.S. GAAP establishes a framework for measuring fair value, and a three-level hierarchy for fair value measurements based upon the transparency of inputs to the valuation of an asset or liability (including those valued based on their market values as described in Note A.1 above). Inputs may be observable or unobservable and refer broadly to the assumptions that market participants would use in pricing the asset or liability. Observable inputs reflect the assumptions market participants would use in pricing the asset or liability based on market data obtained from sources independent of the Strategy. Unobservable inputs reflect the Strategy’s own assumptions about the assumptions that market participants would use in pricing the asset or liability based on the best information available in the circumstances. Each investment is assigned a level based upon the observability of the inputs which are significant to the overall valuation. The three-tier hierarchy of inputs is summarized below.
| • | Level 1—quoted prices in active markets for identical investments |
| • | Level 2—other significant observable inputs (including quoted prices for similar investments, interest rates, prepayment speeds, credit risk, etc.) |
| • | Level 3—significant unobservable inputs (including the Strategy’s own assumptions in determining the fair value of investments) |
The fair value of debt instruments, such as bonds, and over-the-counter derivatives is generally based on market price quotations, recently executed market transactions (where observable) or industry recognized modeling techniques and are generally classified as Level 2. Pricing vendor inputs to Level 2 valuations may include quoted prices for similar investments in active markets, interest rate curves, coupon rates, currency rates, yield curves, option adjusted spreads, default rates, credit spreads and other unique security features in order to estimate the relevant cash flows which are then discounted to calculate fair values. If these inputs are unobservable and significant to the fair value, these investments will be classified as Level 3. In addition, non-agency rated investments are classified as Level 3.
Where readily available market prices or relevant bid prices are not available for certain equity investments, such investments may be valued based on similar publicly traded investments, movements in relevant indices since last available prices or based upon underlying company fundamentals and comparable company data (such as multiples to earnings or other multiples to equity). Where an investment is valued using an observable input, such as another publicly traded security, the investment will be classified as Level 2. If management determines that an adjustment is appropriate based on restrictions on resale, illiquidity or uncertainty, and such adjustment is a significant component of the valuation, the investment will be classified as Level 3. An
| ALLIANCEBERNSTEIN BOND INFLATION STRATEGY • | 43 |
Notes to Financial Statements
investment will also be classified as Level 3 where management uses company fundamentals and other significant inputs to determine the valuation.
Valuations of mortgage-backed or other asset-backed securities, by pricing vendors, are based on both proprietary and industry recognized models and discounted cash flow techniques. Significant inputs to the valuation of these instruments are value of the collateral, the rates and timing of delinquencies, the rates and timing of prepayments, and default and loss expectations, which are driven in part by housing prices for residential mortgages. Significant inputs are determined based on relative value analyses, which incorporate comparisons to instruments with similar collateral and risk profiles, including relevant indices. Mortgage and asset-backed securities for which management has collected current observable data through pricing services are generally categorized within Level 2. Those investments for which current observable data has not been provided are classified as Level 3.
Other fixed income investments, including non-U.S. government and corporate debt, are generally valued using quoted market prices, if available, which are typically impacted by current interest rates, maturity dates and any perceived credit risk of the issuer. Additionally, in the absence of quoted market prices, these inputs are used by pricing vendors to derive a valuation based upon industry or proprietary models which incorporate issuer specific data with relevant yield/spread comparisons with more widely quoted bonds with similar key characteristics. Those investments for which there are observable inputs are classified as Level 2. Where the inputs are not observable, the investments are classified as Level 3.
The following table summarizes the valuation of the Strategy’s investments by the above fair value hierarchy levels as of October 31, 2014:
Investments in | Level 1 | Level 2 | Level 3 | Total | ||||||||||||
Assets: | ||||||||||||||||
Inflation-Linked Securities | $ | – 0 | – | $ | 310,744,732 | $ | – 0 | – | $ | 310,744,732 | ||||||
Corporates – Investment Grade | – 0 | – | 52,602,811 | – 0 | – | 52,602,811 | ||||||||||
Asset-Backed Securities | – 0 | – | 31,876,692 | 2,818,092 | 34,694,784 | |||||||||||
Commercial Mortgage-Backed Securities | – 0 | – | 26,785,466 | 3,965,975 | 30,751,441 | |||||||||||
Corporates – Non-Investment Grade | – 0 | – | 13,558,256 | – 0 | – | 13,558,256 | ||||||||||
Governments – Treasuries | – 0 | – | 3,768,357 | – 0 | – | 3,768,357 | ||||||||||
Collateralized Mortgage Obligations | – 0 | – | – 0 | – | 3,714,288 | 3,714,288 | ||||||||||
Quasi-Sovereigns | – 0 | – | 3,052,362 | – 0 | – | 3,052,362 | ||||||||||
Emerging Markets – Corporate Bonds | – 0 | – | 773,847 | – 0 | – | 773,847 | ||||||||||
Governments – Sovereign Agencies | – 0 | – | 707,933 | – 0 | – | 707,933 | ||||||||||
Governments – Sovereign Bonds | – 0 | – | 414,604 | – 0 | – | 414,604 | ||||||||||
Preferred Stocks | 51,618 | – 0 | – | – 0 | – | 51,618 | ||||||||||
Short-Term Investments | 3,846,482 | – 0 | – | – 0 | – | 3,846,482 | ||||||||||
|
|
|
|
|
|
|
| |||||||||
Total Investments in Securities | 3,898,100 | 444,285,060 | 10,498,355 | 458,681,515 | ||||||||||||
| 44 | • ALLIANCEBERNSTEIN BOND INFLATION STRATEGY |
Notes to Financial Statements
Investments in | Level 1 | Level 2 | Level 3 | Total | ||||||||||||
Other Financial Instruments* : | ||||||||||||||||
Assets: | ||||||||||||||||
Futures | $ | 83,871 | $ | – 0 | – | $ | – 0 | – | $ | 83,871 | # | |||||
Forward Currency Exchange Contracts | – 0 | – | 160,105 | – 0 | – | 160,105 | ||||||||||
Centrally Cleared Interest Rate Swaps | – 0 | – | 278,864 | – 0 | – | 278,864 | # | |||||||||
Credit Default Swaps | – 0 | – | 97,026 | – 0 | – | 97,026 | ||||||||||
Interest Rate Swaps | – 0 | – | 76,298 | – 0 | – | 76,298 | ||||||||||
Liabilities: | ||||||||||||||||
Futures | (289,876 | ) | – 0 | – | – 0 | – | (289,876 | )# | ||||||||
Forward Currency Exchange Contracts | – 0 | – | (26,139 | ) | – 0 | – | (26,139 | ) | ||||||||
Centrally Cleared Credit Default Swaps | – 0 | – | (271,246 | ) | – 0 | – | (271,246 | )# | ||||||||
Centrally Cleared Interest Rate Swaps | – 0 | – | (963,786 | ) | – 0 | – | (963,786 | )# | ||||||||
Inflation (CPI) Swaps | – 0 | – | (873,645 | ) | – 0 | – | (873,645 | ) | ||||||||
|
|
|
|
|
|
|
| |||||||||
Total+ | $ | 3,692,095 | $ | 442,762,537 | $ | 10,498,355 | $ | 456,952,987 | ||||||||
|
|
|
|
|
|
|
| |||||||||
| * | Other financial instruments are derivative instruments, such as futures, forwards and swaps, which are valued at the unrealized appreciation/depreciation on the instrument. |
| # | Only variation margin receivable/payable at period end is reported within the statement of assets and liabilities. This amount reflects cumulative appreciation/(depreciation) of exchange-traded derivatives as reported in the portfolio of investments. |
| + | There were no transfers between any levels during the reporting period. |
The Strategy recognizes all transfers between levels of the fair value hierarchy assuming the financial instruments were transferred at the beginning of the reporting period.
The following is a reconciliation of investments in which significant unobservable inputs (Level 3) were used in determining fair value.
| Asset-Backed Securities | Commercial Mortgage-Backed Securities | Collateralized Mortgage Obligations | ||||||||||
Balance as of 10/31/13 | $ | 1,887,711 | $ | 2,373,786 | $ | 2,328,160 | ||||||
Accrued discounts/(premiums) | 3,983 | (14,078 | ) | 9,680 | ||||||||
Realized gain (loss) | (1,523 | ) | 319 | (43,932 | ) | |||||||
Change in unrealized appreciation/depreciation | 21,926 | (32,718 | ) | 96,485 | ||||||||
Purchases | 2,817,203 | 2,143,220 | 3,753,602 | |||||||||
Sales | (1,911,208 | ) | (504,554 | ) | (2,429,707 | ) | ||||||
Settlements | – 0 | – | – 0 | – | – 0 | – | ||||||
Transfers in to Level 3 | – 0 | – | – 0 | – | – 0 | – | ||||||
Transfers out of Level 3 | – 0 | – | – 0 | – | – 0 | – | ||||||
|
|
|
|
|
| |||||||
Balance as of 10/31/14 | $ | 2,818,092 | $ | 3,965,975 | $ | 3,714,288 | ||||||
|
|
|
|
|
| |||||||
Net change in unrealized appreciation/depreciation from investments held as of 10/31/14* | $ | 857 | $ | (26,085 | ) | $ | (12,527 | ) | ||||
|
|
|
|
|
| |||||||
| ALLIANCEBERNSTEIN BOND INFLATION STRATEGY • | 45 |
Notes to Financial Statements
| Centrally Cleared Interest Rate Swaps | Total | |||||||||
Balance as of 10/31/13 | $ | (41,645 | ) | $ | 6,548,012 | |||||
Accrued discounts/(premiums) | – 0 | – | (415 | ) | ||||||
Realized gain (loss) | (16,839 | ) | (61,975 | ) | ||||||
Change in unrealized appreciation/depreciation | 41,645 | 127,338 | ||||||||
Purchases | – 0 | – | 8,714,025 | |||||||
Sales | – 0 | – | (4,845,469 | ) | ||||||
Settlements | 16,839 | 16,839 | ||||||||
Transfers in to Level 3 | – 0 | – | – 0 | – | ||||||
Transfers out of Level 3 | – 0 | – | – 0 | – | ||||||
|
|
|
| |||||||
Balance as of 10/31/14 | $ | – 0 | – | $ | 10,498,355 | |||||
|
|
|
| |||||||
Net change in unrealized appreciation/depreciation from investments held as of 10/31/14* | $ | – 0 | – | $ | (37,755 | ) | ||||
|
|
|
| |||||||
| * | The unrealized appreciation/depreciation is included in net change in unrealized appreciation/depreciation of investments in the accompanying statement of operations. |
As of October 31, 2014 all Level 3 securities were priced by third party vendors.
The Adviser has established a Valuation Committee (the “Committee”) which is responsible for overseeing the pricing and valuation of all securities held in the Strategy. The Committee operates under pricing and valuation policies and procedures established by the Adviser and approved by the Board, including pricing policies which set forth the mechanisms and processes to be employed on a daily basis to implement these policies and procedures. In particular, the pricing policies describe how to determine market quotations for securities and other instruments. The Committee’s responsibilities include: 1) fair value and liquidity determinations (and oversight of any third parties to whom any responsibility for fair value and liquidity determinations is delegated), and 2) regular monitoring of the Adviser’s pricing and valuation policies and procedures and modification or enhancement of these policies and procedures (or recommendation of the modification of these policies and procedures) as the Committee believes appropriate.
The Committee is also responsible for monitoring the implementation of the pricing policies by the Adviser’s Pricing Group (the “Pricing Group”) and a third party which performs certain pricing functions in accordance with the pricing policies. The Pricing Group is responsible for the oversight of the third party on a day-to-day basis. The Committee and the Pricing Group perform a series of activities to provide reasonable assurance of the accuracy of prices including: 1) periodic vendor due diligence meetings, review of methodologies, new developments and processes at vendors, 2) daily comparison of security valuation versus prior day for all securities that exceeded established thresholds, and 3) daily review of unpriced, stale, and variance reports with exceptions reviewed by senior management and the Committee.
In addition, several processes outside of the pricing process are used to monitor valuation issues including: 1) performance and performance attribution reports are monitored for anomalous impacts based upon benchmark performance, and
| 46 | • ALLIANCEBERNSTEIN BOND INFLATION STRATEGY |
Notes to Financial Statements
2) portfolio managers review all portfolios for performance and analytics (which are generated using the Adviser’s prices).
3. Currency Translation
Assets and liabilities denominated in foreign currencies and commitments under forward currency exchange contracts are translated into U.S. dollars at the mean of the quoted bid and ask prices of such currencies against the U.S. dollar. Purchases and sales of portfolio securities are translated into U.S. dollars at the rates of exchange prevailing when such securities were acquired or sold. Income and expenses are translated into U.S. dollars at rates of exchange prevailing when accrued.
Net realized gain or loss on foreign currency transactions represents foreign exchange gains and losses from sales and maturities of foreign fixed income investments, foreign currency exchange contracts, holding of foreign currencies, currency gains or losses realized between the trade and settlement dates on foreign investment transactions, and the difference between the amounts of dividends, interest and foreign withholding taxes recorded on the Strategy’s books and the U.S. dollar equivalent amounts actually received or paid. Net unrealized currency gains and losses from valuing foreign currency denominated assets and liabilities at period end exchange rates are reflected as a component of net unrealized appreciation or depreciation of foreign currency denominated assets and liabilities.
4. Taxes
It is the Strategy’s policy to meet the requirements of the Internal Revenue Code applicable to regulated investment companies and to distribute all of its investment company taxable income and net realized gains, if any, to shareholders. Therefore, no provisions for federal income or excise taxes are required. The Strategy may be subject to taxes imposed by countries in which it invests. Such taxes are generally based on income and/or capital gains earned or repatriated. Taxes are accrued and applied to net investment income, net realized gains and net unrealized appreciation/depreciation as such income and/or gains are earned.
In accordance with U.S. GAAP requirements regarding accounting for uncertainties in income taxes, management has analyzed the Strategy’s tax positions taken or expected to be taken on federal and state income tax returns for all open tax years (all years since inception of the Strategy’s) and has concluded that no provision for income tax is required in the Strategy’s financial statements.
5. Investment Income and Investment Transactions
Dividend income is recorded on the ex-dividend date or as soon as the Strategy is informed of the dividend. Interest income is accrued daily. Investment transactions are accounted for on the date the securities are purchased or sold. Investment gains or losses are determined on the identified cost basis. The Strategy amortizes premiums and accretes discounts as adjustments to interest income.
| ALLIANCEBERNSTEIN BOND INFLATION STRATEGY • | 47 |
Notes to Financial Statements
6. Class Allocations
All income earned and expenses incurred by the Strategy are borne on a pro-rata basis by each outstanding class of shares, based on the proportionate interest in the Strategy represented by the net assets of such class, except for class specific expenses which are allocated to the respective class. Expenses of the Fund are charged proportionately to each Strategy or based on other appropriate methods. Realized and unrealized gains and losses are allocated among the various share classes based on respective net assets.
7. Dividends and Distributions
Dividends and distributions to shareholders, if any, are recorded on the ex-dividend date. Income dividends and capital gains distributions are determined in accordance with federal tax regulations and may differ from those determined in accordance with U.S. GAAP. To the extent these differences are permanent, such amounts are reclassified within the capital accounts based on their federal tax basis treatment; temporary differences do not require such reclassification.
NOTE B
Advisory Fee and Other Transactions with Affiliates
Under the terms of the investment advisory agreement, the Strategy pays the Adviser an advisory fee at an annual rate of .50% of the first $2.5 billion, .45% of the next $2.5 billion and .40% in excess of $5 billion, of the Strategy’s average daily net assets. The Adviser has agreed to waive its fees and bear certain expenses to the extent necessary to limit total operating expenses on an annual basis (“Expense Caps”) to .80%, 1.50%, .50%, 1.00%, .75%, .50%, .60% and .50% of the daily average net assets for the Class A, Class C, Advisor Class, Class R, Class K, Class I, Class 1, and Class 2 shares, respectively. Prior to February 1, 2014, the Expense Caps were .75%, 1.45%, .45%, .95%, .70%, .45%, .55% and .45% of the daily average net assets for the Class A, Class C, Advisor Class, Class R, Class K, Class I, Class 1, and Class 2 shares, respectively. Under the agreement, fees waived and expenses borne by the Adviser were subject to repayment by the Strategy until January 26, 2013. No repayment was made that would cause the Strategy’s total annualized operating expenses to exceed the net fee percentage set forth above, or would have exceeded the amount of offering expenses as recorded by the Strategy before January 26, 2011. This fee waiver and/or expense reimbursement agreement will remain in effect until January 31, 2015 and then may be extended for additional one-year terms. For the year ended October 31, 2014, such reimbursement amounted to $715,454.
Pursuant to the investment advisory agreement, the Strategy may reimburse the Adviser for certain legal and accounting services provided to the Strategy by the Adviser. For the year ended October 31, 2014, the reimbursement for such services amounted to $51,054.
The Strategy compensates AllianceBernstein Investor Services, Inc. (“ABIS”), a wholly-owned subsidiary of the Adviser, under a Transfer Agency Agreement for
| 48 | • ALLIANCEBERNSTEIN BOND INFLATION STRATEGY |
Notes to Financial Statements
providing personnel and facilities to perform transfer agency services for the Strategy. ABIS may make payments to intermediaries that provide omnibus account services, sub-accounting services and/or networking services. Such compensation retained by ABIS amounted to $74,080 for the year ended October 31, 2014.
AllianceBernstein Investments, Inc. (the “Distributor”), a wholly-owned subsidiary of the Adviser, serves as the distributor of the Strategy’s shares. The Distributor has advised the Strategy that it has retained front-end sales charges of $601 from the sale of Class A shares and received $0 and $319 in contingent deferred sales charges imposed upon redemptions by shareholders of Class A and Class C shares, respectively, for the year ended October 31, 2014.
The Strategy may invest in the AllianceBernstein Fixed-Income Shares, Inc.—Government STIF Portfolio (“Government STIF Portfolio”), an open-end management investment company managed by the Adviser. The Government STIF Portfolio is offered as a cash management option to mutual funds and other institutional accounts of the Adviser, and is not available for direct purchase by members of the public. The Government STIF Portfolio pays no investment management fees but does bear its own expenses. A summary of the Strategy’s transactions in shares of the Government STIF Portfolio for the year ended October 31, 2014 is as follows:
Market Value October 31, 2013 (000) | Purchases at Cost (000) | Sales Proceeds (000) | Market Value October 31, 2014 (000) | Dividend Income (000) | ||||||||||||
| $ 36,251 | $ | 404,262 | $ | 436,667 | $ | 3,846 | $ | 5 | ||||||||
Brokerage commissions paid on investment transactions for the year ended October 31, 2014 amounted to $5,365, of which $0 and $0, respectively, was paid to Sanford C. Bernstein & Co. LLC and Sanford C. Bernstein Limited, affiliates of the Adviser.
NOTE C
Distribution Services Agreement
The Strategy has adopted a Distribution Services Agreement (the “Agreement”) pursuant to Rule 12b-1 under the Investment Company Act of 1940. Under the Agreement, the Strategy pays distribution and servicing fees to the Distributor at an annual rate of up to .30% of the Strategy’s average daily net assets attributable to Class A shares, 1% of the Strategy’s average daily net assets attributable to Class C shares, .50% of the Strategy’s average daily net assets attributable to Class R shares, .25% of the Strategy’s average daily net assets attributable to Class K shares and .10% of the Strategy’s average daily net assets attributable to Class 1 shares. There are no distribution and servicing fees on the Advisor Class, Class I, and Class 2 shares. The fees are accrued daily and paid monthly. The Agreement provides that the Distributor will use such payments in their entirety for distribution assistance and promotional activities. Since the commencement
| ALLIANCEBERNSTEIN BOND INFLATION STRATEGY • | 49 |
Notes to Financial Statements
of the Strategy’s operations, the Distributor has incurred expenses in excess of the distribution costs reimbursed by the Strategy in the amounts of $226,250, $15,717, $17,185 and $9,759 for Class C, Class R, Class K and Class 1 shares, respectively. While such costs may be recovered from the Strategy in future periods so long as the Agreement is in effect, the rate of the distribution and servicing fees payable under the Agreement may not be increased without a shareholder vote. In accordance with the Agreement, there is no provision for recovery of unreimbursed distribution costs incurred by the Distributor beyond the current fiscal year for Class A shares. The Agreement also provides that the Adviser may use its own resources to finance the distribution of the Strategy’s shares.
NOTE D
Investment Transactions
Purchases and sales of investment securities (excluding short-term investments) for the year ended October 31, 2014 were as follows:
| Purchases | Sales | |||||||
Investment securities (excluding | $ | 90,946,950 | $ | 81,662,871 | ||||
U.S. government securities | 308,650,256 | 295,873,732 | ||||||
Accordingly, gross unrealized appreciation and unrealized depreciation (excluding futures, foreign currency and swap transactions) are as follows:
Cost | $ | 460,133,632 | ||
|
| |||
Gross unrealized appreciation | $ | 3,199,453 | ||
Gross unrealized depreciation | (4,651,570 | ) | ||
|
| |||
Net unrealized depreciation | $ | (1,452,117 | ) | |
|
|
1. Derivative Financial Instruments
The Strategy may use derivatives in an effort to earn income and enhance returns, to replace more traditional direct investments, to obtain exposure to otherwise inaccessible markets (collectively, “investment purposes”), or to hedge or adjust the risk profile of its portfolio.
The principal types of derivatives utilized by the Strategy, as well as the methods in which they may be used are:
| • | Futures |
The Strategy may buy or sell futures for investment purposes or for the purpose of hedging its portfolio against adverse effects of potential movements in the market. The Strategy bears the market risk that arises from changes in the value of these instruments and the imperfect correlation between movements in the price of the futures and movements in the price of the assets, reference rates or indices which they are designed to track. Among other things, the Strategy may purchase or sell futures for
| 50 | • ALLIANCEBERNSTEIN BOND INFLATION STRATEGY |
Notes to Financial Statements
foreign currencies or options thereon for non-hedging purposes as a means of making direct investment in foreign currencies, as described below under “Currency Transactions”.
At the time the Strategy enters into futures, the Strategy deposits and maintains as collateral an initial margin with the broker, as required by the exchange on which the transaction is effected. Such amount is shown as due from broker on the statement of assets and liabilities. Pursuant to the contract, the Strategy agrees to receive from or pay to the broker an amount of cash equal to the daily fluctuation in the value of the contract. Such receipts or payments are known as variation margin and are recorded by the Strategy as unrealized gains or losses. Risks may arise from the potential inability of a counterparty to meet the terms of the contract. The credit/counterparty risk for exchange-traded futures is generally less than privately negotiated futures, since the clearinghouse, which is the issuer or counterparty to each exchange-traded future, has robust risk mitigation standards, including the requirement to provide initial and variation margin. When the contract is closed, the Strategy records a realized gain or loss equal to the difference between the value of the contract at the time it was opened and the time it was closed.
Use of long futures subjects the Strategy to risk of loss in excess of the amounts shown on the statement of assets and liabilities, up to the notional value of the futures. Use of short futures subjects the Strategy to unlimited risk of loss. Under some circumstances, futures exchanges may establish daily limits on the amount that the price of futures can vary from the previous day’s settlement price, which could effectively prevent liquidation of unfavorable positions.
During the year ended October 31, 2014, the Strategy held futures for hedging and non-hedging purposes.
| • | Forward Currency Exchange Contracts |
The Strategy may enter into forward currency exchange contracts in order to hedge its exposure to changes in foreign currency exchange rates on its foreign portfolio holdings, to hedge certain firm purchase and sale commitments denominated in foreign currencies and for non-hedging purposes as a means of making direct investments in foreign currencies, as described below under “Currency Transactions”.
A forward currency exchange contract is a commitment to purchase or sell a foreign currency at a future date at a negotiated forward rate. The gain or loss arising from the difference between the original contract and the closing of such contract would be included in net realized gain or loss on foreign currency transactions. Fluctuations in the value of open forward currency exchange contracts are recorded for financial reporting purposes as unrealized appreciation and/or depreciation by the Strategy. Risks may
| ALLIANCEBERNSTEIN BOND INFLATION STRATEGY • | 51 |
Notes to Financial Statements
arise from the potential inability of a counterparty to meet the terms of a contract and from unanticipated movements in the value of a foreign currency relative to the U.S. dollar.
During the year ended October 31, 2014, the Strategy held forward currency exchange contracts for hedging and non-hedging purposes.
| • | Swaps |
The Strategy may enter into swaps to hedge its exposure to interest rates, credit risk, or currencies. The Strategy may also enter into swaps for non-hedging purposes as a means of gaining market exposures, including by making direct investments in foreign currencies, as described below under “Currency Transactions” or in order to take a “long” or “short” position with respect to an underlying referenced asset described below under “Total Return Swaps”. A swap is an agreement that obligates two parties to exchange a series of cash flows at specified intervals based upon or calculated by reference to changes in specified prices or rates for a specified amount of an underlying asset. The payment flows are usually netted against each other, with the difference being paid by one party to the other. In addition, collateral may be pledged or received by the Strategy in accordance with the terms of the respective swaps to provide value and recourse to the Strategy or its counterparties in the event of default, bankruptcy or insolvency by one of the parties to the swap.
Risks may arise as a result of the failure of the counterparty to the swap to comply with the terms of the swap. The loss incurred by the failure of a counterparty is generally limited to the net interim payment to be received by the Strategy, and/or the termination value at the end of the contract. Therefore, the Strategy considers the creditworthiness of each counterparty to a swap in evaluating potential counterparty risk. This risk is mitigated by having a netting arrangement between the Strategy and the counterparty and by the posting of collateral by the counterparty to the Strategy to cover the Strategy’s exposure to the counterparty. Additionally, risks may arise from unanticipated movements in interest rates or in the value of the underlying securities. The Strategy accrues for the interim payments on swaps on a daily basis, with the net amount recorded within unrealized appreciation/depreciation of swaps on the statement of assets and liabilities, where applicable. Once the interim payments are settled in cash, the net amount is recorded as realized gain/(loss) on swaps on the statement of operations, in addition to any realized gain/(loss) recorded upon the termination of swaps. Upfront premiums paid or received are recognized as cost or proceeds on the statement of assets and liabilities and are amortized on a straight line basis over the life of the contract. Amortized upfront premiums are included in net realized gain/(loss) from swaps on the statement of operations. Fluctuations in the value of swaps are recorded as a component of net change in unrealized appreciation/depreciation of swaps on the statement of operations.
| 52 | • ALLIANCEBERNSTEIN BOND INFLATION STRATEGY |
Notes to Financial Statements
Certain standardized swaps, including certain interest rate swaps and credit default swaps, are (or soon will be) subject to mandatory central clearing. Cleared swaps are transacted through futures commission merchants (“FCMs”) that are members of central clearinghouses, with the clearinghouse serving as central counterparty, similar to transactions in futures contracts. Centralized clearing will be required for additional categories of swaps on a phased-in basis based on requirements published by the Securities and Exchange Commission and Commodity Futures Trading Commission.
At the time the Strategy enters into a centrally cleared swap, the Strategy deposits and maintains as collateral an initial margin with the broker, as required by the exchange on which the transaction is effected. Such amount is shown as due from broker on the statement of assets and liabilities. Pursuant to the contract, the Strategy agrees to receive from or pay to the broker an amount of cash equal to the daily fluctuation in the value of the contract. Such receipts or payments are known as variation margin and are recorded by the Strategy as unrealized gains or losses. Risks may arise from the potential of a counterparty to meet the terms of the contract. The credit/counterparty risk for swaps cleared through a central clearing house’s exchange is generally less than privately negotiated swaps, since the clearinghouse, which is the issuer or counterparty to each exchange-traded swap, has robust risk mitigation standards, including the requirement to provide initial and variation margin. When the contract is closed, the Strategy records a realized gain or loss equal to the difference between the value of the contract at the time it was opened and the time it was closed.
Interest Rate Swaps:
The Strategy is subject to interest rate risk exposure in the normal course of pursuing its investment objectives. Because the Strategy holds fixed rate bonds, the value of these bonds may decrease if interest rates rise. To help hedge against this risk and to maintain its ability to generate income at prevailing market rates, the Strategy may enter into interest rate swaps. Interest rate swaps are agreements between two parties to exchange cash flows based on a notional amount. The Strategy may elect to pay a fixed rate and receive a floating rate, or, receive a fixed rate and pay a floating rate on a notional amount.
In addition, the Strategy may also enter into interest rate swap transactions to preserve a return or spread on a particular investment or portion of its portfolio, or protecting against an increase in the price of securities the Strategy anticipates purchasing at a later date. Interest rate swaps involve the exchange by a Strategy with another party of their respective commitments to pay or receive interest (e.g., an exchange of floating rate payments for fixed rate payments) computed based on a contractually-based principal (or “notional”) amount. Interest rate swaps are entered
| ALLIANCEBERNSTEIN BOND INFLATION STRATEGY • | 53 |
Notes to Financial Statements
into on a net basis (i.e., the two payment streams are netted out, with the Strategy receiving or paying, as the case may be, only the net amount of the two payments).
During the year ended October 31, 2014, the Strategy held interest rate swaps for hedging and non-hedging purposes.
Inflation (CPI) Swaps:
Inflation swaps are contracts in which one party agrees to pay the cumulative percentage increase in a price index (the Consumer Price Index with respect to CPI swaps) over the term of the swap (with some lag on the inflation index), and the other pays a compounded fixed rate. Inflation swaps may be used to protect the net asset value, or NAV, of a Strategy against an unexpected change in the rate of inflation measured by an inflation index since the value of these agreements is expected to increase if unexpected inflation increases.
During the year ended October 31, 2014, the Strategy held inflation (CPI) swaps for hedging and non-hedging purposes.
Credit Default Swaps:
The Strategy may enter into credit default swaps, including to manage its exposure to the market or certain sectors of the market, to reduce its risk exposure to defaults by corporate and sovereign issuers held by the Strategy, or to create exposure to corporate or sovereign issuers to which it is not otherwise exposed. The Strategy may purchase credit protection (“Buy Contract”) or provide credit protection (“Sale Contract”) on the referenced obligation of the credit default swap. During the term of the swap, the Strategy receives/(pays) fixed payments from/(to) the respective counterparty, calculated at the agreed upon rate applied to the notional amount. If the Strategy is a buyer/(seller) of protection and a credit event occurs, as defined under the terms of the swap, the Strategy will either (i) receive from the seller/(pay to the buyer) of protection an amount equal to the notional amount of the swap (the “Maximum Payout Amount”) and deliver/(take delivery of) the referenced obligation or (ii) receive/(pay) a net settlement amount in the form of cash or securities equal to the notional amount of the swap less the recovery value of the referenced obligation.
In certain circumstances Maximum Payout Amounts may be partially offset by recovery values of the respective referenced obligations, upfront premium received upon entering into the agreement, or net amounts received from settlement of buy protection credit default swaps entered into by the Portfolio for the same reference obligation with the same counterparty. As of September 30, 2014, the Portfolio did not have Buy Contracts outstanding with respect to the same referenced obligation and same counterparty for its Sales Contracts outstanding
| 54 | • ALLIANCEBERNSTEIN BOND INFLATION STRATEGY |
Notes to Financial Statements
Credit default swaps may involve greater risks than if a Strategy had invested in the referenced obligation directly. Credit default swaps are subject to general market risk, liquidity risk, counterparty risk and credit risk. If the Strategy is a buyer of protection and no credit event occurs, it will lose the payments it made to its counterparty. If the Strategy is a seller of protection and a credit event occurs, the value of the referenced obligation received by the Strategy coupled with the periodic payments previously received, may be less than the Maximum Payout Amount it pays to the buyer, resulting in a net loss to the Strategy.
During the year ended October 31, 2014, the Strategy held credit default swaps for hedging and non-hedging purposes.
Implied credit spreads over U.S. Treasuries of comparable maturity utilized in determining the market value of credit default swaps on issuers as of period end are disclosed in the portfolio of investments. The implied spreads serve as an indicator of the current status of the payment/performance risk and typically reflect the likelihood of default by the issuer of the referenced obligation. The implied credit spread of a particular reference obligation also reflects the cost of buying/selling protection and may reflect upfront payments required to be made to enter into the agreement. Widening credit spreads typically represent a deterioration of the referenced obligation’s credit soundness and greater likelihood of default or other credit event occurring as defined under the terms of the agreement. A credit spread identified as “Defaulted” indicates a credit event has occurred for the referenced obligation.
The Strategy typically enters into International Swaps and Derivatives Association, Inc. Master Agreements (“ISDA Master Agreement”) or similar master agreements (collectively, “Master Agreements”) with its OTC derivative contract counterparties in order to, among other things, reduce its credit risk to counterparties. ISDA Master Agreements include provisions for general obligations, representations, collateral and events of default or termination. Under an ISDA Master Agreement, the Strategy typically may offset with the counterparty certain derivative financial instrument’s payables and/or receivables with collateral held and/or posted and create one single net payment (close-out netting) in the event of default or termination.
Various Master Agreements govern the terms of certain transactions with counterparties, including transactions such as exchange-traded derivative transactions, repurchase and reverse repurchase agreements. These Master Agreements typically attempt to reduce the counterparty risk associated with such transactions by specifying credit protection mechanisms and providing standardization that improves legal certainty. Cross-termination provisions under Master Agreements typically provide that a default in connection with one transaction between the Strategy and a counterparty gives the non-defaulting party the right to terminate
| ALLIANCEBERNSTEIN BOND INFLATION STRATEGY • | 55 |
Notes to Financial Statements
any other transactions in place with the defaulting party to create one single net payment due to/due from the defaulting party. In the event of a default by a Master Agreements counterparty, the return of collateral with market value in excess of the Strategy’s net liability, held by the defaulting party, may be delayed or denied.
The Strategy’s Master Agreements may contain provisions for early termination of OTC derivative transactions in the event the net assets of the Strategy decline below specific levels (“net asset contingent features”). If these levels are triggered, the Strategy’s counterparty has the right to terminate such transaction and require the Strategy to pay or receive a settlement amount in connection with the terminated transaction. For additional details, please refer to netting arrangements by counterparty tables below.
At October 31, 2014, the Strategy had entered into the following derivatives:
Asset Derivatives | Liability Derivatives | |||||||||||
Derivative Type | Statement of | Fair Value | Statement of | Fair Value | ||||||||
Interest rate contracts | Receivable/Payable for variation margin on exchange-traded derivatives | $ | 362,735 | * | Receivable/Payable for variation margin on exchange-traded derivatives | $ | 1,253,662 | * | ||||
Credit contracts | Receivable/Payable for variation margin on exchange-traded derivatives | 271,246 | * | |||||||||
Foreign exchange contracts | Unrealized appreciation on forward currency exchange contracts | | 160,105 | | Unrealized depreciation on forward currency exchange contracts | | 26,139 | | ||||
Interest rate contracts | Unrealized appreciation on interest rate swaps | | 76,298 | | ||||||||
Interest rate contracts | Unrealized depreciation on inflation swaps | | 873,645 | | ||||||||
Credit contracts | Unrealized appreciation on credit default swaps | 97,026 | ||||||||||
|
|
|
| |||||||||
Total | $ | 696,164 | $ | 2,424,692 | ||||||||
|
|
|
| |||||||||
| * | Only variation margin receivable/payable at period end is reported within the statement of assets and liabilities. This amount reflects cumulative appreciation/(depreciation) as reported in the portfolio of investments. |
| 56 | • ALLIANCEBERNSTEIN BOND INFLATION STRATEGY |
Notes to Financial Statements
The effect of derivative instruments on the statement of operations for the year ended October 31, 2014:
Derivative Type | Location of Gain | Realized Gain or (Loss) on Derivatives | Change in Unrealized Appreciation or (Depreciation) | |||||||
Interest rate contracts | Net realized gain (loss) on futures; Net change in unrealized appreciation/depreciation of futures | $ | (1,028,131 | ) | $ | (138,881 | ) | |||
Foreign exchange contracts | Net realized gain (loss) on foreign currency transactions; Net change in unrealized appreciation/depreciation of foreign currency denominated assets and liabilities | (93,504 | ) | 162,341 | ||||||
Interest rate contracts | Net realized gain (loss) on swaps; Net change in unrealized appreciation/depreciation of swaps | (265,360 | ) | (1,025,275 | ) | |||||
Credit contracts | Net realized gain (loss) on swaps; Net change in unrealized appreciation/depreciation of swaps | (261,211 | ) | (74,206 | ) | |||||
|
|
|
| |||||||
Total | $ | (1,648,206 | ) | $ | (1,076,021 | ) | ||||
|
|
|
| |||||||
The following table represents the volume of the Strategy’s derivative transactions during the year ended October 31, 2014:
Futures: | ||||
Average original value of buy contracts | $ | 22,773,117 | ||
Average original value of sale contracts | $ | 27,357,894 | ||
Forward Currency Exchange Contracts: | ||||
Average principal amount of buy contracts | $ | 9,525,964 | ||
Average principal amount of sale contracts | $ | 20,310,560 | ||
Interest Rate Swaps: | ||||
Average notional amount | $ | 6,622,308 | ||
Inflation Swaps: | ||||
Average notional amount | $ | 75,115,385 | ||
Centrally Cleared Interest Rate Swaps: | ||||
Average notional amount | $ | 31,264,549 | (a) | |
Credit Default Swaps: | ||||
Average notional amount of sale contracts | $ | 4,079,870 | ||
Centrally Cleared Credit Default Swaps: | ||||
Average notional amount of buy contracts | $ | 6,948,831 | ||
| (a) | Positions were open for eleven months during the year. |
| ALLIANCEBERNSTEIN BOND INFLATION STRATEGY • | 57 |
Notes to Financial Statements
For financial reporting purposes, the Strategy does not offset derivative assets and derivative liabilities that are subject to netting arrangements in the statement of assets and liabilities.
All derivatives held at period end were subject to netting arrangements. The following table presents the Strategy’s derivative assets and liabilities by counterparty net of amounts available for offset under Master Agreements (“MA”) and net of the related collateral received/ pledged by the Strategy as of October 31, 2014:
| Counterparty | Derivative Assets Subject to a MA | Derivative Available for Offset | Cash Collateral Received* | Security Collateral Received* | Net Amount of Derivatives | |||||||||||||||
Exchange-Traded Derivatives: | ||||||||||||||||||||
Goldman Sachs & Co.** | $ | 60,445 | $ | – 0 | – | $ | – 0 | – | $ | – 0 | – | $ | 60,445 | |||||||
Morgan Stanley & Co., LLC** | 23,706 | – 0 | – | – 0 | – | – 0 | – | 23,706 | ||||||||||||
|
|
|
|
|
|
|
|
|
| |||||||||||
Total | $ | 84,151 | $ | – 0 | – | $ | – 0 | – | $ | – 0 | – | $ | 84,151 | |||||||
|
|
|
|
|
|
|
|
|
| |||||||||||
OTC Derivatives: | ||||||||||||||||||||
Bank of America, NA | $ | 68,659 | $ | – 0 | – | $ | – 0 | – | $ | – 0 | – | $ | 68,659 | |||||||
Barclays Bank PLC | 1,372 | (1,372 | ) | – 0 | – | – 0 | – | – 0 | – | |||||||||||
Credit Suisse International | 1,079 | – 0 | – | – 0 | – | – 0 | – | 1,079 | ||||||||||||
Deutsche Bank AG | 7,980 | – 0 | – | – 0 | – | – 0 | – | 7,980 | ||||||||||||
Goldman Sachs Bank USA | 67,452 | – 0 | – | – 0 | – | – 0 | – | 67,452 | ||||||||||||
JPMorgan Chase Bank, NA | 27,895 | – 0 | – | – 0 | – | – 0 | – | 27,895 | ||||||||||||
Morgan Stanley Capital Services LLC | 74,926 | (74,926 | ) | – 0 | – | – 0 | – | – 0 | – | |||||||||||
Royal Bank of Scotland PLC | 63,967 | – 0 | – | – 0 | – | – 0 | – | 63,967 | ||||||||||||
|
|
|
|
|
|
|
|
|
| |||||||||||
Total | $ | 313,330 | $ | (76,298 | ) | $ | – 0 | – | $ | – 0 | – | $ | 237,032 | ^ | ||||||
|
|
|
|
|
|
|
|
|
| |||||||||||
| Counterparty | Derivative Liabilities | Derivative Available for Offset | Cash Collateral Pledged* | Security Collateral Pledged* | Net Amount of Derivatives Liabilities | |||||||||||||||
Exchange-Traded Derivatives: | ||||||||||||||||||||
Citigroup Global Markets, Inc.** | $ | 567 | $ | – 0 | – | $ | (567 | ) | $ | – 0 | – | $ | – 0 – | |||||||
|
|
|
|
|
|
|
|
|
| |||||||||||
Total | $ | 567 | $ | – 0 | – | $ | (567 | ) | $ | – 0 | – | $ | – 0 – | |||||||
|
|
|
|
|
|
|
|
|
| |||||||||||
OTC Derivatives: | ||||||||||||||||||||
Barclays Bank PLC | $ | 416,216 | $ | (1,372 | ) | $ | – 0 | – | $ | – 0 | – | $ | 414,844 | |||||||
Citibank, NA | 97,111 | – 0 | – | – 0 | – | – 0 | – | 97,111 | ||||||||||||
Morgan Stanley Capital Services LLC | 360,318 | (74,926 | ) | – 0 | – | – 0 | – | 285,392 | ||||||||||||
State Street Bank & Trust Co. | 26,139 | – 0 | – | – 0 | – | – 0 | – | 26,139 | ||||||||||||
|
|
|
|
|
|
|
|
|
| |||||||||||
Total | $ | 899,784 | $ | (76,298 | ) | $ | – 0 | – | $ | – 0 | – | $ | 823,486 | ^ | ||||||
|
|
|
|
|
|
|
|
|
| |||||||||||
| * | The actual collateral received/pledged may be more than the amount reported due to overcollateralization. |
| ** | Cash has been posted for initial margin requirements for exchange traded derivatives outstanding at October 31, 2014. |
| ^ | Net amount represents the net receivable/payable that would be due from/to the counterparty in the event of default or termination. The net amount from OTC financial derivative instruments can only be netted across transactions governed under the same master agreement with the same counterparty. |
| 58 | • ALLIANCEBERNSTEIN BOND INFLATION STRATEGY |
Notes to Financial Statements
2. Currency Transactions
The Strategy may invest in non-U.S. dollar securities on a currency hedged or unhedged basis. The Strategy may seek investment opportunities by taking long or short positions in currencies through the use of currency-related derivatives, including forward currency exchange contracts, futures and options on futures, swaps, and other options. The Strategy may enter into transactions for investment opportunities when it anticipates that a foreign currency will appreciate or depreciate in value but securities denominated in that currency are not held by the Strategy and do not present attractive investment opportunities. Such transactions may also be used when the Adviser believes that it may be more efficient than a direct investment in a foreign currency-denominated security. The Strategy may also conduct currency exchange contracts on a spot basis (i.e., for cash at the spot rate prevailing in the currency exchange market for buying or selling currencies).
3. Dollar Rolls
The Strategy may enter into dollar rolls. Dollar rolls involve sales by the Strategy of securities for delivery in the current month and the Strategy’s simultaneously contracting to repurchase substantially similar (same type and coupon) securities on a specified future date. During the roll period, the Strategy forgoes principal and interest paid on the securities. The Strategy is compensated by the difference between the current sales price and the lower forward price for the future purchase (often referred to as the “drop”) as well as by the interest earned on the cash proceeds of the initial sale. Dollar rolls involve the risk that the market value of the securities the Strategy is obligated to repurchase under the agreement may decline below the repurchase price. Dollar rolls are speculative techniques and may be considered to be borrowings by the Strategy. For the year ended October 31, 2014, the Strategy had no transactions in dollar rolls.
4. Reverse Repurchase Agreements
The Strategy may enter into reverse repurchase transactions (“RVP”) in accordance with the terms of a Master Repurchase Agreement (“MRA”), under which the Strategy sells securities and agrees to repurchase them at a mutually agreed upon date and price. At the time the Strategy enters into a reverse repurchase agreement, it will establish a segregated account with the custodian containing liquid assets having a value comparable to the repurchase price. Under the MRA and other Master Agreements, the Strategy is permitted to offset payables and/or receivables with collateral held and/or posted to the counterparty and create one single net payment due to or from the Strategy in the event of a default. In the event of a default by a MRA counterparty, the Strategy may be considered an unsecured creditor with respect to any excess collateral (collateral with a market value in excess of the repurchase price) held by and/or posted to the counterparty, and as such the return of such excess collateral may be delayed or denied. For the year ended October 31, 2014, the average amount of reverse repurchase agreements outstanding was $84,120,889
| ALLIANCEBERNSTEIN BOND INFLATION STRATEGY • | 59 |
Notes to Financial Statements
and the daily weighted average interest rate was 0.10%. At October 31, 2014, the Strategy had reverse repurchase agreements outstanding in the amount of $85,383,087 as reported on the statement of assets and liabilities.
The following table presents the Strategy’s RVP liabilities by counterparty net of the related collateral pledged by the Strategy as of October 31, 2014:
Counterparty | RVP Asset Subject to a MRA | Securities Collateral Received†* | Net Amount of RVP Assets | |||||||||
Bank of America | 20,010,396 | (20,010,396 | ) | – 0 | – | |||||||
Barclays Capital, Inc. | 7,987,606 | (7,941,361 | ) | 46,245 | ||||||||
HSBC | 49,211,187 | (49,005,310 | ) | 205,877 | ||||||||
JPMorgan Chase | 8,173,898 | (8,173,898 | ) | – 0 | – | |||||||
|
|
|
|
|
| |||||||
Total | $ | 85,383,087 | $ | (85,130,965 | ) | $ | 252,122 | |||||
|
|
|
|
|
| |||||||
| † | Including accrued interest. |
| * | The actual collateral pledged may be more than the amount reported due to overcollateralization. |
NOTE E
Capital Stock
Each class consists of 3,000,000,000 authorized shares. Transactions in capital shares for each class were as follows:
| Shares | Amount | |||||||||||||||||||
| Year Ended October 31, 2014 | Year Ended October 31, 2013 | Year Ended October 31, 2014 | Year Ended 2013 | |||||||||||||||||
|
| |||||||||||||||||||
| Class A | ||||||||||||||||||||
Shares sold | 365,636 | 1,263,934 | $ | 3,958,275 | $ | 13,772,700 | ||||||||||||||
| ||||||||||||||||||||
Shares issued in reinvestment of dividends and distributions | 26,770 | 10,010 | 291,538 | 110,149 | ||||||||||||||||
| ||||||||||||||||||||
Shares redeemed | (1,081,920 | ) | (663,623 | ) | (11,685,187 | ) | (7,266,498 | ) | ||||||||||||
| ||||||||||||||||||||
Net increase (decrease) | (689,514 | ) | 610,321 | $ | (7,435,374 | ) | $ | 6,616,351 | ||||||||||||
| ||||||||||||||||||||
| Class C | ||||||||||||||||||||
Shares sold | 18,830 | 144,209 | $ | 201,233 | $ | 1,619,721 | ||||||||||||||
| ||||||||||||||||||||
Shares issued in reinvestment of dividends and distributions | 3,806 | 465 | 41,032 | 5,058 | ||||||||||||||||
| ||||||||||||||||||||
Shares redeemed | (230,439 | ) | (307,462 | ) | (2,459,540 | ) | (3,375,097 | ) | ||||||||||||
| ||||||||||||||||||||
Net decrease | (207,803 | ) | (162,788 | ) | $ | (2,217,275 | ) | $ | (1,750,318 | ) | ||||||||||
| ||||||||||||||||||||
| 60 | • ALLIANCEBERNSTEIN BOND INFLATION STRATEGY |
Notes to Financial Statements
| Shares | Amount | |||||||||||||||||||
| Year Ended October 31, 2014 | Year Ended October 31, 2013 | Year Ended October 31, 2014 | Year Ended 2013 | |||||||||||||||||
|
|
|
|
|
|
|
|
| ||||||||||||
| Advisor Class | ||||||||||||||||||||
Shares sold | 1,013,910 | 1,559,263 | $ | 10,977,539 | $ | 17,509,615 | ||||||||||||||
| ||||||||||||||||||||
Shares issued in reinvestment of dividends and distributions | 15,279 | 4,758 | 166,616 | 52,594 | ||||||||||||||||
| ||||||||||||||||||||
Shares redeemed | (269,728 | ) | (1,310,326 | ) | (2,933,678 | ) | (14,820,089 | ) | ||||||||||||
| ||||||||||||||||||||
Net increase | 759,461 | 253,695 | $ | 8,210,477 | $ | 2,742,120 | ||||||||||||||
| ||||||||||||||||||||
| Class R | ||||||||||||||||||||
Shares sold | 3,557 | 1,376 | $ | 38,616 | $ | 15,343 | ||||||||||||||
| ||||||||||||||||||||
Shares issued in reinvestment of dividends and distributions | 255 | 70 | 2,783 | 773 | ||||||||||||||||
| ||||||||||||||||||||
Shares redeemed | (1,811 | ) | (29,643 | ) | (19,578 | ) | (317,776 | ) | ||||||||||||
| ||||||||||||||||||||
Net increase (decrease) | 2,001 | (28,197 | ) | $ | 21,821 | $ | (301,660 | ) | ||||||||||||
| ||||||||||||||||||||
| Class K | ||||||||||||||||||||
Shares sold | 90,056 | 77,416 | $ | 974,305 | $ | 873,308 | ||||||||||||||
| ||||||||||||||||||||
Shares issued in reinvestment of dividends and distributions | 2,755 | 1,124 | 29,968 | 12,408 | ||||||||||||||||
| ||||||||||||||||||||
Shares redeemed | (70,120 | ) | (72,023 | ) | (753,094 | ) | (802,796 | ) | ||||||||||||
| ||||||||||||||||||||
Net increase | 22,691 | 6,517 | $ | 251,179 | $ | 82,920 | ||||||||||||||
| ||||||||||||||||||||
| Class I | ||||||||||||||||||||
Shares sold | 60,929 | 239,588 | $ | 660,107 | $ | 2,573,309 | ||||||||||||||
| ||||||||||||||||||||
Shares issued in reinvestment of dividends and distributions | 4,646 | 345 | 50,358 | 3,792 | ||||||||||||||||
| ||||||||||||||||||||
Shares redeemed | (231,495 | ) | (19,252 | ) | (2,489,428 | ) | (205,881 | ) | ||||||||||||
| ||||||||||||||||||||
Net increase (decrease) | (165,920 | ) | 220,681 | $ | (1,778,963 | ) | $ | 2,371,220 | ||||||||||||
| ||||||||||||||||||||
| Class 1 | ||||||||||||||||||||
Shares sold | 8,046,926 | 17,308,327 | $ | 86,492,452 | $ | 192,409,592 | ||||||||||||||
| ||||||||||||||||||||
Shares issued in reinvestment of dividends and distributions | 421,004 | 176,130 | 4,555,895 | 1,935,557 | ||||||||||||||||
| ||||||||||||||||||||
Shares redeemed | (10,830,473 | ) | (5,297,506 | ) | (116,610,335 | ) | (58,483,004 | ) | ||||||||||||
| ||||||||||||||||||||
Net increase (decrease) | (2,362,543 | ) | 12,186,951 | $ | (25,561,988 | ) | $ | 135,862,145 | ||||||||||||
| ||||||||||||||||||||
| ALLIANCEBERNSTEIN BOND INFLATION STRATEGY • | 61 |
Notes to Financial Statements
| Shares | Amount | |||||||||||||||||||
| Year Ended October 31, 2014 | Year Ended October 31, 2013 | Year Ended October 31, 2014 | Year Ended 2013 | |||||||||||||||||
|
|
|
|
|
|
|
|
| ||||||||||||
| Class 2 | ||||||||||||||||||||
Shares sold | 1,144,093 | 3,262,457 | $ | 12,184,729 | $ | 36,376,327 | ||||||||||||||
| ||||||||||||||||||||
Shares issued in reinvestment of dividends and distributions | 70,568 | 40,820 | 763,421 | 450,558 | ||||||||||||||||
| ||||||||||||||||||||
Shares redeemed | (1,126,681 | ) | (3,141,138 | ) | (12,084,688 | ) | (34,885,528 | ) | ||||||||||||
| ||||||||||||||||||||
Net increase | 87,980 | 162,139 | $ | 863,462 | $ | 1,941,357 | ||||||||||||||
| ||||||||||||||||||||
NOTE F
Risks Involved in Investing in the Strategy
Interest Rate Risk and Credit Risk—Interest rate risk is the risk that changes in interest rates will affect the value of the Strategy’s investments in fixed-income debt securities such as bonds or notes. Increases in interest rates may cause the value of the Strategy’s investments to decline. Credit risk is the risk that the issuer or guarantor of a debt security, or the counterparty to a derivative contract, will be unable or unwilling to make timely principal and/or interest payments, or to otherwise honor its obligations. The degree of risk for a particular security may be reflected in its credit rating. Credit risk is greater for medium quality and lower-rated securities. Lower-rated debt securities and similar unrated securities (commonly known as “junk bonds”) have speculative elements or are predominantly speculative risks.
Duration Risk—Duration is the measure that relates the expected price volatility of a fixed-income security to changes in interest rates. The duration of a fixed-income security may be shorter than or equal to full maturity of a fixed-income security. Fixed-income securities with longer durations have more risk and will decrease in price as interest rates rise. For example, a fixed-income security with a duration of three years will decrease in value by approximately 3% if interest rates increase by 1%.
Liquidity Risk—Liquidity risk exists when particular investments are difficult to purchase or sell, possibly preventing the Strategy from selling out of these illiquid or relatively less liquid securities at an advantageous price. Causes of liquidity risk may include low trading volume, lack of a market maker, a large position, heavy redemptions, or legal restrictions that limit or prevent a Strategy from selling securities or closing derivative positions at desirable prices or opportune times. Over recent years, the capacity of dealers to make markets in fixed income securities has been outpaced by the growth in the size of the fixed income markets. Liquidity risk may be magnified in a rising interest rate environment, where the value and liquidity of fixed income securities generally go down. Derivatives and securities involving substantial market and credit risk tend to involve greater liquidity risk. To the extent a Strategy invests in
| 62 | • ALLIANCEBERNSTEIN BOND INFLATION STRATEGY |
Notes to Financial Statements
municipal securities, the Strategy is subject to more liquidity risk because the market for municipal securities is generally smaller than many other markets. Illiquid securities and relatively less liquid securities may also be difficult to value.
Redemption Risk—A Strategy may experience heavy redemptions that could cause the Strategy to liquidate its assets at inopportune times or at a loss or depressed value, which could cause the value of your investment to decline.
Foreign Securities Risk—Investing in securities of foreign companies or foreign governments involves special risks which include changes in foreign currency exchange rates and the possibility of future political and economic developments which could adversely affect the value of such securities. Moreover, securities of many foreign companies or foreign governments and their markets may be less liquid and their prices more volatile than those of comparable U.S. companies or of the U.S. government.
Inflation Risk—This is the risk that the value of assets or income from investments will be less in the future as inflation decreases the value of money. As inflation increases, the real value of the Strategy’s assets can decline as can the real value of the Strategy’s distributions.
Currency Risk—This is the risk that changes in foreign currency exchange rates may negatively affect the value of the Strategy’s investments or reduce the returns of the Strategy. For example, the value of the Strategy’s investments in foreign currency-denominated securities or currencies may decrease if the U.S. dollar is strong (i.e., gaining value relative to other currencies) and other currencies are weak (i.e., losing value relative to the U.S. dollar). Currency markets are generally not as regulated as securities markets. Independent of the Strategy’s investments denominated in foreign currencies, the Strategy’s positions in various foreign currencies may cause the Strategy to experience investment losses due to the changes in exchange rates and interest rates.
Derivatives Risk—The Strategy may enter into derivative transactions such as forwards, options, futures and swaps. Derivatives may be illiquid, difficult to price, and leveraged so that small changes may produce disproportionate losses for the Strategy, and subject to counterparty risk to a greater degree than more traditional investments. Derivatives may result in significant losses, including losses that are far greater than the value of the derivatives reflected in the statement of assets and liabilities.
Leverage Risk—When the Strategy borrows money or otherwise leverages its portfolio, it may be volatile because leverage tends to exaggerate the effect of any increase or decrease in the value of the Strategy’s investments. The Strategy may create leverage through the use of reverse repurchase arrangements, forward currency exchange contracts, forward commitments, dollar rolls or
| ALLIANCEBERNSTEIN BOND INFLATION STRATEGY • | 63 |
Notes to Financial Statements
futures contracts or by borrowing money. The use of derivative instruments by the Strategy, such as forwards, futures, options and swaps, may also result in a form of leverage. Leverage may result in higher returns to the Strategy than if the Strategy were not leveraged, but may also adversely affect returns, particularly if the market is declining.
Indemnification Risk—In the ordinary course of business, the Strategy enters into contracts that contain a variety of indemnifications. The Strategy’s maximum exposure under these arrangements is unknown. However, the Strategy has not had prior claims or losses pursuant to these indemnification provisions and expects the risk of loss thereunder to be remote. Therefore, the Strategy has not accrued any liability in connection with these indemnification provisions.
NOTE G
Joint Credit Facility
A number of open-end mutual funds managed by the Adviser, including the Strategy, participate in a $280 million revolving credit facility (the “Facility”) intended to provide short-term financing, if necessary, subject to certain restrictions in connection with abnormal redemption activity. Commitment fees related to the Facility are paid by the participating funds and are included in miscellaneous expenses in the statement of operations. The Strategy did not utilize the Facility during the year ended October 31, 2014.
NOTE H
Distributions to Shareholders
The tax character of distributions paid during the fiscal years ended October 31, 2014 and October 31, 2013 were as follows:
| 2014 | 2013 | |||||||
Distributions paid from: | ||||||||
Ordinary income | $ | 7,646,805 | $ | 3,294,124 | ||||
Net long-term capital gains | – 0 | – | 38,486 | |||||
|
|
|
| |||||
Total taxable distributions paid | $ | 7,646,805 | $ | 3,332,610 | ||||
|
|
|
| |||||
As of October 31, 2014, the components of accumulated earnings/(deficit) on a tax basis were as follows:
Undistributed ordinary income | $ | 1,687,001 | ||
Accumulated capital and other losses | (6,167,139 | )(a) | ||
Unrealized appreciation/(depreciation) | (2,769,625 | )(b) | ||
|
| |||
Total accumulated earnings/(deficit) | $ | (7,249,763 | ) | |
|
|
| (a) | At October 31, 2014, the Strategy had a net capital loss carryforward of $6,152,515. As of October 31, 2014, the Strategy had cumulative deferred straddle losses of $14,624. |
| (b) | The differences between book-basis and tax-basis unrealized appreciation/(depreciation) are attributable primarily to the tax deferral of losses on wash sales, the tax treatment of swaps, the realization for tax purposes of gains/losses on certain derivative instruments, and the tax treatment of Treasury inflation-protected securities. |
| 64 | • ALLIANCEBERNSTEIN BOND INFLATION STRATEGY |
Notes to Financial Statements
For tax purposes, net capital losses may be carried over to offset future capital gains, if any. Funds are permitted to carry forward capital losses incurred in taxable years beginning after December 22, 2010 for an indefinite period, and such losses will retain their character as either short-term or long-term capital losses. As of October 31, 2014, the Strategy had a net short-term capital loss carryforward of $1,816,311 and a net long-term capital loss carryforward of $4,336,204 which may be carried forward for an indefinite period.
During the current fiscal year, permanent differences primarily due to foreign currency reclassifications, the tax treatment of swaps and clearing fees, reclassifications of paydown gains/losses, and the tax treatment of Treasury inflation-protected securities resulted in a net increase in undistributed net investment income and a net increase in accumulated net realized loss on investment and foreign currency transactions. These reclassifications had no effect on net assets.
NOTE I
Subsequent Events
Management has evaluated subsequent events for possible recognition or disclosure in the financial statements through the date the financial statements are issued. Management has determined that there are no material events that would require disclosure in the Strategy’s financial statements through this date.
| ALLIANCEBERNSTEIN BOND INFLATION STRATEGY • | 65 |
Notes to Financial Statements
FINANCIAL HIGHLIGHTS
Selected Data For A Share Of Capital Stock Outstanding Throughout Each Period
| Class A | ||||||||||||||||||||
| Year Ended October 31, | January 26, 2010 | |||||||||||||||||||
| 2014 | 2013 | 2012 | 2011 | |||||||||||||||||
|
| |||||||||||||||||||
Net asset value, beginning of period | $ 10.81 | $ 11.36 | $ 10.81 | $ 10.53 | $ 10.00 | |||||||||||||||
|
| |||||||||||||||||||
Income From Investment Operations | ||||||||||||||||||||
Net investment income(b)(c) | .17 | .09 | .13 | .38 | .14 | |||||||||||||||
Net realized and unrealized gain (loss) on investment and foreign currency transactions | (.04 | ) | (.57 | ) | .56 | .21 | .47 | |||||||||||||
|
| |||||||||||||||||||
Net increase (decrease) in net asset value from operations | .13 | (.48 | ) | .69 | .59 | .61 | ||||||||||||||
|
| |||||||||||||||||||
Less: Dividends and Distributions | ||||||||||||||||||||
Dividends from net investment income | (.17 | ) | (.07 | ) | (.14 | ) | (.31 | ) | (.08 | ) | ||||||||||
Distributions from net realized gain on investment transactions | – 0 | – | (.00 | )(d) | – 0 | – | – 0 | – | – 0 | – | ||||||||||
Tax return of capital | – 0 | – | – 0 | – | – 0 | – | – 0 | – | (.00 | )(d) | ||||||||||
|
| |||||||||||||||||||
Total dividends and distributions | (.17 | ) | (.07 | ) | (.14 | ) | (.31 | ) | (.08 | ) | ||||||||||
|
| |||||||||||||||||||
Net asset value, end of period | $ 10.77 | $ 10.81 | $ 11.36 | $ 10.81 | $ 10.53 | |||||||||||||||
|
| |||||||||||||||||||
Total Return | ||||||||||||||||||||
Total investment return based on net asset value(e) | 1.16 | % | (4.23 | )% | 6.41 | % | 5.75 | % | 6.15 | % | ||||||||||
Ratios/Supplemental Data | ||||||||||||||||||||
Net assets, end of period | $15,860 | $23,358 | $17,627 | $9,732 | $2,000 | |||||||||||||||
Ratio to average net assets of: | ||||||||||||||||||||
Expenses, net of waivers/reimbursements(f) | .81 | % | .80 | % | .81 | % | .78 | % | .80 | %^+ | ||||||||||
Expenses, before waivers/reimbursements(f) | 1.15 | % | 1.18 | % | 1.25 | % | 1.87 | % | 4.63 | %^+ | ||||||||||
Net investment income(c) | 1.57 | % | .80 | % | 1.20 | % | 3.59 | % | 1.76 | %^+ | ||||||||||
Portfolio turnover rate** | 77 | % | 93 | % | 32 | % | 38 | % | 34 | % | ||||||||||
See footnote summary on page 74.
| 66 | • ALLIANCEBERNSTEIN BOND INFLATION STRATEGY |
Financial Highlights
Selected Data For A Share Of Capital Stock Outstanding Throughout Each Period
| Class C | ||||||||||||||||||||
| Year Ended October 31, | January 26, 2010(a) to October 31, | |||||||||||||||||||
| 2014 | 2013 | 2012 | 2011 | 2010 | ||||||||||||||||
|
| |||||||||||||||||||
Net asset value, beginning of period | $ 10.71 | $ 11.28 | $ 10.78 | $ 10.50 | $ 10.00 | |||||||||||||||
|
| |||||||||||||||||||
Income From Investment Operations | ||||||||||||||||||||
Net investment income(b)(c) | .07 | .00 | (d) | .04 | .30 | .08 | ||||||||||||||
Net realized and unrealized gain (loss) on investment and foreign currency transactions | (.01 | ) | (.56 | ) | .56 | .22 | .48 | |||||||||||||
|
| |||||||||||||||||||
Net increase (decrease) in net asset value from operations | .06 | (.56 | ) | .60 | .52 | .56 | ||||||||||||||
|
| |||||||||||||||||||
Less: Dividends and Distributions | ||||||||||||||||||||
Dividends from net investment income | (.13 | ) | (.01 | ) | (.10 | ) | (.24 | ) | (.06 | ) | ||||||||||
Distributions from net realized gain on investment transactions | – 0 | – | (.00 | )(d) | – 0 | – | – 0 | – | – 0 | – | ||||||||||
Tax return of capital | – 0 | – | – 0 | – | – 0 | – | – 0 | – | (.00 | )(d) | ||||||||||
|
| |||||||||||||||||||
Total dividends and distributions | (.13 | ) | (.01 | ) | (.10 | ) | (.24 | ) | (.06 | ) | ||||||||||
|
| |||||||||||||||||||
Net asset value, end of period | $ 10.64 | $ 10.71 | $ 11.28 | $ 10.78 | $ 10.50 | |||||||||||||||
|
| |||||||||||||||||||
Total Return | ||||||||||||||||||||
Total investment return based on net asset value(e) | .50 | % | (4.98 | )% | 5.61 | % | 5.03 | % | 5.61 | % | ||||||||||
Ratios/Supplemental Data | ||||||||||||||||||||
Net assets, end of period | $3,596 | $5,845 | $7,991 | $6,782 | $3,378 | |||||||||||||||
Ratio to average net assets of: | ||||||||||||||||||||
Expenses, net of waivers/reimbursements(f) | 1.51 | % | 1.51 | % | 1.51 | % | 1.49 | % | 1.50 | %^+ | ||||||||||
Expenses, before waivers/reimbursements(f) | 1.86 | % | 1.86 | % | 1.96 | % | 2.84 | % | 4.80 | %^+ | ||||||||||
Net investment income(c) | .70 | % | .01 | % | .39 | % | 2.82 | % | 1.12 | %^+ | ||||||||||
Portfolio turnover rate** | 77 | % | 93 | % | 32 | % | 38 | % | 34 | % | ||||||||||
See footnote summary on page 74.
| ALLIANCEBERNSTEIN BOND INFLATION STRATEGY • | 67 |
Financial Highlights
Selected Data For A Share Of Capital Stock Outstanding Throughout Each Period
| Advisor Class | ||||||||||||||||||||
| Year Ended October 31, | January 26, 2010(a) to October 31, | |||||||||||||||||||
| 2014 | 2013 | 2012 | 2011 | 2010 | ||||||||||||||||
|
| |||||||||||||||||||
Net asset value, beginning of period | $ 10.82 | $ 11.39 | $ 10.83 | $ 10.55 | $ 10.00 | |||||||||||||||
|
| |||||||||||||||||||
Income From Investment Operations | ||||||||||||||||||||
Net investment income(b)(c) | .19 | .06 | .16 | .39 | .17 | |||||||||||||||
Net realized and unrealized gain (loss) on investment and foreign currency transactions | (.03 | ) | (.52 | ) | .56 | .24 | .47 | |||||||||||||
|
| |||||||||||||||||||
Net increase (decrease) in net asset value from operations | .16 | (.46 | ) | .72 | .63 | .64 | ||||||||||||||
|
| |||||||||||||||||||
Less: Dividends and Distributions | ||||||||||||||||||||
Dividends from net investment income | (.19 | ) | (.11 | ) | (.16 | ) | (.35 | ) | (.09 | ) | ||||||||||
Distributions from net realized gain on investment transactions | – 0 | – | (.00 | )(d) | – 0 | – | – 0 | – | – 0 | – | ||||||||||
Tax return of capital | – 0 | – | – 0 | – | – 0 | – | – 0 | – | (.00 | )(d) | ||||||||||
|
| |||||||||||||||||||
Total dividends and distributions | (.19 | ) | (.11 | ) | (.16 | ) | (.35 | ) | (.09 | ) | ||||||||||
|
| |||||||||||||||||||
Net asset value, end of period | $ 10.79 | $ 10.82 | $ 11.39 | $ 10.83 | $ 10.55 | |||||||||||||||
|
| |||||||||||||||||||
Total Return | ||||||||||||||||||||
Total investment return based on net asset value(e) | 1.50 | % | (4.06 | )% | 6.69 | % | 6.07 | % | 6.46 | % | ||||||||||
Ratios/Supplemental Data | ||||||||||||||||||||
Net assets, end of period | $16,144 | $7,969 | $5,499 | $2,325 | $1,102 | |||||||||||||||
Ratio to average net assets of: | ||||||||||||||||||||
Expenses, net of waivers/reimbursements(f) | .52 | % | .51 | % | .51 | % | .49 | % | .50 | %^+ | ||||||||||
Expenses, before waivers/reimbursements(f) | .86 | % | .87 | % | .95 | % | 1.80 | % | 4.50 | % ^+ | ||||||||||
Net investment income(c) | 1.77 | % | .54 | % | 1.52 | % | 3.70 | % | 2.13 | %^+ | ||||||||||
Portfolio turnover rate** | 77 | % | 93 | % | 32 | % | 38 | % | 34 | % | ||||||||||
See footnote summary on page 74.
| 68 | • ALLIANCEBERNSTEIN BOND INFLATION STRATEGY |
Financial Highlights
Selected Data For A Share Of Capital Stock Outstanding Throughout Each Period
| Class R | ||||||||||||||||||||
| Year Ended October 31, | January 26, 2010(a) to October 31, | |||||||||||||||||||
| 2014 | 2013 | 2012 | 2011 | 2010 | ||||||||||||||||
|
| |||||||||||||||||||
Net asset value, beginning of period | $ 10.81 | $ 11.34 | $ 10.79 | $ 10.50 | $ 10.00 | |||||||||||||||
|
| |||||||||||||||||||
Income From Investment Operations | ||||||||||||||||||||
Net investment income(b)(c) | .14 | .06 | .11 | .43 | .12 | |||||||||||||||
Net realized and unrealized gain (loss) on investment and foreign currency transactions | (.02 | ) | (.57 | ) | .55 | .15 | .48 | |||||||||||||
|
| |||||||||||||||||||
Net increase (decrease) in net asset value from operations | .12 | (.51 | ) | .66 | .58 | .60 | ||||||||||||||
|
| |||||||||||||||||||
Less: Dividends and Distributions | ||||||||||||||||||||
Dividends from net investment income | (.15 | ) | (.02 | ) | (.11 | ) | (.29 | ) | (.09 | ) | ||||||||||
Distributions from net realized gain on investment transactions | – 0 | – | (.00 | )(d) | – 0 | – | – 0 | – | – 0 | – | ||||||||||
Tax return of capital | – 0 | – | – 0 | – | – 0 | – | – 0 | – | (.01 | ) | ||||||||||
|
| |||||||||||||||||||
Total dividends and distributions | (.15 | ) | (.02 | ) | (.11 | ) | (.29 | ) | (.10 | ) | ||||||||||
|
| |||||||||||||||||||
Net asset value, end of period | $ 10.78 | $ 10.81 | $ 11.34 | $ 10.79 | $ 10.50 | |||||||||||||||
|
| |||||||||||||||||||
Total Return | ||||||||||||||||||||
Total investment return based on net asset value(e) | 1.10 | % | (4.51 | )% | 6.18 | % | 5.59 | % | 6.04 | % | ||||||||||
Ratios/Supplemental Data | ||||||||||||||||||||
Net assets, end of period (000’s omitted) | $230 | $209 | $539 | $488 | $11 | |||||||||||||||
Ratio to average net assets of: | ||||||||||||||||||||
Expenses, net of waivers/reimbursements(f) | 1.01 | % | 1.01 | % | 1.01 | % | .98 | % | 1.00 | %^+ | ||||||||||
Expenses, before waivers/reimbursements(f) | 1.40 | % | 1.44 | % | 1.60 | % | 2.16 | % | 5.74 | %^+ | ||||||||||
Net investment income(c) | 1.26 | % | .49 | % | .98 | % | 4.16 | % | 1.53 | %^+ | ||||||||||
Portfolio turnover rate** | 77 | % | 93 | % | 32 | % | 38 | % | 34 | % | ||||||||||
See footnote summary on page 74.
| ALLIANCEBERNSTEIN BOND INFLATION STRATEGY • | 69 |
Financial Highlights
Selected Data For A Share Of Capital Stock Outstanding Throughout Each Period
| Class K | ||||||||||||||||||||
| Year Ended October 31, | January 26, 2010(a) to October 31, | |||||||||||||||||||
| 2014 | 2013 | 2012 | 2011 | 2010 | ||||||||||||||||
|
| |||||||||||||||||||
Net asset value, beginning of period | $ 10.80 | $ 11.35 | $ 10.79 | $ 10.50 | $ 10.00 | |||||||||||||||
|
| |||||||||||||||||||
Income From Investment Operations | ||||||||||||||||||||
Net investment income(b)(c) | .17 | .09 | .13 | .28 | .09 | |||||||||||||||
Net realized and unrealized gain (loss) on investment and foreign currency transactions | (.03 | ) | (.57 | ) | .57 | .31 | .53 | |||||||||||||
|
| |||||||||||||||||||
Net increase (decrease) in net asset value from operations | .14 | (.48 | ) | .70 | .59 | .62 | ||||||||||||||
|
| |||||||||||||||||||
Less: Dividends and Distributions | ||||||||||||||||||||
Dividends from net investment income | (.17 | ) | (.07 | ) | (.14 | ) | (.30 | ) | (.12 | ) | ||||||||||
Distributions from net realized gain on investment transactions | – 0 | – | (.00 | )(d) | – 0 | – | – 0 | – | – 0 | – | ||||||||||
Tax return of capital | – 0 | – | – 0 | – | – 0 | – | – 0 | – | (.00 | )(d) | ||||||||||
|
| |||||||||||||||||||
Total dividends and distributions | (.17 | ) | (.07 | ) | (.14 | ) | (.30 | ) | (.12 | ) | ||||||||||
|
| |||||||||||||||||||
Net asset value, end of period | $ 10.77 | $ 10.80 | $ 11.35 | $ 10.79 | $ 10.50 | |||||||||||||||
|
| |||||||||||||||||||
Total Return | ||||||||||||||||||||
Total investment return based on net asset value(e) | 1.31 | % | (4.26 | )% | 6.51 | % | 5.75 | % | 6.22 | % | ||||||||||
Ratios/Supplemental Data | ||||||||||||||||||||
Net assets, end of period (000’s omitted) | $2,219 | $1,981 | $2,007 | $566 | $784 | |||||||||||||||
Ratio to average net assets of: | ||||||||||||||||||||
Expenses, net of waivers/reimbursements(f) | .76 | % | .76 | % | .77 | % | .75 | % | .75 | %^+ | ||||||||||
Expenses, before waivers/reimbursements(f) | 1.07 | % | 1.12 | % | 1.27 | % | 2.39 | % | 3.53 | %^+ | ||||||||||
Net investment income(c) | 1.57 | % | .80 | % | 1.19 | % | 2.76 | % | 1.12 | %^+ | ||||||||||
Portfolio turnover rate** | 77 | % | 93 | % | 32 | % | 38 | % | 34 | % | ||||||||||
See footnote summary on page 74.
| 70 | • ALLIANCEBERNSTEIN BOND INFLATION STRATEGY |
Financial Highlights
Selected Data For A Share Of Capital Stock Outstanding Throughout Each Period
| Class I | ||||||||||||||||||||
| Year Ended October 31, | January 26, | |||||||||||||||||||
| 2014 | 2013 | 2012 | 2011 | 2010 | ||||||||||||||||
|
| |||||||||||||||||||
Net asset value, beginning of period | $ 10.77 | $ 11.33 | $ 10.78 | $ 10.51 | $ 10.00 | |||||||||||||||
|
| |||||||||||||||||||
Income From Investment Operations | ||||||||||||||||||||
Net investment income(b)(c) | .22 | .10 | .18 | .27 | .16 | |||||||||||||||
Net realized and unrealized gain (loss) on investment and foreign currency transactions | (.06 | ) | (.55 | ) | .53 | .36 | .48 | |||||||||||||
|
| |||||||||||||||||||
Net increase (decrease) in net asset value from operations | .16 | (.45 | ) | .71 | .63 | .64 | ||||||||||||||
|
| |||||||||||||||||||
Less: Dividends and Distributions | ||||||||||||||||||||
Dividends from net investment income | (.20 | ) | (.11 | ) | (.16 | ) | (.36 | ) | (.12 | ) | ||||||||||
Distributions from net realized gain on investment transactions | – 0 | – | (.00 | )(d) | – 0 | – | – 0 | – | – 0 | – | ||||||||||
Tax return of capital | – 0 | – | – 0 | – | – 0 | – | – 0 | – | (.01 | ) | ||||||||||
|
| |||||||||||||||||||
Total dividends and distributions | (.20 | ) | (.11 | ) | (.16 | ) | (.36 | ) | (.13 | ) | ||||||||||
|
| |||||||||||||||||||
Net asset value, end of period | $ 10.73 | $ 10.77 | $ 11.33 | $ 10.78 | $ 10.51 | |||||||||||||||
|
| |||||||||||||||||||
Total Return | ||||||||||||||||||||
Total investment return based on net asset value(e) | 1.52 | % | (4.00 | )% | 6.65 | % | 6.11 | % | 6.46 | % | ||||||||||
Ratios/Supplemental Data | ||||||||||||||||||||
Net assets, end of period (000’s omitted) | $841 | $2,631 | $267 | $76 | $11 | |||||||||||||||
Ratio to average net assets of: | ||||||||||||||||||||
Expenses, net of waivers/reimbursements(f) | .51 | % | .50 | % | .52 | % | .50 | % | .49 | %^+ | ||||||||||
Expenses, before waivers/reimbursements(f) | .69 | % | .83 | % | .95 | % | 1.91 | % | 5.19 | %^+ | ||||||||||
Net investment income(c) | 2.06 | % | 1.10 | % | 1.54 | % | 3.67 | % | 2.03 | %^+ | ||||||||||
Portfolio turnover rate** | 77 | % | 93 | % | 32 | % | 38 | % | 34 | % | ||||||||||
See footnote summary on page 74.
| ALLIANCEBERNSTEIN BOND INFLATION STRATEGY • | 71 |
Financial Highlights
Selected Data For A Share Of Capital Stock Outstanding Throughout Each Period
| Class 1 | ||||||||||||||||||||
| Year Ended October 31, | January 26, | |||||||||||||||||||
| 2014 | 2013 | 2012 | 2011 | 2010 | ||||||||||||||||
|
| |||||||||||||||||||
Net asset value, beginning of period | $ 10.76 | $ 11.33 | $ 10.78 | $ 10.51 | $ 10.00 | |||||||||||||||
|
| |||||||||||||||||||
Income From Investment Operations | ||||||||||||||||||||
Net investment income(b)(c) | .19 | .12 | .16 | .34 | .15 | |||||||||||||||
Net realized and unrealized gain (loss) on investment and foreign currency transactions | (.04 | ) | (.58 | ) | .55 | .28 | .48 | |||||||||||||
|
| |||||||||||||||||||
Net increase (decrease) in net asset value from operations | .15 | (.46 | ) | .71 | .62 | .63 | ||||||||||||||
|
| |||||||||||||||||||
Less: Dividends and Distributions | ||||||||||||||||||||
Dividends from net investment income | (.20 | ) | (.11 | ) | (.16 | ) | (.35 | ) | (.11 | ) | ||||||||||
Distributions from net realized gain on investment transactions | – 0 | – | (.00 | )(d) | – 0 | – | – 0 | – | – 0 | – | ||||||||||
Tax return of capital | – 0 | – | – 0 | – | – 0 | – | – 0 | – | (.01 | ) | ||||||||||
|
| |||||||||||||||||||
Total dividends and distributions | (.20 | ) | (.11 | ) | (.16 | ) | (.35 | ) | (.12 | ) | ||||||||||
|
| |||||||||||||||||||
Net asset value, end of period | $ 10.71 | $ 10.76 | $ 11.33 | $ 10.78 | $ 10.51 | |||||||||||||||
|
| |||||||||||||||||||
Total Return | ||||||||||||||||||||
Total investment return based on net asset value(e) | 1.38 | % | (4.08 | )% | 6.63 | % | 6.01 | % | 6.39 | % | ||||||||||
Ratios/Supplemental Data | ||||||||||||||||||||
Net assets, end of period (000’s omitted) | $288,565 | $315,187 | $193,864 | $105,201 | $11 | |||||||||||||||
Ratio to average net assets of: | ||||||||||||||||||||
Expenses, net of waivers/reimbursements(f) | .61 | % | .60 | % | .61 | % | .58 | % | .58 | %^+ | ||||||||||
Expenses, before waivers/reimbursements(f) | .77 | % | .81 | % | .96 | % | 1.20 | % | 5.29 | %^+ | ||||||||||
Net investment income(c) | 1.75 | % | 1.05 | % | 1.41 | % | 3.24 | % | 1.93 | %^+ | ||||||||||
Portfolio turnover rate** | 77 | % | 93 | % | 32 | % | 38 | % | 34 | % | ||||||||||
See footnote summary on page 74.
| 72 | • ALLIANCEBERNSTEIN BOND INFLATION STRATEGY |
Financial Highlights
Selected Data For A Share Of Capital Stock Outstanding Throughout Each Period
| Class 2 | ||||||||||||||||||||
| Year Ended October 31, | January 26, 2010(a) to October 31, | |||||||||||||||||||
| 2014 | 2013 | 2012 | 2011 | 2010 | ||||||||||||||||
|
| |||||||||||||||||||
Net asset value, beginning of period | $ 10.75 | $ 11.33 | $ 10.77 | $ 10.51 | $ 10.00 | |||||||||||||||
|
| |||||||||||||||||||
Income From Investment Operations | ||||||||||||||||||||
Net investment income(b)(c) | .20 | .12 | .14 | .39 | .16 | |||||||||||||||
Net realized and unrealized gain (loss) on investment and foreign currency transactions | (.03 | ) | (.58 | ) | .59 | .23 | .48 | |||||||||||||
|
| |||||||||||||||||||
Net increase (decrease) in net asset value from operations | .17 | (.46 | ) | .73 | .62 | .64 | ||||||||||||||
|
| |||||||||||||||||||
Less: Dividends and Distributions | ||||||||||||||||||||
Dividends from net investment income | (.21 | ) | (.12 | ) | (.17 | ) | (.36 | ) | (.12 | ) | ||||||||||
Distributions from net realized gain on investment transactions | – 0 | – | (.00 | )(d) | – 0 | – | – 0 | – | – 0 | – | ||||||||||
Tax return of capital | – 0 | – | – 0 | – | – 0 | – | – 0 | – | (.01 | ) | ||||||||||
|
| |||||||||||||||||||
Total dividends and distributions | (.21 | ) | (.12 | ) | (.17 | ) | (.36 | ) | (.13 | ) | ||||||||||
|
| |||||||||||||||||||
Net asset value, end of period | $ 10.71 | $ 10.75 | $ 11.33 | $ 10.77 | $ 10.51 | |||||||||||||||
|
| |||||||||||||||||||
Total Return | ||||||||||||||||||||
Total investment return based on net asset value(e) | 1.55 | % | (4.06 | )% | 6.80 | % | 6.01 | % | 6.44 | % | ||||||||||
Ratios/Supplemental Data | ||||||||||||||||||||
Net assets, end of period | $47,314 | $46,554 | $47,200 | $16,550 | $10,439 | |||||||||||||||
Ratio to average net assets of: | ||||||||||||||||||||
Expenses, net of waivers/reimbursements(f) | .51 | % | .51 | % | .51 | % | .49 | % | .49 | %^+ | ||||||||||
Expenses, before waivers/reimbursements(f) | .67 | % | .71 | % | .86 | % | 1.84 | % | 5.18 | %^+ | ||||||||||
Net investment income(c) | 1.87 | % | 1.05 | % | 1.36 | % | 3.73 | % | 2.05 | %^+ | ||||||||||
Portfolio turnover rate**. | 77 | % | 93 | % | 32 | % | 38 | % | 34 | % | ||||||||||
See footnote summary on page 74.
| ALLIANCEBERNSTEIN BOND INFLATION STRATEGY • | 73 |
Financial Highlights
| (a) | Commencement of operations. |
| (b) | Based on average shares outstanding. |
| (c) | Net of fees and expenses waived/reimbursed by the Adviser. |
| (d) | Amount is less than $.005. |
| (e) | Total investment return is calculated assuming an initial investment made at the net asset value at the beginning of the period, reinvestment of all dividends and distributions at net asset value during the period, and redemption on the last day of the period. Initial sales charges or contingent deferred sales charges are not reflected in the calculation of total investment return. Total return does not reflect the deduction of taxes that a shareholder would pay on fund distributions or the redemption of fund shares. Total investment return calculated for a period of less than one year is not annualized. |
| (f) | The expense ratios presented below exclude interest expense: |
January 26, 2010 | ||||||||||||||||||||
| Year Ended October 31, | ||||||||||||||||||||
| 2014 | 2013 | 2012 | 2011 | |||||||||||||||||
|
| |||||||||||||||||||
Class A | ||||||||||||||||||||
Net of waivers/reimbursements | .79 | % | .75 | % | .75 | % | .75 | % | .75 | %^+ | ||||||||||
Before waivers/reimbursements | 1.13 | % | 1.12 | % | 1.18 | % | 1.83 | % | 4.58 | %^+ | ||||||||||
Class C | ||||||||||||||||||||
Net of waivers/reimbursements | 1.48 | % | 1.45 | % | 1.45 | % | 1.45 | % | 1.45 | %^+ | ||||||||||
Before waivers/reimbursements | 1.84 | % | 1.81 | % | 1.90 | % | 2.80 | % | 4.75 | %^+ | ||||||||||
Advisor Class | ||||||||||||||||||||
Net of waivers/reimbursements | .49 | % | .45 | % | .45 | % | .45 | % | .45 | %^+ | ||||||||||
Before waivers/reimbursements | .84 | % | .82 | % | .89 | % | 1.76 | % | 4.44 | %^+ | ||||||||||
Class R | ||||||||||||||||||||
Net of waivers/reimbursements | .99 | % | .95 | % | .95 | % | .95 | % | .95 | %^+ | ||||||||||
Before waivers/reimbursements | 1.38 | % | 1.39 | % | 1.54 | % | 2.13 | % | 5.69 | %^+ | ||||||||||
Class K | ||||||||||||||||||||
Net of waivers/reimbursements | .74 | % | .70 | % | .70 | % | .70 | % | .70 | %^+ | ||||||||||
Before waivers/reimbursements | 1.05 | % | 1.06 | % | 1.21 | % | 2.34 | % | 3.48 | %^+ | ||||||||||
Class I | ||||||||||||||||||||
Net of waivers/reimbursements | .49 | % | .45 | % | .45 | % | .45 | % | .45 | %^+ | ||||||||||
Before waivers/reimbursements | .67 | % | .78 | % | .89 | % | 1.86 | % | 5.16 | %^+ | ||||||||||
Class 1 | ||||||||||||||||||||
Net of waivers/reimbursements | .59 | % | .55 | % | .55 | % | .55 | % | .55 | %^+ | ||||||||||
Before waivers/reimbursements | .74 | % | .76 | % | .89 | % | 1.18 | % | 5.25 | %^+ | ||||||||||
Class 2 | ||||||||||||||||||||
Net of waivers/reimbursements | .49 | % | .45 | % | .45 | % | .45 | % | .45 | %^+ | ||||||||||
Before waivers/reimbursements | .64 | % | .66 | % | .80 | % | 1.80 | % | 5.13 | %^+ | ||||||||||
| ^ | Annualized. |
| + | The ratio includes expenses attributable to costs of proxy solicitation. |
| ** | The Strategy accounts for dollar roll transactions as purchases and sales. |
See notes to financial statements.
| 74 | • ALLIANCEBERNSTEIN BOND INFLATION STRATEGY |
Financial Highlights
REPORT OF INDEPENDENT REGISTERED
PUBLIC ACCOUNTING FIRM
To the Board of Directors of AllianceBernstein Bond Fund, Inc. and Shareholders of the AllianceBernstein Bond Inflation Strategy Portfolio
We have audited the accompanying statement of assets and liabilities, including the portfolio of investments, of AllianceBernstein Bond Inflation Strategy Portfolio (one of the portfolios constituting the AllianceBernstein Bond Fund, Inc. (the “Fund”)), as of October 31, 2014, and the related statement of operations and cash flows for the year then ended, the statement of changes in net assets for each of the two years in the period then ended and the financial highlights for the four years in the period then ended and the period January 26, 2010 (commencement of operations) through October 31, 2010. These financial statements and financial highlights are the responsibility of the Fund’s management. Our responsibility is to express an opinion on these financial statements and financial highlights based on our audits.
We conducted our audits in accordance with the standards of the Public Company Accounting Oversight Board (United States). Those standards require that we plan and perform the audit to obtain reasonable assurance about whether the financial statements and financial highlights are free of material misstatement. We were not engaged to perform an audit of the Fund’s internal control over financial reporting. Our audit included consideration of internal control over financial reporting as a basis for designing audit procedures that are appropriate in the circumstances, but not for the purpose of expressing an opinion on the effectiveness of the Fund’s internal control over financial reporting. Accordingly, we express no such opinion. An audit also includes examining, on a test basis, evidence supporting the amounts and disclosures in the financial statements and financial highlights, assessing the accounting principles used and significant estimates made by management, and evaluating the overall financial statement presentation. Our procedures included confirmation of securities owned as of October 31, 2014, by correspondence with the custodian and others or by other appropriate auditing procedures where replies from others were not received. We believe that our audits provide a reasonable basis for our opinion.
In our opinion, the financial statements and financial highlights referred to above present fairly, in all material respects, the financial position of AllianceBernstein Bond Inflation Strategy Portfolio (one of the portfolios constituting the AllianceBernstein Bond Fund, Inc.) at October 31, 2014, the results of its operations and its cash flows for the year then ended, the changes in its net assets for each of the two years in the period then ended and the financial highlights for each of the four years in the period then ended and the period January 26, 2010 (commencement of operations) through October 31, 2010, in conformity with U.S. generally accepted accounting principles.

New York, New York
December 26, 2014
| ALLIANCEBERNSTEIN BOND INFLATION STRATEGY • | 75 |
Report of Independent Registered Public Accounting Firm
2014 FEDERAL TAX INFORMATION
(unaudited)
For Federal income tax purposes, the following information is furnished with respect to the distributions paid by the Strategy during the taxable year ended October 31, 2014.
For foreign shareholders, 73.99% of ordinary income dividends paid may be considered to be qualifying to be taxed as interest-related dividends.
Shareholders should not use the above information to prepare their income tax returns. The information necessary to complete your income tax returns will be included with your Form 1099-DIV which will be sent to you separately in January 2015.
| 76 | • ALLIANCEBERNSTEIN BOND INFLATION STRATEGY |
BOARD OF DIRECTORS
Marshall C. Turner, Jr.(1), Chairman John H. Dobkin(1) Michael J. Downey(1) William H. Foulk, Jr.(1) D. James Guzy(1) | Nancy P. Jacklin(1) Robert M. Keith, President and Chief Executive Officer Garry L. Moody(1) Earl D. Weiner(1) |
OFFICERS
Philip L. Kirstein, Paul J. DeNoon(2), Vice President Rajen B. Jadav(2), Vice President Shawn E. Keegan(2) , Vice President Douglas J. Peebles(2) , Vice President | Greg J. Wilensky(2), Vice President Emilie D. Wrapp, Secretary Joseph J. Mantineo, Treasurer and Chief Financial Officer Phyllis J. Clarke, Controller Vincent S. Noto, Chief Compliance Officer |
Custodian and Accounting Agent State Street Bank and Trust Company State Street Corporation CCB/5 1 Iron Street Boston, MA 02210
Principal Underwriter AllianceBernstein Investments, Inc. 1345 Avenue of the Americas New York, NY 10105
Transfer Agent AllianceBernstein Investor Services, Inc. P.O. Box 786003 San Antonio, TX 78278-6003 Toll-Free (800) 221-5672 | Independent Registered Public Ernst & Young LLP 5 Times Square New York, NY 10036
Legal Counsel Seward & Kissel LLP One Battery Park Plaza New York, NY 10004 |
| (1) | Member of the Audit Committee, the Governance and Nominating Committee, and the Independent Directors Committee. |
| (2) | The day-to-day management of, and investment decisions for, the Strategy’s portfolio are made by the Adviser’s U.S. Core Fixed-Income Team. Mr. Paul J. DeNoon, Mr. Rajen B. Jadav, Mr. Shawn E. Keegan, Mr. Douglas J. Peebles and Mr. Greg J. Wilensky are the investment professionals with the most significant responsibility for the day-to-day management of the Strategy’s portfolio. |
| ALLIANCEBERNSTEIN BOND INFLATION STRATEGY • | 77 |
Board of Directors
MANAGEMENT OF THE FUND
Board of Directors Information
The business and affairs of the Strategy are managed under the direction of the Board of Directors. Certain information concerning the Strategy’s Directors is set forth below.
| NAME, ADDRESS*, AGE, (YEAR FIRST ELECTED**) | PRINCIPAL OCCUPATION(S) DURING PAST FIVE YEARS AND OTHER RELEVANT QUALIFICATIONS*** | PORTFOLIOS IN FUND COMPLEX OVERSEEN BY DIRECTOR | OTHER DIRECTORSHIP HELD BY DIRECTOR IN THE PAST FIVE YEARS | |||||
| INTERESTED DIRECTOR | ||||||||
Robert M. Keith, + 1345 Avenue of the Americas New York, NY 10105 54 (2010) | Senior Vice President of AllianceBernstein L.P. (the “Adviser”) and the head of AllianceBernstein Investments, Inc. (“ABI”) since July 2008; Director of ABI and President of the AllianceBernstein Mutual Funds. Previously, he served as Executive Managing Director of ABI from December 2006 to June 2008. Prior to joining ABI in 2006, Executive Managing Director of Bernstein Global Wealth Management, and prior thereto, Senior Managing Director and Global Head of Client Service and Sales of the Adviser’s institutional investment management business since 2004. Prior thereto, he was Managing Director and Head of North American Client Service and Sales in the Adviser’s institutional investment management business, with which he had been associated since prior to 2004. | 117 | None | |||||
| 78 | • ALLIANCEBERNSTEIN BOND INFLATION STRATEGY |
Management of the Fund
| NAME, ADDRESS*, AGE, (YEAR FIRST ELECTED**) | PRINCIPAL OCCUPATION(S) DURING PAST FIVE YEARS AND OTHER RELEVANT QUALIFICATIONS*** | PORTFOLIOS IN FUND COMPLEX OVERSEEN BY DIRECTOR | OTHER DIRECTORSHIP HELD BY DIRECTOR IN THE PAST FIVE YEARS | |||||
| DISINTERESTED DIRECTORS | ||||||||
Marshall C. Turner, Jr., ++ Chairman of the Board 73 (2005) | Private Investor since prior to 2009. Former CEO of Dupont Photomasks, Inc. (components of semi-conductor manufacturing), 2003-2006, and interim CEO 1999-2000. He has extensive operating and early-stage investment experience, including prior service as general partner of three institutional venture capital partnerships, and serves on the boards of three education and science-related non-profit organizations. He has served as a director of one AllianceBernstein fund since 1992, and director or trustee of multiple AllianceBernstein funds since 2005. He has been Chairman of the AllianceBernstein Funds since January 2014, and the Chairman of the Independent Directors Committees of such Funds since February 2014. | 117 | Xilinx, Inc. (programmable logic semi-conductors) and SunEdison, Inc. (semi-conductor substrates, solar materials and solar power plants) since prior to 2009 until July 2014 | |||||
John H. Dobkin, ++ 72 (1998) | Independent Consultant since prior to 2009. Formerly, President of Save Venice, Inc. (preservation organization) from 2001-2002; Senior Advisor from June 1999-June 2000 and President of Historic Hudson Valley (historic preservation) from December 1989-May 1999. Previously, Director of the National Academy of Design. He has served as a director or trustee of various AllianceBernstein Funds since 1992, and as Chairman of the Audit Committees of a number of such Funds from 2001-2008. | 117 | None | |||||
| ALLIANCEBERNSTEIN BOND INFLATION STRATEGY • | 79 |
Management of the Fund
| NAME, ADDRESS*, AGE, (YEAR FIRST ELECTED**) | PRINCIPAL OCCUPATION(S) DURING PAST FIVE YEARS AND OTHER RELEVANT QUALIFICATIONS*** | PORTFOLIOS IN FUND COMPLEX OVERSEEN BY DIRECTOR | OTHER DIRECTORSHIP HELD BY DIRECTOR IN THE PAST FIVE YEARS | |||||
DISINTERESTED DIRECTORS (continued) | ||||||||
Michael J. Downey, ++ 70 (2005) | Private Investor since prior to 2009. Formerly, managing partner of Lexington Capital, LLC (investment advisory firm) from December 1997 until December 2003. From 1987 until 1993, Chairman and CEO of Prudential Mutual Fund Management, director of the Prudential mutual funds, and member of the Executive Committee of Prudential Securities Inc. He has served as a director or trustee of the AllianceBernstein Funds since 2005 and is a director and Chairman of one other registered investment company. | 117 | Asia Pacific Fund, Inc. (registered investment company) since prior to 2009, Prospect Acquisition Corp. (financial services) from 2007 until 2009, and The Merger Fund (registered investment company) since prior to 2009 until 2013 | |||||
William H. Foulk, Jr., ++ 82 (1998) | Investment Adviser and an Independent Consultant since prior to 2009. Previously, he was Senior Manager of Barrett Associates, Inc., a registered investment adviser. He was formerly Deputy Comptroller and Chief Investment Officer of the State of New York and, prior thereto, Chief Investment Officer of the New York Bank for Savings. He has served as a director or trustee of various AllianceBernstein Funds since 1983, and was Chairman of the Independent Directors Committees of the AllianceBernstein Funds from 2003 until early February 2014. He served as Chairman of such Funds from 2003 through December 2013. He is also active in a number of mutual fund related organizations and committees. | 117 | None | |||||
| 80 | • ALLIANCEBERNSTEIN BOND INFLATION STRATEGY |
Management of the Fund
| NAME, ADDRESS*, AGE, (YEAR FIRST ELECTED**) | PRINCIPAL OCCUPATION(S) DURING PAST FIVE YEARS AND OTHER RELEVANT QUALIFICATIONS*** | PORTFOLIOS IN FUND COMPLEX OVERSEEN BY DIRECTOR | OTHER DIRECTORSHIP HELD BY DIRECTOR IN THE PAST FIVE YEARS | |||||
| DISINTERESTED DIRECTORS (continued) | ||||||||
D. James Guzy, ++ 78 (2005) | Chairman of the Board of SRC Computers, Inc. (semi-conductors), with which he has been associated since prior to 2009. He served as Chairman of the Board of PLX Technology (semi-conductors) since prior to 2009 until November 2013. He was a director of Intel Corporation (semi-conductors) from 1969 until 2008, and served as Chairman of the Finance Committee of such company for several years until May 2008. He has served as a director or trustee of one or more of the AllianceBernstein Funds since 1982. | 117 | PLX Technology (semi-conductors) since prior to 2009 until November 2013, and Cirrus Logic Corporation (semi-conductors) since prior to 2009 until July 2011 | |||||
Nancy P. Jacklin, ++ 66 (2006) | Professorial Lecturer at the Johns Hopkins School of Advanced International Studies since 2008. Formerly, U.S. Executive Director of the International Monetary Fund (which is responsible for ensuring the stability of the international monetary system), (December 2002-May 2006); Partner, Clifford Chance (1992-2002); Sector Counsel, International Banking and Finance, and Associate General Counsel, Citicorp (1985-1992); Assistant General Counsel (International), Federal Reserve Board of Governors (1982-1985); and Attorney Advisor, U.S. Department of the Treasury (1973-1982). Member of the Bar of the District of Columbia and of New York; and member of the Council on Foreign Relations. She has served as a director or trustee of the AllianceBernstein Funds since 2006 and has been Chairman of the Governance and Nominating Committees of the Funds since August 2014. | 117 | None | |||||
| ALLIANCEBERNSTEIN BOND INFLATION STRATEGY • | 81 |
Management of the Fund
| NAME, ADDRESS*, AGE, (YEAR FIRST ELECTED**) | PRINCIPAL OCCUPATION(S) DURING PAST FIVE YEARS AND OTHER RELEVANT QUALIFICATIONS*** | PORTFOLIOS IN FUND COMPLEX OVERSEEN BY DIRECTOR | OTHER DIRECTORSHIP HELD BY DIRECTOR IN THE PAST FIVE YEARS | |||||
| DISINTERESTED DIRECTORS (continued) | ||||||||
Garry L. Moody, ++ 62 (2008) | Independent Consultant. Formerly, Partner, Deloitte & Touche LLP (1995-2008) where he held a number of senior positions, including Vice Chairman, and U.S. and Global Investment Management Practice Managing Partner; President, Fidelity Accounting and Custody Services Company (1993-1995); and Partner, Ernst & Young LLP (1975-1993), where he served as the National Director of Mutual Fund Tax Services and Managing Partner of its Chicago Office Tax department. He is a member of both the Governing Council of the Independent Directors Council (IDC), an organization of independent directors of mutual funds, and the Trustee Advisory Board of BoardIQ, a biweekly publication focused on issues and news affecting directors of mutual funds. He has served as a director or trustee, and as Chairman of the Audit Committees, of the AllianceBernstein Funds since 2008. | 117 | None | |||||
Earl D. Weiner, ++ 75 (2007) | Of Counsel, and Partner prior to January 2007, of the law firm Sullivan & Cromwell LLP and is a former member of the ABA Federal Regulation of Securities Committee Task Force to draft editions of the Fund Director’s Guidebook. He also serves as a director or trustee of various non-profit organizations and has served as Chairman or Vice Chairman of a number of them. He has served as a director or trustee of the AllianceBernstein Funds since 2007 and served as Chairman of the Governance and Nominating Committees of the AllianceBernstein Funds from 2007 until August 2014. | 117 | None | |||||
| 82 | • ALLIANCEBERNSTEIN BOND INFLATION STRATEGY |
Management of the Fund
| * | The address for each of the Strategy’s disinterested Directors is c/o AllianceBernstein L.P., Attention: Philip L. Kirstein, 1345 Avenue of the Americas, New York, NY 10105. |
| ** | There is no stated term of office for the Strategy’s Directors. |
| *** | The information above includes each Director’s principal occupation during the last five years and other information relating to the experience, attributes and skills relevant to each Director’s qualifications to serve as a Director, which led to the conclusion that each Director should serve as a Director for the Strategy. |
| + | Mr. Keith is an “interested person” of the Strategy as defined in the “40 Act”, due to his position as a Senior Vice President of the Adviser. |
| ++ | Member of the Audit Committee, the Governance and Nominating Committee and the Independent Directors Committee. |
| ALLIANCEBERNSTEIN BOND INFLATION STRATEGY • | 83 |
Management of the Fund
Officer Information
Certain information concerning the Strategy’s Officers is listed below.
| NAME, ADDRESS* AND AGE | PRINCIPAL HELD WITH FUND | PRINCIPAL OCCUPATION DURING PAST 5 YEARS | ||
| Robert M. Keith 54 | President and Chief Executive Officer | See biography above. | ||
| Philip L. Kirstein 69 | Senior Vice President and Independent Compliance Officer | Senior Vice President and Independent Compliance Officer of the AllianceBernstein Funds, with which he has been associated since October 2004. Prior thereto, he was Of Counsel to Kirkpatrick & Lockhart, LLP from October 2003 to October 2004, and General Counsel of Merrill Lynch Investment Managers, L.P. since prior to March 2003. | ||
Paul J. DeNoon 52 | Vice President | Senior Vice President of the Adviser,** with which he has been associated since prior to 2009. | ||
Rajen B. Jadav 39 | Vice President | Vice President of the Adviser,** with which he has been associated since prior to 2009. | ||
Shawn E. Keegan 43 | Vice President | Vice President of the Adviser,** with which he has been associated since prior to 2009. | ||
Douglas J. Peebles 49 | Vice President | Senior Vice President of the Adviser,** with which he has been associated since prior to 2009. | ||
Greg J. Wilensky 47 | Vice President | Senior Vice President of the Adviser,** with which he has been associated since prior to 2009. | ||
| Emilie D. Wrapp 58 | Secretary | Senior Vice President, Assistant General Counsel and Assistant Secretary of ABI,** with which she has been associated since prior to 2009. | ||
| Joseph J. Mantineo 55 | Treasurer and Chief Financial Officer | Senior Vice President of AllianceBernstein Investor Services, Inc. (“ABIS”),** with which he has been associated since prior to 2009. | ||
| Phyllis J. Clarke 53 | Controller | Vice President of ABIS,** with which she has been associated since prior to 2009. | ||
| Vincent S. Noto 50 | Chief Compliance Officer | Vice President and Mutual Fund Chief Compliance Officer of the Adviser** since 2014. Prior thereto, he was Vice President and Director of Mutual Fund Compliance of the Adviser** since 2009. |
| * | The address for each of the Fund’s Officers is 1345 Avenue of the Americas, New York, NY 10105. |
| ** | The Adviser, ABI and ABIS are affiliates of the Strategy. |
| The Fund’s Statement of Additional Information (“SAI”) has additional information about the Strategy’s Directors and Officers and is available without charge upon request. Contact your financial representative or AllianceBernstein at 1-800-227-4618, or visit www.alliancebernstein.com, for a free prospectus or SAI. |
| 84 | • ALLIANCEBERNSTEIN BOND INFLATION STRATEGY |
Management of the Fund
THE FOLLOWING IS NOT PART OF THE SHAREHOLDER REPORT OR THE FINANCIAL STATEMENTS
SUMMARY OF SENIOR OFFICER’S EVALUATION OF INVESTMENT ADVISORY AGREEMENT1
The following is a summary of the evaluation of the Investment Advisory Agreement between AllianceBernstein L.P. (the “Adviser”) and AllianceBernstein Bond Fund, Inc. (the “Fund”) in respect of AllianceBernstein Bond Inflation Strategy (the “Strategy”).2 The evaluation of the Investment Advisory Agreement was prepared by Philip L. Kirstein, the Senior Officer of the Fund, for the Directors of the Fund, as required by the September 1, 2004 Assurance of Discontinuance (“AoD”) between the Adviser and the New York State Attorney General (the “NYAG”). The Senior Officer’s evaluation of the Investment Advisory Agreement is not meant to diminish the responsibility or authority of the Board of Directors of the Fund to perform its duties pursuant to Section 15 of the Investment Company Act of 1940 (the “40 Act”) and applicable state law. The purpose of this summary is to provide shareholders with a synopsis of the independent evaluation of the reasonableness of the advisory fees proposed to be paid by the Strategy which was provided to the Directors in connection with their review of the proposed approval of the continuance of the Investment Advisory Agreement. The Senior Officer’s evaluation considered the following factors:
| 1. | Advisory fees charged to institutional and other clients of the Adviser for like services; |
| 2. | Advisory fees charged by other mutual fund companies for like services; |
| 3. | Costs to the Adviser and its affiliates of supplying services pursuant to the advisory agreement, excluding any intra-corporate profit; |
| 4. | Profit margins of the Adviser and its affiliates from supplying such services; |
| 5. | Possible economies of scale as the Strategy grows larger; and |
| 6. | Nature and quality of the Adviser’s services including the performance of the Strategy. |
These factors, with the exception of the first factor, are generally referred to as the “Gartenberg factors,” which were articulated by the United States Court of Appeals for the Second Circuit in 1982. Gartenberg v. Merrill Lynch Asset Management, Inc., 694 F. 2d 923 (2d Cir. 1982). On March 30, 2010, the Supreme Court held the Gartenberg decision was correct in its basic formulation of what Section 36(b) requires: to face liability under Section 36(b), “an investment adviser must charge a fee that is so disproportionately large that it bears no
| 1 | The Senior Officer’s fee evaluation was completed on October 23, 2014 and discussed with the Board of Directors on November 4-6, 2014. |
| 2 | Future references to the Fund or the Strategy do not include “AllianceBernstein.” |
| ALLIANCEBERNSTEIN BOND INFLATION STRATEGY • | 85 |
reasonable relationship to the services rendered and could not have been the product of arm’s length bargaining.” Jones v. Harris Associates L.P., 130 S. Ct. 1418 (2010). In Jones, the Court stated the Gartenberg approach fully incorporates the correct understanding of fiduciary duty within the context of Section 36(b) and noted with approval that “Gartenberg insists that all relevant circumstances be taken into account” and “uses the range of fees that might result from arm’s length bargaining as the benchmark for reviewing challenged fees.”3
INVESTMENT ADVISORY FEES, NET ASSETS, EXPENSE CAPS & RATIOS
The Adviser proposed that the Strategy pay the advisory fee set forth in the table below for receiving the services to be provided pursuant to the Investment Advisory Agreement. The fee schedule below, implemented in January 2004 in connection with the Adviser’s settlement with the NYAG in December 2003, is based on a master schedule that contemplates eight categories of funds with almost all funds in each category having the same advisory fee schedule.4
| Strategy | Category | Net Assets 9/30/14 ($MM) | Advisory Fee Based on % of Average Daily Net Assets | |||||
Bond Inflation Strategy | High Income | $ | 417.7 | 0.50% on 1st $2.5 billion 0.45% on next $2.5 billion 0.40 % on the balance | ||||
The Adviser is reimbursed as specified in the Investment Advisory Agreement for certain clerical, legal, accounting, administrative and other services provided to the Strategy. During the Strategy’s fiscal year ended October 31, 2013, the Adviser received $43,312 (0.012% of the Strategy’s average daily net assets) for providing such services.
The Adviser agreed to waive that portion of its advisory fees and/or reimburse the Strategy for that portion of the Strategy’s total operating expenses to the degree necessary to limit the Strategy’s expense ratios to the amounts set forth below for the Strategy’s current fiscal year. The waiver is terminable by the Adviser upon at least 60 days’ notice prior to the Strategy’s prospectus update. In addition, set forth below are the Strategy’s gross expense ratios for the most recent semi-annual period:5
| 3 | Jones v. Harris at 1427. |
| 4 | Most of the AllianceBernstein Mutual Funds, which the Adviser manages, were affected by the Adviser’s settlement with the NYAG. |
| 5 | Semi-annual total expense ratios are unaudited. |
| 86 | • ALLIANCEBERNSTEIN BOND INFLATION STRATEGY |
| Strategy | Expense Cap Pursuant to Expense Limitation Undertaking | Gross Expense Ratio6 | Fiscal Year End | |||||||||
| Bond Inflation Strategy7,8 | Advisor Class A Class C Class R Class K Class I Class 1 Class 2 |
| 0.50% 0.80% 1.50% 1.00% 0.75% 0.50% 0.60% 0.50% |
|
| 0.81% 1.10% 1.81% 1.34% 1.05% 0.66% 0.72% 0.62% |
| October 31 (ratio as of April 30, 2014) | ||||
| I. | ADVISORY FEES CHARGED TO INSTITUTIONAL AND OTHER CLIENTS |
The advisory fees charged to investment companies which the Adviser manages and sponsors are normally higher than those charged to similar sized institutional accounts, including pension plans and sub-advised investment companies. The fee differential reflects, among other things, different services provided to such clients, and different liabilities assumed. Services provided by the Adviser to the Strategy that are not provided to non-investment company clients include providing office space and personnel to serve as Fund Officers, who among other responsibilities make the certifications required under the Sarbanes–Oxley Act of 2002, and coordinating with and monitoring the Portfolio’s third party service providers such as Fund counsel, auditors, custodians, transfer agents and pricing services. The accounting, administrative, legal and compliance requirements for the Strategy are more costly than those for institutional client assets due to the greater complexities and time required for investment companies, although as previously noted, the Adviser is reimbursed for providing such services. Also, retail mutual funds managed by the Adviser are widely held and accordingly, servicing the Strategy’s investors is more time consuming and labor intensive compared to servicing institutional clients since the Adviser needs to communicate with a more extensive network of financial intermediaries and shareholders. The Adviser also believes that it incurs substantial entrepreneurial risk when offering a new mutual fund since establishing a new mutual fund requires a large upfront investment and it may take a long time for the fund to achieve profitability since the fund must be priced to scale from inception in order to be competitive and assets are acquired one account at a time. In addition, managing the cash flow of an investment company may be more difficult than that of a stable pool of assets, such as an institutional account with little cash movement in either direction, particularly if the Strategy is in net
| 6 | Annualized. |
| 7 | The Strategy’s expense ratios exclude interest expense of 0.02% for Advisor Class, Class A, Class C, Class I, Class Z, Class 1 and Class 2 shares, and 0.01% for Class K shares. |
| 8 | Prior to February 1, 2014, the Adviser had agreed to waive its fees and bear certain expenses to the extent necessary to limit total operating expenses on an annual basis to 0.45%, 0.75%, 1.45%, 0.95%, 0.70%, 0.45%, 0.55% and 0.45% of daily average net assets for Advisor Class, Class A, Class C, Class R, Class K, Class I, Class 1 and Class 2 shares, respectively. |
| ALLIANCEBERNSTEIN BOND INFLATION STRATEGY • | 87 |
redemption and the Adviser is frequently forced to sell securities to raise cash for redemptions. However, managing a fund with positive cash flow may be easier at times than managing a stable pool of assets. Finally, in recent years, investment advisers have been sued by institutional clients and have suffered reputational damage both by the attendant publicity and outcomes other than complete victories. Accordingly, the legal and reputational risks associated with institutional accounts are greater than previously thought, although arguably still not equal to those related to the mutual fund industry.
Notwithstanding the Adviser’s view that managing an investment company is not comparable to managing other institutional accounts because the services provided are different, the Supreme Court has indicated consideration should be given to the advisory fees charged to institutional accounts with a similar investment style as the Strategy.9 In addition to the AllianceBernstein Institutional fee schedule, set forth below is what would have been the effective advisory fee for the Strategy had the AllianceBernstein Institutional fee schedule been applicable to the Strategy versus the Strategy’s advisory fees based on September 30, 2014 net assets.10
| Strategy | Net Assets 09/30/14 ($MM) | AllianceBernstein (“AB”) Institutional (“Inst.”) Fee Schedule | Effective AB Inst. Adv. Fee | Strategy Advisory Fee | ||||||||||
| Bond Inflation Strategy | $417.7 | TIPS Plus Schedule 0.50% on 1st $30 million 0.20% on the balance Minimum Account Size: $25m | 0.222% | 0.500% | ||||||||||
The Adviser represented that it does not sub-advise any registered investment companies that have a similar investment strategy as the Strategy.
| II. | MANAGEMENT FEES CHARGED BY OTHER MUTUAL FUND COMPANIES FOR LIKE SERVICES. |
Lipper, Inc. (“Lipper”), an analytical service that is not affiliated with the Adviser, compared the fees charged to the Strategy with fees charged to other investment companies for similar services offered by other investment advisers.11
| 9 | The Supreme Court stated that “courts may give such comparisons the weight that they merit in light of the similarities and differences between the services that the clients in question require, but the courts must be wary of inapt comparisons.” Among the significant differences the Supreme Court noted that may exist between services provided to mutual funds and institutional accounts are “higher marketing costs.” Jones v. Harris at 1428. |
| 10 | The Adviser has indicated that with respect to institutional accounts with assets greater than $300 million, it will negotiate a fee schedule. Discounts that are negotiated vary based upon each client relationship. |
| 11 | The Supreme Court cautioned against accepting mutual fund fee comparisons without careful scrutiny since “these comparisons are problematic because these fees, like those challenged, may not be the product of negotiations conducted at arm’s length.” Jones v. Harris at 1429. |
| 88 | • ALLIANCEBERNSTEIN BOND INFLATION STRATEGY |
Lipper’s analysis included the comparison of the Strategy’s contractual management fee, estimated at the approximate current asset level of the Strategy, to the median of the Strategy’s Lipper Expense Group (“EG”)12 and the Strategy’s contractual management fee ranking.13
Lipper describes an EG as a representative sample of comparable funds. Lipper’s standard methodology for screening funds to be included in an EG entails the consideration of several fund criteria, including fund type, investment classification/objective, load type and similar 12b-1/non-12b-1 service fees, asset (size) comparability, expense components and attributes. An EG will typically consist of seven to twenty funds.
| Strategy | Contractual Management Fee (%) | Lipper Expense Median (%) | Rank | |||||||||
| Bond Inflation Strategy | 0.500 | 0.475 | 6/10 | |||||||||
Lipper also compared the Strategy’s total expense ratio to the medians of the Strategy’s EG and Lipper Expense Universe (“EU”). The EU14 is a broader group compared to the EG, consisting of all funds that have the same investment classification/objective and load type as the subject Strategy. Pro-forma total expense ratio is shown for the Portfolio to reflect the Portfolio’s expense cap level effective January 31, 2014.
| Strategy | Total Expense Ratio (%)15 | Lipper Exp. Group Median (%) | Lipper Group Rank | Lipper Exp. Universe Median (%) | Lipper Universe Rank | |||||||||||||||
| Bond Inflation Strategy | 0.750 | 0.819 | 3/10 | 0.805 | 5/22 | |||||||||||||||
Pro-forma | 0.800 | 0.819 | 4/10 | 0.805 | 10/22 | |||||||||||||||
| 12 | Lipper does not consider average account size when constructing EGs. Funds with relatively small average account sizes tend to have higher transfer agent expense ratios than comparable sized funds that have relatively large average account sizes. There are limitations to Lipper expense category data because different funds categorize expenses differently. |
| 13 | The contractual management fee is calculated by Lipper using the Strategy’s contractual management fee rate at a hypothetical asset level. The hypothetical asset level is based on the combined net assets of all classes of the Strategy, rounded up to the next $25 million. Lipper’s total expense ratio information is based on the most recent annual report except as otherwise noted. A ranking of “1” would mean that Strategy had the lowest effective fee rate in the Lipper peer group. |
| 14 | Except for asset (size) comparability, Lipper uses the same criteria for selecting an EG when selecting an EU. Unlike the EG, the EU allows for the same adviser to be represented by more than just one fund. |
| 15 | Most recently completed fiscal year Class A share total expense ratio. |
| ALLIANCEBERNSTEIN BOND INFLATION STRATEGY • | 89 |
Based on this analysis, considering pro-forma information where available, the Strategy has a more favorable ranking on a total expense ratio basis than on a contractual management fee basis.
| III. | COSTS TO THE ADVISER AND ITS AFFILIATES OF SUPPLYING SERVICES PURSUANT TO THE ADVISORY FEE ARRANGEMENT, EXCLUDING ANY INTRA-CORPORATE PROFIT. |
The Adviser utilizes two profitability reporting systems, which operate independently but are aligned with each other, to estimate the Adviser’s profitability in connection with investment advisory services provided to the Strategy. The Senior Officer has retained an independent consultant to provide independent advice regarding the alignment of the two profitability systems as well as the methodologies and allocations utilized by both profitability systems. See Section IV for additional discussion.
| IV. | PROFIT MARGINS OF THE ADVISER AND ITS AFFILIATES FOR SUPPLYING SUCH SERVICES. |
The profitability information for the Strategy, prepared by the Adviser for the Board of Directors, was reviewed by the Senior Officer and the independent consultant. The Adviser’s profitability from providing investment advisory services to the Strategy increased during calendar year 2013, relative to 2012.
In addition to the Adviser’s direct profits from managing the Strategy, certain of the Adviser’s affiliates have business relationships with the Strategy and may earn a profit from providing other services to the Strategy. The courts have referred to this type of business opportunity as “fall-out benefits” to the Adviser and indicated that such benefits should be factored into the evaluation of the total relationship between the Strategy and the Adviser. Neither case law nor common business practice precludes the Adviser’s affiliates from earning a reasonable profit on this type of relationship provided the affiliates’ charges and services are competitive. These affiliates provide transfer agent and distribution related services to the Strategy and receive transfer agent fees, front-end sales loads, Rule 12b-1 payments and contingent deferred sales charges (“CDSC”). During the Strategy’s most recently completed fiscal year, ABI received from the Strategy $3,214, $402,457 and $1,123 in front-end sales charges, Rule 12b-1 and CDSC fees, respectively.16
AllianceBernstein Investments, Inc. (“ABI”), an affiliate of the Adviser, is the Strategy’s principal underwriter. ABI and the Adviser have disclosed in the Strategy’s prospectus that they may make revenue sharing payments from their own resources, in addition to revenues derived from sales loads and Rule 12b-1 fees, to firms that sell shares of the Strategy. In 2013, ABI paid approximately 0.05%
| 16 | As a result of discussions between the Board and the Adviser, ABI is planning to phase into reductions of the Strategy’s Class A shares Rule 12b-1 fee payment rate from 0.30% to 0.25% effective on February 1, 2016. |
| 90 | • ALLIANCEBERNSTEIN BOND INFLATION STRATEGY |
of the average monthly assets of the AllianceBernstein Mutual Funds or approximately $19.4 million for distribution services and educational support (revenue sharing payments).
Fees and reimbursements for out of pocket expenses charged by AllianceBernstein Investor Services, Inc. (“ABIS”), the affiliated transfer agent for the Strategy, are charged on a per account basis, based on the level of service provided and the class of share held by the account. ABIS also receives a fee per shareholder sub-account for each account maintained by an intermediary on an omnibus basis. During the Strategy’s most recently completed fiscal year, ABIS received $24,863 in fees from the Strategy.
| V. | POSSIBLE ECONOMIES OF SCALE |
The Adviser has indicated that economies of scale are being shared with shareholders through pricing to scale, breakpoints, fee reductions/waivers and enhancement to services.
In May 2012, an independent consultant, retained by the Senior Officer, provided the Board of Directors information on the Adviser’s firm-wide average costs from 2005 through 2011 and the potential economies of scale. The independent consultant noted that from 2005 through 2007 the Adviser experienced significant growth in assets under management (“AUM”). During this period, operating expenses increased, in part to keep up with growth, and in part reflecting market returns. However, from 2008 through the first quarter of 2009, AUM rapidly and significantly decreased due to declines in market value and client withdrawals. When AUM rapidly decreased, some operating expenses categories, including base compensation and office space, adjusted more slowly during this period, resulting in an increase in average costs. Since 2009, AUM has experienced less significant changes. The independent consultant noted that changes in operating expenses reflect changes in business composition and business practices in response to changes in financial markets. Finally, the independent consultant concluded that the increase in average cost and the decline in net operating margin across the Adviser since late 2008 are inconsistent with the view that there are currently reductions in average costs due to economies of scale that can be shared with the AllianceBernstein Mutual Funds managed by the Adviser through lower fees.
Previously, in February 2008, the independent consultant provided the Board of Directors an update of the Deli17 study on advisory fees and various fund characteristics.18 The independent consultant first reiterated the results of his previous
| 17 | The Deli study, originally published in 2002 based on 1997 data and updated for the February 2008 Presentation, may be of diminished value due to the age of the data used in the presentation and the changes experienced in the industry since 2008. |
| 18 | As mentioned previously, the Supreme Court cautioned against accepting mutual fund fee comparisons without careful scrutiny since the fees may not be the product of negotiations conducted at arm’s length. See Jones v. Harris at 1429. |
| ALLIANCEBERNSTEIN BOND INFLATION STRATEGY • | 91 |
two dimensional comparison analysis (fund size and family size) with the Board of Directors.19 The independent consultant then discussed the results of the regression model that was utilized to study the effects of various factors on advisory fees. The regression model output indicated that the bulk of the variation in fees predicted were explained by various factors, but substantially by fund AUM, family AUM, index fund indicator and investment style. The independent consultant also compared the advisory fees of the AllianceBernstein Mutual Funds to similar funds managed by 19 other large asset managers, regardless of the fund size and each Adviser’s proportion of mutual fund assets to non-mutual fund assets.
| VI. | NATURE AND QUALITY OF THE ADVISER’S SERVICES INCLUDING THE PERFORMANCE OF THE PORTFOLIO. |
With assets under management of approximately $473 billion as of September 30, 2014, the Adviser has the investment experience to manage and provide non-investment services (described in Section I) to the Strategy.
The information below shows the 1 and 3 year performance return and rankings of the Strategy20 relative to its Lipper Performance Group (“PG”) and Lipper Performance Universe (“PU”)21 for the periods ended July 31, 2014.22
| Strategy | Strategy Return (%) | PG Median (%) | PU Median (%) | PG Rank | PU Rank | |||||||||||||
| Bond Inflation Strategy | ||||||||||||||||||
1 year | 3.16 | 3.45 | 3.09 | 7/10 | 14/28 | |||||||||||||
3 year | 1.45 | 1.50 | 1.46 | 6/9 | 14/26 | |||||||||||||
| 19 | The two dimensional analysis showed patterns of lower advisory fees for funds with larger asset sizes and funds from larger family sizes compared to funds with smaller asset sizes and funds from smaller family sizes, which according to the independent consultant is indicative of a sharing of economies of scale and scope. However, in less liquid and active markets, such is not the case, as the empirical analysis showed potential for diseconomies of scale in those markets. The empirical analysis also showed diminishing economies of scale and scope as funds surpassed a certain high level of assets. |
| 20 | The performance returns and rankings are for the Class A shares of the Strategy. The performance returns of the Strategy were provided Lipper. |
| 21 | The Strategy’s PG is identical to the Strategy’s EG. The Strategy’s PU is not identical to the Strategy’s EU as the criteria for including/excluding a strategy in/from a PU are somewhat different from that of an EU. |
| 22 | The current Lipper investment classification/objective dictates the PG and PU throughout the life of the Strategy even if the Strategy may have had a different investment classification/objective at different points in time. |
| 92 | • ALLIANCEBERNSTEIN BOND INFLATION STRATEGY |
Set forth below are the 1, 3 year and since inception net performance returns of the Strategy (in bold)23 versus its benchmark.24 Strategy and benchmark volatility and reward-to-variability ratio (“Sharpe Ratio”) information is also shown.25
| Periods Ending July 31, 2014 Annualized Performance | ||||||||||||||||||||||||
| Since Inception (%) | Annualized | Risk Period (Year) | ||||||||||||||||||||||
| 1 Year (%) | 3 Year (%) | Volatility (%) | Sharpe (%) | |||||||||||||||||||||
| Bond Inflation Strategy | 3.16 | 1.45 | 3.64 | 3.97 | 0.36 | 3 | ||||||||||||||||||
| Barclays Capital 1-10yr TIPS Index | 2.39 | 1.26 | 3.39 | 3.55 | 0.35 | 3 | ||||||||||||||||||
| Inception Date: January 26, 2010 | ||||||||||||||||||||||||
CONCLUSION:
Based on the factors discussed above the Senior Officer’s conclusion is that the proposed advisory fee for the Strategy is reasonable and within the range of what would have been negotiated at arm’s-length in light of all the surrounding circumstances. This conclusion in respect of the Strategy is based on an evaluation of all of these factors and no single factor was dispositive.
Dated: November 18, 2014
| 23 | The performance returns and risk measures shown in the table are for the Class A shares of the Strategy. |
| 24 | The Adviser provided Strategy and benchmark performance return information for the periods through July 31, 2014. |
| 25 | Strategy and benchmark volatility and Sharpe Ratio information was obtained through Lipper LANA, a database maintained by Lipper. Volatility is a statistical measure of the tendency of a market price or yield to vary over time. A Sharpe Ratio is a risk adjusted measure of return that divides a fund’s return in excess of the riskless return by the fund’s standard deviation. A strategy with a greater volatility would be viewed as more risky than a strategy with equivalent performance but lower volatility; for that reason, a greater return would be demanded for the more risky fund. A strategy with a higher Sharpe Ratio would be viewed as better performing than a strategy with a lower Sharpe Ratio. |
| ALLIANCEBERNSTEIN BOND INFLATION STRATEGY • | 93 |
THIS PAGE IS NOT PART OF THE SHAREHOLDER REPORT OR THE FINANCIAL STATEMENTS
ALLIANCEBERNSTEIN FAMILY OF FUNDS
US Equity
US Core
Core Opportunities Fund
Select US Equity Portfolio
US Growth
Concentrated Growth Fund
Discovery Growth Fund
Growth Fund
Large Cap Growth Fund
Small Cap Growth Portfolio
US Value
Discovery Value Fund
Equity Income Fund
Growth & Income Fund
Value Fund
International/Global Equity
International/Global Core
Global Equity & Covered Call Strategy Fund
Global Thematic Growth Fund
International Portfolio
Tax-Managed International Portfolio
International/Global Growth
International Growth Fund
International/Global Value
International Value Fund
Fixed Income
Municipal
High Income Municipal Portfolio
Intermediate California Portfolio
Intermediate Diversified Portfolio
Intermediate New York Portfolio
Municipal Bond Inflation Strategy
Tax-Aware Fixed Income Portfolio
National Portfolio
Arizona Portfolio
California Portfolio
Massachusetts Portfolio
Michigan Portfolio
Minnesota Portfolio
New Jersey Portfolio
New York Portfolio
Ohio Portfolio
Pennsylvania Portfolio
Virginia Portfolio
Taxable
Bond Inflation Strategy
Global Bond Fund
Fixed Income (continued)
Taxable
High Income Fund
High Yield Portfolio
Intermediate Bond Portfolio
Limited Duration High Income Portfolio
Short Duration Portfolio
Alternatives
All Market Real Return Portfolio*
Credit Long/Short Portfolio
Global Real Estate Investment Fund
Long/Short Multi-Manager Fund
Market Neutral Strategy-U.S.
Multi-Manager Alternative Strategies Fund
Select US Long/Short Portfolio
Unconstrained Bond Fund
Multi-Asset
All Market Growth Portfolio*
Emerging Markets Multi-Asset Portfolio
Global Risk Allocation Fund
Retirement Strategies
2000 Retirement Strategy
2005 Retirement Strategy
2010 Retirement Strategy
2015 Retirement Strategy
2020 Retirement Strategy
2025 Retirement Strategy
2030 Retirement Strategy
2035 Retirement Strategy
2040 Retirement Strategy
2045 Retirement Strategy
2050 Retirement Strategy
2055 Retirement Strategy
Wealth Strategies
Balanced Wealth Strategy
Conservative Wealth Strategy
Wealth Appreciation Strategy
Tax-Managed Balanced Wealth Strategy
Tax-Managed Conservative Wealth Strategy
Tax-Managed Wealth Appreciation Strategy
Closed-End Funds
Alliance California Municipal Income Fund
Alliance New York Municipal Income Fund
AllianceBernstein Global High Income Fund
AllianceBernstein Income Fund
AllianceBernstein Multi-Manager Alternative Fund
AllianceBernstein National Municipal Income Fund
We also offer Exchange Reserves, which serves as the money market fund exchange vehicle for the AllianceBernstein mutual funds. An investment in Exchange Reserves is not a deposit in a bank and is not insured or guaranteed by the Federal Deposit Insurance Corporation or any other government agency. Although the Fund seeks to preserve the value of your investment at $1.00 per share, it is possible to lose money by investing in the Fund.
Investors should consider the investment objectives, risks, charges and expenses of the Fund carefully before investing. For copies of our prospectus or summary prospectus, which contain this and other information, visit us online at www.alliancebernstein.com or contact your AllianceBernstein investments representative. Please read the prospectus and/or summary prospectus carefully before investing.
* Prior to December 15, 2014, All Market Growth Portfolio was named Dynamic All Market Fund; All Market Real Return Portfolio was named Real Asset Strategy.
| 94 | • ALLIANCEBERNSTEIN BOND INFLATION STRATEGY |
AllianceBernstein Family of Funds
NOTES
| ALLIANCEBERNSTEIN BOND INFLATION STRATEGY • | 95 |
NOTES
| 96 | • ALLIANCEBERNSTEIN BOND INFLATION STRATEGY |
NOTES
| ALLIANCEBERNSTEIN BOND INFLATION STRATEGY • | 97 |
NOTES
| 98 | • ALLIANCEBERNSTEIN BOND INFLATION STRATEGY |
NOTES
| ALLIANCEBERNSTEIN BOND INFLATION STRATEGY • | 99 |
NOTES
| 100 | • ALLIANCEBERNSTEIN BOND INFLATION STRATEGY |
ALLIANCEBERNSTEIN BOND INFLATION STRATEGY
1345 Avenue of the Americas
New York, NY 10105
800.221.5672
| BIS-0151-1014 |  | |
ANNUAL REPORT
AllianceBernstein
Credit Long/Short Portfolio
October 31, 2014
Annual Report

Investment Products Offered
• Are Not FDIC Insured • May Lose Value • Are Not Bank Guaranteed |
Investors should consider the investment objectives, risks, charges and expenses of the Fund carefully before investing. For copies of our prospectus or summary prospectus, which contain this and other information, visit us online at www.alliancebernstein.com or contact your AllianceBernstein Investments representative. Please read the prospectus and/or summary prospectus carefully before investing.
This shareholder report must be preceded or accompanied by the Fund’s prospectus for individuals who are not current shareholders of the Fund.
You may obtain a description of the Fund’s proxy voting policies and procedures, and information regarding how the Fund voted proxies relating to portfolio securities during the most recent 12-month period ended June 30, without charge. Simply visit AllianceBernstein’s website at www.alliancebernstein.com, or go to the Securities and Exchange Commission’s (the “Commission”) website at www.sec.gov, or call AllianceBernstein at (800) 227-4618.
The Fund files its complete schedule of portfolio holdings with the Commission for the first and third quarters of each fiscal year on Form N-Q. The Fund’s Forms N-Q are available on the Commission’s website at www.sec.gov. The Fund’s Forms N-Q may also be reviewed and copied at the Commission’s Public Reference Room in Washington, DC; information on the operation of the Public Reference Room may be obtained by calling (800) SEC-0330. AllianceBernstein publishes full portfolio holdings for the Fund monthly at www.alliancebernstein.com.
AllianceBernstein Investments, Inc. (ABI) is the distributor of the AllianceBernstein family of mutual funds. ABI is a member of FINRA and is an affiliate of AllianceBernstein L.P., the manager of the funds.
AllianceBernstein® and the AB Logo are registered trademarks and service marks used by permission of the owner, AllianceBernstein L.P.
December 12, 2014
Annual Report
This report provides management’s discussion of fund performance for AllianceBernstein Credit Long/Short Portfolio (the “Fund”) for the annual reporting period ended October 31, 2014. The Fund commenced operations on May 7, 2014.
Investment Objectives and Policies
The Fund’s investment objective is to seek absolute return over a full market cycle. At least 80% of the Fund’s net assets will under normal circumstances be invested in long and short positions in credit-related instruments. For purposes of this 80% requirement, credit-related instruments will include any type of fixed-income security, such as corporate bonds, convertible fixed-income securities, preferred stocks, U.S. government and agency securities, securities of foreign governments and supranational entities, mortgage-related and asset-backed securities, and loan participations. It is expected that a substantial portion of the Fund’s long and short positions will relate to fixed-income securities rated below investment grade (commonly known as “junk bonds”).
In selecting securities for purchase or sale by the Fund and securities for the Fund to take short positions in, AllianceBernstein L.P. (the “Adviser”) will attempt to take advantage of inefficiencies that it believes exist in the global debt markets. These inefficiencies arise from investor behavior, market complexity, and the investment limitations to which investors are subject. The Adviser will combine quantitative analysis with fundamental credit and
economic research in seeking to exploit these inefficiencies.
Under normal market conditions, the net exposure of the Fund (long exposure minus short exposure) will range between 150% and -150%. For example, the Fund may hold long positions in fixed-income securities with a value equal to 95% of its net assets and hold short positions equal to 75% of its net assets, resulting in 20% net long exposure. The Fund may also take long and short positions in equity securities.
Short positions may be effectuated through derivative instruments or through conventional short sales. When the Fund sells securities short, it sells a security that it does not own (but has borrowed) at its current market price in anticipation that the price of the security will decline. To complete, or close out, the short sale transaction, the Fund buys the same security in the market at a later date and returns it to the lender. The Adviser expects that the Fund’s long positions will be effectuated both through derivatives and actual purchases of fixed-income securities. The Fund may invest in fixed-income securities with a range of maturities from short- to long-term, and expects to maintain a weighted average duration of between -3 and 6 years. The Fund would have a negative duration when the Adviser expects the value of the Fund’s assets to increase as interest rates rise.
While the Fund’s investments will be focused on U.S. dollar-denominated securities, the Fund may invest to a
| ALLIANCEBERNSTEIN CREDIT LONG/SHORT PORTFOLIO • | 1 |
lesser extent in securities denominated in foreign currencies. Fluctuations in currency exchange rates can have a dramatic impact on the returns of fixed-income securities. While the Adviser may hedge the foreign currency exposure resulting from the Fund’s security positions through the use of currency-related derivatives, it is not required to do so. The Fund may take long and short positions in currencies (or related derivatives) independent of any such security positions, including taking a position in a currency when it does not hold any securities denominated in that currency.
The Fund expects to use derivatives, such as options, futures, forwards and swaps, to a significant extent. Derivatives may provide a more efficient and economical exposure to market segments than direct investments, and may also be a more efficient way to alter the Fund’s exposure. The Fund may, for example, use credit default, interest rate and total return swaps to establish exposure to the fixed-income markets or particular fixed-income securities and, as noted above, may use currency derivatives to hedge foreign currency exposure.
The Fund may borrow money and enter into transactions such as reverse repurchase agreements that are similar to borrowings (in addition to the borrowing of securities inherent in short sale transactions) for investment purposes. As a result of these borrowing transactions and the use of derivatives, the Fund will at times be highly leveraged, with aggregate exposure (long and short) substantially in excess of its net assets.
Investment Results
The table on page 6 shows the Fund’s performance compared to its benchmark, the Bank of America Merrill Lynch (“BofA ML”) 3-Month U.S. Treasury Bill Index, for the period since the Fund’s inception through October 31, 2014.
Since inception, all share classes of the Fund outperformed the benchmark. The outperformance was primarily driven by security selection as single name longs generally outperformed single name shorts; the Fund held a number of financial sector bonds, both senior and subordinated issues. The Fund’s employment of capital structure arbitrage (going long one security in a company’s capital structure while at the same time going short another security in the same company’s capital structure) and relative value pair trades (matching a long position with a short position in a pair of highly correlated instruments such as two bonds) added to performance.
During the reporting period, the Fund utilized derivatives including Treasury futures, written options and total return swaps for hedging and investment purposes, and interest rate swaps for hedging purposes, which detracted from performance; currency forwards and purchased options were utilized for hedging and investment purposes, which had an immaterial impact; and credit default swaps for hedging and investment purposes contributed to performance.
| 2 | • ALLIANCEBERNSTEIN CREDIT LONG/SHORT PORTFOLIO |
Market Review and Investment Strategy
Global credit markets were somewhat volatile during the reporting period. In June, yields hit all-time lows for U.S. high yield assets, followed by periods of selloff and recovery from August through October. In general, spreads widened over the period. Energy-related names particularly sold off during the period due to falling oil prices.
The Fund’s Investment Policy Team (the “Team”) focused on single-name relative value between long and short credit positions, by taking long positions
on securities considered undervalued and short positions on securities considered overvalued. The Fund maintained long positions in a variety of undervalued credit sectors, including subordinated financials and investment-grade emerging-market debt. Short positions included speculative grade energy bonds. The Team began the period with very little net exposure to the market, and opportunistically increased exposure during periods of market stress, exiting the period with modest market exposure to the global credit market.
| ALLIANCEBERNSTEIN CREDIT LONG/SHORT PORTFOLIO • | 3 |
DISCLOSURES AND RISKS
Benchmark Disclosure
The unmanaged Bank of America Merrill Lynch® 3-Month U.S. Treasury Bill Index does not reflect fees and expenses associated with the active management of a mutual fund portfolio. The BofA ML 3-Month U.S. Treasury Bill Index measures the performance of Treasury securities maturing in 90 days. An investor cannot invest directly in an index, and its results are not indicative of the performance for any specific investment, including the Fund.
A Word About Risk
Market Risk: The value of the Fund’s assets will fluctuate as the bond or stock market fluctuates. The value of its investments may decline, sometimes rapidly and unpredictably, simply because of economic changes or other events that affect large portions of the market.
Credit Risk: An issuer or guarantor of a fixed-income security, or the counterparty to a derivatives or other contract, may be unable or unwilling to make timely payments of interest or principal, or to otherwise honor its obligations. The issuer or guarantor may default, causing a loss of the full principal amount of a security. The degree of risk for a particular security may be reflected in its credit rating. There is the possibility that the credit rating of a fixed-income security may be downgraded after purchase, which may adversely affect the value of the security.
Below Investment Grade Securities Risk: Investments in fixed-income securities with lower ratings are subject to a higher probability that an issuer will default or fail to meet its payment obligations. These securities may be subject to greater price volatility due to such factors as specific corporate developments, negative perceptions of the junk bond market generally and less secondary market liquidity. These securities are often able to be “called” or repurchased by the issuer prior to their maturity date, forcing the Fund to reinvest the proceeds, possibly at a lower rate of return.
Inflation Risk: This is the risk that the value of assets or income from investments will be less in the future as inflation decreases the value of money. As inflation increases, the value of the Fund’s assets can decline as can the value of the Fund’s distributions. This risk is significantly greater if the Fund invests a significant portion of its assets in fixed-income securities with longer maturities.
Interest Rate Risk: Changes in interest rates will affect the value of investments in fixed-income securities. When interest rates rise, the value of investments in fixed-income securities tends to fall and this decrease in value may not be offset by higher income from new investments. Interest rate risk is generally greater for fixed-income securities with longer maturities or durations. Duration is a measure that relates the expected price volatility of a fixed-income security to changes in interest rates. The duration of a fixed-income security may be shorter than or equal to full maturity of a fixed-income security. A fixed-income security with a duration of three years will decrease in value by approximately 3% if interest rates increase by 1%.
Derivatives Risk: Derivatives may be illiquid, difficult to price, and leveraged so that small changes may produce disproportionate losses for the Fund, and may be subject to counterparty risk to a greater degree than more traditional investments.
Leverage Risk: To the extent the Fund uses leveraging techniques, its net asset value (“NAV”) may be more volatile because leverage tends to exaggerate the effect of changes in interest rates and any increase or decrease in the value of the Fund’s investments.
Short Sale Risk: Short sales involve the risk that the Fund will incur a loss by subsequently buying a security at a higher price than the price at which it sold the security. The amount of such loss is theoretically unlimited, as it will be based on the
(Disclosures, Risks and Note about Historical Performance continued on next page)
| 4 | • ALLIANCEBERNSTEIN CREDIT LONG/SHORT PORTFOLIO |
Disclosures and Risks
DISCLOSURES AND RISKS
(continued from previous page)
increase in value of the security sold short. In contrast, the risk of loss from a long position is limited to the Fund’s investment in the security, because the price of the security cannot fall below zero. The Fund may not always be able to close out a short position on favorable terms.
Foreign (Non-U.S.) Risk: Investments in securities of non-U.S. issuers may involve more risk than those of U.S. issuers. These securities may fluctuate more widely in price and may be less liquid due to adverse market, economic, political, regulatory or other factors.
Emerging Market Risk: Investments in emerging market countries may have more risk because the markets are less developed and less liquid as well as being subject to increased economic, political, regulatory or other uncertainties.
Currency Risk: Fluctuations in currency exchange rates may negatively affect the value of the Fund’s investments or reduce its returns.
Diversification Risk: The Fund may have more risk because it is “non-diversified,” meaning that it can invest more of its assets in a smaller number of issuers. Accordingly, changes in the value of a single security may have a more significant effect, either negative or positive, on the Fund’s NAV.
Management Risk: The Fund is subject to management risk because it is an actively-managed investment fund. The Adviser will apply its investment techniques and risk analyses in making investment decisions, but there is no guarantee that its techniques will produce the intended results.
These risks are fully discussed in the Fund’s prospectus.
An Important Note About Historical Performance
The investment return and principal value of an investment in the Fund will fluctuate, so that shares, when redeemed, may be worth more or less than their original cost. Performance shown on the following pages represents past performance and does not guarantee future results. Current performance may be lower or higher than the performance information shown. You may obtain performance information current to the most recent month-end by visiting www.alliancebernstein.com. The Fund has been in operation only for a short period of time, and therefore has a very limited historical performance period. This limited performance period is unlikely to be representative of the performance the Fund will achieve over a longer period.
All fees and expenses related to the operation of the Fund have been deducted. NAV returns do not reflect sales charges; if sales charges were reflected, the Fund’s quoted performance would be lower. SEC returns reflect the applicable sales charges for each share class: a 4.25% maximum front-end sales charge for Class A shares and a 1% 1-year contingent deferred sales charge for Class C shares. Returns for the different share classes will vary due to different expenses associated with each class. Performance assumes reinvestment of distributions and does not account for taxes.
| ALLIANCEBERNSTEIN CREDIT LONG/SHORT PORTFOLIO • | 5 |
Disclosures and Risks
HISTORICAL PERFORMANCE
THE FUND VS. ITS BENCHMARK PERIODS ENDED OCTOBER 31, 2014 (unaudited) | NAV Returns | |||||
| Since Inception* | ||||||
| AllianceBernstein Credit Long/Short Portfolio | ||||||
Class A | 0.57% | |||||
| ||||||
Class C | 0.21% | |||||
| ||||||
Advisor Class† | 0.70% | |||||
| ||||||
| BofA ML 3-Month U.S. Treasury Bill Index | 0.02% | |||||
| ||||||
* Inception date: 5/7/2014.
† Please note that these share classes are for investors purchasing shares through accounts established under certain fee-based programs sponsored and maintained by certain broker-dealers and financial intermediaries, institutional pension plans and/or investment advisory clients of, and certain other persons associated with, the Adviser and its affiliates or the Fund. | ||||||
GROWTH OF A $10,000 INVESTMENT IN THE FUND 5/7/14* TO 10/31/14 (unaudited)
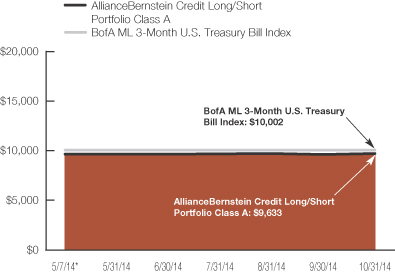
This chart illustrates the total value of an assumed $10,000 investment in AllianceBernstein Credit Long/Short Portfolio Class A shares (from 5/7/14 to 10/31/14) as compared to the performance of the Fund’s benchmark. The chart reflects the deduction of the maximum 4.25% sales charge from the initial $10,000 investment in the Strategy and assumes the reinvestment of dividends and capital gains distributions.
| * | Inception date: 5/7/2014. |
See Disclosures, Risks and Note about Historical Performance on pages 4-5.
(Historical Performance continued on next page)
| 6 | • ALLIANCEBERNSTEIN CREDIT LONG/SHORT PORTFOLIO |
Historical Performance
HISTORICAL PERFORMANCE
(continued from previous page)
| AVERAGE ANNUAL RETURNS AS OF OCTOBER 31, 2014 (unaudited) | ||||||||||||
| NAV Returns | SEC Returns (reflects applicable sales charges) | SEC Yields* | ||||||||||
| Class A Shares | 7.46 | % | ||||||||||
Since Inception† | 0.57 | % | -3.67 | % | ||||||||
| Class C Shares | 1.12 | % | ||||||||||
Since Inception† | 0.21 | % | -0.79 | % | ||||||||
| Advisor Class Shares‡ | 3.94 | % | ||||||||||
Since Inception† | 0.70 | % | 0.70 | % | ||||||||
The Fund’s prospectus fee table shows the Fund’s total annual operating expense ratios as 1.76%, 2.53% and 1.51% for Class A, Class C and Advisor Class shares, respectively, gross of any fee waivers or expense reimbursements. Contractual fee waivers and/or expense reimbursements limit the Fund’s annual operating expense ratios exclusive of interest expense, dividend expense, borrowing costs and brokerage expense on securities sold short to 1.35%, 2.10% and 1.10% for Class A, Class C and Advisor Class shares, respectively. These waivers/reimbursements may not be terminated before June 19, 2015 and may be extended by the Adviser for additional one-year terms. Absent reimbursements or waivers, performance would have been lower. The Financial Highlights section of this report sets forth expense ratio data for the current reporting period; the expense ratios shown above may differ from the expense ratios in the Financial Highlights sections since they are based on different time periods.
| * | SEC yields are calculated based on SEC guidelines for the 30-day period ended October 31, 2014. |
| † | Inception date: 5/7/2014. |
| ‡ | These share classes are offered at NAV to eligible investors and their SEC returns are the same as their NAV returns. Please note that these share classes are for investors purchasing shares through accounts established under certain fee-based programs sponsored and maintained by certain broker-dealers and financial intermediaries, institutional pension plans and/or investment advisory clients of, and certain other persons associated with, the Adviser and its affiliates or the Fund. The inception date is listed above. |
See Disclosures, Risks and Note about Historical Performance on pages 4-5.
(Historical Performance continued on next page)
| ALLIANCEBERNSTEIN CREDIT LONG/SHORT PORTFOLIO • | 7 |
Historical Performance
HISTORICAL PERFORMANCE
(continued from previous page)
SEC AVERAGE ANNUAL RETURNS AS OF THE MOST RECENT CALENDAR QUARTER-END | ||||
SEC Returns (reflects applicable | ||||
| Class A Shares | ||||
Since Inception† | -4.54 | % | ||
| Class C Shares | ||||
Since Inception† | -1.68 | % | ||
| Advisor Class Shares‡ | ||||
Since Inception† | -0.30 | % | ||
| † | Inception date: 5/7/2014. |
| ‡ | These share classes are offered at NAV to eligible investors and their SEC returns are the same as their NAV returns. Please note that these share classes are for investors purchasing shares through accounts established under certain fee-based programs sponsored and maintained by certain broker-dealers and financial intermediaries, institutional pension plans and/or investment advisory clients of, and certain other persons associated with, the Adviser and its affiliates or the Fund. The inception date is listed above. |
See Disclosures, Risks and Note about Historical Performance on pages 4-5.
| 8 | • ALLIANCEBERNSTEIN CREDIT LONG/SHORT PORTFOLIO |
Historical Performance
EXPENSE EXAMPLE
(unaudited)
As a shareholder of a mutual fund, you may incur two types of costs: (1) transaction costs, including sales charges (loads) on purchase payments, contingent deferred sales charges on redemptions and (2) ongoing costs, including management fees; distribution (12b-1) fees; and other fund expenses. This example is intended to help you understand your ongoing costs (in dollars) of investing in the Fund and to compare these costs with the ongoing costs of investing in other mutual funds.
The Example is based on an investment of $1,000 invested at the beginning of the period and held for the entire period as indicated below.
Actual Expenses
The table below provides information about actual account values and actual expenses. You may use the information in this line, together with the amount you invested, to estimate the expenses that you paid over the period. Simply divide your account value by $1,000 (for example, an $8,600 account value divided by $1,000 = 8.6), then multiply the result by the number in the first line under the heading entitled “Expenses Paid During Period” to estimate the expenses you paid on your account during this period.
Hypothetical Example for Comparison Purposes
The table below provides information about hypothetical account values and hypothetical expenses based on the Fund’s actual expense ratio and an assumed annual rate of return of 5% before expenses, which is not the Fund’s actual return. The hypothetical account values and expenses may not be used to estimate the actual ending account balance or expenses you paid for the period. You may use this information to compare the ongoing costs of investing in the Fund and other funds by comparing this 5% hypothetical example with the 5% hypothetical examples that appear in the shareholder reports of other funds.
Please note that the expenses shown in the table are meant to highlight your ongoing costs only and do not reflect any transactional costs, such as sales charges (loads), or contingent deferred sales charges on redemptions. Therefore, the hypothetical example is useful in comparing ongoing costs only, and will not help you determine the relative total costs of owning different funds. In addition, if these transactional costs were included, your costs would have been higher.
| Beginning Account Value May 7, 2014+ | Ending Account Value October 31, 2014 | Expenses Paid During Period* | Annualized Expense Ratio* | |||||||||||||
| Class A | ||||||||||||||||
Actual | $ | 1,000 | $ | 1,005.70 | $ | 17.41 | 3.56 | % | ||||||||
Hypothetical** | $ | 1,000 | $ | 1,007.02 | $ | 17.42 | 3.56 | % | ||||||||
| Class C | ||||||||||||||||
Actual | $ | 1,000 | $ | 1,002.10 | $ | 20.41 | 4.18 | % | ||||||||
Hypothetical** | $ | 1,000 | $ | 1,004.00 | $ | 20.43 | 4.18 | % | ||||||||
| Advisor Class | ||||||||||||||||
Actual | $ | 1,000 | $ | 1,007.00 | $ | 13.65 | 2.79 | % | ||||||||
Hypothetical** | $ | 1,000 | $ | 1,010.78 | $ | 13.68 | 2.79 | % | ||||||||
| + | Commencement of operations. |
| * | Expenses are equal to the Strategy’s annualized expense ratio, multiplied by the average account value over the period, multiplied by 177/365 (to reflect the one-half year period). |
| ** | Assumes 5% annual return before expenses. |
| ALLIANCEBERNSTEIN CREDIT LONG/SHORT PORTFOLIO • | 9 |
Expense Example
PORTFOLIO SUMMARY
October 31, 2014 (unaudited)
PORTFOLIO STATISTICS
Net Assets ($mil): $21.0
SECTOR BREAKDOWN*
| Long | Short | |||||||
Bank Loans | 2.2 | % | — | % | ||||
Collateralized Mortgage Obligations | 3.3 | — | ||||||
Common Stocks | 5.4 | — | ||||||
Corporates – Investment Grade | 6.1 | -6.4 | ||||||
Corporates – Non-Investment Grade | 57.9 | -27.2 | ||||||
Emerging Markets – Corporate Bonds | 3.1 | — | ||||||
Emerging Markets – Sovereigns | 0.4 | — | ||||||
Governments – Treasuries | 0.4 | — | ||||||
Options Purchased – Calls | 0.3 | — | ||||||
Options Purchased – Puts | 0.3 | — | ||||||
Preferred Stocks | 3.8 | — | ||||||
Quasi-Sovereigns | 2.7 | -2.9 | ||||||
NET COUNTRY EXPOSURE (TOP THREE)*
| Long | ||||
United States | 31.9 | % | ||
United Kingdom | 4.7 | |||
Brazil | 2.7 | |||
| Short | ||||
Italy | -1.7 | % | ||
Germany | -1.0 | |||
Spain | -0.8 | |||
TEN LARGEST HOLDINGS*
| Long | ||||
| Company | ||||
Petroleos de Venezuela SA | 2.7 | % | ||
Ally Financial, Inc. | 1.9 | |||
Lloyds Bank PLC | 1.9 | |||
Laureate Education, Inc. | 1.9 | |||
GMAC Capital Trust I | 1.8 | |||
Yamana Gold, Inc. | 1.5 | |||
T-Mobile USA, Inc. | 1.5 | |||
Athlon Holdings LP/Athlon Finance Corp. | 1.4 | |||
Calpine Corp. | 1.4 | |||
Wind Acquisition Finance SA | 1.4 | |||
| Short | ||||
| Company | ||||
Petroleos de Venezuela SA | -2.9 | % | ||
Intesa Sanpaolo SpA | -2.1 | |||
Glencore Funding LLC | -1.9 | |||
Ally Financial, Inc. | -1.9 | |||
SandRidge Energy, Inc. | -1.7 | |||
Barrick Gold Corp. | -1.4 | |||
Huntsman International LLC | -1.2 | |||
INEOS Group Holdings SA | -1.2 | |||
Chrysler Group LLC / CG Co-Issuer, Inc. | -1.1 | |||
RWE AG | -1.0 | |||
| * | Holdings are expressed as a percentage of total net assets and may vary over time. The Portfolio also enters into derivative transactions, which may be used for hedging or investment purposes (see “Portfolio of Investments” section of the report for additional details). |
| 10 | • ALLIANCEBERNSTEIN CREDIT LONG/SHORT PORTFOLIO |
Portfolio Summary, Net Country Exposure (Top Three) and Ten Largest Holdings
PORTFOLIO OF INVESTMENTS
October 31, 2014
| Principal Amount (000) | U.S. $ Value | |||||||||
| ||||||||||
CORPORATES - NON-INVESTMENT GRADE – 58.0% |
| |||||||||
Industrial – 42.1% | ||||||||||
Basic – 3.7% | ||||||||||
ArcelorMittal | U.S.$ | 196 | $ | 202,370 | ||||||
Cliffs Natural Resources, Inc. | 148 | 109,520 | ||||||||
FMG Resources August 206 Pty Ltd. | 91 | 94,413 | ||||||||
Lundin Mining Corp. | 100 | 104,000 | ||||||||
Molycorp, Inc. | 78 | 55,770 | ||||||||
Smurfit Kappa Acquisitions | 200 | 207,020 | ||||||||
|
| |||||||||
| 773,093 | ||||||||||
|
| |||||||||
Capital Goods – 1.4% | ||||||||||
Beverage Packaging Holdings Luxembourg II SA/Beverage Packaging Holdings II Issuer | 97 | 96,758 | ||||||||
Bombardier, Inc. | 100 | 102,500 | ||||||||
United Rentals North America, Inc. | 100 | 109,000 | ||||||||
|
| |||||||||
| 308,258 | ||||||||||
|
| |||||||||
Communications - Media – 5.2% | ||||||||||
CCO Holdings LLC/CCO Holdings Capital Corp. | 58 | 59,377 | ||||||||
Gannett Co., Inc. | 32 | 32,240 | ||||||||
5.50%, 9/15/24(a) | 20 | 20,650 | ||||||||
iHeartCommunications, Inc. | 104 | 94,380 | ||||||||
9.00%, 9/15/22(a) | 50 | 50,250 | ||||||||
Intelsat Jackson Holdings SA | 220 | 220,550 | ||||||||
Sirius XM Radio, Inc. | 196 | 204,330 | ||||||||
Virgin Media Finance PLC | 200 | 208,000 | ||||||||
Ziggo Bond Co. BV | EUR | 145 | 196,698 | |||||||
|
| |||||||||
| 1,086,475 | ||||||||||
|
| |||||||||
Communications - Telecommunications – 6.3% | ||||||||||
Altice SA | U.S.$ | 200 | 210,000 | |||||||
| ALLIANCEBERNSTEIN CREDIT LONG/SHORT PORTFOLIO • | 11 |
Portfolio of Investments
| Principal Amount (000) | U.S. $ Value | |||||||||
| ||||||||||
CenturyLink, Inc. | U.S.$ | 102 | $ | 101,745 | ||||||
Frontier Communications Corp. | 99 | 102,960 | ||||||||
Sprint Capital Corp. | 180 | 201,150 | ||||||||
T-Mobile USA, Inc. | 300 | 308,250 | ||||||||
Wind Acquisition Finance SA | 300 | 293,250 | ||||||||
Windstream Corp. | 101 | 101,757 | ||||||||
|
| |||||||||
| 1,319,112 | ||||||||||
|
| |||||||||
Consumer Cyclical - Automotive – 1.8% | ||||||||||
Commercial Vehicle Group, Inc. | 190 | 196,650 | ||||||||
Servus Luxembourg Holding SCA | EUR | 138 | 182,363 | |||||||
|
| |||||||||
| 379,013 | ||||||||||
|
| |||||||||
Consumer Cyclical - Other – 0.5% | ||||||||||
Caesars Growth Properties Holdings LLC/Caesars Growth Properties Finance, Inc. | U.S.$ | 110 | 102,300 | |||||||
|
| |||||||||
Consumer Cyclical - Retailers – 2.0% | ||||||||||
Brighthouse Group PLC | GBP | 112 | 172,000 | |||||||
Cash America International, Inc. | U.S.$ | 120 | 124,800 | |||||||
Men’s Wearhouse, Inc. (The) | 87 | 90,154 | ||||||||
Neiman Marcus Group Ltd. LLC | 27 | 28,890 | ||||||||
|
| |||||||||
| 415,844 | ||||||||||
|
| |||||||||
Consumer Non-Cyclical – 4.9% | ||||||||||
Amsurg Corp. | 74 | 76,673 | ||||||||
CHS/Community Health Systems, Inc. | 96 | 103,440 | ||||||||
HCA, Inc. | 126 | 128,047 | ||||||||
IASIS Healthcare LLC/IASIS Capital Corp. | 100 | 105,500 | ||||||||
Jaguar Holding Co. I | 149 | 152,539 | ||||||||
| 12 | • ALLIANCEBERNSTEIN CREDIT LONG/SHORT PORTFOLIO |
Portfolio of Investments
| Principal Amount (000) | U.S. $ Value | |||||||||
| ||||||||||
MPH Acquisition Holdings LLC | U.S.$ | 97 | $ | 101,486 | ||||||
PC Nextco Holdings LLC/PC Nextco Finance, Inc. | 37 | 37,555 | ||||||||
Pinnacle Merger Sub, Inc. | 90 | 98,100 | ||||||||
Sun Products Corp. (The) | 48 | 35,520 | ||||||||
Tenet Healthcare Corp. | ||||||||||
6.25%, 11/01/18 | 91 | 98,849 | ||||||||
6.875%, 11/15/31 | 100 | 98,000 | ||||||||
|
| |||||||||
| 1,035,709 | ||||||||||
|
| |||||||||
Energy – 10.6% | ||||||||||
Athlon Holdings LP/Athlon Finance Corp. | 275 | 301,125 | ||||||||
EXCO Resources, Inc. | 220 | 191,400 | ||||||||
Global Partners LP/GLP Finance Corp. | 200 | 198,000 | ||||||||
Halcon Resources Corp. | 105 | 87,609 | ||||||||
Jupiter Resources, Inc. | 95 | 83,838 | ||||||||
Linn Energy LLC/Linn Energy Finance Corp. | 193 | 177,560 | ||||||||
Offshore Group Investment Ltd. | 250 | 206,250 | ||||||||
Pacific Drilling SA | 220 | 196,762 | ||||||||
Paragon Offshore PLC | 149 | 113,985 | ||||||||
Regency Energy Partners LP/Regency Energy Finance Corp. | 85 | 86,700 | ||||||||
Sabine Pass Liquefaction LLC | 200 | 206,750 | ||||||||
Southern Star Central Corp. | 200 | 203,000 | ||||||||
Tervita Corp. | 91 | 82,810 | ||||||||
Triangle USA Petroleum Corp. | 100 | 87,500 | ||||||||
|
| |||||||||
| 2,223,289 | ||||||||||
|
| |||||||||
Other Industrial – 2.2% | ||||||||||
General Cable Corp. | 85 | 56,153 | ||||||||
Laureate Education, Inc. | 390 | 401,700 | ||||||||
|
| |||||||||
| 457,853 | ||||||||||
|
| |||||||||
| ALLIANCEBERNSTEIN CREDIT LONG/SHORT PORTFOLIO • | 13 |
Portfolio of Investments
| Principal Amount (000) | U.S. $ Value | |||||||||
| ||||||||||
Services – 0.2% | ||||||||||
IHS, Inc. | U.S.$ | 55 | $ | 55,825 | ||||||
|
| |||||||||
Technology – 3.3% | ||||||||||
Avaya, Inc. | 112 | 98,140 | ||||||||
BMC Software Finance, Inc. | 100 | 95,750 | ||||||||
Brightstar Corp. | 90 | 96,750 | ||||||||
Denali Borrower LLC/Denali Finance Corp. | 194 | 205,761 | ||||||||
Numericable Group SA | 200 | 204,500 | ||||||||
|
| |||||||||
| 700,901 | ||||||||||
|
| |||||||||
| 8,857,672 | ||||||||||
|
| |||||||||
Financial Institutions – 11.1% | ||||||||||
Banking – 8.3% | ||||||||||
ABN AMRO Bank NV | EUR | 71 | 90,086 | |||||||
Ally Financial, Inc. | U.S.$ | 350 | 406,000 | |||||||
Banco Espirito Santo SA | EUR | 100 | 113,034 | |||||||
Bank of America Corp. | U.S.$ | 200 | 205,500 | |||||||
Barclays Bank PLC | EUR | 40 | 48,748 | |||||||
6.86%, 6/15/32(a)(d) | U.S.$ | 73 | 80,848 | |||||||
BNP Paribas SA | 97 | 97,970 | ||||||||
Credit Suisse Group AG | 200 | 213,000 | ||||||||
Danske Bank A/S | GBP | 56 | 92,047 | |||||||
Royal Bank of Scotland PLC (The) | U.S.$ | 85 | 97,146 | |||||||
Societe Generale SA | 200 | 200,000 | ||||||||
UBS Preferred Funding Trust V | 94 | 97,694 | ||||||||
|
| |||||||||
| 1,742,073 | ||||||||||
|
| |||||||||
Brokerage – 1.0% | ||||||||||
GFI Group, Inc. | 180 | 213,525 | ||||||||
|
| |||||||||
| 14 | • ALLIANCEBERNSTEIN CREDIT LONG/SHORT PORTFOLIO |
Portfolio of Investments
| Principal Amount (000) | U.S. $ Value | |||||||||
| ||||||||||
Finance – 1.8% | ||||||||||
Enova International, Inc. | U.S.$ | 96 | $ | 97,680 | ||||||
International Lease Finance Corp. | 156 | 187,200 | ||||||||
TMX Finance LLC/TitleMax Finance Corp. | 94 | 91,650 | ||||||||
|
| |||||||||
| 376,530 | ||||||||||
|
| |||||||||
| 2,332,128 | ||||||||||
|
| |||||||||
Utility – 4.1% | ||||||||||
Electric – 4.1% | ||||||||||
Calpine Corp. | ||||||||||
5.75%, 1/15/25 | 200 | 202,500 | ||||||||
7.875%, 1/15/23(a) | 85 | 94,138 | ||||||||
Dynegy Finance I, Inc./Dynegy Finance II, Inc. | ||||||||||
7.375%, 11/01/22(a) | 115 | 121,612 | ||||||||
7.625%, 11/01/24(a) | 75 | 79,500 | ||||||||
GenOn Energy, Inc. | 97 | 98,212 | ||||||||
NRG Energy, Inc. | ||||||||||
6.25%, 5/01/24(a) | 21 | 21,683 | ||||||||
6.25%, 7/15/22 | 23 | 24,035 | ||||||||
6.625%, 3/15/23 | 42 | 44,310 | ||||||||
RJS Power Holdings LLC | 171 | 170,145 | ||||||||
|
| |||||||||
| 856,135 | ||||||||||
|
| |||||||||
Non Corporate Sectors – 0.7% | ||||||||||
Agencies - Not Government | ||||||||||
CITGO Petroleum Corp. | 132 | 134,310 | ||||||||
|
| |||||||||
Total Corporates – Non-Investment Grade | 12,180,245 | |||||||||
|
| |||||||||
CORPORATES - INVESTMENT GRADE – 6.1% | ||||||||||
Industrial – 2.5% | ||||||||||
Capital Goods – 1.5% | ||||||||||
Yamana Gold, Inc. | 324 | 316,899 | ||||||||
|
| |||||||||
Technology – 1.0% | ||||||||||
Tencent Holdings Ltd. | 200 | 203,356 | ||||||||
|
| |||||||||
| 520,255 | ||||||||||
|
| |||||||||
| ALLIANCEBERNSTEIN CREDIT LONG/SHORT PORTFOLIO • | 15 |
Portfolio of Investments
| Principal Amount (000) | U.S. $ Value | |||||||||
| ||||||||||
Financial Institutions – 2.4% | ||||||||||
Banking – 1.9% | ||||||||||
Lloyds Bank PLC | U.S.$ | 350 | $ | 404,790 | ||||||
|
| |||||||||
Finance – 0.5% | ||||||||||
HSBC Finance Capital Trust IX | 100 | 102,250 | ||||||||
|
| |||||||||
| 507,040 | ||||||||||
|
| |||||||||
Non Corporate Sectors – 1.2% | ||||||||||
ABS - Other – 1.2% | ||||||||||
Rio Oil Finance Trust | 250 | 260,000 | ||||||||
|
| |||||||||
Total Corporates – Investment Grade | 1,287,295 | |||||||||
|
| |||||||||
| Shares | ||||||||||
COMMON STOCKS – 5.4% | ||||||||||
ADT Corp. (The) | 1,290 | 46,234 | ||||||||
Beazer Homes USA, Inc.(f) | 3,490 | 62,576 | ||||||||
BlackRock Debt Strategies Fund, Inc. | 66,300 | 252,603 | ||||||||
Community Health Systems, Inc.(f) | 520 | 28,584 | ||||||||
DISH Network Corp. – Class A(f) | 800 | 50,920 | ||||||||
eDreams ODIGEO SL | 5,380 | 12,550 | ||||||||
General Motors Co. | 1,700 | 53,380 | ||||||||
Goodyear Tire & Rubber Co. (The) | 3,030 | 73,417 | ||||||||
LyondellBasell Industries NV – Class A | 660 | 60,476 | ||||||||
Nortek, Inc.(f) | 590 | 49,135 | ||||||||
Orbitz Worldwide, Inc.(f) | 8,450 | 69,881 | ||||||||
Peabody Energy Corp. | 1,450 | 15,124 | ||||||||
Quicksilver Resources, Inc.(f) | 2,600 | 1,421 | ||||||||
Salix Pharmaceuticals Ltd.(f) | 150 | 21,578 | ||||||||
Townsquare Media, Inc. – Class A(f) | 5,320 | 67,085 | ||||||||
Triangle Petroleum Corp.(f) | 3,670 | 28,442 | ||||||||
Western Asset High Yield Defined Opportunity Fund, Inc. | 14,900 | 248,532 | ||||||||
|
| |||||||||
Total Common Stocks | 1,141,938 | |||||||||
|
| |||||||||
PREFERRED STOCKS – 3.8% | ||||||||||
Financial Institutions – 3.3% | ||||||||||
Banking – 2.3% | ||||||||||
GMAC Capital Trust I | 14,500 | 387,585 | ||||||||
Goldman Sachs Group, Inc. (The) | 3,925 | 93,925 | ||||||||
|
| |||||||||
| 481,510 | ||||||||||
|
| |||||||||
| 16 | • ALLIANCEBERNSTEIN CREDIT LONG/SHORT PORTFOLIO |
Portfolio of Investments
| Company | Shares | U.S. $ Value | ||||||||
| ||||||||||
REITS – 1.0% | ||||||||||
Public Storage | 4,550 | $ | 104,559 | |||||||
Vornado Realty Trust | 4,250 | 104,508 | ||||||||
|
| |||||||||
| 209,067 | ||||||||||
|
| |||||||||
| 690,577 | ||||||||||
|
| |||||||||
Industrial – 0.5% | ||||||||||
Basic – 0.3% | ||||||||||
ArcelorMittal | 2,920 | 59,860 | ||||||||
|
| |||||||||
Consumer Cyclical - Other – 0.2% | ||||||||||
Hovnanian Enterprises, Inc. | 3,625 | 55,136 | ||||||||
|
| |||||||||
| 114,996 | ||||||||||
|
| |||||||||
Total Preferred Stocks | 805,573 | |||||||||
|
| |||||||||
| Principal Amount (000) | ||||||||||
COLLATERALIZED MORTGAGE OBLIGATIONS – 3.3% | ||||||||||
Non-Agency Fixed Rate – 2.1% | ||||||||||
Alternative Loan Trust | U.S.$ | 99 | 95,010 | |||||||
CHL Mortgage Pass-Through Trust | 100 | 92,392 | ||||||||
GSR Mortgage Loan Trust | 51 | 45,605 | ||||||||
Morgan Stanley Mortgage Loan Trust | 101 | 76,217 | ||||||||
Wells Fargo Mortgage Backed Securities | 94 | 90,426 | ||||||||
Wells Fargo Mortgage Backed Securities Trust | 43 | 42,546 | ||||||||
|
| |||||||||
| 442,196 | ||||||||||
|
| |||||||||
| ALLIANCEBERNSTEIN CREDIT LONG/SHORT PORTFOLIO • | 17 |
Portfolio of Investments
| Principal Amount (000) | U.S. $ Value | |||||||||
| ||||||||||
GSE Risk Share Floating Rate – 1.2% | ||||||||||
Federal Home Loan Mortgage Corp. Structured Agency Credit Risk Debt Notes | U.S.$ | 250 | $ | 257,706 | ||||||
|
| |||||||||
Total Collateralized Mortgage Obligations | 699,902 | |||||||||
|
| |||||||||
EMERGING MARKETS – CORPORATE BONDS – 3.1% | ||||||||||
Industrial – 3.1% | ||||||||||
Basic – 1.1% | ||||||||||
Sappi Papier Holding GmbH | 200 | 215,000 | ||||||||
|
| |||||||||
Capital Goods – 1.0% | ||||||||||
Cemex SAB de CV | 200 | 214,250 | ||||||||
|
| |||||||||
Consumer Non-Cyclical – 1.0% | ||||||||||
Marfrig Holding Europe BV | 200 | 210,500 | ||||||||
|
| |||||||||
Total Emerging Markets – Corporate Bonds | 639,750 | |||||||||
|
| |||||||||
QUASI-SOVEREIGNS – 2.7% | ||||||||||
Quasi-Sovereign Bonds – 2.7% | ||||||||||
Venezuela – 2.7% | ||||||||||
Petroleos de Venezuela SA | 800 | 410,000 | ||||||||
9.00%, 11/17/21(a) | 235 | 148,931 | ||||||||
|
| |||||||||
Total Quasi-Sovereigns | 558,931 | |||||||||
|
| |||||||||
BANK LOANS – 2.2% | ||||||||||
Industrial – 2.2% | ||||||||||
Basic – 0.9% | ||||||||||
Arysta LifeScience SPC LLC | 99 | 99,030 | ||||||||
FMG Resources (August 2006) Pty Ltd. (FMG America Finance, Inc.) | 99 | 96,976 | ||||||||
|
| |||||||||
| 196,006 | ||||||||||
|
| |||||||||
Communications - Media – 0.5% | ||||||||||
TWCC Holding Corp. | 100 | 97,958 | ||||||||
|
| |||||||||
| 18 | • ALLIANCEBERNSTEIN CREDIT LONG/SHORT PORTFOLIO |
Portfolio of Investments
| Principal Amount (000) | U.S. $ Value | |||||||||
| ||||||||||
Consumer Cyclical - Automotive – 0.3% | ||||||||||
TI Group Automotive Systems LLC | U.S.$ | 74 | $ | 73,673 | ||||||
|
| |||||||||
Other Industrial – 0.5% | ||||||||||
Orbitz Worldwide, Inc. | 100 | 98,777 | ||||||||
|
| |||||||||
Total Bank Loans | 466,414 | |||||||||
|
| |||||||||
GOVERNMENTS - TREASURIES – 0.4% | ||||||||||
Brazil – 0.4% | ||||||||||
Brazil Notas do Tesouro Nacional | BRL | 233 | 90,068 | |||||||
|
| |||||||||
EMERGING MARKETS - | ||||||||||
Argentina – 0.2% | ||||||||||
Argentina Bonos | U.S.$ | 51 | 47,784 | |||||||
|
| |||||||||
Venezuela – 0.2% | ||||||||||
Venezuela Government International Bond | 60 | 39,900 | ||||||||
|
| |||||||||
Total Emerging Markets – Sovereigns | 87,684 | |||||||||
|
| |||||||||
| Contracts | ||||||||||
OPTIONS PURCHASED - CALLS – 0.3% | ||||||||||
Options on Funds and Investment Trusts – 0.2% | ||||||||||
iShares iBoxx High Yield Corporate Bond ETF | 239 | 8,365 | ||||||||
iShares iBoxx High Yield Corporate Bond ETF | 57 | 5,985 | ||||||||
iShares iBoxx High Yield Corporate Bond ETF | 103 | 5,665 | ||||||||
iShares Russell 2000 ETF | 129 | 21,478 | ||||||||
SPDR S&P 500 ETF Trust | 23 | 11,063 | ||||||||
SPDR S&P Oil & Gas Exploration | 78 | 2,769 | ||||||||
|
| |||||||||
| 55,325 | ||||||||||
|
| |||||||||
| ALLIANCEBERNSTEIN CREDIT LONG/SHORT PORTFOLIO • | 19 |
Portfolio of Investments
| Notional Amount (000) | U.S. $ Value | |||||||||
| ||||||||||
Swaptions – 0.1% | ||||||||||
CDX-NAHY.22 Goldman Sachs & Co. | 1,050 | $ | 2,430 | |||||||
CDX-NAHY.22 Morgan Stanley Capital Services LLC | 2,050 | 8,443 | ||||||||
|
| |||||||||
| 10,873 | ||||||||||
|
| |||||||||
| Contracts | ||||||||||
Options on Equities – 0.0% | ||||||||||
ORBITZ Worldwide, Inc. | 103 | 1,803 | ||||||||
|
| |||||||||
Total Options Purchased – Calls | 68,001 | |||||||||
|
| |||||||||
OPTIONS PURCHASED - PUTS – 0.3% | ||||||||||
Options on Equities – 0.1% | ||||||||||
Best of SPY TLT Expiration: Dec 2014, Exercise Price: $ 100.00(f)(h) | 580 | 183 | ||||||||
Cliffs Natural Resources, Inc. Expiration: Apr 2015, Exercise Price: $ 6.00(f)(h) | 132 | 7,194 | ||||||||
Peabody Energy Corp. Expiration: Dec 2014, Exercise Price: $ 18.00(f)(h) | 29 | 22,547 | ||||||||
|
| |||||||||
| 29,924 | ||||||||||
|
| |||||||||
| Notional Amount (000) | ||||||||||
Swaptions – 0.1% | ||||||||||
CDX NAHY.23 Goldman Sachs & Co. (Buy Protection) Expiration: Dec 2014, | 1,780 | 6,182 | ||||||||
CDX NAHY.23 Bank of America (Buy Protection) Expiration: Nov 2014, Exercise Rate: 104%(f) | 1,700 | 1,933 | ||||||||
CDX NAHY.23 Bank of America (Buy Protection) Expiration: Nov 2014, Exercise Rate: 106%(f) | 1,700 | 6,306 | ||||||||
IRS Swaption, JPMorgan Chase Bank, NA Expiration: May 2015, Pay 3.06%, Receive 3-month LIBOR (BBA)(f) | 410 | 3,111 | ||||||||
IRS Swaption, JPMorgan Chase Bank, NA Expiration: May 2015, Pay 3.31%, Receive 3-month LIBOR (BBA)(f) | 450 | 1,644 | ||||||||
|
| |||||||||
| 19,176 | ||||||||||
|
| |||||||||
| 20 | • ALLIANCEBERNSTEIN CREDIT LONG/SHORT PORTFOLIO |
Portfolio of Investments
| Contracts | U.S. $ Value | |||||||||
| ||||||||||
Options on Funds and Investment Trusts – 0.1% | ||||||||||
iShares iBoxx High Yield Corporate Bond ETF Expiration: Nov 2014, | 149 | $ | 4,470 | |||||||
iShares US Preferred Stock ETF Expiration: Dec 2014, Exercise Price: $ 38.00(f)(h) | 83 | 1,038 | ||||||||
SPDR S&P 500 ETF Trust Expiration: Nov 2014, Exercise Price: $ 180.00(f)(h) | 103 | 1,081 | ||||||||
SPDR S&P 500 ETF Trust Expiration: Nov 2014, Exercise Price: $ 184.00(f)(h) | 17 | 272 | ||||||||
SPDR S&P 500 ETF Trust Expiration: Nov 2014, Exercise Price: $ 185.00(f)(h) | 51 | 918 | ||||||||
SPDR S&P 500 ETF Trust Expiration: Nov 2014, Exercise Price: $ 193.00(f)(h) | 32 | 1,744 | ||||||||
|
| |||||||||
| 9,523 | ||||||||||
|
| |||||||||
Total Options Purchased – Puts | 58,623 | |||||||||
|
| |||||||||
| Shares | ||||||||||
WARRANTS – 0.0% | ||||||||||
Peugeot SA, expiring 4/29/17(f) | 4,500 | 6,823 | ||||||||
|
| |||||||||
SHORT-TERM INVESTMENTS – 9.7% | ||||||||||
Investment Companies – 9.7% | ||||||||||
AllianceBernstein Fixed-Income Shares, Inc. – Government STIF Portfolio, 0.07%(i)(j) | 2,037,924 | 2,037,924 | ||||||||
|
| |||||||||
Total Investments Before Securities Sold Short – 95.7% | 20,129,171 | |||||||||
|
| |||||||||
| Principal Amount (000) | ||||||||||
SECURITIES SOLD SHORT – (36.5)% | ||||||||||
CORPORATES - NON-INVESTMENT | ||||||||||
Industrial – (21.4)% | ||||||||||
Basic – (4.3)% | ||||||||||
Chemtura Corp. | U.S.$ | (200 | ) | (199,500 | ) | |||||
Huntsman International LLC | EUR | (200 | ) | (261,076 | ) | |||||
INEOS Group Holdings SA | (200 | ) | (249,482 | ) | ||||||
Rayonier AM Products, Inc. | U.S.$ | (200 | ) | (189,000 | ) | |||||
|
| |||||||||
| (899,058 | ) | |||||||||
|
| |||||||||
| ALLIANCEBERNSTEIN CREDIT LONG/SHORT PORTFOLIO • | 21 |
Portfolio of Investments
| Principal Amount (000) | U.S. $ Value | |||||||||
| ||||||||||
Capital Goods – (2.0)% | ||||||||||
Clean Harbors, Inc. | U.S.$ | (198 | ) | $ | (201,465 | ) | ||||
United Rentals North America, Inc. | (200 | ) | (209,750 | ) | ||||||
|
| |||||||||
| (411,215 | ) | |||||||||
|
| |||||||||
Communications - Media – (1.0)% | ||||||||||
Lamar Media Corp. | (200 | ) | (211,000 | ) | ||||||
|
| |||||||||
Communications - Telecommunications – (0.5)% | ||||||||||
T-Mobile USA, Inc. | (100 | ) | (104,750 | ) | ||||||
|
| |||||||||
Consumer Cyclical - Automotive – (4.0)% | ||||||||||
Chrysler Group LLC / CG Co-Issuer, Inc. | (200 | ) | (223,500 | ) | ||||||
Gestamp Funding Luxembourg SA | EUR | (134 | ) | (176,696 | ) | |||||
Jaguar Land Rover Automotive PLC | U.S.$ | (192 | ) | (199,680 | ) | |||||
Lear Corp. | (195 | ) | (199,875 | ) | ||||||
Navistar International Corp. | (48 | ) | (49,344 | ) | ||||||
|
| |||||||||
| (849,095 | ) | |||||||||
|
| |||||||||
Consumer Cyclical - Retailers – (0.9)% | ||||||||||
Rent-A-Center, Inc. | (200 | ) | (193,000 | ) | ||||||
|
| |||||||||
Consumer Non-Cyclical – (1.6)% | ||||||||||
HCA, Inc. | (197 | ) | (211,775 | ) | ||||||
Unilabs Subholding AB | EUR | (100 | ) | (125,503 | ) | |||||
|
| |||||||||
| (337,278 | ) | |||||||||
|
| |||||||||
Energy – (4.3)% | ||||||||||
Energy XXI Gulf Coast, Inc. | U.S.$ | (200 | ) | (166,000 | ) | |||||
Halcon Resources Corp. | (38 | ) | (31,160 | ) | ||||||
Hercules Offshore, Inc. | (125 | ) | (80,000 | ) | ||||||
Oasis Petroleum, Inc. | (92 | ) | (95,680 | ) | ||||||
SandRidge Energy, Inc. | (388 | ) | (348,200 | ) | ||||||
Swift Energy Co. | (200 | ) | (180,500 | ) | ||||||
|
| |||||||||
| (901,540 | ) | |||||||||
|
| |||||||||
| 22 | • ALLIANCEBERNSTEIN CREDIT LONG/SHORT PORTFOLIO |
Portfolio of Investments
| Principal Amount (000) | U.S. $ Value | |||||||||
| ||||||||||
Services – (1.9)% | ||||||||||
ADT Corp. (The) | U.S.$ | (220 | ) | $ | (202,400 | ) | ||||
Realogy Group LLC/Realogy Co-Issuer Corp. | (200 | ) | (200,500 | ) | ||||||
|
| |||||||||
| (402,900 | ) | |||||||||
|
| |||||||||
Technology – (0.9)% | ||||||||||
Freescale Semiconductor, Inc. | (198 | ) | (195,030 | ) | ||||||
|
| |||||||||
| (4,504,866 | ) | |||||||||
|
| |||||||||
Financial Institutions – (4.8)% | ||||||||||
Banking – (2.9)% | ||||||||||
Ally Financial, Inc. | (400 | ) | (403,000 | ) | ||||||
UniCredit SpA | (200 | ) | (200,500 | ) | ||||||
|
| |||||||||
| (603,500 | ) | |||||||||
|
| |||||||||
Finance – (1.9)% | ||||||||||
CIT Group, Inc. | (200 | ) | (208,750 | ) | ||||||
iStar Financial, Inc. | (200 | ) | (199,000 | ) | ||||||
|
| |||||||||
| (407,750 | ) | |||||||||
|
| |||||||||
| (1,011,250 | ) | |||||||||
|
| |||||||||
Utility – (1.0)% | ||||||||||
Electric – (1.0)% | ||||||||||
Calpine Corp. | (189 | ) | (203,648 | ) | ||||||
|
| |||||||||
Total Corporates – Non-Investment Grade | (5,719,764 | ) | ||||||||
|
| |||||||||
CORPORATES - INVESTMENT GRADE – (6.4)% | ||||||||||
Industrial – (3.3)% | ||||||||||
Basic – (3.3)% | ||||||||||
Barrick Gold Corp. | (300 | ) | (289,966 | ) | ||||||
Glencore Funding LLC | (400 | ) | (404,000 | ) | ||||||
|
| |||||||||
| (693,966 | ) | |||||||||
|
| |||||||||
Financial Institutions – (2.1)% | ||||||||||
Banking – (2.1)% | ||||||||||
Intesa Sanpaolo SpA | EUR | (300 | ) | (442,016 | ) | |||||
|
| |||||||||
| ALLIANCEBERNSTEIN CREDIT LONG/SHORT PORTFOLIO • | 23 |
Portfolio of Investments
| Principal Amount (000) | U.S. $ Value | |||||||||
| ||||||||||
Utility – (1.0)% | ||||||||||
Electric – (1.0)% | ||||||||||
RWE AG | U.S.$ | (200 | ) | $ | (217,000 | ) | ||||
|
| |||||||||
Total Corporates – Investment Grade | (1,352,982 | ) | ||||||||
|
| |||||||||
QUASI-SOVEREIGNS – (2.9)% | ||||||||||
Quasi-Sovereign Bonds – (2.9)% | ||||||||||
Venezuela – (2.9)% | ||||||||||
Petroleos de Venezuela SA | ||||||||||
5.375%, 4/12/27(a) | (600 | ) | (285,000 | ) | ||||||
12.75%, 2/17/22(a) | (400 | ) | (317,500 | ) | ||||||
|
| |||||||||
Total Quasi-Sovereigns | (602,500 | ) | ||||||||
|
| |||||||||
Total Securities Sold Short | (7,675,246 | ) | ||||||||
|
| |||||||||
Total Investments, Net of Securities Sold Short – 59.2% | 12,453,925 | |||||||||
Other assets less liabilities – 40.8% | 8,566,449 | |||||||||
|
| |||||||||
Net Assets – 100.0% | $ | 21,020,374 | ||||||||
|
| |||||||||
FUTURES (see Note D)
| Type | Number of Contracts | Expiration Month | Original Value | Value at October 31, 2014 | Unrealized Appreciation/ (Depreciation) | |||||||||||||||
Purchased Contracts | ||||||||||||||||||||
EURO STOXX 50 | 3 | December 2014 | $ | 120,470 | $ | 116,581 | $ | (3,889 | ) | |||||||||||
U.S. T-Note 5 Yr (CBT) Futures | 15 | December 2014 | 1,777,288 | 1,791,445 | 14,157 | |||||||||||||||
Sold Contracts | ||||||||||||||||||||
U.S. T-Note 10 Yr (CBT) Futures | 22 | December 2014 | 2,755,811 | 2,779,906 | (24,095 | ) | ||||||||||||||
|
| |||||||||||||||||||
| $ | (13,827 | ) | ||||||||||||||||||
|
| |||||||||||||||||||
FORWARD CURRENCY EXCHANGE CONTRACTS (see Note D)
| Counterparty | Contracts to Deliver (000) | In Exchange (000) | Settlement Date | Unrealized Appreciation/ (Depreciation) | ||||||||||||
Credit Suisse International | USD | 1,102 | EUR | 866 | 12/15/14 | $ | (15,649 | ) | ||||||||
Credit Suisse International | EUR | 12 | USD | 15 | 1/22/15 | 242 | ||||||||||
State Street Bank & Trust Co. | USD | 163 | GBP | 102 | 11/14/14 | 46 | ||||||||||
| 24 | • ALLIANCEBERNSTEIN CREDIT LONG/SHORT PORTFOLIO |
Portfolio of Investments
| Counterparty | Contracts to Deliver (000) | In Exchange (000) | Settlement Date | Unrealized Appreciation/ (Depreciation) | ||||||||||||
State Street Bank & Trust Co. | EUR | 10 | USD | 13 | 11/21/14 | $ | 208 | |||||||||
State Street Bank & Trust Co. | USD | 51 | EUR | 41 | 11/21/14 | (534 | ) | |||||||||
State Street Bank & Trust Co. | EUR | 34 | USD | 44 | 12/15/14 | 1,422 | ||||||||||
State Street Bank & Trust Co. | EUR | 17 | USD | 22 | 12/15/14 | (16 | ) | |||||||||
State Street Bank & Trust Co. | CAD | 102 | USD | 93 | 12/22/14 | 2,621 | ||||||||||
State Street Bank & Trust Co. | EUR | 418 | USD | 534 | 12/22/14 | 10,315 | ||||||||||
State Street Bank & Trust Co. | GBP | 326 | USD | 533 | 12/22/14 | 11,520 | ||||||||||
State Street Bank & Trust Co. | USD | 14 | EUR | 11 | 12/22/14 | (341 | ) | |||||||||
State Street Bank & Trust Co. | USD | 76 | GBP | 46 | 12/22/14 | (1,564 | ) | |||||||||
|
| |||||||||||||||
| $ | 8,270 | |||||||||||||||
|
| |||||||||||||||
CALL OPTIONS WRITTEN (see Note D)
| Description | Contracts | Exercise Price | Expiration Month | Premiums Received | U.S. $ Value | |||||||||||||||
Call – iShares Russell 2000 ETF (h) | 129 | $ | 119.00 | November 2014 | $ | 9,541 | $ | (10,578 | ) | |||||||||||
Call – SPDR S&P 500 ETF Trust (h) | 23 | 201.00 | November 2014 | 2,069 | (6,233 | )) | ||||||||||||||
|
|
|
| |||||||||||||||||
| $ | 11,610 | $ | (16,811 | ) | ||||||||||||||||
|
|
|
| |||||||||||||||||
PUT OPTIONS WRITTEN (see Note D)
| Description | Contracts | Exercise Price | Expiration Month | Premiums Received | U.S. $ Value | |||||||||||||||
Put – iShares 20 Year | 50 | $ | 122.00 | November 2014 | $ | 14,257 | $ | (17,375 | ) | |||||||||||
Put – iShares iBoxx High Yield Corporate Bond ETF(h) | 57 | 84.00 | December 2014 | 3,076 | (1,140 | ) | ||||||||||||||
Put – SPDR S&P 500 | 17 | 178.00 | November 2014 | 2,634 | (153 | ) | ||||||||||||||
Put – SPDR S&P 500 | 32 | 188.00 | November 2014 | 1,887 | (816 | ) | ||||||||||||||
|
|
|
| |||||||||||||||||
| $ | 21,854 | $ | (19,484 | ) | ||||||||||||||||
|
|
|
| |||||||||||||||||
CREDIT DEFAULT SWAPTIONS WRITTEN (see Note D)
| Description | Counterparty | Buy/Sell Protection | Strike Rate | Expiration Date | Notional Amount (000) | Premiums Received | Market Value | |||||||||||||||||||
Put – CDX NAHY | Bank of America, NA | Sell | 1.05 | % | 11/19/14 | $ | 3,400 | $ | 8,160 | $ | (6,884 | ) | ||||||||||||||
Put – CDX NAHY | Goldman Sachs International | Sell | 1.00 | % | 12/17/14 | 1,780 | 5,251 | (2,724 | ) | |||||||||||||||||
|
|
|
| |||||||||||||||||||||||
| $ | 13,411 | $ | (9,608 | ) | ||||||||||||||||||||||
|
|
|
| |||||||||||||||||||||||
| ALLIANCEBERNSTEIN CREDIT LONG/SHORT PORTFOLIO • | 25 |
Portfolio of Investments
CENTRALLY CLEARED CREDIT DEFAULT SWAPS (see Note D)
| Clearing Broker/(Exchange) & Referenced Obligation | Fixed Rate (Pay) Receive | Implied Credit Spread at October 31, 2014 | Notional Amount (000) | Market Value | Unrealized Appreciation/ (Depreciation) | |||||||||||||||
Buy Contracts | ||||||||||||||||||||
Morgan Stanley & Co. LLC/(INTRCONX): | ||||||||||||||||||||
CDX-NAHY Series 22, 5 Year Index, 6/20/19* | (5.00 | )% | 3.15 | % | $ | 129 | $ | (10,364 | ) | $ | (2,893 | ) | ||||||||
CDX-NAHY Series 22, 5 Year Index, 6/20/19* | (5.00 | ) | 3.15 | 515 | (41,454 | ) | (8,255 | ) | ||||||||||||
CDX-NAHY Series 22, | (5.00 | ) | 3.15 | 2,030 | (163,426 | ) | (62,901 | ) | ||||||||||||
CDX-NAHY Series 22, | (5.00 | ) | 3.15 | 644 | (51,818 | ) | (10,959 | ) | ||||||||||||
iTraxx Europe Crossover | (5.00 | ) | 2.41 | EUR | 90 | (13,090 | ) | 1,142 | ||||||||||||
iTraxx Europe Crossover | (5.00 | ) | 2.41 | 780 | (113,446 | ) | 3,642 | |||||||||||||
Sale Contracts | ||||||||||||||||||||
Morgan Stanley & Co. LLC/(INTRCONX): | ||||||||||||||||||||
CDX-NAHY Series 22, | 5.00 | 3.15 | $ | 1,172 | 94,373 | 40,155 | ||||||||||||||
CDX-NAHY Series 22, | 5.00 | 3.15 | 572 | 46,036 | 17,719 | |||||||||||||||
CDX-NAHY Series 22, | 5.00 | 3.15 | 286 | 23,018 | 8,859 | |||||||||||||||
CDX-NAHY Series 22, | 5.00 | 3.15 | 495 | 39,860 | (628 | ) | ||||||||||||||
|
|
|
| |||||||||||||||||
| $ | (190,311 | ) | $ | (14,119 | ) | |||||||||||||||
|
|
|
| |||||||||||||||||
| * | Termination date. |
CENTRALLY CLEARED INTEREST RATE SWAPS
| Rate Type | ||||||||||||||||||||
| Clearing Broker /(Exchange) | Notional Amount (000) | Termination Date | Payments made by the Fund | Payments received by the Fund | Unrealized Appreciation/ (Depreciation) | |||||||||||||||
Morgan Stanley & Co. LLC/(CME) | $ | 2,000 | 5/09/19 | 1.732 | % | 3 Month LIBOR | $ | (24,792 | ) | |||||||||||
| 26 | • ALLIANCEBERNSTEIN CREDIT LONG/SHORT PORTFOLIO |
Portfolio of Investments
CREDIT DEFAULT SWAPS (see Note D)
| Swap Counterparty & Referenced Obligation | Fixed Rate (Pay) Receive | Implied Credit Spread at October 31, 2014 | Notional Amount (000) | Market Value | Upfront Premiums Paid (Received) | Unrealized Appreciation/ (Depreciation) | ||||||||||||||||||
Buy Contracts | ||||||||||||||||||||||||
Bank of America, NA: | ||||||||||||||||||||||||
ArcelorMittal, | (1.00 | )% | 2.45 | % | EUR | 160 | $ | 13,830 | $ | 15,488 | $ | (1,658 | ) | |||||||||||
Hellenic Telecommunications Organization Societe Anonyme, | (1.00 | ) | 1.24 | 320 | (38,536 | ) | (36,308 | ) | (2,228 | ) | ||||||||||||||
Citibank, NA: | ||||||||||||||||||||||||
Amkor Technology, Inc., 7.375%, 5/20/18, 12/20/19* | (5.00 | ) | 3.51 | $ | 100 | (7,408 | ) | (8,344 | ) | 936 | ||||||||||||||
Dell Inc., 7.1%, 4/15/28, 12/20/19* | (1.00 | ) | 1.86 | 200 | 8,028 | 11,202 | (3,174 | ) | ||||||||||||||||
J. C. Penney Co., Inc., 6.375%, 10/15/36. 6/20/16* | (5.00 | ) | 3.75 | 100 | (1,371 | ) | 3,531 | (4,902 | ) | |||||||||||||||
Quest Diagnostics Incorporated, 6.95%, 7/01/l37, 12/20/19*: | (1.00 | ) | 1.06 | 500 | 954 | 3,575 | (2,621 | ) | ||||||||||||||||
Russian Federation, 7.5 %, 3/31/30, 12/20/19* | (1.00 | ) | 2.42 | 100 | 6,538 | 6,809 | (271 | ) | ||||||||||||||||
Credit Suisse International | ||||||||||||||||||||||||
Bellsouth Corp., 6.55% 6/15/34, 09/20/2019* | (1.00 | ) | 0.42 | 1,000 | (28,089 | ) | (23,963 | ) | (4,126 | ) | ||||||||||||||
ConAgra Foods, Inc., | (1.00 | ) | 0.78 | 600 | (9,547 | ) | (6,187 | ) | (3,360 | ) | ||||||||||||||
Western Union Co., | (1.00 | ) | 0.59 | 600 | (7,103 | ) | (7,691 | ) | 588 | |||||||||||||||
Deutsche Bank AG | ||||||||||||||||||||||||
Lloyds Bank PLC, | (1.00 | ) | 0.61 | EUR | 470 | (12,437 | ) | (12,352 | ) | (85 | ) | |||||||||||||
Goldman Sachs International | ||||||||||||||||||||||||
Peabody Energy Corporation, 7.375%, 11/01/16, 12/20/19* | (5.00 | ) | 5.93 | $ | 130 | 4,385 | 1,308 | 3,077 | ||||||||||||||||
JPMorgan Chase Bank, NA: | ||||||||||||||||||||||||
Kohl’s Corp., 6.25%, 12/15/17, 6/20/17* | (1.00 | ) | 0.40 | 400 | (6,331 | ) | (4,588 | ) | (1,743 | ) | ||||||||||||||
| ALLIANCEBERNSTEIN CREDIT LONG/SHORT PORTFOLIO • | 27 |
Portfolio of Investments
| Swap Counterparty & Referenced Obligation | Fixed Rate (Pay) Receive | Implied Credit Spread at October 31, 2014 | Notional Amount (000) | Market Value | Upfront Premiums Paid (Received) | Unrealized Appreciation/ (Depreciation) | ||||||||||||||||||
Sale Contracts | ||||||||||||||||||||||||
Bank of America, NA: | ||||||||||||||||||||||||
Hellenic Telecommunications Organization Societe Anonyme, | 5.00 | % | 1.88 | % | EUR | 140 | $ | 18,674 | $ | 17,699 | $ | 975 | ||||||||||||
Citibank, NA: | ||||||||||||||||||||||||
Laderokes PLC, | 1.00 | 2.81 | 140 | (13,878 | ) | (15,696 | ) | 1,818 | ||||||||||||||||
NRG Energy, Inc., | 5.00 | 2.50 | $ | 100 | 11,051 | 10,758 | 293 | |||||||||||||||||
Telecom Italia SPA, | 1.00 | 1.75 | EUR | 70 | (2,920 | ) | (3,650 | ) | 730 | |||||||||||||||
UPC Holding BV, | 5.00 | 2.04 | 140 | 23,704 | 17,831 | 5,873 | ||||||||||||||||||
Credit Suisse International: | ||||||||||||||||||||||||
AT&T Inc. | 1.00 | 0.45 | $ | 1,000 | 26,974 | 27,815 | (841 | ) | ||||||||||||||||
Western Union Co., | 1.00 | 1.35 | 400 | (6,668 | ) | (5,444 | ) | (1,224 | ) | |||||||||||||||
JPMorgan Chase Bank, NA: |
| |||||||||||||||||||||||
Kohl’s Corp., | 1.00 | 0.97 | 400 | 402 | (5,358 | ) | 5,760 | |||||||||||||||||
TRW Automotive Inc., | 1.00 | 0.91 | 100 | 431 | (1,716 | ) | 2,147 | |||||||||||||||||
|
|
|
|
|
| |||||||||||||||||||
| $ | (19,317 | ) | $ | (15,281 | ) | $ | (4,036 | ) | ||||||||||||||||
|
|
|
|
|
| |||||||||||||||||||
| * | Termination date. |
TOTAL RETURN SWAPS (see Note D)
Counterparty & Referenced Obligation | # of Shares or Units | Rate Paid/ Received | Notional Amount (000) | Maturity Date | Unrealized Appreciation/ (Depreciation) | |||||||||||||||
Receive Total Return on Reference Obligation |
| |||||||||||||||||||
Goldman Sachs International iBoxx $ Liquid High Yield Total Return Index | 8,574 | LIBOR Plus 0.00 | % | $ | 2,000 | 12/20/14 | $ | 19,593 | ||||||||||||
| 28 | • ALLIANCEBERNSTEIN CREDIT LONG/SHORT PORTFOLIO |
Portfolio of Investments
| (a) | Security is exempt from registration under Rule 144A of the Securities Act of 1933. These securities are considered liquid and may be resold in transactions exempt from registration, normally to qualified institutional buyers. At October 31, 2014, the aggregate market value of these securities amounted to $5,750,840 or 27.4% of net assets. |
| (b) | Pay-In-Kind Payments (PIK). The issuer may pay cash interest and/or interest in additional debt securities. Rates shown are the rates in effect at October 31, 2014. |
| (c) | Convertible security. |
| (d) | Securities are perpetual and, thus, do not have a predetermined maturity date. The date shown, if applicable, reflects the next call date. |
| (e) | Coupon rate adjusts periodically based upon a predetermined schedule. Stated interest rate in effect at October 31, 2014. |
| (f) | Non-income producing security. |
| (g) | Floating Rate Security. Stated interest rate was in effect at October 31, 2014. |
| (h) | One contract relates to 100 shares. |
| (i) | To obtain a copy of the fund’s financial statements, please go to the Securities and Exchange Commission’s website at www.sec.gov, or call AllianceBernstein at (800) 227-4618. |
| (j) | Investment in affiliated money market mutual fund. The rate shown represents the 7-day yield as of period end. |
Currency Abbreviations:
CAD – Canadian Dollar
BRL – Brazilian Real
EUR – Euro
GBP – Great British Pound
USD – United States Dollar
Glossary:
ABS – Asset-Backed Securities
BBA –British Bankers Association
CBT – Chicago Board of Trade
CDX-NAHY – North American High Yield Credit Default Swap Index
CME – Chicago Mercantile Exchange
ETF – Exchange Traded Fund
GSE – Government-Sponsored Enterprise
iBOXHY – iBoxx $ Liquid High Yield Index
INTRCONX – Inter-Continental Exchange
IRS – Interest Rate Swaption
LIBOR – London Interbank Offered Rates
REIT – Real Estate Investment Trust
RTP – Right to Pay
SPDR – Standard & Poor’s Depository Receipt
SPY – SPDR Trust Series I
TLT – iShares Barclays 20 Year Treasury Bond Fund
See notes to financial statements.
| ALLIANCEBERNSTEIN CREDIT LONG/SHORT PORTFOLIO • | 29 |
Portfolio of Investments
STATEMENT OF ASSETS & LIABILITIES
October 31, 2014
| Assets | ||||
Investments in securities, at value | ||||
Unaffiliated issuers (cost $18,469,210) | $ | 18,091,247 | ||
Affiliated issuers (cost $2,037,924) | 2,037,924 | |||
Due from broker | 509,566 | (a) | ||
Foreign currencies, at value (cost $11,006) | 12,551 | |||
Deposit at broker for securities sold short | 7,764,001 | |||
Receivable for investment securities sold | 412,372 | |||
Interest and dividends receivable | 290,548 | |||
Upfront premium paid on credit default swaps | 116,016 | |||
Prepaid expenses | 43,939 | |||
Unrealized appreciation on forward currency exchange contracts | 26,374 | |||
Unrealized appreciation on credit default swaps | 22,197 | |||
Unrealized appreciation on total return swaps | 19,593 | |||
Receivable for terminated credit default swaps | 61,127 | |||
Receivable for variation margin on exchange-traded derivatives | 6,317 | |||
Receivable for terminated centrally cleared credit default swaps | 13 | |||
|
| |||
Total assets | 29,413,785 | |||
|
| |||
| Liabilities | ||||
Due to custodian | 11,238 | |||
Options written, at value (premiums received $33,464) | 36,295 | |||
Swaptions written, at value (premiums received $13,411) | 9,608 | |||
Payable for securities sold short, at value (proceeds received $7,956,338) | 7,675,246 | |||
Interest expense payable | 123,757 | |||
Payable for investment securities purchased and foreign currency transactions | 117,560 | |||
Advisory fee payable | 96,873 | |||
Unrealized depreciation on credit default swaps | 26,233 | |||
Unrealized depreciation on forward currency exchange contracts | 18,104 | |||
Upfront premium received on credit default swaps | 131,297 | |||
Payable for variation margin on exchange-traded derivatives | 3,906 | |||
Transfer Agent fee payable | 2,996 | |||
Distribution fee payable | 48 | |||
Accrued expenses | 140,250 | |||
|
| |||
Total liabilities | 8,393,411 | |||
|
| |||
Net Assets | $ | 21,020,374 | ||
|
| |||
| Composition of Net Assets | ||||
Capital stock, at par | $ | 2,101 | ||
Additional paid-in capital | 20,991,467 | |||
Undistributed net investment income | 130,266 | |||
Accumulated net realized gain on investment and foreign currency transactions | 22,076 | |||
Net unrealized depreciation on investments and foreign currency denominated assets and liabilities | (125,536 | ) | ||
|
| |||
| $ | 21,020,374 | |||
|
|
| (a) | Represents amounts on deposit at the broker as collateral for open derivative contracts. |
See notes to financial statements.
| 30 | • ALLIANCEBERNSTEIN CREDIT LONG/SHORT PORTFOLIO |
Statement of Assets & Liabilities
Net Asset Value Per Share—9 billion shares of capital stock authorized, $.001 par value
| Class | Net Assets | Shares Outstanding | Net Asset Value | |||||||||
| ||||||||||||
| A | $ | 84,108 | 8,412 | $ | 10.00 | * | ||||||
| ||||||||||||
| C | $ | 44,437 | 4,459 | $ | 9.97 | |||||||
| ||||||||||||
| Advisor | $ | 20,891,829 | 2,087,651 | $ | 10.01 | |||||||
| ||||||||||||
| * | The maximum offering price per share for Class A shares was $10.44 which reflects a sales charge of 4.25%. |
See notes to financial statements.
| ALLIANCEBERNSTEIN CREDIT LONG/SHORT PORTFOLIO • | 31 |
Statement of Assets & Liabilities
STATEMENT OF OPERATIONS
For the Period May 7, 2014(a) to October 31, 2014
| Investment Income | ||||||||
Interest | $ | 428,962 | ||||||
Dividends | ||||||||
Unaffiliated issuers (net of foreign taxes withheld of $114) | 41,560 | |||||||
Affiliated issuers | 1,252 | |||||||
Consent fee income | 225 | $ | 471,999 | |||||
|
| |||||||
| Expenses | ||||||||
Advisory fee (see Note B) | 88,451 | |||||||
Distribution fee—Class A | 24 | |||||||
Distribution fee—Class C | 99 | |||||||
Transfer agency—Class A | 9 | |||||||
Transfer agency—Class C | 10 | |||||||
Transfer agency—Advisor Class | 8,577 | |||||||
Audit and tax | 79,302 | |||||||
Custodian | 61,572 | |||||||
Amortization of offering expenses | 41,368 | |||||||
Administrative | 38,604 | |||||||
Legal | 13,549 | |||||||
Printing | 11,452 | |||||||
Registration fees | 5,929 | |||||||
Directors’ fees | 5,644 | |||||||
Miscellaneous | 6,500 | |||||||
|
| |||||||
Total expenses before expenses on securities sold short | 361,090 | |||||||
Interest expense | 154,154 | |||||||
Broker fee | 12,156 | |||||||
|
| |||||||
Total expenses | 527,400 | |||||||
Less: expenses waived and reimbursed by the Adviser (see Note B) | (252,520 | ) | ||||||
|
| |||||||
Net expenses | 274,880 | |||||||
|
| |||||||
Net investment income | 197,119 | |||||||
|
| |||||||
| Realized and Unrealized Gain (Loss) on Investment and Foreign Currency Transactions | ||||||||
Net realized gain (loss) on: | ||||||||
Investment transactions | 71,828 | |||||||
Securities sold short | 28,914 | |||||||
Futures | (59,477 | ) | ||||||
Options written | (16,567 | ) | ||||||
Swaptions written | 19,454 | |||||||
Swaps | (14,109 | ) | ||||||
Foreign currency transactions | 16,213 | |||||||
Net change in unrealized appreciation/depreciation of: | ||||||||
Investments | (377,963 | ) | ||||||
Securities sold short | 281,255 | |||||||
Futures | (13,827 | ) | ||||||
Options written | (2,831 | ) | ||||||
Swaptions written | 3,803 | |||||||
Swaps | (23,354 | ) | ||||||
Foreign currency denominated assets and liabilities | 7,381 | |||||||
|
| |||||||
Net loss on investment and foreign currency transactions | (79,280 | ) | ||||||
|
| |||||||
Net Increase in Net Assets from Operations | $ | 117,839 | ||||||
|
|
| (a) | Commencement of operations. |
See notes to financial statements.
| 32 | • ALLIANCEBERNSTEIN CREDIT LONG/SHORT PORTFOLIO |
Statement of Operations
STATEMENT OF CHANGES IN NET ASSETS
| May 7, 2014(a) to October 31, 2014 | ||||
| Increase (Decrease) in Net Assets from Operations | ||||
Net investment income | $ | 197,119 | ||
Net realized gain on investment and foreign currency transactions | 46,256 | |||
Net change in unrealized appreciation/depreciation of investments and foreign currency denominated assets and liabilities | (125,536 | ) | ||
|
| |||
Net increase in net assets from operations | 117,839 | |||
| Dividends to Shareholders from | ||||
Net investment income | ||||
Class A | (87 | ) | ||
Class C | (182 | ) | ||
Advisor Class | (101,727 | ) | ||
| Capital Stock Transactions | ||||
Net increase | 21,004,531 | |||
|
| |||
Total increase | 21,020,374 | |||
| Net Assets | ||||
Beginning of period | – 0 | – | ||
|
| |||
End of period (including undistributed net investment | $ | 21,020,374 | ||
|
| |||
| (a) | Commencement of operations. |
See notes to financial statements.
| ALLIANCEBERNSTEIN CREDIT LONG/SHORT PORTFOLIO • | 33 |
Statement of Changes in Net Assets
STATEMENT OF CASH FLOWS
For the Period May 7, 2014(a) to October 31, 2014
| Cash flows from Operating Activities | ||||||||
Net increase in net assets from operations | $ | 117,839 | ||||||
| Reconciliation of Net Increase in Net Assets from Operations to Net Decrease in Cash from Operating Activities: | ||||||||
Increase in interest and dividends receivable | $ | (290,548 | ) | |||||
Increase in receivable for investments sold | (412,372 | ) | ||||||
Net accretion of bond discount and amortization of bond premium | 24,677 | |||||||
Increase in payable for investments purchased | 117,560 | |||||||
Increase in other assets | (43,939 | ) | ||||||
Increase in accrued expenses | 240,167 | |||||||
Increase in due from broker | (8,273,567 | ) | ||||||
Purchases of long-term investments | (31,797,938 | ) | ||||||
Purchases of short-term investments | (28,740,559 | ) | ||||||
Proceeds from disposition of long-term investments | 13,364,355 | |||||||
Proceeds from disposition of short-term investments | 26,702,635 | |||||||
Proceeds from short sales transactions, net | 8,080,095 | |||||||
Proceeds from written options, net | 49,762 | |||||||
Payments on swaps, net | (55,789 | ) | ||||||
Payments for exchange-traded derivatives settlements | (84,063 | ) | ||||||
Variation margin paid on exchange-traded derivatives | (2,411 | ) | ||||||
Net realized gain on investment and foreign currency transactions | (46,256 | ) | ||||||
Net change in unrealized appreciaton/depreciation of investments and foreign currency denominated assets and liabilities | 125,536 | |||||||
|
| |||||||
Total adjustments | (21,042,655 | ) | ||||||
|
| |||||||
Net Decrease in Cash from Operating Activities | $ | (20,924,816 | ) | |||||
|
| |||||||
| Financing Activities: | ||||||||
Subscriptions of capital stock, net | 21,002,732 | |||||||
Increase in due to custodian | 11,238 | |||||||
Cash dividends paid (net of dividend reinvestments)* | (100,197 | ) | ||||||
|
| |||||||
Net increase in cash from financing activities | 20,913,773 | |||||||
Effect of exchange rate on cash | 23,594 | |||||||
|
| |||||||
Net increase in cash | 12,551 | |||||||
Net change in cash | ||||||||
Cash at beginning of period | — | |||||||
|
| |||||||
Cash at end of period | $ | 12,551 | ||||||
|
| |||||||
* Reinvestment of dividends | 1,799 | |||||||
Supplemental disclosure of cash flow information: | ||||||||
Interest expense paid during the period | 30,397 |
In accordance with U.S. GAAP, the Fund has included a Statement of Cash Flows as a result of its significant investments in Level 3 securities throughout the period.
| (a) | Commencement of operations. |
See notes to financial statements.
| 34 | • ALLIANCEBERNSTEIN CREDIT LONG/SHORT PORTFOLIO |
Statement of cash Flows
NOTES TO FINANCIAL STATEMENTS
October 31, 2014
NOTE A
Significant Accounting Policies
AllianceBernstein Bond Fund, Inc. (the “Fund”) is registered under the Investment Company Act of 1940 as an open-end management investment company. The Fund, which is a Maryland corporation, operates as a series company comprised of nine portfolios currently in operation: the Intermediate Bond Portfolio, the Bond Inflation Strategy Portfolio, the Municipal Bond Inflation Strategy Portfolio, the Real Asset Strategy Portfolio, the Limited Duration High Income Portfolio, the Government Reserves Portfolio, the Tax-Aware Fixed Income Portfolio, the AllianceBernstein Credit Long/Short Portfolio and the AllianceBernstein High Yield Portfolio. They are each diversified Portfolios, with the exception of the Limited Duration High Income Portfolio, which is non-diversified. The Government Reserves Portfolio commenced operations on May 1, 2013. The Tax-Aware Fixed Income Portfolio commenced operations on December 11, 2013. The AllianceBernstein Credit Long/Short Portfolio commenced operations on May 7, 2014. The AllianceBernstein High Yield Portfolio commenced operations July 15, 2014. Each Portfolio is considered to be a separate entity for financial reporting and tax purposes. This report relates only to the AllianceBernstein Credit Long/Short Portfolio (the “Portfolio”). The Fund have authorized the issuance of Class A, Class B, Class C, Advisor Class, Class R, Class K, Class I, Class Z, Class 1 and Class 2 shares. Class B, Class R, Class K, Class I, Class Z, Class 1 and Class 2 shares are not currently offered. Class A shares are sold with a front-end sales charge of up to 4.25% for purchases up to $500,000; purchases of $500,000 or more are not subject to a sales charge. With respect to purchases of $500,000 or more, Class A shares redeemed within one year of purchase may be subject to a contingent deferred sales charge of 1%. Class C shares are subject to a contingent deferred sales charge of 1% on redemptions made within the first year after purchase. Advisor Class shares are sold without any initial or contingent deferred sales charge and are not subject to ongoing distribution expenses. All nine classes of shares have identical voting, dividend, liquidation and other rights, except that the classes bear different distribution and transfer agency expenses. Each class has exclusive voting rights with respect to its distribution plan. The financial statements have been prepared in conformity with U.S. generally accepted accounting principles (“U.S. GAAP”) which require management to make certain estimates and assumptions that affect the reported amounts of assets and liabilities in the financial statements and amounts of income and expenses during the reporting period. Actual results could differ from those estimates. The following is a summary of significant accounting policies followed by the Portfolio.
1. Security Valuation
Portfolio securities are valued at their current market value determined on the basis of market quotations or, if market quotations are not readily available or are deemed unreliable, at “fair value” as determined in accordance with procedures established by and under the general supervision of the Fund’s Board of Directors (the “Board”).
| ALLIANCEBERNSTEIN CREDIT LONG/SHORT PORTFOLIO • | 35 |
Notes to Financial Statements
In general, the market values of securities which are readily available and deemed reliable are determined as follows: securities listed on a national securities exchange (other than securities listed on the NASDAQ Stock Market, Inc. (“NASDAQ”)) or on a foreign securities exchange are valued at the last sale price at the close of the exchange or foreign securities exchange. If there has been no sale on such day, the securities are valued at the last traded price from the previous day. Securities listed on more than one exchange are valued by reference to the principal exchange on which the securities are traded; securities listed only on NASDAQ are valued in accordance with the NASDAQ Official Closing Price; listed or over the counter (“OTC”) market put or call options are valued at the mid level between the current bid and ask prices. If either a current bid or current ask price is unavailable, AllianceBernstein L.P. (the “Adviser”) will have discretion to determine the best valuation (e.g. last trade price in the case of listed options); open futures are valued using the closing settlement price or, in the absence of such a price, the most recent quoted bid price. If there are no quotations available for the day of valuation, the last available closing settlement price is used; U.S. government securities and other debt instruments having 60 days or less remaining until maturity are valued at amortized cost if their original maturity was 60 days or less. If the original term to maturity exceeded 60 days, the securities are valued by a pricing service, if a market price is available. If a market price is not available, the securities are valued by using amortized cost as of the 61st day prior to maturity. Fixed-income securities, including mortgage-backed and asset-backed securities, may be valued on the basis of prices provided by a pricing service or at a price obtained from one or more of the major broker-dealers. In cases where broker-dealer quotes are obtained, the Adviser may establish procedures whereby changes in market yields or spreads are used to adjust, on a daily basis, a recently obtained quoted price on a security. Swaps and other derivatives are valued daily, primarily using independent pricing services, independent pricing models using market inputs, as well as third party broker-dealers or counterparties. Investment companies are valued at their net asset value each day.
Securities for which market quotations are not readily available (including restricted securities) or are deemed unreliable are valued at fair value. Factors considered in making this determination may include, but are not limited to, information obtained by contacting the issuer, analysts, analysis of the issuer’s financial statements or other available documents. In addition, the Portfolio may use fair value pricing for securities primarily traded in non-U.S. markets because most foreign markets close well before the Portfolio value it’s securities at 4:00 p.m., Eastern Time. The earlier close of these foreign markets gives rise to the possibility that significant events, including broad market moves, may have occurred in the interim and may materially affect the value of those securities.
2. Fair Value Measurements
In accordance with U.S. GAAP regarding fair value measurements, fair value is defined as the price that the Portfolio would receive to sell an asset or pay to
| 36 | • ALLIANCEBERNSTEIN CREDIT LONG/SHORT PORTFOLIO |
Notes to Financial Statements
transfer a liability in an orderly transaction between market participants at the measurement date. U.S. GAAP establishes a framework for measuring fair value, and a three-level hierarchy for fair value measurements based upon the transparency of inputs to the valuation of an asset or liability (including those valued based on their market values as described in Note A.1 above). Inputs may be observable or unobservable and refer broadly to the assumptions that market participants would use in pricing the asset or liability. Observable inputs reflect the assumptions market participants would use in pricing the asset or liability based on market data obtained from sources independent of the Portfolio. Unobservable inputs reflect the Portfolio own assumptions about the assumptions that market participants would use in pricing the asset or liability based on the best information available in the circumstances. Each investment is assigned a level based upon the observability of the inputs which are significant to the overall valuation. The three-tier hierarchy of inputs is summarized below.
| • | Level 1—quoted prices in active markets for identical investments |
| • | Level 2—other significant observable inputs (including quoted prices for similar investments, interest rates, prepayment speeds, credit risk, etc.) |
| • | Level 3—significant unobservable inputs (including the Portfolio own assumptions in determining the fair value of investments) |
The fair value of debt instruments, such as bonds, and over-the-counter derivatives is generally based on market price quotations, recently executed market transactions (where observable) or industry recognized modeling techniques and are generally classified as Level 2. Pricing vendor inputs to Level 2 valuations may include quoted prices for similar investments in active markets, interest rate curves, coupon rates, currency rates, yield curves, option adjusted spreads, default rates, credit spreads and other unique security features in order to estimate the relevant cash flows which are then discounted to calculate fair values. If these inputs are unobservable and significant to the fair value, these investments will be classified as Level 3. In addition, non-agency rated investments are classified as Level 3.
Where readily available market prices or relevant bid prices are not available for certain equity investments, such investments may be valued based on similar publicly traded investments, movements in relevant indices since last available prices or based upon underlying company fundamentals and comparable company data (such as multiples to earnings or other multiples to equity). Where an investment is valued using an observable input, such as another publicly traded security, the investment will be classified as Level 2. If management determines that an adjustment is appropriate based on restrictions on resale, illiquidity or uncertainty, and such adjustment is a significant component of the valuation, the investment will be classified as Level 3. An investment will also be classified as Level 3 where management uses company fundamentals and other significant inputs to determine the valuation.
| ALLIANCEBERNSTEIN CREDIT LONG/SHORT PORTFOLIO • | 37 |
Notes to Financial Statements
Options are valued using market-based inputs to models, broker or dealer quotations, or alternative pricing sources with reasonable levels of price transparency, where such inputs and models are available. Alternatively the values may be obtained through unobservable management determined inputs and/or management’s proprietary models. Where models are used, the selection of a particular model to value an option depends upon the contractual terms of, and specific risks inherent in, the option as well as the availability of pricing information in the market. Valuation models require a variety of inputs, including contractual terms, market prices, measures of volatility and correlations of such inputs. Exchange traded options generally will be classified as Level 2. For options that do not trade on exchange but trade in liquid markets, inputs can generally be verified and model selection does not involve significant management judgment. Options are classified within Level 2 on the fair value hierarchy when all of the significant inputs can be corroborated to market evidence. Otherwise such instruments are classified as Level 3.
The following table summarizes the valuation of the Portfolio’s investments by the above fair value hierarchy levels as of October 31, 2014:
Investments in Securities: | Level 1 | Level 2 | Level 3 | Total | ||||||||||||
Assets: | ||||||||||||||||
Corporates – Non-Investment Grade | $ | – 0 | – | $ | 12,055,445 | $ | 124,800 | $ | 12,180,245 | |||||||
Corporates – Investment Grade | – 0 | – | 1,287,295 | – 0 | – | 1,287,295 | ||||||||||
Common Stocks | 1,141,938 | – 0 | – | – 0 | – | 1,141,938 | ||||||||||
Preferred Stocks | 805,573 | – 0 | – | – 0 | – | 805,573 | ||||||||||
Collateralized Mortgage Obligations | – 0 | – | – 0 | – | 699,902 | 699,902 | ||||||||||
Emerging Markets – Corporate Bonds | – 0 | – | 639,750 | – 0 | – | 639,750 | ||||||||||
Quasi-Sovereigns | – 0 | – | 558,931 | – 0 | – | 558,931 | ||||||||||
Bank Loans | – 0 | – | – 0 | – | 466,414 | 466,414 | ||||||||||
Governments – Treasuries | – 0 | – | 90,068 | – 0 | – | 90,068 | ||||||||||
Emerging Markets – Sovereigns | – 0 | – | 87,684 | – 0 | – | 87,684 | ||||||||||
Options Purchased – Calls | – 0 | – | 68,001 | – 0 | – | 68,001 | ||||||||||
Options Purchased – Puts | – 0 | – | 58,623 | – 0 | – | 58,623 | ||||||||||
Warrants | 6,823 | – 0 | – | – 0 | – | 6,823 | ||||||||||
Short-Term Investments | 2,037,924 | – 0 | – | – 0 | – | 2,037,924 | ||||||||||
Liabilities: | ||||||||||||||||
Corporates – Non-Investment Grade | – 0 | – | (5,719,764 | ) | – 0 | – | (5,719,764 | ) | ||||||||
Corporates – Investment Grade | – 0 | – | (1,352,982 | ) | – 0 | – | (1,352,982 | ) | ||||||||
Quasi-Sovereigns | – 0 | – | (602,500 | ) | – 0 | – | (602,500 | ) | ||||||||
|
|
|
|
|
|
|
| |||||||||
Total Investments in Securities | 3,992,258 | 7,170,551 | 1,291,116 | 12,453,925 | ||||||||||||
| 38 | • ALLIANCEBERNSTEIN CREDIT LONG/SHORT PORTFOLIO |
Notes to Financial Statements
Investments in Securities: | Level 1 | Level 2 | Level 3 | Total | ||||||||||||
Other Financial Instruments* : | ||||||||||||||||
Assets: | ||||||||||||||||
Futures | $ | 14,157 | $ | – 0 | – | $ | – 0 | – | $ | 14,157 | # | |||||
Forward Currency Exchange Contracts | – 0 | – | 26,374 | – 0 | – | 26,374 | ||||||||||
Centrally Cleared Credit Default Swaps | – 0 | – | 71,517 | – 0 | – | 71,517 | # | |||||||||
Credit Default Swaps | – 0 | – | 22,197 | – 0 | – | 22,197 | ||||||||||
Total Return Swaps | – 0 | – | 19,593 | – 0 | – | 19,593 | ||||||||||
Liabilities: | ||||||||||||||||
Futures | (24,095 | ) | (3,889 | ) | – 0 | – | (27,984 | )# | ||||||||
Forward Currency Exchange Contracts | – 0 | – | (18,104 | ) | – 0 | – | (18,104 | ) | ||||||||
Call Options Written | – 0 | – | (16,811 | ) | – 0 | – | (16,811 | ) | ||||||||
Put Options Written | – 0 | – | (19,484 | ) | – 0 | – | (19,484 | ) | ||||||||
Credit Default Swaptions Written | – 0 | – | (9,608 | ) | – 0 | – | (9,608 | ) | ||||||||
Centrally Cleared Credit Default Swaps | – 0 | – | (85,636 | ) | – 0 | – | (85,636 | )# | ||||||||
Centrally Cleared Interest Rate Swaps | – 0 | – | (24,792 | ) | – 0 | – | (24,792 | )# | ||||||||
Credit Default Swaps | – 0 | – | (26,233 | ) | – 0 | – | (26,233 | ) | ||||||||
|
|
|
|
|
|
|
| |||||||||
Total^ | $ | 3,982,320 | $ | 7,105,675 | $ | 1,291,116 | $ | 12,379,111 | ||||||||
|
|
|
|
|
|
|
| |||||||||
| * | Other financial instruments are derivative instruments, such as futures, forwards and swaps, which are valued at the unrealized appreciation/depreciation on the instrument. Other financial instruments may also include Options and Swaptions written which are valued at market value. |
| # | Only variation margin receivable/payable at period end is reported within the statement of assets and liabilities. This amount reflects cumulative appreciation/(depreciation) of exchange traded derivatives in the portfolio of investments. |
| ^ | There were no transfers between any levels during the reporting period. |
The Portfolio recognizes all transfers between levels of the fair value hierarchy assuming the financial instruments were transferred at the beginning of the reporting period.
The following is a reconciliation of investments in which significant unobservable inputs (Level 3) were used in determining fair value.
| Corporates - Non- Investment Grade | Collateralized Mortgage Obligations | Bank Loans | ||||||||||
Balance as of 5/07/14(a) | $ | – 0 | – | $ | – 0 | – | $ | – 0 | – | |||
Accrued discounts/(premiums) | (33 | ) | (429 | ) | (48 | ) | ||||||
Realized gain (loss) | 904 | 156 | (5 | ) | ||||||||
Change in unrealized appreciation/depreciation | 3,156 | (15,781 | ) | (7,319 | ) | |||||||
Purchases | 140,723 | 747,732 | 475,230 | |||||||||
Sales | (19,950 | ) | (31,776 | ) | (1,444 | ) | ||||||
Transfers in to Level 3 | – 0 | – | – 0 | – | – 0 – | |||||||
Transfers out of Level 3 | – 0 | – | – 0 | – | – 0 – | |||||||
|
|
|
|
|
| |||||||
Balance as of 10/31/14 | $ | 124,800 | $ | 699,902 | $ | 466,414 | ||||||
|
|
|
|
|
| |||||||
Net change in unrealized appreciation/depreciation from investments held as of 10/31/14* | $ | 3,156 | $ | (15,781 | ) | $ | (7,319 | ) | ||||
|
|
|
|
|
| |||||||
| ALLIANCEBERNSTEIN CREDIT LONG/SHORT PORTFOLIO • | 39 |
Notes to Financial Statements
| Total | ||||||||
Balance as of 5/07/14(a) | $ | – 0 | – | |||||
Accrued discounts/(premiums) | (510 | ) | ||||||
Realized gain (loss) | 1,055 | |||||||
Change in unrealized appreciation/depreciation | (19,944 | ) | ||||||
Purchases | 1,363,685 | |||||||
Sales | (53,170 | ) | ||||||
Transfers in to Level 3 | – 0 | – | ||||||
Transfers out of Level 3 | – 0 | – | ||||||
|
| |||||||
Balance as of 10/31/14 | $ | 1,291,116 | ||||||
|
| |||||||
Net change in unrealized appreciation/depreciation from investments held as of 10/31/14* | $ | (19,944 | ) | |||||
|
| |||||||
| (a) | Commencement of Operations. |
| * | The unrealized appreciation/depreciation is included in net change in unrealized appreciation/depreciation of investments in the accompanying statement of operations. |
As of October 31, 2014, all Level 3 securities were priced by third party vendors.
The Adviser has established a Valuation Committee (the “Committee”) which is responsible for overseeing the pricing and valuation of all securities held in the Portfolio. The Committee operates under pricing and valuation policies and procedures established by the Adviser and approved by the Board, including pricing policies which set forth the mechanisms and processes to be employed on a daily basis to implement these policies and procedures. In particular, the pricing policies describe how to determine market quotations for securities and other instruments. The Committee’s responsibilities include: 1) fair value and liquidity determinations (and oversight of any third parties to whom any responsibility for fair value and liquidity determinations is delegated), and 2) regular monitoring of the Adviser’s pricing and valuation policies and procedures and modification or enhancement of these policies and procedures (or recommendation of the modification of these policies and procedures) as the Committee believes appropriate.
The Committee is also responsible for monitoring the implementation of the pricing policies by the Adviser’s Pricing Group (the “Pricing Group”) and a third party which performs certain pricing functions in accordance with the pricing policies. The Pricing Group is responsible for the oversight of the third party on a day-to-day basis. The Committee and the Pricing Group perform a series of activities to provide reasonable assurance of the accuracy of prices including: 1) periodic vendor due diligence meetings, review of methodologies, new developments and processes at vendors, 2) daily comparison of security valuation versus prior day for all securities that exceeded established thresholds, and 3) daily review of unpriced, stale, and variance reports with exceptions reviewed by senior management and the Committee.
In addition, several processes outside of the pricing process are used to monitor valuation issues including: 1) performance and performance attribution reports
| 40 | • ALLIANCEBERNSTEIN CREDIT LONG/SHORT PORTFOLIO |
Notes to Financial Statements
are monitored for anomalous impacts based upon benchmark performance, and 2) portfolio managers review all portfolios for performance and analytics (which are generated using the Adviser’s prices).
3. Currency Translation
Assets and liabilities denominated in foreign currencies and commitments under forward currency exchange contracts are translated into U.S. dollars at the mean of the quoted bid and ask prices of such currencies against the U.S. dollar. Purchases and sales of portfolio securities are translated into U.S. dollars at the rates of exchange prevailing when such securities were acquired or sold. Income and expenses are translated into U.S. dollars at rates of exchange prevailing when accrued.
Net realized gain or loss on foreign currency transactions represents foreign exchange gains and losses from sales and maturities of foreign fixed income investments, foreign currency exchange contracts, holding of foreign currencies, currency gains or losses realized between the trade and settlement dates on foreign investment transactions, and the difference between the amounts of dividends, interest and foreign withholding taxes recorded on the Portfolio’s books and the U.S. dollar equivalent amounts actually received or paid. Net unrealized currency gains and losses from valuing foreign currency denominated assets and liabilities at period end exchange rates are reflected as a component of net unrealized appreciation or depreciation of foreign currency denominated assets and liabilities.
4. Taxes
It is the Portfolio’s policy to meet the requirements of the Internal Revenue Code applicable to regulated investment companies and to distribute all of its investment company taxable income and net realized gains, if any, to shareholders. Therefore, no provisions for federal income or excise taxes are required. The Portfolio may be subject to taxes imposed by countries in which it invests. Such taxes are generally based on income and/or capital gains earned or repatriated. Taxes are accrued and applied to net investment income, net realized gains and net unrealized appreciation/depreciation as such income and/or gains are earned.
In accordance with U.S. GAAP requirements regarding accounting for uncertainties in income taxes, management has analyzed the Portfolio’s tax positions taken or expected to be taken on federal and state income tax returns for the current tax year and has concluded that no provision for income tax is required in the Portfolio’s financial statements.
5. Investment Income and Investment Transactions
Dividend income is recorded on the ex-dividend date or as soon as the Portfolio is informed of the dividend. Interest income is accrued daily. Investment transactions
| ALLIANCEBERNSTEIN CREDIT LONG/SHORT PORTFOLIO • | 41 |
Notes to Financial Statements
are accounted for on the date the securities are purchased or sold. Investment gains or losses are determined on the identified cost basis. The Portfolio amortizes premiums and accretes discounts as adjustments to interest income.
6. Class Allocations
All income earned and expenses incurred by the Portfolio are borne on a pro-rata basis by each outstanding class of shares, based on the proportionate interest in the Portfolio represented by the net assets of such class, except for class specific expenses which are allocated to the respective class. Realized and unrealized gains and losses are allocated among the various share classes based on respective net assets.
7. Dividends and Distributions
Dividends and distributions to shareholders, if any, are recorded on the ex-dividend date. Income dividends and capital gains distributions are determined in accordance with federal tax regulations and may differ from those determined in accordance with U.S. GAAP. To the extent these differences are permanent, such amounts are reclassified within the capital accounts based on their federal tax basis treatment; temporary differences do not require such reclassification.
8. Offering Expenses
Offering expenses of $85,307 were deferred and amortized on a straight line basis over a one year period starting from May 7, 2014 (commencement of operations).
NOTE B
Advisory Fee and Other Transactions with Affiliates
Under the terms of the investment advisory agreement, the Fund pays the Adviser a management fee at an annual rate of .90% of the Fund’s average daily net assets. The fee is accrued daily and paid monthly. The Adviser has agreed to waive its fees and bear certain expenses to the extent necessary to limit total operating expenses on an annual basis to 1.35%, 2.10%, and 1.10% of daily average net assets for Class A, Class C, and Advisor Class shares, respectively. Under the agreement, any fees waived and expenses borne by the Adviser may be reimbursed by the Fund until the end of the third fiscal year after the fiscal period in which the fee was waived or the expense was borne, provided that no reimbursement payment will be made that would cause the Fund’s total annual operating expenses to exceed the net fee percentage set forth in the preceding sentence. This fee waiver and/or expense reimbursement agreement may not be terminated by the Adviser before June 19, 2015. For the period ended October 31, 2014, such reimbursements/waivers amounted to $252,520.
Pursuant to the investment advisory agreement, the Portfolio may reimburse the Adviser for certain legal and accounting services provided to the Portfolio by the Adviser. For the period ended October 31, 2014, the reimbursement for such services amounted to $38,604.
| 42 | • ALLIANCEBERNSTEIN CREDIT LONG/SHORT PORTFOLIO |
Notes to Financial Statements
The Portfolio compensates AllianceBernstein Investor Services, Inc. (“ABIS”), a wholly-owned subsidiary of the Adviser, under a Transfer Agency Agreement for providing personnel and facilities to perform transfer agency services for the Portfolio. ABIS may make payments to intermediaries that provide omnibus account services, sub-accounting services and/or networking services. Such compensation retained by ABIS amounted to $7,509 for the period ended October 31, 2014.
AllianceBernstein Investments, Inc. (the “Distributor”), a wholly-owned subsidiary of the Adviser, serves as the distributor of the Portfolio’s shares. The Distributor has advised the Portfolio that it has retained front-end sales charges of $62 from the sale of Class A shares and received $0 in contingent deferred sales charges imposed upon redemptions by shareholders of Class C shares for the period ended October 31, 2014.
The Fund may invest in the AllianceBernstein Fixed-Income Shares, Inc. – Government STIF Portfolio (“Government STIF Portfolio”), an open-end management investment company managed by the Adviser. The Government STIF Portfolio is offered as a cash management option to mutual funds and other institutional accounts of the Adviser, and is not available for direct purchase by members of the public. The Government STIF Portfolio pays no investment management fees but does bear its own expenses. A summary of the Portfolio’s transactions in shares of the Government STIF Portfolio for the period ended October 31, 2014 is as follows:
Market Value | Purchases at Cost (000) | Sales Proceeds (000) | Market Value October 31, 2014 (000) | Dividend Income (000) | ||||||||||||
| $ – 0 – | $ | 28,741 | $ | 26,703 | $ | 2,038 | $ | 1 | ||||||||
| (a) | Commencement of operations. |
Brokerage commissions paid on investment transactions for the period ended October 31, 2014 amounted to $0, of which $0 and $0, respectively, was paid to Sanford C. Bernstein & Co. LLC and Sanford C. Bernstein Limited, affiliates of the Adviser.
NOTE C
Distribution Services Agreement
The Fund has adopted a Distribution Services Agreement (the “Agreement”) pursuant to Rule 12b-1 under the Investment Company Act of 1940. Under the Agreement, the Portfolio pays distribution and servicing fees to the Distributor at an annual rate of up to .25% of the Portfolio’s average daily net assets attributable to Class A shares, 1% of the Portfolio’s average daily net assets attributable to Class C shares. There are no distribution and servicing fees on the Advisor Class shares. The fees are accrued daily and paid monthly. The Agreement provides that the Distributor will use such payments in their entirety for distribution assistance and promotional activities. Since the commencement of the Portfolio’s
| ALLIANCEBERNSTEIN CREDIT LONG/SHORT PORTFOLIO • | 43 |
Notes to Financial Statements
operations, the Distributor has incurred expenses in excess of the distribution costs reimbursed by the Portfolio in the amounts of $-0- for Class C. While such costs may be recovered from the Portfolio in future periods so long as the Agreement is in effect, the rate of the distribution and servicing fees payable under the Agreement may not be increased without a shareholder vote. In accordance with the Agreement, there is no provision for recovery of unreimbursed distribution costs incurred by the Distributor beyond the current fiscal year for Class A shares. The Agreement also provides that the Adviser may use its own resources to finance the distribution of the Portfolio’s shares.
NOTE D
Investment Transactions
Purchases and sales of investment securities (excluding short-term investments) for the period ended October 31, 2014 were as follows:
Purchases | Sales | Securities Sold Short | Covers on Securities Sold Short | |||||||||
| $ 30,281,638 | $ | 11,969,977 | $ | 11,447,436 | $ | 3,358,542 | ||||||
During the period ended October 31, 2014, there were no purchases or sales of U.S. Government Securities.
The cost of investments for federal income tax purposes, gross unrealized appreciation and unrealized depreciation are as follows:
| Gross Unrealized | ||||||||||||||||||||
Cost of | Appreciation on Investments | Depreciation on Investments | Net Unrealized Depreciation on Investments | Net Unrealized Appreciation on Securities Sold Short | Net Unrealized Depreciation | |||||||||||||||
| $ 20,507,134 | $ | 210,604 | $ | (588,567) | $ | (377,963) | $ | 281,092(a) | $ | (96,871) | ||||||||||
| (a) | Gross unrealized appreciation was $310,983 and gross unrealized depreciation was $(29,891), resulting in net unrealized appreciation of $281,092. |
1. Derivative Financial Instruments
The Portfolio may use derivatives in an effort to earn income and enhance returns, to replace more traditional direct investments, to obtain exposure to otherwise inaccessible markets (collectively, “investment purposes”), or to hedge or adjust the risk profile of its portfolio.
The principal types of derivatives utilized by the Portfolio, as well as the methods in which they may be used are:
| • | Futures |
The Portfolio may buy or sell futures for investment purposes or for the purpose of hedging its portfolio against adverse effects of potential
| 44 | • ALLIANCEBERNSTEIN CREDIT LONG/SHORT PORTFOLIO |
Notes to Financial Statements
movements in the market. The Portfolio bear the market risk that arises from changes in the value of these instruments and the imperfect correlation between movements in the price of the futures and movements in the price of the assets, reference rates or indices which they are designed to track. Among other things, the Portfolio may purchase or sell futures for foreign currencies or options thereon for non-hedging purposes as a means of making direct investment in foreign currencies, as described below under “Currency Transactions”.
At the time the Portfolio enters into futures, the Portfolio deposits and maintains as collateral an initial margin with the broker, as required by the exchange on which the transaction is effected. Such amount is shown as due from broker on the statement of assets and liabilities. Pursuant to the contract, the Portfolio agrees to receive from or pay to the broker an amount of cash equal to the daily fluctuation in the value of the contract. Such receipts or payments are known as variation margin and are recorded by the Portfolio as unrealized gains or losses. Risks may arise from the potential inability of a counterparty to meet the terms of the contract. The credit/counterparty risk for exchange-traded futures is generally less than privately negotiated futures, since the clearinghouse, which is the issuer or counterparty to each exchange-traded future, has robust risk mitigation standards, including the requirement to provide initial and variation margin. When the contract is closed, the Portfolio records a realized gain or loss equal to the difference between the value of the contract at the time it was opened and the time it was closed.
Use of long futures subjects the Portfolio to risk of loss in excess of the amounts shown on the statement of assets and liabilities, up to the notional value of the futures. Use of short futures subjects the Portfolio to unlimited risk of loss. Under some circumstances, futures exchanges may establish daily limits on the amount that the price of futures can vary from the previous day’s settlement price, which could effectively prevent liquidation of unfavorable positions.
During the period ended October 31, 2014, the Portfolio held futures for hedging and non-hedging purposes.
| • | Forward Currency Exchange Contracts |
The Portfolio may enter into forward currency exchange contracts in order to hedge its exposure to changes in foreign currency exchange rates on its foreign portfolio holdings, to hedge certain firm purchase and sale commitments denominated in foreign currencies and for non-hedging purposes as a means of making direct investments in foreign currencies, as described below under “Currency Transactions”.
A forward currency exchange contract is a commitment to purchase or sell a foreign currency at a future date at a negotiated forward rate. The gain or
| ALLIANCEBERNSTEIN CREDIT LONG/SHORT PORTFOLIO • | 45 |
Notes to Financial Statements
loss arising from the difference between the original contract and the closing of such contract would be included in net realized gain or loss on foreign currency transactions. Fluctuations in the value of open forward currency exchange contracts are recorded for financial reporting purposes as unrealized appreciation and/or depreciation by the Portfolio. Risks may arise from the potential inability of a counterparty to meet the terms of a contract and from unanticipated movements in the value of a foreign currency relative to the U.S. dollar.
During the period ended October 31, 2014, the Portfolio held forward currency exchange contracts for hedging and non-hedging purposes.
| • | Option Transactions |
For hedging and investment purposes, the Portfolio may purchase and write (sell) put and call options on U.S. and foreign securities and foreign currencies that are traded on U.S. and foreign securities exchanges and over-the-counter markets. Among other things, the Portfolio may also use options transactions for non-hedging purposes as a means of making direct investments in foreign currencies, as described below under “Currency Transactions” and may use options strategies involving the purchase and/or writing of various combinations of call and/or put options, for hedging and investment purposes.
The risk associated with purchasing an option is that the Portfolio pays a premium whether or not the option is exercised. Additionally, the Portfolio bears the risk of loss of the premium and change in market value should the counterparty not perform under the contract. Put and call options purchased are accounted for in the same manner as portfolio securities. The cost of securities acquired through the exercise of call options is increased by premiums paid. The proceeds from securities sold through the exercise of put options are decreased by the premiums paid.
When the Portfolio writes an option, the premium received by the Portfolio is recorded as a liability and is subsequently adjusted to the current market value of the option written. Premiums received from written options which expire unexercised are recorded by the Portfolio on the expiration date as realized gains from options written. The difference between the premium received and the amount paid on effecting a closing purchase transaction, including brokerage commissions, is also treated as a realized gain, or if the premium received is less than the amount paid for the closing purchase transaction, as a realized loss. If a call option is exercised, the premium received is added to the proceeds from the sale of the underlying security or currency in determining whether the Portfolio has realized a gain or loss. If a put option is exercised, the premium received reduces the cost basis of the security or currency purchased by the Portfolio. In writing an option, the Portfolio bears the market risk of an unfavorable change in the price of the security or currency underlying the
| 46 | • ALLIANCEBERNSTEIN CREDIT LONG/SHORT PORTFOLIO |
Notes to Financial Statements
written option. Exercise of an option written by the Portfolio could result in the Portfolio selling or buying a security or currency at a price different from the current market value.
The Portfolio may also invest in options on swap agreements, also called “swaptions”. A swaption is an option that gives the buyer the right, but not the obligation, to enter into a swap on a future date in exchange for paying a market-based “premium”. A receiver swaption gives the owner the right to receive the total return of a specified asset, reference rate, or index. A payer swaption gives the owner the right to pay the total return on a specified asset, reference rate, or index. Swaptions also include options that allow an existing swap to be terminated or extended by one of the counterparties.
During the period ended October 31, 2014, the Portfolio held purchased options for hedging and non-hedging purposes. During the period ended October 31, 2014, the Portfolio held written options for hedging and non-hedging purposes.
For the period ended October 31, 2014, the Portfolio had the following transactions in written options:
| Number of Contracts | Premiums Received | |||||||
Options written outstanding as of 5/07/14(a) | – 0 | – | $ | – 0 | – | |||
Options written | 872 | 53,179 | ||||||
Options expired | (294 | ) | (10,537 | ) | ||||
Options bought back | (270 | ) | (9,178 | ) | ||||
Options exercised | – 0 | – | – 0 | – | ||||
|
|
|
| |||||
Options written outstanding as of 10/31/14 | 308 | $ | 33,464 | |||||
|
|
|
| |||||
| Notional Amount | Premiums Received | |||||||
Swaptions written outstanding as of 5/07/14(a) | – 0 | – | $ | – 0 | – | |||
Swaptions written | 17,716,199 | 35,637 | ||||||
Swaptions expired | (8,926,199 | ) | (11,677 | ) | ||||
Swaptions bought back | (3,610,000 | ) | (10,549 | ) | ||||
Swaptions exercised | – 0 | – | – 0 | – | ||||
|
|
|
| |||||
Swaptions written outstanding as of 10/31/14 | 5,180,000 | $ | 13,411 | |||||
|
|
|
| |||||
| (a) | Commencement of operations. |
| • | Swaps |
The Portfolio may enter into swaps to hedge its exposure to interest rates, credit risk, or currencies. The Portfolio may also enter into swaps for non-hedging purposes as a means of gaining market exposures, including by making direct investments in foreign currencies, as described below under “Currency Transactions” or in order to take a “long” or “short” position with respect to an underlying referenced asset described below under
| ALLIANCEBERNSTEIN CREDIT LONG/SHORT PORTFOLIO • | 47 |
Notes to Financial Statements
“Total Return Swaps”. A swap is an agreement that obligates two parties to exchange a series of cash flows at specified intervals based upon or calculated by reference to changes in specified prices or rates for a specified amount of an underlying asset. The payment flows are usually netted against each other, with the difference being paid by one party to the other. In addition, collateral may be pledged or received by the Portfolio in accordance with the terms of the respective swaps to provide value and recourse to the Portfolio or its counterparties in the event of default, bankruptcy or insolvency by one of the parties to the swap.
Risks may arise as a result of the failure of the counterparty to the swap to comply with the terms of the swap. The loss incurred by the failure of a counterparty is generally limited to the net interim payment to be received by the Portfolio, and/or the termination value at the end of the contract. Therefore, the Portfolio considers the creditworthiness of each counterparty to a swap in evaluating potential counterparty risk. This risk is mitigated by having a netting arrangement between the Portfolio and the counterparty and by the posting of collateral by the counterparty to the Portfolio to cover the Portfolio’s exposure to the counterparty. Additionally, risks may arise from unanticipated movements in interest rates or in the value of the underlying securities. The Portfolio accrues for the interim payments on swaps on a daily basis, with the net amount recorded within unrealized appreciation/depreciation of swaps on the statement of assets and liabilities, where applicable. Once the interim payments are settled in cash, the net amount is recorded as realized gain/(loss) on swaps on the statement of operations, in addition to any realized gain/(loss) recorded upon the termination of swaps. Upfront premiums paid or received are recognized as cost or proceeds on the statement of assets and liabilities and are amortized on a straight line basis over the life of the contract. Amortized upfront premiums are included in net realized gain/(loss) from swaps on the statement of operations. Fluctuations in the value of swaps are recorded as a component of net change in unrealized appreciation/depreciation of swaps on the statement of operations.
Certain standardized swaps, including certain interest rate swaps and credit default swaps, are (or soon will be) subject to mandatory central clearing. Cleared swaps are transacted through futures commission merchants (“FCMs”) that are members of central clearinghouses, with the clearinghouse serving as central counterparty, similar to transactions in futures contracts. Centralized clearing will be required for additional categories of swaps on a phased-in basis based on requirements published by the Securities and Exchange Commission and Commodity Futures Trading Commission.
At the time the Portfolio enters into a centrally cleared swap, the Portfolio deposits and maintains as collateral an initial margin with the broker, as
| 48 | • ALLIANCEBERNSTEIN CREDIT LONG/SHORT PORTFOLIO |
Notes to Financial Statements
required by the exchange on which the transaction is effected. Such amount is shown as due from broker on the statement of assets and liabilities. Pursuant to the contract, the Portfolio agrees to receive from or pay to the broker an amount of cash equal to the daily fluctuation in the value of the contract. Such receipts or payments are known as variation margin and are recorded by the Portfolio as unrealized gains or losses. Risks may arise from the potential inability of a counterparty to meet the terms of the contract. The credit/counterparty risk for swaps cleared through a central clearinghouse’s exchange is generally less than privately negotiated swaps, since the clearinghouse, which is the issuer or counterparty to each exchange-traded swap, has robust risk mitigation standards, including the requirement to provide initial and variation margin. When the contract is closed, the Portfolio records a realized gain or loss equal to the difference between the value of the contract at the time it was opened and the time it was closed.
Interest Rate Swaps:
The Portfolio is subject to interest rate risk exposure in the normal course of pursuing its investment objectives. Because the Portfolio holds fixed rate bonds, the value of these bonds may decrease if interest rates rise. To help hedge against this risk and to maintain its ability to generate income at prevailing market rates, the Portfolio may enter into interest rate swaps. Interest rate swaps are agreements between two parties to exchange cash flows based on a notional amount. The Portfolio may elect to pay a fixed rate and receive a floating rate, or, receive a fixed rate and pay a floating rate on a notional amount.
In addition, the Portfolio may also enter into interest rate swap transactions to preserve a return or spread on a particular investment or portion of its portfolio, or protecting against an increase in the price of securities the Portfolio anticipates purchasing at a later date. Interest rate swaps involve the exchange by a Portfolio with another party of their respective commitments to pay or receive interest (e.g., an exchange of floating rate payments for fixed rate payments) computed based on a contractually-based principal (or “notional”) amount. Interest rate swaps are entered into on a net basis (i.e., the two payment streams are netted out, with the Portfolio receiving or paying, as the case may be, only the net amount of the two payments).
During the period ended October 31, 2014, the Portfolio held interest rate swaps for hedging purposes.
Credit Default Swaps:
The Portfolio may enter into credit default swaps, including to manage its exposure to the market or certain sectors of the market, to reduce its risk exposure to defaults by corporate and sovereign issuers held by the Portfolio, or to create exposure to corporate or sovereign issuers to which
| ALLIANCEBERNSTEIN CREDIT LONG/SHORT PORTFOLIO • | 49 |
Notes to Financial Statements
it is not otherwise exposed. The Portfolio may purchase credit protection (“Buy Contract”) or provide credit protection (“Sale Contract”) on the referenced obligation of the credit default swap. During the term of the swap, the Portfolio receives/(pays) fixed payments from/(to) the respective counterparty, calculated at the agreed upon rate applied to the notional amount. If the Portfolio is a buyer/(seller) of protection and a credit event occurs, as defined under the terms of the swap, the Portfolio will either (i) receive from the seller/(pay to the buyer) of protection an amount equal to the notional amount of the swap (the “Maximum Payout Amount”) and deliver/(take delivery of) the referenced obligation or (ii) receive/(pay) a net settlement amount in the form of cash or securities equal to the notional amount of the swap less the recovery value of the referenced obligation.
In certain circumstances Maximum Payout Amounts may be partially offset by recovery values of the respective referenced obligations, upfront premium received upon entering into the agreement, or net amounts received from settlement of buy protection credit default swaps entered into by the Portfolio for the same reference obligation with the same counterparty. As of October 31, 2014, the Portfolio did not have Buy Contracts outstanding with respect to the same referenced obligation and same counterparty for its Sales Contracts outstanding.
Credit default swaps may involve greater risks than if a Portfolio had invested in the referenced obligation directly. Credit default swaps are subject to general market risk, liquidity risk, counterparty risk and credit risk. If the Portfolio is a buyer of protection and no credit event occurs, it will lose the payments it made to its counterparty. If the Portfolio is a seller of protection and a credit event occurs, the value of the referenced obligation received by the Portfolio coupled with the periodic payments previously received, may be less than the Maximum Payout Amount it pays to the buyer, resulting in a net loss to the Portfolio.
During the period ended October 31, 2014, the Portfolio held credit default swaps for hedging and non-hedging purposes.
Implied credit spreads over U.S. Treasuries comparable maturity utilized in determining the market value of credit default swaps on issuers as of period end are disclosed in the portfolio of investments. The implied spreads serve as an indicator of the current status of the payment/performance risk and typically reflect the likelihood of default by the issuer of the referenced obligation. The implied credit spread of a particular reference obligation also reflects the cost of buying/selling protection and may reflect upfront payments required to be made to enter into the agreement. Widening credit spreads typically represent a deterioration of the referenced obligation’s credit soundness and greater likelihood of default or other
| 50 | • ALLIANCEBERNSTEIN CREDIT LONG/SHORT PORTFOLIO |
Notes to Financial Statements
credit event occurring as defined under the terms of the agreement. A credit spread identified as “Defaulted” indicates a credit event has occurred for the referenced obligation.
Total Return Swaps:
The Portfolio may enter into total return swaps in order take a “long” or “short” position with respect to an underlying referenced asset. The Portfolio is subject to market price volatility of the underlying referenced asset. A total return swap involves commitments to pay interest in exchange for a market linked return based on a notional amount. To the extent that the total return of the security, group of securities or index underlying the transaction exceeds or falls short of the offsetting interest obligation, the Portfolio will receive a payment from or make a payment to the counterparty.
During the period ended October 31, 2014, the Portfolio held total return swaps for hedging and non-hedging purposes.
The Fund typically enters into International Swaps and Derivatives Association, Inc. Master Agreements (“ISDA Master Agreement”) or similar master agreements (collectively, “Master Agreements”) with its OTC derivative contract counterparties in order to, among other things, reduce its credit risk to counterparties. ISDA Master Agreements include provisions for general obligations, representations, collateral and events of default or termination. Under an ISDA Master Agreement, the Fund typically may offset with the counterparty certain derivative financial instrument’s payables and/or receivables with collateral held and/or posted and create one single net payment (close-out netting) in the event of default or termination.
Various Master Agreements govern the terms of certain transactions with counterparties, including transactions such as exchange-traded derivative transactions, repurchase and reverse repurchase agreements. These Master Agreements typically attempt to reduce the counterparty risk associated with such transactions by specifying credit protection mechanisms and providing standardization that improves legal certainty. Cross-termination provisions under Master Agreements typically provide that a default in connection with one transaction between the Portfolio and a counterparty gives the non-defaulting party the right to terminate any other transactions in place with the defaulting party to create one single net payment due to/due from the defaulting party. In the event of a default by a Master Agreements counterparty, the return of collateral with market value in excess of the Portfolio’s net liability, held by the defaulting party, may be delayed or denied.
The Portfolio’s Master Agreements may contain provisions for early termination of OTC derivative transactions in the event the net assets of the Portfolio decline below specific levels (“net asset contingent features”). If these levels are
| ALLIANCEBERNSTEIN CREDIT LONG/SHORT PORTFOLIO • | 51 |
Notes to Financial Statements
triggered, the Portfolio’s counterparty has the right to terminate such transaction and require the Portfolio to pay or receive a settlement amount in connection with the terminated transaction. For additional details, please refer to netting arrangements by counterparty tables below.
Asset Derivatives | Liability Derivatives | |||||||||||
Derivative Type | Statement of | Fair Value | Statement of | Fair Value | ||||||||
Interest rate contracts | Receivable/Payable for variation margin on exchange-traded derivatives | $ | 14,157 | * | Receivable/Payable for variation margin on exchange-traded derivatives | $ | 48,887 | * | ||||
Credit contracts | Receivable/Payable for variation margin on exchange-traded derivatives | 71,517 | * | Receivable/Payable for variation margin on exchange-traded derivatives | 85,636 | * | ||||||
Equity contracts | Receivable/Payable for variation margin on exchange-traded derivatives | 3,889 | * | |||||||||
Foreign exchange contracts | Unrealized appreciation on forward currency exchange contracts |
| 26,374 |
| Unrealized depreciation on forward currency exchange contracts |
| 18,104 |
| ||||
Interest rate contracts | Investments in securities, at value |
| 4,755 |
| ||||||||
Credit contracts | Investments in securities, at value | 25,294 | ||||||||||
Equity contracts | Investments in securities, at value | 96,575 | ||||||||||
Interest rate contracts | Swaptions written, at value |
| 9,608 |
| ||||||||
Equity contracts | Options written, at value | 36,295 | ||||||||||
Credit contracts | Unrealized appreciation on credit default swaps | 22,197 | Unrealized depreciation on credit default swaps | 26,233 | ||||||||
Equity contracts | Unrealized appreciation on total return swaps | 19,593 | ||||||||||
|
|
|
| |||||||||
Total | $ | 280,462 | $ | 228,652 | ||||||||
|
|
|
| |||||||||
| * | Only variation margin receivable/payable at period end is reported within the statement of assets and liabilities. This amount reflects cumulative appreciation/(depreciation) of exchange-traded derivatives as reported in the portfolio of investments. |
| 52 | • ALLIANCEBERNSTEIN CREDIT LONG/SHORT PORTFOLIO |
Notes to Financial Statements
The effect of derivative instruments on the statement of operations for the period ended October 31, 2014:
Derivative Type | Location of | Realized Gain or (Loss) on Derivatives | Change in Unrealized Appreciation or (Depreciation) | |||||||
Interest rate contracts | Net realized gain (loss) on futures; Net change in unrealized appreciation/depreciation of futures | $ | (52,182 | ) | $ | (9,938 | ) | |||
Equity contracts | Net realized gain (loss) on futures; Net change in unrealized appreciation/depreciation of futures | (7,295 | ) | (3,889 | ) | |||||
Foreign exchange contracts | Net realized gain (loss) on foreign currency transactions; Net change in unrealized appreciation/depreciation of foreign currency denominated assets and liabilities | 1,813 | 8,270 | |||||||
Interest rate contracts | Net realized gain (loss) on investment transactions; Net change in unrealized appreciation/depreciation of investments | (14,185 | ) | (5,266 | ) | |||||
Foreign exchange contracts | Net realized gain (loss) on investment transactions; Net change in unrealized appreciation/depreciation of investments | (10,253 | ) | – 0 | – | |||||
Credit contracts | Net realized gain (loss) on investment transactions; Net change in unrealized appreciation/depreciation of investments | (22,564 | ) | (6,771 | ) | |||||
Equity contracts | Net realized gain (loss) on investment transactions; Net change in unrealized appreciation/depreciation of investments | 42,039 | (23,051 | ) | ||||||
| ALLIANCEBERNSTEIN CREDIT LONG/SHORT PORTFOLIO • | 53 |
Notes to Financial Statements
Derivative Type | Location of Gain or (Loss) on Derivatives | Realized Gain or (Loss) on Derivatives | Change in Unrealized Appreciation or (Depreciation) | |||||||
Credit contracts | Net realized gain (loss) on swaptions written; Net change in unrealized appreciation/depreciation of swaptions written | $ | 19,454 | $ | 3,803 | |||||
Equity contracts | Net realized gain (loss) on options written; Net change in unrealized appreciation/depreciation of options written | (16,567 | ) | (2,831 | ) | |||||
Interest rate contracts | Net realized gain (loss) on swaps; Net change in unrealized appreciation/depreciation of swaps | (13,622 | ) | (24,792 | ) | |||||
Credit contracts | Net realized gain (loss) on swaps; Net change in unrealized appreciation/depreciation of swaps | 30,927 | (18,155 | ) | ||||||
Equity contracts | Net realized gain (loss) on swaps; Net change in unrealized appreciation/depreciation of swaps | (31,414 | ) | 19,593 | ||||||
|
|
|
| |||||||
Total | $ | (73,849 | ) | $ | (63,027 | ) | ||||
|
|
|
| |||||||
The following table represents the volume of the Fund’s derivative transactions during the period ended October 31, 2014:
Futures: | ||||
Average original value of buy contracts | $ | 1,973,033 | ||
Average original value of sale contracts | $ | 3,069,725 | ||
Forward Currency Exchange Contracts: | ||||
Average principal amount of buy contracts | $ | 532,149 | ||
Average principal amount of sale contracts | $ | 1,284,527 | ||
Purchased Options: | ||||
Average monthly cost | $ | 92,628 | ||
Centrally Cleared Interest Rate Swaps: | ||||
Average notional amount | $ | 2,000,000 | ||
Credit Default Swaps: | ||||
Average notional amount of buy contracts | $ | 3,842,749 | ||
Average notional amount of sale contracts | $ | 3,225,706 | ||
Centrally Cleared Credit Default Swaps: | ||||
Average notional amount of buy contracts | $ | 2,898,067 | ||
Average notional amount of sale contracts | $ | 735,582 | (a) | |
Total Return Swaps: | ||||
Average notional amount | $ | 4,333,333 | ||
| (a) | Positions were open for four months during the period. |
| 54 | • ALLIANCEBERNSTEIN CREDIT LONG/SHORT PORTFOLIO |
Notes to Financial Statements
For financial reporting purposes, the Portfolio does not offset derivative assets and derivative liabilities that are subject to netting arrangements in the statement of assets and liabilities.
All derivatives held at period end were subject to netting arrangements. The following table presents the Portfolio’s derivative assets and liabilities by counterparty net of amounts available for offset under Master Agreements (“MA”) and net of the related collateral received/ pledged by the Fund as of October 31, 2014:
Counterparty | Derivative Assets Subject to a MA | Derivative Available for Offset | Cash Collateral Received | Security Collateral Received | Net Amount of Derivatives Assets | |||||||||||||||
Exchange-Traded Derivatives: | ||||||||||||||||||||
Morgan Stanley & Co., LLC* | $ | 102,709 | $ | (40,201 | ) | $ | – 0 | – | $ | – 0 | – | $ | 62,508 | |||||||
|
|
|
|
|
|
|
|
|
| |||||||||||
Total | $ | 102,709 | $ | (40,201 | ) | $ | – 0 | – | $ | – 0 | – | $ | 62,508 | |||||||
|
|
|
|
|
|
|
|
|
| |||||||||||
OTC Derivatives: | ||||||||||||||||||||
Bank of America, N.A | $ | 40,743 | $ | (40,743 | ) | $ | – 0 | – | $ | – 0 | – | $ | – 0 | – | ||||||
Citibank, NA | 50,275 | (25,577 | ) | – 0 | – | – 0 | – | 24,698 | ||||||||||||
Credit Suisse International | 27,216 | (27,216 | ) | – 0 | – | – 0 | – | – 0 | – | |||||||||||
Goldman Sachs & Co. | 28,205 | (2,724 | ) | – 0 | – | – 0 | – | 25,481 | ||||||||||||
Goldman Sachs International | 4,385 | – 0 | – | – 0 | – | – 0 | – | 4,385 | ||||||||||||
JPMorgan Chase Bank, NA | 5,771 | (5,771 | ) | – 0 | – | – 0 | – | – 0 | – | |||||||||||
Morgan Stanley Capital Services LLC | 8,443 | – 0 | – | – 0 | – | – 0 | – | 8,443 | ||||||||||||
State Street Bank & Trust Co. | 26,132 | (2,455 | ) | – 0 | – | – 0 | – | 23,677 | ||||||||||||
|
|
|
|
|
|
|
|
|
| |||||||||||
Total | $ | 191,170 | $ | (104,486 | ) | $ | – 0 | – | $ | – 0 | – | $ | 86,684 ^ | |||||||
|
|
|
|
|
|
|
|
|
| |||||||||||
Counterparty | Derivative Liabilities Subject to a MA | Derivative Available for Offset | Cash Collateral Pledged | Security Collateral Pledged | Net Amount of Derivatives Liabilities | |||||||||||||||
Exchange-Traded Derivatives: | ||||||||||||||||||||
Morgan Stanley & Co., LLC* | $ | 40,201 | $ | (40,201 | ) | $ | – 0 | – | $ | – 0 | – | $ | – 0 | – | ||||||
|
|
|
|
|
|
|
|
|
| |||||||||||
Total | $ | 40,201 | $ | (40,201 | ) | $ | – 0 | – | $ | – 0 | – | $ | – 0 | – | ||||||
|
|
|
|
|
|
|
|
|
| |||||||||||
OTC Derivatives: | ||||||||||||||||||||
Bank of America, N.A | $ | 45,420 | $ | (40,743 | ) | $ | – 0 | – | $ | – 0 | – | $ | 4,677 | |||||||
Citibank, NA | 25,577 | (25,577 | ) | – 0 | – | – 0 | – | – 0 | – | |||||||||||
Credit Suisse International | 67,056 | (27,216 | ) | – 0 | – | – 0 | – | 39,840 | ||||||||||||
Deutsche Bank AG | 12,437 | – 0 | – | – 0 | – | – 0 | – | 12,437 | ||||||||||||
Goldman Sachs & Co. | 2,724 | (2,724 | ) | – 0 | – | – 0 | – | – 0 | – | |||||||||||
JPMorgan Chase Bank, NA | 6,331 | (5,771 | ) | – 0 | – | – 0 | – | 560 | ||||||||||||
State Street Bank & Trust Co. | 2,455 | (2,455 | ) | – 0 | – | – 0 | – | – 0 | – | |||||||||||
|
|
|
|
|
|
|
|
|
| |||||||||||
Total | $ | 162,000 | $ | (104,486 | ) | $ | – 0 | – | $ | – 0 | – | $ | 57,514 ^ | |||||||
|
|
|
|
|
|
|
|
|
| |||||||||||
| * | Cash has been posted for initial margin requirements for exchange traded derivatives outstanding at October 31, 2014. |
| ^ | Net amount represents the net receivable/(payable) that would be due from/to the counterparty in the event of default or termination. The net amount from OTC financial derivative instruments can only be netted across transactions governed under the same master agreement with the same counterparty. |
| ALLIANCEBERNSTEIN CREDIT LONG/SHORT PORTFOLIO • | 55 |
Notes to Financial Statements
2. Currency Transactions
The Portfolio may invest in non-U.S. dollar securities on a currency hedged or unhedged basis. The Portfolio may seek investment opportunities by taking long or short positions in currencies through the use of currency-related derivatives, including forward currency exchange contracts, futures and options on futures, swaps, and other options. The Portfolio may enter into transactions for investment opportunities when it anticipates that a foreign currency will appreciate or depreciate in value but securities denominated in that currency are not held by the Portfolio and do not present attractive investment opportunities. Such transactions may also be used when the Adviser believes that it may be more efficient than a direct investment in a foreign currency-denominated security. The Portfolio may also conduct currency exchange contracts on a spot basis (i.e., for cash at the spot rate prevailing in the currency exchange market for buying or selling currencies).
3. Short Sales
The Portfolio may sell securities short. A short sale is a transaction in which the Strategy sells securities it does not own, but has borrowed, in anticipation of a decline in the market price of the securities. The Strategy is obligated to replace the borrowed securities at their market price at the time of settlement. The Strategy’s obligation to replace the securities borrowed in connection with a short sale will be fully secured by collateral deposited with the broker. Short sales by the Strategy involve certain risks and special considerations. Possible losses from short sales differ from losses that could be incurred from a purchase of a security because losses from short sales may be unlimited, whereas losses from purchases cannot exceed the total amount invested.
NOTE E
Capital Stock
Each class consists of 3,000,000,000 authorized shares. Transactions in capital shares for each class were as follows:
| Shares | Amount | |||||||||||
May 7, 2014(a) to October 31, | May 7, 2014(a) to October 31, | |||||||||||
|
| |||||||||||
| Class A | ||||||||||||
Shares sold | 8,408 | $ | 83,942 | |||||||||
| ||||||||||||
Shares issued in reinvestment of dividends and distributions | 4 | 41 | ||||||||||
| ||||||||||||
Net increase | 8,412 | $ | 83,983 | |||||||||
| ||||||||||||
| Class C | ||||||||||||
Shares sold | 4,445 | $ | 44,511 | |||||||||
| ||||||||||||
Shares issued in reinvestment of dividends and distributions | 14 | 141 | ||||||||||
| ||||||||||||
Net increase | 4,459 | $ | 44,652 | |||||||||
| ||||||||||||
| 56 | • ALLIANCEBERNSTEIN CREDIT LONG/SHORT PORTFOLIO |
Notes to Financial Statements
| Shares | Amount | |||||||||||
May 7, 2014(a) to October 31, | May 7, 2014(a) to October 31, | |||||||||||
|
| |||||||||||
| Advisor Class | ||||||||||||
Shares sold | 2,095,777 | $ | 20,956,109 | |||||||||
| ||||||||||||
Shares issued in reinvestment of dividends and distributions | 162 | 1,617 | ||||||||||
| ||||||||||||
Shares redeemed | (8,288 | ) | (81,830 | ) | ||||||||
| ||||||||||||
Net increase | 2,087,651 | $ | 20,875,896 | |||||||||
| ||||||||||||
| (a) | Commencement of operations. |
At October 31, 2014, the Adviser owns approximately 95.22% of the Portfolio’s outstanding shares.
NOTE F
Risks Involved in Investing in the Fund
Below Investment Grade Securities Risk—Investments in fixed-income securities with lower ratings (commonly known as “junk bonds”) tend to have a higher probability that an issuer will default or fail to meet its payment obligations. These securities may be subject to greater price volatility due to such factors as specific corporate developments, interest rate sensitivity, negative performance of the junk bond market generally and less secondary market liquidity.
Inflation Risk—This is the risk that the value of assets or income from investments will be less in the future as inflation decreases the value of money. As inflation increases, the real value of the Portfolio’s assets can decline as can the real value of the Portfolio’s distributions.
Interest Rate Risk and Credit Risk—Interest rate risk is the risk that changes in interest rates will affect the value of the Portfolio’s investments in fixed-income debt securities such as bonds or notes. Increases in interest rates may cause the value of the Portfolio’s investments to decline. Credit risk is the risk that the issuer or guarantor of a debt security, or the counterparty to a derivative contract, will be unable or unwilling to make timely principal and/or interest payments, or to otherwise honor its obligations. The degree of risk for a particular security may be reflected in its credit rating. Credit risk is greater for medium quality and lower-rated securities. Lower-rated debt securities and similar unrated securities (commonly known as “junk bonds”) have speculative elements or are predominantly speculative risks.
Liquidity Risk—Liquidity risk exists when particular investments are difficult to purchase or sell, possibly preventing the Portfolio from selling out of these illiquid or relatively less liquid securities at an advantageous price. Causes of liquidity risk may include low trading volume, lack of a market maker, a large position, heavy redemptions, or legal restrictions that limit or prevent a Portfolio from
| ALLIANCEBERNSTEIN CREDIT LONG/SHORT PORTFOLIO • | 57 |
Notes to Financial Statements
selling securities or closing derivative positions at desirable prices or opportune times. Over recent years, the capacity of dealers to make markets in fixed income securities has been outpaced by the growth in the size of the fixed income markets. Liquidity risk may be magnified in a rising interest rate environment, where the value and liquidity of fixed income securities generally go down. Derivatives and securities involving substantial market and credit risk tend to involve greater liquidity risk. To the extent a Portfolio invests in municipal securities, the Portfolio is subject to more liquidity risk because the market for municipal securities is generally smaller than many other markets. Illiquid securities and relatively less liquid securities may also be difficult to value.
Redemption Risk—A Portfolio may experience heavy redemptions that could cause the Portfolio to liquidate its assets at inopportune times or at a loss or depressed value, which could cause the value of your investment to decline
Currency Risk—This is the risk that changes in foreign currency exchange rates may negatively affect the value of the Portfolio’s investments or reduce the returns of the Portfolio. For example, the value of the Portfolio’s investments in foreign currency-denominated securities or currencies may decrease if the U.S. dollar is strong (i.e., gaining value relative to other currencies) and other currencies are weak (i.e., losing value relative to the U.S. dollar). Currency markets are generally not as regulated as securities markets. Independent of the Portfolio’s investments denominated in foreign currencies, the Portfolio’s positions in various foreign currencies may cause the Portfolio to experience investment losses due to the changes in exchange rates and interest rates.
Derivatives Risk—The Portfolio may enter into derivative transactions such as forwards, options, futures and swaps. Derivatives may be illiquid, difficult to price, and leveraged so that small changes may produce disproportionate losses for the Portfolio, and subject to counterparty risk to a greater degree than more traditional investments. Derivatives may result in significant losses, including losses that are far greater than the value of the derivatives reflected in the statement of assets and liabilities.
Short Sales Risk and Leverage Risk—The Portfolio may not always be able to close out a short position on favorable terms. Short sales involve the risk that the Portfolio will incur a loss by subsequently buying a security at a higher price than the price at which it sold the security short. The amount of such loss is theoretically unlimited (since it is limited only by the increase in value of the security sold short by the Portfolio.) In contrast, the risk of loss from a long position is limited to the Portfolio’s investment in the long position, since its value cannot fall below zero. Short selling may be used as a form of leverage which may lead to higher volatility of the Portfolio’s NAV or greater losses for the Portfolio.
Emerging Market Risk—Investments in emerging market countries may have more risk because the markets are less developed and less liquid, and because
| 58 | • ALLIANCEBERNSTEIN CREDIT LONG/SHORT PORTFOLIO |
Notes to Financial Statements
these investments may be subject to increased economic, political, regulatory and other uncertainties.
Foreign (Non-U.S.) Risk—Investment in securities of non-U.S. issuers may involve more risk than those of U.S. issuers. These securities may fluctuate more widely in price and may be less liquid due to adverse market, economic, political, regulatory or other factors.
Indemnification Risk—In the ordinary course of business, the Fund enter into contracts that contain a variety of indemnifications. The Fund’s maximum exposure under these arrangements is unknown. However, the Fund has not had prior claims or losses pursuant to these indemnification provisions and expect the risk of loss thereunder to be remote. Therefore, the Fund has not accrued any liability in connection with these indemnification provisions.
NOTE G
Joint Credit Facility
A number of open-end mutual funds managed by the Adviser, including the Fund, participate in a $280 million revolving credit facility (the “Facility”) intended to provide short-term financing, if necessary, subject to certain restrictions in connection with abnormal redemption activity. Commitment fees related to the Facility are paid by the participating funds and are included in miscellaneous expenses in the statement of operations. The Portfolio was included as a part of the Facility on July 14, 2014. The Fund did not utilize the Facility during the period ended October 31, 2014.
NOTE H
Distributions to Shareholders
The tax character of distributions paid during the fiscal period ended October 31, 2014 were as follows:
| 2014 | ||||
Distributions paid from: | ||||
Ordinary income | $ | 101,996 | ||
|
| |||
Total taxable distributions paid | $ | 101,996 | ||
|
| |||
As of October 31, 2014, the components of accumulated earnings/(deficit) on a tax basis were as follows:
Undistributed ordinary income | $ | 121,675 | ||
Unrealized appreciation/(depreciation) | (86,349 | )(a) | ||
|
| |||
Total accumulated earnings/(deficit) | $ | 35,326 | (b) | |
|
|
| (a) | The differences between book-basis and tax-basis unrealized appreciation/(depreciation) are attributable primarily to the tax treatment of swaps and the realization for tax purposes of gains/losses on certain derivative instruments. |
| (b) | The difference between book-basis and tax-basis components of accumulated earnings/(deficit) is attributable primarily to the amortization of offering costs. |
For tax purposes, net capital losses may be carried over to offset future capital gains, if any. Funds are permitted to carry forward capital losses incurred in taxable years beginning after December 22, 2010 for an indefinite period, and such losses
| ALLIANCEBERNSTEIN CREDIT LONG/SHORT PORTFOLIO • | 59 |
Notes to Financial Statements
will retain their character as either short-term or long-term capital losses. As of October 31, 2014, the Portfolio did not have any capital loss carryforwards.
During the current fiscal period, permanent differences primarily due to the tax treatment of offering costs and clearing fees, reclassifications of foreign currency and paydown gains(losses), and the tax treatment of swaps and options resulted in a net increase in undistributed net investment income, a net decrease in accumulated net realized gain on investment and foreign currency transactions, and a net decrease in additional paid-in capital. These reclassifications had no effect on net assets.
NOTE I
Subsequent Events
Management has evaluated subsequent events for possible recognition or disclosure in the financial statements through the date the financial statements are issued. Management has determined that there are no material events that would require disclosure in the Portfolio’s financial statements through this date.
| 60 | • ALLIANCEBERNSTEIN CREDIT LONG/SHORT PORTFOLIO |
FINANCIAL HIGHLIGHTS
Selected Data For A Share Of Capital Stock Outstanding Throughout Each Period
| Class A | ||||
| May 7, 2014(a) to October 31, 2014 | ||||
|
| |||
Net asset value, beginning of period | $ 10.00 | |||
|
| |||
Income From Investment Operations | ||||
Net investment income(b)(c) | .08 | |||
Net realized and unrealized loss on investment and foreign currency transactions | (.03 | ) | ||
|
| |||
Net increase in net asset value from operations | .05 | |||
|
| |||
Less: Dividends | ||||
Dividends from net investment income | (.05 | ) | ||
|
| |||
Net asset value, end of period | $ 10.00 | |||
|
| |||
Total Return | ||||
Total investment return based on net asset value(d) | .57 | % | ||
Ratios/Supplemental Data | ||||
Net assets, end of period (000’s omitted) | $84 | |||
Ratio to average net assets of: | ||||
Expenses, net of waivers/reimbursements(e)^ | 3.56 | % | ||
Expenses, before waivers/reimbursements(e)^ | 4.29 | % | ||
Net investment income(c)^ | 1.79 | % | ||
Portfolio turnover rate | 69 | % | ||
Portfolio turnover rate (including securities sold short) | 102 | % | ||
See footnote summary on page 63.
| ALLIANCEBERNSTEIN CREDIT LONG/SHORT PORTFOLIO • | 61 |
Financial Highlights
Selected Data For A Share Of Capital Stock Outstanding Throughout Each Period
| Class C | ||||
| May 7, 2014(a) to October 31, 2014 | ||||
|
| |||
Net asset value, beginning of period | $ 10.00 | |||
|
| |||
Income From Investment Operations | ||||
Net investment income(b)(c) | .06 | |||
Net realized and unrealized gain on investment and foreign currency transactions | (.05 | ) | ||
|
| |||
Net increase in net asset value from operations | .01 | |||
|
| |||
Less: Dividends | ||||
Dividends from net investment income | (.04 | ) | ||
|
| |||
Net asset value, end of period | $ 9.97 | |||
|
| |||
Total Return | ||||
Total investment return based on net asset value(d) | .21 | % | ||
Ratios/Supplemental Data | ||||
Net assets, end of period (000’s omitted) | $44 | |||
Ratio to average net assets of: | ||||
Expenses, net of waivers/reimbursements(e)^ | 4.18 | % | ||
Expenses, before waivers/reimbursements(e)^ | 6.31 | % | ||
Net investment income(c)^ | 1.21 | % | ||
Portfolio turnover rate | 69 | % | ||
Portfolio turnover rate (including securities sold short) | 102 | % | ||
See footnote summary on page 63.
| 62 | • ALLIANCEBERNSTEIN CREDIT LONG/SHORT PORTFOLIO |
Financial Highlights
Selected Data For A Share Of Capital Stock Outstanding Throughout Each Period
| Advisor Class | ||||
| May 7, 2014(a) to October 31, 2014 | ||||
|
| |||
Net asset value, beginning of period | $ 10.00 | |||
|
| |||
Income From Investment Operations | ||||
Net investment income(b)(c) | .10 | |||
Net realized and unrealized gain on investment and foreign currency transactions | (.04 | ) | ||
|
| |||
Net increase in net asset value from operations | .06 | |||
|
| |||
Less: Dividends | ||||
Dividends from net investment income | (.05 | ) | ||
|
| |||
Net asset value, end of period | $ 10.01 | |||
|
| |||
Total Return | ||||
Total investment return based on net asset value(d) | .70 | % | ||
Ratios/Supplemental Data | ||||
Net assets, end of period (000’s omitted) | $20,892 | |||
Ratio to average net assets of: | ||||
Expenses, net of waivers/reimbursements(e)^ | 2.79 | % | ||
Expenses, before waivers/reimbursements(e)^ | 5.37 | % | ||
Net investment income(c)^ | 2.01 | % | ||
Portfolio turnover rate | 69 | % | ||
Portfolio turnover rate (including securities sold short) | 102 | % | ||
| (a) | Commencement of operations. |
| (b) | Based on average shares outstanding. |
| (c) | Net of fees and expenses waived/reimbursed by the Adviser. |
| (d) | Total investment return is calculated assuming an initial investment made at the net asset value at the beginning of the period, reinvestment of all dividends and distributions at net asset value during the period, and redemption on the last day of the period. Initial sales charges or contingent deferred sales charges are not reflected in the calculation of total investment return. Total return does not reflect the deduction of taxes that a shareholder would pay on fund distributions or the redemption of fund shares. Total investment return calculated for a period of less than one year is not annualized. |
| (e) | The expense ratios presented below exclude expenses on securities sold short: |
| May 7, 2014(a) to October 31, 2014 | ||||
Class A | ||||
Net of waivers/reimbursements | 1.35 | %^ | ||
Before waivers/reimbursements | 2.08 | %^ | ||
Class C | ||||
Net of waivers/reimbursements | 2.10 | %^ | ||
Before waivers/reimbursements | 4.24 | %^ | ||
Advisor Class | ||||
Net of waivers/reimbursements | 1.10 | %^ | ||
Before waivers/reimbursements | 3.68 | %^ | ||
| ^ | Annualized. |
See notes to financial statements.
| ALLIANCEBERNSTEIN CREDIT LONG/SHORT PORTFOLIO • | 63 |
Financial Highlights
REPORT OF INDEPENDENT REGISTERED
PUBLIC ACCOUNTING FIRM
To the Board of Directors of AllianceBernstein Bond Fund, Inc. and Shareholders of the AllianceBernstein Credit Long/Short Portfolio
We have audited the accompanying statement of assets and liabilities, including the portfolio of investments, of AllianceBernstein Credit Long/Short Portfolio (one of the portfolios constituting the AllianceBernstein Bond Fund, Inc. (the “Fund”)), as of October 31, 2014, and the related statement of operations, cash flows, changes in net assets, and financial highlights for the period May 7, 2014 (commencement of operations) through October 31, 2014. These financial statements and financial highlights are the responsibility of the Fund’s management. Our responsibility is to express an opinion on these financial statements and financial highlights based on our audits.
We conducted our audits in accordance with the standards of the Public Company Accounting Oversight Board (United States). Those standards require that we plan and perform the audit to obtain reasonable assurance about whether the financial statements and financial highlights are free of material misstatement. We were not engaged to perform an audit of the Fund’s internal control over financial reporting. Our audit included consideration of internal control over financial reporting as a basis for designing audit procedures that are appropriate in the circumstances, but not for the purpose of expressing an opinion on the effectiveness of the Fund’s internal control over financial reporting. Accordingly, we express no such opinion. An audit also includes examining, on a test basis, evidence supporting the amounts and disclosures in the financial statements and financial highlights, assessing the accounting principles used and significant estimates made by management, and evaluating the overall financial statement presentation. Our procedures included confirmation of securities owned as of October 31, 2014, by correspondence with the custodian and others or by other appropriate auditing procedures where replies from others were not received. We believe that our audits provide a reasonable basis for our opinion.
In our opinion, the financial statements and financial highlights referred to above present fairly, in all material respects, the financial position of AllianceBernstein Credit Long/Short Portfolio (one of the portfolios constituting the AllianceBernstein Bond Fund, Inc.) at October 31, 2014, and the results of its operations, cash flows, changes in its net assets and financial highlights for the period May 7, 2014 (commencement of operations) to October 31, 2014, in conformity with U.S. generally accepted accounting principles.

New York, New York
December 29, 2014
| 64 | • ALLIANCEBERNSTEIN CREDIT LONG/SHORT PORTFOLIO |
Report of Independent Registered Public Accounting Firm
2014 FEDERAL TAX INFORMATION
(unaudited)
For Federal income tax purposes, the following information is furnished with respect to the distributions paid by the Portfolio during the taxable period ended October 31, 2014. For corporate shareholders, 9.99% of dividends paid qualify for the dividends received deduction. For foreign shareholders, 23.51% of ordinary dividends paid may be considered to be qualifying to be taxed as interest-related dividends.
For the taxable period ended October 31, 2014, the Portfolio designates $29,956 as the maximum amount that may be considered qualified dividend income for individual shareholders.
Shareholders should not use the above information to prepare their income tax returns. The information necessary to complete your income tax returns will be included with your form 1099-DIV which will be sent to you separately in January 2015.
| ALLIANCEBERNSTEIN CREDIT LONG/SHORT PORTFOLIO • | 65 |
BOARD OF DIRECTORS
Marshall C. Turner, Jr.(1), Chairman John H. Dobkin(1) Michael J. Downey(1) William H. Foulk, Jr.(1) D. James Guzy(1) | Nancy P. Jacklin(1) Robert M. Keith, President and Chief Executive Officer Garry L. Moody(1) Earl D. Weiner(1) |
OFFICERS
Philip L. Kirstein, Senior Vice President and Independent Compliance Officer Gershon M. Distenfeld(2), Vice President Sherif M. Hamid(2), Vice President Ivan Rudolph-Shabinsky(2), Vice President Robert Schwartz(2), Vice President | Ashish C. Shah(2), Vice President Joseph J. Mantineo, Treasurer and Chief Financial Officer Emilie D. Wrapp, Secretary Phyllis J. Clarke, Controller Vincent S. Noto, Chief Compliance Officer |
Custodian and Accounting Agent State Street Bank and Trust Company State Street Corporation CCB/5 1 Iron Street Boston, MA 02210
Principal Underwriter AllianceBernstein Investments, Inc. 1345 Avenue of the Americas New York, NY 10105
Transfer Agent AllianceBernstein Investor Services, Inc. P.O. Box 786003 San Antonio, TX 78278-6003 Toll-Free (800) 221-5672 | Independent Registered Public Accounting Firm Ernst & Young LLP 5 Times Square New York, NY 10036
Legal Counsel Seward & Kissel LLP One Battery Park Plaza New York, NY 10004 |
| (1) | Member of the Audit Committee, the Governance and Nominating Committee and the Independent Directors Committee. |
| (2) | The day-to-day management of, and investment decisions for, the Fund are made by its senior management team. Messrs. Distenfeld, Hamid, Rudolph-Shabinksy, Schwartz and Shah are the investment professionals with the most significant responsibility for the day-to-day management of the Fund’s portfolio. |
| 66 | • ALLIANCEBERNSTEIN CREDIT LONG/SHORT PORTFOLIO |
Board of Directors
MANAGEMENT OF THE FUND
| NAME, ADDRESS*, AGE, (YEAR FIRST ELECTED**) | PRINCIPAL OCCUPATION(S) DURING PAST FIVE YEARS AND OTHER RELEVANT QUALIFICATIONS*** | PORTFOLIOS IN FUND COMPLEX OVERSEEN BY DIRECTOR | OTHER DIRECTORSHIP HELD BY DIRECTOR IN THE PAST FIVE YEARS | |||||
| INTERESTED DIRECTOR | ||||||||
Robert M. Keith, + 1345 Avenue of the Americas New York, NY 10105 54 (2014) | Senior Vice President of AllianceBernstein L.P. (the “Adviser”) and the head of AllianceBernstein Investments, Inc. (“ABI”) since July 2008; Director of ABI and President of the AllianceBernstein Mutual Funds. Previously, he served as Executive Managing Director of ABI from December 2006 to June 2008. Prior to joining ABI in 2006, Executive Managing Director of Bernstein Global Wealth Management, and prior thereto, Senior Managing Director and Global Head of Client Service and Sales of the Adviser’s institutional investment management business since 2004. Prior thereto, he was Managing Director and Head of North American Client Service and Sales in the Adviser’s institutional investment management business, with which he had been associated since prior to 2004. | 117 | None | |||||
| ALLIANCEBERNSTEIN CREDIT LONG/SHORT PORTFOLIO • | 67 |
Management of the Fund
| NAME, ADDRESS*, AGE, (YEAR FIRST ELECTED**) | PRINCIPAL OCCUPATION(S) DURING PAST FIVE YEARS AND OTHER RELEVANT QUALIFICATIONS*** | PORTFOLIOS IN FUND COMPLEX OVERSEEN BY DIRECTOR | OTHER DIRECTORSHIP HELD BY DIRECTOR IN THE PAST FIVE YEARS | |||||
| DISINTERESTED DIRECTORS | ||||||||
Marshall C. Turner, Jr., # Chairman of the Board 73 (2014) | Private Investor since prior to 2009. Former CEO of Dupont Photomasks, Inc. (components of semi-conductor manufacturing), 2003-2006, and interim CEO 1999-2000. He has extensive operating and early-stage investment experience, including prior service as general partner of three institutional venture capital partnerships, and serves on the boards of three education and science-related non-profit organizations. He has served as a director of one AllianceBernstein fund since 1992, and director or trustee of multiple AllianceBernstein funds since 2005. He has been Chairman of the AllianceBernstein Funds since January 2014, and the Chairman of the Independent Directors Committees of such Funds since February 2014. | 117 | Xilinx, Inc. (programmable logic semi-conductors) and SunEdison, Inc. (semi-conductor substrates, solar materials and solar power plants) since prior to 2009 until July 2014 | |||||
John H. Dobkin, # 72 (2014) | Independent Consultant since prior to 2009. Formerly, President of Save Venice, Inc. (preservation organization) from 2001–2002; Senior Advisor from June 1999-June 2000 and President of Historic Hudson Valley (historic preservation) from December 1989-May 1999. Previously, Director of the National Academy of Design. He has served as a director or trustee of various AllianceBernstein Funds since 1992, and as Chairman of the Audit Committees of a number of such Funds from 2001-2008. | 117 | None | |||||
| 68 | • ALLIANCEBERNSTEIN CREDIT LONG/SHORT PORTFOLIO |
Management of the Fund
| NAME, ADDRESS*, AGE, (YEAR FIRST ELECTED**) | PRINCIPAL OCCUPATION(S) DURING PAST FIVE YEARS AND OTHER RELEVANT QUALIFICATIONS*** | PORTFOLIOS IN FUND COMPLEX OVERSEEN BY DIRECTOR | OTHER DIRECTORSHIP HELD BY DIRECTOR IN THE PAST FIVE YEARS | |||||
DISINTERESTED DIRECTORS (continued) | ||||||||
Michael J. Downey, # 70 (2014) | Private Investor since prior to 2009. Formerly, managing partner of Lexington Capital, LLC (investment advisory firm) from December 1997 until December 2003. From 1987 until 1993, Chairman and CEO of Prudential Mutual Fund Management, director of the Prudential mutual funds, and member of the Executive Committee of Prudential Securities Inc. He has served as a director or trustee of the AllianceBernstein Funds since 2005 and is a director and Chairman of one other registered investment company. | 117 | Asia Pacific Fund, Inc. (registered investment company) since prior to 2009, Prospect Acquisition Corp. (financial services) from 2007 until 2009, and The Merger Fund (registered investment company) since prior to 2009 until 2013 | |||||
William H. Foulk, Jr., # 82 (2014) | Investment Adviser and an Independent Consultant since prior to 2009. Previously, he was Senior Manager of Barrett Associates, Inc., a registered investment adviser. He was formerly Deputy Comptroller and Chief Investment Officer of the State of New York and, prior thereto, Chief Investment Officer of the New York Bank for Savings. He has served as a director or trustee of various AllianceBernstein Funds since 1983, and was Chairman of the Independent Directors Committees of the AllianceBernstein Funds from 2003 until early February 2014. He served as Chairman of such Funds from 2003 through December 2013. He is also active in a number of mutual fund related organizations and committees. | 117 | None | |||||
| ALLIANCEBERNSTEIN CREDIT LONG/SHORT PORTFOLIO • | 69 |
Management of the Fund
| NAME, ADDRESS*, AGE, (YEAR FIRST ELECTED**) | PRINCIPAL OCCUPATION(S) DURING PAST FIVE YEARS AND OTHER RELEVANT QUALIFICATIONS*** | PORTFOLIOS IN FUND COMPLEX OVERSEEN BY DIRECTOR | OTHER DIRECTORSHIP HELD BY DIRECTOR IN THE PAST FIVE YEARS | |||||
DISINTERESTED DIRECTORS (continued) | ||||||||
D. James Guzy, # 78 (2014) | Chairman of the Board of SRC Computers, Inc. (semi-conductors), with which he has been associated since prior to 2009. He served as Chairman of the Board of PLX Technology (semi-conductors) since prior to 2009 until November 2013. He was a director of Intel Corporation (semi-conductors) from 1969 until 2008, and served as Chairman of the Finance Committee of such company for several years until May 2008. He has served as a director or trustee of one or more of the AllianceBernstein Funds since 1982. | 117 | PLX Technology (semi-conductors) since prior to 2009 until November 2013, and Cirrus Logic Corporation (semi-conductors) since prior to 2009 until July 2011 | |||||
Nancy P. Jacklin, # 66 (2014) | Professorial Lecturer at the Johns Hopkins School of Advanced International Studies since 2008. Formerly, U.S. Executive Director of the International Monetary Fund (which is responsible for ensuring the stability of the international monetary system), (December 2002-May 2006); Partner, Clifford Chance (1992-2002); Sector Counsel, International Banking and Finance, and Associate General Counsel, Citicorp (1985-1992); Assistant General Counsel (International), Federal Reserve Board of Governors (1982-1985); and Attorney Advisor, U.S. Department of the Treasury (1973-1982). Member of the Bar of the District of Columbia and of New York; and member of the Council on Foreign Relations. She has served as a director or trustee of the AllianceBernstein Funds since 2006 and has been Chairman of the Governance and Nominating Committees of the Funds since August 2014. | 117 | None | |||||
| 70 | • ALLIANCEBERNSTEIN CREDIT LONG/SHORT PORTFOLIO |
Management of the Fund
| NAME, ADDRESS*, AGE, (YEAR FIRST ELECTED**) | PRINCIPAL OCCUPATION(S) DURING PAST FIVE YEARS AND OTHER RELEVANT QUALIFICATIONS*** | PORTFOLIOS IN FUND COMPLEX OVERSEEN BY DIRECTOR | OTHER DIRECTORSHIP HELD BY DIRECTOR IN THE PAST FIVE YEARS | |||||
DISINTERESTED DIRECTORS (continued) | ||||||||
Garry L. Moody, # 62 (2014) | Independent Consultant. Formerly, Partner, Deloitte & Touche LLP (1995-2008) where he held a number of senior positions, including Vice Chairman, and U.S. and Global Investment Management Practice Managing Partner; President, Fidelity Accounting and Custody Services Company (1993-1995); and Partner, Ernst & Young LLP (1975-1993), where he served as the National Director of Mutual Fund Tax Services and Managing Partner of its Chicago Office Tax department. He is a member of both the Governing Council of the Independent Directors Council (IDC), an organization of independent directors of mutual funds, and the Trustee Advisory Board of BoardIQ, a biweekly publication focused on issues and news affecting directors of mutual funds. He has served as a director or trustee, and as Chairman of the Audit Committees, of the AllianceBernstein Funds since 2008. | 117 | None | |||||
Earl D. Weiner, # 75 (2014) | Of Counsel, and Partner prior to January 2007, of the law firm Sullivan & Cromwell LLP and is a former member of the ABA Federal Regulation of Securities Committee Task Force to draft editions of the Fund Director’s Guidebook. He also serves as a director or trustee of various non-profit organizations and has served as Chairman or Vice Chairman of a number of them. He has served as a director or trustee of the AllianceBernstein Funds since 2007 and served as Chairman of the Governance and Nominating Committees of the AllianceBernstein Funds from 2007 until August 2014. | 117 | None | |||||
| ALLIANCEBERNSTEIN CREDIT LONG/SHORT PORTFOLIO • | 71 |
Management of the Fund
| * | The address for each of the Fund’s disinterested Directors is c/o AllianceBernstein L.P., Attention: Philip L. Kirstein, 1345 Avenue of the Americas, New York, NY 10105. |
| ** | There is no stated term of office for the Fund’s Directors. |
| *** | The information above includes each Director’s principal occupation during the last five years and other information relating to the experience, attributes and skills relevant to each Director’s qualifications to serve as a Director, which led to the conclusion that each Director should serve as a Director for the Fund. |
| + | Mr. Keith is an “interested person” of the Portfolio as defined in the Investment Company Act of 1940, due to his position as a Senior Vice President of the Adviser. |
| # | Member of the Audit Committee, the Governance and Nominating Committee and the Independent Directors Committee. |
| 72 | • ALLIANCEBERNSTEIN CREDIT LONG/SHORT PORTFOLIO |
Management of the Fund
Officer Information
Certain information concerning the Fund’s Officers is listed below.
NAME, ADDRESS*, AND AGE | POSITION(S) HELD WITH FUND | PRINCIPAL OCCUPATION DURING PAST 5 YEARS | ||
Robert M. Keith 54 | President and Chief Executive Officer | See biography above. | ||
Philip L. Kirstein 69 | Senior Vice President and Independent Compliance Officer | Senior Vice President and Independent Compliance Officer of the AllianceBernstein Funds, with which he has been associated since October 2004. Prior thereto, he was Of Counsel to Kirkpatrick & Lockhart, LLP from October 2003 to October 2004, and General Counsel of Merrill Lynch Investment Managers, L.P. since prior to March 2003. | ||
Gershon M. Distenfeld 39 | Vice President | Senior Vice President of the Adviser**, with which he has been associated since prior to 2009. | ||
Sherif M. Hamid 38 | Vice President | Vice President and Portfolio Manager for High Yield of the Adviser**, with which he has been associated with since 2013. Prior to joining the Adviser**, he was at Barclays Capital where he was head of European Credit Strategy from 2011 to 2013, and a U.S. investment-grade credit strategist and U.S. high yield analyst from prior to 2009 to 2011. | ||
Robert Schwartz 42 | Vice President | Senior Vice President, and Corporate Credit Research Analyst of the Adviser**, with which he has been associated since 2012. Prior thereto, he was a senior credit analyst at Bell Point Capital Management from 2010 until 2012, a senior credit analyst at Litespeed Partners from 2009 until 2010, and a senior credit analyst at Citadel Investment Group since prior to 2009. | ||
Ivan Rudolph-Shabinsky 50 | Vice President | Senior Vice President of the Adviser**, with which he has been associated since prior to 2009. | ||
Ashish C. Shah 44 | Vice President | Senior Vice President, Head of Global Credit, and Chief Diversity Officer at the Adviser**, with which he has been associated since May, 2010. Previously he was a Managing Director and Head of Global Credit Strategy at Barclays Capital since prior to 2009 until May 2010. | ||
Emilie D. Wrapp 58 | Secretary | Senior Vice President, Assistant General Counsel and Assistant Secretary of ABI**, with which she has been associated since prior to 2009. | ||
| ALLIANCEBERNSTEIN CREDIT LONG/SHORT PORTFOLIO • | 73 |
Management of the Fund
NAME, ADDRESS*, AND AGE | POSITION(S) HELD WITH FUND | PRINCIPAL OCCUPATION DURING PAST 5 YEARS | ||
Joseph J. Mantineo 55 | Treasurer and Chief Financial Officer | Senior Vice President of ABIS**, with which he has been associated since prior to 2009. | ||
Vincent S. Noto 50 | Chief Compliance Officer | Vice President and Mutual Fund Chief Compliance Officer of the Adviser** since 2014. Prior thereto, he was Vice President and Director of Mutual Fund Compliance of the Adviser** since 2009. | ||
Phyllis J. Clarke 53 | Controller | Vice President of ABIS**, with which she has been associated since prior to 2009. |
| * | The address for each of the Fund’s Officers is 1345 Avenue of the Americas, New York, NY 10105. |
| ** | The Adviser, ABI and ABIS are affiliates of the Fund. |
| The Fund’s Statement of Additional Information (“SAI”) has additional information about the Fund’s Directors and Officers and is available without charge upon request. Contact your financial representative or AllianceBernstein at 1-(800) 227-4618, or visit www.alliancebernstein.com, for a free prospectus or SAI. |
| 74 | • ALLIANCEBERNSTEIN CREDIT LONG/SHORT PORTFOLIO |
Management of the Fund
Information Regarding the Review and Approval of the Portfolio’s Advisory Agreement
The disinterested directors (the “directors”) of AllianceBernstein Bond Fund, Inc. (the “Fund”) unanimously approved the application of the Fund’s Investment Advisory Contract (the “Advisory Agreement”) with the Adviser in respect of AllianceBernstein Credit Long/Short Portfolio (the “Portfolio”) for an initial two-year period at a meeting held on February 3-5, 2014.
Prior to approval of the Advisory Agreement, the directors had requested from the Adviser, and received and evaluated, extensive materials. They reviewed the proposed Advisory Agreement with the Adviser and with experienced counsel who are independent of the Adviser, who advised on the relevant legal standards. The directors also reviewed an independent evaluation prepared by the Fund’s Senior Officer (who is also the Fund’s Independent Compliance Officer) of the reasonableness of the proposed advisory fee. The directors also reviewed certain supplemental information relating to the Portfolio that had been prepared by the Fund’s Senior Officer. The directors also discussed the proposed approval in private sessions with counsel and the Fund’s Senior Officer.
The directors considered their knowledge of the nature and quality of the services to be provided by the Adviser to the Portfolio gained from their experience as directors or trustees of most of the registered investment companies advised by the Adviser, including the Fund, their overall confidence in the Adviser’s integrity and competence they have gained from that experience, the Adviser’s initiative in identifying and raising potential issues with the directors and its responsiveness, frankness and attention to concerns raised by the directors in the past, including the Adviser’s willingness to consider and implement organizational and operational changes designed to improve investment results and the services provided to the AllianceBernstein Funds. The directors noted that they have four regular meetings each year, at each of which they receive presentations from the Adviser on the investment results of the AllianceBernstein Funds and review extensive materials and information presented by the Adviser.
The directors also considered all other factors they believed relevant, including the specific matters discussed below. In their deliberations, the directors did not identify any particular information that was all-important or controlling, and different directors may have attributed different weights to the various factors. The directors determined that the selection of the Adviser to manage the Portfolio, and the overall arrangements between the Portfolio and the Adviser, as provided in the Advisory Agreement, including the proposed advisory fee, were fair and reasonable in light of the services to be performed, expenses to be incurred and such other matters as the directors considered relevant in the exercise of their business judgment. The material factors and conclusions that formed the basis for the directors’ determinations included the following:
| ALLIANCEBERNSTEIN CREDIT LONG/SHORT PORTFOLIO • | 75 |
Nature, Extent and Quality of Services to be Provided
The directors considered the scope and quality of services to be provided by the Adviser under the Advisory Agreement, including the quality of the investment research capabilities of the Adviser and the other resources it has dedicated to performing services for the AllianceBernstein Funds. They also noted the professional experience and qualifications of the Portfolio’s portfolio manager and other members of the investment team and other senior personnel of the Adviser. The directors also considered that the Advisory Agreement provides that the Portfolio will reimburse the Adviser for the cost to it of providing certain clerical, accounting, administrative and other services to the Portfolio by employees of the Adviser or its affiliates. Requests for these reimbursements will require the directors’ approval on a quarterly basis. Reimbursements, to the extent requested and paid, result in a higher rate of total compensation from the Portfolio to the Adviser than the fee rate stated in the Advisory Agreement. The directors noted that the methodology to be used to determine the reimbursement amounts had been reviewed by an independent consultant retained by the Fund’s Senior Officer. The quality of administrative and other services, including the Adviser’s role in coordinating the activities of the Portfolio’s other service providers, also were considered. The directors concluded that, overall, they were satisfied with the nature, extent and quality of services to be provided to the Portfolio under the Advisory Agreement.
Costs of Services to be Provided and Profitability
Because the Portfolio had not yet commenced operations, the directors were unable to consider historical information about the profitability of the Portfolio. However, the Adviser agreed to provide the directors with profitability information in connection with future proposed continuances of the Advisory Agreement. They also considered the costs to be borne by the Adviser in providing services to the Portfolio and that the Portfolio was unlikely to be profitable to the Adviser unless it achieves a material level of net assets.
Fall-Out Benefits
The directors considered the other benefits to the Adviser and its affiliates from their proposed relationships with the Portfolio, including, but not limited to, receipt of 12b-1 fees and sales charges to be received by the Fund’s principal underwriter (which is a wholly owned subsidiary of the Adviser) in respect of certain classes of the Portfolio’s shares and transfer agency fees to be paid by the Portfolio to a wholly owned subsidiary of the Adviser. The directors recognized that the Adviser’s future profitability would be somewhat lower without these benefits. The directors also understood that the Adviser also might derive reputational and other benefits from its association with the Portfolio.
Investment Results
Since the Portfolio had not yet commenced operations, no performance or other historical information for the Portfolio was available. The Adviser had not managed
| 76 | • ALLIANCEBERNSTEIN CREDIT LONG/SHORT PORTFOLIO |
clients’ assets using a strategy comparable to that proposed for the Portfolio, but as of December 31, 2013, had approximately $250 billion in fixed income assets under management. Based on this information, together with the Adviser’s written and oral presentations regarding the management of the Portfolio and their general knowledge and confidence in the Adviser’s expertise in managing mutual funds, the directors concluded that they were satisfied that the Adviser was capable of providing high quality portfolio management services to the Portfolio.
Advisory Fee and Other Expenses
The directors considered the proposed advisory fee rate payable by the Portfolio and information prepared by Lipper concerning advisory fee rates paid by other funds in the same Lipper category as the Portfolio at a hypothetical common asset level of $250 million. The directors recognized that it is difficult to make comparisons of advisory fees because there are variations in the services that are included in the fees paid by other funds. The information reviewed by the directors showed that, at the Portfolio’s hypothetical size of $250 million, its anticipated contractual advisory fee rate of 90 basis points was higher than the Expense Group median of 72.5 basis points.
The Adviser informed the directors that there were no institutional products managed by it that have a substantially similar investment style. The directors reviewed the relevant fee information from the Adviser’s Form ADV and the evaluation from the Fund’s Senior Officer and noted that the Adviser charged institutional clients lower fees for advising comparably sized accounts using strategies that differ from those of the Portfolio but which involved investments in fixed income securities.
The Adviser reviewed with the directors the significantly greater scope of the services it provides to the AllianceBernstein Funds relative to institutional clients. The Adviser also noted that because mutual funds are constantly issuing and redeeming shares, they are more difficult to manage than an institutional account, where the assets tend to be relatively stable. In light of the substantial differences in services rendered by the Adviser to institutional clients as compared to funds such as the Portfolio, as well as the difference in fee structure, the directors considered these fee comparisons inapt and did not place significant weight on them in their deliberations.
The directors considered the estimated total expense ratio of the Class A shares of the Portfolio assuming $250 million in assets under management in comparison to the fees and expenses of funds within two comparison groups created by Lipper: an Expense Group and an Expense Universe. Lipper described an Expense Group as a representative sample of funds similar to the Portfolio and an Expense Universe as a broader group, consisting of all funds in the investment classification/objective with a similar load type as the Portfolio.
| ALLIANCEBERNSTEIN CREDIT LONG/SHORT PORTFOLIO • | 77 |
The estimated total expense ratio of the Portfolio reflected fee waivers and/or expense reimbursements as a result of an expense limitation agreement between the Adviser and the Fund in respect of the Portfolio. The directors noted that it was likely that the expense ratios of some of the other funds in the Portfolio’s Lipper category also were lowered by waivers or reimbursements by those funds’ investment advisers, which in some cases might be voluntary or temporary. The directors view the estimated expense ratio information as relevant to their evaluation of the Adviser’s services because the Adviser is responsible for coordinating services provided to the Portfolio by others.
The directors noted that the Portfolio may invest in shares of exchange-traded funds (“ETFs”). The directors also noted that ETFs pay advisory fees pursuant to their advisory contracts. The directors concluded, based on the Adviser’s explanation of how it may use ETFs when they represent the least expensive way to obtain desired exposures for a fund or to temporarily “equitize” cash inflows pending purchases of underlying securities, that the proposed advisory fee for the Portfolio was based on services to be provided that will be in addition to, rather than duplicative of, the services provided under the advisory contracts of the ETFs in which the Portfolio may in the future invest.
The directors recognized that the Adviser’s total compensation from the Portfolio pursuant to the Advisory Agreement would be increased by amounts paid pursuant to the expense reimbursement provision in the Advisory Agreement, and that the impact of such expense reimbursement would depend on the size of the Portfolio and the extent to which the Adviser requests reimbursements pursuant to this provision. The Lipper analysis reflected the Adviser’s agreement to cap the Portfolio’s expense ratio for a one-year period.
The information reviewed by the directors showed that the Portfolio’s anticipated total expense ratio of 1.35%, giving effect to the proposed expense limitation agreement, was higher than the Expense Group median of 1.191% and the Expense Universe median of 1.184%. The directors had considered the Senior Officer’s observations about the relatively high anticipated expense ratio and the potentially mitigating aspect of the Adviser’s anticipated use of leverage to manage the Portfolio’s investments. They noted that the Adviser had stated that the gross exposures being managed by the Adviser would be significantly in excess of the net assets of the Portfolio, thus reducing the effective advisory fee and total expense ratio. After discussing with the Adviser the reasons for the Portfolio’s anticipated expense ratio and the risks and potential benefits of the anticipated use of leverage, the directors concluded that the Portfolio’s anticipated expense ratio, taking into account the one year expense limitation agreement, was acceptable.
Economies of Scale
The directors noted that the proposed advisory fee schedule for the Portfolio does not contain breakpoints and that they had discussed their strong preference
| 78 | • ALLIANCEBERNSTEIN CREDIT LONG/SHORT PORTFOLIO |
for breakpoints in advisory contracts with the Adviser. The directors considered the Adviser’s position that of the ten funds other than the Portfolio in the expense group, three had no breakpoints, and one other had a management fee schedule where the lowest fee rate was higher than the fee rate proposed for the Portfolio, and that it did not have sufficient information to determine the asset levels at which economies of scale may arise for the Portfolio. The directors took into consideration prior presentations by an independent consultant on economies of scale in the mutual fund industry and for the AllianceBernstein Funds, and by the Adviser concerning certain of its views on economies of scale. The directors also had requested and received from the Adviser certain updates on economies of scale at the May 2013 meetings. The directors believe that economies of scale may be realized (if at all) by the Adviser across a variety of products and services, and not only in respect of a single fund. The directors noted that there is no established methodology for setting breakpoints that give effect to the fund-specific services provided by a fund’s adviser and to the economies of scale that an adviser may realize in its overall mutual fund business or those components of it which directly or indirectly affect a fund’s operations. The directors observed that in the mutual fund industry as a whole, as well as among funds similar to the Portfolio, there is no uniformity or pattern in the fees and asset levels at which breakpoints (if any) apply. The directors also noted that the advisory agreements for many funds do not have breakpoints at all. The directors informed the Adviser that they would monitor the Portfolio’s assets and its profitability to the Adviser and anticipated revisiting the question of breakpoints in the future if circumstances warranted doing so.
| ALLIANCEBERNSTEIN CREDIT LONG/SHORT PORTFOLIO • | 79 |
THE FOLLOWING IS NOT PART OF THE SHAREHOLDER REPORT OR THE FINANCIAL STATEMENTS
SUMMARY OF SENIOR OFFICER’S EVALUATION OF INVESTMENT ADVISORY AGREEMENT1
The following is a summary of the evaluation of the Investment Advisory Agreement between AllianceBernstein L.P. (the “Adviser”) and AllianceBernstein Bond Fund, Inc. (the “Fund”) in respect of AllianceBernstein Credit Long/Short Portfolio (the “Portfolio”),2 prepared by Philip L. Kirstein, the Senior Officer of the Fund for the Directors of the Fund, as required by the August 2004 agreement between the Adviser and the New York State Attorney General (the “NYAG”). The Senior Officer’s evaluation of the Investment Advisory Agreement is not meant to diminish the responsibility or authority of the Board of Directors of the Fund to perform its duties pursuant to Section 15 of the Investment Company Act of 1940 (the “40 Act”) and applicable state law. The purpose of the summary is to provide shareholders with a synopsis of the independent evaluation of the reasonableness of the advisory fees proposed to be paid by the Portfolio which was provided to the Directors in connection with their review of the proposed initial approval of the Investment Advisory Agreement.
The investment objective of the Portfolio is to seek absolute return over a full market cycle, which typically for fixed income markets is three to five years. Under normal circumstances, at least 80% of the Portfolio’s net assets is invested in long and short positions in credit-related instruments, which include corporate bonds, convertible fixed income securities, preferred stocks, U.S. government and agency securities, securities of foreign governments and supranational entities, mortgage-related and asset-backed securities, and loan participations. The Portfolio’s long and short positions may relate to fixed income securities below investment grade. While the Portfolio’s investments are focused on U.S. denominated securities, the Portfolio may invest to a lesser extent in securities denominated in foreign currencies. The Portfolio may hold a currency even if it does not hold any securities in that currency.
The Portfolio may also utilize derivative instruments for a variety of reasons, including providing long or short exposure to fixed income markets or particular fixed income securities, obtaining foreign currency exposure and for hedging purposes. In addition, the Portfolio may borrow money or enter into transactions such as reverse repurchase agreements for investment purposes. As a result of these borrowing transactions and the use of derivatives, the Portfolio’s gross exposure, including long and short exposure but not including cash or cash equivalents, may exceed its net assets.
| 1 | The Senior Officer’s fee evaluation was completed on January 24, 2014 and discussed with the Board of Directors on February 4-5, 2014. |
| 2 | Future references to the Portfolio do not include “AllianceBernstein.” References in the fee summary pertaining to performance and expense ratios refer to the Class A shares of the Portfolio. |
| 80 | • ALLIANCEBERNSTEIN CREDIT LONG/SHORT PORTFOLIO |
The Adviser proposed the Bank of America Merrill Lynch 3-Month U.S. T-Bill Index to be the primary benchmark for the Portfolio. The Adviser expects Lipper and Morningstar to place the Portfolio in their respective Alternative Credit Focus and Non-Traditional Bond categories.
The Senior Officer’s evaluation considered the following factors:
| 1. | Advisory fees charged to institutional and other clients of the Adviser for like services; |
| 2. | Advisory fees charged by other mutual fund companies for like services; |
| 3. | Costs to the Adviser and its affiliates of supplying services pursuant to the advisory agreement, excluding any intra-corporate profit; |
| 4. | Profit margins of the Adviser and its affiliates from supplying such services; |
| 5. | Possible economies of scale as the Portfolio grows larger; and |
| 6. | Nature and quality of the Adviser’s services including the performance of the Portfolio. |
These factors, with the exception of the first factor, are generally referred to as the “Gartenberg factors,” which were articulated by the United States Court of Appeals for the Second Circuit in 1982. Gartenberg v. Merrill Lynch Asset Management, Inc., 694 F. 2d 923 (2d Cir. 1982). On March 30, 2010, the Supreme Court held the Gartenberg decision was correct in its basic formulation of what Section 36(b) requires: to face liability under Section 36(b), “an investment adviser must charge a fee that is so disproportionately large that it bears no reasonable relationship to the services rendered and could not have been the product of arm’s length bargaining.” Jones v. Harris Associates L.P., 130 S. Ct. 1418 (2010). In the Jones decision, the Court stated the Gartenberg approach fully incorporates the correct understanding of fiduciary duty within the context of Section 36(b) and noted with approval that “Gartenberg insists that all relevant circumstances be taken into account” and “uses the range of fees that might result from arm’s length bargaining as the benchmark for reviewing challenged fees.”3
INVESTMENT ADVISORY FEES, NET ASSETS, & EXPENSE RATIOS
The Adviser proposed that the Portfolio pays the advisory fee set forth below for receiving the services to be provided pursuant to the Investment Advisory Agreement.
| Portfolio | Advisory Fee | |
| Credit Long/Short Portfolio4 | 0.90% of average daily net assets |
| 3 | Jones v. Harris at 1427. |
| 4 | The proposed advisory fee schedule for the Portfolio has a higher effective fee rate than the advisory fee schedule of the Specialty category, in which the Portfolio would have been categorized had the Adviser proposed to implement either of the NYAG related fee schedule. The advisory fee schedule for the Specialty category is as follows: 75 bp on the first $2.5 billion, 65 bp on the next $2.5 billion, 60 bp on the balance. |
| ALLIANCEBERNSTEIN CREDIT LONG/SHORT PORTFOLIO • | 81 |
In addition to paying the advisory fee, the Investment Advisory Agreement provides for the Adviser to be reimbursed for providing administrative and accounting services.
The Portfolio‘s Expense Limitation Agreement calls for the Adviser to establish expense caps, set forth below, for a one year period after the date the date that shares of the Portfolios are first offered to the public. The Expense Limitation Agreement also provides a mechanism for reimbursing the Adviser for its expense cap subsidy. Under the Expense Limitation Agreement, the Adviser may be able to recoup all or a portion of the amounts waived or reimbursed until the end of three fiscal years after the fiscal period in which the amounts were waived or reimbursed to the extent that the reimbursements do not cause the expense ratios of the Portfolio’s share classes to exceed the expense caps. The Adviser’s ability to recoup offering expenses will terminate with the agreement.
| Portfolio | Expense Cap Pursuant to Expense Limitation Undertaking | Estimated Gross Expense Ratio5 | Fiscal Year End | |||||||||
| Credit Long/Short Portfolio | Class A | 1.35 | % | 1.39 | % | October 31 | ||||||
| Class C | 2.05 | % | 2.16 | % | ||||||||
| Class R | 1.55 | % | 1.86 | % | ||||||||
| Class K | 1.30 | % | 1.55 | % | ||||||||
| Class I | 1.05 | % | 1.22 | % | ||||||||
| Advisor | 1.05 | % | 1.14 | % | ||||||||
| Class 1 | 1.15 | % | 1.22 | % | ||||||||
| Class 2 | 1.05 | % | 1.12 | % | ||||||||
| Class Z | 1.05 | % | 1.12 | % | ||||||||
| I. | ADVISORY FEES CHARGED TO INSTITUTIONAL AND OTHER CLIENTS |
The advisory fees charged to investment companies which the Adviser manages and sponsors are normally higher than those charged to similar sized institutional accounts, including pension plans and sub-advised investment companies. The fee differential reflects, among other things, different services provided to such clients, and different liabilities assumed. Services to be provided by the Adviser to the Portfolio that are not provided to non-investment company clients and sub-advised investment companies include providing office space and personnel to serve as Fund Officers, who among other responsibilities, make the certifications required under the Sarbanes–Oxley Act of 2002, and coordinating with and monitoring the Portfolio’s third party service providers such as Fund counsel, auditors, custodians, transfer agents and pricing services. The accounting, administrative, legal and compliance requirements for the Portfolio will be more costly than those for institutional assets due to the greater complexities and time required for investment companies, although the Adviser will be reimbursed for providing some of these services. Also, retail mutual funds managed by the Adviser are widely held. Servicing the Portfolio’s investors will be
| 5 | The Portfolio’s estimated gross expense ratios are based on an initial estimate of the Portfolio’s net assets at $250 million. |
| 82 | • ALLIANCEBERNSTEIN CREDIT LONG/SHORT PORTFOLIO |
more time consuming and labor intensive compared to institutional clients since the Adviser needs to communicate with a more extensive network of financial intermediaries and shareholders. The Adviser also believes that it incurs substantial entrepreneurial risk when offering a new mutual fund since establishing a new mutual fund requires a large upfront investment and it may take a long time for the fund to achieve profitability since the fund must be priced to scale from inception in order to be competitive and assets are acquired one account at a time. Managing the cash flow of an investment company may be more difficult than managing that of a stable pool of assets, such as an institutional account with little cash movement in either direction, particularly, if a fund is in net redemption and the Adviser is frequently forced to sell securities to raise cash for redemptions. However, managing a fund with positive cash flow may be easier at times than managing a stable pool of assets. Finally, in recent years, investment advisers have been sued by institutional clients and have suffered reputational damage both by the attendant publicity and outcomes other than complete victories. Accordingly, the legal and reputational risks associated with institutional accounts are greater than previously thought, although still not equal to those related to the mutual fund industry.
Notwithstanding the Adviser’s view that managing an investment company is not comparable to managing other institutional accounts because the services provided are different, the Supreme Court has indicated consideration should be given to the advisory fees charged to institutional accounts with a similar investment style as the Portfolio.6 However, the Adviser has represented that there is no category in the Form ADV for institutional products that have a substantially similar investment style as the Portfolio.
The Adviser has represented that it does not provide sub-advisory investment services to other investment companies that have a substantially similar investment style as the Portfolio.
| II. | MANAGEMENT FEES CHARGED BY OTHER MUTUAL FUND COMPANIES FOR LIKE SERVICES. |
Lipper, Inc. (“Lipper”), an analytical service that is not affiliated with the Adviser, compared the fees charged to the Portfolio with fees charged to other investment companies for similar services offered by other investment advisers.7 Lipper’s analysis included the comparison of the Portfolio’s contractual
| 6 | The Supreme Court stated that “courts may give such comparisons the weight that they merit in light of the similarities and differences between the services that the clients in question require, but the courts must be wary of inapt comparisons.” Among the significant differences the Supreme Court noted that may exist between services provided to mutual funds and institutional accounts are “higher marketing costs.” Jones v. Harris at 1428. |
| 7 | The Supreme Court cautioned against accepting mutual fund fee comparisons without careful scrutiny since “these comparisons are problematic because these fees, like those challenged, may not be the product of negotiations conducted at arm’s length.” Jones v. Harris at 1429. |
| ALLIANCEBERNSTEIN CREDIT LONG/SHORT PORTFOLIO • | 83 |
management fee, estimated at an initial asset level of $250 million, to the median of the Portfolio’s Lipper Expense Group (“EG”)8 and the Portfolio’s contractual management fee ranking.9
Lipper describes an EG as a representative sample of comparable funds. Lipper’s standard methodology for screening funds to be included in an EG entails the consideration of several fund criteria, including fund type, investment classification/objective, load type and similar 12b-1/non-12b-1 service fees, asset (size) comparability, expense components and attributes. An EG will typically consist of seven to twenty funds.
| Portfolio | Contractual Management Fee (%)10 | Lipper Exp. Group Median (%) | Rank | |||||||||
| Credit Long/Short Portfolio11 | 0.900 | 0.725 | 8/10 | |||||||||
Lipper also compared the Portfolio’s projected total expense ratio to the medians of the Portfolio’s EG and Lipper Expense Universe (“EU”). The EU is as a broader group compared to the EG, consisting of all funds that have the same investment classification/objective and load type as the subject Portfolio.12
| Portfolio | Expense Ratio (%)13 | Lipper Exp. Group Median (%) | Lipper Group Rank | Lipper Exp. Universe Median (%) | Lipper Universe Rank | |||||||||||||||
| Credit Long/Short Portfolio | 1.350 | 1.191 | 9/11 | 1.184 | 19/24 | |||||||||||||||
| 8 | Lipper does not consider average account size when constructing EGs. Funds with relatively small average account sizes tend to have higher transfer agent expense ratio than comparable sized funds that have relatively large average account sizes. There are limitations to Lipper expense category data because different funds categorize expenses differently. |
| 9 | The contractual management fee is calculated by Lipper using the Portfolio’s contractual management fee rate at a hypothetical asset level. The hypothetical asset level is based on the combined net assets of all classes of the Portfolio, rounded up to the next $25 million. Lipper’s total expense ratio information is based on the most recent annual report except as otherwise noted. A ranking of “1” would mean that Fund had the lowest effective fee rate in the Lipper peer group. |
| 10 | The contractual management fee does not reflect any expense reimbursements made by the Portfolio to the Adviser for certain clerical, legal, accounting, administrative, and other services. In addition, the contractual management fee does not reflect any advisory fee waivers for expense caps. |
| 11 | Note that one of the Portfolio’s EG peer is excluded from the contractual management fee comparison due to the fund’s all-inclusive fee. |
| 12 | Except for asset (size) comparability, Lipper uses the same criteria for selecting an EG peer when selecting an EU peer. Unlike the EG, the EU allows for the same adviser to be represented by more than just one fund. |
| 13 | Projected total expense ratio information, based on an initial net asset estimate of $250 million, pertains to the Portfolio’s Class A shares. |
| 84 | • ALLIANCEBERNSTEIN CREDIT LONG/SHORT PORTFOLIO |
Based on this analysis, the Portfolio’s contractual management fee and total expense ratio are higher than the medians of the Portfolio’s EG and EU.
| III. | COSTS TO THE ADVISER AND ITS AFFILIATES OF SUPPLYING SERVICES PURSUANT TO THE MANAGEMENT FEE ARRANGEMENT, EXCLUDING ANY INTRA-CORPORATE PROFIT. |
The Adviser utilizes two profitability reporting systems, which operate independently but are aligned with each other, to estimate the Adviser’s profitability in connection with investment advisory services provided to the Portfolio. The Senior Officer has retained a consultant to provide independent advice regarding the alignment of the two profitability systems as well as the methodologies and allocations utilized by both profitability systems. See Section IV for additional discussion.
| IV. | PROFIT MARGINS OF THE ADVISER AND ITS AFFILIATES FOR SUPPLYING SUCH SERVICES. |
The Portfolio has not yet commenced operations. Therefore, there is no historic profitability data with respect to the Adviser’s investment services to the Portfolio.
In addition to the Adviser’s direct profits from managing the Portfolio, certain of the Adviser’s affiliates have business relationships with the Portfolio and may earn a profit from providing other services to the Portfolio. The courts have referred to this type of business opportunity as “fall-out benefits” to the Adviser and indicated that such benefits should be factored into the evaluation of the total relationship between the Portfolio and the Adviser. Neither case law nor common business practice precludes the Adviser’s affiliates from earning a reasonable profit on this type of relationship provided the affiliates’ charges and services are competitive and the relationship otherwise complies with the 40 Act restrictions. These affiliates will provide transfer agent and distribution related services to the Portfolio and will receive transfer agent fees, Rule 12b-1 payments, front-end sales loads and contingent deferred sales charges (“CDSC”).
AllianceBernstein Investments, Inc. (“ABI”), an affiliate of the Adviser, is the Fund’s principal underwriter. ABI and the Adviser have disclosed in the Portfolio’s prospectus that they may make revenue sharing payments from their own resources, in addition to resources derived from sales loads and Rule 12b-1 fees, to firms that sell shares of the Portfolio. The total amount to be paid to a financial intermediary associated with the sale of shares will generally not exceed the sum of (a) 0.25% of the current year’s fund sales by that firm and (b) 0.10% of the average daily net assets attributable to that firm over the year. In 2012, ABI paid approximately 0.048% of the average monthly assets of the AllianceBernstein Mutual Funds or approximately $19.0 million for distribution services and educational support (revenue sharing payments).
| ALLIANCEBERNSTEIN CREDIT LONG/SHORT PORTFOLIO • | 85 |
Fees and reimbursements for out of pocket expenses to be charged by AllianceBernstein Investor Services, Inc. (“ABIS”), the affiliated transfer agent for the Portfolio, are based on the level of the network account and the class of shares held by the account. ABIS also receives a fee per shareholder sub-account for each account maintained by an intermediary on an omnibus basis
| V. | POSSIBLE ECONOMIES OF SCALE |
The Adviser has indicated that economies of scale are being shared with shareholders through pricing to scale, breakpoints, fee reductions/waivers and enhancement to services.
An independent consultant, retained by the Senior Officer, provided the Board of Directors information on the Adviser’s firm-wide average costs from 2005 through 2011 and the potential economies of scale. The independent consultant noted that from 2005 through 2007 the Adviser experienced significant growth in assets under management (���AUM”). During this period, operating expenses increased, in part to keep up with growth, and in part reflecting market returns. However, from 2008 through the first quarter of 2009, AUM rapidly and significantly decreased due to declines in market value and client withdrawals. When AUM rapidly decreased, some operating expenses categories, including base compensation and office space, adjusted more slowly during this period, resulting in an increase in average costs. Since 2009, AUM have experienced less significant changes. The independent consultant noted that changes in operating expenses reflect changes in business composition and business practices in response to changes in financial markets. Finally, the independent consultant concluded that the increase in average cost and the decline in net operating margin across the Adviser since late 2008 are inconsistent with the view that there are currently reductions in average costs due to economies of scale that can be shared with the AllianceBernstein Mutual Funds managed by the Adviser through lower fees.
In February 2008, the independent consultant provided the Board of Directors an update of the Deli14 study on advisory fees and various fund characteristics.15 The independent consultant first reiterated the results of his previous two dimensional comparison analysis (fund size and family size) with the Board of
| 14 | The Deli study, originally published in 2002 based on 1997 data and updated for the February 2008 Presentation, may be of diminished value due to the age of the data used in the presentation and the changes experienced in the industry over the last four years. |
| 15 | As mentioned previously, the Supreme Court cautioned against accepting mutual fund fee comparisons without careful scrutiny since the fees may not be the product of negotiations conducted at arm’s length. See Jones v. Harris at 1429. |
| 86 | • ALLIANCEBERNSTEIN CREDIT LONG/SHORT PORTFOLIO |
Directors.16 The independent consultant then discussed the results of the regression model that was utilized to study the effects of various factors on advisory fees. The regression model output indicated that the bulk of the variation in fees predicted were explained by various factors, but substantially by fund AUM, family AUM, index fund indicator and investment style. The independent consultant also compared the advisory fees of the AllianceBernstein Mutual Funds to similar funds managed by 19 other large asset managers, regardless of the fund size and each Adviser’s proportion of mutual fund assets to non-mutual fund assets.
| VI. | NATURE AND QUALITY OF THE ADVISER’S SERVICES, INCLUDING THE PERFORMANCE OF THE FUND |
With assets under management of approximately $451 billion as of December 31, 2013, the Adviser has the investment experience to manage and provide non-investment services (described in Section I) to the Portfolio.
Since the Portfolio has not yet commenced operations, the Portfolio has no performance history.
CONCLUSION:
Based on the factors discussed above, the Senior Officer noted the proposed contractual management fee and total expense ratio for the Portfolio, both of which are higher than the medians. The Senior Office recommended that the Directors consider discussing with the Adviser the Portfolio’s anticipated leverage in light of the Portfolio’s investment advisory fee. The Senior Officer also recommended that the Directors consider discussing with the Adviser adding breakpoints to the proposed advisory fee schedule for the Portfolio. This conclusion in respect of the Portfolio is based on an evaluation of all of these factors and no single factor was dispositive.
Dated: March 5, 2014
| 16 | The two dimensional analysis showed patterns of lower advisory fees for funds with larger asset sizes and funds from larger family sizes compared to funds with smaller asset sizes and funds from smaller family sizes, which according to the independent consultant is indicative of a sharing of economies of scale and scope. However, in less liquid and active markets, such is not the case, as the empirical analysis showed potential for diseconomies of scale in those markets. The empirical analysis also showed diminishing economies of scale and scope as funds surpassed a certain high level of assets. |
| ALLIANCEBERNSTEIN CREDIT LONG/SHORT PORTFOLIO • | 87 |
THIS PAGE IS NOT PART OF THE SHAREHOLDER REPORT OR THE FINANCIAL STATEMENTS
ALLIANCEBERNSTEIN FAMILY OF FUNDS
US Equity
US Core
Core Opportunities Fund
Select US Equity Portfolio
US Growth
Concentrated Growth Fund
Discovery Growth Fund
Growth Fund
Large Cap Growth Fund
Small Cap Growth Portfolio
US Value
Discovery Value Fund
Equity Income Fund
Growth & Income Fund
Value Fund
International/Global Equity
International/Global Core
Global Equity & Covered Call Strategy Fund
Global Thematic Growth Fund
International Portfolio
Tax-Managed International Portfolio
International/Global Growth
International Growth Fund
International/Global Value
International Value Fund
Fixed Income
Municipal
High Income Municipal Portfolio
Intermediate California Portfolio
Intermediate Diversified Portfolio
Intermediate New York Portfolio
Municipal Bond Inflation Strategy
Tax-Aware Fixed Income Portfolio
National Portfolio
Arizona Portfolio
California Portfolio
Massachusetts Portfolio
Michigan Portfolio
Minnesota Portfolio
New Jersey Portfolio
New York Portfolio
Ohio Portfolio
Pennsylvania Portfolio
Virginia Portfolio
Taxable
Bond Inflation Strategy
Global Bond Fund
Fixed Income (continued)
Taxable
High Income Fund
High Yield Portfolio
Intermediate Bond Portfolio
Limited Duration High Income Portfolio
Short Duration Portfolio
Alternatives
All Market Real Return Portfolio*
Credit Long/Short Portfolio
Global Real Estate Investment Fund
Long/Short Multi-Manager Fund
Market Neutral Strategy-U.S.
Multi-Manager Alternative Strategies Fund
Select US Long/Short Portfolio
Unconstrained Bond Fund
Multi-Asset
All Market Growth Portfolio*
Emerging Markets Multi-Asset Portfolio
Global Risk Allocation Fund
Retirement Strategies
2000 Retirement Strategy
2005 Retirement Strategy
2010 Retirement Strategy
2015 Retirement Strategy
2020 Retirement Strategy
2025 Retirement Strategy
2030 Retirement Strategy
2035 Retirement Strategy
2040 Retirement Strategy
2045 Retirement Strategy
2050 Retirement Strategy
2055 Retirement Strategy
Wealth Strategies
Balanced Wealth Strategy
Conservative Wealth Strategy
Wealth Appreciation Strategy
Tax-Managed Balanced Wealth Strategy
Tax-Managed Conservative Wealth Strategy
Tax-Managed Wealth Appreciation Strategy
Closed-End Funds
Alliance California Municipal Income Fund
Alliance New York Municipal Income Fund
AllianceBernstein Global High Income Fund
AllianceBernstein Income Fund
AllianceBernstein Multi-Manager Alternative Fund
AllianceBernstein National Municipal Income Fund
We also offer Exchange Reserves, which serves as the money market fund exchange vehicle for the AllianceBernstein mutual funds. An investment in Exchange Reserves is not a deposit in a bank and is not insured or guaranteed by the Federal Deposit Insurance Corporation or any other government agency. Although the Fund seeks to preserve the value of your investment at $1.00 per share, it is possible to lose money by investing in the Fund.
Investors should consider the investment objectives, risks, charges and expenses of the Fund carefully before investing. For copies of our prospectus or summary prospectus, which contain this and other information, visit us online at www.alliancebernstein.com or contact your AllianceBernstein investments representative. Please read the prospectus and/or summary prospectus carefully before investing.
* Prior to December 15, 2014, All Market Growth Portfolio was named Dynamic All Market Fund; All Market Real Return Portfolio was named Real Asset Strategy.
| 88 | • ALLIANCEBERNSTEIN CREDIT LONG/SHORT PORTFOLIO |
AllianceBernstein Family of Funds
NOTES
| ALLIANCEBERNSTEIN CREDIT LONG/SHORT PORTFOLIO • | 89 |
NOTES
| 90 | • ALLIANCEBERNSTEIN CREDIT LONG/SHORT PORTFOLIO |
NOTES
| ALLIANCEBERNSTEIN CREDIT LONG/SHORT PORTFOLIO • | 91 |
NOTES
| 92 | • ALLIANCEBERNSTEIN CREDIT LONG/SHORT PORTFOLIO |
ALLIANCEBERNSTEIN CREDIT LONG/SHORT PORTFOLIO
1345 Avenue of the Americas
New York, NY 10105
800.221.5672
| CLS-0151-1014 |  | |
ANNUAL REPORT
AllianceBernstein
High Yield Portfolio
October 31, 2014
Annual Report

Investment Products Offered
• Are Not FDIC Insured • May Lose Value • Are Not Bank Guaranteed |
Investors should consider the investment objectives, risks, charges and expenses of the Fund carefully before investing. For copies of our prospectus or summary prospectus, which contain this and other information, visit us online at www.alliancebernstein.com or contact your AllianceBernstein Investments representative. Please read the prospectus and/or summary prospectus carefully before investing.
This shareholder report must be preceded or accompanied by the Fund’s prospectus for individuals who are not current shareholders of the Fund.
You may obtain a description of the Fund’s proxy voting policies and procedures, and information regarding how the Fund voted proxies relating to portfolio securities during the most recent 12-month period ended June 30, without charge. Simply visit AllianceBernstein’s website at www.alliancebernstein.com, or go to the Securities and Exchange Commission’s (the “Commission”) website at www.sec.gov, or call AllianceBernstein at (800) 227-4618.
The Fund files its complete schedule of portfolio holdings with the Commission for the first and third quarters of each fiscal year on Form N-Q. The Fund’s Forms N-Q are available on the Commission’s website at www.sec.gov. The Fund’s Forms N-Q may also be reviewed and copied at the Commission’s Public Reference Room in Washington, DC; information on the operation of the Public Reference Room may be obtained by calling (800) SEC-0330. AllianceBernstein publishes full portfolio holdings for the Fund monthly at www.alliancebernstein.com.
AllianceBernstein Investments, Inc. (ABI) is the distributor of the AllianceBernstein family of mutual funds. ABI is a member of FINRA and is an affiliate of AllianceBernstein L.P., the manager of the funds.
AllianceBernstein® and the AB Logo are registered trademarks and service marks used by permission of the owner, AllianceBernstein L.P.
December 18, 2014
Annual Report
This report provides management’s discussion of fund performance for AllianceBernstein High Yield Portfolio (the “Fund”) for the annual reporting period ended October 31, 2014. The Fund commenced operations on July 15, 2014.
Investment Objectives and Policies
The Fund’s investment objective is to seek to maximize total return consistent with prudent investment management. Under normal circumstances, at least 80% of the Fund’s net assets will be invested in fixed-income securities rated Ba1 or lower by Moody’s Investors Service (“Moody’s”) or BB+ or lower by Standard & Poor’s Ratings Services (“S&P”) or Fitch Ratings (“Fitch”) (commonly known as “junk bonds”), unrated securities considered by AllianceBernstein L.P. (the “Adviser”) to be of comparable quality, and related derivatives. The Fund may invest in fixed-income securities with a range of maturities from short- to long-term. The Fund may also invest in equity securities.
In selecting securities for purchase or sale by the Fund, the Adviser attempts to take advantage of inefficiencies that it believes exist in the global debt markets. These inefficiencies arise from investor behavior, market complexity, and the investment limitations to which investors are subject. The Adviser combines quantitative analysis with fundamental credit and economic research in seeking to exploit these inefficiencies.
The Fund will most often invest in securities of U.S. issuers, but may also
purchase fixed-income securities of foreign issuers, including securities denominated in foreign currencies. Fluctuations in currency exchange rates can have a dramatic impact on the returns of fixed-income securities denominated in foreign currencies. The Adviser may or may not hedge any foreign currency exposure through the use of currency-related derivatives.
The Fund expects to use derivatives, such as options, futures, forwards and swaps, to a significant extent. Derivatives may provide a more efficient and economical exposure to market segments than direct investments, and may also be a more efficient way to alter the Fund’s exposure. The Fund may, for example, use credit default and interest rate swaps to gain exposure to the fixed-income markets or particular fixed-income securities and, as noted above, may use currency derivatives. The Adviser may use derivatives to effectively leverage the Fund by creating aggregate market exposure substantially in excess of the Fund’s net assets.
Investment Results
The table on page 5 shows the Fund’s performance compared to its benchmark, the Barclays U.S. Corporate High Yield (“HY”) 2% Issuer Capped Index, for the period since the Fund’s inception on July 15, 2014 through October 31, 2014.
All share classes of the Fund outperformed the benchmark since inception. Overall security selection, particularly in the Fund’s consumer cyclical, media, energy, technology
| ALLIANCEBERNSTEIN HIGH YIELD PORTFOLIO • | 1 |
and consumer non-cyclical holdings, was a primary contributor to performance. Industry allocation, specifically an overweight in banks and underweight in basics and energy, also contributed. Within sector positioning, an allocation to securitized assets (non-agency mortgages and commercial mortgage-backed securities) detracted, while exposure to investment-grade corporates contributed. Overall yield curve positioning, particularly an underweight in the five-year maturity bucket, detracted. Currency exposure, specifically an overweight to the U.S. dollar versus short positions in several developed-market currencies, contributed.
Derivatives in the form of Treasury futures were utilized during the reporting period to manage overall duration and yield curve positioning. Currency forwards were employed to manage overall currency positioning, which contributed to returns. Purchased options were utilized for hedging purposes, which contributed; written options were utilized for hedging purposes, which detracted. Credit default swaps were utilized for hedging and investment purposes, and total return swaps for investment purposes, which contributed to returns.
Market Review and Investment Strategy
Volatility returned to fixed-income markets during the reporting period, as geopolitical risks and signs of slowing growth in Europe and China dampened overall risk sentiment. Technical influences, including record-setting high-yield new issuance, led high-yield spreads wider in September, and the broad high-yield market posted only its
second monthly negative return during 2014. However, the high-yield market rebounded in October, along with equity markets. After several months of outflows, flows into high-yield funds turned positive in October.
Within high yield holdings since the Fund’s inception, utility and financial sectors posted positive returns while industrials fell into negative territory. The industrial sector was dragged down by weak returns in energy and basic industries. Within quality tier, higher-rated high yield outperformed with BB-rated debt returning 0.91%, followed by B-rated at -0.74% and CCC-rated at -2.75%. High-yield spreads widened approximately 0.70% since the Fund’s inception, to end the period at 4.15% over duration-matched Treasuries.
In the view of the Fund’s Investment Policy Team (the “Team”), continued moderate global growth should provide a supportive backdrop for high yield and the Team anticipates that growth will be fast enough to prevent a significant deterioration of credit quality, but not so fast as to warrant reactionary monetary policy tightening. Credit fundamentals are still generally solid and the Team continues to look for opportunities in periods of volatility, while emphasizing the importance of security selection. The Team cautions against the reach for yield, and remains selective in the Fund’s exposure to CCC-rated bonds. The Fund’s high-yield holdings are attractively valued compared to current and expected defaults, and are diversified at the sector and issuer level.
| 2 | • ALLIANCEBERNSTEIN HIGH YIELD PORTFOLIO |
DISCLOSURES AND RISKS
Benchmark Disclosure
The unmanaged Barclays U.S. Corporate High Yield 2% Issuer Capped Index does not reflect fees and expenses associated with the active management of a mutual fund portfolio. The Barclays U.S. Corporate HY 2% Issuer Capped Index is the 2% Issuer Capped component of the U.S. Corporate High Yield Index. The Barclays U.S. Corporate HY Index represents the performance of fixed-income securities having a maximum quality rating of Ba1, a minimum amount outstanding of $150 million and at least one year to maturity. An investor cannot invest directly in an index or average, and their results are not indicative of the performance for any specific investment, including the Fund.
A Word About Risk
Market Risk: The value of the Fund’s assets will fluctuate as the bond or stock market fluctuates. The value of its investments may decline, sometimes rapidly and unpredictably, simply because of economic changes or other events that affect large portions of the market.
Interest Rate Risk: Changes in interest rates will affect the value of investments in fixed-income securities. When interest rates rise, the value of investments in fixed-income securities tends to fall and this decrease in value may not be offset by higher income from new investments. Interest rate risk is generally greater for fixed-income securities with longer maturities or durations.
Credit Risk: An issuer or guarantor of a fixed-income security, or the counterparty to a derivatives or other contract, may be unable or unwilling to make timely payments of interest or principal, or to otherwise honor its obligations. The issuer or guarantor may default, causing a loss of the full principal amount of a security. The degree of risk for a particular security may be reflected in its credit rating. There is the possibility that the credit rating of a fixed-income security may be downgraded after purchase, which may adversely affect the value of the security.
Below Investment Grade Securities Risk: Investments in fixed-income securities with lower ratings are subject to a higher probability that an issuer will default or fail to meet its payment obligations. These securities may be subject to greater price volatility, due to such factors as specific corporate developments, negative perception of the junk bond market generally and less secondary market liquidity. These securities are often able to be “called” or repurchased by the issuer prior to their maturity date, forcing the Fund to reinvest the proceeds, possibly at a lower rate of return.
Inflation Risk: This is the risk that the value of assets or income from investments will be less in the future as inflation decreases the value of money. As inflation increases, the value of the Fund’s assets can decline as can the value of the Fund’s distributions. This risk is significantly greater if the Fund invests a significant portion of its assets in fixed-income securities with longer maturities.
Derivatives Risk: Investments in derivatives may be illiquid, difficult to price, and leveraged so that small changes may produce disproportionate losses for the Fund, and may be subject to counterparty risk to a greater degree than more traditional investments.
Leverage Risk: To the extent the Fund uses leveraging techniques, its net asset value (“NAV”) may be more volatile because leverage tends to exaggerate the effect of changes in interest rates and any increase or decrease in the value of the Fund’s investments.
Foreign (Non-U.S.) Risk: Investments in securities of non-U.S. issuers may involve more risk than those of U.S. issuers. These securities may fluctuate more widely in price and may be less liquid due to adverse market, economic, political, regulatory or other factors. These risks may be heightened with respect to investments in emerging-market countries, where there may be an increased amount of economic, political and social instability.
(Disclosures, Risks and Note about Historical Performance continued on next page)
| ALLIANCEBERNSTEIN HIGH YIELD PORTFOLIO • | 3 |
Disclosures and Risks
DISCLOSURES AND RISKS
(continued from previous page)
Emerging Market Risk: Investments in emerging market countries may have more risk because the markets are less developed and less liquid as well as being subject to increased economic, political, regulatory or other uncertainties.
Currency Risk: Fluctuations in currency exchange rates may negatively affect the value of the Fund’s investments or reduce its returns.
Diversification Risk: The Fund may have more risk because it is “non-diversified”, meaning that it can invest more of its assets in a smaller number of issuers. Accordingly, changes in the value of a single security may have a more significant effect, either negative or positive, on the Fund’s NAV.
Management Risk: The Fund is subject to management risk because it is an actively-managed investment fund. The Adviser will apply its investment techniques and risk analyses in making investment decisions, but there is no guarantee that its techniques will produce the intended results.
These risks are fully discussed in the Fund’s prospectus.
An Important Note About Historical Performance
The investment return and principal value of an investment in the Fund will fluctuate, so that shares, when redeemed, may be worth more or less than their original cost. Performance shown on the following pages represents past performance and does not guarantee future results. Current performance may be lower or higher than the performance information shown. You may obtain performance information current to the most recent month-end by visiting www.alliancebernstein.com. The Fund has been in operation only for a short period of time, and therefore has a very limited historical performance period. This limited performance period is unlikely to be representative of the performance the Fund will achieve over a longer period.
All fees and expenses related to the operation of the Fund have been deducted. NAV returns do not reflect sales charges; if sales charges were reflected, the Fund’s quoted performance would be lower. SEC returns reflect the applicable sales charges for each share class: a 4.25% maximum front-end sales charge for Class A shares and a 1% 1-year contingent deferred sales charge for Class C shares. Returns for the different share classes will vary due to different expenses associated with each class. Performance assumes reinvestment of distributions and does not account for taxes.
| 4 | • ALLIANCEBERNSTEIN HIGH YIELD PORTFOLIO |
Disclosures and Risks
HISTORICAL PERFORMANCE
THE FUND VS. ITS BENCHMARK PERIODS ENDED OCTOBER 31, 2014 (unaudited) | NAV Returns | |||||
| Since Inception* | ||||||
| AllianceBernstein High Yield Portfolio | ||||||
| ||||||
Class A | 0.04% | |||||
| ||||||
Class C | -0.18% | |||||
| ||||||
Advisor Class† | 0.14% | |||||
| ||||||
Class R† | -0.03% | |||||
| ||||||
Class K† | 0.05% | |||||
| ||||||
Class I† | 0.12% | |||||
| ||||||
Class Z† | 0.12% | |||||
| ||||||
| Barclays U.S. Corporate HY 2% Issuer Capped Index | -0.52% | |||||
| ||||||
* Inception date: 7/15/2014.
† Please note that these share classes are for investors purchasing shares through accounts established under certain fee-based programs sponsored and maintained by certain broker-dealers and financial intermediaries, institutional pension plans and/or investment advisory clients of, and certain other persons associated with, the Adviser and its affiliates or the Fund. | ||||||
See Disclosures, Risks and Note about Historical Performance on pages 3-4.
(Historical Performance continued on next page)
| ALLIANCEBERNSTEIN HIGH YIELD PORTFOLIO • | 5 |
Historical Performance
HISTORICAL PERFORMANCE
(continued from previous page)
GROWTH OF A $10,000 INVESTMENT IN THE FUND
7/15/14* TO 10/31/14 (unaudited)
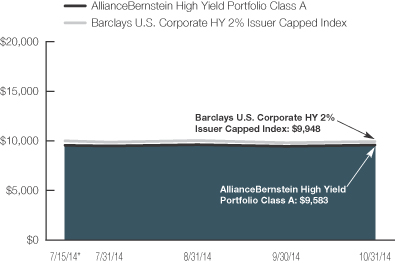
This chart illustrates the total value of an assumed $10,000 investment in AllianceBernstein High Yield Portfolio Class A shares (from 7/15/14 to 10/31/14) as compared to the performance of the Fund’s benchmark. The chart reflects the deduction of the maximum 4.25% sales charge from the initial $10,000 investment in the Strategy and assumes the reinvestment of dividends and capital gains distributions.
| * | Inception date: 7/15/2014. |
See Disclosures, Risks and Note about Historical Performance on pages 3-4.
(Historical Performance continued on next page)
| 6 | • ALLIANCEBERNSTEIN HIGH YIELD PORTFOLIO |
Historical Performance
HISTORICAL PERFORMANCE
(continued from previous page)
| AVERAGE ANNUAL RETURNS AS OF OCTOBER 31, 2014 (unaudited) | ||||||||||||
| NAV Returns | SEC Returns (reflects applicable | SEC Yields* | ||||||||||
| Class A Shares | -22.52 | % | ||||||||||
Since Inception† | 0.04 | % | -4.17 | % | ||||||||
| Class C Shares | -24.20 | % | ||||||||||
Since Inception† | -0.18 | % | -1.17 | % | ||||||||
| Advisor Class Shares‡ | -5.90 | % | ||||||||||
Since Inception† | 0.14 | % | 0.14 | % | ||||||||
| Class R Shares‡ | 0.32 | % | ||||||||||
Since Inception† | -0.03 | % | -0.03 | % | ||||||||
| Class K Shares‡ | 0.60 | % | ||||||||||
Since Inception† | 0.05 | % | 0.05 | % | ||||||||
| Class I Shares‡ | 0.88 | % | ||||||||||
Since Inception† | 0.12 | % | 0.12 | % | ||||||||
| Class Z Shares‡ | 0.85 | % | ||||||||||
Since Inception† | 0.12 | % | 0.12 | % | ||||||||
The Fund’s prospectus fee table shows the Fund’s total annual operating expense ratios as 1.39%, 2.16%, 1.14%, 1.86%, 1.55%, 1.22% and 1.12% for Class A, Class C, Advisor Class, Class R, Class K, Class I and Class Z shares, respectively, gross of any fee waivers or expense reimbursements. Contractual fee waivers and/or expense reimbursements limit the Fund’s annual operating expenses to 1.05%, 1.80%, 0.80%, 1.30%, 1.05%, 0.80% and 0.80% for Class A, Class C, Advisor Class, Class R, Class K, Class I and Class Z shares, respectively. These waivers/reimbursements may not be terminated before July 15, 2015 and may be extended by the Adviser for additional one-year terms. Absent reimbursements or waivers, performance would have been lower. The Financial Highlights section of this report sets forth expense ratio data for the current reporting period; the expense ratios shown above may differ from the expense ratios in the Financial Highlights sections since they are based on different time periods.
| * | SEC yields are calculated based on SEC guidelines for the 30-day period ended October 31, 2014. |
| † | Inception date: 7/15/2014. |
| ‡ | These share classes are offered at NAV to eligible investors and their SEC returns are the same as their NAV returns. Please note that these share classes are for investors purchasing shares through accounts established under certain fee-based programs sponsored and maintained by certain broker-dealers and financial intermediaries, institutional pension plans and/or investment advisory clients of, and certain other persons associated with, the Adviser and its affiliates or the Fund. The inception date for these share classes is listed above. |
See Disclosures, Risks and Note about Historical Performance on pages 3-4.
(Historical Performance continued on next page)
| ALLIANCEBERNSTEIN HIGH YIELD PORTFOLIO • | 7 |
Historical Performance
HISTORICAL PERFORMANCE
(continued from previous page)
| SEC AVERAGE ANNUAL RETURNS AS OF THE MOST RECENT CALENDAR QUARTER-END SEPTEMBER 30, 2014 (unaudited) | ||||
SEC Returns (reflects applicable sales charges) | ||||
| Class A Shares | ||||
Since Inception† | -5.33 | % | ||
| Class C Shares | ||||
Since Inception† | -2.30 | % | ||
| Advisor Class Shares‡ | ||||
Since Inception† | -1.11 | % | ||
| Class R Shares‡ | ||||
Since Inception† | -1.22 | % | ||
| Class K Shares‡ | ||||
Since Inception† | -1.16 | % | ||
| Class I Shares‡ | ||||
Since Inception† | -1.11 | % | ||
| Class Z Shares‡ | ||||
Since Inception† | -1.11 | % | ||
| † | Inception date: 7/15/2014. |
| ‡ | These share classes are offered at NAV to eligible investors and their SEC returns are the same as their NAV returns. Please note that these share classes are for investors purchasing shares through accounts established under certain fee-based programs sponsored and maintained by certain broker-dealers and financial intermediaries, institutional pension plans and/or investment advisory clients of, and certain other persons associated with, the Adviser and its affiliates or the Fund. The inception date for these share classes is listed above. |
See Disclosures, Risks and Note about Historical Performance on pages 3-4.
| 8 | • ALLIANCEBERNSTEIN HIGH YIELD PORTFOLIO |
Historical Performance
EXPENSE EXAMPLE
(unaudited)
As a shareholder of the Fund, you incur two types of costs: (1) transaction costs, including sales charges (loads) on purchase payments, contingent deferred sales charges on redemptions and (2) ongoing costs, including management fees; distribution (12b-1) fees; and other Fund expenses. This example is intended to help you understand your ongoing costs (in dollars) of investing in the Fund and to compare these costs with the ongoing costs of investing in other mutual funds.
The Example is based on an investment of $1,000 invested at the beginning of the period and held for the entire period as indicated below.
Actual Expenses
The first line of the table below provides information about actual account values and actual expenses. You may use the information in this line, together with the amount you invested, to estimate the expenses that you paid over the period. Simply divide your account value by $1,000 (for example, an $8,600 account value divided by $1,000 = 8.6), then multiply the result by the number in the first line under the heading entitled “Expenses Paid During Period” to estimate the expenses you paid on your account during this period.
Hypothetical Example for Comparison Purposes
The second line of the table below provides information about hypothetical account values and hypothetical expenses based on the Fund’s actual expense ratio and an assumed annual rate of return of 5% before expenses, which is not the Fund’s actual return. The hypothetical account values and expenses may not be used to estimate the actual ending account balance or expenses you paid for the period. You may use this information to compare the ongoing costs of investing in the Fund and other funds by comparing this 5% hypothetical example with the 5% hypothetical examples that appear in the shareholder reports of other funds.
| Beginning Account Value July 15, 2014† | Ending Account Value October 31, 2014 | Expenses Paid During Period* | Annualized Expense Ratio* | |||||||||||||
| Class A | ||||||||||||||||
Actual | $ | 1,000 | $ | 1,000.40 | $ | 3.11 | 1.05 | % | ||||||||
Hypothetical** | $ | 1,000 | $ | 1,019.91 | $ | 5.35 | 1.05 | % | ||||||||
| Class C | ||||||||||||||||
Actual | $ | 1,000 | $ | 998.20 | $ | 5.32 | 1.80 | % | ||||||||
Hypothetical** | $ | 1,000 | $ | 1,016.13 | $ | 9.15 | 1.80 | % | ||||||||
| Advisor Class | ||||||||||||||||
Actual | $ | 1,000 | $ | 1,001.40 | $ | 2.37 | 0.80 | % | ||||||||
Hypothetical** | $ | 1,000 | $ | 1,021.17 | $ | 4.08 | 0.80 | % | ||||||||
| Class R | ||||||||||||||||
Actual | $ | 1,000 | $ | 999.70 | $ | 3.85 | 1.30 | % | ||||||||
Hypothetical** | $ | 1,000 | $ | 1,018.65 | $ | 6.61 | 1.30 | % | ||||||||
| Class K | ||||||||||||||||
Actual | $ | 1,000 | $ | 1,000.50 | $ | 3.11 | 1.05 | % | ||||||||
Hypothetical** | $ | 1,000 | $ | 1,019.91 | $ | 5.35 | 1.05 | % | ||||||||
| Class I | ||||||||||||||||
Actual | $ | 1,000 | $ | 1,001.20 | $ | 2.37 | 0.80 | % | ||||||||
Hypothetical** | $ | 1,000 | $ | 1,021.17 | $ | 4.08 | 0.80 | % | ||||||||
| Class Z | ||||||||||||||||
Actual | $ | 1,000 | $ | 1,001.20 | $ | 2.37 | 0.80 | % | ||||||||
Hypothetical** | $ | 1,000 | $ | 1,021.17 | $ | 4.08 | 0.80 | % | ||||||||
| † | Commencement of operations. |
| * | Actual expenses paid are based on the period from July 15, 2014 (commencement of operations) and are equal to the Fund’s annualized expense ratio, multiplied by the average account value over the period multiplied by 108/365 (to reflect the since inception period). Hypothetical expenses are equal to the Fund’s annualized expense ratio, multiplied by the average account value over the period, multiplied by 184/365 (to reflect the one-half year period). |
| ** | Assumes 5% annual return before expenses. |
| ALLIANCEBERNSTEIN HIGH YIELD PORTFOLIO • | 9 |
Expense Example
PORTFOLIO SUMMARY
October 31, 2014 (unaudited)
PORTFOLIO STATISTICS
Net Assets ($mil): $20.0
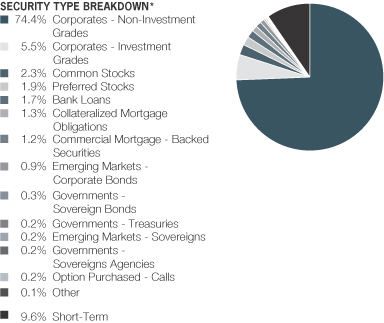
| * | All data are as of October 31, 2014. The Fund’s security type breakdown is expressed as a percentage of total investments and may vary over time. The Fund also enters into derivative transactions, which may be used for hedging or investment purposes (see “Portfolio of Investments” section of the report for additional details). “Other” securities type weightings represent 0.1% or less in the following security types: Option Purchased-Puts and Warrants. |
| 10 | • ALLIANCEBERNSTEIN HIGH YIELD PORTFOLIO |
Portfolio Summary
PORTFOLIO OF INVESTMENTS
October 31, 2014
| Principal Amount (000) | U.S. $ Value | |||||||||
|
|
| ||||||||
CORPORATES - NON-INVESTMENT GRADE – 73.4% | ||||||||||
Industrial – 58.9% | ||||||||||
Basic – 5.1% | ||||||||||
AK Steel Corp. | U.S.$ | 20 | $ | 21,850 | ||||||
Aleris International, Inc. | 30 | 30,900 | ||||||||
7.875%, 11/01/20 | 10 | 10,400 | ||||||||
ArcelorMittal | 10 | 10,725 | ||||||||
6.125%, 6/01/18 | 73 | 78,110 | ||||||||
7.25%, 3/01/41 | 38 | 39,235 | ||||||||
7.50%, 10/15/39 | 46 | 49,105 | ||||||||
Arch Coal, Inc. | 30 | 11,100 | ||||||||
Ashland, Inc. | 20 | 20,325 | ||||||||
Axiall Corp. | 40 | 38,800 | ||||||||
Cliffs Natural Resources, Inc. | 15 | 12,300 | ||||||||
6.25%, 10/01/40 | 26 | 19,240 | ||||||||
Commercial Metals Co. | 25 | 26,875 | ||||||||
FMG Resources August 2006 Pty Ltd. | 20 | 20,400 | ||||||||
8.25%, 11/01/19(a) | 75 | 77,812 | ||||||||
Hexion US Finance Corp./Hexion Nova Scotia Finance ULC | 9 | 8,899 | ||||||||
Huntsman International LLC | 50 | 54,500 | ||||||||
JMC Steel Group, Inc. | 40 | 40,600 | ||||||||
Lundin Mining Corp. | 15 | 15,638 | ||||||||
7.875%, 11/01/22(a) | 15 | 15,600 | ||||||||
Magnetation LLC/Mag Finance Corp. | 50 | 44,875 | ||||||||
Molycorp, Inc. | 49 | 35,035 | ||||||||
Momentive Performance Materials, Inc. | 40 | – 0 | – | |||||||
Novelis, Inc. | 30 | 32,737 | ||||||||
Peabody Energy Corp. | 56 | 54,180 | ||||||||
Rain CII Carbon LLC/CII Carbon Corp. | 30 | 30,900 | ||||||||
| ALLIANCEBERNSTEIN HIGH YIELD PORTFOLIO • | 11 |
Portfolio of Investments
| Principal Amount (000) | U.S. $ Value | |||||||||
|
|
| ||||||||
Ryerson, Inc./Joseph T. Ryerson & Son, Inc. | U.S.$ | 20 | $ | 21,050 | ||||||
11.25%, 10/15/18 | 6 | 6,540 | ||||||||
Smurfit Kappa Treasury Funding Ltd. | 40 | 46,200 | ||||||||
Steel Dynamics, Inc. | 20 | 21,000 | ||||||||
6.125%, 8/15/19 | 30 | 32,250 | ||||||||
Thompson Creek Metals Co., Inc. | 30 | 32,025 | ||||||||
TPC Group, Inc. | 30 | 31,388 | ||||||||
W.R. Grace & Co.-Conn | 12 | 12,503 | ||||||||
5.625%, 10/01/24(a) | 7 | 7,376 | ||||||||
|
| |||||||||
| 1,010,473 | ||||||||||
|
| |||||||||
Capital Goods – 5.8% | ||||||||||
Apex Tool Group LLC | 30 | 27,000 | ||||||||
Ardagh Packaging Finance PLC/Ardagh Holdings USA, Inc. | 200 | 197,250 | ||||||||
Beverage Packaging Holdings Luxembourg II SA/Beverage Packaging Holdings II Issuer | 30 | 30,075 | ||||||||
6.00%, 6/15/17(a) | 10 | 9,975 | ||||||||
Bombardier, Inc. | 60 | 61,612 | ||||||||
6.125%, 1/15/23(a) | 70 | 72,100 | ||||||||
CNH Industrial Capital LLC | 40 | 40,000 | ||||||||
EnPro Industries, Inc. | 16 | 16,400 | ||||||||
Graphic Packaging International, Inc. | 30 | 31,260 | ||||||||
HD Supply, Inc. | 60 | 63,900 | ||||||||
Manitowoc Co., Inc. (The) | 30 | 30,900 | ||||||||
8.50%, 11/01/20 | 30 | 32,475 | ||||||||
Masco Corp. | 30 | 34,275 | ||||||||
Nuverra Environmental Solutions, Inc. | 10 | 9,300 | ||||||||
Reynolds Group Issuer, Inc./Reynolds Group Issuer LLC/Reynolds Group Issuer Lu | 40 | 41,600 | ||||||||
8.25%, 2/15/21 | 100 | 107,500 | ||||||||
9.00%, 4/15/19 | 100 | 104,500 | ||||||||
RSI Home Products, Inc. | 50 | 52,250 | ||||||||
| 12 | • ALLIANCEBERNSTEIN HIGH YIELD PORTFOLIO |
Portfolio of Investments
| Principal Amount (000) | U.S. $ Value | |||||||||
|
|
| ||||||||
Sealed Air Corp. | U.S.$ | 40 | $ | 41,800 | ||||||
8.125%, 9/15/19(a) | 20 | 21,675 | ||||||||
Summit Materials LLC/Summit Materials Finance Corp. | 30 | 33,525 | ||||||||
TransDigm, Inc. | 30 | 30,338 | ||||||||
6.50%, 7/15/24 | 30 | 30,900 | ||||||||
United Rentals North America, Inc. | 35 | 36,662 | ||||||||
|
| |||||||||
| 1,157,272 | ||||||||||
|
| |||||||||
Communications - Media – 7.7% | ||||||||||
CBS Outdoor Americas Capital LLC/CBS Outdoor Americas Capital Corp. | 10 | 10,325 | ||||||||
5.875%, 3/15/25(a) | 9 | 9,450 | ||||||||
CCO Holdings LLC/CCO Holdings Capital Corp. | 60 | 59,850 | ||||||||
5.75%, 1/15/24 | 83 | 84,971 | ||||||||
Cequel Communications Holdings I LLC/Cequel Capital Corp. | 30 | 29,287 | ||||||||
6.375%, 9/15/20(a) | 30 | 31,275 | ||||||||
Clear Channel Worldwide Holdings, Inc. | 70 | 72,450 | ||||||||
7.625%, 3/15/20 | 10 | 10,638 | ||||||||
Crown Media Holdings, Inc. | 20 | 21,900 | ||||||||
CSC Holdings LLC | 20 | 20,050 | ||||||||
7.625%, 7/15/18 | 60 | 67,950 | ||||||||
DISH DBS Corp. | 105 | 116,550 | ||||||||
Gannett Co., Inc. | 25 | 25,187 | ||||||||
5.50%, 9/15/24(a) | 7 | 7,228 | ||||||||
6.375%, 10/15/23 | 40 | 43,000 | ||||||||
Hughes Satellite Systems Corp. | 50 | 55,625 | ||||||||
iHeartCommunications, Inc. | 70 | 63,525 | ||||||||
9.00%, 12/15/19 | 40 | 40,425 | ||||||||
9.00%, 9/15/22(a) | 20 | 20,100 | ||||||||
Intelsat Jackson Holdings SA | 150 | 150,375 | ||||||||
7.25%, 10/15/20 | 100 | 106,750 | ||||||||
Media General Financing Sub, Inc. | 9 | 9,068 | ||||||||
| ALLIANCEBERNSTEIN HIGH YIELD PORTFOLIO • | 13 |
Portfolio of Investments
| Principal Amount (000) | U.S. $ Value | |||||||||
|
|
| ||||||||
Mediacom Broadband LLC/Mediacom Broadband Corp. | U.S.$ | 20 | $ | 21,100 | ||||||
Radio One, Inc. | 20 | 19,850 | ||||||||
RR Donnelley & Sons Co. | 50 | 56,000 | ||||||||
Sinclair Television Group, Inc. | 20 | 20,050 | ||||||||
5.625%, 8/01/24(a) | 30 | 29,625 | ||||||||
6.125%, 10/01/22 | 30 | 31,050 | ||||||||
Sirius XM Radio, Inc. | 20 | 21,150 | ||||||||
6.00%, 7/15/24(a) | 60 | 62,550 | ||||||||
Starz LLC/Starz Finance Corp. | 40 | 41,200 | ||||||||
Time, Inc. | 20 | 19,550 | ||||||||
Townsquare Radio LLC/Townsquare Radio, Inc. | 20 | 21,600 | ||||||||
Univision Communications, Inc. | 10 | 10,550 | ||||||||
6.75%, 9/15/22(a) | 20 | 22,200 | ||||||||
8.50%, 5/15/21(a) | 30 | 32,475 | ||||||||
Videotron Ltd. | 75 | 77,250 | ||||||||
|
| |||||||||
| 1,542,179 | ||||||||||
|
| |||||||||
Communications - Telecommunications – 5.8% | ||||||||||
CenturyLink, Inc. | 10 | 10,600 | ||||||||
Series U | 70 | 69,825 | ||||||||
Series W | 27 | 29,970 | ||||||||
Crown Castle International Corp. | 20 | 20,200 | ||||||||
Frontier Communications Corp. | 34 | 35,126 | ||||||||
7.625%, 4/15/24 | 55 | 59,125 | ||||||||
7.875%, 1/15/27 | 10 | 10,400 | ||||||||
9.00%, 8/15/31 | 30 | 32,550 | ||||||||
Level 3 Communications, Inc. | 20 | 21,450 | ||||||||
Level 3 Financing, Inc. | 30 | 31,463 | ||||||||
7.00%, 6/01/20 | 40 | 42,700 | ||||||||
Sprint Capital Corp. | 160 | 155,600 | ||||||||
8.75%, 3/15/32 | 40 | 44,700 | ||||||||
| 14 | • ALLIANCEBERNSTEIN HIGH YIELD PORTFOLIO |
Portfolio of Investments
| Principal Amount (000) | U.S. $ Value | |||||||||
|
|
| ||||||||
Sprint Communications, Inc. | U.S.$ | 40 | $ | 39,900 | ||||||
9.00%, 11/15/18(a) | 50 | 58,812 | ||||||||
Sprint Corp. | 30 | 31,725 | ||||||||
7.875%, 9/15/23(a) | 50 | 54,125 | ||||||||
T-Mobile USA, Inc. | 50 | 52,188 | ||||||||
6.375%, 3/01/25 | 30 | 30,825 | ||||||||
6.542%, 4/28/20 | 55 | 58,025 | ||||||||
6.625%, 4/01/23 | 45 | 47,475 | ||||||||
Telecom Italia Capital SA | 60 | 60,600 | ||||||||
tw telecom holdings, Inc. | 10 | 11,400 | ||||||||
WaveDivision Escrow LLC/WaveDivision Escrow Corp. | 10 | 10,875 | ||||||||
Windstream Corp. | 40 | 42,000 | ||||||||
7.875%, 11/01/17 | 40 | 44,528 | ||||||||
8.125%, 9/01/18 | 50 | 52,125 | ||||||||
|
| |||||||||
| 1,158,312 | ||||||||||
|
| |||||||||
Consumer Cyclical - Automotive – 1.5% | ||||||||||
Affinia Group, Inc. | 30 | 30,375 | ||||||||
Allison Transmission, Inc. | 20 | 21,025 | ||||||||
Banque PSA Finance SA | 30 | 30,450 | ||||||||
Commercial Vehicle Group, Inc. | 20 | 20,700 | ||||||||
Gates Global LLC/Gates Global Co. | 25 | 24,250 | ||||||||
General Motors Financial Co., Inc. | 20 | 20,281 | ||||||||
3.25%, 5/15/18 | 20 | 20,450 | ||||||||
3.50%, 7/10/19 | 20 | 20,615 | ||||||||
6.75%, 6/01/18 | 50 | 56,812 | ||||||||
LKQ Corp. | 30 | 28,992 | ||||||||
Titan International, Inc. | 20 | 18,050 | ||||||||
|
| |||||||||
| 292,000 | ||||||||||
|
| |||||||||
Consumer Cyclical - Entertainment – 0.3% | ||||||||||
Cedar Fair LP/Canada’s Wonderland Co./Magnum Management Corp. | 10 | 10,000 | ||||||||
Live Nation Entertainment, Inc. | 10 | 10,625 | ||||||||
| ALLIANCEBERNSTEIN HIGH YIELD PORTFOLIO • | 15 |
Portfolio of Investments
| Principal Amount (000) | U.S. $ Value | |||||||||
|
|
| ||||||||
Pinnacle Entertainment, Inc. | U.S.$ | 20 | $ | 21,350 | ||||||
Regal Entertainment Group | 20 | 19,550 | ||||||||
|
| |||||||||
| 61,525 | ||||||||||
|
| |||||||||
Consumer Cyclical - Other – 3.1% | ||||||||||
Beazer Homes USA, Inc. | 20 | 19,150 | ||||||||
Boyd Gaming Corp. | 50 | 54,000 | ||||||||
Caesars Entertainment Operating Co., Inc. | 30 | 22,650 | ||||||||
Caesars Entertainment Resort Properties LLC/Caesars Entertainment Resort Prope | 20 | 19,400 | ||||||||
Caesars Growth Properties Holdings LLC/Caesars Growth Properties Finance, Inc. | 40 | 37,200 | ||||||||
DR Horton, Inc. | 60 | 63,600 | ||||||||
Gtech SpA | EUR | 50 | 65,477 | |||||||
Isle of Capri Casinos, Inc. | U.S.$ | 30 | 31,500 | |||||||
KB Home | 15 | 14,888 | ||||||||
Lennar Corp. | 70 | 74,200 | ||||||||
M/I Homes, Inc. | 40 | 41,750 | ||||||||
Marina District Finance Co., Inc. | 20 | 21,050 | ||||||||
MGM Resorts International | 55 | 56,441 | ||||||||
Ryland Group, Inc. (The) | 20 | 21,400 | ||||||||
Shea Homes LP/Shea Homes Funding Corp. | 30 | 31,950 | ||||||||
Standard Pacific Corp. | 30 | 34,725 | ||||||||
Toll Brothers Finance Corp. | 10 | 10,125 | ||||||||
|
| |||||||||
| 619,506 | ||||||||||
|
| |||||||||
Consumer Cyclical - Restaurants – 0.1% | ||||||||||
1011778 B.C. ULC/New Red Finance, Inc. | 22 | 22,303 | ||||||||
|
| |||||||||
Consumer Cyclical - Retailers – 1.8% | ||||||||||
Asbury Automotive Group, Inc. | 20 | 21,600 | ||||||||
| 16 | • ALLIANCEBERNSTEIN HIGH YIELD PORTFOLIO |
Portfolio of Investments
| Principal Amount (000) | U.S. $ Value | |||||||||
|
|
| ||||||||
Cash America International, Inc. | U.S.$ | 30 | $ | 31,200 | ||||||
Chinos Intermediate Holdings A, Inc. | 50 | 48,000 | ||||||||
CST Brands, Inc. | 80 | 79,400 | ||||||||
Group 1 Automotive, Inc. | 20 | 19,800 | ||||||||
L Brands, Inc. | 50 | 59,750 | ||||||||
Men’s Wearhouse, Inc. (The) | 50 | 51,812 | ||||||||
Murphy Oil USA, Inc. | 10 | 10,475 | ||||||||
Neiman Marcus Group Ltd. LLC | 17 | 18,190 | ||||||||
Wolverine World Wide, Inc. | 10 | 10,525 | ||||||||
|
| |||||||||
| 350,752 | ||||||||||
|
| |||||||||
Consumer Non-Cyclical – 8.6% | ||||||||||
Air Medical Group Holdings, Inc. | 60 | 62,700 | ||||||||
Alere, Inc. | 40 | 41,750 | ||||||||
Amsurg Corp. | 10 | 10,361 | ||||||||
Anna Merger Sub, Inc. | 10 | 10,188 | ||||||||
Aramark Services, Inc. | 10 | 10,450 | ||||||||
Big Heart Pet Brands | 20 | 20,050 | ||||||||
Capsugel SA | 36 | 36,607 | ||||||||
CHS/Community Health Systems, Inc. | 150 | 161,625 | ||||||||
7.125%, 7/15/20 | 40 | 43,300 | ||||||||
Constellation Brands, Inc. | 40 | 44,600 | ||||||||
Endo Finance LLC | 10 | 10,050 | ||||||||
Endo Finance LLC & Endo Finco, Inc. | 50 | 52,625 | ||||||||
7.25%, 1/15/22(a) | 10 | 10,675 | ||||||||
Envision Healthcare Corp. | 20 | 20,250 | ||||||||
Fresenius Medical Care US Finance, Inc. | 20 | 22,150 | ||||||||
| ALLIANCEBERNSTEIN HIGH YIELD PORTFOLIO • | 17 |
Portfolio of Investments
| Principal Amount (000) | U.S. $ Value | |||||||||
|
|
| ||||||||
HCA, Inc. | ||||||||||
4.25%, 10/15/19 | U.S.$ | 133 | $ | 135,161 | ||||||
6.50%, 2/15/20 | 80 | 89,300 | ||||||||
IASIS Healthcare LLC/IASIS Capital Corp. | 65 | 68,575 | ||||||||
Jaguar Holding Co. I | 50 | 51,187 | ||||||||
Jaguar Holding Co. II/Jaguar Merger Sub, Inc. | 50 | 53,625 | ||||||||
Kinetic Concepts, Inc./KCI USA, Inc. | 50 | 55,125 | ||||||||
Mallinckrodt International Finance SA/Mallinckrodt CB LLC | 18 | 18,855 | ||||||||
MPH Acquisition Holdings LLC | 10 | 10,463 | ||||||||
New Albertsons, Inc. | 30 | 27,600 | ||||||||
Par Pharmaceutical Cos., Inc. | 20 | 21,250 | ||||||||
PC Nextco Holdings LLC/PC Nextco Finance, Inc. | 12 | 12,180 | ||||||||
Pinnacle Merger Sub, Inc. | 50 | 54,500 | ||||||||
Post Holdings, Inc. | 40 | 41,000 | ||||||||
Salix Pharmaceuticals Ltd. | 10 | 10,825 | ||||||||
Smithfield Foods, Inc. | 40 | 41,200 | ||||||||
5.875%, 8/01/21(a) | 30 | 31,800 | ||||||||
6.625%, 8/15/22 | 20 | 21,800 | ||||||||
Spectrum Brands, Inc. | 20 | 21,450 | ||||||||
Sun Products Corp. (The) | 20 | 14,800 | ||||||||
Tenet Healthcare Corp. | 20 | 19,600 | ||||||||
8.00%, 8/01/20 | 60 | 63,900 | ||||||||
8.125%, 4/01/22 | 100 | 114,625 | ||||||||
United Surgical Partners International, Inc. | 20 | 21,600 | ||||||||
Valeant Pharmaceuticals International | 60 | 61,575 | ||||||||
6.875%, 12/01/18(a) | 40 | 41,400 | ||||||||
7.00%, 10/01/20(a) | 60 | 62,850 | ||||||||
|
| |||||||||
| 1,723,627 | ||||||||||
|
| |||||||||
Energy – 11.1% | ||||||||||
Access Midstream Partners LP/ACMP Finance Corp. | 30 | 31,350 | ||||||||
| 18 | • ALLIANCEBERNSTEIN HIGH YIELD PORTFOLIO |
Portfolio of Investments
| Principal Amount (000) | U.S. $ Value | |||||||||
|
|
| ||||||||
Antero Resources Corp. | U.S.$ | 20 | $ | 20,004 | ||||||
Athlon Holdings LP/Athlon Finance Corp. | 70 | 76,650 | ||||||||
Atwood Oceanics, Inc. | 40 | 40,200 | ||||||||
Basic Energy Services, Inc. | 30 | 29,250 | ||||||||
Bill Barrett Corp. | 20 | 20,200 | ||||||||
Bonanza Creek Energy, Inc. | 23 | 21,965 | ||||||||
6.75%, 4/15/21 | 14 | 14,035 | ||||||||
California Resources Corp. | 40 | 40,600 | ||||||||
5.50%, 9/15/21(a) | 39 | 39,780 | ||||||||
6.00%, 11/15/24(a) | 44 | 44,880 | ||||||||
Chesapeake Energy Corp. | 60 | 59,475 | ||||||||
4.875%, 4/15/22 | 20 | 20,455 | ||||||||
6.875%, 11/15/20 | 60 | 68,550 | ||||||||
Cimarex Energy Co. | 20 | 20,325 | ||||||||
Denbury Resources, Inc. | 20 | 18,475 | ||||||||
5.50%, 5/01/22 | 40 | 39,400 | ||||||||
Energy Transfer Equity LP | 20 | 21,000 | ||||||||
Energy XXI Gulf Coast, Inc. | 10 | 9,000 | ||||||||
EP Energy LLC/Everest Acquisition Finance, Inc. | 40 | 41,600 | ||||||||
EXCO Resources, Inc. | 25 | 21,750 | ||||||||
Global Partners LP/GLP Finance Corp. | 50 | 49,500 | ||||||||
Halcon Resources Corp. | 17 | 13,940 | ||||||||
9.75%, 7/15/20 | 23 | 19,190 | ||||||||
Hiland Partners LP/Hiland Partners Finance Corp. | 10 | 9,850 | ||||||||
7.25%, 10/01/20(a) | 40 | 42,300 | ||||||||
Hornbeck Offshore Services, Inc. | 30 | 28,200 | ||||||||
Jones Energy Holdings LLC/Jones Energy Finance Corp. | 37 | 35,335 | ||||||||
Jupiter Resources, Inc. | 46 | 40,595 | ||||||||
Key Energy Services, Inc. | 34 | 30,260 | ||||||||
| ALLIANCEBERNSTEIN HIGH YIELD PORTFOLIO • | 19 |
Portfolio of Investments
| Principal Amount (000) | U.S. $ Value | |||||||||
|
|
| ||||||||
Kinder Morgan Finance Co. LLC | U.S.$ | 90 | $ | 94,050 | ||||||
Kinder Morgan, Inc./DE | 10 | 12,300 | ||||||||
Kodiak Oil & Gas Corp. | 20 | 20,400 | ||||||||
Laredo Petroleum, Inc. | 30 | 31,200 | ||||||||
Legacy Reserves LP/Legacy Reserves Finance Corp. | 5 | 4,850 | ||||||||
6.625%, 12/01/21(a) | 5 | 4,850 | ||||||||
8.00%, 12/01/20 | 10 | 10,075 | ||||||||
Linn Energy LLC/Linn Energy Finance Corp. | 120 | 110,400 | ||||||||
6.50%, 9/15/21 | 19 | 17,385 | ||||||||
Memorial Resource Development Corp. | 52 | 50,700 | ||||||||
Oasis Petroleum, Inc. | 30 | 31,200 | ||||||||
Offshore Group Investment Ltd. | 30 | 25,575 | ||||||||
Pacific Drilling SA | 50 | 44,719 | ||||||||
Paragon Offshore PLC | 60 | 45,900 | ||||||||
PHI, Inc. | 30 | 29,636 | ||||||||
Precision Drilling Corp. | 20 | 20,500 | ||||||||
QEP Resources, Inc. | 80 | 78,800 | ||||||||
Regency Energy Partners LP/Regency Energy Finance Corp. | 30 | 29,775 | ||||||||
5.00%, 10/01/22 | 35 | 35,700 | ||||||||
5.50%, 4/15/23 | 20 | 20,700 | ||||||||
Rosetta Resources, Inc. | 30 | 28,800 | ||||||||
RSP Permian, Inc. | 9 | 8,976 | ||||||||
Sabine Pass Liquefaction LLC | 100 | 104,750 | ||||||||
5.75%, 5/15/24(a) | 100 | 103,375 | ||||||||
Sanchez Energy Corp. | 48 | 45,720 | ||||||||
7.75%, 6/15/21 | 20 | 20,400 | ||||||||
Seven Generations Energy Ltd. | 40 | 42,000 | ||||||||
SM Energy Co. | 20 | 18,700 | ||||||||
| 20 | • ALLIANCEBERNSTEIN HIGH YIELD PORTFOLIO |
Portfolio of Investments
| Principal Amount (000) | U.S. $ Value | |||||||||
|
|
| ||||||||
Southern Star Central Corp. | U.S.$ | 20 | $ | 20,300 | ||||||
Tervita Corp. | 30 | 28,800 | ||||||||
10.875%, 2/15/18(a) | 20 | 18,200 | ||||||||
Triangle USA Petroleum Corp. | 40 | 35,000 | ||||||||
W&T Offshore, Inc. | 30 | 29,250 | ||||||||
Whiting Petroleum Corp. | 20 | 20,700 | ||||||||
|
| |||||||||
| 2,211,800 | ||||||||||
|
| |||||||||
Other Industrial – 1.4% | ||||||||||
General Cable Corp. | 17 | 11,231 | ||||||||
5.75%, 10/01/22 | 20 | 17,600 | ||||||||
Interline Brands, Inc. | 30 | 31,275 | ||||||||
Laureate Education, Inc. | 70 | 72,100 | ||||||||
Modular Space Corp. | 30 | 30,600 | ||||||||
NANA Development Corp. | 60 | 56,400 | ||||||||
New Enterprise Stone & Lime Co., Inc. | 30 | 28,800 | ||||||||
13.00% (5.00% Cash and 8.00% PIK), | 21 | 22,149 | ||||||||
Safway Group Holding LLC/Safway Finance Corp. | 17 | 17,552 | ||||||||
|
| |||||||||
| 287,707 | ||||||||||
|
| |||||||||
Services – 0.7% | ||||||||||
ADT Corp. (The) | 20 | 19,825 | ||||||||
6.25%, 10/15/21 | 20 | 21,000 | ||||||||
IHS, Inc. | 15 | 15,225 | ||||||||
Mobile Mini, Inc. | 20 | 21,550 | ||||||||
Sabre GLBL, Inc. | 30 | 32,250 | ||||||||
ServiceMaster Co. (The) | 10 | 10,575 | ||||||||
8.00%, 2/15/20 | 10 | 10,675 | ||||||||
|
| |||||||||
| 131,100 | ||||||||||
|
| |||||||||
Technology – 5.4% | ||||||||||
Audatex North America, Inc. | 10 | 10,575 | ||||||||
6.125%, 11/01/23(a) | 10 | 10,600 | ||||||||
| ALLIANCEBERNSTEIN HIGH YIELD PORTFOLIO • | 21 |
Portfolio of Investments
| Principal Amount (000) | U.S. $ Value | |||||||||
|
|
| ||||||||
Avaya, Inc. | ||||||||||
7.00%, 4/01/19(a) | U.S.$ | 35 | $ | 34,388 | ||||||
10.50%, 3/01/21(a) | 70 | 61,250 | ||||||||
Blackboard, Inc. | 15 | 15,150 | ||||||||
BMC Software Finance, Inc. | 60 | 57,450 | ||||||||
Brightstar Corp. | 90 | 94,743 | ||||||||
CDW LLC/CDW Finance Corp. | 13 | 13,715 | ||||||||
8.50%, 4/01/19 | 49 | 51,940 | ||||||||
Ceridian HCM Holding, Inc. | 55 | 62,012 | ||||||||
Ceridian LLC | 35 | 38,675 | ||||||||
CommScope, Inc. | 10 | 10,113 | ||||||||
First Data Corp. | 20 | 21,500 | ||||||||
7.375%, 6/15/19(a) | 80 | 84,700 | ||||||||
8.25%, 1/15/21(a) | 20 | 21,700 | ||||||||
11.75%, 8/15/21 | 30 | 35,175 | ||||||||
12.625%, 1/15/21 | 45 | 54,337 | ||||||||
Infor Software Parent LLC/Infor Software Parent, Inc. | 20 | 20,250 | ||||||||
Infor US, Inc. | 35 | 38,062 | ||||||||
Iron Mountain, Inc. | 30 | 30,600 | ||||||||
Micron Technology, Inc. | 26 | 26,325 | ||||||||
Numericable Group SA | 200 | 204,500 | ||||||||
Sensata Technologies BV | 40 | 41,800 | ||||||||
SunGard Data Systems, Inc. | 40 | 42,650 | ||||||||
|
| |||||||||
| 1,082,210 | ||||||||||
|
| |||||||||
Transportation - Airlines – 0.1% | ||||||||||
Air Canada | 20 | 21,856 | ||||||||
|
| |||||||||
Transportation - Services – 0.4% | ||||||||||
Hertz Corp. (The) | 20 | 20,150 | ||||||||
6.75%, 4/15/19 | 53 | 55,253 | ||||||||
|
| |||||||||
| 75,403 | ||||||||||
|
| |||||||||
| 11,748,025 | ||||||||||
|
| |||||||||
| 22 | • ALLIANCEBERNSTEIN HIGH YIELD PORTFOLIO |
Portfolio of Investments
| Principal Amount (000) | U.S. $ Value | |||||||||
|
|
| ||||||||
Financial Institutions – 11.1% | ||||||||||
Banking – 5.9% | ||||||||||
ABN AMRO Bank NV | EUR | 50 | $ | 63,441 | ||||||
Ally Financial, Inc. | U.S.$ | 80 | 96,175 | |||||||
Bank of America Corp. | 22 | 20,405 | ||||||||
Series X | 50 | 49,937 | ||||||||
Bank of Ireland | EUR | 100 | 135,372 | |||||||
Barclays Bank PLC | U.S.$ | 30 | 33,225 | |||||||
BBVA International Preferred SAU | EUR | 50 | 63,308 | |||||||
BNP Paribas SA | U.S.$ | 50 | 50,500 | |||||||
Citigroup, Inc. | 46 | 45,712 | ||||||||
Credit Agricole SA | GBP | 50 | 88,355 | |||||||
HT1 Funding GmbH | EUR | 40 | 50,377 | |||||||
Lloyds Banking Group PLC | U.S.$ | 35 | 37,712 | |||||||
Macquarie Capital Funding LP/Jersey | GBP | 50 | 78,341 | |||||||
Novo Banco SA | EUR | 50 | 62,188 | |||||||
RBS Capital Trust C | 40 | 49,625 | ||||||||
Royal Bank of Scotland Group PLC | U.S.$ | 100 | 105,750 | |||||||
Societe Generale SA | 100 | 105,500 | ||||||||
Zions Bancorporation | 10 | 10,287 | ||||||||
5.80%, 6/15/23(g) | 20 | 19,100 | ||||||||
|
| |||||||||
| 1,165,310 | ||||||||||
|
| |||||||||
Brokerage – 0.4% | ||||||||||
E*TRADE Financial Corp. | 30 | 31,988 | ||||||||
6.75%, 6/01/16 | 20 | 21,250 | ||||||||
GFI Group, Inc. | 20 | 23,725 | ||||||||
|
| |||||||||
| 76,963 | ||||||||||
|
| |||||||||
| ALLIANCEBERNSTEIN HIGH YIELD PORTFOLIO • | 23 |
Portfolio of Investments
| Principal Amount (000) | U.S. $ Value | |||||||||
|
|
| ||||||||
Finance – 3.3% | ||||||||||
Artsonig Pty Ltd. | U.S.$ | 21 | $ | 20,112 | ||||||
CIT Group, Inc. | 95 | 100,225 | ||||||||
Creditcorp | 20 | 20,400 | ||||||||
Enova International, Inc. | 40 | 40,700 | ||||||||
International Lease Finance Corp. | 70 | 75,425 | ||||||||
8.25%, 12/15/20 | 55 | 66,000 | ||||||||
8.75%, 3/15/17 | 20 | 22,500 | ||||||||
8.875%, 9/01/17 | 40 | 46,000 | ||||||||
Milestone Aviation Group Ltd. (The) | 37 | 41,162 | ||||||||
Navient Corp. | 20 | 20,350 | ||||||||
4.875%, 6/17/19 | 50 | 50,750 | ||||||||
8.00%, 3/25/20 | 80 | 91,800 | ||||||||
TMX Finance LLC/TitleMax Finance Corp. | 60 | 58,500 | ||||||||
|
| |||||||||
| 653,924 | ||||||||||
|
| |||||||||
Insurance – 0.8% | ||||||||||
American Equity Investment Life Holding Co. | 30 | 31,650 | ||||||||
Hartford Financial Services Group, Inc. (The) | 40 | 46,400 | ||||||||
Hockey Merger Sub 2, Inc. | 20 | 20,850 | ||||||||
Liberty Mutual Group, Inc. | 40 | 46,800 | ||||||||
WellCare Health Plans, Inc. | 20 | 20,596 | ||||||||
|
| |||||||||
| 166,296 | ||||||||||
|
| |||||||||
Other Finance – 0.7% | ||||||||||
ACE Cash Express, Inc. | 10 | 7,150 | ||||||||
CNG Holdings, Inc./OH | 30 | 22,575 | ||||||||
FTI Consulting, Inc. | 30 | 31,650 | ||||||||
Gardner Denver, Inc. | 21 | 21,892 | ||||||||
Harbinger Group, Inc. | 10 | 10,150 | ||||||||
7.875%, 7/15/19 | 20 | 21,650 | ||||||||
| 24 | • ALLIANCEBERNSTEIN HIGH YIELD PORTFOLIO |
Portfolio of Investments
| Principal Amount (000) | U.S. $ Value | |||||||||
|
|
| ||||||||
Speedy Group Holdings Corp. | U.S.$ | 30 | $ | 29,475 | ||||||
|
| |||||||||
| 144,542 | ||||||||||
|
| |||||||||
| 2,207,035 | ||||||||||
|
| |||||||||
Utility – 3.3% | ||||||||||
Electric – 3.3% | ||||||||||
AES Corp./VA | 20 | 19,950 | ||||||||
7.375%, 7/01/21 | 55 | 62,752 | ||||||||
Calpine Corp. | 10 | 10,125 | ||||||||
5.875%, 1/15/24(a) | 45 | 48,375 | ||||||||
7.875%, 1/15/23(a) | 18 | 19,935 | ||||||||
DPL, Inc. | 20 | 20,650 | ||||||||
Dynegy Finance I, Inc./Dynegy Finance II, Inc. | 45 | 46,575 | ||||||||
7.375%, 11/01/22(a) | 65 | 68,738 | ||||||||
7.625%, 11/01/24(a) | 40 | 42,400 | ||||||||
FirstEnergy Corp. | 20 | 20,206 | ||||||||
Series C | 20 | 23,764 | ||||||||
GenOn Energy, Inc. | 40 | 40,500 | ||||||||
9.50%, 10/15/18 | 60 | 62,550 | ||||||||
NRG Energy, Inc. | 9 | 9,293 | ||||||||
6.25%, 7/15/22 | 6 | 6,270 | ||||||||
6.625%, 3/15/23 | 13 | 13,715 | ||||||||
7.875%, 5/15/21 | 50 | 54,250 | ||||||||
NRG Yield Operating LLC | 12 | 12,480 | ||||||||
PPL Capital Funding, Inc. | 20 | 20,275 | ||||||||
PPL Energy Supply LLC | 20 | 18,854 | ||||||||
6.50%, 5/01/18 | 10 | 10,856 | ||||||||
RJS Power Holdings LLC | 30 | 29,850 | ||||||||
|
| |||||||||
| 662,363 | ||||||||||
|
| |||||||||
Non Corporate Sectors – 0.1% | ||||||||||
Agencies - Not Government Guaranteed – 0.1% | ||||||||||
CITGO Petroleum Corp. | 29 | 29,507 | ||||||||
|
| |||||||||
Total Corporates - Non-Investment Grade | 14,646,930 | |||||||||
|
| |||||||||
| ALLIANCEBERNSTEIN HIGH YIELD PORTFOLIO • | 25 |
Portfolio of Investments
| Principal Amount (000) | U.S. $ Value | |||||||||
|
|
| ||||||||
CORPORATES - INVESTMENT GRADE – 5.4% | ||||||||||
Financial Institutions – 4.5% | ||||||||||
Banking – 2.7% | ||||||||||
Credit Suisse AG | U.S.$ | 200 | $ | 220,522 | ||||||
HSBC Capital Funding LP/Jersey | 35 | 52,238 | ||||||||
JPMorgan Chase & Co. | 20 | 18,950 | ||||||||
Series R | 20 | 19,825 | ||||||||
Series S | 7 | 7,410 | ||||||||
Nationwide Building Society | GBP | 40 | 65,903 | |||||||
Standard Chartered PLC | U.S.$ | 100 | 104,625 | |||||||
Wells Fargo & Co. | 55 | 56,545 | ||||||||
|
| |||||||||
| 546,018 | ||||||||||
|
| |||||||||
Finance – 0.5% | ||||||||||
Aviation Capital Group Corp. | 10 | 10,421 | ||||||||
GE Capital Trust III | GBP | 50 | 85,585 | |||||||
|
| |||||||||
| 96,006 | ||||||||||
|
| |||||||||
Insurance – 0.6% | ||||||||||
Mitsui Sumitomo Insurance Co., Ltd. | U.S.$ | 50 | 58,036 | |||||||
Nationwide Mutual Insurance Co. | 20 | 30,824 | ||||||||
Prudential Financial, Inc. | 40 | 41,500 | ||||||||
|
| |||||||||
| 130,360 | ||||||||||
|
| |||||||||
REITS – 0.7% | ||||||||||
DDR Corp. | 40 | 49,660 | ||||||||
EPR Properties | 40 | 48,318 | ||||||||
Senior Housing Properties Trust | 30 | 34,337 | ||||||||
|
| |||||||||
| 132,315 | ||||||||||
|
| |||||||||
| 904,699 | ||||||||||
|
| |||||||||
Industrial – 0.9% | ||||||||||
Basic – 0.4% | ||||||||||
Freeport-McMoran Oil & Gas LLC/FCX Oil & Gas, Inc. | 50 | 55,375 | ||||||||
| 26 | • ALLIANCEBERNSTEIN HIGH YIELD PORTFOLIO |
Portfolio of Investments
| Company | Principal Amount (000) | U.S. $ Value | ||||||||
|
|
| ||||||||
Momentive Performance Materials, Inc. | U.S.$ | 40 | $ | 34,600 | ||||||
|
| |||||||||
| 89,975 | ||||||||||
|
| |||||||||
Communications - Telecommunications – 0.2% | ||||||||||
Embarq Corp. | 30 | 33,300 | ||||||||
|
| |||||||||
Consumer Non-Cyclical – 0.1% | ||||||||||
Forest Laboratories, Inc. | 10 | 10,715 | ||||||||
|
| |||||||||
Energy – 0.2% | ||||||||||
Enterprise Products Operating LLC | 20 | 21,850 | ||||||||
Transocean, Inc. | 20 | 18,735 | ||||||||
|
| |||||||||
| 40,585 | ||||||||||
|
| |||||||||
| 174,575 | ||||||||||
|
| |||||||||
Total Corporates - Investment Grade | 1,079,274 | |||||||||
|
| |||||||||
| Shares | ||||||||||
COMMON STOCKS – 2.2% | ||||||||||
ADT Corp. (The) | 650 | 23,296 | ||||||||
Beazer Homes USA, Inc.(b) | 830 | 14,882 | ||||||||
Community Health Systems, Inc.(b) | 270 | 14,842 | ||||||||
Crown Castle International Corp. | 480 | 37,498 | ||||||||
DISH Network Corp. – Class A(b) | 310 | 19,731 | ||||||||
eDreams ODIGEO SL(b) | 5,140 | 13,436 | ||||||||
General Motors Co. | 760 | 23,864 | ||||||||
Isle of Capri Casinos, Inc.(b) | 1,650 | 12,260 | ||||||||
Las Vegas Sands Corp. | 450 | 28,017 | ||||||||
LifePoint Hospitals, Inc.(b) | 720 | 50,400 | ||||||||
LyondellBasell Industries NV – Class A | 220 | 20,159 | ||||||||
Nortek, Inc.(b) | 280 | 23,318 | ||||||||
Orbitz Worldwide, Inc.(b) | 4,200 | 34,734 | ||||||||
Quicksilver Resources, Inc.(b) | 1,300 | 711 | ||||||||
Salix Pharmaceuticals Ltd.(b) | 90 | 12,946 | ||||||||
SBA Communications Corp. – Class A(b) | 520 | 58,412 | ||||||||
Townsquare Media, Inc. – Class A(b) | 2,600 | 32,786 | ||||||||
Travelport Worldwide Ltd.(b) | 1,430 | 20,663 | ||||||||
|
| |||||||||
Total Common Stocks | 441,955 | |||||||||
|
| |||||||||
| ALLIANCEBERNSTEIN HIGH YIELD PORTFOLIO • | 27 |
Portfolio of Investments
Company | Shares | U.S. $ Value | ||||||||
|
|
| ||||||||
PREFERRED STOCKS – 1.8% | ||||||||||
Financial Institutions – 1.7% | ||||||||||
Banking – 1.2% | ||||||||||
GMAC Capital Trust I | 2,000 | $ | 53,460 | |||||||
Goldman Sachs Group, Inc. (The) | 1,550 | 37,092 | ||||||||
Morgan Stanley | 2,000 | 53,040 | ||||||||
Royal Bank of Scotland Group PLC | 2,000 | 49,160 | ||||||||
US Bancorp/MN | 2,000 | 58,620 | ||||||||
|
| |||||||||
| 251,372 | ||||||||||
|
| |||||||||
REITS – 0.5% | ||||||||||
Health Care REIT, Inc. | 1,000 | 25,890 | ||||||||
Kimco Realty Corp. | 1,000 | 25,470 | ||||||||
National Retail Properties, Inc. | 1,000 | 25,970 | ||||||||
Public Storage | 1,000 | 22,980 | ||||||||
|
| |||||||||
| 100,310 | ||||||||||
|
| |||||||||
| 351,682 | ||||||||||
|
| |||||||||
Industrial – 0.1% | ||||||||||
Consumer Cyclical - Other – 0.1% | ||||||||||
Hovnanian Enterprises, Inc. | 1,000 | 15,210 | ||||||||
|
| |||||||||
Total Preferred Stocks | 366,892 | |||||||||
|
| |||||||||
| Principal Amount (000) | ||||||||||
BANK LOANS – 1.6% | ||||||||||
Industrial – 0.8% | ||||||||||
Consumer Cyclical - Automotive – 0.2% | ||||||||||
TI Group Automotive Systems LLC | U.S.$ | 30 | 29,626 | |||||||
|
| |||||||||
| 28 | • ALLIANCEBERNSTEIN HIGH YIELD PORTFOLIO |
Portfolio of Investments
Principal Amount (000) | U.S. $ Value | |||||||||
|
|
| ||||||||
Consumer Cyclical - Other – 0.1% | ||||||||||
Caesars Entertainment Operating Co., Inc.(fka Harrah’s Operating Co., Inc.) | U.S.$ | 27 | $ | 24,162 | ||||||
|
| |||||||||
Consumer Non-Cyclical – 0.3% | ||||||||||
Catalent Pharma Solutions, Inc. (fka Cardinal Health 409, Inc.) | 6 | 5,876 | ||||||||
Grifols Worldwide Operations Ltd. | 10 | 9,841 | ||||||||
Pharmedium Healthcare Corp. | 40 | 39,900 | ||||||||
|
| |||||||||
| 55,617 | ||||||||||
|
| |||||||||
Other Industrial – 0.2% | ||||||||||
Atkore International, Inc. | 25 | 24,563 | ||||||||
Orbitz Worldwide, Inc. | 20 | 19,755 | ||||||||
|
| |||||||||
| 44,318 | ||||||||||
|
| |||||||||
| 153,723 | ||||||||||
|
| |||||||||
Utility – 0.7% | ||||||||||
Electric – 0.7% | ||||||||||
Energy Future Intermediate Holding Co., LLC (EFIH Finance, Inc.) | 150 | 149,625 | ||||||||
|
| |||||||||
Financial Institutions – 0.1% | ||||||||||
Other Finance – 0.1% | ||||||||||
Travelport Finance (Luxembourg) S.À.r.l. | 23 | 23,408 | ||||||||
|
| |||||||||
Total Bank Loans | 326,756 | |||||||||
|
| |||||||||
COLLATERALIZED MORTGAGE | ||||||||||
GSE Risk Share Floating Rate – 1.2% | ||||||||||
Federal Home Loan Mortgage Corp. | 50 | 60,888 | ||||||||
Series 2013-DN2, Class M2 | 50 | 51,393 | ||||||||
Federal National Mortgage Association | 50 | 55,372 | ||||||||
Series 2014-C01, Class M2 | 50 | 52,386 | ||||||||
Series 2014-C02, Class 2M2 | 15 | 13,494 | ||||||||
|
| |||||||||
| 233,533 | ||||||||||
|
| |||||||||
| ALLIANCEBERNSTEIN HIGH YIELD PORTFOLIO • | 29 |
Portfolio of Investments
Principal Amount (000) | U.S. $ Value | |||||||||
|
|
| ||||||||
Non-Agency Fixed Rate – 0.1% | ||||||||||
Alternative Loan Trust | U.S.$ | 33 | $ | 28,814 | ||||||
|
| |||||||||
Total Collateralized Mortgage Obligations | 262,347 | |||||||||
|
| |||||||||
COMMERCIAL MORTGAGE-BACKED | ||||||||||
Non-Agency Fixed Rate CMBS – 1.2% | ||||||||||
Citigroup Commercial Mortgage Trust | 50 | 45,982 | ||||||||
GS Mortgage Securities Trust | 100 | 95,663 | ||||||||
JPMBB Commercial Mortgage Securities Trust | 100 | 96,513 | ||||||||
|
| |||||||||
Total Commercial Mortgage-Backed Securities | 238,158 | |||||||||
|
| |||||||||
EMERGING MARKETS - CORPORATE BONDS – 0.9% | ||||||||||
Industrial – 0.9% | ||||||||||
Capital Goods – 0.4% | ||||||||||
CEMEX Espana SA/Luxembourg | 70 | 75,075 | ||||||||
|
| |||||||||
Consumer Non-Cyclical – 0.5% | ||||||||||
Marfrig Overseas Ltd. | 100 | 105,625 | ||||||||
|
| |||||||||
Total Emerging Markets - Corporate Bonds | 180,700 | |||||||||
|
| |||||||||
GOVERNMENTS - SOVEREIGN BONDS – 0.4% | ||||||||||
Hungary – 0.4% | ||||||||||
Hungary Government International Bond | 60 | 68,093 | ||||||||
|
| |||||||||
GOVERNMENTS - TREASURIES – 0.2% | ||||||||||
Brazil – 0.2% | ||||||||||
Brazil Notas do Tesouro Nacional | BRL | 110 | 42,521 | |||||||
|
| |||||||||
| 30 | • ALLIANCEBERNSTEIN HIGH YIELD PORTFOLIO |
Portfolio of Investments
Principal Amount (000) | U.S. $ Value | |||||||||
|
|
| ||||||||
EMERGING MARKETS - SOVEREIGNS – 0.2% | ||||||||||
Argentina – 0.1% | ||||||||||
Argentina Boden Bonds | U.S.$ | 30 | $ | 28,133 | ||||||
|
| |||||||||
Venezuela – 0.1% | ||||||||||
Venezuela Government International Bond | 20 | 13,300 | ||||||||
|
| |||||||||
Total Emerging Markets - Sovereigns | 41,433 | |||||||||
|
| |||||||||
GOVERNMENTS - SOVEREIGN AGENCIES – 0.2% | ||||||||||
Canada – 0.1% | ||||||||||
NOVA Chemicals Corp. | 30 | 30,975 | ||||||||
|
| |||||||||
Colombia – 0.1% | ||||||||||
Ecopetrol SA | 10 | 10,251 | ||||||||
|
| |||||||||
Total Governments - Sovereign Agencies | 41,226 | |||||||||
|
| |||||||||
| Contracts | ||||||||||
OPTIONS PURCHASED - CALLS – 0.2% | ||||||||||
Options on Funds and Investment Trusts – 0.2% | ||||||||||
iShares Russell 20 ETF Expiration: Nov 2014, | 80 | 12,643 | ||||||||
iShares iBoxx High Yield Corporate Bond ETF | 166 | 5,810 | ||||||||
iShares iBoxx High Yield Corporate Bond ETF | 98 | 5,390 | ||||||||
SPDR S&P 500 ETF Trust Expiration: Nov 2014, | 23 | 11,063 | ||||||||
SPDR S&P Oil & Gas Expiration: Dec 2014, | 74 | 2,627 | ||||||||
|
| |||||||||
| 37,533 | ||||||||||
|
| |||||||||
Options on Equities – 0.0% | ||||||||||
ORBITZ Worldwide | 100 | 1,750 | ||||||||
|
| |||||||||
Total Options Purchased - Calls | 39,283 | |||||||||
|
| |||||||||
| ALLIANCEBERNSTEIN HIGH YIELD PORTFOLIO • | 31 |
Portfolio of Investments
| Company | Notional Amount (000) | U.S. $ Value | ||||||||
|
|
| ||||||||
OPTIONS PURCHASED - PUTS – 0.1% | ||||||||||
Swaptions – 0.1% | ||||||||||
CDX-NAHY Series 23, 5 Year Index RTP, | U.S.$ | 1,600 | $ | 1,819 | ||||||
CDX-NAHY Series 23, 5 Year Index RTP, | 1,600 | 5,935 | ||||||||
CDX-NAHY Series 23, 5 Year Index RTP, Goldman Sachs International | 560 | 1,945 | ||||||||
|
| |||||||||
| 9,699 | ||||||||||
|
| |||||||||
| Contracts | ||||||||||
Options on Funds and Investment Trusts – 0.0% | ||||||||||
SPDR S&P 500 ETF Trust | 48 | 504 | ||||||||
SPDR S&P 500 ETF Trust | 34 | 612 | ||||||||
SPDR S&P 500 ETF Trust | 31 | 1,689 | ||||||||
SPDR S&P 500 ETF Trust | 16 | 256 | ||||||||
|
| |||||||||
| 3,061 | ||||||||||
|
| |||||||||
Options on Equities – 0.0% | ||||||||||
Best of SPY TLT | 570 | 180 | ||||||||
|
| |||||||||
| Shares | ||||||||||
Total Options Purchased - Puts | 12,940 | |||||||||
|
| |||||||||
WARRANTS – 0.0% | ||||||||||
Peugeot SA, expiring 4/29/17(b) | 2,300 | 3,488 | ||||||||
|
| |||||||||
SHORT-TERM INVESTMENTS – 9.5% | ||||||||||
Investment Companies – 9.2% | ||||||||||
AllianceBernstein Fixed-Income Shares, | 1,840,889 | 1,840,889 | ||||||||
|
| |||||||||
| 32 | • ALLIANCEBERNSTEIN HIGH YIELD PORTFOLIO |
Portfolio of Investments
| Principal Amount (000) | U.S. $ Value | |||||||||
|
|
| ||||||||
Time Deposits – 0.3% | ||||||||||
BBH, Grand Cayman | ||||||||||
0.03%, 11/03/14 | U.S.$ | 6 | $ | 5,737 | ||||||
0.337%, 11/03/14 | CAD | 6 | 5,344 | |||||||
4.064%, 11/03/14 | ZAR | 2 | 136 | |||||||
Wells Fargo, Grand Cayman | GBP | 25 | 40,042 | |||||||
|
| |||||||||
Total Time Deposits | 51,259 | |||||||||
|
| |||||||||
Total Short-Term Investments | 1,892,148 | |||||||||
|
| |||||||||
Total Investments – 98.6% | 19,684,144 | |||||||||
Other assets less liabilities – 1.4% | 278,547 | |||||||||
|
| |||||||||
Net Assets – 100.0% | $ | 19,962,691 | ||||||||
|
| |||||||||
FUTURES (see Note D)
| Type | Number of Contracts | Expiration Month | Original Value | Value at October 31, 2014 | Unrealized Appreciation/ (Depreciation) | |||||||||||||||
Sold Contracts | ||||||||||||||||||||
S&P 500 E-Mini Futures | 1 | December 2014 | $ | 98,063 | $ | 100,570 | $ | (2,507 | ) | |||||||||||
FORWARD CURRENCY EXCHANGE CONTRACTS (see Note D)
| Counterparty | Contracts to Deliver (000) | In Exchange For (000) | Settlement Date | Unrealized Appreciation/ (Depreciation) | ||||||||||||||||||||
Brown Brothers Harriman & Co. | USD | 0 | * | TRY | 0 | * | 11/13/14 | $ | 5 | |||||||||||||||
Brown Brothers Harriman & Co. | GBP | 102 | USD | 162 | 11/14/14 | 637 | ||||||||||||||||||
Brown Brothers Harriman & Co. | USD | 81 | GBP | 51 | 11/14/14 | (86 | ) | |||||||||||||||||
Brown Brothers Harriman & Co. | CAD | 62 | USD | 55 | 11/21/14 | 272 | ||||||||||||||||||
Brown Brothers Harriman & Co. | EUR | 610 | USD | 771 | 11/21/14 | 7,490 | ||||||||||||||||||
Brown Brothers Harriman & Co. | USD | 179 | EUR | 141 | 11/21/14 | (2,189 | ) | |||||||||||||||||
Brown Brothers Harriman & Co. | USD | 47 | SEK | 341 | 12/04/14 | (1,196 | ) | |||||||||||||||||
Brown Brothers Harriman & Co. | JPY | 5,658 | USD | 53 | 12/05/14 | 2,961 | ||||||||||||||||||
Brown Brothers Harriman & Co. | AUD | 85 | USD | 75 | 12/12/14 | (127 | ) | |||||||||||||||||
Brown Brothers Harriman & Co. | NZD | 64 | USD | 51 | 12/19/14 | 1,036 | ||||||||||||||||||
Goldman Sachs Bank USA | BRL | 108 | USD | 44 | 11/04/14 | 599 | ||||||||||||||||||
Goldman Sachs Bank USA | USD | 43 | BRL | 108 | 11/04/14 | (35 | ) | |||||||||||||||||
Goldman Sachs Bank USA | USD | 0 | * | IDR | 4,470 | 11/21/14 | 5 | |||||||||||||||||
Goldman Sachs Bank USA | BRL | 108 | USD | 43 | 12/02/14 | 61 | ||||||||||||||||||
JPMorgan Chase Bank | GBP | 209 | USD | 337 | 11/14/14 | 2,470 | ||||||||||||||||||
Royal Bank of Scotland PLC | BRL | 108 | USD | 44 | 11/04/14 | 904 | ||||||||||||||||||
Royal Bank of Scotland PLC | USD | 44 | BRL | 108 | 11/04/14 | (599 | ) | |||||||||||||||||
|
| |||||||||||||||||||||||
| $ | 12,208 | |||||||||||||||||||||||
|
| |||||||||||||||||||||||
| ALLIANCEBERNSTEIN HIGH YIELD PORTFOLIO • | 33 |
Portfolio of Investments
CALL OPTIONS WRITTEN (see Note D)
| Description | Contracts | Exercise Price | Expiration Month | Premiums Received | U.S. $ Value | |||||||||||||||
iShares Russell 2000 ETF(i) | 80 | $ | 119.00 | November 2014 | $ | 5,917 | $ | (5,917 | ) | |||||||||||
SPDR S&P 500 ETF Trust(i) | 23 | 201.00 | November 2014 | 2,069 | (6,233 | ) | ||||||||||||||
|
|
|
| |||||||||||||||||
| $ | 7,986 | $ | (12,150 | ) | ||||||||||||||||
|
|
|
| |||||||||||||||||
PUT OPTIONS WRITTEN (see Note D)
| Description | Contracts | Exercise Price | Expiration Month | Premiums Received | U.S. $ Value | |||||||||||||||
SPDR S&P 500 ETF Trust(i) | 16 | $ | 178.00 | November 2014 | $ | 2,479 | $ | (144 | ) | |||||||||||
SPDR S&P 500 ETF Trust(i) | 31 | 188.00 | November 2014 | 1,828 | (791 | ) | ||||||||||||||
|
|
|
| |||||||||||||||||
| $ | 4,307 | $ | (935 | ) | ||||||||||||||||
|
|
|
| |||||||||||||||||
CREDIT DEFAULT SWAPTIONS WRITTEN (see Note D)
| Description | Counterparty | Buy/Sell Protection | Strike Rate | Expiration Date | Notional Amount (000) | Premiums Received | Market Value | |||||||||||||||||||
Put –CDX-NAHY-23, 5 Year Index | Bank of America, NA | Sell | 105 | % | 11/19/14 | $ | 3,200 | $ | 7,680 | $ | (6,479 | ) | ||||||||||||||
Put –CDX-NAHY-23, 5 Year Index | Goldman Sachs International | Sell | 100 | 12/17/14 | 560 | 1,652 | (857 | ) | ||||||||||||||||||
|
|
|
| |||||||||||||||||||||||
| $ | 9,332 | $ | (7,336 | ) | ||||||||||||||||||||||
|
|
|
| |||||||||||||||||||||||
CENTRALLY CLEARED CREDIT DEFAULT SWAPS (see Note D)
| Clearing Broker/(Exchange) & Referenced Obligation | Fixed Rate (Pay) Receive | Implied Credit Spread at October 31, 2014 | Notional Amount (000) | Market Value | Unrealized Appreciation/ (Depreciation) | |||||||||||||||
Buy Contracts | ||||||||||||||||||||
Citigroup Global Markets, Inc./(INTRCONX): | ||||||||||||||||||||
CDX-NAHY Series 22, | (5.00 | )% | 3.15 | % | $ | 990 | $ | (79,720 | ) | $ | (30,683 | ) | ||||||||
Sale Contracts | ||||||||||||||||||||
Citigroup Global Markets, Inc./(INTRCONX): | ||||||||||||||||||||
CDX-NAHY Series 22, | 5.00 | 3.15 | 572 | 46,035 | 19,587 | |||||||||||||||
CDX-NAHY Series 22, | 5.00 | 3.15 | 279 | 22,456 | 8,643 | |||||||||||||||
CDX-NAHY Series 22, | 5.00 | 3.15 | 139 | 11,229 | 4,322 | |||||||||||||||
|
|
|
| |||||||||||||||||
| $ | – 0 | – | $ | 1,869 | ||||||||||||||||
|
|
|
| |||||||||||||||||
| * | Termination date |
| 34 | • ALLIANCEBERNSTEIN HIGH YIELD PORTFOLIO |
Portfolio of Investments
CREDIT DEFAULT SWAPS (see Note D)
| Swap Counterparty & Referenced Obligation | Fixed Rate (Pay) Receive | Implied Credit Spread at October 31, 2014 | Notional Amount (000) | Market Value | Upfront Premiums Paid (Received) | Unrealized Appreciation/ (Depreciation) | ||||||||||||||||||
Buy Contracts | ||||||||||||||||||||||||
Credit Suisse International: | ||||||||||||||||||||||||
Western Union Co., | (1.00 | )% | 0.59 | % | $ | 60 | $ | (710 | ) | $ | (769 | ) | $ | 59 | ||||||||||
Sale Contracts | ||||||||||||||||||||||||
Bank of America, NA: | ||||||||||||||||||||||||
KB Home, | 5.00 | 3.03 | 30 | 2,727 | 2,326 | 401 | ||||||||||||||||||
Barclays Bank PLC: | ||||||||||||||||||||||||
Altice Finco S.A., | 5.00 | 4.50 | EUR | 40 | 1,411 | 2,093 | (682 | ) | ||||||||||||||||
Credit Suisse International: | ||||||||||||||||||||||||
Western Union Co., | 1.00 | 1.35 | $ | 40 | (666 | ) | (544 | ) | (122 | ) | ||||||||||||||
Goldman Sachs International: | ||||||||||||||||||||||||
Convatec Healthcare E S.A., | 5.00 | 1.63 | EUR | 50 | 10,216 | 9,738 | 478 | |||||||||||||||||
NXP B.V., | 5.00 | 1.78 | 40 | 7,781 | 7,130 | 651 | ||||||||||||||||||
JPMorgan Chase Bank, NA: | ||||||||||||||||||||||||
Virgin Media Finance PLC, | 5.00 | 2.14 | 60 | 10,318 | 7,323 | 2,995 | ||||||||||||||||||
Wind Acquisition Finance S.A., | 5.00 | 4.26 | 70 | 3,193 | 6,164 | (2,971 | ) | |||||||||||||||||
Morgan Stanley & Co. International PLC: | ||||||||||||||||||||||||
AK Steel Corp., | 5.00 | 5.62 | $ | 30 | (664 | ) | 355 | (1,019 | ) | |||||||||||||||
American Axle & Manufacturing, | 5.00 | 2.60 | 50 | 5,590 | 5,391 | 199 | ||||||||||||||||||
Amkor Technology, Inc., | 5.00 | 3.28 | 20 | 1,589 | 2,252 | (663 | ) | |||||||||||||||||
Avis Budget Car Rental LLC, | 5.00 | 2.82 | 40 | 4,061 | 4,949 | (888 | ) | |||||||||||||||||
DISH DBS Corp., | 5.00 | 1.76 | 160 | 24,458 | 22,170 | 2,288 | ||||||||||||||||||
| ALLIANCEBERNSTEIN HIGH YIELD PORTFOLIO • | 35 |
Portfolio of Investments
| Swap Counterparty & Referenced Obligation | Fixed Rate (Pay) Receive | Implied Credit Spread at October 31, 2014 | Notional Amount (000) | Market Value | Upfront Premiums Paid (Received) | Unrealized Appreciation/ (Depreciation) | ||||||||||||||||||
Freescale Semiconductor, Inc., | 5.00 | % | 3.01 | % | $ | 80 | $ | 7,342 | $ | 7,237 | $ | 105 | ||||||||||||
Goodyear Tire & Rubber Co., | 5.00 | 2.62 | 60 | 6,631 | 6,813 | (182 | ) | |||||||||||||||||
Levi Strauss & Co., | 5.00 | 2.71 | 50 | 5,332 | 5,870 | (538 | ) | |||||||||||||||||
MGM Resorts International, | 5.00 | 2.54 | 160 | 18,340 | 16,870 | 1,470 | ||||||||||||||||||
Sanmina Corp., | 5.00 | 2.39 | 40 | 4,869 | 3,708 | 1,161 | ||||||||||||||||||
Telecome Italia SpA, | 1.00 | 1.83 | EUR | 80 | (3,873 | ) | (4,395 | ) | 522 | |||||||||||||||
U.S. Steel Corp., | 5.00 | 2.52 | $ | 40 | 4,637 | 2,220 | 2,417 | |||||||||||||||||
|
|
|
|
|
| |||||||||||||||||||
| $ | 112,582 | $ | 106,901 | $ | 5,681 | |||||||||||||||||||
|
|
|
|
|
| |||||||||||||||||||
| * | Termination date |
TOTAL RETURN SWAPS (see Note D)
| Counterparty & Referenced Obligation | # of Shares or Units | Rate Paid | Notional Amount (000) | Maturity Date | Unrealized Appreciation/ (Depreciation) | |||||||||||||||
Receive Total Return on Referenced Obligation |
| |||||||||||||||||||
Goldman Sachs International | ||||||||||||||||||||
iBoxx $ Liquid High Yield Total Return Index | 867 | 0.233 | % | USD | 198 | 12/20/14 | $ | 6,268 | ||||||||||||
JPMorgan Chase Bank, NA | ||||||||||||||||||||
iBoxx $ Liquid High Yield Total Return Index | 851 | 0.231 | 200 | 12/20/14 | 459 | |||||||||||||||
Morgan Stanley & Co. International PLC | ||||||||||||||||||||
iBoxx $ Liquid High Yield Total Return Index | 857 | 0.121 | 200 | 12/22/14 | 1,966 | |||||||||||||||
|
| |||||||||||||||||||
| $ | 8,693 | |||||||||||||||||||
|
| |||||||||||||||||||
| 36 | • ALLIANCEBERNSTEIN HIGH YIELD PORTFOLIO |
Portfolio of Investments
| * | Contract amount less than 500. |
| (a) | Security is exempt from registration under Rule 144A of the Securities Act of 1933. These securities are considered liquid and may be resold in transactions exempt from registration, normally to qualified institutional buyers. At October 31, 2014, the aggregate market value of these securities amounted to $6,511,756 or 32.6% of net assets. |
| (b) | Non-income producing security. |
| (c) | Restricted and illiquid security. |
| Restricted Securities | Acquisition Date | Cost | Market Value | Percentage of Net Assets | ||||||||||||
Momentive Performance Materials, Inc. 8.875%, 10/15/20 | 7/16/14 | $ | – 0 | – | $ | – 0 | – | 0.00 | % | |||||||
| (d) | Pay-In-Kind Payments (PIK). The issuer may pay cash interest and/or interest in additional debt securities. Rates shown are the rates in effect at October 31, 2014. |
| (e) | Convertible security. |
| (f) | Coupon rate adjusts periodically based upon a predetermined schedule. Stated interest rate in effect at October 31, 2014. |
| (g) | Securities are perpetual and, thus, do not have a predetermined maturity date. The date shown, if applicable, reflects the next call date. |
| (h) | Floating Rate Security. Stated interest rate was in effect at October 31, 2014. |
| (i) | One contract relates to 100 shares. |
| (j) | To obtain a copy of the fund’s financial statements, please go to the Securities and Exchange Commission’s website at www.sec.gov, or call AllianceBernstein at (800) 227-4618. |
| (k) | Investment in affiliated money market mutual fund. The rate shown represents the 7-day yield as of period end. |
Currency Abbreviations:
AUD – Australian Dollar
BRL – Brazilian Real
CAD – Canadian Dollar
EUR – Euro
GBP – Great British Pound
IDR – Indonesian Rupiah
JPY – Japanese Yen
NZD – New Zealand Dollar
SEK – Swedish Krona
TRY – Turkish Lira
USD – United States Dollar
ZAR – South African Rand
Glossary:
CDX-NAHY – North American High Yield Credit Default Swap Index
CMBS – Commercial Mortgage-Backed Securities
ETF – Exchange Traded Fund
GSE – Government-Sponsored Enterprise
INTRCONX – Inter-Continental Exchange
REIT – Real Estate Investment Trust
RTP – Right to Pay
SPDR – Standard & Poor’s Depository Receipt
SPY – SPDR Trust Series I
TLT – iShares Barclays 20 Year Treasury Bond Fund
See notes to financial statements.
| ALLIANCEBERNSTEIN HIGH YIELD PORTFOLIO • | 37 |
Portfolio of Investments
STATEMENT OF ASSETS & LIABILITIES
October 31, 2014
| Assets | ||||
Investments in securities, at value | ||||
Unaffiliated issuers (cost $18,137,195) | $ | 17,843,255 | ||
Affiliated issuers (cost $1,840,889) | 1,840,889 | |||
Foreign currencies, at value (cost $12,220) | 12,227 | |||
Due from broker | 5,060 | (a) | ||
Dividends and interest receivable | 301,558 | |||
Upfront premiums paid on credit default swaps | 112,609 | |||
Unamortized offering expense | 99,120 | |||
Receivable from Adviser | 37,603 | |||
Receivable for investment securities sold | 40,418 | |||
Unrealized appreciation on forward currency exchange contracts | 16,440 | |||
Unrealized appreciation on credit default swaps | 12,746 | |||
Unrealized appreciation on total return swaps | 8,693 | |||
|
| |||
Total assets | 20,330,618 | |||
|
| |||
| Liabilities | ||||
Payable for investment securities purchased | 102,701 | |||
Audit and tax fee payable | 85,073 | |||
Dividends payable | 64,388 | |||
Custody fee payable | 31,115 | |||
Options written, at value (premiums received $21,625) | 20,421 | |||
Offering expenses payable | 10,870 | |||
Unrealized depreciation on credit default swaps | 7,065 | |||
Upfront premiums received on credit default swaps | 5,708 | |||
Unrealized depreciation on forward currency exchange contracts | 4,232 | |||
Payable for terminated credit default swaps | 3,524 | |||
Transfer Agent fee payable | 1,519 | |||
Payable for variation margin on exchange-traded derivatives | 1,140 | |||
Distribution fee payable | 21 | |||
Accrued expenses and other liabilities | 30,150 | |||
|
| |||
Total Liabilities | 367,927 | |||
|
| |||
Net Assets | $ | 19,962,691 | ||
|
| |||
| Composition of Net Assets | ||||
Capital stock, at par | $ | 2,015 | ||
Additional paid-in capital | 20,137,506 | |||
Undistributed net investment income | 64,724 | |||
Accumulated net realized gain on investment | 26,125 | |||
Net unrealized depreciation of investments and foreign currency denominated assets and liabilities | (267,679 | ) | ||
|
| |||
| $ | 19,962,691 | |||
|
|
| (a) | Represents amount on deposit at broker as collateral for open derivatives contracts. |
See notes to financial statements.
| 38 | • ALLIANCEBERNSTEIN HIGH YIELD PORTFOLIO |
Statement of Assets & Liabilities
Net Asset Value Per Share—30 billion shares of capital stock authorized, $.001 par value
| Class | Net Assets | Shares Outstanding | Net Asset Value | |||||||||
| ||||||||||||
| A | $ | 29,114 | 2,939 | $ | 9.91 | * | ||||||
| ||||||||||||
| C | $ | 9,910 | 1,000 | $ | 9.91 | |||||||
| ||||||||||||
| Advisor Class | $ | 136,644 | 13,791 | $ | 9.91 | |||||||
| ||||||||||||
| R | $ | 9,910 | 1,000 | $ | 9.91 | |||||||
| ||||||||||||
| K | $ | 9,910 | 1,000 | $ | 9.91 | |||||||
| ||||||||||||
| I | $ | 19,757,293 | 1,994,000 | $ | 9.91 | |||||||
| ||||||||||||
| Z | $ | 9,910 | 1,000 | $ | 9.91 | |||||||
| ||||||||||||
| * | The maximum offering price per share for Class A shares was $10.35 which reflects a sales charge of 4.25%. |
See notes to financial statements.
| ALLIANCEBERNSTEIN HIGH YIELD PORTFOLIO • | 39 |
Statement of Assets & Liabilities
STATEMENT OF OPERATIONS
Period from July 15, 2014* to October 31, 2014
| Investment Income | ||||||||
Interest | $ | 232,015 | ||||||
Dividends | ||||||||
Unaffiliated issuers (net of foreign taxes withheld of $23) | 7,503 | |||||||
Affiliated issuers | 868 | $ | 240,386 | |||||
|
| |||||||
| Expenses | ||||||||
Advisory fee (see Note B) | 35,279 | |||||||
Distribution fee—Class A | 14 | |||||||
Distribution fee—Class C | 29 | |||||||
Distribution fee—Class R | 15 | |||||||
Distribution fee—Class K | 8 | |||||||
Transfer agency—Class A | 2,436 | |||||||
Transfer agency—Class C | 1,517 | |||||||
Transfer agency—Advisor Class | 1,679 | |||||||
Transfer agency—Class R | 2 | |||||||
Transfer agency—Class K | 1 | |||||||
Transfer agency—Class I | 1,171 | |||||||
Transfer agency—Class Z | 1 | |||||||
Audit and tax | 85,073 | |||||||
Amortization of offering expenses | 41,653 | |||||||
Custodian | 31,115 | |||||||
Administrative | 19,919 | |||||||
Legal | 11,984 | |||||||
Printing | 11,453 | |||||||
Registration fees | 4,846 | |||||||
Directors’ fees | 2,165 | |||||||
Miscellaneous | 6,372 | |||||||
|
| |||||||
Total expenses | 256,732 | |||||||
Less: expenses waived and reimbursed by the Adviser | (209,617 | ) | ||||||
|
| |||||||
Net expenses | 47,115 | |||||||
|
| |||||||
Net investment income | 193,271 | |||||||
|
| |||||||
| Realized and Unrealized Gain (Loss) on Investment and Foreign Currency Transactions | ||||||||
Net realized gain (loss) on: | ||||||||
Investment transactions | 18,553 | |||||||
Swaps | 10,247 | |||||||
Futures | (2 | ) | ||||||
Options written | (2,363 | ) | ||||||
Foreign currency transactions | 68,605 | |||||||
Net change in unrealized appreciation/depreciation of: | ||||||||
Investments | (293,940 | ) | ||||||
Swaps | 16,243 | |||||||
Futures | (2,507 | ) | ||||||
Options written | 1,204 | |||||||
Foreign currency denominated assets and liabilities | 11,321 | |||||||
|
| |||||||
Net loss on investment and foreign currency transactions | (172,639 | ) | ||||||
|
| |||||||
Net Increase in Net Assets from Operations | $ | 20,632 | ||||||
|
|
| * | Commencement of operations. |
See notes to financial statements.
| 40 | • ALLIANCEBERNSTEIN HIGH YIELD PORTFOLIO |
Statement of Operations
STATEMENT OF CHANGES IN NET ASSETS
| July 15, 2014* to October 31, 2014 | ||||
| Increase (Decrease) in Net Assets from Operations | ||||
Net investment income | $ | 193,271 | ||
Net realized gain on investment and foreign currency transactions | 95,040 | |||
Net change in unrealized appreciation/depreciation of investments and foreign currency denominated assets and liabilities | (267,679 | ) | ||
|
| |||
Net increase in net assets from operations | 20,632 | |||
| Dividends to Shareholders from | ||||
Net investment income | ||||
Class A | (192 | ) | ||
Class C | (72 | ) | ||
Advisor Class | (202 | ) | ||
Class R | (87 | ) | ||
Class K | (94 | ) | ||
Class I | (203,083 | ) | ||
Class Z | (102 | ) | ||
| Capital Stock Transactions | ||||
Net increase | 20,145,891 | |||
Total increase | 19,962,691 | |||
|
| |||
| Net Assets | ||||
Beginning of period | – 0 | – | ||
|
| |||
End of period (including undistributed net investment income of $64,724) | $ | 19,962,691 | ||
|
| |||
| * | Commencement of operations. |
See notes to financial statements.
| ALLIANCEBERNSTEIN HIGH YIELD PORTFOLIO • | 41 |
Statement of Changes In Net Assets
NOTES TO FINANCIAL STATEMENTS
October 31, 2014
NOTE A
Significant Accounting Policies
AllianceBernstein Bond Fund, Inc. (the “Fund”) is registered under the Investment Company Act of 1940 as an open-end management investment company. The Fund, which is a Maryland corporation, operates as a series company comprised of nine portfolios currently in operation: the Intermediate Bond Portfolio, the Bond Inflation Strategy Portfolio, the Municipal Bond Inflation Strategy Portfolio, the Real Asset Strategy Portfolio, the Limited Duration High Income Portfolio, the Government Reserves Portfolio, the Tax-Aware Fixed Income Portfolio, the AllianceBernstein Credit Long/Short Portfolio and the High Yield Portfolio. They are each diversified Portfolios, with the exception of the Limited Duration High Income Portfolio, the AllianceBernstein Credit Long/Short Portfolio and the AllianceBernstein High Yield Portfolio, which are non-diversified. The Tax-Aware Fixed Income Portfolio commenced operations on December 11, 2013. The Credit Long/Short Portfolio commenced operations on May 7, 2014. The High Yield Portfolio commenced operations on July 15, 2014. Each Portfolio is considered to be a separate entity for financial reporting and tax purposes. This report relates only to the High Yield Portfolio (the “Portfolio”). The Portfolio has authorized the issuance of Class A, Class B, Class C, Advisor Class, Class R, Class K, Class I, Class Z, Class 1 and Class 2 shares. Class B, Class 1 and Class 2 are not currently being offered. As of October 31, 2014, AllianceBernstein L.P. (the “Adviser”) was the sole shareholder of Class C, Class R, Class K, Class I and Class Z shares. Class A shares are sold with a front end sales charge of up to 4.25% for purchases not exceeding $1,000,000. With respect to purchases of $1,000,000 or more, Class A shares redeemed within one year of purchase may be subject to a contingent deferred sales charge of 1%. Class C shares are subject to a contingent deferred sales charge of 1% on redemptions made within the first year after purchase. Class R and Class K shares are sold without an initial or contingent deferred sales charge. Advisor Class, Class I and Class Z shares are sold without an initial or contingent deferred sales charge and are not subject to ongoing distribution expenses. All ten classes of shares have identical voting, dividend, liquidation and other rights, except that the classes bear different distribution and transfer agency expenses. Each class has exclusive voting rights with respect to its distribution plan. The financial statements have been prepared in conformity with U.S. generally accepted accounting principles (“U.S. GAAP”) which require management to make certain estimates and assumptions that affect the reported amounts of assets and liabilities in the financial statements and amounts of income and expenses during the reporting period. Actual results could differ from those estimates. The following is a summary of significant accounting policies followed by the Portfolio.
1. Security Valuation
Portfolio securities are valued at their current market value determined on the basis of market quotations or, if market quotations are not readily available or are deemed unreliable, at “fair value” as determined in accordance with procedures established by and under the general supervision of the Portfolio’s Board of Directors (the “Board”).
| 42 | • ALLIANCEBERNSTEIN HIGH YIELD PORTFOLIO |
Notes to Financial Statements
In general, the market values of securities which are readily available and deemed reliable are determined as follows: securities listed on a national securities exchange (other than securities listed on the NASDAQ Stock Market, Inc. (“NASDAQ”)) or on a foreign securities exchange are valued at the last sale price at the close of the exchange or foreign securities exchange. If there has been no sale on such day, the securities are valued at the last traded price from the previous day. Securities listed on more than one exchange are valued by reference to the principal exchange on which the securities are traded; securities listed only on NASDAQ are valued in accordance with the NASDAQ Official Closing Price; listed or over the counter (“OTC”) market put or call options are valued at the mid level between the current bid and ask prices. If either a current bid or current ask price is unavailable, the Adviser will have discretion to determine the best valuation (e.g. last trade price in the case of listed options); open futures contracts are valued using the closing settlement price or, in the absence of such a price, the most recent quoted bid price. If there are no quotations available for the day of valuation, the last available closing settlement price is used; U.S. government securities and other debt instruments having 60 days or less remaining until maturity are valued at amortized cost if their original maturity was 60 days or less. If the original term to maturity exceeded 60 days, the securities are valued by a pricing service, if a market price is available. If a market price is not available, the securities are valued by using amortized cost as of the 61st day prior to maturity. Fixed-income securities, including mortgage-backed and asset-backed securities, may be valued on the basis of prices provided by a pricing service or at a price obtained from one or more of the major broker-dealers. In cases where broker-dealer quotes are obtained, the Adviser may establish procedures whereby changes in market yields or spreads are used to adjust, on a daily basis, a recently obtained quoted price on a security. Swaps and other derivatives are valued daily, primarily using independent pricing services, independent pricing models using market inputs, as well as third party broker-dealers or counterparties. Investment companies are valued at their net asset value each day.
Securities for which market quotations are not readily available (including restricted securities) or are deemed unreliable are valued at fair value. Factors considered in making this determination may include, but are not limited to, information obtained by contacting the issuer, analysts, analysis of the issuer’s financial statements or other available documents. In addition, the Portfolio may use fair value pricing for securities primarily traded in non-U.S. markets because most foreign markets close well before the Portfolio values its securities at 4:00 p.m., Eastern Time. The earlier close of these foreign markets gives rise to the possibility that significant events, including broad market moves, may have occurred in the interim and may materially affect the value of those securities.
2. Fair Value Measurements
In accordance with U.S. GAAP regarding fair value measurements, fair value is defined as the price that the Portfolio would receive to sell an asset or pay to
| ALLIANCEBERNSTEIN HIGH YIELD PORTFOLIO • | 43 |
Notes to Financial Statements
transfer a liability in an orderly transaction between market participants at the measurement date. U.S. GAAP establishes a framework for measuring fair value, and a three-level hierarchy for fair value measurements based upon the transparency of inputs to the valuation of an asset or liability (including those valued based on their market values as described in Note A.1 above). Inputs may be observable or unobservable and refer broadly to the assumptions that market participants would use in pricing the asset or liability. Observable inputs reflect the assumptions market participants would use in pricing the asset or liability based on market data obtained from sources independent of the Portfolio. Unobservable inputs reflect the Portfolio’s own assumptions about the assumptions that market participants would use in pricing the asset or liability based on the best information available in the circumstances. Each investment is assigned a level based upon the observability of the inputs which are significant to the overall valuation. The three-tier hierarchy of inputs is summarized below.
| • | Level 1—quoted prices in active markets for identical investments |
| • | Level 2—other significant observable inputs (including quoted prices for similar investments, interest rates, prepayment speeds, credit risk, etc.) |
| • | Level 3—significant unobservable inputs (including the Portfolio’s own assumptions in determining the fair value of investments) |
The fair value of debt instruments, such as bonds, and over-the-counter derivatives is generally based on market price quotations, recently executed market transactions (where observable) or industry recognized modeling techniques and are generally classified as Level 2. Pricing vendor inputs to Level 2 valuations may include quoted prices for similar investments in active markets, interest rate curves, coupon rates, currency rates, yield curves, option adjusted spreads, default rates, credit spreads and other unique security features in order to estimate the relevant cash flows which is then discounted to calculate fair values. If these inputs are unobservable and significant to the fair value, these investments will be classified as Level 3. In addition, non-agency rated investments are classified as Level 3.
Where readily available market prices or relevant bid prices are not available for certain equity investments, such investments may be valued based on similar publicly traded investments, movements in relevant indices since last available prices or based upon underlying company fundamentals and comparable company data (such as multiples to earnings or other multiples to equity). Where an investment is valued using an observable input, such as another publicly traded security, the investment will be classified as Level 2. If management determines that an adjustment is appropriate based on restrictions on resale, illiquidity or uncertainty, and such adjustment is a significant component of the valuation, the investment will be classified as Level 3. An investment will also be classified as Level 3 where management uses company fundamentals and other significant inputs to determine the valuation.
| 44 | • ALLIANCEBERNSTEIN HIGH YIELD PORTFOLIO |
Notes to Financial Statements
Options are valued using market-based inputs to models, broker or dealer quotations, or alternative pricing sources with reasonable levels of price transparency, where such inputs and models are available. Alternatively the values may be obtained through unobservable management determined inputs and/or management’s proprietary models. Where models are used, the selection of a particular model to value an option depends upon the contractual terms of, and specific risks inherent in, the option as well as the availability of pricing information in the market. Valuation models require a variety of inputs, including contractual terms, market prices, measures of volatility and correlations of such inputs. Exchange traded options generally will be classified as Level 2. For options that do not trade on exchange but trade in liquid markets, inputs can generally be verified and model selection does not involve significant management judgment. Options are classified within Level 2 on the fair value hierarchy when all of the significant inputs can be corroborated to market evidence. Otherwise such instruments are classified as Level 3.
Valuations of mortgage-backed or other asset-backed securities, by pricing vendors, are based on both proprietary and industry recognized models and discounted cash flow techniques. Significant inputs to the valuation of these instruments are value of the collateral, the rates and timing of delinquencies, the rates and timing of prepayments, and default and loss expectations, which are driven in part by housing prices for residential mortgages. Significant inputs are determined based on relative value analyses, which incorporate comparisons to instruments with similar collateral and risk profiles, including relevant indices. Mortgage and asset backed securities for which management has collected current observable data through pricing services are generally categorized within Level 2. Those investments for which current observable data has not been provided are classified as Level 3.
Other fixed income investments, including non-U.S. government and corporate debt, are generally valued using quoted market prices, if available, which are typically impacted by current interest rates, maturity dates and any perceived credit risk of the issuer. Additionally, in the absence of quoted market prices, these inputs are used by pricing vendors to derive a valuation based upon industry or proprietary models which incorporate issuer specific data with relevant yield/spread comparisons with more widely quoted bonds with similar key characteristics. Those investments for which there are observable inputs are classified as Level 2. Where the inputs are not observable, the investments are classified as Level 3.
Bank loan prices are provided by third party pricing services and consist of a composite of the quotes received by the vendor into a consensus price. Bank loans are classified as Level 3, as significant input used in the fair value measurement of these instruments is the market quotes that are received by the vendor and these inputs are not observable.
| ALLIANCEBERNSTEIN HIGH YIELD PORTFOLIO • | 45 |
Notes to Financial Statements
The following table summarizes the valuation of the Portfolio’s investments by the above fair value hierarchy levels as of October 31, 2014:
Investments in | Level 1 | Level 2 | Level 3 | Total | ||||||||||||
Assets: | ||||||||||||||||
Corporates – Non-Investment Grade | $ | – 0 | – | $ | 14,439,196 | $ | 207,734 | ^ | $ | 14,646,930 | ||||||
Corporates – Investment Grade | – 0 | – | 1,044,674 | 34,600 | 1,079,274 | |||||||||||
Common Stocks | 441,955 | – 0 | – | – 0 | – | 441,955 | ||||||||||
Preferred Stocks | 366,892 | – 0 | – | – 0 | – | 366,892 | ||||||||||
Bank Loans | – 0 | – | – 0 | – | 326,756 | 326,756 | ||||||||||
Collateralized Mortgage Obligations | – 0 | – | – 0 | – | 262,347 | 262,347 | ||||||||||
Commercial Mortgage-Backed Securities | – 0 | – | – 0 | – | 238,158 | 238,158 | ||||||||||
Emerging Markets – Corporate Bonds | – 0 | – | 180,700 | – 0 | – | 180,700 | ||||||||||
Governments – Sovereign Bonds | – 0 | – | 68,093 | – 0 | – | 68,093 | ||||||||||
Governments – Treasuries | – 0 | – | 42,521 | – 0 | – | 42,521 | ||||||||||
Emerging Markets – Sovereigns | – 0 | – | 41,433 | – 0 | – | 41,433 | ||||||||||
Governments – Sovereign Agencies | – 0 | – | 41,226 | – 0 | – | 41,226 | ||||||||||
Options Purchased – Calls | – 0 | – | 39,283 | – 0 | – | 39,283 | ||||||||||
Options Purchased – Puts | – 0 | – | 12,940 | – 0 | – | 12,940 | ||||||||||
Warrants | 3,488 | – 0 | – | – 0 | – | 3,488 | ||||||||||
Short-Term Investments: | ||||||||||||||||
Investment Companies | 1,840,889 | – 0 | – | – 0 | – | 1,840,889 | ||||||||||
Time Deposits | – 0 | – | 51,259 | – 0 | – | 51,259 | ||||||||||
|
|
|
|
|
|
|
| |||||||||
Total Investments in Securities | 2,653,224 | 15,961,325 | 1,069,595 | 19,684,144 | ||||||||||||
Other Financial Instruments*: | ||||||||||||||||
Assets | ||||||||||||||||
Credit Default Swaps | – 0 | – | 12,746 | – 0 | – | 12,746 | ||||||||||
Centrally Cleared Credit Default Swaps | – 0 | – | 32,552 | – 0 | – | 32,552 | † | |||||||||
Forward Currency Exchange Contracts | – 0 | – | 16,440 | – 0 | – | 16,440 | ||||||||||
Total Return Swaps | – 0 | – | 8,693 | – 0 | – | 8,693 | ||||||||||
Liabilities | ||||||||||||||||
Credit Default Swaps | – 0 | – | (7,065 | ) | – 0 | – | (7,065 | ) | ||||||||
Centrally Cleared Credit Default Swaps | – 0 | – | (30,683 | ) | – 0 | – | (30,683 | )† | ||||||||
Futures | (2,507 | ) | – 0 | – | – 0 | – | (2,507 | )† | ||||||||
Forward Currency Exchange Contracts | – 0 | – | (4,232 | ) | – 0 | – | (4,232 | ) | ||||||||
Call Options Written | – 0 | – | (12,150 | ) | – 0 | – | (12,150 | ) | ||||||||
Put Options Written | – 0 | – | (935 | ) | – 0 | – | (935 | ) | ||||||||
Credit Default Swaptions Written | – 0 | – | (7,336 | ) | – 0 | – | (7,336 | ) | ||||||||
|
|
|
|
|
|
|
| |||||||||
Total** | $ | 2,650,717 | $ | 15,969,355 | $ | 1,069,595 | $ | 19,689,667 | ||||||||
|
|
|
|
|
|
|
| |||||||||
| ^ | The Portfolio held securities with zero market value at period end. |
| * | Other financial instruments are derivative instruments, such as futures, forwards and swap contracts which are valued at the unrealized appreciation/depreciation on the instrument. Other financial instruments may also include written options and swaptions which are valued at market value. |
| 46 | • ALLIANCEBERNSTEIN HIGH YIELD PORTFOLIO |
Notes to Financial Statements
| † | Only variation margin receivable/payable at period end is reported within the statements of assets and liabilities. This amount reflects cumulative appreciation/depreciation of exchange-traded derivatives as reported in the portfolio of investments. |
| ** | There were no transfers between any levels during the reporting period. |
The Portfolio recognizes all transfers between levels of the fair value hierarchy assuming the financial instrument was transferred at the beginning of the reporting period.
The following is a reconciliation of investments in which significant unobservable inputs (Level 3) were used in determining fair value.
| Corporates - Non-Investment Grade | Corporates - Investment Grade | Bank Loans | Collateralized Mortgage Obligations | |||||||||||||
Balance as of 07/15/14* | $ | – 0 | – | $ | – 0 | – | $ | – 0 | – | $ | – 0 | – | ||||
Accrued discounts/ (premiums) | (1,147 | ) | (2 | ) | (74 | ) | (2,082 | ) | ||||||||
Realized gain (loss) | – 0 | – | – 0 | – | (171 | ) | (2,758 | ) | ||||||||
Change in unrealized appreciation/depreciation | (4,954 | ) | (7,389 | ) | (3,172 | ) | (17,324 | ) | ||||||||
Purchases | 213,835 | 41,991 | 364,432 | 317,541 | ||||||||||||
Sales/Paydown | – 0 | – | – 0 | – | (34,259 | ) | (33,030 | ) | ||||||||
Transfers into Level 3 | – 0 | – | – 0 | – | – 0 | – | – 0 | – | ||||||||
Transfers out of Level 3 | – 0 | – | – 0 | – | – 0 | – | – 0 | – | ||||||||
|
|
|
|
|
|
|
| |||||||||
Balance as of 10/31/14 | $ | 207,734 | $ | 34,600 | $ | 326,756 | $ | 262,347 | ||||||||
|
|
|
|
|
|
|
| |||||||||
Net change in unrealized appreciation/depreciation from investments held as of 10/31/14** | $ | (4,954 | ) | $ | (7,389 | ) | $ | (3,172 | ) | $ | (17,324 | ) | ||||
| Commercial Mortgage-Backed Securities | Totals | |||||||||||||||
Balance as of 07/15/14* | $ | – 0 | – | $ | – 0 | – | ||||||||||
Accrued discounts/ (premiums) | 58 | (3,247 | ) | |||||||||||||
Realized gain (loss) | – 0 | – | (2,929 | ) | ||||||||||||
Change in unrealized appreciation/depreciation | (5,041 | ) | (37,880 | ) | ||||||||||||
Purchases | 243,141 | 1,180,940 | ||||||||||||||
Sales/Paydown | – 0 | – | (67,289 | ) | ||||||||||||
Transfers into Level 3 | – 0 | – | – 0 | – | ||||||||||||
Transfers out of Level 3 | – 0 | – | – 0 | – | ||||||||||||
|
|
|
| |||||||||||||
Balance as of 10/31/14 | $ | 238,158 | $ | 1,069,595 | + | |||||||||||
|
|
|
| |||||||||||||
Net change in unrealized appreciation/depreciation from investments held as of 10/31/14** | $ | (5,041 | ) | $ | (37,880 | ) | ||||||||||
| ALLIANCEBERNSTEIN HIGH YIELD PORTFOLIO • | 47 |
Notes to Financial Statements
| * | Commencement of operations. |
| + | There were no transfers into or out of Level 3 during the reporting period. |
| ** | The unrealized appreciation/depreciation is included in net change in unrealized appreciation/depreciation of investments and other financial instruments in the accompanying statement of operations. |
As of October 31, 2014 all Level 3 securities were priced by third party vendors.
The Adviser has established a Valuation Committee (the “Committee”) which is responsible for overseeing the pricing and valuation of all securities held in the Portfolios. The Committee operates under pricing and valuation policies and procedures established by the Adviser and approved by the Board, including pricing policies which set forth the mechanisms and processes to be employed on a daily basis to implement these policies and procedures. In particular, the pricing policies describe how to determine market quotations for securities and other instruments. The Committee’s responsibilities include: 1) fair value and liquidity determinations (and oversight of any third parties to whom any responsibility for fair value and liquidity determinations is delegated), and 2) regular monitoring of the Adviser’s pricing and valuation policies and procedures and modification or enhancement of these policies and procedures (or recommendation of the modification of these policies and procedures) as the Committee believes appropriate.
The Committee is also responsible for monitoring the implementation of the pricing policies by the Adviser’s Pricing Group (the “Pricing Group”) and a third party which performs certain pricing functions in accordance with the pricing policies. The Pricing Group is responsible for the oversight of the third party on a day-to-day basis. The Committee and the Pricing Group perform a series of activities to provide reasonable assurance of the accuracy of prices including: 1) periodic vendor due diligence meetings, review of methodologies, new developments, process at vendors, 2) daily comparisons of security valuation versus prior day for all securties that exceeded established thresholds, and 3) daily review of unpriced, stale, and variance reports with exceptions reviewed by senior management and the Committee.
In addition, several processes outside of the pricing process are used to monitor valuation issues including: 1) performance and performance attribution reports are monitored for anomalous impacts based upon benchmark performance, and 2) portfolio managers review all portfolios for performance and analytics (which are generated using the Adviser’s prices).
3. Currency Translation
Assets and liabilities denominated in foreign currencies and commitments under forward currency exchange contracts are translated into U.S. dollars at the mean of the quoted bid and ask prices of such currencies against the U.S. dollar. Purchases and sales of portfolio securities are translated into U.S. dollars at the rates of exchange prevailing when such securities were acquired or sold. Income and expenses are translated into U.S. dollars at the rates of exchange prevailing when accrued.
| 48 | • ALLIANCEBERNSTEIN HIGH YIELD PORTFOLIO |
Notes to Financial Statements
Net realized gain or loss on foreign currency transactions represents foreign exchange gains and losses from sales and maturities of foreign fixed income investments, foreign currency exchange contracts, holding of foreign currencies, currency gains or losses realized between the trade and settlement dates on foreign investment transactions, and the difference between the amounts of dividends, interest and foreign withholding taxes recorded on the Portfolio’s books and the U.S. dollar equivalent amounts actually received or paid. Net unrealized currency gains and losses from valuing foreign currency denominated assets and liabilities at period end exchange rates are reflected as a component of net unrealized appreciation and depreciation of foreign currency denominated assets and liabilities.
4. Taxes
It is the Portfolio’s policy to meet the requirements of the Internal Revenue Code applicable to regulated investment companies and to distribute all of its investment company taxable income and net realized gains, if any, to shareholders. Therefore, no provisions for federal income or excise taxes are required. The Portfolio may be subject to taxes imposed by countries in which it invests. Such taxes are generally based on income and/or capital gains earned or repatriated. Taxes are accrued and applied to net investment income, net realized gains and net unrealized appreciation/depreciation as such income and/or gains are earned.
In accordance with U.S. GAAP requirements regarding accounting for uncertainties in income taxes, management has analyzed the Portfolio’s tax positions taken or expected to be taken on federal and state income tax returns for all open tax years (the current and the prior three tax years) and has concluded that no provision for income tax is required in the Portfolio’s financial statements.
5. Investment Income and Investment Transactions
Dividend income is recorded on the ex-dividend date or as soon as the Portfolio is informed of the dividend. Interest income is accrued daily. Investment transactions are accounted for on the date securities are purchased or sold. Investment gains or losses are determined on the identified cost basis. The Portfolio amortizes premiums and accretes discounts as adjustments to interest income.
6. Class Allocations
All income earned and expenses incurred by the Portfolio are borne on a prorate basis by each outstanding class of shares, based on the proportionate interest in the Portfolio represented by the net assets of such class, except for class specific expenses which are allocated to the respective class. Expenses of the Fund are charged proportionately to each Portfolio or based on other appropriate methods. Realized and unrealized gains and losses are allocated among the various share classes based on respective net assets.
| ALLIANCEBERNSTEIN HIGH YIELD PORTFOLIO • | 49 |
Notes to Financial Statements
7. Dividends and Distributions
Dividends and distributions to shareholders, if any, are recorded on the ex-dividend date. Income dividends and capital gains distributions are determined in accordance with federal tax regulations and may differ from those determined in accordance with U.S. GAAP. To the extent these differences are permanent, such amounts are reclassified within the capital accounts based on their federal tax basis treatment; temporary differences do not require such reclassification.
8. Offering Expenses
Offering expenses of $140,773 were deferred and amortized on a straight line basis over a one year period starting from July 15, 2014 (commencement of operations).
NOTE B
Advisory Fee and Other Transactions with Affiliates
Under the terms of the investment advisory agreement, the Portfolio pays the Adviser an advisory fee at an annual rate of .60% of the first $2.5 billion, .55% of the next $2.5 billion and .50% in excess of $5 billion, of the Portfolio’s average daily net assets. The fee is accrued daily and paid monthly.
The Adviser has agreed to waive its fees and bear certain expenses to the extent necessary to limit total operating expenses on an annual basis (the “Expense Caps”) to 1.05%, 1.80%, .80%, 1.30%, 1.05%, .80%, and .80% of the daily average net assets for the Class A, Class C, Advisor Class, Class R, Class K, Class I, and Class Z shares, respectively.
Under the agreement, any fees waived and expenses borne by the Adviser may be reimbursed by the Portfolio until the end of the third fiscal year after the fiscal period in which the fee was waived or the expense was borne, provided that no reimbursement payment will be made that would cause the Portfolio’s total annual fund operating expenses to exceed the net fee percentages set forth in the preceding paragraph. This fee waiver and/or expense reimbursement agreement may not be terminated by the Adviser before July 15, 2015. For the period ended October 31, 2014, such waiver/reimbursement amounted to $189,698.
Pursuant to the investment advisory agreement, the Portfolio may reimburse the Adviser for certain legal and accounting services provided to the Portfolio by the Adviser. For the period ended October 31, 2014, the Adviser voluntarily agreed to waive such fees in the amount of $19,919.
The Portfolio compensates AllianceBernstein Investor Services, Inc. (“ABIS”), a wholly-owned subsidiary of the Adviser, under a Transfer Agency Agreement for providing personnel and facilities to perform transfer agency services for the Portfolio. ABIS may make payments to intermediaries that provide omnibus account services, sub-accounting services and/or networking services. Such compensation retained by ABIS amounted to $6,000 for the period ended October 31, 2014.
| 50 | • ALLIANCEBERNSTEIN HIGH YIELD PORTFOLIO |
Notes to Financial Statements
AllianceBernstein Investments, Inc. (the “Distributor”), a wholly-owned subsidiary of the Adviser, serves as the distributor of the Portfolio’s shares. The Distributor has advised the Portfolio that it has retained front-end sales charges of $49 from the sale of Class A shares and received $0 and $0 in contingent deferred sales charges imposed upon redemptions by shareholders of Class A and Class C shares, respectively, for the period ended October 31, 2014.
The Portfolio may invest in the AllianceBernstein Fixed-Income Shares, Inc.—Government STIF Portfolio (“Government STIF Portfolio”), an open-end management investment company managed by the Adviser. The Government STIF Portfolio is offered as a cash management option to mutual funds and other institutional accounts of the Adviser, and is not available for direct purchase by members of the public. The Government STIF Portfolio pays no investment management fees but does bear its own expenses. A summary of the Portfolio’s transactions in shares of the Government STIF Portfolio for the period ended October 31, 2014 is as follows:
Market Value | Purchases at Cost (000) | Sales Proceeds (000) | Market Value October 31, 2014 (000) | Dividend Income (000) | ||||||||||||||
| $ – 0 | – | $ | 20,429 | $ | 18,588 | $ | 1,841 | $ | 1 | |||||||||
| * | Commencement of operations. |
Brokerage commissions paid on investment transactions for the period ended October 31, 2014 amounted to $4,015, none of which was paid to Sanford C. Bernstein & Co. LLC and Sanford C. Bernstein Limited, affiliates of the Adviser.
NOTE C
Distribution Services Agreement
The Portfolio has adopted a Distribution Services Agreement (the “Agreement”) pursuant to Rule 12b-1 under the Investment Company Act of 1940. Under the Agreement, the Portfolio pays distribution and servicing fees to the Distributor at an annual rate of up to .25% of the Portfolio’s average daily net assets attributable to Class A shares, 1% of the Portfolio’s average daily net assets attributable to Class C shares, .50% of the Portfolio’s average daily net assets attributable to Class R shares and .25% of the Portfolio’s average daily net assets attributable to Class K shares. There are no distribution and servicing fees on the Advisor Class, Class I and Class Z shares. The fees are accrued daily and paid monthly. The Agreement provides that the Distributor will use such payments in their entirety for distribution assistance and promotional activities. Since the commencement of the Portfolio’s operations, the Distributor has incurred expenses in excess of the distribution costs reimbursed by the Portfolio in the amount of $4 for Class K shares. While such costs may be recovered from the Portfolio in future periods so long as the Agreement is in effect, the rate of the distribution and servicing fees payable under the Agreement may not be increased without a shareholder vote. In accordance with the Agreement, there
| ALLIANCEBERNSTEIN HIGH YIELD PORTFOLIO • | 51 |
Notes to Financial Statements
is no provision for recovery of unreimbursed distribution costs incurred by the Distributor beyond the current fiscal year for Class A shares. The Agreement also provides that the Adviser may use its own resources to finance the distribution of the Portfolio’s shares.
NOTE D
Investment Transactions
Purchases and sales of investment securities (excluding short-term investments) for the period ended October 31, 2014, were as follows:
| Purchases | Sales | |||||||
Investment securities (excluding | $ | 18,716,812 | $ | 752,963 | ||||
U.S. government securities | – 0 | – | – 0 | – | ||||
The cost of investments for federal income tax purposes, gross unrealized appreciation and unrealized depreciation (excluding foreign currency exchange contracts, swaps, and futures) are as follows:
Cost | $ | 19,978,357 | ||
|
| |||
Gross unrealized appreciation | $ | 112,491 | ||
Gross unrealized depreciation | (406,704 | ) | ||
|
| |||
Net unrealized depreciation | $ | (294,213 | ) | |
|
|
1. Derivative Financial Instruments
The Portfolio may use derivatives in an effort to earn income and enhance returns, to replace more traditional direct investments, to obtain exposure to otherwise inaccessible markets (collectively, “investment purposes”), or to hedge or adjust the risk profile of its portfolio.
The principal types of derivatives utilized by the Portfolio, as well as the methods in which they may be used are:
| • | Forward Currency Exchange Contracts |
The Portfolio may enter into forward currency exchange contracts in order to hedge its exposure to changes in foreign currency exchange rates on its foreign portfolio holdings, to hedge certain firm purchase and sales commitments denominated in foreign currencies and for non-hedging purposes as a means of making direct investments in foreign currencies, as described below under “Currency Transactions”.
A forward currency exchange contract is a commitment to purchase or sell a foreign currency at a future date at a negotiated forward rate. The gain or loss arising from the difference between the original contract and the closing of such contract would be included in net realized gain or loss on foreign currency transactions. Fluctuations in the value of open forward currency exchange contracts are recorded for financial reporting purposes as unrealized appreciation and/or depreciation by the Portfolio.
| 52 | • ALLIANCEBERNSTEIN HIGH YIELD PORTFOLIO |
Notes to Financial Statements
Risks may arise from the potential inability of a counterparty to meet the terms of a contract and from unanticipated movements in the value of a foreign currency relative to the U.S. dollar.
During the period ended October 31, 2014, the Portfolio held foreign-currency exchange contracts for non-hedging purposes.
| • | Futures |
The Portfolio may buy or sell futures for investment purposes or for the purpose of hedging its portfolio against adverse effects of potential movements in the market. The Portfolio bears the market risk that arises from changes in the value of these instruments and the imperfect correlation between movements in the price of the futures and movements in the price of the assets, reference rates or indices which they are designed to track. Among other things, the Portfolio may purchase or sell futures for foreign currencies or options thereon for non-hedging purposes as a means of making direct investment in foreign currencies, as described below under “Currency Transactions”.
At the time the Portfolio enters into a future, the Portfolio deposits and maintains as collateral an initial margin with the broker, as required by the exchange on which the transaction is effected. Such amount is shown as due from broker on the statement of assets and liabilities. Pursuant to the contract, the Portfolio agrees to receive from or pay to the broker an amount of cash equal to the daily fluctuation in the value of the contract. Such receipts or payments are known as variation margin and are recorded by the Portfolio as unrealized gains or losses. Risks may arise from the potential inability of a counterparty to meet the terms of the contract. The credit/counterparty risk for exchange-traded futures is generally less than privately negotiated futures, since the clearinghouse, which is the issuer or counterparty to each exchange-traded future, has robust risk mitigation standards, including the requirement to provide initial and variation margin. When the contract is closed, the Portfolio records a realized gain or loss equal to the difference between the value of the contract at the time it was opened and the time it was closed.
Use of long futures subjects the Portfolio to risk of loss in excess of the amounts shown on the statement of assets and liabilities, up to the notional value of the future. Use of short futures subjects the Portfolio to unlimited risk of loss. Under some circumstances, futures exchanges may establish daily limits on the amount that the price of a future can vary from the previous day’s settlement price, which could effectively prevent liquidation of unfavorable positions.
During the period ended October 31, 2014, the Portfolio held futures for hedging and non-hedging purposes.
| ALLIANCEBERNSTEIN HIGH YIELD PORTFOLIO • | 53 |
Notes to Financial Statements
| • | Option Transactions |
For hedging and investment purposes, the Portfolio may purchase and write (sell) put and call options on U.S. and foreign securities, including government securities, and foreign currencies that are traded on U.S. and foreign securities exchanges and over-the-counter markets. Among other things, the Portfolio may use options transactions for non-hedging purposes as a means of making direct investments in foreign currencies, as described below under “Currency Transactions” and may use options strategies involving the purchase and/or writing of various combinations of call and/or put options, for hedging and investment purposes.
The risk associated with purchasing an option is that the Portfolio pays a premium whether or not the option is exercised. Additionally, the Portfolio bears the risk of loss of the premium and change in market value should the counterparty not perform under the contract. Put and call options purchased are accounted for in the same manner as portfolio securities. The cost of securities acquired through the exercise of call options is increased by premiums paid. The proceeds from securities sold through the exercise of put options are decreased by the premiums paid.
When the Portfolio writes an option, the premium received by the Portfolio is recorded as a liability and is subsequently adjusted to the current market value of the option written. Premiums received from written options which expire unexercised are recorded by the Portfolio on the expiration date as realized gains from options written. The difference between the premium received and the amount paid on effecting a closing purchase transaction, including brokerage commissions, is also treated as a realized gain, or if the premium received is less than the amount paid for the closing purchase transaction, as a realized loss. If a call option is exercised, the premium received is added to the proceeds from the sale of the underlying security or currency in determining whether the Portfolio has realized a gain or loss. If a put option is exercised, the premium received reduces the cost basis of the security or currency purchased by the Portfolio. In writing an option, the Portfolio bears the market risk of an unfavorable change in the price of the security or currency underlying the written option. Exercise of an option written by the Portfolio could result in the Portfolio selling or buying a security or currency at a price different from the current market value.
The Portfolio may also invest in options on swap agreements, also called “swaptions”. A swaption is an option that gives the buyer the right, but not the obligation, to enter into a swap on a future date in exchange for paying a market-based “premium”. A receiver swaption gives the owner the right to receive the total return of a specified asset, reference rate, or index. A payer swaption gives the owner the right to pay the total return on a specified asset, reference rate, or index. Swaptions also include options that allow an existing swap to be terminated or extended by one of the counterparties.
| 54 | • ALLIANCEBERNSTEIN HIGH YIELD PORTFOLIO |
Notes to Financial Statements
During the period ended October 31, 2014, the Portfolio held purchased options for hedging purposes.
During the period ended October 31, 2014, the Portfolio held written options for hedging purposes.
During the period ended October 31, 2014, the Portfolio held purchased swaptions for hedging purposes.
During the period ended October 31, 2014, the Portfolio held written swaptions for hedging purposes.
For the period ended October 31, 2014, the Portfolio had the following transactions in written options:
| Number of Contracts | Premiums Received | |||||||
Options written outstanding as of 7/15/14* | – 0 | – | – 0 | – | ||||
Options written | 303 | 17,673 | ||||||
Options expired | (36 | ) | (1,511 | ) | ||||
Options bought back | (117 | ) | (3,869 | ) | ||||
Options exercised | – 0 | – | – 0 | – | ||||
|
|
|
| |||||
Options written outstanding as of 10/31/14 | 150 | $ | 12,293 | |||||
|
|
|
| |||||
For the period ended October 31, 2014, the Portfolio had the following transactions in written swaptions:
| Notional Amount | Premiums Received | |||||||
Swaptions written outstanding as of 7/15/14* | – 0 | – | – 0 | – | ||||
Swaptions written | 6,462,535 | 13,816 | ||||||
Swaptions expired | (2,702,535 | ) | (4,484 | ) | ||||
Swaptions bought back | – 0 | – | – 0 | – | ||||
Swaptions exercised | – 0 | – | – 0 | – | ||||
|
|
|
| |||||
Swaptions written outstanding as of 10/31/14 | 3,760,000 | $ | 9,332 | |||||
|
|
|
| |||||
| * | Commencement of operations. |
| • | Swaps |
The Portfolio may enter into swaps to hedge its exposure to interest rates, credit risk, or currencies. The Portfolio may also enter into swaps for non-hedging purposes as a means of gaining market exposures including by making direct investments in foreign currencies, as described below under “Currency Transactions”. A swap is an agreement that obligates two parties to exchange a series of cash flows at specified intervals based upon or calculated by reference to changes in specified prices or rates for a specified amount of an underlying asset. The payment flows are usually netted against each other, with the difference being paid by one party to the other. In addition, collateral may be pledged or received by the Portfolio in accordance with the terms of the respective swaps to provide value and recourse to the Portfolio or its counterparties in the event of default, bankruptcy or insolvency by one of the parties to the swap.
| ALLIANCEBERNSTEIN HIGH YIELD PORTFOLIO • | 55 |
Notes to Financial Statements
Risks may arise as a result of the failure of the counterparty to the swap to comply with the terms of the swap. The loss incurred by the failure of a counterparty is generally limited to the net interim payment to be received by the Portfolio, and/or the termination value at the end of the contract. Therefore, the Portfolio considers the creditworthiness of each counterparty to a swap in evaluating potential counterparty risk. This risk is mitigated by having a netting arrangement between the Portfolio and the counterparty and by the posting of collateral by the counterparty to the Portfolio to cover the Portfolio’s exposure to the counterparty. Additionally, risks may arise from unanticipated movements in interest rates or in the value of the underlying securities. The Portfolio accrues for the interim payments on swaps on a daily basis, with the net amount recorded within unrealized appreciation/depreciation of swaps on the statement of assets and liabilities, where applicable. Once the interim payments are settled in cash, the net amount is recorded as realized gain/(loss) on swaps on the statement of operations, in addition to any realized gain/(loss) recorded upon the termination of swaps. Upfront premiums paid or received are recognized as cost or proceeds on the statement of assets and liabilities and are amortized on a straight line basis over the life of the contract. Amortized upfront premiums are included in net realized gain/(loss) from swaps on the statement of operations. Fluctuations in the value of swaps are recorded as a component of net change in unrealized appreciation/depreciation of swaps on the statement of operations.
Certain standardized swaps, including certain interest rate swaps and credit default swaps, are (or soon will be) subject to mandatory central clearing. Cleared swaps are transacted through futures commission merchants (“FCMs”) that are members of central clearinghouses, with the clearinghouse serving as central counterparty, similar to transactions in futures contracts. Centralized clearing will be required for additional categories of swaps on a phased-in basis based on requirements published by the Securities Exchange Commission and Commodity Futures Trading Commission.
At the time the Portfolio enters into a centrally cleared swap, the Portfolio deposits and maintains as collateral an initial margin with the broker, as required by the exchange on which the transaction is effected. Such amount of shown as due from broker on the statement of assets and liabilities. Pursuant to the contract, the Portfolio agrees to receive from or pay to the broker an amount of cash equal to the daily fluctuation in the value of the contract.
Such receipts or payments are known as variation margin and are recorded by the Portfolio as unrealized gains or losses. Risks may arise from the potential inability of a counterparty to meet the terms of the contract. The credit/counterparty risk for swaps cleared through a central clearinghouse’s exchange is generally less than privately negotiated swaps,
| 56 | • ALLIANCEBERNSTEIN HIGH YIELD PORTFOLIO |
Notes to Financial Statements
since the clearinghouse, which is the issuer or counterparty to each exchange-traded swap, has robust risk mitigation standards, including the requirement to provide initial and variation margin. When the contract is closed, the Portfolio records a realized gain or loss equal to the difference between the value of the contract at the time it was opened and the time it was closed.
Credit Default Swaps:
The Portfolio may enter into credit default swaps, including to manage its exposure to the market or certain sectors of the market, to reduce its risk exposure to defaults by corporate and sovereign issuers held by the Portfolio, or to create exposure to corporate or sovereign issuers to which it is not otherwise exposed. The Portfolio may purchase credit protection (“Buy Contract”) or provide credit protection (“Sale Contract”) on the referenced obligation of the credit default swap. During the term of the swap agreement, the Portfolio receives/(pays) fixed payments from/(to) the respective counterparty, calculated at the agreed upon interest rate applied to the notional amount. If the Portfolio is a buyer/(seller) of protection and a credit event occurs, as defined under the terms of the swap agreement, the Portfolio will either (i) receive from the seller/(pay to the buyer) of protection an amount equal to the notional amount of the swap contract (the “Maximum Payout Amount”) and deliver/(take delivery of) the referenced obligation or (ii) receive/(pay) a net settlement amount in the form of cash or securities equal to the notional amount of the swap less the recovery value of the referenced obligation.
In certain circumstances Maximum Payout Amounts may be partially offset by recovery values of the respective referenced obligations, upfront premium received upon entering into the agreement, or net amounts received from settlement of buy protection credit default swap agreements entered into by the Portfolio for the same reference obligation with the same counterparty. As of October 31, 2014, the Portfolio had Buy Contracts outstanding with respect to the same referenced obligation and counterparty as certain Sale Contracts which may partially offset the Maximum Payout Amount in the amount of $1,030,000.
Credit default swaps may involve greater risks than if the Portfolio had invested in the referenced obligation directly. Credit default swaps are subject to general market risk, liquidity risk, counterparty risk and credit risk. If the Portfolio is a buyer of protection and no credit event occurs, it will lose its investment. If the Portfolio is a seller of protection and a credit event occurs, the value of the referenced obligation received by the Portfolio coupled with the periodic payments previously received may be less than the Maximum Payout Amount it pays to the buyer, resulting in a net loss to the Portfolio.
| ALLIANCEBERNSTEIN HIGH YIELD PORTFOLIO • | 57 |
Notes to Financial Statements
Implied credit spreads over U.S. Treasuries of comparable maturity utilized in determining the market value of credit default swaps on issuers as of period end are disclosed in the portfolio of investments. The implied spreads serve as an indicator of the current status of the payment/performance risk and typically reflect the market’s assessment of the likelihood of default by the issuer of the referenced obligation. The implied credit spread of a particular reference entity reflects the cost of buying/selling protection and may include upfront payments required to be made to enter into the agreement. Widening credit spreads typically represent a deterioration of the referenced entity’s credit soundness and greater likelihood of default or other credit event occurring as defined under the terms of the agreement. A credit spread identified as “Defaulted” indicates a credit event has occurred for the referenced entity or obligation.
During the period ended October 31, 2014, the Portfolio held credit default swaps for hedging and non-hedging purposes.
Total Return Swaps:
The Portfolio may enter into total return swaps in order take a “long” or “short” position with respect to an underlying referenced asset. The Portfolio is subject to market price volatility of the underlying referenced asset. A total return swap involves commitments to pay interest in exchange for a market linked return based on a notional amount. To the extent that the total return of the security, group of securities or index underlying the transaction exceeds or falls short of the offsetting interest obligation, the Portfolio will receive a payment from or make a payment to the counterparty.
During the period ended October 31, 2014, the Portfolio held total return swaps for non-hedging purposes.
The Portfolio typically enters into International Swaps and Derivatives Association, Inc. Master Agreements (“ISDA Master Agreement”) or similar master agreements (collectively, “Master Agreements”) with its OTC derivative contract counterparties in order to, among other things, reduce its credit risk to counterparties. ISDA Master Agreements include provisions for general obligations, representations, collateral and events of default or termination. Under an ISDA Master Agreement, the Portfolio typically may offset with the counterparty certain derivative financial instrument’s payables and/or receivables with collateral held and/or posted and create one single net payment (close-out netting) in the event of default or termination.
Various master agreements govern the terms of certain transactions with counterparties, including transactions such as exchange-traded derivative transactions, repurchase and reverse repurchase agreements. These Master Agreements typically attempt to reduce the counterparty risk associated with such transactions by specifying credit protection mechanisms and providing standardization that
| 58 | • ALLIANCEBERNSTEIN HIGH YIELD PORTFOLIO |
Notes to Financial Statements
improves legal certainty. Cross-termination provisions under Master Agreements typically provide that a default in connection with one transaction between the Portfolio and a counterparty gives the non-defaulting party the right to terminate any other transactions in place with the defaulting party to create one single net payment due to/due from the defaulting party. In the event of a default by a Master Agreements counterparty, the return of collateral with market value in excess of the Portfolio’s net liability, held by the defaulting party, may be delayed or denied.
The Portfolio’s Master Agreements may contain provisions for early termination of OTC derivative transactions in the event the net assets of the Portfolio decline below specific levels (“net asset contingent features”). If these levels are triggered, the Portfolio’s counterparty has the right to terminate such transaction and require the Portfolio to pay or receive a settlement amount in connection with the terminated transaction. For additional details, please refer to netting arrangements by counterparty tables below.
At October 31, 2014 the Portfolio had entered into the following derivatives:
Asset Derivatives | Liability Derivatives | |||||||||||
Derivative Type | Statement of | Fair Value | Statement of | Fair Value | ||||||||
Foreign exchange contracts | Unrealized appreciation on forward currency exchange contracts | $ | 16,440 | | Unrealized depreciation on forward currency exchange contracts | $ | 4,232 | | ||||
Credit contracts | Unrealized appreciation on credit default swaps | 12,746 | Unrealized depreciation on credit default swaps | 7,065 | ||||||||
Credit contracts | Receivable/Payable for variation margin on exchange-traded derivatives | 32,552 | * | Receivable/Payable for variation margin on exchange-traded derivatives | 30,683 | * | ||||||
Credit contracts | Investments in securities, at value | �� | 9,699 | Options written, at value | 7,336 | |||||||
Interest Rate contracts | Unrealized appreciation on total return swaps | 8,693 | ||||||||||
Interest Rate contracts | Investment in securities, at value | 11,200 | ||||||||||
| ALLIANCEBERNSTEIN HIGH YIELD PORTFOLIO • | 59 |
Notes to Financial Statements
Asset Derivatives | Liability Derivatives | |||||||||||
Derivative Type | Statement of | Fair Value | Statement of | Fair Value | ||||||||
Equity contracts |
on exchange-traded derivatives | $ | 2,507 | * | ||||||||
Equity contracts | Investment in securities, at value | $ | 31,324 | | Options written, at value | | 13,085 | | ||||
|
|
|
| |||||||||
Total | $ | 122,654 | $ | 64,908 | ||||||||
|
|
|
| |||||||||
| * | Only variation margin receivable/payable at period end is reported within the statement of assets and liabilities. This amount reflects cumulative appreciation/(depreciation) of exchange-traded derivative contracts as reported in the portfolio of investments. |
The effect of derivative instruments on the statement of operations for the period ended October 31, 2014:
Derivative Type | Location of | Realized Gain or (Loss) on Derivatives | Change in Unrealized Appreciation or (Depreciation) | |||||||
Foreign exchange contracts | Net realized gain/(loss) on foreign currency transactions; Net change in unrealized appreciation/depreciation of foreign currency denominated assets and liabilities | $ | 69,995 |
| $ | 12,208 |
| |||
Foreign exchange contracts | Net realized gain/(loss) on investment transactions; Net change in unrealized appreciation/depreciation of investment transactions |
| (4,624 | ) |
| – 0 | – | |||
Credit contracts | Net realized gain/(loss) on investment transactions; Net change in unrealized appreciation/depreciation of investment transactions | (8,922 | ) | (3,621 | ) | |||||
| 60 | • ALLIANCEBERNSTEIN HIGH YIELD PORTFOLIO |
Notes to Financial Statements
Derivative Type | Location of | Realized Gain or (Loss) on Derivatives | Change in Unrealized Appreciation or (Depreciation) | |||||||
Credit contracts | Net realized gain/(loss) on swaps; Net change in unrealized appreciation/ depreciation of swaps | $ | 7,291 | $ | 7,550 | |||||
Credit Contracts | Net realized gain/(loss) on options written; Net change in unrealized appreciation/depreciation of options written | 4,484 | 1,995 | |||||||
Interest rate contracts | Net realized gain/(loss) on investment transactions; Net change in unrealized appreciation/depreciation of investment transactions | – 0 – | 4,778 | |||||||
Interest rate contracts | Net realized gain/(loss) on swaps; Net change in unrealized appreciation/ depreciation of swaps | 2,956 | 8,693 | |||||||
Equity contracts | Net realized gain/(loss) on futures; Net change in unrealized appreciation/depreciation of futures | (2 | ) | (2,507 | ) | |||||
Equity contracts | Net realized gain/(loss) on investment transactions; Net change in unrealized appreciation/depreciation of investment transactions | 34,210 | (17,692 | ) | ||||||
Equity contracts | Net realized gain/(loss) on options written; Net change in unrealized appreciation/depreciation of options written | (6,847 | ) | (791 | ) | |||||
|
|
|
| |||||||
Total | $ | 98,541 | $ | 10,613 | ||||||
|
|
|
| |||||||
| ALLIANCEBERNSTEIN HIGH YIELD PORTFOLIO • | 61 |
Notes to Financial Statements
The following table represents the volume of the Portfolio’s derivative transactions during the period ended October 31, 2014:
Centrally Cleared Credit Default Swaps: | ||||
Average notional amount of buy contracts | $ | 990,000 | (a) | |
Average notional amount of sale contracts | $ | 990,000 | (a) | |
Credit Default Swaps: | ||||
Average notional amount of buy contracts | $ | 60,000 | (b) | |
Average notional amount of sale contracts | $ | 1,349,202 | (c) | |
Forward Currency Exchange Contracts: | ||||
Average principal amount of buy contracts | $ | 427,448 | (c) | |
Average principal amount of sale contracts | $ | 1,575,280 | (c) | |
Futures: | ||||
Average notional amount of sale contracts | $ | 98,063 | (a) | |
Total Return Swaps: | ||||
Average notional amount | $ | 398,667 | (d) | |
Purchased Options Contracts: | ||||
Average monthly cost | $ | 36,371 | (c) |
| (a) | Positions were open for one month during the period. |
| (b) | Positions were open for two months during the period. |
| (c) | Positions were open for four months during the period. |
| (d) | Positions were open for three months during the period. |
For financial reporting purposes, the Portfolio does not offset derivative assets and derivative liabilities that are subject to netting arrangements in the statement of assets and liabilities.
All derivatives at period end were subject to netting arrangements. The following tables present the Portfolio’s derivative assets and liabilities by counterparty net of amounts available for offset under Master Agreements (“MA”) and net of the related collateral received/pledged by the Portfolio as of October 31, 2014:
Counterparty | Derivative Assets Subject to a MA | Derivatives Available for Offset | Cash Collateral Received | Security Collateral Received | Net Amount of Derivatives Assets | |||||||||||||||
Exchange-Traded Derivatives: | ||||||||||||||||||||
Citigroup Global Markets, Inc. | $ | – 0 | – | $ | – 0 | – | $ | – 0 | – | $ | – 0 | – | $ | – 0 | – | |||||
Morgan Stanley & Co., LLC* | 42,345 | (14,225 | ) | – 0 | – | – 0 | – | 28,120 | ||||||||||||
|
|
|
|
|
|
|
|
|
| |||||||||||
Total | $ | 42,345 | $ | (14,225 | ) | $ | – 0 | – | $ | – 0 | – | $ | 28,120 | |||||||
|
|
|
|
|
|
|
|
|
| |||||||||||
OTC Derivatives: | ||||||||||||||||||||
Bank of America, N.A. | 10,481 | (6,479 | ) | – 0 | – | – 0 | – | 4,002 | ||||||||||||
Barclays Bank PLC | 1,411 | – 0 | – | – 0 | – | – 0 | – | 1,411 | ||||||||||||
Brown Brothers Harriman & Co. | 12,401 | (3,598 | ) | – 0 | – | – 0 | – | 8,803 | ||||||||||||
Goldman Sachs Bank USA | 665 | (35 | ) | – 0 | – | – 0 | – | 630 | ||||||||||||
Goldman Sachs International | 26,210 | (857 | ) | – 0 | – | – 0 | – | 25,353 | ||||||||||||
JPMorgan Chase Bank, N.A | 16,619 | – 0 | – | – 0 | – | – 0 | – | 16,619 | ||||||||||||
| 62 | • ALLIANCEBERNSTEIN HIGH YIELD PORTFOLIO |
Notes to Financial Statements
Counterparty | Derivative Assets Subject to a MA | Derivatives Available for Offset | Cash Collateral Received | Security Collateral Received | Net Amount of Derivatives Assets | |||||||||||||||
Morgan Stanley & Co. International PLC | $ | 84,815 | $ | (4,537 | ) | $ | – 0 | – | $ | – 0 | – | $ | 80,278 | |||||||
Royal Bank of Scotland PLC | 904 | (599 | ) | – 0 | – | – 0 | – | 305 | ||||||||||||
|
|
|
|
|
|
|
|
|
| |||||||||||
Total | $ | 153,506 | $ | (16,105 | ) | $ | – 0 | – | $ | – 0 | – | $ | 137,401 | ^ | ||||||
|
|
|
|
|
|
|
|
|
| |||||||||||
Counterparty | Derivative Liabilities Subject to a MA | Derivatives Available for Offset | Cash Collateral Pledged | Security Collateral Pledged | Net Amount of Derivatives Liabilities | |||||||||||||||
Exchange-Traded Derivatives: | ||||||||||||||||||||
Citigroup Global Markets, Inc. | $ | – 0 | – | $ | – 0 | – | $ | – 0 | – | $ | – 0 | – | $ | – 0 | – | |||||
Morgan Stanley & Co., LLC* | 14,225 | (14,225 | ) | – 0 | – | – 0 | – | – 0 | – | |||||||||||
|
|
|
|
|
|
|
|
|
| |||||||||||
Total | $ | 14,225 | $ | (14,225 | ) | $ | – 0 | – | $ | – 0 | – | $ | – 0 | – | ||||||
|
|
|
|
|
|
|
|
|
| |||||||||||
OTC Derivatives: | ||||||||||||||||||||
Bank of America, N.A. | 6,479 | (6,479 | ) | – 0 | – | – 0 | – | – 0 | – | |||||||||||
Brown Brothers Harriman & Co. | 3,598 | (3,598 | ) | – 0 | – | – 0 | – | – 0 | – | |||||||||||
Credit Suisse International | 1,376 | - 0 | - | – 0 | – | – 0 | – | 1,376 | ||||||||||||
Goldman Sachs Bank USA | 35 | (35 | ) | – 0 | – | – 0 | – | – 0 | – | |||||||||||
Goldman Sachs International | 857 | (857 | ) | – 0 | – | – 0 | – | – 0 | – | |||||||||||
Morgan Stanley & Co. International PLC | 4,537 | (4,537 | ) | – 0 | – | – 0 | – | – 0 | – | |||||||||||
Royal Bank of Scotland PLC | 599 | (599 | ) | – 0 | – | – 0 | – | – 0 | – | |||||||||||
|
|
|
|
|
|
|
|
|
| |||||||||||
Total | $ | 17,481 | $ | (16,105 | ) | $ | – 0 | – | $ | – 0 | – | $ | 1,376 | ^ | ||||||
|
|
|
|
|
|
|
|
|
| |||||||||||
| * | Cash has been posted for initial margin requirements for exchange-traded derivatives outstanding at October 31, 2014. |
| ^ | Net amount represents the net receivable/payable that would be due from/to the counterparty in the event of default or termination. The net amount from OTC financial derivative instruments can only be netted across transactions governed under the same master agreement with the same counterparty. |
2. Currency Transactions
The Portfolio may invest in non-U.S. dollar securities on a currency hedged or unhedged basis. The Portfolio may seek investment opportunities by taking long or short positions in currencies through the use of currency-related derivatives, including forward currency exchange contracts, futures and options on futures, swaps, and other options. The Portfolio may enter into transactions for investment opportunities when it anticipates that a foreign currency will appreciate or depreciate in value but securities denominated in that currency are not held by the Portfolio and do not present attractive investment opportunities. Such transactions may also be used when the Adviser believes that it may be more efficient than a direct investment in a foreign currency-denominated security. The Portfolio may also conduct currency exchange contracts on a spot basis (i.e., for cash at the spot rate prevailing in the currency exchange market for buying or selling currencies).
| ALLIANCEBERNSTEIN HIGH YIELD PORTFOLIO • | 63 |
Notes to Financial Statements
NOTE E
Capital Stock
Each class consists of 3,000,000,000 authorized shares. Transactions in capital shares for each class were as follows:
| Shares | Amount | |||||||||||
| July 15,2014* to October 31, 2014 | July 15,2014* to October 31, 2014 | |||||||||||
|
| |||||||||||
| Class A | ||||||||||||
Shares sold | 2,929 | $ | 29,153 | |||||||||
| ||||||||||||
Shares issued in reinvestment of dividends | 10 | 102 | ||||||||||
| ||||||||||||
Net increase | 2,939 | $ | 29,255 | |||||||||
| ||||||||||||
| Class C | ||||||||||||
Shares sold | 1,000 | $ | 10,002 | |||||||||
| ||||||||||||
Net increase | 1,000 | $ | 10,002 | |||||||||
| ||||||||||||
| Advisor Class | ||||||||||||
Shares sold | 13,778 | $ | 136,502 | |||||||||
| ||||||||||||
Shares issued in reinvestment of dividends | 13 | 124 | ||||||||||
| ||||||||||||
Net increase | 13,791 | $ | 136,626 | |||||||||
| ||||||||||||
| Class R | ||||||||||||
Shares sold | 1,000 | $ | 10,002 | |||||||||
| ||||||||||||
Net increase | 1,000 | $ | 10,002 | |||||||||
| ||||||||||||
| Class K | ||||||||||||
Shares sold | 1,000 | $ | 10,002 | |||||||||
| ||||||||||||
Net increase | 1,000 | $ | 10,002 | |||||||||
| ||||||||||||
| Class I | ||||||||||||
Shares sold | 1,994,000 | $ | 19,940,002 | |||||||||
| ||||||||||||
Net increase | 1,994,000 | 19,940,002 | ||||||||||
| ||||||||||||
| Class Z | ||||||||||||
Shares sold | 1,000 | $ | 10,002 | |||||||||
| ||||||||||||
Net increase | 1,000 | $ | 10,002 | |||||||||
| ||||||||||||
| * | Commencement of operations. |
At October 31, 2014, the Adviser owns approximately 99.27% of the Portfolio’s outstanding shares.
NOTE F
Risks Involved in Investing in the Portfolio
Interest Rate Risk and Credit Risk—Interest rate risk is the risk that changes in interest rates will affect the value of the Portfolio’s investments in fixed-income debt securities such as bonds or notes. Increases in interest rates may cause the value of the Portfolio’s investments to decline. Credit risk is the risk that the issuer or guarantor of a debt security, or the counterparty to a derivative contract, will be unable or unwilling to make timely principal and/or interest payments, or to otherwise honor its obligations. The degree of risk for a particular security may be reflected in its credit rating. Credit risk is greater for medium
| 64 | • ALLIANCEBERNSTEIN HIGH YIELD PORTFOLIO |
Notes to Financial Statements
quality and lower-rated securities. Lower-rated debt securities and similar unrated securities (commonly known as “junk bonds”) have speculative elements or are predominantly speculative risks.
Liquidity Risk—Liquidity risk exists when particular investments are difficult to purchase or sell, possibly preventing the Portfolio from selling out of these illiquid or relatively less liquid securities at an advantageous price. Causes of liquidity risk may include low trading volume, lack of a market maker, a large position, heavy redemptions, or legal restrictions that limit or prevent a Portfolio from selling securities or closing derivative positions at desirable prices or opportune times. Over recent years, the capacity of dealers to make markets in fixed income securities has been outpaced by the growth in the size of the fixed income markets. Liquidity risk may be magnified in a rising interest rate environment, where the value and liquidity of fixed income securities generally go down. Derivatives and securities involving substantial market and credit risk tend to involve greater liquidity risk. To the extent a Portfolio invests in municipal securities, the Portfolio is subject to more liquidity risk because the market for municipal securities is generally smaller than many other markets. Illiquid securities and relatively less liquid securities may also be difficult to value.
Redemption Risk—A Portfolio may experience heavy redemptions that could cause the Portfolio to liquidate its assets at inopportune times or at a loss or depressed value, which could cause the value of your investment to decline.
Foreign Securities Risk—Investing in securities of foreign companies or foreign governments involves special risks which include changes in foreign currency exchange rates and the possibility of future political and economic developments which could adversely affect the value of such securities. Moreover, securities of many foreign companies or foreign governments and their markets may be less liquid and their prices more volatile than those of comparable U.S. companies and the U.S. government.
Emerging Market Risk—Investments in emerging market countries may have more risk because the markets are less developed and less liquid as well as being subject to increased economic, political, regulatory or other uncertainties.
Inflation Risk—This is the risk that the value of assets or income from investments will be less in the future as inflation decreases the value of money. As inflation increases, the value of the Portfolio’s assets can decline as can the value of the Portfolio’s distributions. This risk is significantly greater if the Portfolio invests a significant portion of its assets in fixed-income securities with longer maturities.
Currency Risk—This is the risk that changes in foreign currency exchange rates may negatively affect the value of the Portfolio’s investments or reduce the returns of the Portfolio. For example, the value of the Portfolio’s investments in
| ALLIANCEBERNSTEIN HIGH YIELD PORTFOLIO • | 65 |
Notes to Financial Statements
foreign currency-denominated securities or currencies may decrease if the U.S. Dollar is strong (i.e., gaining value relative to other currencies) and other currencies are weak (i.e., losing value relative to the U.S. Dollar). Currency markets are generally not as regulated as securities markets. Independent of the Portfolio’s investments in securities denominated in foreign currencies, the Portfolio’s positions in various foreign currencies may cause the Portfolio to experience investment losses due to the changes in exchange rates and interest rates.
Derivatives Risk—The Portfolio may enter into derivative transactions such as forwards, options, futures and swaps. Derivatives may be illiquid, difficult to price, and leveraged so that small changes may produce disproportionate losses for the Portfolio, and subject to counterparty risk to a greater degree than more traditional investments. Derivatives may result in significant losses, including losses that are far greater than the value of the derivatives reflected on the statement of assets and liabilities.
Leverage Risk—When the Portfolio borrows money or otherwise leverages its investments, its performance may be volatile because leverage tends to exaggerate the effect of any increase or decrease in the value of the Portfolio’s investments. The Portfolio may create leverage through the use of reverse repurchase arrangements, forward currency exchange contracts, forward commitments, dollar rolls or futures contracts or by borrowing money. The use of derivative instruments by the Portfolio, such as forwards, futures, options and swaps, may also result in a form of leverage. Leverage may result in higher returns to the Portfolio than if the Portfolio were not leveraged, but may also adversely affect returns, particularly if the market is declining.
Indemnification Risk—In the ordinary course of business, the Portfolio enters into contracts that contain a variety of indemnifications. The Portfolio’s maximum exposure under these arrangements is unknown. However, the Portfolio has not had prior claims or losses pursuant to these indemnification provisions and expects the risk of loss thereunder to be remote. Therefore, the Portfolio has not accrued any liability in connection with these indemnification provisions.
NOTE G
Joint Credit Facility
A number of open-end mutual funds managed by the Adviser, including the Portfolio, participate in a $280 million revolving credit facility (the “Facility”) intended to provide short-term financing if necessary, subject to certain restrictions, in connection with abnormal redemption activity. Commitment fees related to the Facility are paid by the participating funds and are included in miscellaneous expenses in the statement of operations. The Portfolio did not utilize the Facility during the period ended October 31, 2014.
| 66 | • ALLIANCEBERNSTEIN HIGH YIELD PORTFOLIO |
Notes to Financial Statements
NOTE H
Distributions to Shareholders
The tax character of distributions paid during the fiscal period were as follows:
| 2014 | ||||
Distributions paid from: | ||||
Ordinary income | $ | 203,832 | ||
|
| |||
Total taxable distributions paid | $ | 203,832 | ||
|
| |||
As of October 31, 2014, the components of accumulated earnings/(deficit) on a tax basis were as follows:
Undistributed ordinary income | $ | 166,021 | ||
Unrealized appreciation/(depreciation) | (279,262 | )(a) | ||
|
| |||
Total accumulated earnings/(deficit) | $ | (113,241 | )(b) | |
|
|
| (a) | The differences between book-basis and tax-basis unrealized appreciation/(depreciation) are attributable primarily to the tax deferral of losses on wash sales, the tax treatment of swaps, and the realization for tax purposes of gains/losses on certain derivative instruments. |
| (b) | The differences between book-basis and tax-basis components of accumulated earnings/ (deficit) are attributable primarily to the amortization of offering costs and dividends payable. |
For tax purposes, net capital losses may be carried over to offset future capital gains, if any. Funds are permitted to carry forward capital losses incurred in taxable years beginning after December 22, 2010 for an indefinite period, and such losses will retain their character as either short-term or long-term capital losses. As of October 31, 2014, the Portfolio did not have any capital loss carryforwards.
During the current period, permanent differences primarily due to foreign currency reclassifications, the tax treatment of swaps, options, and futures, reclassifications of paydown gains/losses, and the tax treatment of offering costs resulted in a net decrease in distributions in excess of net investment income, a net decrease in accumulated net realized gain on investment and foreign currency transactions, and a net decrease in additional paid-in capital. These reclassifications had no effect on net assets.
NOTE I
Subsequent Events
Management has evaluated subsequent events for possible recognition or disclosure in the financial statements through the date the financial statements are issued. Management has determined that there are no material events that would require disclosure in the Portfolio’s financial statements through this date.
| ALLIANCEBERNSTEIN HIGH YIELD PORTFOLIO • | 67 |
Notes to Financial Statements
FINANCIAL HIGHLIGHTS
Selected Data For A Share Of Capital Stock Outstanding Throughout Each Period
| Class A | ||||
| July 15, 2014(a) to October 31, | ||||
| 2014 | ||||
|
| |||
Net asset value, beginning of period | $ 10.00 | |||
|
| |||
Income From Investment Operations | ||||
Net investment income(b)(c) | .10 | |||
Net realized and unrealized loss on investment and foreign currency transactions | (.10 | ) | ||
|
| |||
Net increase in net asset value from operations | .00 | |||
|
| |||
Less: Dividends | ||||
Dividends from net investment income | (.09 | ) | ||
|
| |||
Net asset value, end of period | $ 9.91 | |||
|
| |||
Total Return | ||||
Total investment return based on net asset value(d) | 0.04 | % | ||
Ratios/Supplemental Data | ||||
Net assets, end of period (000’s omitted) | $29 | |||
Ratio to average net assets of: | ||||
Expenses, net of waivers/reimbursements(e) | 1.05 | % | ||
Expenses, before waivers/reimbursements(e) | 49.84 | % | ||
Net investment income(c)(e) | 3.41 | % | ||
Portfolio turnover rate | 5 | % | ||
See footnote summary on page 74.
| 68 | • ALLIANCEBERNSTEIN HIGH YIELD PORTFOLIO |
Financial Highlights
Selected Data For A Share Of Capital Stock Outstanding Throughout Each Period
| Class C | ||||
| July 15, 2014(a) to October 31, | ||||
| 2014 | ||||
|
| |||
Net asset value, beginning of period | $ 10.00 | |||
|
| |||
Income From Investment Operations | ||||
Net investment income(b)(c) | .07 | |||
Net realized and unrealized loss on investment and foreign currency transactions | (.09 | ) | ||
|
| |||
Net decrease in net asset value from operations | (.02 | ) | ||
|
| |||
Less: Dividends | ||||
Dividends from net investment income | (.07 | ) | ||
|
| |||
Net asset value, end of period | $ 9.91 | |||
|
| |||
Total Return | ||||
Total investment return based on net asset value(d) | (0.18 | )% | ||
Ratios/Supplemental Data | ||||
Net assets, end of period (000’s omitted) | $10 | |||
Ratio to average net assets of: | ||||
Expenses, net of waivers/reimbursements(e) | 1.80 | % | ||
Expenses, before waivers/reimbursements(e) | 56.89 | % | ||
Net investment income(c)(e) | 2.28 | % | ||
Portfolio turnover rate | 5 | % | ||
See footnote summary on page 74.
| ALLIANCEBERNSTEIN HIGH YIELD PORTFOLIO • | 69 |
Financial Highlights
Selected Data For A Share Of Capital Stock Outstanding Throughout Each Period
| Advisor Class | ||||
| July 15, 2014(a) to October 31, | ||||
| 2014 | ||||
|
| |||
Net asset value, beginning of period | $ 10.00 | |||
|
| |||
Income From Investment Operations | ||||
Net investment income(b)(c) | .10 | |||
Net realized and unrealized loss on investment and foreign currency transactions | (.09 | ) | ||
|
| |||
Net increase in net asset value from operations | .01 | |||
|
| |||
Less: Dividends | ||||
Dividends from net investment income | (.10 | ) | ||
|
| |||
Net asset value, end of period | $ 9.91 | |||
|
| |||
Total Return | ||||
Total investment return based on net asset value(d) | 0.14 | % | ||
Ratios/Supplemental Data | ||||
Net assets, end of period (000’s omitted) | $137 | |||
Ratio to average net assets of: | ||||
Expenses, net of waivers/reimbursements(e) | 0.80 | % | ||
Expenses, before waivers/reimbursements(e) | 33.51 | % | ||
Net investment income(c)(e) | 3.26 | % | ||
Portfolio turnover rate | 5 | % | ||
See footnote summary on page 74.
| 70 | • ALLIANCEBERNSTEIN HIGH YIELD PORTFOLIO |
Financial Highlights
Selected Data For A Share Of Capital Stock Outstanding Throughout Each Period
| Class R | ||||
| July 15, 2014(a) to October 31, | ||||
| 2014 | ||||
|
| |||
Net asset value, beginning of period | $ 10.00 | |||
|
| |||
Income From Investment Operations | ||||
Net investment income(b)(c) | .08 | |||
Net realized and unrealized loss on investment and foreign currency transactions | (.08 | ) | ||
|
| |||
Net increase in net asset value from operations | .00 | |||
|
| |||
Less: Dividends | ||||
Dividends from net investment income | (.09 | ) | ||
|
| |||
Net asset value, end of period | $ 9.91 | |||
|
| |||
Total Return | ||||
Total investment return based on net asset value(d) | (0.03 | )% | ||
Ratios/Supplemental Data | ||||
Net assets, end of period (000’s omitted) | $10 | |||
Ratio to average net assets of: | ||||
Expenses, net of waivers/reimbursements(e) | 1.30 | % | ||
Expenses, before waivers/reimbursements(e) | 4.84 | % | ||
Net investment income(c)(e) | 2.78 | % | ||
Portfolio turnover rate | 5 | % | ||
See footnote summary on page 74.
| ALLIANCEBERNSTEIN HIGH YIELD PORTFOLIO • | 71 |
Financial Highlights
Selected Data For A Share Of Capital Stock Outstanding Throughout Each Period
| Class K | ||||
| July 15, 2014(a) to October 31, | ||||
| 2014 | ||||
|
| |||
Net asset value, beginning of period | $ 10.00 | |||
|
| |||
Income From Investment Operations | ||||
Net investment income(b)(c) | .09 | |||
Net realized and unrealized loss on investment and foreign currency transactions | (.09 | ) | ||
|
| |||
Net increase in net asset value from operations | .00 | |||
|
| |||
Less: Dividends | ||||
Dividends from net investment income | (.09 | ) | ||
|
| |||
Net asset value, end of period | $ 9.91 | |||
|
| |||
Total Return | ||||
Total investment return based on net asset value(d) | 0.05 | % | ||
Ratios/Supplemental Data | ||||
Net assets, end of period (000’s omitted) | $10 | |||
Ratio to average net assets of: | ||||
Expenses, net of waivers/reimbursements(e) | 1.05 | % | ||
Expenses, before waivers/reimbursements(e) | 4.56 | % | ||
Net investment income(c)(e) | 3.03 | % | ||
Portfolio turnover rate | 5 | % | ||
See footnote summary on page 74.
| 72 | • ALLIANCEBERNSTEIN HIGH YIELD PORTFOLIO |
Financial Highlights
Selected Data For A Share Of Capital Stock Outstanding Throughout Each Period
| Class I | ||||
| July 15, 2014(a) to October 31, | ||||
| 2014 | ||||
|
| |||
Net asset value, beginning of period | $ 10.00 | |||
|
| |||
Income From Investment Operations | ||||
Net investment income(b)(c) | .10 | |||
Net realized and unrealized loss on investment and foreign currency transactions | (.09 | ) | ||
|
| |||
Net increase in net asset value from operations | .01 | |||
|
| |||
Less: Dividends | ||||
Dividends from net investment income | (.10 | ) | ||
|
| |||
Net asset value, end of period | $ 9.91 | |||
|
| |||
Total Return | ||||
Total investment return based on net asset value(d) | 0.12 | % | ||
Ratios/Supplemental Data | ||||
Net assets, end of period (000’s omitted) | $19,757 | |||
Ratio to average net assets of: | ||||
Expenses, net of waivers/reimbursements(e) | .80 | % | ||
Expenses, before waivers/reimbursements(e) | 4.27 | % | ||
Net investment income(c)(e) | 3.29 | % | ||
Portfolio turnover rate | 5 | % | ||
See footnote summary on page 74.
| ALLIANCEBERNSTEIN HIGH YIELD PORTFOLIO • | 73 |
Financial Highlights
Selected Data For A Share Of Capital Stock Outstanding Throughout Each Period
| Class Z | ||||
| July 15, 2014(a) to October 31, | ||||
| 2014 | ||||
|
| |||
Net asset value, beginning of period | $ 10.00 | |||
|
| |||
Income From Investment Operations | ||||
Net investment income(b)(c) | .10 | |||
Net realized and unrealized loss on investment and foreign currency transactions | (.09 | ) | ||
|
| |||
Net increase in net asset value from operations | .01 | |||
|
| |||
Less: Dividends | ||||
Dividends from net investment income | (.10 | ) | ||
|
| |||
Net asset value, end of period | $ 9.91 | |||
|
| |||
Total Return | ||||
Total investment return based on net asset value(d) | 0.12 | % | ||
Ratios/Supplemental Data | ||||
Net assets, end of period (000’s omitted) | $10 | |||
Ratio to average net assets of: | ||||
Expenses, net of waivers/reimbursements(e) | 0.80 | % | ||
Expenses, before waivers/reimbursements(e) | 4.30 | % | ||
Net investment income(c)(e) | 3.28 | % | ||
Portfolio turnover rate | 5 | % | ||
| (a) | Commencement of operations. |
| (b) | Based on average shares outstanding. |
| (c) | Net of expenses waived/reimbursed by the Adviser. |
| (d) | Total investment return is calculated assuming an initial investment made at the net asset value at the beginning of the period, reinvestment of all dividends and distributions at net asset value during the period, and redemption on the last day of the period. Initial sales charges or contingent deferred sales charges are not reflected in the calculation of total investment return. Total return does not reflect the deduction of taxes that a shareholder would pay on fund distributions or the redemption of fund shares. Total investment return calculated for a period of less than one year is not annualized. |
| (e) | Annualized. |
See notes to financial statements.
| 74 | • ALLIANCEBERNSTEIN HIGH YIELD PORTFOLIO |
Financial Highlights
REPORT OF INDEPENDENT REGISTERED
PUBLIC ACCOUNTING FIRM
To the Board of Directors of AllianceBernstein Bond Fund, Inc. and Shareholders of AllianceBernstein High Yield Portfolio
We have audited the accompanying statement of assets and liabilities, including the portfolio of investments, of AllianceBernstein High Yield Portfolio (one of the portfolios constituting AllianceBernstein Bond Fund, Inc. (the “Fund”)), as of October 31, 2014, and the related statements of operations, changes in net assets and financial highlights for the period July 15, 2014 (commencement of operations) to October 31, 2014. These financial statements and financial highlights are the responsibility of the Fund’s management. Our responsibility is to express an opinion on these financial statements and financial highlights based on our audit.
We conducted our audit in accordance with the standards of the Public Company Accounting Oversight Board (United States). Those standards require that we plan and perform the audit to obtain reasonable assurance about whether the financial statements and financial highlights are free of material misstatement. We were not engaged to perform an audit of the Fund’s internal control over financial reporting. Our audit included consideration of internal control over financial reporting as a basis for designing audit procedures that are appropriate in the circumstances, but not for the purpose of expressing an opinion on the effectiveness of the Fund’s internal control over financial reporting. Accordingly, we express no such opinion. An audit also includes examining, on a test basis, evidence supporting the amounts and disclosures in the financial statements and financial highlights, assessing the accounting principles used and significant estimates made by management, and evaluating the overall financial statement presentation. Our procedures included confirmation of securities owned as of October 31, 2014, by correspondence with the custodian and others or by other appropriate auditing procedures where replies from others were not received. We believe that our audit provides a reasonable basis for our opinion.
In our opinion, the financial statements and financial highlights referred to above present fairly, in all material respects, the financial position of AllianceBernstein High Yield Portfolio (one of the portfolios constituting AllianceBernstein Bond Fund, Inc.) at October 31, 2014, and the results of its operations, changes in its net assets and financial highlights for the period July 15, 2014 (commencement of operations) to October 31, 2014, in conformity with U.S. generally accepted accounting principles.

New York, New York
December 29, 2014
| ALLIANCEBERNSTEIN HIGH YIELD PORTFOLIO • | 75 |
Report of Independent Registered Public Accounting Firm
2014 FEDERAL TAX INFORMATION
(unaudited)
For Federal income tax purposes, the following information is furnished with respect to the distributions paid by the Portfolio during the taxable period ended October 31, 2014. For foreign shareholders, 50.55% of ordinary dividends paid may be considered to be qualifying to be taxed as interest-related dividends.
Shareholders should not use the above information to prepare their income tax returns. The information necessary to complete your income tax returns will be included with your Form 1099-DIV which will be sent to you separately in January 2015.
| 76 | • ALLIANCEBERNSTEIN HIGH YIELD PORTFOLIO |
BOARD OF DIRECTORS
Marshall C. Turner, Jr.(1) , Chairman John H. Dobkin(1) Michael J. Downey(1) William H. Foulk, Jr.(1) D. James Guzy(1) | Nancy P. Jacklin(1) Robert M. Keith, President and Chief Executive Officer Garry L. Moody(1) Earl D. Weiner(1) |
OFFICERS
Philip L. Kirstein, Senior Vice President and Independent Compliance Officer Gershon M. Distenfeld(2), Vice President Sherif M. Hamid(2), Vice President Ivan Rudolph-Shabinsky(2), Vice President Ashish C. Shah(2), Vice President | Joseph J. Mantineo, Treasurer and Chief Financial Officer Emilie D. Wrapp, Secretary Phyllis J. Clarke, Controller Vincent S. Noto, Chief Compliance Officer |
Custodian and Accounting Agent Brown Brothers Harriman & Co. 50 Post Office Square Boston, MA 02110
Principal Underwriter AllianceBernstein Investments, Inc. 1345 Avenue of the Americas New York, NY 10105
Transfer Agent AllianceBernstein Investor Services, Inc. P.O. Box 786003 San Antonio, TX 78278-6003 Toll-Free (800) 221-5672 | Independent Registered Public Accounting Firm Ernst & Young LLP 5 Times Square New York, NY 10036
Legal Counsel Seward & Kissel LLP One Battery Park Plaza New York, NY 10004 |
| (1) | Member of the Audit Committee, the Governance and Nominating Committee and the Independent Directors Committee. |
| (2) | The day-to-day management of, and investment decisions for, the Fund are made by its senior management team. Messrs. Distenfeld, Hamid, Rudolph-Shabinksy and Shah are the investment professionals with the most significant responsibility for the day-to-day management of the Fund’s portfolio. |
| ALLIANCEBERNSTEIN HIGH YIELD PORTFOLIO • | 77 |
Board of Directors
MANAGEMENT OF THE FUND
NAME, ADDRESS*, AGE, (YEAR FIRST ELECTED**) | PRINCIPAL OCCUPATION(S) DURING PAST FIVE YEARS AND OTHER RELEVANT | PORTFOLIOS IN FUND COMPLEX OVERSEEN BY DIRECTOR | OTHER DIRECTORSHIP HELD BY DIRECTOR IN THE PAST FIVE YEARS | |||||
| INTERESTED DIRECTOR | ||||||||
Robert M. Keith, + 1345 Avenue of the Americas New York, NY 10105 54 (2014) | Senior Vice President of AllianceBernstein L.P. (the “Adviser”) and the head of AllianceBernstein Investments, Inc. (“ABI”) since July 2008; Director of ABI and President of the AllianceBernstein Mutual Funds. Previously, he served as Executive Managing Director of ABI from December 2006 to June 2008. Prior to joining ABI in 2006, Executive Managing Director of Bernstein Global Wealth Management, and prior thereto, Senior Managing Director and Global Head of Client Service and Sales of the Adviser’s institutional investment management business since 2004. Prior thereto, he was Managing Director and Head of North American Client Service and Sales in the Adviser’s institutional investment management business, with which he had been associated since prior to 2004. | 117 | None | |||||
| 78 | • ALLIANCEBERNSTEIN HIGH YIELD PORTFOLIO |
Management of the Fund
NAME, ADDRESS*, AGE, (YEAR FIRST ELECTED**) | PRINCIPAL OCCUPATION(S) DURING PAST FIVE YEARS AND OTHER RELEVANT | PORTFOLIOS IN FUND COMPLEX OVERSEEN BY DIRECTOR | OTHER DIRECTORSHIP HELD BY DIRECTOR IN THE PAST FIVE YEARS | |||||
| DISINTERESTED DIRECTORS | ||||||||
Marshall C. Turner, Jr., # Chairman of the Board 73 (2014) | Private Investor since prior to 2009. Former CEO of Dupont Photomasks, Inc. (components of semi-conductor manufacturing), 2003-2006, and interim CEO 1999-2000. He has extensive operating and early-stage investment experience, including prior service as general partner of three institutional venture capital partnerships, and serves on the boards of three education and science-related non-profit organizations. He has served as a director of one AllianceBernstein fund since 1992, and director or trustee of multiple AllianceBernstein funds since 2005. He has been Chairman of the AllianceBernstein Funds since January 2014, and the Chairman of the Independent Directors Committees of such Funds since February 2014. | 117 | Xilinx, Inc. (programmable logic semi-conductors) and SunEdison, Inc. (semi-conductor substrates, solar materials and solar power plants) since prior to 2009 until July 2014 | |||||
John H. Dobkin, # 72 (2014) | Independent Consultant since prior to 2009. Formerly, President of Save Venice, Inc. (preservation organization) from 2001–2002; Senior Advisor from June 1999-June 2000 and President of Historic Hudson Valley (historic preservation) from December 1989-May 1999. Previously, Director of the National Academy of Design. He has served as a director or trustee of various AllianceBernstein Funds since 1992, and as Chairman of the Audit Committees of a number of such Funds from 2001-2008. | 117 | None | |||||
| ALLIANCEBERNSTEIN HIGH YIELD PORTFOLIO • | 79 |
Management of the Fund
NAME, ADDRESS*, AGE, (YEAR FIRST ELECTED**) | PRINCIPAL OCCUPATION(S) DURING PAST FIVE YEARS AND OTHER RELEVANT | PORTFOLIOS IN FUND COMPLEX OVERSEEN BY DIRECTOR | OTHER DIRECTORSHIP HELD BY DIRECTOR IN THE PAST FIVE YEARS | |||||
| DISINTERESTED DIRECTORS (continued) | ||||||||
Michael J. Downey, # 70 (2014) | Private Investor since prior to 2009. Formerly, managing partner of Lexington Capital, LLC (investment advisory firm) from December 1997 until December 2003. From 1987 until 1993, Chairman and CEO of Prudential Mutual Fund Management, director of the Prudential mutual funds, and member of the Executive Committee of Prudential Securities Inc. He has served as a director or trustee of the AllianceBernstein Funds since 2005 and is a director and Chairman of one other registered investment company. | 117 | Asia Pacific Fund, Inc. (registered investment company) since prior to 2009, Prospect Acquisition Corp. (financial services) from 2007 until 2009, and The Merger Fund (registered investment company) since prior to 2009 until 2013 | |||||
William H. Foulk, Jr., # 82 (2014) | Investment Adviser and an Independent Consultant since prior to 2009. Previously, he was Senior Manager of Barrett Associates, Inc., a registered investment adviser. He was formerly Deputy Comptroller and Chief Investment Officer of the State of New York and, prior thereto, Chief Investment Officer of the New York Bank for Savings. He has served as a director or trustee of various AllianceBernstein Funds since 1983, and was Chairman of the Independent Directors Committees of the AllianceBernstein Funds from 2003 until early February 2014. He served as Chairman of such Funds from 2003 through December 2013. He is also active in a number of mutual fund related organizations and committees. | 117 | None | |||||
| 80 | • ALLIANCEBERNSTEIN HIGH YIELD PORTFOLIO |
Management of the Fund
NAME, ADDRESS*, AGE, (YEAR FIRST ELECTED**) | PRINCIPAL OCCUPATION(S) DURING PAST FIVE YEARS AND OTHER RELEVANT | PORTFOLIOS IN FUND COMPLEX OVERSEEN BY DIRECTOR | OTHER DIRECTORSHIP HELD BY DIRECTOR IN THE PAST FIVE YEARS | |||||
| DISINTERESTED DIRECTORS (continued) | ||||||||
D. James Guzy, # 78 (2014) | Chairman of the Board of SRC Computers, Inc. (semi-conductors), with which he has been associated since prior to 2009. He served as Chairman of the Board of PLX Technology (semi-conductors) since prior to 2009 until November 2013. He was a director of Intel Corporation (semi-conductors) from 1969 until 2008, and served as Chairman of the Finance Committee of such company for several years until May 2008. He has served as a director or trustee of one or more of the AllianceBernstein Funds since 1982. | 117 | PLX Technology (semi-conductors) since prior to 2009 until November 2013, and Cirrus Logic Corporation (semi-conductors) since prior to 2009 until July 2011 | |||||
Nancy P. Jacklin, # 66 (2014) | Professorial Lecturer at the Johns Hopkins School of Advanced International Studies since 2008. Formerly, U.S. Executive Director of the International Monetary Fund (which is responsible for ensuring the stability of the international monetary system), (December 2002-May 2006); Partner, Clifford Chance (1992-2002); Sector Counsel, International Banking and Finance, and Associate General Counsel, Citicorp (1985-1992); Assistant General Counsel (International), Federal Reserve Board of Governors (1982-1985); and Attorney Advisor, U.S. Department of the Treasury (1973-1982). Member of the Bar of the District of Columbia and of New York; and member of the Council on Foreign Relations. She has served as a director or trustee of the AllianceBernstein Funds since 2006 and has been Chairman of the Governance and Nominating Committees of the Funds since August 2014. | 117 | None | |||||
| ALLIANCEBERNSTEIN HIGH YIELD PORTFOLIO • | 81 |
Management of the Fund
NAME, ADDRESS*, AGE, (YEAR FIRST ELECTED**) | PRINCIPAL OCCUPATION(S) DURING PAST FIVE YEARS AND OTHER RELEVANT | PORTFOLIOS IN FUND COMPLEX OVERSEEN BY DIRECTOR | OTHER DIRECTORSHIP HELD BY DIRECTOR IN THE PAST FIVE YEARS | |||||
| DISINTERESTED DIRECTORS (continued) | ||||||||
Garry L. Moody, # 62 (2014) | Independent Consultant. Formerly, Partner, Deloitte & Touche LLP (1995-2008) where he held a number of senior positions, including Vice Chairman, and U.S. and Global Investment Management Practice Managing Partner; President, Fidelity Accounting and Custody Services Company (1993-1995); and Partner, Ernst & Young LLP (1975-1993), where he served as the National Director of Mutual Fund Tax Services and Managing Partner of its Chicago Office Tax department. He is a member of both the Governing Council of the Independent Directors Council (IDC), an organization of independent directors of mutual funds, and the Trustee Advisory Board of BoardIQ, a biweekly publication focused on issues and news affecting directors of mutual funds. He has served as a director or trustee, and as Chairman of the Audit Committees, of the AllianceBernstein Funds since 2008. | 117 | None | |||||
Earl D. Weiner, # 75 (2014) | Of Counsel, and Partner prior to January 2007, of the law firm Sullivan & Cromwell LLP and is a former member of the ABA Federal Regulation of Securities Committee Task Force to draft editions of the Fund Director’s Guidebook. He also serves as a director or trustee of various non-profit organizations and has served as Chairman or Vice Chairman of a number of them. He has served as a director or trustee of the AllianceBernstein Funds since 2007 and served as Chairman of the Governance and Nominating Committees of the AllianceBernstein Funds from 2007 until August 2014. | 117 | None | |||||
| 82 | • ALLIANCEBERNSTEIN HIGH YIELD PORTFOLIO |
Management of the Fund
| * | The address for each of the Fund’s disinterested Directors is c/o AllianceBernstein L.P., Attention: Philip L. Kirstein, 1345 Avenue of the Americas, New York, NY 10105. |
| ** | There is no stated term of office for the Fund’s Directors. |
| *** | The information above includes each Director’s principal occupation during the last five years and other information relating to the experience, attributes and skills relevant to each Director’s qualifications to serve as a Director, which led to the conclusion that each Director should serve as a Director for the Fund. |
| + | Mr. Keith is an “interested person” of the Portfolio as defined in the Investment Company Act of 1940, due to his position as a Senior Vice President of the Adviser. |
| # | Member of the Audit Committee, the Governance and Nominating Committee and the Independent Directors Committee. |
| ALLIANCEBERNSTEIN HIGH YIELD PORTFOLIO • | 83 |
Management of the Fund
Officer Information
Certain information concerning the Fund’s Officers is listed below.
| NAME, ADDRESS*, AND AGE | POSITION(S) HELD WITH FUND | PRINCIPAL OCCUPATION DURING PAST 5 YEARS | ||
Robert M. Keith 54 | President and Chief Executive Officer | See biography above. | ||
Philip L. Kirstein 69 | Senior Vice President and Independent Compliance Officer | Senior Vice President and Independent Compliance Officer of the AllianceBernstein Funds, with which he has been associated since October 2004. Prior thereto, he was Of Counsel to Kirkpatrick & Lockhart, LLP from October 2003 to October 2004, and General Counsel of Merrill Lynch Investment Managers, L.P. since prior to March 2003. | ||
Gershon M. Distenfeld 39 | Vice President | Senior Vice President of the Adviser**, with which he has been associated since prior to 2009. | ||
Sherif M. Hamid 38 | Vice President | Vice President and Portfolio Manager for High Yield of the Adviser**, with which he has been associated with since 2013. Prior to joining the Adviser**, he was at Barclays Capital where he was head of European Credit Strategy from 2011 to 2013, and a U.S. investment-grade credit strategist and U.S. high yield analyst from prior to 2009 to 2011. | ||
Ivan Rudolph-Shabinsky 50 | Vice President | Senior Vice President of the Adviser**, with which he has been associated since prior to 2009. | ||
Ashish C. Shah 44 | Vice President | Senior Vice President, Head of Global Credit, and Chief Diversity Officer at the Adviser**, with which he has been associated since May, 2010. Previously he was a Managing Director and Head of Global Credit Strategy at Barclays Capital since prior to 2009 until May 2010. | ||
Emilie D. Wrapp 58 | Secretary | Senior Vice President, Assistant General Counsel and Assistant Secretary of ABI**, with which she has been associated since prior to 2009. | ||
Joseph J. Mantineo 55 | Treasurer and Chief Financial Officer | Senior Vice President of ABIS**, with which he has been associated since prior to 2009. | ||
Vincent S. Noto 50 | Chief Compliance Officer | Vice President and Mutual Fund Chief Compliance Officer of the Adviser** since 2014. Prior thereto, he was Vice President and Director of Mutual Fund Compliance of the Adviser** since 2009. | ||
Phyllis J. Clarke 53 | Controller | Vice President of ABIS**, with which she has been associated since prior to 2009. |
| 84 | • ALLIANCEBERNSTEIN HIGH YIELD PORTFOLIO |
Management of the Fund
| * | The address for each of the Fund’s Officers is 1345 Avenue of the Americas, New York, NY 10105. |
| ** | The Adviser, ABI and ABIS are affiliates of the Fund. |
| The Fund’s Statement of Additional Information (“SAI”) has additional information about the Fund’s Directors and Officers and is available without charge upon request. Contact your financial representative or AllianceBernstein at 1-(800) 227-4618, or visit www.alliancebernstein.com, for a free prospectus or SAI. |
| ALLIANCEBERNSTEIN HIGH YIELD PORTFOLIO • | 85 |
Management of the Fund
Information Regarding the Review and Approval of the Portfolio’s Advisory Agreement
The disinterested directors (the “directors”) of AllianceBernstein Bond Fund, Inc. (the “Fund”) unanimously approved the application of the Fund’s Investment Advisory Contract (the “Advisory Agreement”) with the Adviser in respect of AllianceBernstein High Yield Portfolio (the “Portfolio”) for an initial two-year period at a meeting held on February 3-5, 2014.
Prior to approval of the Advisory Agreement, the directors had requested from the Adviser, and received and evaluated, extensive materials. They reviewed the proposed Advisory Agreement with the Adviser and with experienced counsel who are independent of the Adviser, who advised on the relevant legal standards. The directors also reviewed an independent evaluation prepared by the Fund’s Senior Officer (who is also the Fund’s Independent Compliance Officer) of the reasonableness of the proposed advisory fee. The directors also reviewed certain supplemental information relating to the Portfolio that had been prepared by the Fund’s Senior Officer. The directors also discussed the proposed approval in private sessions with counsel and the Fund’s Senior Officer.
The directors considered their knowledge of the nature and quality of the services to be provided by the Adviser to the Portfolio gained from their experience as directors or trustees of most of the registered investment companies advised by the Adviser, including the Fund, their overall confidence in the Adviser’s integrity and competence they have gained from that experience, the Adviser’s initiative in identifying and raising potential issues with the directors and its responsiveness, frankness and attention to concerns raised by the directors in the past, including the Adviser’s willingness to consider and implement organizational and operational changes designed to improve investment results and the services provided to the AllianceBernstein Funds. The directors noted that they have four regular meetings each year, at each of which they receive presentations from the Adviser on the investment results of the AllianceBernstein Funds and review extensive materials and information presented by the Adviser.
The directors also considered all other factors they believed relevant, including the specific matters discussed below. In their deliberations, the directors did not identify any particular information that was all-important or controlling, and different directors may have attributed different weights to the various factors. The directors determined that the selection of the Adviser to manage the Portfolio, and the overall arrangements between the Portfolio and the Adviser, as provided in the Advisory Agreement, including the proposed advisory fee, were fair and reasonable in light of the services to be performed, expenses to be incurred and such other matters as the directors considered relevant in the exercise of their business judgment. The material factors and conclusions that formed the basis for the directors’ determinations included the following:
| 86 | • ALLIANCEBERNSTEIN HIGH YIELD PORTFOLIO |
Nature, Extent and Quality of Services to be Provided
The directors considered the scope and quality of services to be provided by the Adviser under the Advisory Agreement, including the quality of the investment research capabilities of the Adviser and the other resources it has dedicated to performing services for the AllianceBernstein Funds. They also noted the professional experience and qualifications of the Portfolio’s portfolio manager and other members of the investment team and other senior personnel of the Adviser. The directors also considered that the Advisory Agreement provides that the Portfolio will reimburse the Adviser for the cost to it of providing certain clerical, accounting, administrative and other services to the Portfolio by employees of the Adviser or its affiliates. Requests for these reimbursements will require the directors’ approval on a quarterly basis. Reimbursements, to the extent requested and paid, result in a higher rate of total compensation from the Portfolio to the Adviser than the fee rate stated in the Advisory Agreement. The directors noted that the methodology to be used to determine the reimbursement amounts had been reviewed by an independent consultant retained by the Fund’s Senior Officer. The quality of administrative and other services, including the Adviser’s role in coordinating the activities of the Portfolio’s other service providers, also were considered. The directors concluded that, overall, they were satisfied with the nature, extent and quality of services to be provided to the Portfolio under the Advisory Agreement.
Costs of Services to be Provided and Profitability
Because the Portfolio had not yet commenced operations, the directors were unable to consider historical information about the profitability of the Portfolio. However, the Adviser agreed to provide the directors with profitability information in connection with future proposed continuances of the Advisory Agreement. They also considered the costs to be borne by the Adviser in providing services to the Portfolio and that the Portfolio was unlikely to be profitable to the Adviser unless it achieves a material level of net assets.
Fall-Out Benefits
The directors considered the other benefits to the Adviser and its affiliates from their proposed relationships with the Portfolio, including, but not limited to, receipt of 12b-1 fees and sales charges to be received by the Fund’s principal underwriter (which is a wholly owned subsidiary of the Adviser) in respect of certain classes of the Portfolio’s shares and transfer agency fees to be paid by the Portfolio to a wholly owned subsidiary of the Adviser. The directors recognized that the Adviser’s future profitability would be somewhat lower without these benefits. The directors also understood that the Adviser also might derive reputational and other benefits from its association with the Portfolio.
Investment Results
Since the Portfolio had not yet commenced operations, no performance or other historical information for the Portfolio was available. The Adviser has managed
| ALLIANCEBERNSTEIN HIGH YIELD PORTFOLIO • | 87 |
separate accounts using strategies similar to those proposed for the Portfolio. The directors reviewed performance information for a composite of accounts managed by the Adviser with investment strategies similar but not the same as those proposed for the Portfolio. Based on this information, together with the Adviser’s written and oral presentations regarding the management of the Portfolio and their general knowledge and confidence in the Adviser’s expertise in managing mutual funds, the directors concluded that they were satisfied that the Adviser was capable of providing high quality portfolio management services to the Portfolio.
Advisory Fee and Other Expenses
The directors considered the proposed advisory fee rate payable by the Portfolio and information prepared by Lipper concerning advisory fee rates paid by other funds in the same Lipper category as the Portfolio at a hypothetical common asset level of $250 million. The directors recognized that it is difficult to make comparisons of advisory fees because there are variations in the services that are included in the fees paid by other funds. The information reviewed by the directors showed that, at the Portfolio’s hypothetical size of $250 million, its anticipated contractual advisory fee rate of 60 basis points was lower than the Expense Group median of 67 basis points.
The directors also considered the advisory fees the Adviser charges non-fund clients pursuing a similar investment style. For this purpose, they reviewed the relevant advisory fee information from the Adviser’s Form ADV and the evaluation from the Fund’s Senior Officer. The directors noted that the institutional fee schedule and the Portfolio’s fee schedule started at different rates and that the institutional fee schedule had breakpoints at lower asset levels. The application of the institutional fee schedule to a hypothetical asset level of $250 million would result in a fee rate lower than the rate at the same asset level provided in the Advisory Agreement as proposed for the Portfolio. The directors noted that the Adviser may, in some cases, agree to fee rates with large institutional clients that are lower than those on the schedule reviewed by the directors and that they had previously discussed with the Adviser its policies in respect of such arrangements.
The Adviser reviewed with the directors the significantly greater scope of the services it provides to the AllianceBernstein Funds relative to institutional clients. The Adviser also noted that because mutual funds are constantly issuing and redeeming shares, they are more difficult to manage than an institutional account, where the assets tend to be relatively stable. In light of the substantial differences in services rendered by the Adviser to institutional clients as compared to funds such as the Portfolio, as well as the difference in fee structure, the directors considered these fee comparisons inapt and did not place significant weight on them in their deliberations.
The directors considered the estimated total expense ratio of the Class A shares of the Portfolio assuming $250 million in assets under management in comparison to
| 88 | • ALLIANCEBERNSTEIN HIGH YIELD PORTFOLIO |
the fees and expenses of funds within two comparison groups created by Lipper: an Expense Group and an Expense Universe. Lipper described an Expense Group as a representative sample of funds similar to the Portfolio and an Expense Universe as a broader group, consisting of all funds in the investment classification/objective with a similar load type as the Portfolio.
The estimated total expense ratio of the Portfolio reflected fee waivers and/or expense reimbursements as a result of an expense limitation agreement between the Adviser and the Fund in respect of the Portfolio. The directors noted that it was likely that the expense ratios of some of the other funds in the Portfolio’s Lipper category also were lowered by waivers or reimbursements by those funds’ investment advisers, which in some cases might be voluntary or temporary. The directors view the estimated expense ratio information as relevant to their evaluation of the Adviser’s services because the Adviser is responsible for coordinating services provided to the Portfolio by others.
The directors noted that the Portfolio may invest in shares of exchange-traded funds (“ETFs”). The directors also noted that ETFs pay advisory fees pursuant to their advisory contracts. The directors concluded, based on the Adviser’s explanation of how it may use ETFs when they represent the least expensive way to obtain desired exposures for a fund or to temporarily “equitize” cash inflows pending purchases of underlying securities, that the proposed advisory fee for the Portfolio was based on services to be provided that will be in addition to, rather than duplicative of, the services provided under the advisory contracts of the ETFs in which the Portfolio may in the future invest.
The directors recognized that the Adviser’s total compensation from the Portfolio pursuant to the Advisory Agreement would be increased by amounts paid pursuant to the expense reimbursement provision in the Advisory Agreement, and that the impact of such expense reimbursement would depend on the size of the Portfolio and the extent to which the Adviser requests reimbursements pursuant to this provision. The Lipper analysis reflected the Adviser’s agreement to cap the Portfolio’s expense ratio for a one-year period.
The information reviewed by the directors showed that the Portfolio’s anticipated total expense ratio of 1.05%, giving effect to the proposed expense limitation agreement, was lower than the Expense Group median of 1.105% and the Expense Universe median of 1.106%. The directors concluded that the Portfolio’s anticipated expense ratio, taking into account the one-year expense limitation agreement, was satisfactory.
Economies of Scale
The directors noted that the proposed advisory fee schedule for the Portfolio contains breakpoints that reduce the fee rates on assets above specified levels. The directors took into consideration prior presentations by an independent
| ALLIANCEBERNSTEIN HIGH YIELD PORTFOLIO • | 89 |
consultant on economies of scale in the mutual fund industry and for the AllianceBernstein Funds, and by the Adviser concerning certain of its views on economies of scale. The directors also had requested and received from the Adviser certain updates on economies of scale at the May 2013 meetings. The directors believe that economies of scale may be realized (if at all) by the Adviser across a variety of products and services, and not only in respect of a single fund. The directors noted that there is no established methodology for setting breakpoints that give effect to the fund-specific services provided by a fund’s adviser and to the economies of scale that an adviser may realize in its overall mutual fund business or those components of it which directly or indirectly affect a fund’s operations. The directors observed that in the mutual fund industry as a whole, as well as among funds similar to the Portfolio, there is no uniformity or pattern in the fees and asset levels at which breakpoints (if any) apply. The directors also noted that the advisory agreements for many funds do not have breakpoints at all. Having taken these factors into account, the directors concluded that the Portfolio’s shareholders would benefit from a sharing of economies of scale in the event the Portfolio’s net assets exceed a breakpoint in the future.
| 90 | • ALLIANCEBERNSTEIN HIGH YIELD PORTFOLIO |
THE FOLLOWING IS NOT PART OF THE SHAREHOLDER REPORT OR THE FINANCIAL STATEMENTS
SUMMARY OF SENIOR OFFICER’S EVALUATION OF INVESTMENT ADVISORY AGREEMENT1
The following is a summary of the evaluation of the Investment Advisory Agreement between AllianceBernstein L.P. (the “Adviser”) and AllianceBernstein Bond Fund, Inc. (the “Fund”) in respect of AllianceBernstein High Yield Portfolio (the “Portfolio”),2 prepared by Philip L. Kirstein, the Senior Officer of the Fund for the Directors of the Fund, as required by the August 2004 agreement between the Adviser and the New York State Attorney General (the “NYAG”). The Senior Officer’s evaluation of the Investment Advisory Agreement is not meant to diminish the responsibility or authority of the Board of Directors of the Fund to perform its duties pursuant to Section 15 of the Investment Company Act of 1940 (the “40 Act”) and applicable state law. The purpose of the summary is to provide shareholders with a synopsis of the independent evaluation of the reasonableness of the advisory fees proposed to be paid by the Portfolio which was provided to the Directors in connection with their review of the proposed initial approval of the Investment Advisory Agreement.
The Portfolio’s investment objective is to maximize total return while generating high current income. Under normal circumstances, the Portfolio invests at least 80% of its net assets in fixed income securities rated Ba1 or lower by Moody’s or BB+ or lower by S&P or Fitch and unrated securities considered by the Adviser to be of comparable quality, and related derivatives. The Portfolio invests in fixed income securities with a range of maturities from short- to long-term. The Portfolio may invest in securities denominated in foreign currencies and will generally hedge any foreign currency exposure through the use of currency related derivatives.
The Portfolio may also utilize derivative instruments for a variety of reasons, including providing long or short exposure to fixed income markets or particular fixed income securities, obtaining foreign currency exposure and for hedging purposes. The Portfolio’s use of derivatives may at times create aggregate notional exposure for the Portfolio in excess of its net assets, effectively leveraging the Portfolio.
The Adviser proposed the Barclays Capital U.S. High Yield Index (2% Issuer Cap) Index to be the primary benchmark for the Portfolio. The Adviser expects Lipper and Morningstar to place the Portfolio in their High Yield Funds category.
| 1 | The Senior Officer’s fee evaluation was completed on January 24, 2014 and discussed with the Board of Directors on February 4-5, 2014. |
| 2 | Future references to the Portfolio do not include “AllianceBernstein.” References in the fee summary pertaining to performance and expense ratios refer to the Class A shares of the Portfolio. |
| ALLIANCEBERNSTEIN HIGH YIELD PORTFOLIO • | 91 |
The Senior Officer’s evaluation considered the following factors:
| 1. | Advisory fees charged to institutional and other clients of the Adviser for like services; |
| 2. | Advisory fees charged by other mutual fund companies for like services; |
| 3. | Costs to the Adviser and its affiliates of supplying services pursuant to the advisory agreement, excluding any intra-corporate profit; |
| 4. | Profit margins of the Adviser and its affiliates from supplying such services; |
| 5. | Possible economies of scale as the Portfolio grows larger; and |
| 6. | Nature and quality of the Adviser’s services including the performance of the Portfolio. |
These factors, with the exception of the first factor, are generally referred to as the “Gartenberg factors,” which were articulated by the United States Court of Appeals for the Second Circuit in 1982. Gartenberg v. Merrill Lynch Asset Management, Inc., 694 F. 2d 923 (2d Cir. 1982). On March 30, 2010, the Supreme Court held the Gartenberg decision was correct in its basic formulation of what Section 36(b) requires: to face liability under Section 36(b), “an investment adviser must charge a fee that is so disproportionately large that it bears no reasonable relationship to the services rendered and could not have been the product of arm’s length bargaining.” Jones v. Harris Associates L.P., 130 S. Ct. 1418 (2010). In the Jones decision, the Court stated the Gartenberg approach fully incorporates the correct understanding of fiduciary duty within the context of Section 36(b) and noted with approval that “Gartenberg insists that all relevant circumstances be taken into account” and “uses the range of fees that might result from arm’s length bargaining as the benchmark for reviewing challenged fees.”3
INVESTMENT ADVISORY FEES, NET ASSETS, & EXPENSE RATIOS
The Adviser proposed that the Portfolio pays the advisory fee set forth below for receiving the services to be provided pursuant to the Investment Advisory Agreement.
| 3 | Jones v. Harris at 1427. |
| 92 | • ALLIANCEBERNSTEIN HIGH YIELD PORTFOLIO |
| Portfolio | Advisory Fee | |
| High Yield Portfolio4,5 | 0.60% on 1st $2.5 billion | |
0.55% on next $2.5 billion | ||
0.50% on the balance |
In addition to paying the advisory fee, the Investment Advisory Agreement provides for the Adviser to be reimbursed for providing administrative and accounting services.
The Portfolio‘s Expense Limitation Agreement calls for the Adviser to establish expense caps, set forth below, for a one year period after the date the date that shares of the Portfolio is first offered to the public. The Expense Limitation Agreement also provides a mechanism for reimbursing the Adviser for its expense cap subsidy. Under the Expense Limitation Agreement, the Adviser may be able to recoup all or a portion of the amounts waived or reimbursed until the end of three fiscal years after the fiscal period in which the amounts were waived or reimbursed to the extent that the reimbursements do not cause the expense ratios of the Portfolio’s share classes to exceed the expense caps. The Adviser’s ability to recoup offering expenses will terminate with the agreement.
| Portfolio | Expense Cap Pursuant to Expense Limitation Undertaking | Estimated Gross Expense Ratio 6 | Fiscal Year End | |||||||||
| High Yield Portfolio | Class A Class C Class R Class K Class I Advisor Class 1 Class 2 Class Z |
| 1.05 1.75 1.25 1.00 0.75 0.75 0.85 0.75 0.75 | % % % % % % % % % |
| 1.11 1.88 1.59 1.28 0.95 0.86 0.95 0.85 0.85 | % % % % % % % % % | October 31 | ||||
| 4 | The proposed advisory fee schedule for the Portfolio has a higher effective fee rate than the advisory fee schedule of the High Income category, in which the Portfolio would have been categorized, had the Adviser proposed to implement the NYAG related fee schedule. The advisory fee schedule of the High Income category is as follows: 50 bp on the first $2.5 billion, 45 bp on the next $2.5 billion, and 40 bp on the balance. |
| 5 | The Adviser manages AllianceBernstein High Income Fund, Inc. (“High Income Fund, Inc.”). Prior to January 25, 2008, the High Income Fund, Inc. had an emerging market debt investment strategy and was known as AllianceBernstein Emerging Market Debt Fund, Inc. In addition, on or around January 25, 2008, High Income Fund, Inc. merged with other retail fixed income mutual funds managed by the Adviser: AllianceBernstein Corporate Debt Portfolio (“Corporate Debt Portfolio”) and AllianceBernstein High Yield Fund, Inc. (“High Yield Fund, Inc.”). Emerging Market Debt Fund, Inc., Corporate Debt Portfolio and High Yield Fund, Inc. were categorized as High Income and accordingly, their advisory fee schedules were identical to each other under the High Income category. |
| 6 | The Portfolio’s estimated gross expense ratios are based on an initial estimate of the Portfolio’s net assets at $250 million. |
| ALLIANCEBERNSTEIN HIGH YIELD PORTFOLIO • | 93 |
| I. | ADVISORY FEES CHARGED TO INSTITUTIONAL AND OTHER CLIENTS |
The advisory fees charged to investment companies which the Adviser manages and sponsors are normally higher than those charged to similar sized institutional accounts, including pension plans and sub-advised investment companies. The fee differential reflects, among other things, different services provided to such clients, and different liabilities assumed. Services to be provided by the Adviser to the Portfolio that are not provided to non-investment company clients and sub-advised investment companies include providing office space and personnel to serve as Fund Officers, who among other responsibilities, make the certifications required under the Sarbanes–Oxley Act of 2002, and coordinating with and monitoring the Portfolio’s third party service providers such as Fund counsel, auditors, custodians, transfer agents and pricing services. The accounting, administrative, legal and compliance requirements for the Portfolio will be more costly than those for institutional assets due to the greater complexities and time required for investment companies, although the Adviser will be reimbursed for providing some of these services. Also, retail mutual funds managed by the Adviser are widely held. Servicing the Portfolio’s investors will be more time consuming and labor intensive compared to institutional clients since the Adviser needs to communicate with a more extensive network of financial intermediaries and shareholders. The Adviser also believes that it incurs substantial entrepreneurial risk when offering a new mutual fund since establishing a new mutual fund requires a large upfront investment and it may take a long time for the fund to achieve profitability since the fund must be priced to scale from inception in order to be competitive and assets are acquired one account at a time. Managing the cash flow of an investment company may be more difficult than managing that of a stable pool of assets, such as an institutional account with little cash movement in either direction, particularly, if a fund is in net redemption and the Adviser is frequently forced to sell securities to raise cash for redemptions. However, managing a fund with positive cash flow may be easier at times than managing a stable pool of assets. Finally, in recent years, investment advisers have been sued by institutional clients and have suffered reputational damage both by the attendant publicity and outcomes other than complete victories. Accordingly, the legal and reputational risks associated with institutional accounts are greater than previously thought, although still not equal to those related to the mutual fund industry.
Notwithstanding the Adviser’s view that managing an investment company is not comparable to managing other institutional accounts because the services provided are different, the Supreme Court has indicated consideration should be given to the advisory fees charged to institutional accounts with a similar investment style as the Portfolio.7 In addition to the institutional fee schedule,
| 7 | The Supreme Court stated that “courts may give such comparisons the weight that they merit in light of the similarities and differences between the services that the clients in question require, but the courts must be wary of inapt comparisons.” Among the significant differences the Supreme Court noted that may exist between services provided to mutual funds and institutional accounts are “higher marketing costs.” Jones v. Harris at 1428. |
| 94 | • ALLIANCEBERNSTEIN HIGH YIELD PORTFOLIO |
set forth below are would have been the effective advisory fee of the Portfolio had the institutional fee schedule been applicable to the Portfolio, the Portfolio’s advisory fee and the differences between those fees based on an initial estimate of the Portfolio’s net assets at $250 million.8
| Portfolio | Projected Net Assets ($MM) | AllianceBernstein Institutional Fee Schedule9 | Effective AB Inst. Adv. Fee (%) | Fund Advisory Fee (%) | Difference | |||||||||||||
| High Yield Portfolio | $ | 250.0 | U.S. High Yield 0.55% on 1st $50 million 0.30% on the balance Minimum account size: $50m | 0.350 | % | 0.600 | % | 0.250 | % | |||||||||
The Adviser also manages and sponsors retail mutual funds, which are organized in jurisdictions outside the United States, generally Luxembourg and Japan, and sold to non-United States resident investors. The Adviser charges the following fee for the Luxembourg fund that has a somewhat similar investment style as the Portfolio:
| Portfolio | Luxembourg Fund | Fee10 | ||
| High Yield Portfolio11 | U.S. High Yield | |||
| Class A2 | 1.20% | |||
| Class I2 (Institutional) | 0.65% |
The AllianceBernstein Investment Trust Management mutual funds (“ITM”), which are offered to investors in Japan, have an “all-in” fee to compensate the Adviser for investment advisory as well as fund accounting and administrative related services. The table below shows the fee schedule of the ITM mutual fund that has a somewhat similar investment style as the Portfolio:
| Portfolio | ITM Mutual Fund | Fee12 | ||
| High Yield Portfolio | High Yield Open Fund | 1.00% |
| 8 | The Adviser has indicated that with respect to institutional accounts with assets greater than $300 million, it will negotiate a fee schedule. Discounts that are negotiated vary based upon each client relationship. |
| 9 | With respect to each Portfolio listed as “N/A,” the Adviser has represented that there is no category in the Form ADV for an institutional product that has a substantially similar investment style. |
| 10 | Class A shares of the Luxembourg funds are charged an “all-in” fee, which covers investment advisory and distribution related services. |
| 11 | The Adviser expects the Portfolio to have a foreign currency exposure between the two emerging markets debt Luxembourg funds shown in the table. |
| 12 | The Japanese Yen-U.S. dollar currency exchange rate quoted at 4 p.m. on December 31, 2013 by Reuters was ¥105.31 per $1. |
| ALLIANCEBERNSTEIN HIGH YIELD PORTFOLIO • | 95 |
The Adviser represented that it does not provide sub-advisory investment services to other investment companies that have a substantially similar investment style as the Portfolio.
| II. | MANAGEMENT FEES CHARGED BY OTHER MUTUAL FUND COMPANIES FOR LIKE SERVICES. |
Lipper, Inc. (“Lipper”), an analytical service that is not affiliated with the Adviser, compared the fees charged to the Portfolio with fees charged to other investment companies for similar services offered by other investment advisers.13 Lipper’s analysis included the comparison of the Portfolio’s contractual management fee, estimated at an initial asset level of $250 million, to the median of the Portfolio’s Lipper Expense Group (“EG”)14 and the Portfolio’s contractual management fee ranking.15
Lipper describes an EG as a representative sample of comparable funds. Lipper’s standard methodology for screening funds to be included in an EG entails the consideration of several fund criteria, including fund type, investment classification/objective, load type and similar 12b-1/non-12b-1 service fees, asset (size) comparability, expense components and attributes. An EG will typically consist of seven to twenty funds.
| Portfolio | Contractual Management Fee (%)16 | Lipper Exp. Group Median (%) | Rank | |||||||
| High Yield Portfolio | 0.600 | 0.667 | 2/10 | |||||||
| 13 | The Supreme Court cautioned against accepting mutual fund fee comparisons without careful scrutiny since “these comparisons are problematic because these fees, like those challenged, may not be the product of negotiations conducted at arm’s length.” Jones v. Harris at 1429. |
| 14 | Lipper does not consider average account size when constructing EGs. Funds with relatively small average account sizes tend to have higher transfer agent expense ratio than comparable sized funds that have relatively large average account sizes. There are limitations to Lipper expense category data because different funds categorize expenses differently. |
| 15 | The contractual management fee is calculated by Lipper using the Portfolio’s contractual management fee rate at a hypothetical asset level. The hypothetical asset level is based on the combined net assets of all classes of the Portfolio, rounded up to the next $25 million. Lipper’s total expense ratio information is based on the most recent annual report except as otherwise noted. A ranking of “1” would mean that Portfolio had the lowest effective fee rate in the Lipper peer group. |
| 16 | The contractual management fee does not reflect any expense reimbursements made by the Portfolio to the Adviser for certain clerical, legal, accounting, administrative, and other services. In addition, the contractual management fee does not reflect any advisory fee waivers for expense caps. |
| 96 | • ALLIANCEBERNSTEIN HIGH YIELD PORTFOLIO |
Lipper also compared the Portfolio’s projected total expense ratio to the medians of the Portfolio’s EG and Lipper Expense Universe (“EU”). The EU is as a broader group compared to the EG, consisting of all funds that have the same investment classification/objective and load type as the subject Portfolio.17
| Portfolio | Expense Ratio (%)18 | Lipper Exp. Group Median (%) | Lipper Group Rank | Lipper Exp. Universe Median (%) | Lipper Universe Rank | |||||||||||||
| High Yield Portfolio | 1.050 | 1.105 | 4/10 | 1.060 | 36/81 | |||||||||||||
Based on this analysis, the Portfolio has a more favorable ranking on a contractual management fee basis than on a total expense ratio basis.
| III. | COSTS TO THE ADVISER AND ITS AFFILIATES OF SUPPLYING SERVICES PURSUANT TO THE MANAGEMENT FEE ARRANGEMENT, EXCLUDING ANY INTRA-CORPORATE PROFIT. |
The Adviser utilizes two profitability reporting systems, which operate independently but are aligned with each other, to estimate the Adviser’s profitability in connection with investment advisory services provided to the Portfolio. The Senior Officer has retained a consultant to provide independent advice regarding the alignment of the two profitability systems as well as the methodologies and allocations utilized by both profitability systems. See Section IV for additional discussion.
| IV. | PROFIT MARGINS OF THE ADVISER AND ITS AFFILIATES FOR SUPPLYING SUCH SERVICES. |
The Portfolio has not yet commenced operations. Therefore, there is no historic profitability data with respect to the Adviser’s investment services to the Portfolio.
In addition to the Adviser’s direct profits from managing the Portfolio, certain of the Adviser’s affiliates have business relationships with the Portfolio and may earn a profit from providing other services to the Portfolio. The courts have referred to this type of business opportunity as “fall-out benefits” to the Adviser and indicated that such benefits should be factored into the evaluation of the total relationship between the Portfolio and the Adviser. Neither case law nor common business practice precludes the Adviser’s affiliates from earning a reasonable profit on this type of relationship provided the affiliates’ charges and services are competitive and the relationship otherwise complies with the 40 Act restrictions. These affiliates will provide transfer agent and distribution related services to the Portfolio and will receive transfer agent fees, Rule 12b-1 payments, front-end sales loads and contingent deferred sales charges (“CDSC”).
| 17 | Except for asset (size) comparability, Lipper uses the same criteria for selecting an EG peer when selecting an EU peer. Unlike the EG, the EU allows for the same adviser to be represented by more than just one fund. |
| 18 | Projected total expense ratio information, based on an initial net asset estimate of $250 million, pertains to the Portfolio’s Class A shares. |
| ALLIANCEBERNSTEIN HIGH YIELD PORTFOLIO • | 97 |
AllianceBernstein Investments, Inc. (“ABI”), an affiliate of the Adviser, is the Fund’s principal underwriter. ABI and the Adviser have disclosed in the Portfolio’s prospectus that they may make revenue sharing payments from their own resources, in addition to resources derived from sales loads and Rule 12b-1 fees, to firms that sell shares of the Portfolio. The total amount to be paid to a financial intermediary associated with the sale of shares will generally not exceed the sum of (a) 0.25% of the current year’s fund sales by that firm and (b) 0.10% of the average daily net assets attributable to that firm over the year. In 2012, ABI paid approximately 0.048% of the average monthly assets of the AllianceBernstein Mutual Funds or approximately $19.0 million for distribution services and educational support (revenue sharing payments).
Fees and reimbursements for out of pocket expenses to be charged by AllianceBernstein Investor Services, Inc. (“ABIS”), the affiliated transfer agent for the Portfolio, are based on the level of the network account and the class of shares held by the account. ABIS also receives a fee per shareholder sub-account for each account maintained by an intermediary on an omnibus basis.
| V. | POSSIBLE ECONOMIES OF SCALE |
The Adviser has indicated that economies of scale are being shared with shareholders through pricing to scale, breakpoints, fee reductions/waivers and enhancement to services.
An independent consultant, retained by the Senior Officer, provided the Board of Directors information on the Adviser’s firm-wide average costs from 2005 through 2011 and the potential economies of scale. The independent consultant noted that from 2005 through 2007 the Adviser experienced significant growth in assets under management (“AUM”). During this period, operating expenses increased, in part to keep up with growth, and in part reflecting market returns. However, from 2008 through the first quarter of 2009, AUM rapidly and significantly decreased due to declines in market value and client withdrawals. When AUM rapidly decreased, some operating expenses categories, including base compensation and office space, adjusted more slowly during this period, resulting in an increase in average costs. Since 2009, AUM have experienced less significant changes. The independent consultant noted that changes in operating expenses reflect changes in business composition and business practices in response to changes in financial markets. Finally, the independent consultant concluded that the increase in average cost and the decline in net operating margin across the Adviser since late 2008 are inconsistent with the view that there are currently reductions in average costs due to economies of scale that can be shared with the AllianceBernstein Mutual Funds managed by the Adviser through lower fees.
| 98 | • ALLIANCEBERNSTEIN HIGH YIELD PORTFOLIO |
In February 2008, the independent consultant provided the Board of Directors an update of the Deli19 study on advisory fees and various fund characteristics.20 The independent consultant first reiterated the results of his previous two dimensional comparison analysis (fund size and family size) with the Board of Directors.21 The independent consultant then discussed the results of the regression model that was utilized to study the effects of various factors on advisory fees. The regression model output indicated that the bulk of the variation in fees predicted were explained by various factors, but substantially by fund AUM, family AUM, index fund indicator and investment style. The independent consultant also compared the advisory fees of the AllianceBernstein Mutual Funds to similar funds managed by 19 other large asset managers, regardless of the fund size and each Adviser’s proportion of mutual fund assets to non-mutual fund assets.
| VI. | NATURE AND QUALITY OF THE ADVISER’S SERVICES, INCLUDING THE PERFORMANCE OF THE FUND |
With assets under management of approximately $451 billion as of December 31, 2013, the Adviser has the investment experience to manage and provide non-investment services (described in Section I) to the Portfolio.
Since the Portfolio has not yet commenced operations, the Portfolio has no performance history. However, the Adviser provides a similar service to institutional clients. Performance information for the institutional composite associated with these clients was provided to the Directors at the February 4-5, 2014 meetings.
CONCLUSION:
Based on the factors discussed above, the Senior Officer’s conclusion is that the Investment Advisory Agreement for the Portfolio is reasonable and within the range of what would have been negotiated at arm’s length in light of all the surrounding circumstances. This conclusion in respect of the Portfolio is based on an evaluation of all of these factors and no single factor was dispositive.
Dated: March 5, 2014
| 19 | The Deli study, originally published in 2002 based on 1997 data and updated for the February 2008 Presentation, may be of diminished value due to the age of the data used in the presentation and the changes experienced in the industry over the last four years. |
| 20 | As mentioned previously, the Supreme Court cautioned against accepting mutual fund fee comparisons without careful scrutiny since the fees may not be the product of negotiations conducted at arm’s length. See Jones V. Harris at 1429. |
| 21 | The two dimensional analysis showed patterns of lower advisory fees for funds with larger asset sizes and funds from larger family sizes compared to funds with smaller asset sizes and funds from smaller family sizes, which according to the independent consultant is indicative of a sharing of economies of scale and scope. However, in less liquid and active markets, such is not the case, as the empirical analysis showed potential for diseconomies of scale in those markets. The empirical analysis also showed diminishing economies of scale and scope as funds surpassed a certain high level of assets. |
| ALLIANCEBERNSTEIN HIGH YIELD PORTFOLIO • | 99 |
THIS PAGE IS NOT PART OF THE SHAREHOLDER REPORT OR THE FINANCIAL STATEMENTS
ALLIANCEBERNSTEIN FAMILY OF FUNDS
US Equity
US Core
Core Opportunities Fund
Select US Equity Portfolio
US Growth
Concentrated Growth Fund
Discovery Growth Fund
Growth Fund
Large Cap Growth Fund
Small Cap Growth Portfolio
US Value
Discovery Value Fund
Equity Income Fund
Growth & Income Fund
Value Fund
International/Global Equity
International/Global Core
Global Equity & Covered Call Strategy Fund
Global Thematic Growth Fund
International Portfolio
Tax-Managed International Portfolio
International/Global Growth
International Growth Fund
International/Global Value
International Value Fund
Fixed Income
Municipal
High Income Municipal Portfolio
Intermediate California Portfolio
Intermediate Diversified Portfolio
Intermediate New York Portfolio
Municipal Bond Inflation Strategy
Tax-Aware Fixed Income Portfolio
National Portfolio
Arizona Portfolio
California Portfolio
Massachusetts Portfolio
Michigan Portfolio
Minnesota Portfolio
New Jersey Portfolio
New York Portfolio
Ohio Portfolio
Pennsylvania Portfolio
Virginia Portfolio
Taxable
Bond Inflation Strategy
Global Bond Fund
Fixed Income (continued)
Taxable
High Income Fund
High Yield Portfolio
Intermediate Bond Portfolio
Limited Duration High Income Portfolio
Short Duration Portfolio
Alternatives
All Market Real Return Portfolio*
Credit Long/Short Portfolio
Global Real Estate Investment Fund
Long/Short Multi-Manager Fund
Market Neutral Strategy-U.S.
Multi-Manager Alternative Strategies Fund
Select US Long/Short Portfolio
Unconstrained Bond Fund
Multi-Asset
All Market Growth Portfolio*
Emerging Markets Multi-Asset Portfolio
Global Risk Allocation Fund
Retirement Strategies
2000 Retirement Strategy
2005 Retirement Strategy
2010 Retirement Strategy
2015 Retirement Strategy
2020 Retirement Strategy
2025 Retirement Strategy
2030 Retirement Strategy
2035 Retirement Strategy
2040 Retirement Strategy
2045 Retirement Strategy
2050 Retirement Strategy
2055 Retirement Strategy
Wealth Strategies
Balanced Wealth Strategy
Conservative Wealth Strategy
Wealth Appreciation Strategy
Tax-Managed Balanced Wealth Strategy
Tax-Managed Conservative Wealth Strategy
Tax-Managed Wealth Appreciation Strategy
Closed-End Funds
Alliance California Municipal Income Fund
Alliance New York Municipal Income Fund
AllianceBernstein Global High Income Fund
AllianceBernstein Income Fund
AllianceBernstein Multi-Manager Alternative Fund
AllianceBernstein National Municipal Income Fund
We also offer Exchange Reserves, which serves as the money market fund exchange vehicle for the AllianceBernstein mutual funds. An investment in Exchange Reserves is not a deposit in a bank and is not insured or guaranteed by the Federal Deposit Insurance Corporation or any other government agency. Although the Fund seeks to preserve the value of your investment at $1.00 per share, it is possible to lose money by investing in the Fund.
Investors should consider the investment objectives, risks, charges and expenses of the Fund carefully before investing. For copies of our prospectus or summary prospectus, which contain this and other information, visit us online at www.alliancebernstein.com or contact your AllianceBernstein investments representative. Please read the prospectus and/or summary prospectus carefully before investing.
* Prior to December 15, 2014, All Market Growth Portfolio was named Dynamic All Market Fund; All Market Real Return Portfolio was named Real Asset Strategy.
| 100 | • ALLIANCEBERNSTEIN HIGH YIELD PORTFOLIO |
AllianceBernstein Family of Funds
ALLIANCEBERNSTEIN HIGH YIELD PORTFOLIO
1345 Avenue of the Americas
New York, NY 10105
800.221.5672
| HY-0151-1014 |  | |
ANNUAL REPORT
AllianceBernstein Bond Fund Intermediate Bond Portfolio
October 31, 2014
Annual Report

Investment Products Offered
•Are Not FDIC Insured •May Lose Value •Are Not Bank Guaranteed |
Investors should consider the investment objectives, risks, charges and expenses of the Fund carefully before investing. For copies of our prospectus or summary prospectus, which contain this and other information, visit us online at www.alliancebernstein.com or contact your AllianceBernstein Investments representative. Please read the prospectus and/or summary prospectus carefully before investing.
This shareholder report must be preceded or accompanied by the Fund’s prospectus for individuals who are not current shareholders of the Fund.
You may obtain a description of the Fund’s proxy voting policies and procedures, and information regarding how the Fund voted proxies relating to portfolio securities during the most recent 12-month period ended June 30, without charge. Simply visit AllianceBernstein’s website at www.alliancebernstein.com, or go to the Securities and Exchange Commission’s (the “Commission”) website at www.sec.gov, or call AllianceBernstein at (800) 227-4618.
The Fund files its complete schedule of portfolio holdings with the Commission for the first and third quarters of each fiscal year on Form N-Q. The Fund’s Forms N-Q are available on the Commission’s website at www.sec.gov. The Fund’s Forms N-Q may also be reviewed and copied at the Commission’s Public Reference Room in Washington, DC; information on the operation of the Public Reference Room may be obtained by calling (800) SEC-0330. AllianceBernstein publishes full portfolio holdings for the Fund monthly at www.alliancebernstein.com.
AllianceBernstein Investments, Inc. (ABI) is the distributor of the AllianceBernstein family of mutual funds. ABI is a member of FINRA and is an affiliate of AllianceBernstein L.P., the manager of the funds.
AllianceBernstein® and the AB Logo are registered trademarks and service marks used by permission of the owner, AllianceBernstein L.P.
December 11, 2014
Annual Report
This report provides management’s discussion of fund performance for AllianceBernstein Intermediate Bond Portfolio (the “Portfolio”) for the annual reporting period ended October 31, 2014.
Investment Objective and Policies
The Portfolio’s investment objective is to generate income and price appreciation without assuming what AllianceBernstein L.P. (the “Adviser”) considers undue risk. The Portfolio invests, under normal circumstances, at least 80% of its net assets in fixed-income securities. The Portfolio expects to invest in readily marketable fixed-income securities with a range of maturities from short- to long-term and relatively attractive yields that do not involve undue risk of loss of capital. The Portfolio expects to invest in fixed-income securities with a dollar-weighted average maturity of between three to ten years and an average duration of three to six years. The Portfolio may invest up to 25% of its net assets in below investment-grade bonds. The Portfolio may use leverage for investment purposes. The Portfolio may invest without limit in U.S. dollar-denominated foreign fixed-income securities and may invest up to 25% of its assets in non-U.S. dollar-denominated foreign fixed-income securities. These investments may include, in each case, developed and emerging market debt securities.
The Portfolio may invest in mortgage-related and other asset-backed securities, loan participations, inflation-protected securities, structured securities, variable,
floating, and inverse floating-rate instruments and preferred stock, and may use other investment techniques. The Portfolio intends, among other things, to enter into transactions such as reverse repurchase agreements and dollar rolls. The Portfolio may invest, without limit, in derivatives, such as options, futures, forwards or swaps.
Investment Results
The table on page 6 shows the Portfolio’s performance compared with its benchmark, the Barclays U.S. Aggregate Bond Index for the six- and 12-month periods ended October 31, 2014.
All share classes of the Portfolio (except for Class Z shares whose inception date is April 25, 2014, and performance period is less than 12 months) outperformed for the 12-month period. For the six-month period, all share classes underperformed, excluding Advisor Class, Class I and Class Z shares. For both periods, investment-grade corporate security selection, particularly in the financials sector, was a primary contributor to returns. Currency exposure, specifically an overweight to the U.S. dollar versus short positions in several developed-market currencies, also contributed, as well as an allocation to non-U.S. dollar holdings and non-agency mortgages. During the 12-month period, an underweight in U.S. Treasuries, as credit sectors outperformed, contributed to returns; an overweight to investment-grade corporates and opportunistic exposure to high yield also contributed. An allocation to inflation-linked securities detracted for both periods, while exposure to high yield and emerging-
| ALLIANCEBERNSTEIN BOND FUND INTERMEDIATE BOND PORTFOLIO • | 1 |
market corporates detracted for the six-month period.
The Portfolio utilized derivatives including Treasury futures and interest rate swaps to manage overall duration positioning; yield curve positioning detracted for both periods. Credit default swaps were utilized for hedging and investment purposes, which had an immaterial impact during both periods; currency forwards were utilized for both hedging and investment purposes to manage the portfolio’s overall currency exposure. Purchased options and currency swaps were utilized for hedging purposes, which had an immaterial impact on performance during both periods.
Market Review and Investment Strategy
During the 12-month period, markets remained heavily focused on the direction of interest rates, central bank monetary policy and global growth. Early in the period, volatility increased as the U.S. Federal Reserve (the “Fed”) began to taper its asset purchase program and investors worried about the impact of higher interest rates. However, fixed-income markets stabilized in the first quarter of 2014 and bond fund flows turned positive once again, as U.S. economic data cooled, blamed mostly on winter weather. Ongoing geopolitical concerns, specifically the conflict between Ukraine and Russia, as well as continued violence in the Middle East, contributed to periodic safe haven rallies into U.S. Treasuries, keeping a lid on yields.
Contrary to expectations, interest rates continued to decline toward the end of the period as investors became increasingly wary regarding global growth, particularly in Europe and China. Worries about Europe increased as core inflation moved closer to zero and the European Central Bank (“ECB”) cut key interest rates, announcing plans to repurchase asset-backed securities and covered bonds to further stimulate the struggling economy. Low yields in the euro area and further easing by the ECB helped anchor U.S. Treasury yields.
The U.S. Federal Open Market Committee (“FOMC”) also announced no changes to the stance of U.S. monetary policy after its mid-September meeting, easing concerns for higher interest rates. The FOMC reaffirmed its views that U.S. interest rates will remain low until unemployment and inflation are more closely aligned with Fed targets. However, the Fed did end its monthly bond purchase program at the end of October, and dropped a characterization of U.S. labor market slack as “significant” in a show of confidence in the economy’s prospects. The Fed largely dismissed financial market volatility, dimming growth in Europe and a weak inflation outlook as unlikely to undercut progress toward its unemployment and inflation goals. Despite the intra-period volatility, the 10-year U.S. Treasury yield declined only 0.22% during the 12-month period to end at a yield of 2.34%. The U.S. Treasury curve flattened, as intermediate yields rose and longer term yields declined.
| 2 | • ALLIANCEBERNSTEIN BOND FUND INTERMEDIATE BOND PORTFOLIO |
Against this backdrop, fixed-income sectors benefited from the low-yield environment with major U.S. fixed-income sectors posting positive returns. Credit-sensitive securities generally outperformed Treasuries with corporate sectors, both investment-grade and high-yield, posting the strongest returns. Corporate fundamentals, as well as earnings, remained favorable amid ample global liquidity and tighter spreads.
The risk profile of the Portfolio was reduced amid both increased volatility and tighter spread levels during the 12-month period. The Portfolio continues to hold notable underweights in
U.S. Treasuries and agency mortgages. The Portfolio remains overweight asset-backed securities and commercial mortgage-backed securities, and continues to hold exposure to high-yield corporates. Within corporate exposure, the Portfolio continues to favor financials on a relative value basis. With diverging global growth and central bank policies, currency exposure was increased late in the period, with a bias toward long U.S. dollar positions on anticipated U.S. dollar strength. The Portfolio’s overall duration remains short versus the benchmark, with an emphasis on 10-year maturities to benefit from the steepness of the U.S. yield curve.
| ALLIANCEBERNSTEIN BOND FUND INTERMEDIATE BOND PORTFOLIO • | 3 |
DISCLOSURES AND RISKS
Benchmark Disclosure
The unmanaged Barclays U.S. Aggregate Bond Index does not reflect fees and expenses associated with the active management of a mutual fund portfolio. The Barclays U.S. Aggregate Bond Index represents the performance of securities within the U.S. investment-grade fixed-rate bond market, with index components for government and corporate securities, mortgage pass-through securities, asset-backed securities, and commercial mortgage-backed securities. An investor cannot invest directly in an index, and its results are not indicative of the performance for any specific investment, including the Portfolio.
A Word About Risk
Market Risk: The value of the Portfolio’s assets will fluctuate as the stock or bond market fluctuates. The value of its investments may decline, sometimes rapidly and unpredictably, simply because of economic changes or other events that affect large portions of the market.
Interest Rate Risk: Changes in interest rates will affect the value of investments in fixed-income securities. When interest rates rise, the value of investments in fixed-income securities tends to fall and this decrease in value may not be offset by higher income from new investments. Interest rate risk is generally greater for fixed-income securities with longer maturities or durations.
Duration Risk: Duration is a measure that relates the expected price volatility of a fixed-income security to changes in interest rates. The duration of a fixed-income security may be shorter than or equal to full maturity of a fixed-income security. Fixed-income securities with longer durations have more risk and will decrease in price as interest rates rise. For example, a fixed-income security with a duration of three years will decrease in value by approximately 3% if interest rates increase by 1%.
Credit Risk: An issuer or guarantor of a fixed-income security, or the counterparty to a derivatives or other contract, may be unable or unwilling to make timely payments of interest or principal, or to otherwise honor its obligations. The issuer or guarantor may default, causing a loss of the full principal amount of a security. The degree of risk for a particular security may be reflected in its credit rating. There is the possibility that the credit rating of a fixed-income security may be downgraded after purchase, which may adversely affect the value of the security.
Below Investment Grade Securities Risk: Investments in fixed-income securities with lower ratings (commonly known as “junk bonds”) are subject to a higher probability that an issuer will default or fail to meet its payment obligations. These securities may be subject to greater price volatility due to such factors as specific corporate developments, negative perceptions of the junk bond market generally and less secondary market liquidity.
Inflation Risk: This is the risk that the value of assets or income from investments will be less in the future as inflation decreases the value of money. As inflation increases, the value of the Portfolio’s assets can decline as can the value of the Portfolio’s distributions. This risk is significantly greater if the Portfolio invests a significant portion of its assets in fixed-income securities with longer maturities.
Foreign (Non-U.S.) Risk: Investments in securities of non-U.S. issuers may involve more risk than those of U.S. issuers. These securities may fluctuate more widely in price and may be less liquid due to adverse market, economic, political, regulatory or other factors.
Emerging Market Risk: Investments in emerging market countries may have more risk because the markets are less developed and less liquid as well as being subject to increased economic, political, regulatory or other uncertainties.
(Disclosures, Risks and Note about Historical Performance continued on next page)
| 4 | • ALLIANCEBERNSTEIN BOND FUND INTERMEDIATE BOND PORTFOLIO |
Disclosures and Risks
DISCLOSURES AND RISKS
(continued from previous page)
Currency Risk: Fluctuations in currency exchange rates may negatively affect the value of the Portfolio’s investments or reduce its returns.
Prepayment Risk: The value of mortgage-related or asset-backed securities may be particularly sensitive to changes in prevailing interest rates. Early payments of principal on some mortgage-related securities may occur during periods of falling mortgage interest rates and expose the Portfolio to a lower rate of return upon reinvestment of principal. Early payments associated with mortgage-related securities cause these securities to experience significantly greater price and yield volatility than is experienced by traditional fixed-income securities. During periods of rising interest rates, a reduction in prepayments may increase the effective life of mortgage-related securities, subjecting them to greater risk of decline in market value in response to rising interest rates. If the life of a mortgage-related security is inaccurately predicted, the Portfolio may not be able to realize the rate of return it expected.
Leverage Risk: To the extent the Portfolio uses leveraging techniques, its net asset value (“NAV”) may be more volatile because leverage tends to exaggerate the effects of changes in interest rates and any increase or decrease in the value of the Portfolio’s investments.
Derivatives Risk: Derivatives may be illiquid, difficult to price, and leveraged so that small changes may produce disproportionate losses for the Portfolio, and may be subject to counterparty risk to a greater degree than more traditional investments.
Management Risk: The Portfolio is subject to management risk because it is an actively-managed investment fund. The Adviser will apply its investment techniques and risk analyses in making investment decisions, but there is no guarantee that its techniques will produce the intended results.
These risks are fully discussed in the Portfolio’s prospectus.
An Important Note About Historical Performance
The investment return and principal value of an investment in the Portfolio will fluctuate, so that shares, when redeemed, may be worth more or less than their original cost. Performance shown on the following pages represents past performance and does not guarantee future results. Current performance may be lower or higher than the performance information shown. You may obtain performance information current to the most recent month-end by visiting www.alliancebernstein.com.
All fees and expenses related to the operation of the Portfolio have been deducted. NAV returns do not reflect sales charges; if sales charges were reflected, the Portfolio’s quoted performance would be lower. SEC returns reflect the applicable sales charges for each share class: a 4.25% maximum frontend sales charge for Class A shares; the applicable contingent deferred sales charge for Class B shares (3% year 1, 2% year 2, 1% year 3); a 1% 1-year contingent deferred sales charge for Class C shares. Returns for the different share classes will vary due to different expenses associated with each class. Performance assumes reinvestment of distributions and does not account for taxes.
| ALLIANCEBERNSTEIN BOND FUND INTERMEDIATE BOND PORTFOLIO • | 5 |
Disclosures and Risks
HISTORICAL PERFORMANCE
| THE PORTFOLIO VS. ITS BENCHMARK PERIODS ENDED OCTOBER 31, 2014 (unaudited) | NAV Returns | |||||||||
| 6 Months | 12 Months | |||||||||
| AllianceBernstein Bond Fund Intermediate Bond Portfolio* | ||||||||||
| ||||||||||
Class A | 2.32% | 5.34% | ||||||||
| ||||||||||
Class B† | 1.87% | 4.61% | ||||||||
| ||||||||||
Class C | 1.96% | 4.63% | ||||||||
| ||||||||||
Advisor Class‡ | 2.38% | 5.65% | ||||||||
| ||||||||||
Class R‡ | 2.22% | 5.13% | ||||||||
| ||||||||||
Class K‡ | 2.25% | 5.30% | ||||||||
| ||||||||||
Class I‡ | 2.38% | 5.65% | ||||||||
| ||||||||||
Class Z‡ | 2.48% | 2.61% | ^ | |||||||
| ||||||||||
| Barclays U.S. Aggregate Bond Index | 2.35% | 4.14% | ||||||||
| ||||||||||
* Includes the impact of proceeds received and credited to the Portfolio resulting from class action settlements, which enhanced the performance of the Portfolio for the six- and 12-month periods ended October 31, 2014 by 0.01% and 0.01%, respectively.
† Effective January 31, 2009, Class B shares are no longer available for purchase to new investors. Please see Note A for additional information.
‡ Please note that these share classes are for investors purchasing shares through accounts established under certain fee-based programs sponsored and maintained by certain broker-dealers and financial intermediaries, institutional pension plans and/or investment advisory clients of, and certain other persons associated with, the Adviser and its affiliates or the Portfolio.
^ Since inception on 4/25/2014. | ||||||||||
See Disclosures, Risks and Note about Historical Performance on pages 4-5.
(Historical Performance continued on next page)
| 6 | • ALLIANCEBERNSTEIN BOND FUND INTERMEDIATE BOND PORTFOLIO |
Historical Performance
HISTORICAL PERFORMANCE
(continued from previous page)
GROWTH OF A $10,000 INVESTMENT IN THE PORTFOLIO
10/31/04 TO 10/31/14 (unaudited)
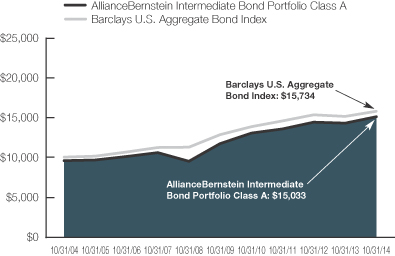
This chart illustrates the total value of an assumed $10,000 investment in AllianceBernstein Intermediate Bond Portfolio Class A shares (from 10/31/04 to 10/31/14) as compared to the performance of the Portfolio’s benchmark. The chart reflects the deduction of the maximum 4.25% sales charge from the initial $10,000 investment in the Portfolio and assumes the reinvestment of dividends and capital gains distributions.
See Disclosures, Risks and Note about Historical Performance on pages 4-5.
(Historical Performance continued on next page)
| ALLIANCEBERNSTEIN BOND FUND INTERMEDIATE BOND PORTFOLIO • | 7 |
Historical Performance
HISTORICAL PERFORMANCE
(continued from previous page)
| AVERAGE ANNUAL RETURNS AS OF OCTOBER 31, 2014 (unaudited) | ||||||||||||
| NAV Returns | SEC Returns (reflects applicable sales charges) | SEC Yields* | ||||||||||
| Class A Shares | 2.02 | % | ||||||||||
1 Year | 5.34 | % | 0.85 | % | ||||||||
5 Years | 5.15 | % | 4.23 | % | ||||||||
10 Years | 4.61 | % | 4.16 | % | ||||||||
| Class B Shares | 1.42 | % | ||||||||||
1 Year | 4.61 | % | 1.61 | % | ||||||||
5 Years | 4.43 | % | 4.43 | % | ||||||||
10 Years(a) | 4.23 | % | 4.23 | % | ||||||||
| Class C Shares | 1.41 | % | ||||||||||
1 Year | 4.63 | % | 3.63 | % | ||||||||
5 Years | 4.43 | % | 4.43 | % | ||||||||
10 Years | 3.91 | % | 3.91 | % | ||||||||
| Advisor Class Shares† | 2.43 | % | ||||||||||
1 Year | 5.65 | % | 5.65 | % | ||||||||
5 Years | 5.46 | % | 5.46 | % | ||||||||
10 Years | 4.92 | % | 4.92 | % | ||||||||
| Class R Shares† | 1.67 | % | ||||||||||
1 Year | 5.13 | % | 5.13 | % | ||||||||
5 Years | 4.94 | % | 4.94 | % | ||||||||
10 Years | 4.41 | % | 4.41 | % | ||||||||
| Class K Shares† | 1.97 | % | ||||||||||
1 Year | 5.30 | % | 5.30 | % | ||||||||
5 Years | 5.18 | % | 5.18 | % | ||||||||
Since Inception‡ | 4.80 | % | 4.80 | % | ||||||||
| Class I Shares† | 2.29 | % | ||||||||||
1 Year | 5.65 | % | 5.65 | % | ||||||||
5 Years | 5.45 | % | 5.45 | % | ||||||||
Since Inception‡ | 5.07 | % | 5.07 | % | ||||||||
| Class Z Shares† | 2.32 | % | ||||||||||
Since Inception‡ | 2.61 | % | 2.61 | % | ||||||||
The Portfolio’s prospectus fee table shows the Portfolio’s total annual operating expense ratios as 1.02%, 1.74%, 1.73%, 0.72%, 1.31%, 0.93%, 0.67% and 0.57% for Class A, Class B, Class C, Advisor Class, Class R, Class K, Class I and Class Z shares, respectively, gross of any fee waivers or expense reimbursements. Contractual fee waivers and/or expense reimbursements limit the Portfolio’s annual operating expense ratios (exclusive of interest expense) to 0.90%, 1.60%, 1.60%, 0.60%, 1.10%, 0.85%, 0.60% and 0.60% for Class A, Class B, Class C, Advisor Class, Class R, Class K, Class I and Class Z shares, respectively. These waivers/reimbursements may not be terminated before January 31, 2015 and may be extended by the Adviser for additional one-year terms. Absent reimbursements or waivers, performance would have been lower, with the exception of Class Z shares, as this share class is currently operating below its contractual expense cap. The Financial Highlights section of this report sets forth expense ratio data for the current reporting period; the expense ratios shown above may differ from the expense ratios in the Financial Highlights sections since they are based on different time periods.
| * | SEC yields are calculated based on SEC guidelines for the 30-day period ended October 31, 2014. |
| (a) | Assumes conversion of Class B shares into Class A shares after six years. |
| † | These share classes are offered at NAV to eligible investors and their SEC returns are the same as their NAV returns. Please note that these share classes are for investors purchasing shares through accounts established under certain fee-based programs sponsored and maintained by certain broker-dealers and financial intermediaries, institutional pension plans and/or investment advisory clients of, and certain other persons associated with, the Adviser and its affiliates or the Portfolio. |
| ‡ | Inception dates: 3/1/2005 for Class K and Class I shares; 4/25/2014 for Class Z shares. |
See Disclosures, Risks and Note about Historical Performance on pages 4-5.
(Historical Performance continued on next page)
| 8 | • ALLIANCEBERNSTEIN BOND FUND INTERMEDIATE BOND PORTFOLIO |
Historical Performance
HISTORICAL PERFORMANCE
(continued from previous page)
SEC AVERAGE ANNUAL RETURNS AS OF THE MOST RECENT CALENDAR QUARTER-END SEPTEMBER 30, 2014 (unaudited) | ||||
| SEC Returns (reflects applicable sales charges) | ||||
| Class A Shares | ||||
1 Year | 1.59 | % | ||
5 Years | 4.35 | % | ||
10 Years | 4.16 | % | ||
| Class B Shares | ||||
1 Year | 2.33 | % | ||
5 Years | 4.53 | % | ||
10 Years(a) | 4.23 | % | ||
| Class C Shares | ||||
1 Year | 4.35 | % | ||
5 Years | 4.53 | % | ||
10 Years | 3.91 | % | ||
| Advisor Class Shares† | ||||
1 Year | 6.47 | % | ||
5 Years | 5.58 | % | ||
10 Years | 4.95 | % | ||
| Class R Shares† | ||||
1 Year | 5.86 | % | ||
5 Years | 5.04 | % | ||
10 Years | 4.42 | % | ||
| Class K Shares† | ||||
1 Year | 6.12 | % | ||
5 Years | 5.30 | % | ||
Since Inception‡ | 4.77 | % | ||
| Class I Shares† | ||||
1 Year | 6.48 | % | ||
5 Years | 5.58 | % | ||
Since Inception‡ | 5.04 | % | ||
| Class Z Shares† | ||||
Since Inception‡ | 1.82 | % | ||
| (a) | Assumes conversion of Class B shares into Class A shares after six years. |
| † | Please note that these share classes are for investors purchasing shares through accounts established under certain fee-based programs sponsored and maintained by certain broker-dealers and financial intermediaries, institutional pension plans and/or investment advisory clients of, and certain other persons associated with, the Adviser and its affiliates or the Portfolio. |
| ‡ | Inception dates: 3/1/2005 for Class K and Class I shares; 4/25/2014 for Class Z shares. |
See Disclosures, Risks and Note about Historical Performance on pages 4-5.
| ALLIANCEBERNSTEIN BOND FUND INTERMEDIATE BOND PORTFOLIO • | 9 |
Historical Performance
EXPENSE EXAMPLE
(unaudited)
As a shareholder of the Fund, you incur two types of costs: (1) transaction costs, including sales charges (loads) on purchase payments, contingent deferred sales charges on redemptions and (2) ongoing costs, including management fees; distribution (12b-1) fees; and other Fund expenses. This example is intended to help you understand your ongoing costs (in dollars) of investing in the Fund and to compare these costs with the ongoing costs of investing in other mutual funds.
The Example is based on an investment of $1,000 invested at the beginning of the period and held for the entire period as indicated below.
Actual Expenses
The table below provides information about actual account values and actual expenses. You may use the information, together with the amount you invested, to estimate the expenses that you paid over the period. Simply divide your account value by $1,000 (for example, an $8,600 account value divided by $1,000 = 8.6), then multiply the result by the number under the heading entitled “Expenses Paid During Period” to estimate the expenses you paid on your account during this period.
Hypothetical Example for Comparison Purposes
The table below also provides information about hypothetical account values and hypothetical expenses based on the Fund’s actual expense ratio and an assumed annual rate of return of 5% before expenses, which is not the Fund’s actual return. The hypothetical account values and expenses may not be used to estimate the actual ending account balance or expenses you paid for the period. You may use this information to compare the ongoing costs of investing in the Fund and other funds by comparing this 5% hypothetical example with the 5% hypothetical examples that appear in the shareholder reports of other funds.
Please note that the expenses shown in the table are meant to highlight your ongoing costs only and do not reflect any transactional costs, such as sales charges (loads), or contingent deferred sales charges on redemptions. Therefore, the hypothetical example is useful in comparing ongoing costs only, and will not help you determine the relative total costs of owning different funds. In addition, if these transactional costs were included, your costs would have been higher.
| Beginning Account Value May 1, 2014 | Ending Account Value October 31, 2014 | Expenses Paid During Period* | Annualized Expense Ratio* | |||||||||||||
| Class A | ||||||||||||||||
Actual | $ | 1,000 | $ | 1,023.20 | $ | 4.59 | 0.90 | % | ||||||||
Hypothetical** | $ | 1,000 | $ | 1,020.67 | $ | 4.58 | 0.90 | % | ||||||||
| Class B | ||||||||||||||||
Actual | $ | 1,000 | $ | 1,018.70 | $ | 8.14 | 1.60 | % | ||||||||
Hypothetical** | $ | 1,000 | $ | 1,017.14 | $ | 8.13 | 1.60 | % | ||||||||
| Class C | ||||||||||||||||
Actual | $ | 1,000 | $ | 1,019.60 | $ | 8.14 | 1.60 | % | ||||||||
Hypothetical** | $ | 1,000 | $ | 1,017.14 | $ | 8.13 | 1.60 | % | ||||||||
| Advisor Class | ||||||||||||||||
Actual | $ | 1,000 | $ | 1,023.80 | $ | 3.06 | 0.60 | % | ||||||||
Hypothetical** | $ | 1,000 | $ | 1,022.18 | $ | 3.06 | 0.60 | % | ||||||||
| Class R | ||||||||||||||||
Actual | $ | 1,000 | $ | 1,022.20 | $ | 5.61 | 1.10 | % | ||||||||
Hypothetical** | $ | 1,000 | $ | 1,019.66 | $ | 5.60 | 1.10 | % | ||||||||
| Class K | ||||||||||||||||
Actual | $ | 1,000 | $ | 1,022.50 | $ | 4.33 | 0.85 | % | ||||||||
Hypothetical** | $ | 1,000 | $ | 1,020.92 | $ | 4.33 | 0.85 | % | ||||||||
| Class I | ||||||||||||||||
Actual | $ | 1,000 | $ | 1,023.80 | $ | 3.06 | 0.60 | % | ||||||||
Hypothetical** | $ | 1,000 | $ | 1,022.18 | $ | 3.06 | 0.60 | % | ||||||||
| Class Z | ||||||||||||||||
Actual | $ | 1,000 | $ | 1,024.80 | $ | 3.06 | 0.60 | % | ||||||||
Hypothetical** | $ | 1,000 | $ | 1,022.18 | $ | 3.06 | 0.60 | % | ||||||||
| * | Expenses are equal to the classes’ annualized expense ratios multiplied by the average account value over the period, multiplied by 184/365 (to reflect the one-half year period). |
| ** | Assumes 5% annual return before expenses. |
| 10 | • ALLIANCEBERNSTEIN BOND FUND INTERMEDIATE BOND PORTFOLIO |
Expense Example
PORTFOLIO SUMMARY
October 31, 2014 (unaudited)
PORTFOLIO STATISTICS
Net Assets ($mil): $353.0
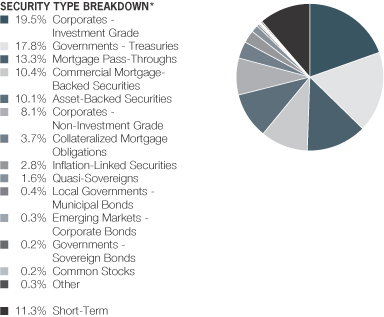
| * | All data are as of October 31, 2014. The Portfolio’s security type breakdown is expressed as a percentage of total investments and may vary over time. The Portfolio also enters into derivative transactions, which may be used for hedging or investment purposes (see “Portfolio of Investments” section of the report for additional details). “Other” security type weightings represent 0.2% or less in the following types: Governments-Sovereign Agencies, Options Purchased-Puts, and Preferred Stocks. |
| ALLIANCEBERNSTEIN BOND FUND INTERMEDIATE BOND PORTFOLIO • | 11 |
Portfolio Summary
PORTFOLIO OF INVESTMENTS
October 31, 2014
| Principal Amount (000) | U.S. $ Value | |||||||||
| ||||||||||
CORPORATES – INVESTMENT GRADE – 21.8% |
| |||||||||
Industrial – 12.5% | ||||||||||
Basic – 1.3% | ||||||||||
Basell Finance Co. BV | U.S.$ | 405 | $ | 542,971 | ||||||
Cia Minera Milpo SAA | 598 | 601,891 | ||||||||
Glencore Funding LLC | 286 | 284,871 | ||||||||
International Paper Co. | 198 | 195,780 | ||||||||
4.75%, 2/15/22 | 235 | 254,836 | ||||||||
LyondellBasell Industries NV | 766 | 894,185 | ||||||||
Minsur SA | 907 | 999,273 | ||||||||
Sociedad Quimica y Minera de Chile SA | 562 | 539,599 | ||||||||
Vale SA | 136 | 134,395 | ||||||||
|
| |||||||||
| 4,447,801 | ||||||||||
|
| |||||||||
Capital Goods – 0.6% | ||||||||||
Odebrecht Finance Ltd. | 541 | 516,655 | ||||||||
Owens Corning | 955 | 1,049,549 | ||||||||
Yamana Gold, Inc. | 724 | 708,132 | ||||||||
|
| |||||||||
| 2,274,336 | ||||||||||
|
| |||||||||
Communications - Media – 2.0% | ||||||||||
21st Century Fox America, Inc. | 902 | 1,105,192 | ||||||||
6.55%, 3/15/33 | 142 | 179,125 | ||||||||
CBS Corp. | 710 | 812,365 | ||||||||
DirecTV Holdings LLC/DirecTV Financing Co., Inc. | 252 | 256,697 | ||||||||
4.45%, 4/01/24 | 349 | 364,123 | ||||||||
4.60%, 2/15/21 | 565 | 611,983 | ||||||||
5.20%, 3/15/20 | 97 | 108,467 | ||||||||
Globo Comunicacao e Participacoes SA | 431 | 456,860 | ||||||||
NBCUniversal Enterprise, Inc. | 604 | 629,182 | ||||||||
Time Warner Cable, Inc. | 740 | 828,217 | ||||||||
| 12 | • ALLIANCEBERNSTEIN BOND FUND INTERMEDIATE BOND PORTFOLIO |
Portfolio of Investments
| Principal Amount (000) | U.S. $ Value | |||||||||
| ||||||||||
Time Warner, Inc. | ||||||||||
4.70%, 1/15/21 | U.S.$ | 600 | $ | 656,892 | ||||||
7.625%, 4/15/31 | 154 | 210,359 | ||||||||
Viacom, Inc. | 503 | 503,186 | ||||||||
5.625%, 9/15/19 | 240 | 272,960 | ||||||||
|
| |||||||||
| 6,995,608 | ||||||||||
|
| |||||||||
Communications - Telecommunications – 1.9% | ||||||||||
American Tower Corp. | 1,185 | 1,291,449 | ||||||||
AT&T, Inc. | 233 | 248,768 | ||||||||
Deutsche Telekom International Finance BV | 500 | 517,241 | ||||||||
Rogers Communications, Inc. | CAD | 130 | 120,243 | |||||||
SBA Tower Trust | U.S.$ | 688 | 689,828 | |||||||
Telefonica Emisiones SAU | 520 | 583,590 | ||||||||
Verizon Communications, Inc. | 1,034 | 1,157,964 | ||||||||
6.55%, 9/15/43 | 1,625 | 2,048,485 | ||||||||
|
| |||||||||
| 6,657,568 | ||||||||||
|
| |||||||||
Consumer Cyclical - Automotive – 0.4% | ||||||||||
Ford Motor Credit Co. LLC | 1,291 | 1,492,087 | ||||||||
|
| |||||||||
Consumer Cyclical - Other – 0.2% | ||||||||||
Host Hotels & Resorts LP | 545 | 595,262 | ||||||||
|
| |||||||||
Consumer Non-Cyclical – 1.1% | ||||||||||
Actavis Funding SCS | 238 | 231,646 | ||||||||
Bayer US Finance LLC | 321 | 321,939 | ||||||||
Bunge Ltd. Finance Corp. | 130 | 133,925 | ||||||||
Grupo Bimbo SAB de CV | 538 | 535,471 | ||||||||
Kroger Co. (The) | 916 | 927,118 | ||||||||
Reynolds American, Inc. | 616 | 601,567 | ||||||||
Thermo Fisher Scientific, Inc. | 383 | 400,951 | ||||||||
Tyson Foods, Inc. | 164 | 165,563 | ||||||||
| ALLIANCEBERNSTEIN BOND FUND INTERMEDIATE BOND PORTFOLIO • | 13 |
Portfolio of Investments
| Principal Amount (000) | U.S. $ Value | |||||||||||
| ||||||||||||
3.95%, 8/15/24 | U.S.$ | 541 | $ | 551,769 | ||||||||
|
| |||||||||||
| 3,869,949 | ||||||||||||
|
| |||||||||||
Energy – 3.3% | ||||||||||||
Diamond Offshore Drilling, Inc. | 292 | 262,571 | ||||||||||
Encana Corp. | 415 | 433,153 | ||||||||||
Energy Transfer Partners LP | 411 | 471,572 | ||||||||||
7.50%, 7/01/38 | 237 | 300,002 | ||||||||||
Enterprise Products Operating LLC | 235 | 263,774 | ||||||||||
Hess Corp. | 85 | 115,010 | ||||||||||
Kinder Morgan Energy Partners LP | 1,460 | 1,456,052 | ||||||||||
4.15%, 3/01/22 | 339 | 346,509 | ||||||||||
Nabors Industries, Inc. | 593 | 634,549 | ||||||||||
Noble Energy, Inc. | 1,232 | 1,518,250 | ||||||||||
Noble Holding International Ltd. | 305 | 294,204 | ||||||||||
4.90%, 8/01/20 | 108 | 111,598 | ||||||||||
Reliance Holding USA, Inc. | 636 | 696,924 | ||||||||||
Sunoco Logistics Partners Operations LP | 460 | 475,905 | ||||||||||
TransCanada PipeLines Ltd. | 831 | 839,310 | ||||||||||
Transocean, Inc. | 4 | 4,203 | ||||||||||
6.50%, 11/15/20 | 855 | 879,440 | ||||||||||
Valero Energy Corp. | 770 | 896,824 | ||||||||||
Weatherford International Ltd./Bermuda | 605 | 773,126 | ||||||||||
Williams Partners LP | 403 | 423,769 | ||||||||||
5.25%, 3/15/20 | 371 | 411,874 | ||||||||||
|
| |||||||||||
| 11,608,619 | ||||||||||||
|
| |||||||||||
Other Industrial – 0.1% | ||||||||||||
Hutchison Whampoa International 14 Ltd. | 340 | 339,423 | ||||||||||
|
| |||||||||||
Technology – 1.1% | ||||||||||||
Agilent Technologies, Inc. | 217 | 237,391 | ||||||||||
| 14 | • ALLIANCEBERNSTEIN BOND FUND INTERMEDIATE BOND PORTFOLIO |
Portfolio of Investments
| Principal Amount (000) | U.S. $ Value | |||||||||
| ||||||||||
Hewlett-Packard Co. | U.S.$ | 266 | $ | 285,583 | ||||||
Kla-tencor Corp. | 840 | 846,460 | ||||||||
Motorola Solutions, Inc. | 794 | 772,689 | ||||||||
7.50%, 5/15/25 | 30 | 38,162 | ||||||||
Seagate HDD Cayman | 336 | 339,780 | ||||||||
Telefonaktiebolaget LM Ericsson | 64 | 66,932 | ||||||||
Tencent Holdings Ltd. | 517 | 525,676 | ||||||||
Total System Services, Inc. | 344 | 342,669 | ||||||||
3.75%, 6/01/23 | 350 | 344,196 | ||||||||
|
| |||||||||
| 3,799,538 | ||||||||||
|
| |||||||||
Transportation - Services – 0.5% | ||||||||||
Asciano Finance Ltd. | 753 | 765,845 | ||||||||
5.00%, 4/07/18(a) | 722 | 780,008 | ||||||||
Ryder System, Inc. | 383 | 417,642 | ||||||||
|
| |||||||||
| 1,963,495 | ||||||||||
|
| |||||||||
| 44,043,686 | ||||||||||
|
| |||||||||
Financial Institutions – 8.0% | ||||||||||
Banking – 4.6% | ||||||||||
Bank of America Corp. | 1,053 | 1,063,076 | ||||||||
Barclays Bank PLC | EUR | 605 | 957,172 | |||||||
BPCE SA | U.S.$ | 737 | 791,435 | |||||||
Compass Bank | 1,339 | 1,469,211 | ||||||||
Countrywide Financial Corp. | 62 | 66,602 | ||||||||
Credit Suisse AG | 794 | 875,471 | ||||||||
Deutsche Bank AG | 1,315 | 1,276,181 | ||||||||
Goldman Sachs Group, Inc. (The) | 905 | 914,279 | ||||||||
Series D | 1,430 | 1,644,516 | ||||||||
Macquarie Bank Ltd. | 282 | 303,845 | ||||||||
| ALLIANCEBERNSTEIN BOND FUND INTERMEDIATE BOND PORTFOLIO • | 15 |
Portfolio of Investments
| Principal Amount (000) | U.S. $ Value | |||||||||
| ||||||||||
Macquarie Group Ltd. | U.S.$ | 668 | $ | 720,242 | ||||||
Mizuho Financial Group Cayman 3 Ltd. | 812 | 845,294 | ||||||||
Morgan Stanley | 478 | 541,466 | ||||||||
Series G | 590 | 666,514 | ||||||||
Murray Street Investment Trust I | 125 | 133,452 | ||||||||
National Capital Trust II Delaware | 372 | 375,255 | ||||||||
Nordea Bank AB | 350 | 350,735 | ||||||||
Rabobank Capital Funding Trust III | 430 | 451,500 | ||||||||
Standard Chartered PLC Series E | 1,310 | 1,346,326 | ||||||||
Turkiye Garanti Bankasi AS | 316 | 320,241 | ||||||||
UBS AG/Stamford CT | 620 | 731,697 | ||||||||
Wells Fargo Bank NA | 456 | 570,250 | ||||||||
|
| |||||||||
| 16,414,760 | ||||||||||
|
| |||||||||
Finance – 0.2% | ||||||||||
Aviation Capital Group Corp. | 552 | 631,143 | ||||||||
|
| |||||||||
Insurance – 2.5% | ||||||||||
American International Group, Inc. | 680 | 812,022 | ||||||||
8.175%, 5/15/58 | 940 | 1,276,050 | ||||||||
Coventry Health Care, Inc. | 115 | 116,221 | ||||||||
Dai-ichi Life Insurance Co., Ltd. (The) | 393 | 401,646 | ||||||||
Guardian Life Insurance Co. of America (The) | 542 | 742,459 | ||||||||
Hartford Financial Services Group, Inc. (The) | 280 | 283,807 | ||||||||
5.50%, 3/30/20 | 726 | 823,129 | ||||||||
Lincoln National Corp. | 361 | 458,490 | ||||||||
MetLife Capital Trust IV | 699 | 892,972 | ||||||||
Nationwide Mutual Insurance Co. | 246 | 379,127 | ||||||||
| 16 | • ALLIANCEBERNSTEIN BOND FUND INTERMEDIATE BOND PORTFOLIO |
Portfolio of Investments
| Principal Amount (000) | U.S. $ Value | |||||||||
| ||||||||||
Prudential Financial, Inc. | U.S.$ | 920 | $ | 954,500 | ||||||
Swiss Reinsurance Co. via ELM BV | EUR | 850 | 1,115,774 | |||||||
ZFS Finance USA Trust V | U.S.$ | 538 | 578,350 | |||||||
|
| |||||||||
| 8,834,547 | ||||||||||
|
| |||||||||
REITS – 0.7% | ||||||||||
HCP, Inc. | 1,410 | 1,576,338 | ||||||||
Trust F/1401 | 830 | 875,650 | ||||||||
|
| |||||||||
| 2,451,988 | ||||||||||
|
| |||||||||
| 28,332,438 | ||||||||||
|
| |||||||||
Utility – 0.8% | ||||||||||
Electric – 0.4% | ||||||||||
CMS Energy Corp. | 440 | 492,995 | ||||||||
Constellation Energy Group, Inc. | 260 | 289,615 | ||||||||
Exelon Generation Co. LLC | 337 | 351,689 | ||||||||
TECO Finance, Inc. | 380 | 425,993 | ||||||||
|
| |||||||||
| 1,560,292 | ||||||||||
|
| |||||||||
Natural Gas – 0.4% | ||||||||||
Talent Yield Investments Ltd. | 1,365 | 1,420,419 | ||||||||
|
| |||||||||
| 2,980,711 | ||||||||||
|
| |||||||||
Non Corporate Sectors – 0.5% | ||||||||||
ABS - Other – 0.1% | ||||||||||
Rio Oil Finance Trust | 403 | 419,120 | ||||||||
|
| |||||||||
Agencies - Not Government | ||||||||||
CNOOC Finance 2013 Ltd. | 915 | 867,959 | ||||||||
OCP SA | 298 | 312,587 | ||||||||
|
| |||||||||
| 1,180,546 | ||||||||||
|
| |||||||||
| 1,599,666 | ||||||||||
|
| |||||||||
Total Corporates – Investment Grade | 76,956,501 | |||||||||
|
| |||||||||
| ALLIANCEBERNSTEIN BOND FUND INTERMEDIATE BOND PORTFOLIO • | 17 |
Portfolio of Investments
| Principal Amount (000) | U.S. $ Value | |||||||||
| ||||||||||
GOVERNMENTS – TREASURIES – 19.9% | ||||||||||
Mexico – 1.0% | ||||||||||
Mexican Bonos | MXN | 47,810 | $ | 3,559,521 | ||||||
|
| |||||||||
New Zealand – 1.2% | ||||||||||
New Zealand Government Bond | NZD | 5,000 | 4,086,527 | |||||||
|
| |||||||||
United Kingdom – 0.8% | ||||||||||
United Kingdom Gilt | GBP | 1,461 | 2,624,372 | |||||||
|
| |||||||||
United States – 16.9% | ||||||||||
U.S. Treasury Bonds | U.S.$ | 18,462 | 18,689,591 | |||||||
U.S. Treasury Notes | ||||||||||
1.50%, 5/31/19 | 751 | 749,891 | ||||||||
1.625%, 8/31/19 | 2,155 | 2,158,198 | ||||||||
1.75%, 9/30/19-5/15/22 | 7,939 | 7,973,005 | ||||||||
2.375%, 8/15/24 | 15,374 | 15,433,951 | ||||||||
2.50%, 5/15/24 | 11,674 | 11,861,881 | ||||||||
2.75%, 2/15/24 | 2,823 | 2,932,159 | ||||||||
|
| |||||||||
| 59,798,676 | ||||||||||
|
| |||||||||
Total Governments – Treasuries | 70,069,096 | |||||||||
|
| |||||||||
MORTGAGE PASS-THROUGHS – 15.0% | ||||||||||
Agency Fixed Rate 30-Year – 13.6% | ||||||||||
Federal Home Loan Mortgage Corp. Gold | 502 | 565,331 | ||||||||
Series 2007 | 69 | 77,477 | ||||||||
Federal National Mortgage Association | 13,271 | 13,684,154 | ||||||||
4.00%, 12/01/44, TBA | 16,659 | 17,640,083 | ||||||||
4.50%, 4/01/44 | 1,808 | 1,965,594 | ||||||||
5.50%, 1/01/35 | 1,360 | 1,527,880 | ||||||||
Series 2003 | 492 | 554,041 | ||||||||
Series 2004 | 282 | 316,558 | ||||||||
Series 2005 | 210 | 235,913 | ||||||||
Series 2007 | 899 | 1,011,217 | ||||||||
| 18 | • ALLIANCEBERNSTEIN BOND FUND INTERMEDIATE BOND PORTFOLIO |
Portfolio of Investments
| Principal Amount (000) | U.S. $ Value | |||||||||
| ||||||||||
Series 2014 | U.S.$ | 6,167 | $ | 6,710,536 | ||||||
Government National Mortgage Association | 3,419 | 3,567,847 | ||||||||
Series 1990 | – 0 | –* | 55 | |||||||
Series 1999 | 79 | 87,429 | ||||||||
|
| |||||||||
| 47,944,115 | ||||||||||
|
| |||||||||
Agency Fixed Rate 15-Year – 1.4% | ||||||||||
Federal National Mortgage Association | 4,845 | 5,014,954 | ||||||||
|
| |||||||||
Agency ARMs – 0.0% | ||||||||||
Federal Home Loan Mortgage Corp. | 79 | 84,647 | ||||||||
|
| |||||||||
Total Mortgage Pass-Throughs | 53,043,716 | |||||||||
|
| |||||||||
COMMERCIAL MORTGAGE-BACKED SECURITIES – 11.6% | ||||||||||
Non-Agency Fixed Rate CMBS – 10.5% | ||||||||||
Banc of America Commercial Mortgage Trust | 1,707 | 1,876,727 | ||||||||
Series 2007-5, Class AM | 411 | 440,733 | ||||||||
Bear Stearns Commercial Mortgage Securities Trust | 538 | 556,564 | ||||||||
BHMS Mortgage Trust | 890 | 893,726 | ||||||||
CGRBS Commercial Mortgage Trust | 1,305 | 1,320,631 | ||||||||
Citigroup Commercial Mortgage Trust | 363 | 383,718 | ||||||||
Series 2013-GC17, Class D | 565 | 548,395 | ||||||||
COBALT CMBS Commercial Mortgage Trust | 627 | 687,082 | ||||||||
Commercial Mortgage Pass-Through Certificates | 2,225 | 2,394,571 | ||||||||
| ALLIANCEBERNSTEIN BOND FUND INTERMEDIATE BOND PORTFOLIO • | 19 |
Portfolio of Investments
| Principal Amount (000) | U.S. $ Value | |||||||||
| ||||||||||
Series 2007-GG9, Class AM | U.S.$ | 829 | $ | 874,736 | ||||||
Series 2013-SFS, Class A1 | 582 | 568,559 | ||||||||
Credit Suisse Commercial Mortgage Trust | 437 | 461,661 | ||||||||
Extended Stay America Trust | 890 | 876,386 | ||||||||
GS Mortgage Securities Corp. II | 1,319 | 1,333,495 | ||||||||
GS Mortgage Securities Trust | 766 | 757,587 | ||||||||
JP Morgan Chase Commercial Mortgage Securities Trust | 278 | 277,530 | ||||||||
Series 2006-CB15, Class A4 | 2,007 | 2,122,539 | ||||||||
Series 2007-CB19, Class AM | 470 | 498,046 | ||||||||
Series 2007-LD12, Class A4 | 1,580 | 1,723,840 | ||||||||
Series 2007-LD12, Class AM | 795 | 874,071 | ||||||||
Series 2007-LDPX, Class A1A | 2,286 | 2,475,470 | ||||||||
Series 2008-C2, Class A1A | 710 | 784,120 | ||||||||
Series 2010-C2, Class A1 | 749 | 760,292 | ||||||||
LSTAR Commercial Mortgage Trust | 527 | 532,096 | ||||||||
Merrill Lynch Mortgage Trust | 811 | 866,153 | ||||||||
Merrill Lynch/Countrywide Commercial Mortgage Trust | 2,997 | 3,188,242 | ||||||||
Series 2007-9, Class A4 | 2,940 | 3,208,945 | ||||||||
Motel 6 Trust | 1,047 | 1,045,969 | ||||||||
| 20 | • ALLIANCEBERNSTEIN BOND FUND INTERMEDIATE BOND PORTFOLIO |
Portfolio of Investments
| Principal Amount (000) | U.S. $ Value | |||||||||
| ||||||||||
Prudential Securities Secured Financing Corp. | U.S.$ | 4,350 | $ | 33,063 | ||||||
UBS-Barclays Commercial Mortgage Trust | 552 | 555,094 | ||||||||
Series 2012-C4, Class A5 | 1,098 | 1,081,722 | ||||||||
Wachovia Bank Commercial Mortgage Trust Series 2006-C23, Class A5 | 1,345 | 1,406,262 | ||||||||
WF-RBS Commercial Mortgage Trust | 1,142 | 1,161,569 | ||||||||
Series 2014-C20, Class A2 | 546 | 565,523 | ||||||||
|
| |||||||||
| 37,135,117 | ||||||||||
|
| |||||||||
Non-Agency Floating Rate CMBS – 1.1% | ||||||||||
Commercial Mortgage Pass Through Certificates | 647 | 646,624 | ||||||||
Commercial Mortgage Pass-Through Certificates | 559 | 559,623 | ||||||||
Extended Stay America Trust | 685 | 684,932 | ||||||||
JP Morgan Chase Commercial Mortgage Securities Trust | 902 | 900,608 | ||||||||
PFP III Ltd. | 706 | 703,385 | ||||||||
Resource Capital Corp., Ltd. | 385 | 384,500 | ||||||||
|
| |||||||||
| 3,879,672 | ||||||||||
|
| |||||||||
Agency CMBS – 0.0% | ||||||||||
Government National Mortgage Association | 2,572 | 22,359 | ||||||||
|
| |||||||||
Total Commercial Mortgage-Backed Securities | 41,037,148 | |||||||||
|
| |||||||||
| ALLIANCEBERNSTEIN BOND FUND INTERMEDIATE BOND PORTFOLIO • | 21 |
Portfolio of Investments
| Principal Amount (000) | U.S. $ Value | |||||||||
| ||||||||||
ASSET-BACKED SECURITIES – 11.3% | ||||||||||
Autos - Fixed Rate – 7.4% | ||||||||||
Ally Master Owner Trust | U.S.$ | 1,300 | $ | 1,304,144 | ||||||
Series 2014-1, Class A2 | 1,409 | 1,411,593 | ||||||||
AmeriCredit Automobile Receivables Trust | 900 | 925,925 | ||||||||
Series 2013-3, Class A3 | 1,695 | 1,698,166 | ||||||||
Series 2013-4, Class A3 | 640 | 641,595 | ||||||||
Series 2013-5, Class A2A | 246 | 246,638 | ||||||||
ARI Fleet Lease Trust | 575 | 574,955 | ||||||||
Series 2014-A, Class A2 | 383 | 382,448 | ||||||||
Avis Budget Rental Car Funding AESOP LLC | 1,005 | 1,012,410 | ||||||||
Series 2014-1A, Class A | 1,769 | 1,776,306 | ||||||||
California Republic Auto Receivables Trust | 546 | 546,054 | ||||||||
Capital Auto Receivables Asset Trust | 1,330 | 1,334,249 | ||||||||
Series 2014-1, Class B | 220 | 222,486 | ||||||||
Capital Auto Receivables Asset Trust/Ally | 532 | 531,875 | ||||||||
CarMax Auto Owner Trust | 222 | 222,072 | ||||||||
CPS Auto Receivables Trust | 518 | 519,853 | ||||||||
Series 2014-B, Class A | 505 | 504,129 | ||||||||
Enterprise Fleet Financing LLC | 428 | 428,077 | ||||||||
| 22 | • ALLIANCEBERNSTEIN BOND FUND INTERMEDIATE BOND PORTFOLIO |
Portfolio of Investments
| Principal Amount (000) | U.S. $ Value | |||||||||
| ||||||||||
Exeter Automobile Receivables Trust | U.S.$ | 191 | $ | 190,775 | ||||||
Series 2013-1A, Class A | 222 | 222,373 | ||||||||
Series 2014-1A, Class A | 347 | 347,289 | ||||||||
Series 2014-2A, Class A | 288 | 287,371 | ||||||||
Fifth Third Auto Trust | 721 | 717,611 | ||||||||
Flagship Credit Auto Trust | 241 | 240,992 | ||||||||
Ford Auto Securitization Trust | CAD | 480 | 426,278 | |||||||
Series 2013-R4A, Class A1 | 24 | 21,372 | ||||||||
Ford Credit Auto Lease Trust | U.S.$ | 644 | 644,803 | |||||||
Ford Credit Auto Owner Trust | 895 | 898,533 | ||||||||
Series 2012-D, Class B | 440 | 438,491 | ||||||||
Ford Credit Floorplan Master Owner Trust | 842 | 844,131 | ||||||||
Series 2014-1, Class A1 | 993 | 993,667 | ||||||||
Hertz Vehicle Financing LLC | 880 | 880,738 | ||||||||
Series 2013-1A, Class A2 | 2,370 | 2,348,656 | ||||||||
Mercedes-Benz Auto Lease Trust | 825 | 825,001 | ||||||||
Santander Drive Auto Receivables Trust | 1,315 | 1,318,260 | ||||||||
Series 2013-5, Class A2A | 225 | 224,939 | ||||||||
|
| |||||||||
| 26,154,255 | ||||||||||
|
| |||||||||
| ALLIANCEBERNSTEIN BOND FUND INTERMEDIATE BOND PORTFOLIO • | 23 |
Portfolio of Investments
| Principal Amount (000) | U.S. $ Value | |||||||||
| ||||||||||
Credit Cards - Fixed Rate – 1.1% | ||||||||||
American Express Credit Account Master Trust | U.S.$ | 400 | $ | 400,640 | ||||||
Barclays Dryrock Issuance Trust | 1,119 | 1,129,254 | ||||||||
Discover Card Master Trust | 891 | 893,106 | ||||||||
World Financial Network Credit Card Master Trust | 890 | 897,914 | ||||||||
Series 2013-A, Class A | 570 | 567,835 | ||||||||
|
| |||||||||
| 3,888,749 | ||||||||||
|
| |||||||||
Credit Cards - Floating Rate – 1.1% | ||||||||||
Barclays Dryrock Issuance Trust | 358 | 358,000 | ||||||||
First National Master Note Trust | 882 | 884,672 | ||||||||
Gracechurch Card Funding PLC | EUR | 1,235 | 1,549,909 | |||||||
World Financial Network Credit Card Master Trust | U.S.$ | 865 | 866,557 | |||||||
|
| |||||||||
| 3,659,138 | ||||||||||
|
| |||||||||
Autos - Floating Rate – 0.7% | ||||||||||
GE Dealer Floorplan Master Note Trust | 686 | 686,724 | ||||||||
Hertz Fleet Lease Funding LP | 1,180 | 1,182,071 | ||||||||
Navmt | 719 | 719,000 | ||||||||
|
| |||||||||
| 2,587,795 | ||||||||||
|
| |||||||||
Other ABS - Fixed Rate – 0.5% | ||||||||||
CIT Equipment Collateral | 1,049 | 1,054,555 | ||||||||
| 24 | • ALLIANCEBERNSTEIN BOND FUND INTERMEDIATE BOND PORTFOLIO |
Portfolio of Investments
| Principal Amount (000) | U.S. $ Value | |||||||||
| ||||||||||
GE Equipment Small Ticket LLC | U.S.$ | 790 | $ | 790,072 | ||||||
|
| |||||||||
| 1,844,627 | ||||||||||
|
| |||||||||
Other ABS - Floating Rate – 0.3% | ||||||||||
GE Dealer Floorplan Master Note Trust | 1,075 | 1,073,824 | ||||||||
|
| |||||||||
Home Equity Loans - Floating | ||||||||||
Asset Backed Funding Certificates | 65 | 62,761 | ||||||||
GSAA Trust | 969 | 669,180 | ||||||||
|
| |||||||||
| 731,941 | ||||||||||
|
| |||||||||
Home Equity Loans - Fixed Rate – 0.0% | ||||||||||
Credit-Based Asset Servicing and Securitization LLC | 118 | 117,202 | ||||||||
Nationstar NIM Ltd. | 18 | – 0 | – | |||||||
|
| |||||||||
| 117,202 | ||||||||||
|
| |||||||||
Total Asset-Backed Securities | 40,057,531 | |||||||||
|
| |||||||||
CORPORATES – NON-INVESTMENT | ||||||||||
Industrial – 5.2% | ||||||||||
Basic – 0.2% | ||||||||||
Axalta Coating Systems US Holdings, Inc./Axalta Coating Systems Dutch Holding B | 700 | 757,750 | ||||||||
Novelis, Inc. | 75 | 78,375 | ||||||||
|
| |||||||||
| 836,125 | ||||||||||
|
| |||||||||
Capital Goods – 0.1% | ||||||||||
Rexam PLC | EUR | 360 | 474,819 | |||||||
|
| |||||||||
Communications - Media – 0.9% | ||||||||||
Arqiva Broadcast Finance PLC | GBP | 300 | 524,902 | |||||||
| ALLIANCEBERNSTEIN BOND FUND INTERMEDIATE BOND PORTFOLIO • | 25 |
Portfolio of Investments
| Principal Amount (000) | U.S. $ Value | |||||||||
| ||||||||||
CSC Holdings LLC | U.S.$ | 118 | $ | 138,502 | ||||||
Intelsat Jackson Holdings SA | 750 | 800,625 | ||||||||
Numericable Group SA | EUR | 222 | 288,893 | |||||||
Quebecor Media, Inc. | U.S.$ | 391 | 402,730 | |||||||
Unitymedia Hessen GmbH & Co. | 750 | 781,875 | ||||||||
Univision Communications, Inc. | 271 | 284,889 | ||||||||
|
| |||||||||
| 3,222,416 | ||||||||||
|
| |||||||||
Communications - | ||||||||||
Sprint Corp. | 475 | 514,187 | ||||||||
Wind Acquisition Finance SA | 700 | 728,000 | ||||||||
Windstream Corp. | 750 | 755,625 | ||||||||
|
| |||||||||
| 1,997,812 | ||||||||||
|
| |||||||||
Consumer Cyclical - Automotive – 0.1% | ||||||||||
General Motors Co. | 340 | 350,200 | ||||||||
Goodyear Tire & Rubber Co. (The) | 158 | 169,850 | ||||||||
|
| |||||||||
| 520,050 | ||||||||||
|
| |||||||||
Consumer Cyclical - Other – 0.1% | ||||||||||
KB Home | 286 | 283,855 | ||||||||
MCE Finance Ltd. | 235 | 233,238 | ||||||||
|
| |||||||||
| 517,093 | ||||||||||
|
| |||||||||
Consumer Cyclical - Retailers – 0.3% | ||||||||||
Cash America International, Inc. | 295 | 306,800 | ||||||||
CST Brands, Inc. | 470 | 466,475 | ||||||||
Men’s Wearhouse, Inc. (The) | 379 | 392,739 | ||||||||
|
| |||||||||
| 1,166,014 | ||||||||||
|
| |||||||||
Consumer Non-Cyclical – 0.5% | ||||||||||
CHS/Community Health Systems, Inc. | 140 | 145,600 | ||||||||
| 26 | • ALLIANCEBERNSTEIN BOND FUND INTERMEDIATE BOND PORTFOLIO |
Portfolio of Investments
| Principal Amount (000) | U.S. $ Value | |||||||||
| ||||||||||
First Quality Finance Co., Inc. | U.S.$ | 475 | $ | 439,375 | ||||||
Priory Group No 3 PLC | GBP | 310 | 517,598 | |||||||
Voyage Care Bondco PLC | 320 | 518,303 | ||||||||
|
| |||||||||
| 1,620,876 | ||||||||||
|
| |||||||||
Energy – 1.3% | ||||||||||
Access Midstream Partners LP/ACMP | U.S.$ | 338 | 353,210 | |||||||
California Resources Corp. | 231 | 235,620 | ||||||||
Cimarex Energy Co. | 316 | 321,135 | ||||||||
5.875%, 5/01/22 | 395 | 424,625 | ||||||||
Global Partners LP/GLP Finance Corp. | 361 | 357,390 | ||||||||
Offshore Group Investment Ltd. | 671 | 553,575 | ||||||||
ONEOK, Inc. | 877 | 866,199 | ||||||||
Paragon Offshore PLC | 52 | 39,650 | ||||||||
7.25%, 8/15/24(a) | 303 | 231,795 | ||||||||
Regency Energy Partners LP/Regency Energy Finance Corp. | 135 | 133,987 | ||||||||
5.75%, 9/01/20 | 420 | 446,250 | ||||||||
SM Energy Co. | 35 | 36,138 | ||||||||
Targa Resources Partners LP/Targa | 440 | 473,000 | ||||||||
|
| |||||||||
| 4,472,574 | ||||||||||
|
| |||||||||
Other Industrial – 0.2% | ||||||||||
General Cable Corp. | 655 | 576,400 | ||||||||
|
| |||||||||
Services – 0.2% | ||||||||||
Sabre GLBL, Inc. | 673 | 723,475 | ||||||||
|
| |||||||||
Technology – 0.2% | ||||||||||
Audatex North America, Inc. | 630 | 666,225 | ||||||||
|
| |||||||||
Transportation - Airlines – 0.2% | ||||||||||
Air Canada | 640 | 673,600 | ||||||||
|
| |||||||||
| ALLIANCEBERNSTEIN BOND FUND INTERMEDIATE BOND PORTFOLIO • | 27 |
Portfolio of Investments
| Principal Amount (000) | U.S. $ Value | |||||||||
| ||||||||||
Transportation - Services – 0.3% | ||||||||||
Avis Budget Car Rental LLC/Avis Budget | U.S.$ | 670 | $ | 674,187 | ||||||
Hertz Corp. (The) | 304 | 316,920 | ||||||||
|
| |||||||||
| 991,107 | ||||||||||
|
| |||||||||
| 18,458,586 | ||||||||||
|
| |||||||||
Financial Institutions – 3.4% | ||||||||||
Banking – 2.9% | ||||||||||
ABN AMRO Bank NV | EUR | 340 | 431,397 | |||||||
Bank of America Corp. | U.S.$ | 343 | 352,432 | |||||||
Bank of Ireland | CAD | 565 | 481,256 | |||||||
Barclays Bank PLC | U.S.$ | 129 | 142,868 | |||||||
7.625%, 11/21/22 | 400 | 435,750 | ||||||||
7.75%, 4/10/23 | 402 | 440,692 | ||||||||
BNP Paribas SA | EUR | 500 | 641,437 | |||||||
5.186%, 6/29/15(a)(d) | U.S.$ | 297 | 299,970 | |||||||
Credit Agricole SA | 249 | 256,470 | ||||||||
Credit Suisse Group AG | 363 | 386,595 | ||||||||
Danske Bank A/S | GBP | 230 | 378,049 | |||||||
HBOS Capital Funding LP | EUR | 910 | 1,139,146 | |||||||
Intesa Sanpaolo SpA | U.S.$ | 569 | 556,092 | |||||||
LBG Capital No.1 PLC | 254 | 272,415 | ||||||||
Lloyds Banking Group PLC | 402 | 418,080 | ||||||||
Royal Bank of Scotland PLC (The) | 1,024 | 1,170,330 | ||||||||
Skandinaviska Enskilda Banken AB | 249 | 251,490 | ||||||||
Series E | EUR | 805 | 1,142,450 | |||||||
Societe Generale SA | 232 | 290,731 | ||||||||
5.922%, 4/05/17(a)(d) | U.S.$ | 130 | 137,150 | |||||||
| 28 | • ALLIANCEBERNSTEIN BOND FUND INTERMEDIATE BOND PORTFOLIO |
Portfolio of Investments
| Principal Amount (000) | U.S. $ Value | |||||||||
| ||||||||||
Unicredit Luxembourg Finance SA | U.S.$ | 563 | $ | 606,995 | ||||||
|
| |||||||||
| 10,231,795 | ||||||||||
|
| |||||||||
Finance – 0.2% | ||||||||||
AerCap Aviation Solutions BV | 320 | 339,200 | ||||||||
International Lease Finance Corp. | 245 | 263,987 | ||||||||
Navient Corp. | 99 | 110,633 | ||||||||
|
| |||||||||
| 713,820 | ||||||||||
|
| |||||||||
Insurance – 0.1% | ||||||||||
American Equity Investment Life Holding Co. | 430 | 453,650 | ||||||||
|
| |||||||||
REITS – 0.2% | ||||||||||
Felcor Lodging LP | 615 | 639,600 | ||||||||
|
| |||||||||
| 12,038,865 | ||||||||||
|
| |||||||||
Utility – 0.4% | ||||||||||
Electric – 0.4% | ||||||||||
AES Corp./VA | 580 | 661,744 | ||||||||
NRG Energy, Inc. | 595 | 645,575 | ||||||||
|
| |||||||||
| 1,307,319 | ||||||||||
|
| |||||||||
Total Corporates – Non-Investment Grade | 31,804,770 | |||||||||
|
| |||||||||
COLLATERALIZED MORTGAGE OBLIGATIONS – 4.1% | ||||||||||
Non-Agency Floating Rate – 1.7% | ||||||||||
Chevy Chase Funding LLC Mortgage-Backed Certificates | 615 | 463,177 | ||||||||
Deutsche Alt-A Securities Mortgage Loan Trust | 1,044 | 640,432 | ||||||||
HomeBanc Mortgage Trust | 525 | 468,660 | ||||||||
Impac Secured Assets CMN Owner Trust | 567 | 411,749 | ||||||||
| ALLIANCEBERNSTEIN BOND FUND INTERMEDIATE BOND PORTFOLIO • | 29 |
Portfolio of Investments
| Principal Amount (000) | U.S. $ Value | |||||||||
| ||||||||||
IndyMac Index Mortgage Loan Trust | U.S.$ | 769 | $ | 589,985 | ||||||
Series 2006-AR27, Class 2A2 | 818 | 701,132 | ||||||||
Residential Accredit Loans, Inc. | 672 | 372,779 | ||||||||
Series 2007-QS4, Class 2A4 | 1,000 | 367,484 | ||||||||
Residential Asset Securitization Trust | 474 | 376,165 | ||||||||
Washington Mutual Alternative Mortgage Pass-Through Certificates | 409 | 304,375 | ||||||||
Washington Mutual Mortgage Pass- | 1,324 | 1,075,167 | ||||||||
|
| |||||||||
| 5,771,105 | ||||||||||
|
| |||||||||
Non-Agency Fixed Rate – 1.5% | ||||||||||
Alternative Loan Trust | 577 | 512,635 | ||||||||
Series 2006-28CB, Class A14 | 389 | 334,240 | ||||||||
Series 2006-J1, Class 1A13 | 371 | 333,973 | ||||||||
Citigroup Mortgage Loan Trust, Inc. | 746 | 734,531 | ||||||||
Countrywide Home Loan Mortgage Pass- | 509 | 473,950 | ||||||||
Series 2006-13, Class 1A19 | 184 | 170,889 | ||||||||
Series 2007-HYB2, Class 3A1 | 752 | 620,119 | ||||||||
First Horizon Alternative Mortgage Securities Trust | 642 | 542,470 | ||||||||
JP Morgan Alternative Loan Trust | 1,078 | 836,679 | ||||||||
| 30 | • ALLIANCEBERNSTEIN BOND FUND INTERMEDIATE BOND PORTFOLIO |
Portfolio of Investments
| Principal Amount (000) | U.S. $ Value | |||||||||
| ||||||||||
Structured Asset Securities Corp. Mortgage Pass-Through Certificates | U.S.$ | 958 | $ | 830,724 | ||||||
|
| |||||||||
| 5,390,210 | ||||||||||
|
| |||||||||
GSE Risk Share Floating Rate – 0.9% | ||||||||||
Federal Home Loan Mortgage Corp. Structured Agency Credit Risk Debt Notes | 1,040 | 1,072,058 | ||||||||
Series 2014-DN3, Class M3 | 870 | 838,717 | ||||||||
Series 2014-HQ3, Class M3 | 345 | 345,762 | ||||||||
Federal National Mortgage Association Connecticut Avenue Securities | 422 | 441,759 | ||||||||
Series 2014-C03, Class 1M1 | 328 | 325,069 | ||||||||
Structured Agency Credit Risk Debt Notes | 250 | 234,634 | ||||||||
|
| |||||||||
| 3,257,999 | ||||||||||
|
| |||||||||
Agency Fixed Rate – 0.0% | ||||||||||
Fannie Mae Grantor Trust | 65 | 58,899 | ||||||||
|
| |||||||||
Total Collateralized Mortgage Obligations | 14,478,213 | |||||||||
|
| |||||||||
INFLATION-LINKED SECURITIES – 3.1% | ||||||||||
United States – 3.1% | ||||||||||
U.S. Treasury Inflation Index | 10,973 | 11,049,688 | ||||||||
|
| |||||||||
QUASI-SOVEREIGNS – 1.8% | ||||||||||
Quasi-Sovereign Bonds – 1.8% | ||||||||||
Chile – 0.1% | ||||||||||
Empresa de Transporte de Pasajeros | 358 | 377,160 | ||||||||
|
| |||||||||
China – 0.3% | ||||||||||
Sinopec Group Overseas Development | 1,095 | 1,147,006 | ||||||||
|
| |||||||||
| ALLIANCEBERNSTEIN BOND FUND INTERMEDIATE BOND PORTFOLIO • | 31 |
Portfolio of Investments
| Principal Amount (000) | U.S. $ Value | |||||||||||
| ||||||||||||
Kazakhstan – 0.3% |
| |||||||||||
KazMunayGas National Co. JSC | U.S.$ | 790 | $ | 889,935 | ||||||||
|
| |||||||||||
Malaysia – 0.5% |
| |||||||||||
Petronas Capital Ltd. | 1,385 | 1,555,691 | ||||||||||
|
| |||||||||||
Mexico – 0.2% |
| |||||||||||
Petroleos Mexicanos | 823 | 834,023 | ||||||||||
|
| |||||||||||
United Arab Emirates – 0.4% |
| |||||||||||
IPIC GMTN Ltd. | 1,365 | 1,440,075 | ||||||||||
|
| |||||||||||
Total Quasi-Sovereigns | 6,243,890 | |||||||||||
|
| |||||||||||
LOCAL GOVERNMENTS – MUNICIPAL |
| |||||||||||
United States – 0.4% | ||||||||||||
California GO | 970 | 1,448,220 | ||||||||||
|
| |||||||||||
EMERGING MARKETS – CORPORATE BONDS – 0.3% | ||||||||||||
Industrial – 0.3% | ||||||||||||
Communications - | ||||||||||||
Comcel Trust | 207 | 221,490 | ||||||||||
|
| |||||||||||
Consumer Non-Cyclical – 0.2% | ||||||||||||
Marfrig Overseas Ltd. | 730 | 771,062 | ||||||||||
Virgolino de Oliveira Finance SA | 660 | 161,700 | ||||||||||
|
| |||||||||||
| 932,762 | ||||||||||||
|
| |||||||||||
Total Emerging Markets – Corporate Bonds | 1,154,252 | |||||||||||
|
| |||||||||||
GOVERNMENTS – SOVEREIGN | ||||||||||||
Turkey – 0.3% | ||||||||||||
Turkey Government International Bond | 903 | 878,655 | ||||||||||
|
| |||||||||||
| 32 | • ALLIANCEBERNSTEIN BOND FUND INTERMEDIATE BOND PORTFOLIO |
Portfolio of Investments
| Company | Shares | U.S. $ Value | ||||||||||
| ||||||||||||
COMMON STOCKS – 0.2% | ||||||||||||
Mt. Logan Re Ltd. (Preference Shares)^ (j) | 700 | $ | 746,394 | |||||||||
|
| |||||||||||
PREFERRED STOCKS – 0.2% | ||||||||||||
Financial Institutions – 0.2% | ||||||||||||
Insurance – 0.2% | ||||||||||||
Allstate Corp. (The) | 25,975 | 638,464 | ||||||||||
|
| |||||||||||
| Principal Amount (000) | ||||||||||||
GOVERNMENTS – SOVEREIGN AGENCIES – 0.2% | ||||||||||||
Canada – 0.1% | ||||||||||||
NOVA Chemicals Corp. | U.S.$ | 331 | 345,895 | |||||||||
|
| |||||||||||
Colombia – 0.1% | ||||||||||||
Ecopetrol SA | 245 | 251,157 | ||||||||||
|
| |||||||||||
Total Governments – Sovereign Agencies (cost $605,617) | 597,052 | |||||||||||
| �� |
|
| ||||||||||
| Contracts | ||||||||||||
OPTIONS PURCHASED—PUTS – 0.0% | ||||||||||||
Options on Equities – 0.0% | ||||||||||||
Best of SPY TLT Expiration: Dec 2014, | 3,500,000 | 1,537 | ||||||||||
|
| |||||||||||
| Shares | ||||||||||||
SHORT-TERM INVESTMENTS – 12.6% | ||||||||||||
Investment Companies – 12.6% | ||||||||||||
AllianceBerstein Fixed-Income | 44,458,515 | 44,458,515 | ||||||||||
|
| |||||||||||
Total Investments – 111.8% | 394,663,642 | |||||||||||
Other assets less liabilities – (11.8)% | (41,642,748 | ) | ||||||||||
|
| |||||||||||
Net Assets – 100.0% | $ | 353,020,894 | ||||||||||
|
| |||||||||||
| ALLIANCEBERNSTEIN BOND FUND INTERMEDIATE BOND PORTFOLIO • | 33 |
Portfolio of Investments
FUTURES (see Note D)
| Type | Number of Contracts | Expiration Month | Original Value | Value at October 31, 2014 | Unrealized Appreciation/ (Depreciation) | |||||||||||||||
Purchased Contracts | ||||||||||||||||||||
U.S. Long Bond (CBT) Futures | 6 | December 2014 | $ | 834,010 | $ | 846,563 | $ | 12,553 | ||||||||||||
U.S. T-Note 5 Yr (CBT) Futures | 47 | December 2014 | 5,568,842 | 5,613,195 | 44,353 | |||||||||||||||
Sold Contracts | ||||||||||||||||||||
U.S. T-Note 2 Yr (CBT) Futures | 62 | December 2014 | 13,568,212 | 13,612,875 | (44,663 | ) | ||||||||||||||
|
| |||||||||||||||||||
| $ | 12,243 | |||||||||||||||||||
|
| |||||||||||||||||||
FORWARD CURRENCY EXCHANGE CONTRACTS (see Note D)
| Counterparty | Contracts to Deliver (000) | In Exchange (000) | Settlement Date | Unrealized Appreciation/ (Depreciation) | ||||||||||||||||||||
BNP Paribas SA | EUR | 7,717 | USD | 9,782 | 11/21/14 | $ | 110,549 | |||||||||||||||||
BNP Paribas SA | JPY | 182,601 | USD | 1,687 | 12/05/14 | 61,485 | ||||||||||||||||||
JPMorgan Chase Bank | GBP | 2,845 | USD | 4,584 | �� | 11/14/14 | 33,572 | |||||||||||||||||
JPMorgan Chase Bank | CAD | 4,214 | USD | 3,761 | 11/21/14 | 23,751 | ||||||||||||||||||
Royal Bank of Scotland PLC | AUD | 2,884 | USD | 2,532 | 12/12/14 | 811 | ||||||||||||||||||
Royal Bank of Scotland PLC | NZD | 5,229 | USD | 4,143 | 12/19/14 | 84,276 | ||||||||||||||||||
State Street Bank & Trust Co. | MXN | 48,890 | USD | 3,603 | 11/20/14 | (24,379 | ) | |||||||||||||||||
State Street Bank & Trust Co. | USD | 87 | CAD | 98 | 11/21/14 | (230 | ) | |||||||||||||||||
State Street Bank & Trust Co. | USD | 497 | EUR | 388 | 11/21/14 | (9,702 | ) | |||||||||||||||||
|
| |||||||||||||||||||||||
| $ | 280,133 | |||||||||||||||||||||||
|
| |||||||||||||||||||||||
CENTRALLY CLEARED INTEREST RATE SWAPS (see Note D)
| Rate Type | ||||||||||||||||||||
Clearing Broker/ (Exchange) | Notional Amount (000) | Termination Date | Payments made by the Fund | Payments by the Fund | Unrealized Appreciation/ (Depreciation) | |||||||||||||||
Morgan Stanley & Co., LLC/(CME Group) | CAD | 5,680 | 10/03/19 | 1.993% | 3 Month CDOR | $ | (21,756 | ) | ||||||||||||
Morgan Stanley & Co., LLC/(CME Group) | $ | 4,340 | 10/07/19 | 3 Month LIBOR | 1.935% | 47,019 | ||||||||||||||
Morgan Stanley & Co., LLC/(CME Group) | 2,630 | 1/14/24 | 2.980% | 3 Month LIBOR | (152,502 | ) | ||||||||||||||
Morgan Stanley & Co., LLC/(CME Group) | 2,300 | 2/14/24 | 2.889% | 3 Month LIBOR | (108,782 | ) | ||||||||||||||
Morgan Stanley & Co., LLC/(CME Group) | NZD | 3,130 | 9/25/24 | 4.628% | 3 Month BKBM | (48,117 | ) | |||||||||||||
|
| |||||||||||||||||||
| $ | (284,138 | ) | ||||||||||||||||||
|
| |||||||||||||||||||
| 34 | • ALLIANCEBERNSTEIN BOND FUND INTERMEDIATE BOND PORTFOLIO |
Portfolio of Investments
CREDIT DEFAULT SWAPS (see Note D)
Swap Counterparty & Referenced Obligation | Fixed Rate (Pay) Receive | Implied Credit Spread at October 31, 2014 | Notional Amount (000) | Market Value | Upfront Premiums Paid (Received) | Unrealized Appreciation/ (Depreciation) | ||||||||||||||||||
Buy Contracts | ||||||||||||||||||||||||
Citibank, NA: | ||||||||||||||||||||||||
Russian Federation, | (1.00 | )% | 2.36 | % | $ | 1,563 | $ | 89,684 | $ | 89,802 | $ | (118 | ) | |||||||||||
Goldman Sachs Bank USA: | ||||||||||||||||||||||||
Russian Federation, | (1.00 | ) | 2.36 | 1,967 | 112,898 | 112,128 | 770 | |||||||||||||||||
Sale Contracts | ||||||||||||||||||||||||
Credit Suisse International: | ||||||||||||||||||||||||
Anadarko Petroleum Corp., | 1.00 | 0.46 | 1,360 | 22,222 | (27,627 | ) | 49,849 | |||||||||||||||||
Kohl’s Corp., | 1.00 | 0.97 | 375 | 378 | (4,707 | ) | 5,085 | |||||||||||||||||
Kohl’s Corp., | 1.00 | 0.97 | 220 | 221 | (2,477 | ) | 2,698 | |||||||||||||||||
Kohl’s Corp., | 1.00 | 0.97 | 153 | 154 | (1,917 | ) | 2,071 | |||||||||||||||||
Kohl’s Corp., | 1.00 | % | 0.97 | % | 152 | 153 | (1,902 | ) | 2,055 | |||||||||||||||
|
|
|
|
|
| |||||||||||||||||||
| $ | 225,710 | $ | 163,300 | $ | 62,410 | |||||||||||||||||||
|
|
|
|
|
| |||||||||||||||||||
| * | Termination date |
INTEREST RATE SWAPS (see Note D)
| Rate Type | ||||||||||||||||
| Swap Counterparty | Notional Amount (000) | Termination Date | Payments made by the Fund | Payments received by the Fund | Unrealized Appreciation/ (Depreciation) | |||||||||||
JPMorgan Chase Bank, NA | $ | 5,590 | 1/30/17 | 1.059% | 3 Month LIBOR | $ | (45,273 | ) | ||||||||
JPMorgan Chase Bank, NA | 6,230 | 2/07/22 | 2.043% | 3 Month LIBOR | 27,664 | |||||||||||
|
| |||||||||||||||
| $ | (17,609 | ) | ||||||||||||||
|
| |||||||||||||||
| ALLIANCEBERNSTEIN BOND FUND INTERMEDIATE BOND PORTFOLIO • | 35 |
Portfolio of Investments
CROSS CURRENCY SWAP CONTRACTS (see Note D)
| Counterparty | Expiration Date | Pay Currency | Pay Rate | Receive Currency | Receive Rate | Market Value | Upfront Premiums Paid (Received) | Unrealized Appreciation/ (Depreciation) | ||||||||||||||||||||||||
Barclays Bank PLC | 2/15/15 | EUR | | 1 Month EURIBOR Plus a Specified Spread | | USD | | 1 Month LIBOR Plus a Specified Spread | | $ | 91,839 | $ | (988 | ) | $ | 92,827 | ||||||||||||||||
| * | Principal amount less than 500. |
| ^ | The security is subject to a 12 month lock-up period, after which semi-annual redemptions are permitted. |
| (a) | Security is exempt from registration under Rule 144A of the Securities Act of 1933. These securities are considered liquid and may be resold in transactions exempt from registration, normally to qualified institutional buyers. At October 31, 2014, the aggregate market value of these securities amounted to $81,888,233 or 23.2% of net assets. |
| (b) | Floating Rate Security. Stated interest rate was in effect at October 31, 2014. |
| (c) | Coupon rate adjusts periodically based upon a predetermined schedule. Stated interest rate in effect at October 31, 2014. |
| (d) | Securities are perpetual and, thus, do not have a predetermined maturity date. The date shown, if applicable, reflects the next call date. |
| (e) | Illiquid security. |
| (f) | IO - Interest Only |
| (g) | Variable rate coupon, rate shown as of October 31, 2014. |
| (h) | Fair valued by the Adviser. |
| (i) | Security is exempt from registration under Rule 144A of the Securities Act of 1933. This security, which represents 0.00% of net assets as of October 31, 2014, is considered illiquid and restricted. |
| Restricted Securities | Acquisition Date | Cost | Market Value | Percentage of Net Assets | ||||||||||||
Nationstar NIM Ltd. | 4/04/07 | $ | 17,607 | $ | – 0 | – | 0.00 | % | ||||||||
| (j) | Restricted and illiquid security. |
| Restricted Securities | Acquisition Date | Cost | Market Value | Percentage of Net Assets | ||||||||||||
Mt. Logan Re Ltd. | 1/02/14 | $ | 700,000 | $ | 746,394 | 0.21 | % | |||||||||
| (k) | Non-income producing security. |
| (l) | One contract relates to 1 share. |
| (m) | To obtain a copy of the fund’s financial statements, please go to the Securities and Exchange Commission’s website at www.sec.gov, or call AllianceBernstein at (800) 227-4618. |
| (n) | Investment in affiliated money market mutual fund. The rate shown represents the 7-day yield as of period end. |
Currency Abbreviations:
AUD – Australian Dollar
CAD – Canadian Dollar
EUR – Euro
| 36 | • ALLIANCEBERNSTEIN BOND FUND INTERMEDIATE BOND PORTFOLIO |
Portfolio of Investments
GBP – Great British Pound
JPY – Japanese Yen
MXN – Mexican Peso
NZD – New Zealand Dollar
USD – United States Dollar
Glossary:
ABS – Asset-Backed Securities
ARMs – Adjustable Rate Mortgages
BKBM – Bank Bill Benchmark (New Zealand)
CBT – Chicago Board of Trade
CDOR – Canadian Dealer Offered Rate
CFC – Customer Facility Charge
CMBS – Commercial Mortgage-Backed Securities
CME – Chicago Mercantile Exchange
EURIBOR – Euro Interbank Offered Rate
GO – General Obligation
GSE – Government-Sponsored Enterprise
JSC – Joint Stock Company
LIBOR – London Interbank Offered Rates
REIT – Real Estate Investment Trust
SPY – SPDR Trust Series I
TBA – To Be Announced
TIPS – Treasury Inflation Protected Security
TLT – iShares Barclays 20 Year Treasury Bond Fund
See notes to financial statements.
| ALLIANCEBERNSTEIN BOND FUND INTERMEDIATE BOND PORTFOLIO • | 37 |
Portfolio of Investments
STATEMENT OF ASSETS & LIABILITIES
October 31, 2014
| Assets | ||||
Investments in securities, at value | ||||
Unaffiliated issuers (cost $347,861,123) | $ | 350,205,127 | ||
Affiliated issuers (cost $44,458,515) | 44,458,515 | |||
Due from broker | 224,423 | (a) | ||
Foreign currencies, at value (cost $85,990) | 78,617 | |||
Receivable for investment securities sold | 44,117,168 | |||
Interest receivable | 2,304,600 | |||
Unrealized appreciation on forward currency exchange contracts | 314,444 | |||
Receivable for capital stock sold | 210,012 | |||
Upfront premium paid on credit default swaps | 201,929 | |||
Unrealized appreciation on cross currency swaps | 92,827 | |||
Unrealized appreciation on credit default swaps | 62,528 | |||
Unrealized appreciation on interest rate swaps | 27,664 | |||
Receivable for variation margin on exchange-traded derivatives | 4,442 | |||
|
| |||
Total assets | 442,302,296 | |||
|
| |||
| Liabilities | ||||
Due to custodian | 2,702 | |||
Payable for investment securities purchased | 88,277,417 | |||
Payable for capital stock redeemed | 260,284 | |||
Dividends payable | 155,454 | |||
Advisory fee payable | 113,383 | |||
Distribution fee payable | 110,888 | |||
Transfer Agent fee payable | 49,242 | |||
Unrealized depreciation on interest rate swaps | 45,273 | |||
Upfront premium received on credit default swaps | 38,629 | |||
Unrealized depreciation on forward currency exchange contracts | 34,311 | |||
Administrative fee payable | 17,627 | |||
Payable for variation margin on exchange-traded derivatives | 6,648 | |||
Upfront premium received on cross currency swaps | 988 | |||
Unrealized depreciation on credit default swaps | 118 | |||
Accrued expenses | 168,438 | |||
|
| |||
Total liabilities | 89,281,402 | |||
|
| |||
Net Assets | $ | 353,020,894 | ||
|
| |||
| Composition of Net Assets | ||||
Capital stock, at par | $ | 31,423 | ||
Additional paid-in capital | 360,546,453 | |||
Undistributed net investment income | 2,534,258 | |||
Accumulated net realized loss on investment | (12,563,192 | ) | ||
Net unrealized appreciation on investments | 2,471,952 | |||
|
| |||
| $ | 353,020,894 | |||
|
|
| 38 | • ALLIANCEBERNSTEIN BOND FUND INTERMEDIATE BOND PORTFOLIO |
Statement of Assets & Liabilities
Net Asset Value Per Share—24 billion shares of capital stock authorized, $.001 par value
| Class | Net Assets | Shares Outstanding | Net Asset Value | |||||||||
| ||||||||||||
| A | $ | 273,961,720 | 24,381,745 | $ | 11.24 | * | ||||||
| ||||||||||||
| B | $ | 3,016,849 | 268,403 | $ | 11.24 | |||||||
| ||||||||||||
| C | $ | 42,690,285 | 3,806,460 | $ | 11.22 | |||||||
| ||||||||||||
| Advisor | $ | 26,352,243 | 2,344,021 | $ | 11.24 | |||||||
| ||||||||||||
| R | $ | 2,368,016 | 210,752 | $ | 11.24 | |||||||
| ||||||||||||
| K | $ | 4,515,226 | 401,558 | $ | 11.24 | |||||||
| ||||||||||||
| I | $ | 106,457 | 9,462 | $ | 11.25 | |||||||
| ||||||||||||
| Z | $ | 10,098 | 897 | $ | 11.26 | |||||||
| ||||||||||||
| (a) | Represents amounts on deposit at the broker as collateral for open derivative contracts. |
| * | The maximum offering price per share for Class A shares was $11.74 which reflects a sales charge of 4.25%. |
See notes to financial statements.
| ALLIANCEBERNSTEIN BOND FUND INTERMEDIATE BOND PORTFOLIO • | 39 |
Statement of Assets & Liabilities
STATEMENT OF OPERATIONS
Year Ended October 31, 2014
| Investment Income | ||||||||
Interest | $ | 15,150,596 | ||||||
Dividends | ||||||||
Unaffiliated issuers | 165,452 | |||||||
Affiliated issuers | 17,534 | |||||||
Consent fee income | 15,812 | $ | 15,349,394 | |||||
|
| |||||||
| Expenses | ||||||||
Advisory fee (see Note B) | 1,702,541 | |||||||
Distribution fee—Class A | 859,487 | |||||||
Distribution fee—Class B | 40,556 | |||||||
Distribution fee—Class C | 442,371 | |||||||
Distribution fee—Class R | 11,204 | |||||||
Distribution fee—Class K | 10,220 | |||||||
Transfer agency—Class A | 441,738 | |||||||
Transfer agency—Class B | 7,186 | |||||||
Transfer agency—Class C | 70,223 | |||||||
Transfer agency—Advisor Class | 60,018 | |||||||
Transfer agency—Class R | 5,593 | |||||||
Transfer agency—Class K | 6,858 | |||||||
Transfer agency—Class I | 63 | |||||||
Transfer agency—Class Z | 1 | |||||||
Custodian | 222,487 | |||||||
Registration fees | 85,962 | |||||||
Audit and tax | 83,785 | |||||||
Printing | 67,253 | |||||||
Administrative | 56,402 | |||||||
Legal | 50,344 | |||||||
Directors’ fees | 7,743 | |||||||
Miscellaneous | 26,707 | |||||||
|
| |||||||
Total expenses | 4,258,742 | |||||||
Less: expenses waived and reimbursed by the Adviser (see Note B) | (624,838 | ) | ||||||
|
| |||||||
Net expenses | 3,633,904 | |||||||
|
| |||||||
Net investment income | 11,715,490 | |||||||
|
| |||||||
| Realized and Unrealized Gain (Loss) on Investment and Foreign Currency Transactions | ||||||||
Net realized gain (loss) on: | ||||||||
Investment transactions | 16,173,181 | |||||||
Futures | (88,847 | ) | ||||||
Options written | 37,400 | |||||||
Swaps | (6,487 | ) | ||||||
Foreign currency transactions | 978,533 | |||||||
Net change in unrealized appreciation/depreciation of: | ||||||||
Investments | (10,197,529 | ) | ||||||
Futures | 20,167 | |||||||
Swaps | (303,422 | ) | ||||||
Foreign currency denominated assets and liabilities and other assets | 507,630 | |||||||
|
| |||||||
Net gain on investment and foreign currency transactions | 7,120,626 | |||||||
|
| |||||||
Net Increase in Net Assets from Operations | $ | 18,836,116 | ||||||
|
|
See notes to financial statements.
| 40 | • ALLIANCEBERNSTEIN BOND FUND INTERMEDIATE BOND PORTFOLIO |
Statement of Operations
STATEMENT OF CHANGES IN NET ASSETS
| Year Ended October 31, 2014 | Year Ended October 31, 2013 | |||||||
| Increase (Decrease) in Net Assets from Operations | ||||||||
Net investment income | $ | 11,715,490 | $ | 11,275,649 | ||||
Net realized gain on investment and foreign currency transactions | 17,093,780 | 4,372,364 | ||||||
Net change in unrealized appreciation/depreciation of investments and foreign currency denominated assets and liabilities and other assets | (9,973,154 | ) | (21,434,180 | ) | ||||
|
|
|
| |||||
Net increase (decrease) in net assets from operations | 18,836,116 | (5,786,167 | ) | |||||
| Dividends to Shareholders from | ||||||||
Net investment income | ||||||||
Class A | (8,778,788 | ) | (9,324,764 | ) | ||||
Class B | (97,320 | ) | (150,141 | ) | ||||
Class C | (1,049,284 | ) | (1,130,651 | ) | ||||
Advisor Class | (1,278,019 | ) | (2,685,254 | ) | ||||
Class R | (63,907 | ) | (60,986 | ) | ||||
Class K | (126,092 | ) | (102,506 | ) | ||||
Class I | (1,625 | ) | (2,287 | ) | ||||
Class Z | (161 | ) | – 0 | – | ||||
| Capital Stock Transactions | ||||||||
Net decrease | (88,221,496 | ) | (89,351,728 | ) | ||||
| Capital Contributions | ||||||||
Proceeds from third party regulatory settlement (see Note E) | – 0 | – | 621,752 | |||||
|
|
|
| |||||
Total decrease | (80,780,576 | ) | (107,972,732 | ) | ||||
| Net Assets | ||||||||
Beginning of period | 433,801,470 | 541,774,202 | ||||||
|
|
|
| |||||
End of period (including undistributed net investment income of $2,534,258 and $677,586, respectively) | $ | 353,020,894 | $ | 433,801,470 | ||||
|
|
|
| |||||
See notes to financial statements.
| ALLIANCEBERNSTEIN BOND FUND INTERMEDIATE BOND PORTFOLIO • | 41 |
Statement of Changes in Net Assets
NOTES TO FINANCIAL STATEMENTS
October 31, 2014
NOTE A
Significant Accounting Policies
AllianceBernstein Bond Fund, Inc. (the “Fund”) is registered under the Investment Company Act of 1940 as an open-end management investment company. The Fund, which is a Maryland corporation, operates as a series company comprised of nine portfolios currently in operation: the Intermediate Bond Portfolio, the Bond Inflation Strategy Portfolio, the Municipal Bond Inflation Strategy Portfolio, the Real Asset Strategy Portfolio, the Limited Duration High Income Portfolio, the Government Reserves Portfolio, the Tax-Aware Fixed Income Portfolio, the AllianceBernstein Credit Long/Short Portfolio and the AllianceBernstein High Yield Portfolio. They are each diversified Portfolios, with the exception of the Limited Duration High Income Portfolio, which is non-diversified. The Government Reserves Portfolio commenced operations on May 1, 2013. The Tax-Aware Fixed Income Portfolio commenced operations on December 11, 2013. The AllianceBernstein Credit Long/Short Portfolio commenced operations on May 7, 2014. The AllianceBernstein High Yield Portfolio commenced operations July 15, 2014. Each Portfolio is considered to be a separate entity for financial reporting and tax purposes. This report relates only to the Intermediate Bond Portfolio (the “Portfolio”). The Portfolio offers Class A, Class B, Class C, Advisor Class, Class R, Class K, Class I, and Class Z shares. Effective April 28, 2014 the fund commenced offering of Class Z shares. Class A shares are sold with a front-end sales charge of up to 4.25% for purchases not exceeding $1,000,000. With respect to purchases of $1,000,000 or more, Class A shares redeemed within one year of purchase may be subject to a contingent deferred sales charge of 1%. Class B shares are currently sold with a contingent deferred sales charge which declines from 3% to zero depending on the period of time the shares are held. Effective January 31, 2009, sales of Class B shares of the Portfolio to new investors were suspended. Class B shares will only be issued (i) upon the exchange of Class B shares from another AllianceBernstein Mutual Fund, (ii) for purposes of dividend reinvestment, (iii) through the Portfolio’s Automatic Investment Program (the “Program”) for accounts that established the Program prior to January 31, 2009, and (iv) for purchases of additional shares by Class B shareholders as of January 31, 2009. The ability to establish a new Program for accounts containing Class B shares was suspended as of January 31, 2009. Class B shares will automatically convert to Class A shares six years after the end of the calendar month of purchase. Class C shares are subject to a contingent deferred sales charge of 1% on redemptions made within the first year after purchase. Class R and Class K shares are sold without an initial or contingent deferred sales charge. Advisor Class, Class I and Class Z shares are sold without an initial or contingent deferred sales charge and are not subject to ongoing distribution expenses. All eight classes of shares have identical voting, dividend, liquidation and other rights, except that the classes bear different distribution and transfer agency expenses. Each class has exclusive voting rights with respect to its distribution plan. The financial statements have been prepared in conformity with U.S.
| 42 | • ALLIANCEBERNSTEIN BOND FUND INTERMEDIATE BOND PORTFOLIO |
Notes to Financial Statements
generally accepted accounting principles (“U.S. GAAP”) which require management to make certain estimates and assumptions that affect the reported amounts of assets and liabilities in the financial statements and amounts of income and expenses during the reporting period. Actual results could differ from those estimates. The following is a summary of significant accounting policies followed by the Portfolio.
1. Security Valuation
Portfolio securities are valued at their current market value determined on the basis of market quotations or, if market quotations are not readily available or are deemed unreliable, at “fair value” as determined in accordance with procedures established by and under the general supervision of the Fund’s Board of Directors (the “Board”).
In general, the market values of securities which are readily available and deemed reliable are determined as follows: securities listed on a national securities exchange (other than securities listed on the NASDAQ Stock Market, Inc. (“NASDAQ”)) or on a foreign securities exchange are valued at the last sale price at the close of the exchange or foreign securities exchange. If there has been no sale on such day, the securities are valued at the last traded price from the previous day. Securities listed on more than one exchange are valued by reference to the principal exchange on which the securities are traded; securities listed only on NASDAQ are valued in accordance with the NASDAQ Official Closing Price; listed or over the counter (“OTC”) market put or call options are valued at the mid level between the current bid and ask prices. If either a current bid or current ask price is unavailable, AllianceBernstein L.P. (the “Adviser”) will have discretion to determine the best valuation (e.g. last trade price in the case of listed options); open futures are valued using the closing settlement price or, in the absence of such a price, the most recent quoted bid price. If there are no quotations available for the day of valuation, the last available closing settlement price is used; U.S. government securities and other debt instruments having 60 days or less remaining until maturity are valued at amortized cost if their original maturity was 60 days or less. If the original term to maturity exceeded 60 days, the securities are valued by a pricing service, if a market price is available. If a market price is not available, the securities are valued by using amortized cost as of the 61st day prior to maturity. Fixed-income securities, including mortgage-backed and asset-backed securities, may be valued on the basis of prices provided by a pricing service or at a price obtained from one or more of the major broker-dealers. In cases where broker-dealer quotes are obtained, the Adviser may establish procedures whereby changes in market yields or spreads are used to adjust, on a daily basis, a recently obtained quoted price on a security. Swaps and other derivatives are valued daily, primarily using independent pricing services, independent pricing models using market inputs, as well as third party broker-dealers or counterparties. Investment companies are valued at their net asset value each day.
| ALLIANCEBERNSTEIN BOND FUND INTERMEDIATE BOND PORTFOLIO • | 43 |
Notes to Financial Statements
Securities for which market quotations are not readily available (including restricted securities) or are deemed unreliable are valued at fair value. Factors considered in making this determination may include, but are not limited to, information obtained by contacting the issuer, analysts, analysis of the issuer’s financial statements or other available documents. In addition, the Portfolio may use fair value pricing for securities primarily traded in non-U.S. markets because most foreign markets close well before the Portfolio values its securities at 4:00 p.m., Eastern Time. The earlier close of these foreign markets gives rise to the possibility that significant events, including broad market moves, may have occurred in the interim and may materially affect the value of those securities.
2. Fair Value Measurements
In accordance with U.S. GAAP regarding fair value measurements, fair value is defined as the price that the Portfolio would receive to sell an asset or pay to transfer a liability in an orderly transaction between market participants at the measurement date. U.S. GAAP establishes a framework for measuring fair value, and a three-level hierarchy for fair value measurements based upon the transparency of inputs to the valuation of an asset or liability (including those valued based on their market values as described in Note A.1 above). Inputs may be observable or unobservable and refer broadly to the assumptions that market participants would use in pricing the asset or liability. Observable inputs reflect the assumptions market participants would use in pricing the asset or liability based on market data obtained from sources independent of the Portfolio. Unobservable inputs reflect the Portfolio’s own assumptions about the assumptions that market participants would use in pricing the asset or liability based on the best information available in the circumstances. Each investment is assigned a level based upon the observability of the inputs which are significant to the overall valuation. The three-tier hierarchy of inputs is summarized below.
| • | Level 1—quoted prices in active markets for identical investments |
| • | Level 2—other significant observable inputs (including quoted prices for similar investments, interest rates, prepayment speeds, credit risk, etc.) |
| • | Level 3—significant unobservable inputs (including the Portfolio’s own assumptions in determining the fair value of investments) |
The fair value of debt instruments, such as bonds, and over-the-counter derivatives is generally based on market price quotations, recently executed market transactions (where observable) or industry recognized modeling techniques and are generally classified as Level 2. Pricing vendor inputs to Level 2 valuations may include quoted prices for similar investments in active markets, interest rate curves, coupon rates, currency rates, yield curves, option adjusted spreads, default rates, credit spreads and other unique security features in order to estimate the relevant cash flows which are then discounted to calculate fair values. If these inputs are unobservable and significant to the fair value, these investments will be classified as Level 3. In addition, non-agency rated investments are classified as Level 3.
| 44 | • ALLIANCEBERNSTEIN BOND FUND INTERMEDIATE BOND PORTFOLIO |
Notes to Financial Statements
Options and warrants are valued using market-based inputs to models, broker or dealer quotations, or alternative pricing sources with reasonable levels of price transparency, where such inputs and models are available. Alternatively the values may be obtained through unobservable management determined inputs and/or management’s proprietary models. Where models are used, the selection of a particular model to value an option or a warrant depends upon the contractual terms of, and specific risks inherent in, the option or warrant as well as the availability of pricing information in the market. Valuation models require a variety of inputs, including contractual terms, market prices, measures of volatility and correlations of such inputs. Exchange traded options generally will be classified as Level 2. For options or warrants that do not trade on exchange but trade in liquid markets, inputs can generally be verified and model selection does not involve significant management judgment. Options and warrants are classified within Level 2 on the fair value hierarchy when all of the significant inputs can be corroborated to market evidence. Otherwise such instruments are classified as Level 3.
Valuations of mortgage-backed or other asset-backed securities, by pricing vendors, are based on both proprietary and industry recognized models and discounted cash flow techniques. Significant inputs to the valuation of these instruments are value of the collateral, the rates and timing of delinquencies, the rates and timing of prepayments, and default and loss expectations, which are driven in part by housing prices for residential mortgages. Significant inputs are determined based on relative value analyses, which incorporate comparisons to instruments with similar collateral and risk profiles, including relevant indices. Mortgage and asset-backed securities for which management has collected current observable data through pricing services are generally categorized within Level 2. Those investments for which current observable data has not been provided are classified as Level 3.
Other fixed income investments, including non-U.S. government and corporate debt, are generally valued using quoted market prices, if available, which are typically impacted by current interest rates, maturity dates and any perceived credit risk of the issuer. Additionally, in the absence of quoted market prices, these inputs are used by pricing vendors to derive a valuation based upon industry or proprietary models which incorporate issuer specific data with relevant yield/spread comparisons with more widely quoted bonds with similar key characteristics. Those investments for which there are observable inputs are classified as Level 2. Where the inputs are not observable, the investments are classified as Level 3.
| ALLIANCEBERNSTEIN BOND FUND INTERMEDIATE BOND PORTFOLIO • | 45 |
Notes to Financial Statements
The following table summarizes the valuation of the Portfolio’s investments by the above fair value hierarchy levels as of October 31, 2014:
Investments in Securities: | Level 1 | Level 2 | Level 3 | Total | ||||||||||||
Assets: | ||||||||||||||||
Corporates—Investment Grade | $ | – 0 | – | $ | 76,956,501 | $ | – 0 | – | $ | 76,956,501 | ||||||
Governments—Treasuries | – 0 | – | 70,069,096 | – 0 | – | 70,069,096 | ||||||||||
Mortgage Pass-Throughs | – 0 | – | 53,043,716 | – 0 | – | 53,043,716 | ||||||||||
Commercial Mortgage-Backed Securities | – 0 | – | 33,843,220 | 7,193,928 | 41,037,148 | |||||||||||
Asset-Backed Securities | – 0 | – | 36,289,937 | 3,767,594 | ^ | 40,057,531 | ||||||||||
Corporates—Non-Investment Grade | – 0 | – | 31,497,970 | 306,800 | 31,804,770 | |||||||||||
Collateralized Mortgage Obligations | – 0 | – | 58,899 | 14,419,314 | 14,478,213 | |||||||||||
Inflation-Linked Securities | – 0 | – | 11,049,688 | – 0 | – | 11,049,688 | ||||||||||
Quasi-Sovereigns | – 0 | – | 6,243,890 | – 0 | – | 6,243,890 | ||||||||||
Local Governments—Municipal Bonds | – 0 | – | 1,448,220 | – 0 | – | 1,448,220 | ||||||||||
Emerging Markets—Corporate Bonds | | – 0 | – | 1,154,252 | – 0 | – | 1,154,252 | |||||||||
Governments—Sovereign Bonds | – 0 | – | 878,655 | – 0 | – | 878,655 | ||||||||||
Common Stocks | – 0 | – | – 0 | – | 746,394 | 746,394 | ||||||||||
Preferred Stocks | 638,464 | – 0 | – | – 0 | – | 638,464 | ||||||||||
Governments—Sovereign Agencies | – 0 | – | 597,052 | – 0 | – | 597,052 | ||||||||||
Options Purchased—Puts | – 0 | – | 1,537 | – 0 | – | 1,537 | ||||||||||
Short-Term Investments | 44,458,515 | – 0 | – | – 0 | – | 44,458,515 | ||||||||||
|
|
|
|
|
|
|
| |||||||||
Total Investments in Securities | 45,096,979 | 323,132,633 | 26,434,030 | 394,663,642 | ||||||||||||
Other Financial Instruments* : | ||||||||||||||||
Assets: | ||||||||||||||||
Futures | 56,906 | – 0 | – | – 0 | – | 56,906 | # | |||||||||
Forward Currency Exchange Contracts | – 0 | – | 314,444 | – 0 | – | 314,444 | ||||||||||
Centrally Cleared Interest Rate Swaps | – 0 | – | 47,019 | – 0 | – | 47,019 | # | |||||||||
Credit Default Swaps | – 0 | – | 62,528 | – 0 | – | 62,528 | ||||||||||
Interest Rate Swaps | – 0 | – | 27,664 | – 0 | – | 27,664 | ||||||||||
Cross Currency Swaps | – 0 | – | – 0 | – | 92,827 | 92,827 | ||||||||||
Liabilities: | ||||||||||||||||
Futures | (44,663 | ) | – 0 | – | – 0 | – | (44,663 | )# | ||||||||
Forward Currency Exchange Contracts | – 0 | – | (34,311 | ) | – 0 | – | (34,311 | ) | ||||||||
Centrally Cleared Interest Rate Swaps | – 0 | – | (331,157 | ) | – 0 | – | (331,157 | )# | ||||||||
Credit Default Swaps | – 0 | – | (118 | ) | – 0 | – | (118 | ) | ||||||||
Interest Rate Swaps | – 0 | – | (45,273 | ) | – 0 | – | (45,273 | ) | ||||||||
|
|
|
|
|
|
|
| |||||||||
Total+ | $ | 45,109,222 | $ | 323,173,429 | $ | 26,526,857 | $ | 394,809,508 | ||||||||
|
|
|
|
|
|
|
| |||||||||
| ^ | The Portfolio held securities with zero market value at period end. |
| * | Other financial instruments are derivative instruments, such as futures, forwards and swaps, which are valued at the unrealized appreciation/depreciation on the instrument. |
| + | There were no transfers between any levels during the reporting period. |
| # | Only variation margin receivable/payable at period end is reported within the statement of assets and liabilities. This amount reflects cumulative appreciation/(depreciation) of exchange-traded derivatives as reported in the portfolio of investments. |
| 46 | • ALLIANCEBERNSTEIN BOND FUND INTERMEDIATE BOND PORTFOLIO |
Notes to Financial Statements
The Portfolio recognizes all transfers between levels of the fair value hierarchy assuming the financial instruments were transferred at the beginning of the reporting period.
The following is a reconciliation of investments in which significant unobservable inputs (Level 3) were used in determining fair value.
| Asset-Backed Securities^ | Commercial Mortgage-Backed Securities | Corporates - Non-Investment Grade | ||||||||||
Balance as of 10/31/13 | $ | 3,931,856 | $ | 6,470,698 | $ | 458,400 | ||||||
Accrued discounts/(premiums) | 14,277 | (4,472 | ) | 2,133 | ||||||||
Realized gain (loss) | 27,236 | 63,256 | 13,476 | |||||||||
Change in unrealized appreciation/depreciation | 20,889 | (86,932 | ) | 27,041 | ||||||||
Purchases | 2,914,005 | 2,436,109 | 468,150 | |||||||||
Sales | (3,140,669 | ) | (1,684,731 | ) | (662,400 | ) | ||||||
Settlements | – 0 | – | – 0 | – | – 0 | – | ||||||
Transfers in to Level 3 | – 0 | – | – 0 | – | – 0 | – | ||||||
Transfers out of Level 3 | – 0 | – | – 0 | – | – 0 | – | ||||||
|
|
|
|
|
| |||||||
Balance as of 10/31/14 | $ | 3,767,594 | $ | 7,193,928 | $ | 306,800 | ||||||
|
|
|
|
|
| |||||||
Net change in unrealized appreciation/depreciation from Investments held as of 10/31/14* | $ | 26,090 | $ | (72,810 | ) | $ | 17,993 | |||||
|
|
|
|
|
| |||||||
| Collateralized Mortgage Obligations | Common Stocks | Centrally Cleared Interest Rate Swaps | ||||||||||
Balance as of 10/31/13 | $ | 11,369,217 | $ | – 0 | – | $ | (56,082 | ) | ||||
Accrued discounts/(premiums) | 104,419 | – 0 | – | – 0 | – | |||||||
Realized gain (loss) | (32,237 | ) | – 0 | – | (22,677 | ) | ||||||
Change in unrealized appreciation/depreciation | 397,130 | 46,394 | 56,082 | |||||||||
Purchases | 5,207,923 | 700,000 | – 0 | – | ||||||||
Sales | (2,627,138 | ) | – 0 | – | – 0 | – | ||||||
Settlements | – 0 | – | – 0 | – | 22,677 | |||||||
Transfers in to Level 3 | – 0 | – | – 0 | – | – 0 | – | ||||||
Transfers out of Level 3 | – 0 | – | – 0 | – | – 0 | – | ||||||
|
|
|
|
|
| |||||||
Balance as of 10/31/14 | $ | 14,419,314 | $ | 746,394 | $ | – 0 | – | |||||
|
|
|
|
|
| |||||||
Net change in unrealized appreciation/depreciation from Investments held as of 10/31/14* | $ | 302,780 | $ | 46,394 | $ | – 0 | – | |||||
|
|
|
|
|
| |||||||
| ALLIANCEBERNSTEIN BOND FUND INTERMEDIATE BOND PORTFOLIO • | 47 |
Notes to Financial Statements
| Cross Currency Swaps | Total | |||||||||
Balance as of 10/31/13 | $ | (45,731 | ) | $ | 22,128,358 | |||||
Accrued discounts/(premiums) | – 0 | – | 116,357 | |||||||
Realized gain (loss) | 5,300 | 54,354 | ||||||||
Change in unrealized appreciation/depreciation | 138,558 | 599,162 | ||||||||
Purchases | – 0 | – | 11,726,187 | |||||||
Sales | – 0 | – | (8,114,938 | ) | ||||||
Settlements | (5,300 | ) | 17,377 | |||||||
Transfers in to Level 3 | – 0 | – | – 0 | – | ||||||
Transfers out of Level 3 | – 0 | – | – 0 | �� | ||||||
|
|
|
| |||||||
Balance as of 10/31/14 | $ | 92,827 | $ | 26,526,857 | ||||||
|
|
|
| |||||||
Net change in unrealized appreciation/depreciation from Investments held as of 10/31/14* | $ | 138,558 | $ | 459,005 | ||||||
|
|
|
| |||||||
| ^ | The Portfolio held securities with zero market value at period end. |
| * | The unrealized appreciation/depreciation is included in net change in unrealized appreciation/depreciation of investments in the accompanying statement of operations. |
The following presents information about significant unobservable inputs related to the Portfolio with material categories of Level 3 investments at October 31, 2014. Securities priced by third party vendors are excluded from the following table.
| Quantitative Information about Level 3 Fair Value Measurements | ||||||||||||
| Fair Value at 10/31/14 | Valuation Technique | Unobservable Input | Range/ Weighted Average | |||||||||
Asset-Backed Securities | $ | – 0 | – | Qualitative Assessment | $0.00/ N/A | |||||||
The Adviser has established a Valuation Committee (the “Committee”) which is responsible for overseeing the pricing and valuation of all securities held in the Portfolio. The Committee operates under pricing and valuation policies and procedures established by the Adviser and approved by the Board, including pricing policies which set forth the mechanisms and processes to be employed on a daily basis to implement these policies and procedures. In particular, the pricing policies describe how to determine market quotations for securities and other instruments. The Committee’s responsibilities include: 1) fair value and liquidity determinations (and oversight of any third parties to whom any responsibility for fair value and liquidity determinations is delegated), and 2) regular monitoring of the Adviser’s pricing and valuation policies and procedures and modification or enhancement of these policies and procedures (or recommendation of the modification of these policies and procedures) as the Committee believes appropriate.
| 48 | • ALLIANCEBERNSTEIN BOND FUND INTERMEDIATE BOND PORTFOLIO |
Notes to Financial Statements
The Committee is also responsible for monitoring the implementation of the pricing policies by the Adviser’s Pricing Group (the “Pricing Group”) and a third party which performs certain pricing functions in accordance with the pricing policies. The Pricing Group is responsible for the oversight of the third party on a day-to-day basis. The Committee and the Pricing Group perform a series of activities to provide reasonable assurance of the accuracy of prices including: 1) periodic vendor due diligence meetings, review of methodologies, new developments and processes at vendors, 2) daily comparison of security valuation versus prior day for all securities that exceeded established thresholds, and 3) daily review of unpriced, stale, and variance reports with exceptions reviewed by senior management and the Committee.
In addition, several processes outside of the pricing process are used to monitor valuation issues including: 1) performance and performance attribution reports are monitored for anomalous impacts based upon benchmark performance, and 2) portfolio managers review all portfolios for performance and analytics (which are generated using the Adviser’s prices).
3. Currency Translation
Assets and liabilities denominated in foreign currencies and commitments under forward currency exchange contracts are translated into U.S. dollars at the mean of the quoted bid and ask prices of such currencies against the U.S. dollar. Purchases and sales of portfolio securities are translated into U.S. dollars at the rates of exchange prevailing when such securities were acquired or sold. Income and expenses are translated into U.S. dollars at rates of exchange prevailing when accrued.
Net realized gain or loss on foreign currency transactions represents foreign exchange gains and losses from sales and maturities of foreign fixed income investments, foreign currency exchange contracts, holding of foreign currencies, currency gains or losses realized between the trade and settlement dates on foreign investment transactions, and the difference between the amounts of dividends, interest and foreign withholding taxes recorded on the Portfolio’s books and the U.S. dollar equivalent amounts actually received or paid. Net unrealized currency gains and losses from valuing foreign currency denominated assets and liabilities at period end exchange rates are reflected as a component of net unrealized appreciation or depreciation of foreign currency denominated assets and liabilities.
4. Taxes
It is the Portfolio’s policy to meet the requirements of the Internal Revenue Code applicable to regulated investment companies and to distribute all of its investment company taxable income and net realized gains, if any, to shareholders. Therefore, no provisions for federal income or excise taxes are required. The Portfolio may be subject to taxes imposed by countries in which it invests.
| ALLIANCEBERNSTEIN BOND FUND INTERMEDIATE BOND PORTFOLIO • | 49 |
Notes to Financial Statements
Such taxes are generally based on income and/or capital gains earned or repatriated. Taxes are accrued and applied to net investment income, net realized gains and net unrealized appreciation/depreciation as such income and/or gains are earned.
In accordance with U.S. GAAP requirements regarding accounting for uncertainties in income taxes, management has analyzed the Portfolio’s tax positions taken or expected to be taken on federal and state income tax returns for all open tax years (the current and the prior three tax years) and has concluded that no provision for income tax is required in the Portfolio’s financial statements.
5. Investment Income and Investment Transactions
Dividend income is recorded on the ex-dividend date or as soon as the Portfolio is informed of the dividend. Interest income is accrued daily. Investment transactions are accounted for on the date the securities are purchased or sold. Investment gains or losses are determined on the identified cost basis. The Portfolio amortizes premiums and accretes discounts as adjustments to interest income.
6. Class Allocations
All income earned and expenses incurred by the Portfolio are borne on a pro-rata basis by each outstanding class of shares, based on the proportionate interest in the Portfolio represented by the net assets of such class, except for class specific expenses which are allocated to the respective class. Expenses of the Fund are charged proportionately to each Portfolio or based on other appropriate methods. Realized and unrealized gains and losses are allocated among the various share classes based on respective net assets.
7. Dividends and Distributions
Dividends and distributions to shareholders, if any, are recorded on the ex-dividend date. Income dividends and capital gains distributions are determined in accordance with federal tax regulations and may differ from those determined in accordance with U.S. GAAP. To the extent these differences are permanent, such amounts are reclassified within the capital accounts based on their federal tax basis treatment; temporary differences do not require such reclassification.
NOTE B
Advisory Fee and Other Transactions with Affiliates
Under the terms of the investment advisory agreement, the Portfolio pays the Adviser an advisory fee at an annual rate of .45% of the first $2.5 billion, .40% of the next $2.5 billion and .35% in excess of $5 billion, of the Portfolio’s average daily net assets. Effective February 1, 2013 (effective April 28, 2014 for Class Z shares), the Adviser has agreed to waive its fees and bear certain expenses to the extent necessary to limit total operating expenses on an annual basis (the “Expense Caps”) to .90%, 1.60%, 1.60%, .60%, 1.10%, .85%, .60%, and .60% of the daily average net assets for the Class A, Class B, Class C, Advisor Class, Class R, Class K, Class I, and Class Z shares, respectively. Prior to February 1, 2013,
| 50 | • ALLIANCEBERNSTEIN BOND FUND INTERMEDIATE BOND PORTFOLIO |
Notes to Financial Statements
the Expense Caps were 85%, 1.55%, 1.55%, .55%, 1.05%, .80% and .55% of the daily average net assets for the Class A, Class B, Class C, Advisor Class, Class R, Class K and Class I shares, respectively. This waiver extends through January 31, 2015 and then may be extended by the Adviser for additional one year terms. For the year ended October 31, 2014, such reimbursements/waivers amounted to $624,838.
Pursuant to the investment advisory agreement, the Portfolio may reimburse the Adviser for certain legal and accounting services provided to the Portfolio by the Adviser. For the year ended October 31, 2014, the reimbursement for such services amounted to $56,402.
The Portfolio compensates AllianceBernstein Investor Services, Inc. (“ABIS”), a wholly-owned subsidiary of the Adviser, under a Transfer Agency Agreement for providing personnel and facilities to perform transfer agency services for the Portfolio. ABIS may make payments to intermediaries that provide omnibus account services, sub-accounting services and/or networking services. Such compensation retained by ABIS amounted to $293,976 for the year ended October 31, 2014.
AllianceBernstein Investments, Inc. (the “Distributor”), a wholly-owned subsidiary of the Adviser, serves as the distributor of the Portfolio’s shares. The Distributor has advised the Portfolio that it has retained front-end sales charges of $4,583 from the sale of Class A shares and received $10,368, $1,627 and $389 in contingent deferred sales charges imposed upon redemptions by shareholders of Class A, Class B and Class C shares, respectively, for the year ended October 31, 2014.
The Portfolio may invest in the AllianceBernstein Fixed-Income Shares, Inc. – Government STIF Portfolio (“Government STIF Portfolio”), an open-end management investment company managed by the Adviser. The Government STIF Portfolio is offered as a cash management option to mutual funds and other institutional accounts of the Adviser, and is not available for direct purchase by members of the public. The Government STIF Portfolio pays no investment management fees but does bear its own expenses. A summary of the Portfolio’s transactions in shares of the Government STIF Portfolio for the year ended October 31, 2014 is as follows:
Market Value October 31, 2013 (000) | Purchases at Cost (000) | Sales Proceeds (000) | Market Value October 31, 2014 (000) | Dividend Income (000) | ||||||||||||
| $ 23,337 | $ | 234,631 | $ | 213,509 | $ | 44,459 | $ | 18 | ||||||||
Brokerage commissions paid on investment transactions for the year ended October 31, 2014 amounted to $3,743, of which $0 and $0, respectively, was paid to Sanford C. Bernstein & Co. LLC and Sanford C. Bernstein Limited, affiliates of the Adviser.
| ALLIANCEBERNSTEIN BOND FUND INTERMEDIATE BOND PORTFOLIO • | 51 |
Notes to Financial Statements
NOTE C
Distribution Services Agreement
The Portfolio has adopted a Distribution Services Agreement (the “Agreement”) pursuant to Rule 12b-1 under the Investment Company Act of 1940. Under the Agreement, the Portfolio pays distribution and servicing fees to the Distributor at an annual rate of up to .30% of the Portfolio’s average daily net assets attributable to Class A shares, 1% of the Portfolio’s average daily net assets attributable to both Class B and Class C shares, .50% of the Portfolio’s average daily net assets attributable to Class R shares and .25% of the Portfolio’s average daily net assets attributable to Class K shares. There are no distribution and servicing fees on the Advisor Class, Class I and Class Z shares. The fees are accrued daily and paid monthly. The Agreement provides that the Distributor will use such payments in their entirety for distribution assistance and promotional activities. Since the commencement of the Portfolio’s operations, the Distributor has incurred expenses in excess of the distribution costs reimbursed by the Portfolio in the amounts of $0, $1,026,738, $119,379 and $49,356 for Class B, Class C, Class R and Class K shares, respectively. While such costs may be recovered from the Portfolio in future periods so long as the Agreement is in effect, the rate of the distribution and servicing fees payable under the Agreement may not be increased without a shareholder vote. In accordance with the Agreement, there is no provision for recovery of unreimbursed distribution costs incurred by the Distributor beyond the current fiscal year for Class A shares. The Agreement also provides that the Adviser may use its own resources to finance the distribution of the Portfolio’s shares.
NOTE D
Investment Transactions
Purchases and sales of investment securities (excluding short-term investments) for the year ended October 31, 2014 were as follows:
| Purchases | Sales | |||||||
Investment securities (excluding | $ | 136,582,729 | $ | 228,762,575 | ||||
U.S. government securities | 744,008,039 | 750,402,705 | ||||||
The cost of investments for federal income tax purposes, gross unrealized appreciation and unrealized depreciation (excluding futures, foreign currency and swap transactions) are as follows:
Cost | $ | 392,379,914 | ||
|
| |||
Gross unrealized appreciation | $ | 6,145,553 | ||
Gross unrealized depreciation | (3,861,825 | ) | ||
|
| |||
Net unrealized appreciation | $ | 2,283,728 | ||
|
|
| 52 | • ALLIANCEBERNSTEIN BOND FUND INTERMEDIATE BOND PORTFOLIO |
Notes to Financial Statements
1. Derivative Financial Instruments
The Portfolio may use derivatives in an effort to earn income and enhance returns, to replace more traditional direct investments, to obtain exposure to otherwise inaccessible markets (collectively, “investment purposes”), or to hedge or adjust the risk profile of its portfolio.
The principal types of derivatives utilized by the Portfolio, as well as the methods in which they may be used are:
| • | Futures |
The Portfolio may buy or sell futures for investment purposes or for the purpose of hedging its portfolio against adverse effects of potential movements in the market. The Portfolio bears the market risk that arises from changes in the value of these instruments and the imperfect correlation between movements in the price of the futures and movements in the price of the assets, reference rates or indices which they are designed to track. Among other things, the Portfolio may purchase or sell futures for foreign currencies or options thereon for non-hedging purposes as a means of making direct investment in foreign currencies, as described below under “Currency Transactions”.
At the time the Portfolio enters into futures, the Portfolio deposits and maintains as collateral an initial margin with the broker, as required by the exchange on which the transaction is effected. Such amount is shown as due from broker on the statement of assets and liabilities. Pursuant to the contract, the Portfolio agrees to receive from or pay to the broker an amount of cash equal to the daily fluctuation in the value of the contract. Such receipts or payments are known as variation margin and are recorded by the Portfolio as unrealized gains or losses. Risks may arise from the potential inability of a counterparty to meet the terms of the contract. The credit/counterparty risk for exchange-traded futures is generally less than privately negotiated futures, since the clearinghouse, which is the issuer or counterparty to each exchange-traded future, has robust risk mitigation standards, including the requirement to provide initial and variation margin. When the contract is closed, the Portfolio records a realized gain or loss equal to the difference between the value of the contract at the time it was opened and the time it was closed.
Use of long futures subjects the Portfolio to risk of loss in excess of the amounts shown on the statement of assets and liabilities, up to the notional value of the futures. Use of short futures subjects the Portfolio to unlimited risk of loss. Under some circumstances, futures exchanges may establish daily limits on the amount that the price of futures can vary from the previous day’s settlement price, which could effectively prevent liquidation of unfavorable positions.
| ALLIANCEBERNSTEIN BOND FUND INTERMEDIATE BOND PORTFOLIO • | 53 |
Notes to Financial Statements
During the year ended October 31, 2014, the Portfolio held futures for hedging and non-hedging purposes.
| • | Forward Currency Exchange Contracts |
The Portfolio may enter into forward currency exchange contracts in order to hedge its exposure to changes in foreign currency exchange rates on its foreign portfolio holdings, to hedge certain firm purchase and sale commitments denominated in foreign currencies and for non-hedging purposes as a means of making direct investments in foreign currencies, as described below under “Currency Transactions”.
A forward currency exchange contract is a commitment to purchase or sell a foreign currency at a future date at a negotiated forward rate. The gain or loss arising from the difference between the original contract and the closing of such contract would be included in net realized gain or loss on foreign currency transactions. Fluctuations in the value of open forward currency exchange contracts are recorded for financial reporting purposes as unrealized appreciation and/or depreciation by the Portfolio. Risks may arise from the potential inability of a counterparty to meet the terms of a contract and from unanticipated movements in the value of a foreign currency relative to the U.S. dollar.
During the year ended October 31, 2014, the Portfolio held forward currency exchange contracts for hedging and non-hedging purposes.
| • | Option Transactions |
For hedging and investment purposes, the Portfolio may purchase and write (sell) put and call options on U.S. and foreign securities, including government securities, and foreign currencies that are traded on U.S. and foreign securities exchanges and over-the-counter markets. Among other things, the Portfolio may use options transactions for non-hedging purposes as a means of making direct investments in foreign currencies, as described below under “Currency Transactions” and may use options strategies involving the purchase and/or writing of various combinations of call and/or put options, for hedging and investment purposes.
The risk associated with purchasing an option is that the Portfolio pays a premium whether or not the option is exercised. Additionally, the Portfolio bears the risk of loss of the premium and change in market value should the counterparty not perform under the contract. Put and call options purchased are accounted for in the same manner as portfolio securities. The cost of securities acquired through the exercise of call options is increased by premiums paid. The proceeds from securities sold through the exercise of put options are decreased by the premiums paid.
When the Portfolio writes an option, the premium received by the Portfolio is recorded as a liability and is subsequently adjusted to the current market value of the option written. Premiums received from
| 54 | • ALLIANCEBERNSTEIN BOND FUND INTERMEDIATE BOND PORTFOLIO |
Notes to Financial Statements
written options which expire unexercised are recorded by the Portfolio on the expiration date as realized gains from options written. The difference between the premium received and the amount paid on effecting a closing purchase transaction, including brokerage commissions, is also treated as a realized gain, or if the premium received is less than the amount paid for the closing purchase transaction, as a realized loss. If a call option is exercised, the premium received is added to the proceeds from the sale of the underlying security or currency in determining whether the Portfolio has realized a gain or loss. If a put option is exercised, the premium received reduces the cost basis of the security or currency purchased by the Portfolio. In writing an option, the Portfolio bears the market risk of an unfavorable change in the price of the security or currency underlying the written option. Exercise of an option written by the Portfolio could result in the Portfolio selling or buying a security or currency at a price different from the current market value.
During the year ended October 31, 2014, the Portfolio held purchased options for hedging purposes.
For the year ended October 31, 2014, the Portfolio had the following transactions in written options:
| Number of Contracts | Premiums Received | |||||||
Options written outstanding as of 10/31/13 | – 0 | – | $ | – 0 | – | |||
Options written | 122,000 | 37,400 | ||||||
Options expired | (122,000 | ) | (37,400 | ) | ||||
Options bought back | – 0 | – | – 0 | – | ||||
Options exercised | – 0 | – | – 0 | – | ||||
|
|
|
| |||||
Options written outstanding as of 10/31/14 | – 0 | – | $ | – 0 | – | |||
|
|
|
| |||||
| • | Swaps |
The Portfolio may enter into swaps to hedge its exposure to interest rates, credit risk, or currencies. The Portfolio may also enter into swaps for non-hedging purposes as a means of gaining market exposures, including by making direct investments in foreign currencies, as described below under “Currency Transactions” or in order to take a “long” or “short” position with respect to an underlying referenced asset described below under “Total Return Swaps”. A swap is an agreement that obligates two parties to exchange a series of cash flows at specified intervals based upon or calculated by reference to changes in specified prices or rates for a specified amount of an underlying asset. The payment flows are usually netted against each other, with the difference being paid by one party to the other. In addition, collateral may be pledged or received by the Portfolio in accordance with the terms of the respective swaps to provide value and recourse to the Portfolio or its counterparties in the event of default, bankruptcy or insolvency by one of the parties to the swap.
| ALLIANCEBERNSTEIN BOND FUND INTERMEDIATE BOND PORTFOLIO • | 55 |
Notes to Financial Statements
Risks may arise as a result of the failure of the counterparty to the swap to comply with the terms of the swap. The loss incurred by the failure of a counterparty is generally limited to the net interim payment to be received by the Portfolio, and/or the termination value at the end of the contract. Therefore, the Portfolio considers the creditworthiness of each counterparty to a swap in evaluating potential counterparty risk. This risk is mitigated by having a netting arrangement between the Portfolio and the counterparty and by the posting of collateral by the counterparty to the Portfolio to cover the Portfolio’s exposure to the counterparty. Additionally, risks may arise from unanticipated movements in interest rates or in the value of the underlying securities. The Portfolio accrues for the interim payments on swaps on a daily basis, with the net amount recorded within unrealized appreciation/depreciation of swaps on the statement of assets and liabilities, where applicable. Once the interim payments are settled in cash, the net amount is recorded as realized gain/(loss) on swaps on the statement of operations, in addition to any realized gain/(loss) recorded upon the termination of swaps. Upfront premiums paid or received are recognized as cost or proceeds on the statement of assets and liabilities and are amortized on a straight line basis over the life of the contract. Amortized upfront premiums are included in net realized gain/(loss) from swaps on the statement of operations. Fluctuations in the value of swaps are recorded as a component of net change in unrealized appreciation/depreciation of swaps on the statement of operations.
Certain standardized swaps, including certain interest rate swaps and credit default swaps, are (or soon will be) subject to mandatory central clearing. Cleared swaps are transacted through futures commission merchants (“FCMs”) that are members of central clearinghouses, with the clearinghouse serving as central counterparty, similar to transactions in futures contracts. Centralized clearing will be required for additional categories of swaps on a phased-in basis based on requirements published by the Securities and Exchange Commission and Commodity Futures Trading Commission.
At the time the Portfolio enters into a centrally cleared swap, the Portfolio deposits and maintains as collateral an initial margin with the broker, as required by the exchange on which the transaction is effected. Such amount is shown as due from broker on the statement of assets and liabilities. Pursuant to the contract, the Portfolio agrees to receive from or pay to the broker an amount of cash equal to the daily fluctuation in the value of the contract. Such receipts or payments are known as variation margin and are recorded by the Portfolio as unrealized gains or losses. Risks may arise from the potential inability of a counterparty to meet the terms of the contract. The credit/counterparty risk for swaps cleared through a central clearing house exchange is generally less than privately negotiated swaps, since the clearinghouse, which is the issuer or
| 56 | • ALLIANCEBERNSTEIN BOND FUND INTERMEDIATE BOND PORTFOLIO |
Notes to Financial Statements
counterparty to each exchange-traded swap, has robust risk mitigation standards, including the requirement to provide initial and variation margin. When the contract is closed, the Portfolio records a realized gain or loss equal to the difference between the value of the contract at the time it was opened and the time it was closed.
Interest Rate Swaps:
The Portfolio is subject to interest rate risk exposure in the normal course of pursuing its investment objectives. Because the Portfolio holds fixed rate bonds, the value of these bonds may decrease if interest rates rise. To help hedge against this risk and to maintain its ability to generate income at prevailing market rates, the Portfolio may enter into interest rate swaps. Interest rate swaps are agreements between two parties to exchange cash flows based on a notional amount. The Portfolio may elect to pay a fixed rate and receive a floating rate, or, receive a fixed rate and pay a floating rate on a notional amount.
In addition, the Portfolio may also enter into interest rate swap transactions to preserve a return or spread on a particular investment or portion of its portfolio, or protecting against an increase in the price of securities the Portfolio anticipates purchasing at a later date. Interest rate swaps involve the exchange by a Portfolio with another party of their respective commitments to pay or receive interest (e.g., an exchange of floating rate payments for fixed rate payments) computed based on a contractually-based principal (or “notional”) amount. Interest rate swaps are entered into on a net basis (i.e., the two payment streams are netted out, with the Portfolio receiving or paying, as the case may be, only the net amount of the two payments).
During the year ended October 31, 2014, the Portfolio held interest rate swaps for hedging and non-hedging purposes.
Currency Swaps:
The Portfolio may invest in currency swaps for hedging purposes to protect against adverse changes in exchange rates between the U.S. Dollar and other currencies or for non-hedging purposes as a means of making direct investments in foreign currencies, as described below under “Currency Transactions”. Currency swaps involve the individually negotiated exchange by a Portfolio with another party of a series of payments in specified currencies. Actual principal amounts of currencies may be exchanged by the counterparties at the initiation, and again upon the termination, of the transaction. Therefore, the entire principal value of a currency swap is subject to the risk that the swap counterparty will default on its contractual delivery obligations.
During the year ended October 31, 2014, the Portfolio held currency swaps for hedging purposes.
| ALLIANCEBERNSTEIN BOND FUND INTERMEDIATE BOND PORTFOLIO • | 57 |
Notes to Financial Statements
Credit Default Swaps:
The Portfolio may enter into credit default swaps, including to manage its exposure to the market or certain sectors of the market, to reduce its risk exposure to defaults by corporate and sovereign issuers held by the Portfolio, or to create exposure to corporate or sovereign issuers to which it is not otherwise exposed. The Portfolio may purchase credit protection (“Buy Contract”) or provide credit protection (“Sale Contract”) on the referenced obligation of the credit default swap. During the term of the swap, the Portfolio receives/(pays) fixed payments from/(to) the respective counterparty, calculated at the agreed upon rate applied to the notional amount. If the Portfolio is a buyer/(seller) of protection and a credit event occurs, as defined under the terms of the swap, the Portfolio will either (i) receive from the seller/(pay to the buyer) of protection an amount equal to the notional amount of the swap (the “Maximum Payout Amount”) and deliver/(take delivery of) the referenced obligation or (ii) receive/(pay) a net settlement amount in the form of cash or securities equal to the notional amount of the swap less the recovery value of the referenced obligation.
In certain circumstances Maximum Payout Amounts may be partially offset by recovery values of the respective referenced obligations, upfront premium received upon entering into the agreement, or net amounts received from settlement of buy protection credit default swaps entered into by the Portfolio for the same reference obligation with the same counterparty. As of October 31, 2014, the Portfolio did not have Buy Contracts outstanding with respect to the same referenced obligation and same counterparty for its Sale Contracts outstanding.
Credit default swaps may involve greater risks than if a Portfolio had invested in the referenced obligation directly. Credit default swaps are subject to general market risk, liquidity risk, counterparty risk and credit risk. If the Portfolio is a buyer of protection and no credit event occurs, it will lose the payments it made to its counterparty. If the Portfolio is a seller of protection and a credit event occurs, the value of the referenced obligation received by the Portfolio coupled with the periodic payments previously received, may be less than the Maximum Payout Amount it pays to the buyer, resulting in a net loss to the Portfolio.
During the year ended October 31, 2014, the Portfolio held credit default swaps for hedging and non-hedging purposes.
Implied credit spreads over U.S. Treasuries comparable maturity utilized in determining the market value of credit default swaps on issuers as of period end are disclosed in the portfolio of investments. The implied spreads serve as an indicator of the current status of the payment/performance risk and typically reflect the likelihood of default by the issuer of the referenced obligation. The implied credit spread of a particular reference obligation also reflects the cost of buying/selling protection and may reflect upfront
| 58 | • ALLIANCEBERNSTEIN BOND FUND INTERMEDIATE BOND PORTFOLIO |
Notes to Financial Statements
payments required to be made to enter into the agreement. Widening credit spreads typically represent a deterioration of the referenced obligation’s credit soundness and greater likelihood of default or other credit event occurring as defined under the terms of the agreement. A credit spread identified as “Defaulted” indicates a credit event has occurred for the referenced obligation.
The Portfolio typically enters into International Swaps and Derivatives Association, Inc. Master Agreements (“ISDA Master Agreement”) or similar master agreements (collectively, “Master Agreements”) with its OTC derivative contract counterparties in order to, among other things, reduce its credit risk to counterparties. ISDA Master Agreements include provisions for general obligations, representations, collateral and events of default or termination. Under an ISDA Master Agreement, the Portfolio typically may offset with the counterparty certain derivative financial instrument’s payables and/or receivables with collateral held and/or posted and create one single net payment (close-out netting) in the event of default or termination.
Various Master Agreements govern the terms of certain transactions with counterparties, including transactions such as exchange-traded derivative transactions, repurchase and reverse repurchase agreements. These Master Agreements typically attempt to reduce the counterparty risk associated with such transactions by specifying credit protection mechanisms and providing standardization that improves legal certainty. Cross-termination provisions under Master Agreements typically provide that a default in connection with one transaction between the Portfolio and a counterparty gives the non-defaulting party the right to terminate any other transactions in place with the defaulting party to create one single net payment due to/due from the defaulting party. In the event of a default by a Master Agreements counterparty, the return of collateral with market value in excess of the Portfolio’s net liability, held by the defaulting party, may be delayed or denied.
The Portfolio’s Master Agreements may contain provisions for early termination of OTC derivative transactions in the event the net assets of the Portfolio decline below specific levels (“net asset contingent features”). If these levels are triggered, the Portfolio’s counterparty has the right to terminate such transaction and require the Portfolio to pay or receive a settlement amount in connection with the terminated transaction. For additional details, please refer to netting arrangements by counterparty tables below.
At October 31, 2014, the Portfolio had entered into the following derivatives:
Asset Derivatives | Liability Derivatives | |||||||||||
Derivative Type | Statement of | Fair Value | Statement of | Fair Value | ||||||||
Interest rate contracts | Receivable/Payable for variation margin on exchange-traded derivatives | $ | 103,925 | * | Receivable/Payable for variation margin on exchange-traded derivatives | $ | 375,820 | * | ||||
| ALLIANCEBERNSTEIN BOND FUND INTERMEDIATE BOND PORTFOLIO • | 59 |
Notes to Financial Statements
Asset Derivatives | Liability Derivatives | |||||||||||
Derivative Type | Statement of | Fair Value | Statement of | Fair Value | ||||||||
Foreign exchange contracts | Unrealized appreciation on forward currency exchange contracts | $ | 314,444 | | Unrealized depreciation on forward currency exchange contracts | $ | 34,311 | | ||||
Equity contracts | Investments in securities, at value | 1,537 | ||||||||||
Interest rate contracts | Unrealized appreciation on interest rate swaps | | 27,664 | | Unrealized depreciation on interest rate swaps | | 45,273 | | ||||
Foreign exchange contracts | Unrealized appreciation on currency swaps | | 92,827 | | ||||||||
Credit contracts | Unrealized appreciation on credit default swaps | 62,528 | Unrealized depreciation on credit default swaps | 118 | ||||||||
|
|
|
| |||||||||
Total | $ | 602,925 | $ | 455,522 | ||||||||
|
|
|
| |||||||||
| * | Only variation margin receivable/payable at period end is reported within the statement of assets and liabilities. This amount reflects cumulative appreciation/(depreciation) of exchange-traded derivatives as reported in the portfolio of investments. |
The effect of derivative instruments on the statement of operations for the year ended October 31, 2014:
Derivative Type | Location of | Realized Gain or (Loss) on Derivatives | Change in Unrealized Appreciation or (Depreciation) | |||||||
Interest rate contracts | Net realized gain (loss) on futures; Net change in unrealized appreciation/depreciation of futures | $ | (88,847 | ) | $ | 20,167 | ||||
Foreign exchange contracts | Net realized gain (loss) on foreign currency transactions; Net change in unrealized appreciation/depreciation of foreign currency denominated assets and liabilities | | (313,978 | ) | | 530,589 | | |||
| 60 | • ALLIANCEBERNSTEIN BOND FUND INTERMEDIATE BOND PORTFOLIO |
Notes to Financial Statements
Derivative Type | Location of | Realized Gain or (Loss) on Derivatives | Change in Unrealized Appreciation or (Depreciation) | |||||||
Equity contracts | Net realized gain (loss) on investment transactions; Net change in unrealized appreciation/depreciation of investments | $ | (113,960 | ) | $ | (24,713 | ) | |||
Equity contracts | Net realized gain (loss) on options written; Net change in unrealized appreciation/depreciation of options written | 37,400 | ||||||||
Interest rate contracts | Net realized gain (loss) on swaps; Net change in unrealized appreciation/depreciation of swaps | (258,685 | ) | (256,433 | ) | |||||
Foreign exchange contracts | Net realized gain (loss) on swaps; Net change in unrealized appreciation/depreciation of swaps | | 5,416 | | | 138,558 | | |||
Credit contracts | Net realized gain (loss) on swaps; Net change in unrealized appreciation/depreciation of swaps | 246,782 | (185,547 | ) | ||||||
|
|
|
| |||||||
Total | $ | (485,872 | ) | $ | 222,621 | |||||
|
|
|
| |||||||
The following table represents the volume of the Portfolio’s derivative transactions during the year ended October 31, 2014:
Futures: | ||||
Average original value of buy contracts | $ | 7,791,459 | ||
Average original value of sale contracts | $ | 12,275,795 | ||
Forward Currency Exchange Contracts: | ||||
Average principal amount of buy contracts | $ | 9,818,747 | ||
Average principal amount of sale contracts | $ | 42,713,923 | ||
Purchased Options: | ||||
Average monthly cost | $ | 43,484 | (a) | |
Interest Rate Swaps: | ||||
Average notional amount | $ | 11,820,000 | ||
Centrally Cleared Interest Rate Swaps: | ||||
Average notional amount | $ | 12,531,914 | (b) | |
Cross Currency Swaps: | ||||
Average notional amount | $ | 1,637,610 | ||
| ALLIANCEBERNSTEIN BOND FUND INTERMEDIATE BOND PORTFOLIO • | 61 |
Notes to Financial Statements
Credit Default Swaps: | ||||
Average notional amount of buy contracts | $ | 3,530,000 | (c) | |
Average notional amount of sale contracts | $ | 1,758,453 | ||
Centrally Cleared Credit Default Swaps: | ||||
Average notional amount of buy contracts | $ | 23,605,000 | (d) | |
Average notional amount of sale contracts | $ | 8,136,667 | (a) |
| (a) | Positions were open for five months during the year. |
| (b) | Positions were open for eleven months during the year. |
| (c) | Positions were open for six months during the year. |
| (d) | Positions were open for two months during the year. |
For financial reporting purposes, the Portfolio does not offset derivative assets and derivative liabilities that are subject to netting arrangements in the statement of assets and liabilities.
All derivatives held at period end were subject to netting arrangements. The following table presents the Portfolio’s derivative assets and liabilities by counterparty net of amounts available for offset under Master Agreements (“MA”) and net of the related collateral received/pledged by the Portfolio as of October 31, 2014:
Counterparty | Derivative Assets Subject to a MA | Derivative Available for Offset | Cash Collateral Received* | Security Collateral Received* | Net Amount of Derivatives Assets | |||||||||||||||
Exchange-Traded Derivatives: | ||||||||||||||||||||
Morgan Stanley & Co., LLC** | $ | 4,442 | $ | – 0 | – | $ | – 0 – | $ | – 0 | – | $ | 4,442 | ||||||||
|
|
|
|
|
|
|
|
|
| |||||||||||
Total | $ | 4,442 | $ | – 0 | – | $ | – 0 – | $ | – 0 | – | $ | 4,442 | ||||||||
|
|
|
|
|
|
|
|
|
| |||||||||||
OTC Derivatives: | ||||||||||||||||||||
Barclays Bank PLC | $ | 92,827 | $ | – 0 | – | $ | – 0 – | $ | – 0 | – | $ | 92,827 | ||||||||
BNP Paribas SA | 172,034 | – 0 | – | – 0 – | – 0 | – | 172,034 | |||||||||||||
Citibank, NA | 89,684 | – 0 | – | – 0 – | – 0 | – | 89,684 | |||||||||||||
Credit Suisse International | 23,128 | – 0 | – | – 0 – | – 0 | – | 23,128 | |||||||||||||
Goldman Sachs Bank USA | 112,898 | – 0 | – | – 0 – | – 0 | – | 112,898 | |||||||||||||
JPMorgan Chase Bank | 58,860 | – 0 | – | – 0 – | – 0 | – | 58,860 | |||||||||||||
JPMorgan Chase Bank, NA | 27,664 | (27,664 | ) | – 0 – | – 0 | – | – 0 | – | ||||||||||||
Royal Bank of Scotland PLC | 85,087 | – 0 | – | – 0 – | – 0 | – | 85,087 | |||||||||||||
|
|
|
|
|
|
|
|
|
| |||||||||||
Total | $ | 662,182 | $ | (27,664 | ) | $ | –0 – | $ | – 0 | – | $ | 634,518 | ^ | |||||||
|
|
|
|
|
|
|
|
|
| |||||||||||
| 62 | • ALLIANCEBERNSTEIN BOND FUND INTERMEDIATE BOND PORTFOLIO |
Notes to Financial Statements
Counterparty | Derivative Liabilities Subject to a MA | Derivative Available for Offset | Cash Collateral Pledged* | Security Collateral Pledged* | Net Amount of Derivatives Liabilities | |||||||||||||||
Exchange-Traded Derivatives: | ||||||||||||||||||||
NewEdge USA, LLC** | $ | 6,648 | $ | – 0 | – | $ | (6,648 | ) | $ | – 0 | – | $ | – 0 | – | ||||||
|
|
|
|
|
|
|
|
|
| |||||||||||
Total | $ | 6,648 | $ | – 0 | – | $ | (6,648 | ) | $ | – 0 | – | $ | – 0 | – | ||||||
|
|
|
|
|
|
|
|
|
| |||||||||||
OTC Derivatives: | ||||||||||||||||||||
JPMorgan Chase Bank, NA | $ | 45,273 | $ | (27,664 | ) | $ | – 0 | – | $ | – 0 | – | $ | 17,609 | |||||||
State Street Bank & Trust Co. | 34,311 | – 0 | – | – 0 | – | – 0 | – | 34,311 | ||||||||||||
|
|
|
|
|
|
|
|
|
| |||||||||||
Total | $ | 79,584 | $ | (27,664 | ) | $ | –0 | – | $ | – 0 | – | $ | 51,920 | ^ | ||||||
|
|
|
|
|
|
|
|
|
| |||||||||||
| * | The actual collateral received/pledged may be more than the amount reported due to overcollateralization. |
| ** | Cash has been posted for initial margin requirements for exchange traded derivatives outstanding at October 31, 2014. |
| ^ | Net amount represents the net receivable/(payable) that would be due from/to the counterparty in the event of default or termination. The net amount from OTC financial derivative instruments can only be netted across transactions governed under the same master agreement with the same counterparty. |
2. Currency Transactions
The Portfolio may invest in non-U.S. dollar securities on a currency hedged or unhedged basis. The Portfolio may seek investment opportunities by taking long or short positions in currencies through the use of currency-related derivatives, including forward currency exchange contracts, futures and options on futures, swaps, and other options. The Portfolio may enter into transactions for investment opportunities when it anticipates that a foreign currency will appreciate or depreciate in value but securities denominated in that currency are not held by the Portfolio and do not present attractive investment opportunities. Such transactions may also be used when the Adviser believes that it may be more efficient than a direct investment in a foreign currency-denominated security. The Portfolio may also conduct currency exchange contracts on a spot basis (i.e., for cash at the spot rate prevailing in the currency exchange market for buying or selling currencies).
3. Dollar Rolls
The Portfolio may enter into dollar rolls. Dollar rolls involve sales by the Portfolio of securities for delivery in the current month and the Portfolio’s simultaneously contracting to repurchase substantially similar (same type and coupon) securities on a specified future date. During the roll period, the Portfolio forgoes principal and interest paid on the securities. The Portfolio is compensated by the difference between the current sales price and the lower forward price for the future purchase (often referred to as the “drop”) as well as by the interest earned on the cash proceeds of the initial sale. Dollar rolls involve the risk that the market value of the securities the Portfolio is obligated to repurchase under the agreement may decline below the repurchase price. Dollar rolls are speculative techniques and may be considered to be borrowings by the Portfolio. For the year ended October 31,
| ALLIANCEBERNSTEIN BOND FUND INTERMEDIATE BOND PORTFOLIO • | 63 |
Notes to Financial Statements
2014, the Portfolio earned drop income of $1,448,142 which is included in interest income in the accompanying statement of operations.
4. Reverse Repurchase Agreements
The Portfolio may enter into reverse repurchase transactions (“RVP”) in accordance with the terms of a Master Repurchase Agreement (“MRA”), under which the Portfolio sells securities and agrees to repurchase them at a mutually agreed upon date and price. At the time the Portfolio enters into a reverse repurchase agreement, it will establish a segregated account with the custodian containing liquid assets having a value comparable to the repurchase price. Under the MRA and other Master Agreements, the Portfolio is permitted to offset payables and/or receivables with collateral held and/or posted to the counterparty and create one single net payment due to or from the Portfolio in the event of a default. In the event of a default by a MRA counterparty, the Portfolio may be considered an unsecured creditor with respect to any excess collateral (collateral with a market value in excess of the repurchase price) held by and/or posted to the counterparty, and as such the return of such excess collateral may be delayed or denied. For the year ended October 31, 2014, the Portfolio had no transactions in reverse repurchase agreements.
NOTE E
Capital Stock
Each class consists of 3,000,000,000 authorized shares. Transactions in capital shares for each class were as follows:
| Shares | Amount | |||||||||||||||||||
| Year Ended October 31, 2014 | Year Ended October 31, 2013 | Year Ended October 31, 2014 | Year Ended 2013 | |||||||||||||||||
|
| |||||||||||||||||||
| Class A | ||||||||||||||||||||
Shares sold | 933,382 | 1,466,440 | $ | 10,384,000 | $ | 16,441,189 | ||||||||||||||
| ||||||||||||||||||||
Shares issued in reinvestment of dividends | 573,909 | 614,242 | 6,379,324 | 6,847,142 | ||||||||||||||||
| ||||||||||||||||||||
Shares converted from Class B | 149,844 | 203,622 | 1,663,533 | 2,282,617 | ||||||||||||||||
| ||||||||||||||||||||
Shares redeemed | (4,712,407 | ) | (7,362,008 | ) | (52,313,975 | ) | (81,944,743 | ) | ||||||||||||
| ||||||||||||||||||||
Net decrease | (3,055,272 | ) | (5,077,704 | ) | $ | (33,887,118 | ) | $ | (56,373,795 | ) | ||||||||||
| ||||||||||||||||||||
| Class B | ||||||||||||||||||||
Shares sold | 18,189 | 64,968 | $ | 202,388 | $ | 729,431 | ||||||||||||||
| ||||||||||||||||||||
Shares issued in reinvestment of dividends | 8,122 | 11,838 | 90,163 | 132,338 | ||||||||||||||||
| ||||||||||||||||||||
Shares converted to Class A | (149,785 | ) | (203,497 | ) | (1,663,533 | ) | (2,282,617 | ) | ||||||||||||
| ||||||||||||||||||||
Shares redeemed | (94,252 | ) | (184,123 | ) | (1,044,053 | ) | (2,049,413 | ) | ||||||||||||
| ||||||||||||||||||||
Net decrease | (217,726 | ) | (310,814 | ) | $ | (2,415,035 | ) | $ | (3,470,261 | ) | ||||||||||
| ||||||||||||||||||||
| 64 | • ALLIANCEBERNSTEIN BOND FUND INTERMEDIATE BOND PORTFOLIO |
Notes to Financial Statements
| Shares | Amount | |||||||||||||||||||
| Year Ended October 31, 2014 | Year Ended October 31, 2013 | Year Ended October 31, 2014 | Year Ended 2013 | |||||||||||||||||
|
|
|
|
|
|
|
|
| ||||||||||||
| Class C | ||||||||||||||||||||
Shares sold | 179,590 | 351,263 | $ | 2,000,896 | $ | 3,941,632 | ||||||||||||||
| ||||||||||||||||||||
Shares issued in reinvestment of dividends | 73,610 | 77,930 | 816,406 | 867,511 | ||||||||||||||||
| ||||||||||||||||||||
Shares redeemed | (776,478 | ) | (1,480,096 | ) | (8,588,355 | ) | (16,442,430 | ) | ||||||||||||
| ||||||||||||||||||||
Net decrease | (523,278 | ) | (1,050,903 | ) | $ | (5,771,053 | ) | $ | (11,633,287 | ) | ||||||||||
| ||||||||||||||||||||
| Advisor Class | ||||||||||||||||||||
Shares sold | 2,974,672 | 1,332,510 | $ | 33,468,592 | $ | 14,997,612 | ||||||||||||||
| ||||||||||||||||||||
Shares issued in reinvestment of dividends | 93,793 | 230,003 | 1,035,070 | 2,566,416 | ||||||||||||||||
| ||||||||||||||||||||
Shares redeemed | (7,399,876 | ) | (3,180,265 | ) | (81,798,132 | ) | (35,169,323 | ) | ||||||||||||
| ||||||||||||||||||||
Net decrease | (4,331,411 | ) | (1,617,752 | ) | $ | (47,294,470 | ) | $ | (17,605,295 | ) | ||||||||||
| ||||||||||||||||||||
| Class R | ||||||||||||||||||||
Shares sold | 59,606 | 158,867 | $ | 661,932 | $ | 1,801,725 | ||||||||||||||
| ||||||||||||||||||||
Shares issued in reinvestment of dividends | 5,744 | 5,488 | 63,862 | 61,160 | ||||||||||||||||
| ||||||||||||||||||||
Shares redeemed | (58,323 | ) | (98,153 | ) | (647,074 | ) | (1,103,120 | ) | ||||||||||||
| ||||||||||||||||||||
Net increase | 7,027 | 66,202 | $ | 78,720 | $ | 759,765 | ||||||||||||||
| ||||||||||||||||||||
| Class K | ||||||||||||||||||||
Shares sold | 101,384 | 48,779 | $ | 1,121,247 | $ | 546,056 | ||||||||||||||
| ||||||||||||||||||||
Shares issued in reinvestment of dividends | 11,372 | 9,385 | 126,655 | 104,699 | ||||||||||||||||
| ||||||||||||||||||||
Shares redeemed | (25,439 | ) | (78,983 | ) | (282,557 | ) | (879,538 | ) | ||||||||||||
| ||||||||||||||||||||
Net increase (decrease) | 87,317 | (20,819 | ) | $ | 965,345 | $ | (228,783 | ) | ||||||||||||
| ||||||||||||||||||||
| Class I | ||||||||||||||||||||
Shares sold | 11,353 | 1,868 | $ | 127,276 | $ | 20,957 | ||||||||||||||
| ||||||||||||||||||||
Shares issued in reinvestment of dividends | 98 | 155 | 1,097 | 1,763 | ||||||||||||||||
| ||||||||||||||||||||
Shares redeemed | (3,219 | ) | (72,131 | ) | (36,261 | ) | (822,792 | ) | ||||||||||||
| ||||||||||||||||||||
Net increase (decrease) | 8,232 | (70,108 | ) | $ | 92,112 | $ | (800,072 | ) | ||||||||||||
| ||||||||||||||||||||
| Class Z(a) | ||||||||||||||||||||
Shares sold | 897 | – 0 | – | $ | 10,003 | $ | – 0 | – | ||||||||||||
| ||||||||||||||||||||
Net increase | 897 | – 0 | – | $ | 10,003 | $ | – 0 | – | ||||||||||||
| ||||||||||||||||||||
| (a) | Commenced distribution on April 28, 2014. |
For the year ended October 31, 2013, the Portfolio received $621,752 related to a third-party’s settlement of regulatory proceedings involving allegations of
| ALLIANCEBERNSTEIN BOND FUND INTERMEDIATE BOND PORTFOLIO • | 65 |
Notes to Financial Statements
improper trading. This amount is presented in the Portfolio’s statement of changes in net assets. Neither the Portfolio nor its affiliates were involved in the proceedings or the calculation of the payment.
NOTE F
Risks Involved in Investing in the Portfolio
Interest Rate Risk and Credit Risk—Interest rate risk is the risk that changes in interest rates will affect the value of the Portfolio’s investments in fixed-income debt securities such as bonds or notes. Increases in interest rates may cause the value of the Portfolio’s investments to decline. Credit risk is the risk that the issuer or guarantor of a debt security, or the counterparty to a derivative contract, will be unable or unwilling to make timely principal and/or interest payments, or to otherwise honor its obligations. The degree of risk for a particular security may be reflected in its credit rating. Credit risk is greater for medium quality and lower-rated securities. Lower-rated debt securities and similar unrated securities (commonly known as “junk bonds”) have speculative elements or are predominantly speculative risks.
Foreign Securities Risk—Investing in securities of foreign companies or foreign governments involves special risks which include changes in foreign currency exchange rates and the possibility of future political and economic developments which could adversely affect the value of such securities. Moreover, securities of many foreign companies or foreign governments and their markets may be less liquid and their prices more volatile than those of comparable U.S. companies or of the U.S. government.
Emerging Market Risk—Investments in emerging market countries may have more risk because the markets are less developed and less liquid, and because these investments may be subject to increased economic, political, regulatory and other uncertainties.
Inflation Risk—This is the risk that the value of assets or income from investments will be less in the future as inflation decreases the value of money. As inflation increases, the real value of the Portfolio’s assets can decline as can the real value of the Portfolio’s distributions.
Currency Risk—This is the risk that changes in foreign currency exchange rates may negatively affect the value of the Portfolio’s investments or reduce the returns of the Portfolio. For example, the value of the Portfolio’s investments in foreign currency-denominated securities or currencies may decrease if the U.S. dollar is strong (i.e., gaining value relative to other currencies) and other currencies are weak (i.e., losing value relative to the U.S. dollar). Currency markets are generally not as regulated as securities markets. Independent of the Portfolio’s investments denominated in foreign currencies, the Portfolio’s positions in various foreign currencies may cause the Portfolio to experience investment losses due to the changes in exchange rates and interest rates.
| 66 | • ALLIANCEBERNSTEIN BOND FUND INTERMEDIATE BOND PORTFOLIO |
Notes to Financial Statements
Derivatives Risk—The Portfolio may enter into derivative transactions such as forwards, options, futures and swaps. Derivatives may be illiquid, difficult to price, and leveraged so that small changes may produce disproportionate losses for the Portfolio, and subject to counterparty risk to a greater degree than more traditional investments. Derivatives may result in significant losses, including losses that are far greater than the value of the derivatives reflected in the statement of assets and liabilities.
Leverage Risk—When the Portfolio borrows money or otherwise leverages its portfolio, it may be volatile because leverage tends to exaggerate the effect of any increase or decrease in the value of the Portfolio’s investments. The Portfolio may create leverage through the use of reverse repurchase arrangements, forward currency exchange contracts, forward commitments, dollar rolls or futures contracts or by borrowing money. The use of derivative instruments by the Portfolio, such as forwards, futures, options and swaps, may also result in a form of leverage. Leverage may result in higher returns to the Portfolio than if the Portfolio were not leveraged, but may also adversely affect returns, particularly if the market is declining.
Liquidity Risk—Liquidity risk exists when particular investments are difficult to purchase or sell, possibly preventing the Portfolio from selling out of these illiquid or relatively less liquid securities at an advantageous price. Causes of liquidity risk may include low trading volume, lack of a market maker, a large position, heavy redemptions, or legal restrictions that limit or prevent a Portfolio from selling securities or closing derivative positions at desirable prices or opportune times. Over recent years, the capacity of dealers to make markets in fixed income securities has been outpaced by the growth in the size of the fixed income markets. Liquidity risk may be magnified in a rising interest rate environment, where the value and liquidity of fixed income securities generally go down. Derivatives and securities involving substantial market and credit risk tend to involve greater liquidity risk. Because the Portfolio invests in municipal securities, the Portfolio is subject to more liquidity risk because the market for municipal securities is generally smaller than many other markets. Illiquid securities and relatively less liquid securities may also be difficult to value.
Redemption Risk—A Portfolio may experience heavy redemptions that could cause the Portfolio to liquidate its assets at inopportune times or at a loss or depressed value, which could cause the value of your investment to decline.
Duration Risk—Duration is the measure that relates the expected price volatility of a fixed-income security to changes in interest rates. The duration of a fixed-income security may be shorter than or equal to full maturity of a fixed-income security. Fixed-income securities with longer durations have more risk and will decrease in price as interest rates rise. For example, a fixed-income security with a duration of three years will decrease in value by approximately 3% if interest rates increase by 1%.
| ALLIANCEBERNSTEIN BOND FUND INTERMEDIATE BOND PORTFOLIO • | 67 |
Notes to Financial Statements
Indemnification Risk—In the ordinary course of business, the Portfolio enters into contracts that contain a variety of indemnifications. The Portfolio’s maximum exposure under these arrangements is unknown. However, the Portfolio has not had prior claims or losses pursuant to these indemnification provisions and expects the risk of loss thereunder to be remote. Therefore, the Portfolio has not accrued any liability in connection with these indemnification provisions.
NOTE G
Joint Credit Facility
A number of open-end mutual funds managed by the Adviser, including the Portfolio, participate in a $280 million revolving credit facility (the “Facility”) intended to provide short-term financing, if necessary, subject to certain restrictions in connection with abnormal redemption activity. Commitment fees related to the Facility are paid by the participating funds and are included in miscellaneous expenses in the statement of operations. The Portfolio did not utilize the Facility during the year ended October 31, 2014.
NOTE H
Distributions to Shareholders
The tax character of distributions paid during the fiscal years ended October 31, 2014 and October 31, 2013 were as follows:
| 2014 | 2013 | |||||||
Distributions paid from: | ||||||||
Ordinary income | $ | 11,395,196 | $ | 13,456,589 | ||||
|
|
|
| |||||
Total taxable distributions paid | $ | 11,395,196 | $ | 13,456,589 | ||||
|
|
|
| |||||
As of October 31, 2014, the components of accumulated earnings/(deficit) on a tax basis were as follows:
Undistributed ordinary income | $ | 2,972,606 | ||
Accumulated capital and other losses | (12,509,250 | )(a) | ||
Unrealized appreciation/(depreciation) | 2,135,116 | (b) | ||
|
| |||
Total accumulated earnings/(deficit) | $ | (7,401,528 | ) | |
|
|
| (a) | On October 31, 2014, the Portfolio had a net capital loss carryforward of $12,484,965. During the fiscal year, the Portfolio utilized $15,587,559 of capital loss carryforwards to offset current year net realized gains. The Portfolio also had $3,832,007 of capital loss carryforwards expire during the fiscal year. As of October 31, 2014, the cumulative deferred loss on straddles was $24,285. |
| (b) | The differences between book-basis and tax-basis unrealized appreciation/(depreciation) are attributable primarily to the tax deferral of losses on wash sales, the difference between book and tax amortization methods for premium, the tax treatment of swaps and Treasury inflation-protected securities, and the realization for tax purposes of gains/losses on certain derivative instruments. |
| (c) | The difference between book-basis and tax-basis components of accumulated earnings/(deficit) is attributable primarily to dividends payable. |
| 68 | • ALLIANCEBERNSTEIN BOND FUND INTERMEDIATE BOND PORTFOLIO |
Notes to Financial Statements
For tax purposes, net capital losses may be carried over to offset future capital gains, if any. Funds are permitted to carry forward capital losses incurred in taxable years beginning after December 22, 2010 for an indefinite period. These post-enactment capital losses must be utilized prior to the pre-enactment capital losses, which are subject to expiration. Post-enactment capital loss carryforwards will retain their character as either short-term or long-term capital losses rather than being considered short-term as under previous regulation. As of October 31, 2014, the Portfolio had a net capital loss carryforward of $12,484,965 which will expire in 2015.
During the current fiscal year, permanent differences primarily due to the tax treatment of swaps, reclassifications of foreign currency and paydown gains/losses, and the expiration of capital loss carryforwards resulted in a net increase in undistributed net investment income, a net decrease in accumulated net realized loss on investment and foreign currency transactions, and a net decrease in additional paid-in capital. These reclassifications had no effect on net assets.
NOTE I
Subsequent Events
Management has evaluated subsequent events for possible recognition or disclosure in the financial statements through the date the financial statements are issued. Management has determined that there are no material events that would require disclosure in the Portfolio’s financial statements through this date.
| ALLIANCEBERNSTEIN BOND FUND INTERMEDIATE BOND PORTFOLIO • | 69 |
Notes to Financial Statements
FINANCIAL HIGHLIGHTS
Selected Data For A Share Of Capital Stock Outstanding Throughout Each Period
| Class A | ||||||||||||||||||||
| Year Ended October 31, | ||||||||||||||||||||
| 2014 | 2013 | 2012 | 2011 | 2010 | ||||||||||||||||
|
|
|
|
|
|
|
|
|
| |||||||||||
Net asset value, beginning of period | $ 11.00 | $ 11.40 | $ 11.04 | $ 10.98 | $ 10.28 | |||||||||||||||
|
| |||||||||||||||||||
Income From Investment Operations | ||||||||||||||||||||
Net investment income(a)(b) | .35 | .26 | .26 | .37 | .42 | |||||||||||||||
Net realized and unrealized gain (loss) on investment and foreign currency transactions | .23 | (.35 | ) | .41 | # | .07 | .70 | |||||||||||||
Contributions from Adviser | – 0 | – | – 0 | – | .01 | # | – 0 | – | – 0 | – | ||||||||||
|
| |||||||||||||||||||
Net increase (decrease) in net asset value from operations | .58 | (.09 | ) | .68 | .44 | 1.12 | ||||||||||||||
|
| |||||||||||||||||||
Less: Dividends | ||||||||||||||||||||
Dividends from net investment income | (.34 | ) | (.31 | ) | (.32 | ) | (.38 | ) | (.42 | ) | ||||||||||
|
| |||||||||||||||||||
Net asset value, end of period | $ 11.24 | $ 11.00 | $ 11.40 | $ 11.04 | $ 10.98 | |||||||||||||||
|
| |||||||||||||||||||
Total Return | ||||||||||||||||||||
Total investment return based on net asset value(c) | 5.34 | %* | (.81 | )%† | 6.27 | %†† | 4.11 | % | 11.17 | %* | ||||||||||
Ratios/Supplemental Data | ||||||||||||||||||||
Net assets, end of period (000’s omitted) | $273,962 | $301,764 | $370,672 | $381,577 | $418,023 | |||||||||||||||
Ratio to average net | ||||||||||||||||||||
Expenses, net of waivers/reimbursements(d) | .90 | % | .89 | % | .85 | % | .85 | % | .91 | %+ | ||||||||||
Expenses, before waivers/reimbursements(d) | 1.06 | % | 1.02 | % | .99 | % | 1.00 | % | 1.11 | %+ | ||||||||||
Net investment income(b) | 3.15 | % | 2.32 | % | 2.29 | % | 3.42 | % | 3.98 | %+ | ||||||||||
Portfolio turnover rate** | 221 | % | 189 | % | 110 | % | 115 | % | 99 | % | ||||||||||
See footnote summary on page 78.
| 70 | • ALLIANCEBERNSTEIN BOND FUND INTERMEDIATE BOND PORTFOLIO |
Financial Highlights
Selected Data For A Share Of Capital Stock Outstanding Throughout Each Period
| Class B | ||||||||||||||||||||
| Year Ended October 31, | ||||||||||||||||||||
| 2014 | 2013 | 2012 | 2011 | 2010 | ||||||||||||||||
|
|
|
|
|
|
|
|
|
| |||||||||||
Net asset value, beginning of period | $ 11.00 | $ 11.41 | $ 11.05 | $ 10.98 | $ 10.28 | |||||||||||||||
|
| |||||||||||||||||||
Income From Investment Operations | ||||||||||||||||||||
Net investment income(a)(b) | .28 | .18 | .18 | .30 | .35 | |||||||||||||||
Net realized and unrealized gain (loss) on investment and foreign currency transactions | .22 | (.36 | ) | .42 | # | .08 | .70 | |||||||||||||
Contributions from Adviser | – 0 | – | – 0 | – | .01 | # | – 0 | – | – 0 | – | ||||||||||
|
| |||||||||||||||||||
Net increase (decrease) in net asset value from operations | .50 | (.18 | ) | .61 | .38 | 1.05 | ||||||||||||||
|
| |||||||||||||||||||
Less: Dividends | ||||||||||||||||||||
Dividends from net investment income | (.26 | ) | (.23 | ) | (.25 | ) | (.31 | ) | (.35 | ) | ||||||||||
|
| |||||||||||||||||||
Net asset value, end of period | $ 11.24 | $ 11.00 | $ 11.41 | $ 11.05 | $ 10.98 | |||||||||||||||
|
| |||||||||||||||||||
Total Return | ||||||||||||||||||||
Total investment return based on net asset value(c) | 4.61 | %* | (1.59 | )%† | 5.56 | %†† | 3.50 | % | 10.40 | %* | ||||||||||
Ratios/Supplemental Data | ||||||||||||||||||||
Net assets, end of period (000’s omitted) | $3,017 | $5,348 | $9,089 | $11,104 | $16,048 | |||||||||||||||
Ratio to average net | ||||||||||||||||||||
Expenses, net of waivers/reimbursements(d) | 1.60 | % | 1.58 | % | 1.55 | % | 1.55 | % | 1.62 | %+ | ||||||||||
Expenses, before waivers/reimbursements(d) | 1.78 | % | 1.74 | % | 1.74 | % | 1.75 | % | 1.88 | %+ | ||||||||||
Net investment income(b) | 2.48 | % | 1.59 | % | 1.59 | % | 2.73 | % | 3.35 | %+ | ||||||||||
Portfolio turnover rate** | 221 | % | 189 | % | 110 | % | 115 | % | 99 | % | ||||||||||
See footnote summary on page 78.
| ALLIANCEBERNSTEIN BOND FUND INTERMEDIATE BOND PORTFOLIO • | 71 |
Financial Highlights
Selected Data For A Share Of Capital Stock Outstanding Throughout Each Period
| Class C | ||||||||||||||||||||
| Year Ended October 31, | ||||||||||||||||||||
| 2014 | 2013 | 2012 | 2011 | 2010 | ||||||||||||||||
|
| |||||||||||||||||||
Net asset value, beginning of period | $ 10.98 | $ 11.38 | $ 11.02 | $ 10.96 | $ 10.26 | |||||||||||||||
|
| |||||||||||||||||||
Income From Investment Operations | ||||||||||||||||||||
Net investment income(a)(b) | .27 | .18 | .18 | .29 | .35 | |||||||||||||||
Net realized and unrealized gain (loss) on investment and foreign currency transactions | .23 | (.35 | ) | .41 | # | .07 | .70 | |||||||||||||
Contributions from Adviser | – 0 | – | – 0 | – | .01 | # | – 0 | – | – 0 | – | ||||||||||
|
| |||||||||||||||||||
Net increase (decrease) in net asset value from operations | .50 | (.17 | ) | .60 | .36 | 1.05 | ||||||||||||||
|
| |||||||||||||||||||
Less: Dividends | ||||||||||||||||||||
Dividends from net investment income | (.26 | ) | (.23 | ) | (.24 | ) | (.30 | ) | (.35 | ) | ||||||||||
|
| |||||||||||||||||||
Net asset value, end of period | $ 11.22 | $ 10.98 | $ 11.38 | $ 11.02 | $ 10.96 | |||||||||||||||
|
| |||||||||||||||||||
Total Return | ||||||||||||||||||||
Total investment return based on net asset value(c) | 4.63 | %* | (1.51 | )%† | 5.55 | %†† | 3.40 | % | 10.42 | %* | ||||||||||
Ratios/Supplemental Data | ||||||||||||||||||||
Net assets, end of period (000’s omitted) | $42,690 | $47,530 | $61,224 | $62,147 | $66,568 | |||||||||||||||
Ratio to average net | ||||||||||||||||||||
Expenses, net of waivers/reimbursements(d) | 1.60 | % | 1.59 | % | 1.55 | % | 1.55 | % | 1.61 | %+ | ||||||||||
Expenses, before waivers/reimbursements(d) | 1.77 | % | 1.73 | % | 1.70 | % | 1.71 | % | 1.83 | %+ | ||||||||||
Net investment income(b) | 2.46 | % | 1.62 | % | 1.60 | % | 2.72 | % | 3.27 | %+ | ||||||||||
Portfolio turnover rate** | 221 | % | 189 | % | 110 | % | 115 | % | 99 | % | ||||||||||
See footnote summary on page 78.
| 72 | • ALLIANCEBERNSTEIN BOND FUND INTERMEDIATE BOND PORTFOLIO |
Financial Highlights
Selected Data For A Share Of Capital Stock Outstanding Throughout Each Period
| Advisor Class | ||||||||||||||||||||
| Year Ended October 31, | ||||||||||||||||||||
| 2014 | 2013 | 2012 | 2011 | 2010 | ||||||||||||||||
|
| |||||||||||||||||||
Net asset value, beginning of period | $ 11.00 | $ 11.41 | $ 11.05 | $ 10.99 | $ 10.28 | |||||||||||||||
|
| |||||||||||||||||||
Income From Investment Operations | ||||||||||||||||||||
Net investment income(a)(b) | .39 | .29 | .29 | .40 | .44 | |||||||||||||||
Net realized and unrealized gain (loss) on investment and foreign currency transactions | .22 | (.36 | ) | .41 | # | .07 | .73 | |||||||||||||
Contributions from Adviser | – 0 | – | – 0 | – | .01 | # | – 0 | – | – 0 | – | ||||||||||
|
| |||||||||||||||||||
Net increase (decrease) in net asset value from operations | .61 | (.07 | ) | .71 | .47 | 1.17 | ||||||||||||||
|
| |||||||||||||||||||
Less: Dividends | ||||||||||||||||||||
Dividends from net investment income | (.37 | ) | (.34 | ) | (.35 | ) | (.41 | ) | (.46 | ) | ||||||||||
|
| |||||||||||||||||||
Net asset value, end of period | $ 11.24 | $ 11.00 | $ 11.41 | $ 11.05 | $ 10.99 | |||||||||||||||
|
| |||||||||||||||||||
Total Return | ||||||||||||||||||||
Total investment return based on net asset value(c) | 5.65 | %* | (.61 | )%† | 6.59 | %†† | 4.43 | % | 11.59 | %* | ||||||||||
Ratios/Supplemental Data | ||||||||||||||||||||
Net assets, end of period (000’s omitted) | $26,352 | $73,445 | $94,584 | $88,402 | $89,981 | |||||||||||||||
Ratio to average net | ||||||||||||||||||||
Expenses, net of waivers/reimbursements(d) | .60 | % | .59 | % | .55 | % | .55 | % | .60 | %+ | ||||||||||
Expenses, before waivers/reimbursements(d) | .75 | % | .72 | % | .69 | % | .70 | % | .80 | %+ | ||||||||||
Net investment income(b) | 3.51 | % | 2.60 | % | 2.59 | % | 3.70 | % | 4.19 | %+ | ||||||||||
Portfolio turnover rate** | 221 | % | 189 | % | 110 | % | 115 | % | 99 | % | ||||||||||
See footnote summary on page 78.
| ALLIANCEBERNSTEIN BOND FUND INTERMEDIATE BOND PORTFOLIO • | 73 |
Financial Highlights
Selected Data For A Share Of Capital Stock Outstanding Throughout Each Period
| Class R | ||||||||||||||||||||
| Year Ended October 31, | ||||||||||||||||||||
| 2014 | 2013 | 2012 | 2011 | 2010 | ||||||||||||||||
|
| |||||||||||||||||||
Net asset value, beginning of period | $ 11.00 | $ 11.40 | $ 11.04 | $ 10.98 | $ 10.28 | |||||||||||||||
|
| |||||||||||||||||||
Income From Investment Operations | ||||||||||||||||||||
Net investment income(a)(b) | .33 | .24 | .23 | .34 | .37 | |||||||||||||||
Net realized and unrealized gain (loss) on investment and foreign currency transactions | .23 | (.36 | ) | .42 | # | .08 | .73 | |||||||||||||
Contributions from Adviser | – 0 | – | – 0 | – | .01 | # | – 0 | – | – 0 | – | ||||||||||
|
| |||||||||||||||||||
Net increase (decrease) in net asset value from operations | .56 | (.12 | ) | .66 | .42 | 1.10 | ||||||||||||||
|
| |||||||||||||||||||
Less: Dividends | ||||||||||||||||||||
Dividends from net investment income | (.32 | ) | (.28 | ) | (.30 | ) | (.36 | ) | (.40 | ) | ||||||||||
|
| |||||||||||||||||||
Net asset value, end of period | $ 11.24 | $ 11.00 | $ 11.40 | $ 11.04 | $ 10.98 | |||||||||||||||
|
| |||||||||||||||||||
Total Return | ||||||||||||||||||||
Total investment return based on net asset value(c) | 5.13 | %* | (1.01 | )%† | 6.05 | %†† | 3.91 | % | 10.94 | %* | ||||||||||
Ratios/Supplemental Data | ||||||||||||||||||||
Net assets, end of period (000’s omitted) | $2,368 | $2,241 | $1,568 | $1,168 | $759 | |||||||||||||||
Ratio to average net | ||||||||||||||||||||
Expenses, net of waivers/reimbursements(d) | 1.10 | % | 1.09 | % | 1.05 | % | 1.05 | % | 1.08 | %+ | ||||||||||
Expenses, before waivers/reimbursements(d) | 1.36 | % | 1.31 | % | 1.29 | % | 1.31 | % | 1.37 | %+ | ||||||||||
Net investment income(b) | 2.94 | % | 2.13 | % | 2.07 | % | 3.16 | % | 3.49 | %+ | ||||||||||
Portfolio turnover rate** | 221 | % | 189 | % | 110 | % | 115 | % | 99 | % | ||||||||||
See footnote summary on page 78.
| 74 | • ALLIANCEBERNSTEIN BOND FUND INTERMEDIATE BOND PORTFOLIO |
Financial Highlights
Selected Data For A Share Of Capital Stock Outstanding Throughout Each Period
| Class K | ||||||||||||||||||||
| Year Ended October 31, | ||||||||||||||||||||
| 2014 | 2013 | 2012 | 2011 | 2010 | ||||||||||||||||
|
|
|
|
|
|
|
|
|
| |||||||||||
Net asset value, beginning | $ 11.01 | $ 11.41 | $ 11.05 | $ 10.99 | $ 10.29 | |||||||||||||||
|
| |||||||||||||||||||
Income From Investment Operations | ||||||||||||||||||||
Net investment income(a)(b) | .35 | .27 | .26 | .38 | .43 | |||||||||||||||
Net realized and unrealized gain (loss) on investment and foreign currency transactions | .22 | (.36 | ) | .42 | # | .07 | .70 | |||||||||||||
Contributions from | – 0 | – | – 0 | – | .01 | # | – 0 | – | – 0 | – | ||||||||||
|
| |||||||||||||||||||
Net increase (decrease) in net asset value from operations | .57 | (.09 | ) | .69 | .45 | 1.13 | ||||||||||||||
|
| |||||||||||||||||||
Less: Dividends | ||||||||||||||||||||
Dividends from net investment income | (.34 | ) | (.31 | ) | (.33 | ) | (.39 | ) | (.43 | ) | ||||||||||
|
| |||||||||||||||||||
Net asset value, end of period | $ 11.24 | $ 11.01 | $ 11.41 | $ 11.05 | $ 10.99 | |||||||||||||||
|
| |||||||||||||||||||
Total Return | ||||||||||||||||||||
Total investment return based on net asset value(c) | 5.30 | %* | (.76 | )%† | 6.32 | %†† | 4.17 | % | 11.21 | %* | ||||||||||
Ratios/Supplemental | ||||||||||||||||||||
Net assets, end of period (000’s omitted) | $4,515 | $3,459 | $3,823 | $2,869 | $4,359 | |||||||||||||||
Ratio to average net | ||||||||||||||||||||
Expenses, net of waivers/reimbursements(d) | .85 | % | .84 | % | .80 | % | .80 | % | .86 | %+ | ||||||||||
Expenses, before | 1.03 | % | .93 | % | .99 | % | 1.01 | % | 1.09 | %+ | ||||||||||
Net investment income(b) | 3.17 | % | 2.38 | % | 2.34 | % | 3.49 | % | 4.02 | %+ | ||||||||||
Portfolio turnover rate** | 221 | % | 189 | % | 110 | % | 115 | % | 99 | % | ||||||||||
See footnote summary on page 78.
| ALLIANCEBERNSTEIN BOND FUND INTERMEDIATE BOND PORTFOLIO • | 75 |
Financial Highlights
Selected Data For A Share Of Capital Stock Outstanding Throughout Each Period
| Class I | ||||||||||||||||||||
| Year Ended October 31, | ||||||||||||||||||||
| 2014 | 2013 | 2012 | 2011 | 2010 | ||||||||||||||||
|
| |||||||||||||||||||
Net asset value, beginning | $ 11.01 | $ 11.42 | $ 11.06 | $ 11.00 | $ 10.29 | |||||||||||||||
|
| |||||||||||||||||||
Income From Investment Operations | ||||||||||||||||||||
Net investment income(a)(b) | .36 | .18 | .29 | .42 | .49 | |||||||||||||||
Net realized and unrealized gain (loss) on investment and foreign currency transactions | .25 | (.25 | ) | .41 | # | .05 | .68 | |||||||||||||
Contributions from | – 0 | – | – 0 | – | .01 | # | – 0 | – | – 0 | – | ||||||||||
|
| |||||||||||||||||||
Net increase (decrease) in | .61 | (.07 | ) | .71 | .47 | 1.17 | ||||||||||||||
|
| |||||||||||||||||||
Less: Dividends | ||||||||||||||||||||
Dividends from net investment income | (.37 | ) | (.34 | ) | (.35 | ) | (.41 | ) | (.46 | ) | ||||||||||
|
| |||||||||||||||||||
Net asset value, end of period | $ 11.25 | $ 11.01 | $ 11.42 | $ 11.06 | $ 11.00 | |||||||||||||||
|
| |||||||||||||||||||
Total Return | ||||||||||||||||||||
Total investment return | 5.65 | %* | (.62 | )%† | 6.58 | %†† | 4.42 | % | 11.59 | %* | ||||||||||
Ratios/Supplemental | ||||||||||||||||||||
Net assets, end of period (000’s omitted) | $107 | $14 | $814 | $715 | $1,348 | |||||||||||||||
Ratio to average net | ||||||||||||||||||||
Expenses, net of waivers/reimbursements(d) | .60 | % | .56 | % | .55 | % | .55 | % | .67 | %+ | ||||||||||
Expenses, before | .75 | % | .67 | % | .66 | % | .68 | % | .81 | %+ | ||||||||||
Net investment | 3.22 | % | 2.46 | % | 2.59 | % | 3.76 | % | 4.60 | %+ | ||||||||||
Portfolio turnover rate** | 221 | % | 189 | % | 110 | % | 115 | % | 99 | % | ||||||||||
See footnote summary on page 78.
| 76 | • ALLIANCEBERNSTEIN BOND FUND INTERMEDIATE BOND PORTFOLIO |
Financial Highlights
Selected Data For A Share Of Capital Stock Outstanding Throughout Each Period
| Class Z | ||||
| April 28, 2014(e) to October 31, 2014 | ||||
Net asset value, beginning of period | $ 11.15 | |||
|
| |||
Income From Investment Operations | ||||
Net investment income(a)(b) | .19 | |||
Net realized and unrealized gain on investment and foreign currency transactions | .10 | |||
|
| |||
Net increase in net asset value from operations | .29 | |||
|
| |||
Less: Dividends | ||||
Dividends from net investment income | (.18 | ) | ||
|
| |||
Net asset value, end of period | $ 11.26 | |||
|
| |||
Total Return | ||||
Total investment return based on net asset value(c) | 2.61 | % | ||
Ratios/Supplemental Data | ||||
Net assets, end of period (000’s omitted) | $10 | |||
Ratio to average net assets of: | ||||
Expenses, net of waivers/reimbursements(d)^ | .60 | % | ||
Expenses, before waivers/reimbursements(d)^ | .66 | % | ||
Net investment income(b)^ | 3.29 | % | ||
Portfolio turnover rate** | 221 | % | ||
See footnote summary on page 78.
| ALLIANCEBERNSTEIN BOND FUND INTERMEDIATE BOND PORTFOLIO • | 77 |
Financial Highlights
| (a) | Based on average shares outstanding. |
| (b) | Net of fees waived and expenses reimbursed by the Adviser. |
| (c) | Total investment return is calculated assuming an initial investment made at the net asset value at the beginning of the period, reinvestment of all dividends and distributions at net asset value during the period, and redemption on the last day of the period. Initial sales charges or contingent deferred sales charges are not reflected in the calculation of total investment return. Total return does not reflect the deduction of taxes that a shareholder would pay on portfolio distributions or the redemption of portfolio shares. Total investment return calculated for a period of less than one year is not annualized. |
| (d) | The expense ratios presented below exclude interest expense and TALF administration fees, where applicable: |
| Year Ended October 31, | ||||||||||||||||||||
| 2014 | 2013 | 2012 | 2011 | 2010 | ||||||||||||||||
|
|
|
|
|
|
|
|
|
| |||||||||||
Class A | ||||||||||||||||||||
Net of waivers/reimbursements | .90 | % | .89 | % | .85 | % | .85 | % | .85 | % | ||||||||||
Before waivers/reimbursements | 1.06 | % | 1.02 | % | .99 | % | 1.00 | % | 1.05 | % | ||||||||||
Class B | ||||||||||||||||||||
Net of waivers/reimbursements | 1.60 | % | 1.58 | % | 1.55 | % | 1.55 | % | 1.55 | % | ||||||||||
Before waivers/reimbursements | 1.78 | % | 1.74 | % | 1.74 | % | 1.75 | % | 1.81 | % | ||||||||||
Class C | ||||||||||||||||||||
Net of waivers/reimbursements | 1.60 | % | 1.59 | % | 1.55 | % | 1.55 | % | 1.55 | % | ||||||||||
Before waivers/reimbursements | 1.77 | % | 1.73 | % | 1.70 | % | 1.71 | % | 1.77 | % | ||||||||||
Advisor Class | ||||||||||||||||||||
Net of waivers/reimbursements | .60 | % | .59 | % | .55 | % | .55 | % | .55 | % | ||||||||||
Before waivers/reimbursements | .75 | % | .72 | % | .69 | % | .70 | % | .75 | % | ||||||||||
Class R | ||||||||||||||||||||
Net of waivers/reimbursements | 1.10 | % | 1.09 | % | 1.05 | % | 1.05 | % | 1.05 | % | ||||||||||
Before waivers/reimbursements | 1.36 | % | 1.31 | % | 1.29 | % | 1.31 | % | 1.34 | % | ||||||||||
Class K | ||||||||||||||||||||
Net of waivers/reimbursements | .85 | % | .84 | % | .80 | % | .80 | % | .80 | % | ||||||||||
Before waivers/reimbursements | 1.03 | % | .93 | % | .99 | % | 1.01 | % | 1.03 | % | ||||||||||
Class I | ||||||||||||||||||||
Net of waivers/reimbursements | .60 | % | .56 | % | .55 | % | .55 | % | .55 | % | ||||||||||
Before waivers/reimbursements | .75 | % | .67 | % | .66 | % | .68 | % | .69 | % | ||||||||||
Class Z | ||||||||||||||||||||
Net of waivers/reimbursements | .60 | %(f)^ | ||||||||||||||||||
Before waivers/reimbursements | .66 | %(f)^ | ||||||||||||||||||
| (e) | Commencement of distributions. |
| (f) | For the period April 28, 2014, commencement of operations, to October 31, 2014. |
| # | Amount reclassified from realized gain (loss) on investment transactions. |
| * | Includes the impact of proceeds received and credited to the Portfolio resulting from class action settlements, which enhanced the Portfolio’s performance for the years ended October 31, 2014 and October 31, 2010 by 0.01% and 0.01%, respectively. |
| † | Includes the impact of proceeds received and credited to the Portfolio resulting from third party regulatory settlements, which enhanced the Portfolio’s performance for the year ended October 31, 2013 by 0.14%. |
| †† | Includes the Adviser’s reimbursement in respect of the Lehman Bankruptcy Claim which contributed to the Portfolio’s performance by 0.07% for the year ended October 31, 2012, (see note B). |
| ^ | Annualized. |
| + | The ratio includes expenses attributable to costs of proxy solicitation. |
| ** | The Portfolio accounts for dollar roll transactions as purchases and sales. |
See notes to financial statements.
| 78 | • ALLIANCEBERNSTEIN BOND FUND INTERMEDIATE BOND PORTFOLIO |
Financial Highlights
REPORT OF INDEPENDENT REGISTERED PUBLIC ACCOUNTING FIRM
To the Board of Directors of AllianceBernstein Bond Fund, Inc. and the Shareholders of AllianceBernstein Intermediate Bond Portfolio
We have audited the accompanying statement of assets and liabilities, including the portfolio of investments, of the AllianceBernstein Intermediate Bond Portfolio (one of the portfolios constituting the AllianceBernstein Bond Fund, Inc. (“the “Fund”)), as of October 31, 2014, and the related statement of operations for the year then ended, the statements of changes in net assets for each of the two years in the period then ended, and the financial highlights for each of the periods indicated therein. These financial statements and financial highlights are the responsibility of the Fund’s management. Our responsibility is to express an opinion on these financial statements and financial highlights based on our audits.
We conducted our audits in accordance with the standards of the Public Company Accounting Oversight Board (United States). Those standards require that we plan and perform the audit to obtain reasonable assurance about whether the financial statements and financial highlights are free of material misstatement. We were not engaged to perform an audit of the Fund’s internal control over financial reporting. Our audits included consideration of internal control over financial reporting as a basis for designing audit procedures that are appropriate in the circumstances, but not for the purpose of expressing an opinion on the effectiveness of the Fund’s internal control over financial reporting. Accordingly, we express no such opinion. An audit also includes examining, on a test basis, evidence supporting the amounts and disclosures in the financial statements and financial highlights, assessing the accounting principles used and significant estimates made by management, and evaluating the overall financial statement presentation. Our procedures included confirmation of securities owned as of October 31, 2014, by correspondence with the custodian and others, or by other appropriate auditing procedures where replies from others were not received. We believe that our audits provide a reasonable basis for our opinion.
In our opinion, the financial statements and financial highlights referred to above present fairly, in all material respects, the financial position of the AllianceBernstein Intermediate Bond Portfolio (one of the portfolios constituting the AllianceBernstein Bond Fund, Inc.) at October 31, 2014, the results of its operations for the year then ended, the changes in its net assets for each of the two years in the period then ended, and the financial highlights for each of the periods indicated therein in conformity with U.S. generally accepted accounting principles.

New York, New York
December 26, 2014
| ALLIANCEBERNSTEIN BOND FUND INTERMEDIATE BOND PORTFOLIO • | 79 |
Report of Independent Registered Public Accounting Firm
2014 FEDERAL TAX INFORMATION
(unaudited)
For Federal income tax purposes, the following information is furnished with respect to the distributions paid by the Portfolio during the taxable year ended October 31, 2014.
For foreign shareholders, 57.60% of ordinary income dividends paid may be considered to be qualifying to be taxed as interest-related dividends.
Shareholders should not use the above information to prepare their income tax returns. The information necessary to complete your income tax returns will be included with your Form 1099-DIV which will be sent to you separately in January 2015.
| 80 | • ALLIANCEBERNSTEIN BOND FUND INTERMEDIATE BOND PORTFOLIO |
BOARD OF DIRECTORS
Marshall C. Turner, Jr.(1), Chairman John H. Dobkin(1) Michael J. Downey(1) William H. Foulk, Jr.(1) D. James Guzy(1) | Nancy P. Jacklin(1) Robert M. Keith, President and Chief Executive Officer Garry L. Moody(1) Earl D. Weiner(1) |
OFFICERS
Philip L. Kirstein, Senior Vice President and Independent Compliance Officer Paul J. DeNoon(2), Vice President Shawn E. Keegan(2) , Vice President Alison M. Martier(2) , Vice President Douglas J. Peebles(2), Vice President | Greg J. Wilensky(2), Vice President Emilie D. Wrapp, Secretary Joseph J. Mantineo, Treasurer and Chief Financial Officer Phyllis J. Clarke, Controller Vincent S. Noto, Chief Compliance Officer |
Custodian and Accounting Agent State Street Bank and Trust Company State Street Corporation CCB/5 1 Iron Street Boston, MA 02210
Principal Underwriter AllianceBernstein Investments, Inc. 1345 Avenue of the Americas New York, NY 10105
Transfer Agent AllianceBernstein Investor Services, Inc. P.O. Box 786003 San Antonio, TX 78278-6003 Toll-Free (800) 221-5672 | Independent Registered Public Ernst & Young LLP 5 Times Square New York, NY 10036
Legal Counsel Seward & Kissel LLP One Battery Park Plaza New York, NY 10004 |
| (1) | Member of the Audit Committee, the Governance and Nominating Committee, and the Independent Directors Committee. |
| (2) | The day-to-day management of, and investment decisions for, the Fund’s portfolio are made by the Adviser’s U.S. Investment Grade Core Fixed Income Investment Team. Mr. Paul J. DeNoon, Mr. Shawn E. Keegan, Ms. Alison M. Martier, Mr. Douglas J. Peebles and Mr. Greg J. Wilensky are the investment professionals with the most significant responsibility for the day-to-day management of the Fund’s portfolio. |
| ALLIANCEBERNSTEIN BOND FUND INTERMEDIATE BOND PORTFOLIO • | 81 |
Board of Directors
MANAGEMENT OF THE FUND
Board of Directors Information
The business and affairs of the Fund are managed under the direction of the Board of Directors. Certain information concerning the Fund’s Directors is set forth below.
NAME, ADDRESS* AND AGE (YEAR FIRST ELECTED**) | PRINCIPAL DURING PAST FIVE YEARS | PORTFOLIOS IN FUND COMPLEX OVERSEEN BY DIRECTOR | OTHER DIRECTORSHIPS HELD BY DIRECTOR IN THE PAST FIVE YEARS | |||||
| INTERESTED DIRECTOR | ||||||||
Robert M. Keith, + 1345 Avenue of the Americas New York, NY 10105 54 (2010) | Senior Vice President of AllianceBernstein L.P. (the “Adviser”) and head of AllianceBernstein Investments, Inc. (“ABI”) since July 2008; Director of ABI and President of the AllianceBernstein Mutual Funds. Previously, he served as Executive Managing Director of ABI from December 2006 to June 2008. Prior to joining ABI in 2006, Executive Managing Director of Bernstein Global Wealth Management, and prior thereto, Senior Managing Director and Global Head of Client Service and Sales of the Adviser’s institutional investment management business since 2004. Prior thereto, he was Managing Director and Head of North American Client Service and Sales in the Adviser’s institutional investment management business, with which he had been associated since prior to 2004. | 117 | None | |||||
| 82 | • ALLIANCEBERNSTEIN BOND FUND INTERMEDIATE BOND PORTFOLIO |
Management of the Fund
| NAME, ADDRESS*, AGE, (YEAR FIRST ELECTED**) | PRINCIPAL OCCUPATION(S) DURING PAST FIVE YEARS AND OTHER RELEVANT QUALIFICATIONS*** | PORTFOLIOS IN FUND COMPLEX OVERSEEN BY DIRECTOR | OTHER DIRECTORSHIP HELD BY DIRECTOR IN THE PAST FIVE YEARS | |||||
| DISINTERESTED DIRECTORS | ||||||||
Marshall C. Turner, Jr., # Chairman of the Board 73 (2005) | Private Investor since prior to 2009. Former CEO of Dupont Photomasks, Inc. (components of semi-conductor manufacturing), 2003-2006, and interim CEO 1999-2000. He has extensive operating and early-stage investment experience, including prior service as general partner of three institutional venture capital partnerships, and serves on the boards of three education and science-related non-profit organizations. He has served as a director of one AllianceBernstein fund since 1992, and director or trustee of multiple AllianceBernstein funds since 2005. He has been Chairman of the AllianceBernstein Funds since January 2014, and the Chairman of the Independent Directors Committees of such Funds since February 2014. | 117 | Xilinx, Inc. (programmable logic semi-conductors) and SunEdison, Inc. (semi-conductor substrates, solar materials and solar power plants) since prior to 2009 until July 2014 | |||||
John H. Dobkin, # 72 (1998) | Independent Consultant since prior to 2009. Formerly, President of Save Venice, Inc. (preservation organization) from 2001-2002; Senior Advisor from June 1999-June 2000 and President of Historic Hudson Valley (historic preservation) from December 1989-May 1999. Previously, Director of the National Academy of Design. He has served as a director or trustee of various AllianceBernstein Funds since 1992, and as Chairman of the Audit Committees of a number of such Funds from 2001-2008. | 117 | None | |||||
| ALLIANCEBERNSTEIN BOND FUND INTERMEDIATE BOND PORTFOLIO • | 83 |
Management of the Fund
| NAME, ADDRESS*, AGE, (YEAR FIRST ELECTED**) | PRINCIPAL OCCUPATION(S) DURING PAST FIVE YEARS AND OTHER RELEVANT QUALIFICATIONS*** | PORTFOLIOS IN FUND COMPLEX OVERSEEN BY DIRECTOR | OTHER DIRECTORSHIP HELD BY DIRECTOR IN THE PAST FIVE YEARS | |||||
| DISINTERESTED DIRECTORS (continued) | ||||||||
Michael J. Downey, # 70 (2005) | Private Investor since prior to 2009. Formerly, managing partner of Lexington Capital, LLC (investment advisory firm) from December 1997 until December 2003. From 1987 until 1993, Chairman and CEO of Prudential Mutual Fund Management, director of the Prudential mutual funds, and member of the Executive Committee of Prudential Securities Inc. He has served as a director or trustee of the AllianceBernstein Funds since 2005 and is a director and Chairman of one other registered investment company. | 117 | Asia Pacific Fund, Inc. (registered investment company) since prior to 2009, Prospect Acquisition Corp. (financial services) from 2007 until 2009, and The Merger Fund (registered investment company) since prior to 2009 until 2013 | |||||
William H. Foulk, Jr., # 82 (1998) | Investment Adviser and an Independent Consultant since prior to 2009. Previously, he was Senior Manager of Barrett Associates, Inc., a registered investment adviser. He was formerly Deputy Comptroller and Chief Investment Officer of the State of New York and, prior thereto, Chief Investment Officer of the New York Bank for Savings. He has served as a director or trustee of various AllianceBernstein Funds since 1983, and was Chairman of the Independent Directors Committees of the AllianceBernstein Funds from 2003 until early February 2014. He served as Chairman of such Funds from 2003 through December 2013. He is also active in a number of mutual fund related organizations and committees. | 117 | None | |||||
| 84 | • ALLIANCEBERNSTEIN BOND FUND INTERMEDIATE BOND PORTFOLIO |
Management of the Fund
| NAME, ADDRESS*, AGE, (YEAR FIRST ELECTED**) | PRINCIPAL OCCUPATION(S) DURING PAST FIVE YEARS AND OTHER RELEVANT QUALIFICATIONS*** | PORTFOLIOS IN FUND COMPLEX OVERSEEN BY DIRECTOR | OTHER DIRECTORSHIP HELD BY DIRECTOR IN THE PAST FIVE YEARS | |||||
| DISINTERESTED DIRECTORS (continued) | ||||||||
D. James Guzy, # 78 (2005) | Chairman of the Board of SRC Computers, Inc. (semi-conductors), with which he has been associated since prior to 2009. He served as Chairman of the Board of PLX Technology (semi-conductors) since prior to 2009 until November 2013. He was a director of Intel Corporation (semi-conductors) from 1969 until 2008, and served as Chairman of the Finance Committee of such company for several years until May 2008. He has served as a director or trustee of one or more of the AllianceBernstein Funds since 1982. | 117 | PLX Technology (semi-conductors) since prior to 2009 until November 2013, and Cirrus Logic Corporation (semi-conductors) since prior to 2009 until July 2011 | |||||
Nancy P. Jacklin, # 66 (2006) | Professorial Lecturer at the Johns Hopkins School of Advanced International Studies since 2008. Formerly, U.S. Executive Director of the International Monetary Fund (which is responsible for ensuring the stability of the international monetary system), (December 2002-May 2006); Partner, Clifford Chance (1992-2002); Sector Counsel, International Banking and Finance, and Associate General Counsel, Citicorp (1985-1992); Assistant General Counsel (International), Federal Reserve Board of Governors (1982-1985); and Attorney Advisor, U.S. Department of the Treasury (1973-1982). Member of the Bar of the District of Columbia and of New York; and member of the Council on Foreign Relations. She has served as a director or trustee of the AllianceBernstein Funds since 2006 and has been Chairman of the Governance and Nominating Committees of the Funds since August 2014. | 117 | None | |||||
| ALLIANCEBERNSTEIN BOND FUND INTERMEDIATE BOND PORTFOLIO • | 85 |
Management of the Fund
| NAME, ADDRESS*, AGE, (YEAR FIRST ELECTED**) | PRINCIPAL OCCUPATION(S) DURING PAST FIVE YEARS AND OTHER RELEVANT QUALIFICATIONS*** | PORTFOLIOS IN FUND COMPLEX OVERSEEN BY DIRECTOR | OTHER DIRECTORSHIP HELD BY DIRECTOR IN THE PAST FIVE YEARS | |||||
| DISINTERESTED DIRECTORS (continued) | ||||||||
Garry L. Moody, # 62 (2008) | Independent Consultant. Formerly, Partner, Deloitte & Touche LLP (1995-2008) where he held a number of senior positions, including Vice Chairman, and U.S. and Global Investment Management Practice Managing Partner; President, Fidelity Accounting and Custody Services Company (1993-1995); and Partner, Ernst & Young LLP (1975-1993), where he served as the National Director of Mutual Fund Tax Services and Managing Partner of its Chicago Office Tax department. He is a member of both the Governing Council of the Independent Directors Council (IDC), an organization of independent directors of mutual funds, and the Trustee Advisory Board of BoardIQ, a biweekly publication focused on issues and news affecting directors of mutual funds. He has served as a director or trustee, and as Chairman of the Audit Committees, of the AllianceBernstein Funds since 2008. | 117 | None | |||||
| 86 | • ALLIANCEBERNSTEIN BOND FUND INTERMEDIATE BOND PORTFOLIO |
Management of the Fund
| NAME, ADDRESS*, AGE, (YEAR FIRST ELECTED**) | PRINCIPAL OCCUPATION(S) DURING PAST FIVE YEARS AND OTHER RELEVANT QUALIFICATIONS*** | PORTFOLIOS IN FUND COMPLEX OVERSEEN BY DIRECTOR | OTHER DIRECTORSHIP HELD BY DIRECTOR IN THE PAST FIVE YEARS | |||||
| DISINTERESTED DIRECTORS (continued) | ||||||||
Earl D. Weiner, # 75 (2007) | Of Counsel, and Partner prior to January 2007, of the law firm Sullivan & Cromwell LLP and is a former member of the ABA Federal Regulation of Securities Committee Task Force to draft editions of the Fund Director’s Guidebook. He also serves as a director or trustee of various non-profit organizations and has served as Chairman or Vice Chairman of a number of them. He has served as a director or trustee of the AllianceBernstein Funds since 2007 and served as Chairman of the Governance and Nominating Committees of the AllianceBernstein Funds from 2007 until August 2014. | 117 | None | |||||
| * | The address for each of the Fund’s disinterested Directors is c/o AllianceBernstein L.P., Attention: Philip L. Kirstein, 1345 Avenue of the Americas, New York, NY 10105. |
| ** | There is no stated term of office for the Fund’s Directors. |
| *** | The information above includes each Director’s principal occupation during the last five years and other information relating to the experience, attributes and skills relevant to each Director’s qualifications to serve as a Director, which led to the conclusion that each Director should serve as a Director for the Fund. |
| + | Mr. Keith is an “interested person” of the Fund as defined in the “40 Act”, due to his position as a Senior Vice President of the Adviser. |
| # | Member of the Audit Committee, the Governance and Nominating Committee and the Independent Directors Committee. |
| ALLIANCEBERNSTEIN BOND FUND INTERMEDIATE BOND PORTFOLIO • | 87 |
Management of the Fund
Officer Information
Certain information concerning the Fund’s Officers is set forth below.
| NAME, ADDRESS* AND AGE | PRINCIPAL POSITION(S) HELD WITH FUND | PRINCIPAL OCCUPATION DURING PAST 5 YEARS | ||
Robert M. Keith 54 | President and Chief Executive Officer | See biography above. | ||
Philip L. Kirstein | Senior Vice President and Independent Compliance Officer | Senior Vice President and Independent Compliance Officer of the AllianceBernstein Funds, with which he has been associated since October 2004. Prior thereto, he was Of Counsel to Kirkpatrick & Lockhart, LLP from October 2003 to October 2004, and General Counsel of Merrill Lynch Investment Managers, L.P. since prior to March 2003. | ||
| Paul J. DeNoon 52 | Vice President | Senior Vice President of the Adviser**, with which he has been associated since prior to 2009. | ||
| Shawn E. Keegan 43 | Vice President | Vice President of the Adviser**, with which he has been associated since prior to 2009. | ||
| Alison M. Martier 57 | Vice President | Senior Vice President of the Adviser**, with which she has been associated since prior to 2009. | ||
| Douglas J. Peebles 49 | Vice President | Senior Vice President of the Adviser**, with which he has been associated since prior to 2009. | ||
| Greg J. Wilensky 47 | Vice President | Senior Vice President of the Adviser**, with which he has been associated since prior to 2009. | ||
| Emilie D. Wrapp 58 | Secretary | Senior Vice President, Assistant General Counsel and Assistant Secretary of ABI**, with which she has been associated since prior to 2009. | ||
| Joseph J. Mantineo 55 | Treasurer and Chief Financial Officer | Senior Vice President of AllianceBernstein Investor Services, Inc. (“ABIS”)**, with which he has been associated since prior to 2009. | ||
| Phyllis J. Clarke 53 | Controller | Vice President of ABIS**, with which she has been associated since prior to 2009. | ||
Vincent S. Noto 50 | Chief Compliance Officer | Vice President and Mutual Fund Chief Compliance Officer of the Adviser ** since 2014. Prior thereto, he was Vice President and Director of Mutual Fund Compliance of the Adviser** since 2009. |
| * | The address for each of the Fund’s Officers is 1345 Avenue of the Americas, New York, NY 10105. |
| ** | The Adviser, ABI and ABIS are affiliates of the Fund. |
| The Fund’s Statement of Additional Information (“SAI”) has additional information about the Fund’s Directors and Officers and is available without charge upon request. Contact your financial representative or AllianceBernstein at 1-800-227-4618, or visit www.alliancebernstein.com, for a free prospectus or SAI. |
| 88 | • ALLIANCEBERNSTEIN BOND FUND INTERMEDIATE BOND PORTFOLIO |
Management of the Fund
THE FOLLOWING IS NOT PART OF THE SHAREHOLDER REPORT OR THE FINANCIAL STATEMENTS
SUMMARY OF SENIOR OFFICER’S EVALUATION OF INVESTMENT ADVISORY AGREEMENT1
The following is a summary of the evaluation of the Investment Advisory Agreement between AllianceBernstein L.P. (the “Adviser”) and AllianceBernstein Bond Fund, Inc. (the “Fund”) with respect to AllianceBernstein Intermediate Bond Portfolio (the “Portfolio”).2 The evaluation of the Investment Advisory Agreement was prepared by Philip L. Kirstein, the Senior Officer of the Fund, for the Directors of the Fund, as required by the September 1, 2004 Assurance of Discontinuance (“AoD”) between the Adviser and the New York State Attorney General (the “NYAG”). The Senior Officer’s evaluation of the Investment Advisory Agreement is not meant to diminish the responsibility or authority of the Board of Directors of the Fund to perform its duties pursuant to Section 15 of the Investment Company Act of 1940 (the “40 Act”) and applicable state law. The purpose of this summary is to provide shareholders with a synopsis of the independent evaluation of the reasonableness of the advisory fees proposed to be paid by the Portfolio which was provided to the Directors in connection with their review of the proposed approval of the continuance of the Investment Advisory Agreement. The Senior Officer’s evaluation considered the following factors:
| 1. | Advisory fees charged to institutional and other clients of the Adviser for like services; |
| 2. | Advisory fees charged by other mutual fund companies for like services; |
| 3. | Costs to the Adviser and its affiliates of supplying services pursuant to the advisory agreement, excluding any intra-corporate profit; |
| 4. | Profit margins of the Adviser and its affiliates from supplying such services; |
| 5. | Possible economies of scale as the Portfolio grows larger; and |
| 6. | Nature and quality of the Adviser’s services including the performance of the Portfolio. |
These factors, with the exception of the first factor, are generally referred to as the “Gartenberg factors,” which were articulated by the United States Court of Appeals for the Second Circuit in 1982. Gartenberg v. Merrill Lynch Asset Management, Inc., 694 F. 2d 923 (2d Cir. 1982). On March 30, 2010, the Supreme Court held the Gartenberg decision was correct in its basic formulation of what
| 1 | The Senior Officer’s fee evaluation was completed on October 23, 2014 and discussed with the Board of Directors on November 4-6, 2014. |
| 2 | Future references to the Portfolio do not include “AllianceBernstein.” References in the fee summary pertaining to performance and expense ratios refer to the Class A shares of the Portfolio. |
| ALLIANCEBERNSTEIN BOND FUND INTERMEDIATE BOND PORTFOLIO • | 89 |
Section 36(b) requires: to face liability under Section 36(b), “an investment adviser must charge a fee that is so disproportionately large that it bears no reasonable relationship to the services rendered and could not have been the product of arm’s length bargaining.” Jones v. Harris Associates L.P., 130 S. Ct. 1418 (2010). In Jones, the Court stated the Gartenberg approach fully incorporates the correct understanding of fiduciary duty within the context of Section 36(b) and noted with approval that “Gartenberg insists that all relevant circumstances be taken into account” and “uses the range of fees that might result from arm’s length bargaining as the benchmark for reviewing challenged fees.”3
INVESTMENT ADVISORY FEES, NET ASSETS, EXPENSE CAPS & RATIOS
The Adviser proposed that the Portfolio pays the advisory fee set forth in the table below for receiving the services to be provided pursuant to the Investment Advisory Agreement. The fee schedule below, implemented in January 2004 in connection with the Adviser’s settlement with the NYAG in December 2003, is based on a master schedule that contemplates eight categories of funds with almost all funds in each category having the same advisory fee schedule.4
| Portfolio | Category | Advisory Fee Based on % of Average Daily Net Assets | Net Assets 09/30/14 ($MM) | |||||
| Intermediate Bond Portfolio | Low Risk Income | 0.45% on 1st $2.5 billion 0.40% on next $2.5 billion 0.35% on the balance | $ | 337.4 | ||||
The Adviser is reimbursed as specified in the Investment Advisory Agreement for certain clerical, legal, accounting, administrative and other services provided to the Portfolio. During the Portfolio’s fiscal year ended October 31, 2013, the Adviser received $45,372 (0.009% of the Portfolio’s average daily net assets) for such services.
The Adviser agreed to waive that portion of its advisory fees and/or reimburse the Portfolio for that portion of the Portfolio’s total operating expenses to the degree necessary to limit the Portfolio’s expense ratios to the amounts set forth below for the Portfolio’s current fiscal year. The waiver is terminable by the Adviser upon at least 60 days’ notice prior to the Portfolio’s prospectus update.
| 3 | Jones v. Harris at 1427. |
| 4 | Most of the AllianceBernstein Mutual Funds, which the Adviser manages, were affected by the Adviser’s settlement with the NYAG. |
| 90 | • ALLIANCEBERNSTEIN BOND FUND INTERMEDIATE BOND PORTFOLIO |
In addition, set forth below are the Portfolio’s gross expense ratios for the most recent semi-annual period:5
| Portfolio | Expense Cap Pursuant to Expense Limitation Undertaking | Gross Expense Ratio6 | Fiscal Year End | |||||||||
| Intermediate Bond Portfolio | Advisor Class A Class B Class C Class R Class K Class I Class Z |
| 0.60 0.90 1.60 1.60 1.10 0.85 0.60 0.60 | % % % % % % % % |
| 0.75 1.07 1.79 1.78 1.33 0.97 0.71 0.75 | % % % % % % % % | Oct. 31 (ratios as of Apr.30, 2014) | ||||
| I. | ADVISORY FEES CHARGED TO INSTITUTIONAL AND OTHER CLIENTS |
The advisory fees charged to investment companies which the Adviser manages and sponsors are normally higher than those charged to similar sized institutional accounts, including pension plans and sub-advised investment companies. The fee differential reflects, among other things, different services provided to such clients, and different liabilities assumed. Services provided by the Adviser to the Portfolio that are not provided to non-investment company clients include providing office space and personnel to serve as Fund Officers, who among other responsibilities make the certifications required under the Sarbanes–Oxley Act of 2002, and coordinating with and monitoring the Portfolio’s third party service providers such as Fund counsel, auditors, custodians, transfer agents and pricing services. The accounting, administrative, legal and compliance requirements for the Portfolio are more costly than those for institutional client assets due to the greater complexities and time required for investment companies, although as previously noted, the Adviser is reimbursed for providing such services. Also, retail mutual funds managed by the Adviser are widely held and accordingly, servicing the Portfolio’s investors is more time consuming and labor intensive compared to servicing institutional clients since the Adviser needs to communicate with a more extensive network of financial intermediaries and shareholders. The Adviser also believes that it incurs substantial entrepreneurial risk when offering a new mutual fund since establishing a new mutual fund requires a large upfront investment and it may take a long time for the fund to achieve profitability since the fund must be priced to scale from inception in order to be competitive and assets are acquired one account at a time. In addition, managing the cash flow of an investment company may be more difficult than that of a stable pool of assets, such as an institutional account with little cash movement in either direction, particularly if the Portfolio is in net redemption and the Adviser is frequently forced to sell securities to raise cash for redemptions. However, managing a fund with positive cash flow may be easier at times than managing a stable pool of assets. Finally, in recent years, investment advisers have been sued by institutional clients and have suffered reputational damage both by the attendant publicity and outcomes other than complete victories. Accordingly, the legal and reputational risks associated with institutional accounts are greater than previously thought, although arguably still not equal to those related to the mutual fund industry.
| 5 | Semi-annual total expense ratios are unaudited. |
| 6 | Annualized. |
| ALLIANCEBERNSTEIN BOND FUND INTERMEDIATE BOND PORTFOLIO • | 91 |
Notwithstanding the Adviser’s view that managing an investment company is not comparable to managing other institutional accounts because the services provided are different, the Supreme Court has indicated consideration should be given to the advisory fees charged to institutional accounts with a similar investment style as the Portfolio.7 In addition to the AllianceBernstein Institutional fee schedule, set forth below is what would have been the effective advisory fee for the Portfolio had the AllianceBernstein Institutional fee schedule been applicable to the Portfolio based on September 30, 2014 net assets.8
| Portfolio | Net Assets 9/30/14 ($MM) | AllianceBernstein (“AB”) Fee Schedule | Effective AB Inst. Adv. Fee | Portfolio Advisory Fee | ||||||
| Intermediate Bond Portfolio | $337.4 | U.S. Strategic Core Plus Schedule 0.50% on 1st $30 million 0.20% on the balance Minimum account size: $25 m | 0.227% | 0.450% | ||||||
The Adviser manages Sanford C. Bernstein Fund, Inc. (“SCB Fund”), an open-end management investment company. The Intermediate Duration Portfolio of SCB Fund has a similar investment style as the Portfolio. Set forth below is Intermediate Duration Portfolio’s advisory fee schedule and what would have been the effective advisory fee of the Portfolio had the fee schedule of Intermediate Duration Portfolio been applicable to the Portfolio based on September 30, 2014 net assets:
| Portfolio | SCB Fund Portfolio | Fee Schedule | SCB Fund Effective Fee | Portfolio Advisory Fee | ||||||
| Intermediate Bond Portfolio | Intermediate Duration Portfolio | 0.50% on 1st $1 billion 0.45% on next $ 2 billion 0.40% on next $ 2 billion 0.35% on next $ 2 billion 0.30% thereafter | 0.500% | 0.450% | ||||||
The adviser also manages the AllianceBernstein Variable Products Series Fund, Inc. (“AVPS”), which is available through variable annuity and variable life contracts offered by other financial institutions and offers policyholders the option to utilize certain AVPS portfolios as the investment option underlying their insurance contracts. Set forth below is the fee schedule of the AVPS portfolio
| 7 | The Supreme Court stated that “courts may give such comparisons the weight that they merit in light of the similarities and differences between the services that the clients in question require, but the courts must be wary of inapt comparisons.” Among the significant differences the Supreme Court noted that may exist between services provided to mutual funds and institutional accounts are “higher marketing costs.” Jones v. Harris at 1428. |
| 8 | The Adviser has indicated that with respect to institutional accounts with assets greater than $300 million, it will negotiate a fee schedule. Discounts that are negotiated vary based upon each client relationship. |
| 92 | • ALLIANCEBERNSTEIN BOND FUND INTERMEDIATE BOND PORTFOLIO |
that has a substantially similar investment style as the Portfolio.9 Also shown are what would have been the effective advisory fee of the Portfolio had the AVPS fee schedule been applicable to the Portfolio and the Portfolio’s advisory fees based on September 30, 2014 net assets:
| Portfolio | AVPS Portfolio | Fee Schedule | AVPS Effective Fee | Portfolio Advisory Fee | ||||||
| Intermediate Bond Fund | Intermediate Bond Portfolio | 0.45% on first $2.5 billion 0.40% on next $2.5 billion 0.35% on the balance | 0.450% | 0.450% | ||||||
The Adviser provides sub-advisory investment services to certain other investment companies managed by other fund families. The Adviser charges the following fee for the sub-advisory relationship that has a somewhat similar investment style as the Portfolio. Also shown are the Portfolio’s advisory fee and what would have been the effective advisory fee of the Portfolio had the fee schedule of the sub-advisory relationship been applicable to the Portfolio based on September 30, 2014 net assets:
| Portfolio | Sub-advised Fund | Sub-advised Fund Fee Schedule | Sub-Advised Management Fund Effective Fee | Portfolio Advisory Fee | ||||||||
| Intermediate Bond Portfolio | Client #110 | 0.29% on first $100 million 0.20% thereafter | 0.227% | 0.450% | ||||||||
It is fair to note that the services the Adviser provides pursuant to sub-advisory agreements are generally confined to the services related to the investment process; in other words, they are not as comprehensive as the services provided to the Portfolio by the Adviser. In addition to the extent that this sub-advisory relationship is with an affiliate of the Adviser, the fee schedule may not reflect arm’s-length bargaining or negotiations.
While it appears that the sub-advisory relationship is paying a lower fee than the Portfolio, it is difficult to evaluate the relevance of such fees due to the differences in the services provided, risks involved and other competitive factors between the Portfolio and the sub-advisory relationship. There could be various business reasons why an investment adviser would be willing to provide a sub-advised relationship investment related services at a different fee level than an investment company it is sponsoring where the investment adviser is provided all the services, not just investment management service generally required by a registered investment company.
| 9 | It should be noted that the AVPS portfolio was also affected by the settlement between the Adviser and the NYAG. As a result, the Portfolio has the same breakpoints in its advisory fee schedule as the AVPS portfolio. |
| 10 | This is the fee schedule of a fund managed for an affiliate of the Adviser. |
| ALLIANCEBERNSTEIN BOND FUND INTERMEDIATE BOND PORTFOLIO • | 93 |
| II. | MANAGEMENT FEES CHARGED BY OTHER MUTUAL FUND COMPANIES FOR LIKE SERVICES. |
Lipper, Inc. (“Lipper”), an analytical service that is not affiliated with the Adviser, compared the fees charged to the Portfolio with fees charged to other investment companies for similar services offered by other investment advisers.11 Lipper’s analysis included the comparison of the Portfolio’s contractual management fee, estimated at the approximate current asset level of the Portfolio, to the median of the Portfolio’s Lipper Expense Group (“EG”)12 and the Portfolio’s contractual management fee ranking.13
Lipper describes an EG as a representative sample of comparable funds. Lipper’s standard methodology for screening funds to be included in an EG entails the consideration of several fund criteria, including fund type, investment classification/objective, load type and similar 12b-1/non-12b-1 service fees, asset (size) comparability, expense components and attributes. An EG will typically consist of seven to twenty funds.
| Portfolio | Contractual Management Fee (%) | Lipper Expense Group Median (%) | Rank | |||||||||
| Intermediate Bond Portfolio | 0.450 | 0.462 | 5/15 | |||||||||
Lipper also compared the Portfolio’s total expense ratio to the medians of the Portfolio’s EG and Lipper Expense Universe (“EU”). The EU is a broader group compared to the EG, consisting of all funds that have the same investment classification/objective and load type as the subject Portfolio.14
| 11 | The Supreme Court cautioned against accepting mutual fund fee comparisons without careful scrutiny since “these comparisons are problematic because these fees, like those challenged, may not be the product of negotiations conducted at arm’s length.” Jones v. Harris at 1429. |
| 12 | Lipper does not consider average account size when constructing EGs. Funds with relatively small average account sizes tend to have higher transfer agent expense ratios than comparable sized funds that have relatively large average account sizes. There are limitations to Lipper expense category data because different funds categorize expenses differently. |
| 13 | The contractual management fee is calculated by Lipper using the Portfolio’s contractual management fee rate at a hypothetical asset level. The hypothetical asset level is based on the combined net assets of all classes of the Portfolio, rounded up to the next $25 million. Lipper’s total expense ratio information is based on the most recent annual report except as otherwise noted. A ranking of “1” would mean that Portfolio had the lowest effective fee rate in the Lipper peer group. |
| 14 | Except for asset (size) comparability, Lipper uses the same criteria for selecting an EG when selecting an EU. Unlike the EG, the EU allows for the same adviser to be represented by more than just one fund. |
| 94 | • ALLIANCEBERNSTEIN BOND FUND INTERMEDIATE BOND PORTFOLIO |
| Portfolio | Total Expense Ratio (%)15 | Lipper Exp. Group Median (%) | Lipper Group Rank | Lipper Exp. Universe Median (%) | Lipper Universe Rank | |||||||||||
| Intermediate Bond Portfolio | 0.886 | 0.889 | 7/15 | 0.862 | 34/59 | |||||||||||
Based on this analysis, the Portfolio has a more favorable ranking on a contractual management fee basis than on a total expense ratio basis.
| III. | COSTS TO THE ADVISER AND ITS AFFILIATES OF SUPPLYING SERVICES PURSUANT TO THE ADVISORY FEE ARRANGEMENT, EXCLUDING ANY INTRA-CORPORATE PROFIT. |
The Adviser utilizes two profitability reporting systems, which operate independently but are aligned with each other, to estimate the Adviser’s profitability in connection with investment advisory services provided to the Portfolio. The Senior Officer has retained an independent consultant to provide independent advice regarding the alignment of the two profitability systems as well as the methodologies and allocations utilized by both profitability systems. See Section IV for additional discussion.
| IV. | PROFIT MARGINS OF THE ADVISER AND ITS AFFILIATES FOR SUPPLYING SUCH SERVICES. |
The profitability information for the Portfolio, prepared by the Adviser for the Board of Directors, was reviewed by the Senior Officer and the independent consultant. The Adviser’s profitability from providing investment advisory services to the Portfolio increased during calendar year 2013 relative to 2012.
In addition to the Adviser’s direct profits from managing the Portfolio, certain of the Adviser’s affiliates have business relationships with the Portfolio and may earn a profit from providing other services to the Portfolio. The courts have referred to this type of business opportunity as “fall-out benefits” to the Adviser and indicated that such benefits should be factored into the evaluation of the total relationship between the Portfolio and the Adviser. Neither case law nor common business practice precludes the Adviser’s affiliates from earning a reasonable profit on this type of relationship provided the affiliates’ charges and services are competitive. These affiliates provide transfer agent and distribution related services to the Portfolio and receive transfer agent fees, front-end sales loads, Rule 12b-1 payments and contingent deferred sales charges (“CDSC”). During the Portfolio’s fiscal year ended October 21, 2013, ABI received from the Portfolio $7,487, $1,652,571 and $16,042 in front-end sales charges, Rule 12b-1 and CDSC fees, respectively.16
| 15 | Most recently completed fiscal year Class A share total expense ratio. |
| 16 | As a result of discussions between the Board and the Adviser, ABI is planning to phase into reductions of the Portfolio’s Class A shares Rule 12b-1 fee payment rate from 0.30% to 0.25% effective on February 1, 2016. |
| ALLIANCEBERNSTEIN BOND FUND INTERMEDIATE BOND PORTFOLIO • | 95 |
AllianceBernstein Investments, Inc. (“ABI”), an affiliate of the Adviser, is the Portfolio’s principal underwriter. ABI and the Adviser have disclosed in the Portfolio’s prospectus that they may make revenue sharing payments from their own resources, in addition to revenues derived from sales loads and Rule 12b-1 fees, to firms that sell shares of the Portfolio. In 2013, ABI paid approximately 0.05% of the average monthly assets of the AllianceBernstein Mutual Funds or approximately $19.4 million for distribution services and educational support (revenue sharing payments).
Fees and reimbursements for out of pocket expenses charged by AllianceBernstein Investor Services, Inc. (“ABIS”), the affiliated transfer agent for the Portfolio, are charged on a per account basis, based on the level of service provided and the class of share held by the account. ABIS also receives a fee per shareholder sub-account for each account maintained by an intermediary on an omnibus basis. During the Portfolio’s fiscal year ended October 31, 2013, ABIS received $426,562 in fees from the Portfolio.
| V. | POSSIBLE ECONOMIES OF SCALE |
The Adviser has indicated that economies of scale are being shared with shareholders through pricing to scale, breakpoints, fee reductions/waivers and enhancement to services.
In May 2012, an independent consultant, retained by the Senior Officer, provided the Board of Directors information on the Adviser’s firm-wide average costs from 2005 through 2011 and the potential economies of scale. The independent consultant noted that from 2005 through 2007 the Adviser experienced significant growth in assets under management (“AUM”). During this period, operating expenses increased, in part to keep up with growth, and in part reflecting market returns. However, from 2008 through the first quarter of 2009, AUM rapidly and significantly decreased due to declines in market value and client withdrawals. When AUM rapidly decreased, some operating expenses categories, including base compensation and office space, adjusted more slowly during this period, resulting in an increase in average costs. Since 2009, AUM has experienced less significant changes. The independent consultant noted that changes in operating expenses reflect changes in business composition and business practices in response to changes in financial markets. Finally, the independent consultant concluded that the increase in average cost and the decline in net operating margin across the Adviser since late 2008 are inconsistent with the view that there are currently reductions in average costs due to economies of scale that can be shared with the AllianceBernstein Mutual Funds managed by the Adviser through lower fees.
| 96 | • ALLIANCEBERNSTEIN BOND FUND INTERMEDIATE BOND PORTFOLIO |
Previously, in February 2008, the independent consultant provided the Board of Directors an update of the Deli17 study on advisory fees and various fund characteristics.18 The independent consultant first reiterated the results of his previous two dimensional comparison analysis (fund size and family size) with the Board of Directors.19 The independent consultant then discussed the results of the regression model that was utilized to study the effects of various factors on advisory fees. The regression model output indicated that the bulk of the variation in fees predicted were explained by various factors, but substantially by fund AUM, family AUM, index fund indicator and investment style. The independent consultant also compared the advisory fees of the AllianceBernstein Mutual Funds to similar funds managed by 19 other large asset managers, regardless of the fund size and each Adviser’s proportion of mutual fund assets to non-mutual fund assets.
| VI. | NATURE AND QUALITY OF THE ADVISER’S SERVICES INCLUDING THE PERFORMANCE OF THE PORTFOLIO. |
With assets under management of approximately $473 billion as of September 30, 2014, the Adviser has the investment experience to manage and provide non-investment services (described in Section I) to the Portfolio.
The information below shows the 1, 3, 5 and 10 year performance returns and rankings of the Portfolio20 relative to its Lipper Performance Group (“PG”) and Lipper Performance Universe (“PU”)21 for the periods ended July 31, 2014.22
| 17 | The Deli study, originally published in 2002 based on 1997 data and updated for the February 2008 Presentation, may be of diminished value due to the age of the data used in the presentation and the changes experienced in the industry since 2008. |
| 18 | As mentioned previously, the Supreme Court cautioned against accepting mutual fund fee comparisons without careful scrutiny since the fees may not be the product of negotiations conducted at arm’s length. See Jones v. Harris at 1429. |
| 19 | The two dimensional analysis showed patterns of lower advisory fees for funds with larger asset sizes and funds from larger family sizes compared to funds with smaller asset sizes and funds from smaller family sizes, which according to the independent consultant is indicative of a sharing of economies of scale and scope. However, in less liquid and active markets, such is not the case, as the empirical analysis showed potential for diseconomies of scale in those markets. The empirical analysis also showed diminishing economies of scale and scope as funds surpassed a certain high level of assets. |
| 20 | The performance returns and rankings are for the Class A shares of the Portfolio. The performance returns of the Portfolios were provided Lipper. |
| 21 | The Portfolio’s PG is identical to the Portfolio’s EG. The Portfolio’s PU is not identical to the Portfolio’s EU as the criteria for including/excluding a portfolio in/from a PU are somewhat different from that of an EU. |
| 22 | The current Lipper investment classification/objective dictates the PG and PU throughout the life of the Portfolio even if the Portfolio may have had a different investment classification/objective at different points in time. |
| ALLIANCEBERNSTEIN BOND FUND INTERMEDIATE BOND PORTFOLIO • | 97 |
| Portfolio | Portfolio Return (%) | PG Median (%) | PU Median (%) | PG Rank | PU Rank | |||||||||||
| Intermediate Bond Portfolio | ||||||||||||||||
1 year | 5.95 | 4.56 | 4.28 | 2/15 | 8/73 | |||||||||||
3 year | 3.59 | 3.54 | 3.44 | 6/14 | 28/67 | |||||||||||
5 year | 6.06 | 4.89 | 5.21 | 3/13 | 14/63 | |||||||||||
10 year | 4.77 | 4.72 | 4.69 | 6/12 | 23/51 | |||||||||||
Set forth below are the 1, 3, 5, 10 year and since inception net performance returns of the Portfolio (in bold)23 versus its benchmark.24 Portfolio and benchmark volatility and reward-to-variability ratio (“Sharpe Ratio”) information is also shown.25
Periods Ending July 31, 2014 Annualized Performance | ||||||||||||||||||||||||||||||||
Since | Annualized | Risk Period (Year) | ||||||||||||||||||||||||||||||
| 1 Year (%) | 3 Year (%) | 5 Year (%) | 10 Year (%) | Volatility (%) | Sharpe (%) | |||||||||||||||||||||||||||
| Intermediate Bond Portfolio | 5.95 | 3.59 | 6.06 | 4.78 | 5.22 | 4.25 | 0.72 | 10 | ||||||||||||||||||||||||
| Barclays Capital U.S. Aggregate Bond Index | 3.97 | 3.04 | 4.47 | 4.80 | 5.55 | 3.24 | 0.96 | 10 | ||||||||||||||||||||||||
| Inception Date: July 1, 1999 | ||||||||||||||||||||||||||||||||
CONCLUSION:
Based on the factors discussed above the Senior Officer’s conclusion is that the proposed advisory fee for the Portfolio is reasonable and within the range of what would have been negotiated at arm’s-length in light of all the surrounding circumstances. This conclusion in respect of the Portfolio is based on an evaluation of all of these factors and no single factor was dispositive.
Dated: November 18, 2014
| 23 | The performance returns and risk measures shown in the table are for the Class A shares of the Portfolio. |
| 24 | The Adviser provided Portfolio and benchmark performance return information for the periods through July 31, 2014. |
| 25 | Portfolio and benchmark volatility and Sharpe Ratio information was obtained through Lipper LANA, a database maintained by Lipper. Volatility is a statistical measure of the tendency of a market price or yield to vary over time. A Sharpe Ratio is a risk adjusted measure of return that divides a fund’s return in excess of the riskless return by the fund’s standard deviation. A portfolio with a greater volatility would be viewed as more risky than a portfolio with equivalent performance but lower volatility; for that reason, a greater return would be demanded for the more risky fund. A portfolio with a higher Sharpe Ratio would be viewed as better performing than a fund with a lower Sharpe Ratio. |
| 98 | • ALLIANCEBERNSTEIN BOND FUND INTERMEDIATE BOND PORTFOLIO |
THIS PAGE IS NOT PART OF THE SHAREHOLDER REPORT OR THE FINANCIAL STATEMENTS
ALLIANCEBERNSTEIN FAMILY OF FUNDS
US Equity
US Core
Core Opportunities Fund
Select US Equity Portfolio
US Growth
Concentrated Growth Fund
Discovery Growth Fund
Growth Fund
Large Cap Growth Fund
Small Cap Growth Portfolio
US Value
Discovery Value Fund
Equity Income Fund
Growth & Income Fund
Value Fund
International/Global Equity
International/Global Core
Global Equity & Covered Call Strategy Fund
Global Thematic Growth Fund
International Portfolio
Tax-Managed International Portfolio
International/Global Growth
International Growth Fund
International/Global Value
International Value Fund
Fixed Income
Municipal
High Income Municipal Portfolio
Intermediate California Portfolio
Intermediate Diversified Portfolio
Intermediate New York Portfolio
Municipal Bond Inflation Strategy
Tax-Aware Fixed Income Portfolio
National Portfolio
Arizona Portfolio
California Portfolio
Massachusetts Portfolio
Michigan Portfolio
Minnesota Portfolio
New Jersey Portfolio
New York Portfolio
Ohio Portfolio
Pennsylvania Portfolio
Virginia Portfolio
Taxable
Bond Inflation Strategy
Global Bond Fund
Fixed Income (continued)
Taxable
High Income Fund
High Yield Portfolio
Intermediate Bond Portfolio
Limited Duration High Income Portfolio
Short Duration Portfolio
Alternatives
All Market Real Return Portfolio*
Credit Long/Short Portfolio
Global Real Estate Investment Fund
Long/Short Multi-Manager Fund
Market Neutral Strategy-U.S.
Multi-Manager Alternative Strategies Fund
Select US Long/Short Portfolio
Unconstrained Bond Fund
Multi-Asset
All Market Growth Portfolio*
Emerging Markets Multi-Asset Portfolio
Global Risk Allocation Fund
Retirement Strategies
2000 Retirement Strategy
2005 Retirement Strategy
2010 Retirement Strategy
2015 Retirement Strategy
2020 Retirement Strategy
2025 Retirement Strategy
2030 Retirement Strategy
2035 Retirement Strategy
2040 Retirement Strategy
2045 Retirement Strategy
2050 Retirement Strategy
2055 Retirement Strategy
Wealth Strategies
Balanced Wealth Strategy
Conservative Wealth Strategy
Wealth Appreciation Strategy
Tax-Managed Balanced Wealth Strategy
Tax-Managed Conservative Wealth Strategy
Tax-Managed Wealth Appreciation Strategy
Closed-End Funds
Alliance California Municipal Income Fund
Alliance New York Municipal Income Fund
AllianceBernstein Global High Income Fund
AllianceBernstein Income Fund
AllianceBernstein Multi-Manager Alternative Fund
AllianceBernstein National Municipal Income Fund
We also offer Exchange Reserves, which serves as the money market fund exchange vehicle for the AllianceBernstein mutual funds. An investment in Exchange Reserves is not a deposit in a bank and is not insured or guaranteed by the Federal Deposit Insurance Corporation or any other government agency. Although the Fund seeks to preserve the value of your investment at $1.00 per share, it is possible to lose money by investing in the Fund.
Investors should consider the investment objectives, risks, charges and expenses of the Fund carefully before investing. For copies of our prospectus or summary prospectus, which contain this and other information, visit us online at www.alliancebernstein.com or contact your AllianceBernstein investments representative. Please read the prospectus and/or summary prospectus carefully before investing.
* Prior to December 15, 2014, All Market Growth Portfolio was named Dynamic All Market Fund; All Market Real Return Portfolio was named Real Asset Strategy.
| ALLIANCEBERNSTEIN BOND FUND INTERMEDIATE BOND PORTFOLIO • | 99 |
AllianceBernstein Family of Funds
NOTES
| 100 | • ALLIANCEBERNSTEIN BOND FUND INTERMEDIATE BOND PORTFOLIO |
ALLIANCEBERNSTEIN BOND FUND INTERMEDIATE BOND PORTFOLIO
1345 Avenue of the Americas
New York, NY 10105
800.221.5672
| IB-0151-1014 |  | |
ANNUAL REPORT
AllianceBernstein
Municipal Bond Inflation Strategy
October 31, 2014
Annual Report

Investment Products Offered
• Are Not FDIC Insured • May Lose Value • Are Not Bank Guaranteed |
Investors should consider the investment objectives, risks, charges and expenses of the Fund carefully before investing. For copies of our prospectus or summary prospectus, which contain this and other information, visit us online at www.alliancebernstein.com or contact your AllianceBernstein Investments representative. Please read the prospectus and/or summary prospectus carefully before investing.
This shareholder report must be preceded or accompanied by the Fund’s prospectus for individuals who are not current shareholders of the Fund.
You may obtain a description of the Fund’s proxy voting policies and procedures, and information regarding how the Fund voted proxies relating to portfolio securities during the most recent 12-month period ended June 30, without charge. Simply visit AllianceBernstein’s website at www.alliancebernstein.com, or go to the Securities and Exchange Commission’s (the “Commission”) website at www.sec.gov, or call AllianceBernstein at (800) 227-4618.
The Fund files its complete schedule of portfolio holdings with the Commission for the first and third quarters of each fiscal year on Form N-Q. The Fund’s Forms N-Q are available on the Commission’s website at www.sec.gov. The Fund’s Forms N-Q may also be reviewed and copied at the Commission’s Public Reference Room in Washington, DC; information on the operation of the Public Reference Room may be obtained by calling (800) SEC-0330. AllianceBernstein publishes full portfolio holdings for the Fund monthly at www.alliancebernstein.com.
AllianceBernstein Investments, Inc. (ABI) is the distributor of the AllianceBernstein family of mutual funds. ABI is a member of FINRA and is an affiliate of AllianceBernstein L.P., the manager of the funds.
AllianceBernstein® and the AB Logo are registered trademarks and service marks used by permission of the owner, AllianceBernstein L.P.
December 12, 2014
Annual Report
This report provides management’s discussion of fund performance for AllianceBernstein Municipal Bond Inflation Strategy (the “Strategy”) for the annual period ended October 31, 2014.
Investment Objectives and Policies
The Strategy seeks to maximize real after-tax return for investors subject to federal income taxes, without undue risk to principal. Real return is the rate of return after adjusting for inflation. The Strategy pursues its objective by investing principally in high-quality, predominantly investment grade, municipal securities, that pay interest exempt from federal taxation. As a fundamental policy, the Strategy will invest at least 80% of its net assets in municipal securities. These securities may be subject to the federal alternative minimum tax (“AMT”) for some taxpayers.
The Strategy will invest at least 80% of its total assets in fixed-income securities rated A or better or the equivalent by one or more national rating agencies or deemed to be of comparable credit quality by AllianceBernstein L.P. (the “Adviser”). In deciding whether to take direct or indirect exposure, the Strategy may invest up to 20% of its total assets in fixed-income securities rated BB or B or the equivalent by one or more national rating agencies (or deemed to be of comparable credit quality by the Adviser), which are not investment grade (“junk bonds”). If the rating of a fixed-income security falls below investment grade, the Strategy will not be obligated to sell the security and
may continue to hold it if, in the Adviser’s opinion, the investment is appropriate under the circumstances. The Strategy may invest in fixed-income securities with any maturity and duration.
To provide inflation protection, the Strategy will typically enter into inflation swap agreements. The Strategy may use other inflation-protected instruments. Payments to the Strategy pursuant to swap agreements will result in taxable income, either ordinary income or capital gains, rather than income exempt from federal income taxation. It is expected that the Strategy’s primary use of derivatives will be for the purpose of inflation protection.
The Strategy may also invest in forward commitments; zero coupon municipal securities and variable, floating and inverse floating rate municipal securities; certain types of mortgage related securities; and derivatives, such as options, futures, forwards and swaps.
The Strategy may also utilize leverage for investment purposes through the use of Tender Option Bonds (“TOB”) transactions. The Adviser will consider the impact of TOB’s, swap agreements and other derivatives in making its assessments of the Strategy’s risks. The resulting exposures to markets, sectors, issuers or specific securities will be continuously monitored by the Adviser.
Investment Results
The table on page 6 shows the Strategy’s performance compared to its benchmark, the Barclays 1-10 Year
| ALLIANCEBERNSTEIN MUNICIPAL BOND INFLATION STRATEGY • | 1 |
Treasury Inflation-Protected Securities (“TIPS”) Index and to the Lipper Intermediate Municipal Debt Funds Average (the “Lipper Average”). Funds in the Lipper Average have generally similar investment objectives to the Strategy, although some may have different investment policies and sales and management fees and fund expenses.
All share classes of the Fund (with the exception of Class C shares underperforming for the six-month period) outperformed the benchmark for both periods, but underperformed the Lipper Average.
In order to pursue the investment objective of after-tax returns net of inflation, the Strategy invests in municipal bonds and uses derivatives for inflation protection. For both periods, positive performance relative to the benchmark was driven by the Strategy’s overweight in A and AA-rated bonds. Furthermore, the outperformance of municipal bonds versus Treasuries contributed positively to performance.
The Strategy’s underperformance relative to the Lipper Average was due to the underperformance of inflation-hedged strategies versus nominal bond strategies as inflation expectations fell over both periods; in part due to falling commodity prices on a global basis.
The Strategy used derivatives, in the form of inflation swaps, for hedging
purposes, which detracted from performance versus the Lipper Average and benefited performance versus the benchmark for both the six-month and 12-month periods.
Market Review and Investment Strategy
Limited supply and continued demand supported municipal bond prices over the six- and 12-month periods ended October 31, 2014. As a result municipal issues outperformed most other bond sectors. According to estimates by the Municipal Bond Investment Team (the “Team”) municipal yields declined between 0.10% and 0.50% over the six-month period and between 0.35% and roughly 1% over the 12-month period. During both periods, the yields for long-maturity bonds declined more than yields for shorter-maturity bonds and municipal bonds generally outperformed Treasury bonds. In the last few months of the reporting period, volatility increased in the markets in response to multiple factors: stronger U.S. economic growth prompted concerns that the U.S. Federal Reserve (the “Fed”) might raise interest rates sooner than expected; faltering economic growth overseas; and strife in the Middle East and Ukraine also heightened uncertainty.
The Team also targeted medium-grade, primarily BBB credit quality*
| * | A measure of the quality and safety of a bond or portfolio, based on the issuer’s financial condition and not of the Fund itself. AAA is highest (best) and D is lowest (worst). Investment grade securities are those rated BBB and above. Ratings are subject to change. If applicable, the pre-refunded category includes bonds which are secured by U.S. Government Securities and therefore have been deemed high-quality investment grade by the Adviser. |
| 2 | • ALLIANCEBERNSTEIN MUNICIPAL BOND INFLATION STRATEGY |
bonds, as an attractive part of the market to overweight. This has allowed the Strategy to capture historically high yields relative to AAA bonds. In addition, the Team expects the yield spread (the amount by which a bond’s yield exceeds the yield of AAA-rated bonds) of such bonds to fall (improving prices) when the Fed begins to increase rates.
The Strategy may purchase municipal securities that are insured under policies issued by certain insurance companies. Historically, insured municipal securities typically received a higher credit rating, which meant that the issuer of the securities paid a lower interest rate. As a result of declines in the credit quality and associated downgrades of most fund insurers, insurance has less value than it did in the past. The market now values
insured municipal securities primarily based on the credit quality of the issuer of the security with little value given to the insurance feature. In purchasing such insured securities, the Adviser evaluates the risk and return of municipal securities through its own research. The ratings of most insurance companies have been downgraded and it is possible that an insurance company may become insolvent. If an insurance company’s rating is downgraded or the company becomes insolvent, the prices of municipal securities insured by the insurance company may decline. As of October 31, 2014, the Strategy’s percentages of investments in municipal bonds that are insured and in insured municipal bonds that have been pre-refunded or escrowed to maturity are 7.16% and 0.70%, respectively.
| ALLIANCEBERNSTEIN MUNICIPAL BOND INFLATION STRATEGY • | 3 |
DISCLOSURES AND RISKS
Benchmark Disclosure
The Barclays 1-10 Year TIPS Index does not reflect fees and expenses associated with the active management of a portfolio. The Barclays 1-10 Year TIPS Index represents the performance of inflation-protected securities issued by the U.S. Treasury. An investor cannot invest directly in an index, and its results are not indicative of the performance for any specific investment, including the Strategy.
A Word About Risk
Market Risk: The value of the Strategy’s assets will fluctuate as the stock or bond market fluctuates. The value of the Strategy’s investments may decline, sometimes rapidly and unpredictably, simply because of economic changes or other events that affect large portions of the market.
Credit Risk: An issuer or guarantor of a fixed-income security, or the counterparty to a derivatives or other contract, may be unable or unwilling to make timely payments of interest or principal, or to otherwise honor its obligations. The issuer or guarantor may default causing a loss of the full principal amount of a security. The degree of risk for a particular security may be reflected in its credit rating. There is the possibility that the credit rating of a fixed-income security may be downgraded after purchase, which may adversely affect the value of the security. Investments in fixed-income securities with lower ratings (commonly referred to as “junk bonds”) tend to have a higher probability that an issuer will default or fail to meet its payment obligations.
Municipal Market Risk: This is the risk that special factors may adversely affect the value of municipal securities and have a significant effect on the yield or value of the Strategy’s investments in municipal securities. These factors include economic conditions, political or legislative changes, uncertainties related to the tax status of municipal securities, or the rights of investors in these securities. To the extent that the Strategy invests more of its assets in a particular state’s municipal securities, the Strategy may be vulnerable to events adversely affecting that state, including economic, political and regulatory occurrences, court decisions, terrorism and catastrophic natural disasters, such as hurricanes or earthquakes. The Strategy’s investments in certain municipal securities with principal and interest payments that are made from the revenues of a specific project or facility, and not general tax revenues, may have increased risks. Factors affecting the project or facility, such as local business or economic conditions, could have a significant effect on the project’s ability to make payments of principal and interest on these securities.
Tax Risk: There is no guarantee that all of the Strategy’s income will remain exempt from federal or state income taxes. From time to time, the U.S. Government and the U.S. Congress consider changes in federal tax law that could limit or eliminate the federal tax exemption for municipal bond income, which would in effect reduce the income received by shareholders from the Strategy by increasing taxes on that income. In such event, the Strategy’s net asset value (“NAV”) could also decline as yields on municipal bonds, which are typically lower than those on taxable bonds, would be expected to increase to approximately the yield of comparable taxable bonds. Actions or anticipated actions affecting the tax exempt status of municipal bonds could also result in significant shareholder redemptions of Strategy shares as investors anticipate adverse effects on the Strategy or seek higher yields to offset the potential loss of the tax deduction. As a result, the Strategy would be required to maintain higher levels of cash to meet the redemptions, which would negatively affect the Strategy’s yield.
Interest Rate Risk: Changes in interest rates will affect the value of investments in fixed-income securities. When interest rates rise, the value of investments in fixed-income securities tends to fall and this decrease in value may not be offset by higher income from new investments. Interest rate risk is generally greater for fixed-income securities with longer maturities or durations.
(Disclosures, Risks and Note about Historical Performance continued on next page)
| 4 | • ALLIANCEBERNSTEIN MUNICIPAL BOND INFLATION STRATEGY |
Disclosures and Risks
DISCLOSURES AND RISKS
(continued from previous page)
Duration Risk: Duration is a measure that relates the expected price volatility of a fixed-income security to changes in interest rates. The duration of a fixed-income security may be shorter than or equal to full maturity of a fixed-income security. Fixed income securities with longer durations have more risk and will decrease in price as interest rates rise. For example, a fixed income security with a duration of three years will decrease in value by approximately 3% if interest rates increase by 1%.
Inflation Risk: This is the risk that the value of assets or income from investments will be less in the future as inflation decreases the value of money. As inflation increases, the value of the Strategy’s assets can decline as can the value of the Strategy’s distributions. This risk is significantly greater for fixed-income securities with longer maturities.
Derivatives Risk: The Strategy’s investments in derivatives, such as swaps, futures, options and forwards, may be illiquid, difficult to price, and leveraged so that small changes may produce disproportionate losses for the Strategy, and may be subject to counterparty risk to a greater degree than more traditional investments. The use of inflation protection derivatives to help meet the Strategy’s investment objective may not be successful.
Leverage Risk: To the extent the Strategy uses leveraging techniques, its NAV may be more volatile because leverage tends to exaggerate the effect of changes in interest rates and any increase or decrease in the value of the Strategy’s investments.
Liquidity Risk: Liquidity risk exists when particular investments, such as lower-rated securities, are difficult to purchase or sell, possibly preventing the Strategy from selling out of these illiquid securities at an advantageous price. The Strategy is subject to liquidity risk because the market for municipal securities is generally smaller than many other markets. Derivatives and securities involving substantial market and credit risk tend to involve greater liquidity risk.
Management Risk: The Strategy is subject to management risk because it is an actively managed investment fund. The Adviser will apply its investment techniques and risk analyses in making investment decisions, but there is no guarantee that its techniques will produce the intended results.
These risks are fully discussed in the Strategy’s prospectus.
An Important Note About Historical Performance
The investment return and principal value of an investment in the Strategy will fluctuate, so that shares, when redeemed, may be worth more or less than their original cost. Performance shown on the following pages represents past performance and does not guarantee future results. Current performance may be lower or higher than the performance information shown. You may obtain performance information current to the most recent month-end by visiting www.alliancebernstein.com. For Class 1 shares click on “Private Clients”, then “Investments”, then “Stocks” or “Bonds”, then “Mutual Fund Performance at a Glance”.
All fees and expenses related to the operation of the Strategy have been deducted. NAV returns do not reflect sales charges; if sales charges were reflected, the Strategy’s quoted performance would be lower. SEC returns reflect the applicable sales charges for each share class: a 3.00% maximum front-end sales charge for Class A shares; and a 1% 1 year contingent deferred sales charge for Class C shares. Class 1 and 2 shares do not carry sales charges. Returns for the different share classes will vary due to different expenses associated with each class. Performance assumes reinvestment of distributions and does not account for taxes.
| ALLIANCEBERNSTEIN MUNICIPAL BOND INFLATION STRATEGY • | 5 |
Disclosures and Risks
HISTORICAL PERFORMANCE
THE STRATEGY VS. ITS BENCHMARK PERIODS ENDED OCTOBER 31, 2014 (unaudited) | NAV Returns | |||||||||
| 6 Months | 12 Months | |||||||||
| AllianceBernstein Municipal Bond Inflation Strategy | ||||||||||
Class 1* | 0.72% | 2.60% | ||||||||
| ||||||||||
Class 2* | 0.77% | 2.79% | ||||||||
| ||||||||||
Class A | 0.70% | 2.44% | ||||||||
| ||||||||||
Class C | 0.34% | 1.72% | ||||||||
| ||||||||||
Advisor Class Shares† | 0.76% | 2.75% | ||||||||
| ||||||||||
| Barclays 1-10 Year TIPS Index | 0.37% | 0.60% | ||||||||
| ||||||||||
| Lipper Intermediate Municipal Debt Funds Average | 2.39% | 5.11% | ||||||||
| ||||||||||
* Class 1 shares are only available to Bernstein Global Wealth Management private client accounts. Class 2 shares are only available to large Bernstein Global Wealth Management private client accounts and the Adviser’s institutional clients or through other limited arrangements.
† Please note that these share classes are for investors purchasing shares through accounts established under certain fee-based programs sponsored and maintained by certain broker-dealers and financial intermediaries, institutional pension plans and/or investment advisory clients of, and certain other persons associated with, the Adviser and its affiliates or the Strategy. | ||||||||||
See Disclosures, Risks and Note about Historical Performance on pages 4-5.
(Historical Performance continued on next page)
| 6 | • ALLIANCEBERNSTEIN MUNICIPAL BOND INFLATION STRATEGY |
Historical Performance
HISTORICAL PERFORMANCE
(continued from previous page)
GROWTH OF A $10,000 INVESTMENT IN THE STRATEGY
1/26/10* TO 10/31/14 (unaudited)
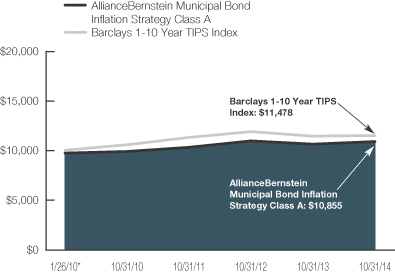
This chart illustrates the total value of an assumed $10,000 investment in AllianceBernstein Municipal Bond Inflation Strategy Class A shares (from 1/26/10* to 10/31/14) as compared to the performance of its benchmark. The chart reflects the deduction of the maximum 3.00% sales charge from the initial $10,000 investment in the Strategy and assumes the reinvestment of dividends and capital gains distributions.
| * | Inception date: 1/26/2010. |
See Disclosures, Risks and Note about Historical Performance on pages 4-5.
(Historical Performance continued on next page)
| ALLIANCEBERNSTEIN MUNICIPAL BOND INFLATION STRATEGY • | 7 |
Historical Performance
HISTORICAL PERFORMANCE
(continued from previous page)
| AVERAGE ANNUAL RETURNS AS OF OCTOBER 31, 2014 (unaudited) | ||||||||||||
| NAV Returns | SEC Returns (reflects applicable sales charges) | SEC Yields* | ||||||||||
| Class 1 Shares† | 0.98 | % | ||||||||||
1 Year | 2.60 | % | 2.60 | % | ||||||||
Since Inception‡ | 2.57 | % | 2.57 | % | ||||||||
| Class 2 Shares† | 1.09 | % | ||||||||||
1 Year | 2.79 | % | 2.79 | % | ||||||||
Since Inception‡ | 2.68 | % | 2.68 | % | ||||||||
| Class A Shares | 0.65 | % | ||||||||||
1 Year | 2.44 | % | -0.63 | % | ||||||||
Since Inception‡ | 2.39 | % | 1.74 | % | ||||||||
| Class C Shares | -0.02 | % | ||||||||||
1 Year | 1.72 | % | 0.72 | % | ||||||||
Since Inception‡ | 1.68 | % | 1.68 | % | ||||||||
| Advisor Class Shares** | 0.97 | % | ||||||||||
1 Year | 2.75 | % | 2.75 | % | ||||||||
Since Inception‡ | 2.68 | % | 2.68 | % | ||||||||
The Strategy’s current prospectus fee table shows the Strategy’s total annual operating expense ratios as 0.67%, 0.57%, 0.91%, 1.61% and 0.61% for Class 1, Class 2, Class A, Class C, and Advisor Class shares, respectively, gross of any fee waivers or expense reimbursements. Contractual fee waivers and/or expense reimbursements limit the Strategy’s annual operating expense ratios, exclusive of interest expense, to 0.60%, 0.50%, 0.80%, 1.50%, and 0.50% for Class 1, Class 2, Class A, Class C, and Advisor Class shares, respectively. These waivers/ reimbursements may not be terminated prior to January 31, 2015 and may be extended by the Adviser for additional one-year terms. Absent reimbursements or waivers, performance would have been lower. The Financial Highlights section of this report sets forth expense ratio data for the current reporting period; the expense ratios shown above may differ from the expense ratios in the Financial Highlights sections since they are based on different time periods.
| * | SEC yields are calculated based on SEC guidelines for the 30-day period ended October 31, 2014. |
| † | Class 1 shares are only available to Bernstein Global Wealth Management private client accounts. Class 2 shares are only available to large Bernstein Global Wealth Management private client accounts and the Adviser’s institutional clients or through other limited arrangements. |
| ‡ | Inception date: 1/26/2010. |
| ** | This share class is offered at NAV to eligible investors and its SEC returns are the same as the NAV returns. Please note that this share class is for investors purchasing shares through accounts established under certain fee-based programs sponsored and maintained by certain broker-dealers and financial intermediaries, institutional pension plans and/or investment advisory clients of, and certain other persons associated with, the Adviser and its affiliates or the Strategy. |
See Disclosures, Risks and Note about Historical Performance on pages 4-5.
(Historical Performance continued on next page)
| 8 | • ALLIANCEBERNSTEIN MUNICIPAL BOND INFLATION STRATEGY |
Historical Performance
HISTORICAL PERFORMANCE
(continued from previous page)
| SEC AVERAGE ANNUAL RETURNS AS OF THE MOST RECENT CALENDAR QUARTER-END SEPTEMBER 30, 2014 (unaudited) | ||||
| SEC Returns (reflects applicable sales charges) | ||||
| Class 1 Shares* | ||||
1 Year | 3.28 | % | ||
Since Inception† | 2.65 | % | ||
| Class 2 Shares* | ||||
1 Year | 3.38 | % | ||
Since Inception† | 2.74 | % | ||
| Class A Shares | ||||
1 Year | -0.08 | % | ||
Since Inception† | 1.79 | % | ||
| Class C Shares | ||||
1 Year | 1.30 | % | ||
Since Inception† | 1.75 | % | ||
| Advisor Class Shares‡ | ||||
1 Year | 3.33 | % | ||
Since Inception† | 2.75 | % | ||
| * | Class 1 shares are only available to Bernstein Global Wealth Management private client accounts. Class 2 shares are only available to large Bernstein Global Wealth Management private client accounts and the Adviser’s institutional clients or through other limited arrangements. |
| † | Inception date: 1/26/2010. |
| ‡ | This share class is offered at NAV to eligible investors and its SEC returns are the same as the NAV returns. Please note that this share class is for investors purchasing shares through accounts established under certain fee-based programs sponsored and maintained by certain broker-dealers and financial intermediaries, institutional pension plans and/or investment advisory clients of, and certain other persons associated with, the Adviser and its affiliates or the Strategy. |
See Disclosures, Risks and Note about Historical Performance on pages 4-5.
| ALLIANCEBERNSTEIN MUNICIPAL BOND INFLATION STRATEGY • | 9 |
Historical Performance
FUND EXPENSES
(unaudited)
As a shareholder of a mutual fund, you may incur two types of costs: (1) transaction costs, including sales charges (loads) on purchase payments, contingent deferred sales charges on redemptions and (2) ongoing costs, including management fees; distribution (12b-1) fees; and other fund expenses. This example is intended to help you understand your ongoing costs (in dollars) of investing in the Fund and to compare these costs with the ongoing costs of investing in other mutual funds.
The Example is based on an investment of $1,000 invested at the beginning of the period and held for the entire period as indicated below.
Actual Expenses
The table below provides information about actual account values and actual expenses. You may use the information in this line, together with the amount you invested, to estimate the expenses that you paid over the period. Simply divide your account value by $1,000 (for example, an $8,600 account value divided by $1,000 = 8.6), then multiply the result by the number in the first line under the heading entitled “Expenses Paid During Period” to estimate the expenses you paid on your account during this period.
Hypothetical Example for Comparison Purposes
The table below provides information about hypothetical account values and hypothetical expenses based on the Fund’s actual expense ratio and an assumed annual rate of return of 5% before expenses, which is not the Fund’s actual return. The hypothetical account values and expenses may not be used to estimate the actual ending account balance or expenses you paid for the period. You may use this information to compare the ongoing costs of investing in the Fund and other funds by comparing this 5% hypothetical example with the 5% hypothetical examples that appear in the shareholder reports of other funds.
Please note that the expenses shown in the table are meant to highlight your ongoing costs only and do not reflect any transactional costs, such as sales charges (loads), or contingent deferred sales charges on redemptions. Therefore, the hypothetical example is useful in comparing ongoing costs only, and will not help you determine the relative total costs of owning different funds. In addition, if these transactional costs were included, your costs would have been higher.
| Beginning Account Value May 1, 2014 | Ending Account Value October 31, 2014 | Expenses Paid During Period* | Annualized Expense Ratio* | |||||||||||||
| Class A | ||||||||||||||||
Actual | $ | 1,000 | $ | 1,007.00 | $ | 4.05 | 0.80 | % | ||||||||
Hypothetical** | $ | 1,000 | $ | 1,021.17 | $ | 4.08 | 0.80 | % | ||||||||
| Class C | ||||||||||||||||
Actual | $ | 1,000 | $ | 1,003.40 | $ | 7.57 | 1.50 | % | ||||||||
Hypothetical** | $ | 1,000 | $ | 1,017.64 | $ | 7.63 | 1.50 | % | ||||||||
| Advisor Class | ||||||||||||||||
Actual | $ | 1,000 | $ | 1,007.60 | $ | 2.53 | 0.50 | % | ||||||||
Hypothetical** | $ | 1,000 | $ | 1,022.68 | $ | 2.55 | 0.50 | % | ||||||||
| Class 1 | ||||||||||||||||
Actual | $ | 1,000 | $ | 1,007.20 | $ | 3.04 | 0.60 | % | ||||||||
Hypothetical** | $ | 1,000 | $ | 1,022.18 | $ | 3.06 | 0.60 | % | ||||||||
| Class 2 | ||||||||||||||||
Actual | $ | 1,000 | $ | 1,007.70 | $ | 2.53 | 0.50 | % | ||||||||
Hypothetical** | $ | 1,000 | $ | 1,022.68 | $ | 2.55 | 0.50 | % | ||||||||
| * | Expenses are equal to the classes’ annualized expense ratios multiplied by the average account value over the period, multiplied by 184/365 (to reflect the one-half year period). |
| ** | Assumes 5% annual return before expenses. |
| 10 | • ALLIANCEBERNSTEIN MUNICIPAL BOND INFLATION STRATEGY |
Fund Expenses
PORTFOLIO SUMMARY
October 31, 2014 (unaudited)
PORTFOLIO STATISTICS
Net Assets ($mil): $860.2
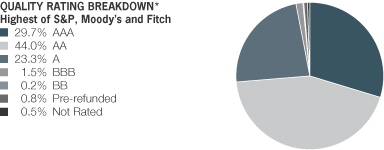
| * | All data are as of October 31, 2014. The Strategy’s quality rating breakdown is expressed as a percentage of the Strategy’s total investments in municipal securities and may vary over time. The Strategy also enters into derivative transactions, which may be used for hedging or investment purposes (see “Portfolio of Investments” section of the report for additional details). The quality ratings are determined by using the Standard & Poor’s Ratings Services (“S&P”), Moody’s Investors Services, Inc.(“Moody’s”) and Fitch Ratings, Ltd.(“Fitch”). The Strategy considers the credit ratings issued by S&P, Moody’s and Fitch and uses the highest rating issued by the agencies. These are a measure of the quality and safety of a bond or portfolio, based on the issuer’s financial condition. AAA is the highest (best) and D is the lowest (worst). If applicable, the pre-refunded category includes bonds which are secured by US Government Securities and therefore are deemed high-quality investment grade by the Adviser. If applicable, Not Applicable (N/A) includes non credit worthy investments; such as, equities, currency contracts, futures and options. If applicable, the Not Rated category includes bonds that are not rated by a Nationally Recognized Statistical Rating Organization. The Adviser valuates the creditworthiness of non-rated securities based on a number of factors including, but not limited to, cash flows, enterprise value and economic environment. |
| ALLIANCEBERNSTEIN MUNICIPAL BOND INFLATION STRATEGY • | 11 |
Portfolio Summary
PORTFOLIO OF INVESTMENTS
October 31, 2014
Principal Amount (000) | U.S. $ Value | |||||||
| ||||||||
MUNICIPAL OBLIGATIONS – 96.0% | ||||||||
Long-Term Municipal Bonds – 96.0% | ||||||||
Alabama – 2.2% | ||||||||
Alabama Public School & College Authority | $ | 12,340 | $ | 12,975,510 | ||||
Series 2009A | 3,785 | 4,047,300 | ||||||
County of Jefferson AL Sewer Revenue | 1,825 | 2,015,932 | ||||||
|
| |||||||
| 19,038,742 | ||||||||
|
| |||||||
Alaska – 0.4% | ||||||||
Alaska Industrial Development & Export Authority | 400 | 439,844 | ||||||
City of Valdez AK (BP Pipelines Alaska, Inc.) | 3,140 | 3,310,847 | ||||||
|
| |||||||
| 3,750,691 | ||||||||
|
| |||||||
Arizona – 2.7% | ||||||||
Arizona State University COP | 8,345 | 9,925,560 | ||||||
City of Phoenix Civic Improvement Corp. | 3,330 | 3,954,109 | ||||||
County of Pima AZ Sewer System Revenue AGM | 1,765 | 2,077,758 | ||||||
Maricopa County Community College District | 2,850 | 3,022,055 | ||||||
Salt River Project Agricultural Improvement & Power District | 3,140 | 3,783,574 | ||||||
|
| |||||||
| 22,763,056 | ||||||||
|
| |||||||
Arkansas – 0.2% | ||||||||
City of Fort Smith AR Sales & Use Tax Revenue | 370 | 370,688 | ||||||
City of Springdale AR Sales & Use Tax Revenue | 1,565 | 1,570,728 | ||||||
|
| |||||||
| 1,941,416 | ||||||||
|
| |||||||
| 12 | • ALLIANCEBERNSTEIN MUNICIPAL BOND INFLATION STRATEGY |
Portfolio of Investments
Principal Amount (000) | U.S. $ Value | |||||||
| ||||||||
California – 2.5% | ||||||||
San Francisco City & County Airports Comm-San Francisco International Airport | $ | 450 | $ | 526,662 | ||||
NATL | 290 | 333,880 | ||||||
State of California | 275 | 298,933 | ||||||
Series 2011 | 5,000 | 5,982,300 | ||||||
Series 2012 | 9,305 | 11,113,985 | ||||||
Series 2014 | 2,960 | 3,601,195 | ||||||
|
| |||||||
| 21,856,955 | ||||||||
|
| |||||||
Colorado – 3.4% | ||||||||
City & County of Denver CO Airport System Revenue | 375 | 435,578 | ||||||
Series 2011B | 4,730 | 4,736,054 | ||||||
Series 2012A | 13,395 | 15,332,244 | ||||||
Denver Urban Renewal Authority | 200 | 209,412 | ||||||
Series 2013A | 5,655 | 6,553,172 | ||||||
Plaza Metropolitan District No 1 | 1,310 | 1,439,926 | ||||||
Regional Transportation District | 440 | 482,750 | ||||||
|
| |||||||
| 29,189,136 | ||||||||
|
| |||||||
Connecticut – 0.8% | ||||||||
State of Connecticut AMBAC | 1,750 | 1,787,888 | ||||||
| ALLIANCEBERNSTEIN MUNICIPAL BOND INFLATION STRATEGY • | 13 |
Portfolio of Investments
Principal Amount (000) | U.S. $ Value | |||||||
| ||||||||
State of Connecticut | $ | 4,360 | $ | 5,309,564 | ||||
|
| |||||||
| 7,097,452 | ||||||||
|
| |||||||
Florida – 8.5% | ||||||||
Citizens Property Insurance Corp. | 315 | 337,015 | ||||||
Series 2011A-1 | 1,720 | 1,766,681 | ||||||
Series 2012A | 7,315 | 8,630,164 | ||||||
Series 2012A-1 | 3,165 | 3,386,202 | ||||||
NATL Series 2007A | 275 | 279,221 | ||||||
City of Jacksonville FL | 1,720 | 2,048,262 | ||||||
City of Jacksonville FL | 10,190 | 12,105,033 | ||||||
City of Tampa FL Water & Wastewater System Revenue | 1,565 | 1,847,577 | ||||||
County of Miami-Dade FL Aviation Revenue | 3,030 | 3,130,172 | ||||||
County of Miami-Dade FL Spl Tax | 1,500 | 1,753,395 | ||||||
Florida Department of Environmental Protection | 3,775 | 4,477,528 | ||||||
Series 2013A | 1,765 | 1,867,617 | ||||||
5.00%, 7/01/18-7/01/19 | 3,905 | 4,509,548 | ||||||
Florida Municipal Power Agency | 2,890 | 3,373,497 | ||||||
Florida Ports Financing Commission | 1,900 | 1,951,908 | ||||||
| 14 | • ALLIANCEBERNSTEIN MUNICIPAL BOND INFLATION STRATEGY |
Portfolio of Investments
Principal Amount (000) | U.S. $ Value | |||||||
| ||||||||
Florida State Board of Education | $ | 16,440 | $ | 18,292,459 | ||||
Florida State Hurricane Catastrophe Fund Finance Corp. | 700 | 722,379 | ||||||
Martin County Industrial Development Authority | 1,900 | 1,934,162 | ||||||
State of Florida Lottery Revenue | 550 | 591,701 | ||||||
|
| |||||||
| 73,004,521 | ||||||||
|
| |||||||
Georgia – 0.9% | ||||||||
Cherokee County Board of Education | 1,000 | 1,191,750 | ||||||
City of Atlanta Department of Aviation | 2,500 | 2,824,850 | ||||||
Municipal Electric Authority of Georgia | 3,045 | 3,606,376 | ||||||
|
| |||||||
| 7,622,976 | ||||||||
|
| |||||||
Idaho – 0.3% | ||||||||
Idaho Health Facilities Authority | 2,390 | 2,418,584 | ||||||
|
| |||||||
Illinois – 3.3% | ||||||||
Chicago O’Hare International Airport | 1,930 | 2,103,739 | ||||||
Chicago O’Hare International Airport | 2,500 | 2,886,550 | ||||||
5.50%, 1/01/25 | 2,250 | 2,645,280 | ||||||
Chicago Transit Authority | 2,425 | 2,491,857 | �� | |||||
| ALLIANCEBERNSTEIN MUNICIPAL BOND INFLATION STRATEGY • | 15 |
Portfolio of Investments
Principal Amount (000) | U.S. $ Value | |||||||
| ||||||||
AMBAC | $ | 1,250 | $ | 1,282,688 | ||||
Springfield Metropolitan Sanitation District | 2,170 | 2,483,001 | ||||||
State of Illinois | 1,040 | 1,165,029 | ||||||
Series 2010 | 500 | 551,610 | ||||||
Series 2012 | 6,050 | 6,247,290 | ||||||
Series 2013A | 4,030 | 4,536,369 | ||||||
State of Illinois | 1,450 | 1,611,428 | ||||||
|
| |||||||
| 28,004,841 | ||||||||
|
| |||||||
Indiana – 0.7% | ||||||||
Indiana Municipal Power Agency | 4,965 | 5,828,552 | ||||||
|
| |||||||
Kentucky – 0.3% | ||||||||
Kentucky Turnpike Authority | 2,275 | 2,717,943 | ||||||
|
| |||||||
Louisiana – 1.2% | ||||||||
State of Louisiana Gasoline & Fuels Tax Revenue | 9,085 | 10,695,225 | ||||||
|
| |||||||
Maryland – 5.2% | ||||||||
State of Maryland | 36,765 | 44,587,310 | ||||||
|
| |||||||
Massachusetts – 4.8% | ||||||||
City of Boston MA | 1,300 | 1,325,818 | ||||||
Commonwealth of Massachusetts | 4,580 | 4,652,593 | ||||||
| 16 | • ALLIANCEBERNSTEIN MUNICIPAL BOND INFLATION STRATEGY |
Portfolio of Investments
Principal Amount (000) | U.S. $ Value | |||||||
| ||||||||
AGM | $ | 9,575 | $ | 10,046,952 | ||||
Commonwealth of Massachusetts (Commonwealth of Massachusetts Fuel Tax) AGM | 3,000 | 3,280,290 | ||||||
Massachusetts Bay Transportation Authority | 3,330 | 4,080,249 | ||||||
Massachusetts Clean Water Trust (The) (Massachusetts Water Pollution Abatement Trust (The) SRF) | 3,240 | 3,413,858 | ||||||
Massachusetts Health & Educational Facilities Authority | 3,730 | 4,017,359 | ||||||
Massachusetts Municipal Wholesale | 1,430 | 1,475,417 | ||||||
Massachusetts School Building Authority | 2,475 | 3,009,278 | ||||||
Metropolitan Boston Transit Parking Corp. | 5,025 | 5,846,045 | ||||||
|
| |||||||
| 41,147,859 | ||||||||
|
| |||||||
Michigan – 3.6% | ||||||||
City of Detroit MI Sewage Disposal System Revenue | 3,750 | 4,225,800 | ||||||
Michigan Finance Authority | 10,545 | 12,224,502 | ||||||
Michigan Finance Authority | 14,055 | 14,241,510 | ||||||
|
| |||||||
| 30,691,812 | ||||||||
|
| |||||||
| ALLIANCEBERNSTEIN MUNICIPAL BOND INFLATION STRATEGY • | 17 |
Portfolio of Investments
Principal Amount (000) | U.S. $ Value | |||||||
| ||||||||
Minnesota – 0.2% | ||||||||
Minnesota Higher Education Facilities Authority | $ | 1,295 | $ | 1,478,255 | ||||
|
| |||||||
Mississippi – 0.3% | ||||||||
Mississippi Development Bank | 1,500 | 1,727,070 | ||||||
Series 2013A | 1,000 | 1,151,380 | ||||||
|
| |||||||
| 2,878,450 | ||||||||
|
| |||||||
Missouri – 0.2% | ||||||||
Springfield Public Utilities Board | 1,390 | 1,561,846 | ||||||
|
| |||||||
Nevada – 3.5% | ||||||||
City of Reno NV | 1,000 | 1,131,850 | ||||||
Series 2013B | 2,210 | 2,573,943 | ||||||
Clark County School District NATL | 450 | 467,280 | ||||||
County of Clark Department of Aviation | 775 | 906,111 | ||||||
Series 2013C-1 | 24,705 | 25,059,022 | ||||||
|
| |||||||
| 30,138,206 | ||||||||
|
| |||||||
New Jersey – 3.3% | ||||||||
Morris-Union Jointure Commission COP AGM | 2,340 | 2,526,779 | ||||||
New Jersey Economic Development Authority | 480 | 533,818 | ||||||
Series 2014P | 5,055 | 5,691,121 | ||||||
New Jersey State Turnpike Authority | 1,800 | 2,160,954 | ||||||
| 18 | • ALLIANCEBERNSTEIN MUNICIPAL BOND INFLATION STRATEGY |
Portfolio of Investments
Principal Amount (000) | U.S. $ Value | |||||||
| ||||||||
Series 2014A | $ | 4,785 | $ | 5,625,772 | ||||
New Jersey Transportation Trust Fund Authority | 10,000 | 11,464,500 | ||||||
|
| |||||||
| 28,002,944 | ||||||||
|
| |||||||
New Mexico – 0.6% | ||||||||
City of Albuquerque NM | 4,925 | 5,222,322 | ||||||
|
| |||||||
New York – 16.2% | ||||||||
City of New York NY | 4,250 | 5,049,977 | ||||||
Series 2014J | 6,100 | 7,286,389 | ||||||
AGM | 1,700 | 1,768,340 | ||||||
Long Island Power Authority | 3,900 | 3,933,735 | ||||||
Metropolitan Transportation Authority | 9,065 | 10,785,652 | ||||||
Series 2012F | 3,635 | 4,303,840 | ||||||
Series 2013A | 2,300 | 2,698,613 | ||||||
Series 2013E | 8,510 | 10,174,215 | ||||||
New York City Transitional Finance Authority Future Tax Secured Revenue | 6,830 | 8,108,508 | ||||||
Series 20131 | 6,650 | 7,256,746 | ||||||
New York City Water & Sewer System | 3,875 | 4,562,580 | ||||||
New York State Dormitory Authority | 3,000 | 3,523,260 | ||||||
Series 2012A | 14,610 | 17,742,238 | ||||||
Series 2012B | 7,900 | 9,368,294 | ||||||
| ALLIANCEBERNSTEIN MUNICIPAL BOND INFLATION STRATEGY • | 19 |
Portfolio of Investments
Principal Amount (000) | U.S. $ Value | |||||||
| ||||||||
Series 2014A | $ | 6,565 | $ | 7,832,308 | ||||
New York State Environmental Facilities Corp. | 3,000 | 3,542,460 | ||||||
New York State Thruway Authority | 17,900 | 21,458,341 | ||||||
Triborough Bridge & Tunnel Authority | 4,360 | 5,149,640 | ||||||
Series 2013B | 4,100 | 4,924,059 | ||||||
|
| |||||||
| 139,469,195 | ||||||||
|
| |||||||
North Carolina – 1.4% | ||||||||
North Carolina Eastern Municipal Power Agency | 6,700 | 7,803,624 | ||||||
State of North Carolina | 2,330 | 2,492,564 | ||||||
State of North Carolina | 1,600 | 1,708,896 | ||||||
|
| |||||||
| 12,005,084 | ||||||||
|
| |||||||
Ohio – 0.1% | ||||||||
City of Cleveland OH COP | 700 | 773,787 | ||||||
|
| |||||||
Oregon – 3.5% | ||||||||
Deschutes County Administrative School District No 1 Bend-La Pine | 5,180 | 6,179,792 | ||||||
Multnomah County School District No 1 Portland/OR | 14,605 | 15,030,151 | ||||||
Tri-County Metropolitan Transportation District | 4,605 | 5,240,076 | ||||||
Washington & Multnomah Counties School District No 48J Beaverton | 3,195 | 3,876,078 | ||||||
|
| |||||||
| 30,326,097 | ||||||||
|
| |||||||
| 20 | • ALLIANCEBERNSTEIN MUNICIPAL BOND INFLATION STRATEGY |
Portfolio of Investments
Principal Amount (000) | U.S. $ Value | |||||||
| ||||||||
Pennsylvania – 7.3% | ||||||||
Allegheny County Sanitary Authority | $ | 2,250 | $ | 2,606,423 | ||||
City of Philadelphia PA Water & Wastewater Revenue | 550 | 626,571 | ||||||
Commonwealth of Pennsylvania | 15,650 | 16,673,979 | ||||||
Series 2014 | 5,000 | 5,571,650 | ||||||
Montgomery County Industrial Development Authority/PA | 475 | 545,599 | ||||||
Pennsylvania Economic Development Financing Authority | 7,550 | 8,490,730 | ||||||
Series 2012A | 13,085 | 15,067,144 | ||||||
Pennsylvania Industrial Development Authority | 5,000 | 5,372,200 | ||||||
School District of Philadelphia (The) | 1,800 | 2,066,598 | ||||||
State Public School Building Authority | 5,150 | 5,902,939 | ||||||
|
| |||||||
| 62,923,833 | ||||||||
|
| |||||||
Puerto Rico – 0.4% | ||||||||
Puerto Rico Electric Power Authority | 3,400 | 3,483,402 | ||||||
|
| |||||||
South Carolina – 0.9% | ||||||||
Horry County School District/SC | 1,470 | 1,561,508 | ||||||
Renewable Water Resources | 2,570 | 3,014,224 | ||||||
| ALLIANCEBERNSTEIN MUNICIPAL BOND INFLATION STRATEGY • | 21 |
Portfolio of Investments
Principal Amount (000) | U.S. $ Value | |||||||
| ||||||||
South Carolina State Public Service Authority | $ | 3,200 | $ | 3,363,360 | ||||
|
| |||||||
| 7,939,092 | ||||||||
|
| |||||||
Tennessee – 0.3% | ||||||||
Metropolitan Government of Nashville & Davidson County TN | 2,385 | 2,886,709 | ||||||
|
| |||||||
Texas – 7.1% | ||||||||
City of Corpus Christi TX Utility System Revenue | 5,675 | 6,705,410 | ||||||
City of Garland TX | 500 | 579,380 | ||||||
City of Houston TX Airport System Revenue | 2,105 | 2,437,106 | ||||||
City of Houston TX Combined Utility System Revenue | 2,735 | 3,171,233 | ||||||
City of Lubbock TX | 1,740 | 2,021,985 | ||||||
City Public Service Board of San Antonio TX | 7,110 | 8,530,365 | ||||||
Conroe Independent School District | 6,240 | 7,318,476 | ||||||
Denton Independent School District | 2,135 | 2,162,776 | ||||||
Fort Worth Independent School District | 4,000 | 4,054,200 | ||||||
North Texas Tollway Authority | 3,625 | 4,357,359 | ||||||
Rockwall Independent School District | 3,280 | 3,820,511 | ||||||
San Antonio Independent School District/TX | 1,710 | 2,022,263 | ||||||
| 22 | • ALLIANCEBERNSTEIN MUNICIPAL BOND INFLATION STRATEGY |
Portfolio of Investments
Principal Amount (000) | U.S. $ Value | |||||||
| ||||||||
Texas Public Finance Authority | $ | 11,605 | $ | 12,733,702 | ||||
University of Texas System (The) | 1,070 | 1,271,288 | ||||||
|
| |||||||
| 61,186,054 | ||||||||
|
| |||||||
Virginia – 1.7% | ||||||||
Fairfax County Economic Development Authority | 6,000 | 6,803,700 | ||||||
Virginia College Building Authority | 5,240 | 6,276,524 | ||||||
Virginia Commonwealth Transportation Board | 1,655 | 1,697,600 | ||||||
|
| |||||||
| 14,777,824 | ||||||||
|
| |||||||
Washington – 5.6% | ||||||||
Central Puget Sound Regional Transit Authority | 7,815 | 9,382,894 | ||||||
Chelan County Public Utility District No 1 | 3,305 | 3,889,390 | ||||||
City of Seattle WA Municipal Light & Power Revenue | 4,080 | 4,821,621 | ||||||
City of Tacoma WA Electric System Revenue | 4,000 | 4,683,140 | ||||||
Energy Northwest | 680 | 779,763 | ||||||
Series 2012A | 4,200 | 4,937,142 | ||||||
King County School District No 414 Lake Washington | 3,735 | 4,079,404 | ||||||
Port of Seattle WA | 4,820 | 5,589,706 | ||||||
| ALLIANCEBERNSTEIN MUNICIPAL BOND INFLATION STRATEGY • | 23 |
Portfolio of Investments
Principal Amount (000) | U.S. $ Value | |||||||
| ||||||||
State of Washington | $ | 710 | $ | 834,371 | ||||
Series 2010-10E | 3,295 | 3,831,690 | ||||||
Series 2013D | 3,385 | 4,132,611 | ||||||
AMBAC | 1,125 | 1,160,966 | ||||||
|
| |||||||
| 48,122,698 | ||||||||
|
| |||||||
Wisconsin – 2.4% | ||||||||
State of Wisconsin Clean Water Fund Leveraged Loan Portfolio | 4,490 | 5,459,391 | ||||||
Wisconsin Department of Transportation | 12,000 | 14,723,380 | ||||||
|
| |||||||
| 20,182,771 | ||||||||
|
| |||||||
Total Municipal Obligations | 825,715,640 | |||||||
|
| |||||||
CORPORATES – INVESTMENT GRADE – 3.9% |
| |||||||
Financial Institutions – 3.3% | ||||||||
Banking – 3.3% | ||||||||
Bank of America Corp. | 2,585 | 2,818,821 | ||||||
Capital One Bank USA NA | 8,300 | 8,264,169 | ||||||
JPMorgan Chase & Co. | 8,885 | 8,898,185 | ||||||
Morgan Stanley | 3,362 | 3,392,187 | ||||||
5.375%, 10/15/15 | 1,000 | 1,043,875 | ||||||
Series G | 4,030 | 4,373,038 | ||||||
|
| |||||||
| 28,790,275 | ||||||||
|
| |||||||
Industrial – 0.6% | ||||||||
Communications - Media – 0.1% | ||||||||
Viacom, Inc. | 800 | 801,723 | ||||||
|
| |||||||
Technology – 0.5% | ||||||||
Cisco Systems, Inc. | 4,468 | 4,476,052 | ||||||
|
| |||||||
| 5,277,775 | ||||||||
|
| |||||||
Total Corporates – Investment Grade | 34,068,050 | |||||||
|
| |||||||
| 24 | • ALLIANCEBERNSTEIN MUNICIPAL BOND INFLATION STRATEGY |
Portfolio of Investments
Principal Amount (000) | U.S. $ Value | |||||||
| ||||||||
AGENCIES – 0.7% | ||||||||
Federal Home Loan Bank | $ | 5,315 | $ | 5,719,546 | ||||
|
| |||||||
| Shares | ||||||||
SHORT-TERM INVESTMENTS – 1.1% | ||||||||
Investment Companies – 1.0% | ||||||||
AllianceBernstein Fixed-Income Shares, Inc. – | 8,377,170 | 8,377,170 | ||||||
|
| |||||||
| Principal Amount (000) | ||||||||
U.S. Treasury Bills – 0.1% | ||||||||
U.S. Treasury Bill | 1,300 | 1,299,610 | ||||||
|
| |||||||
Total Short-Term Investments | 9,676,780 | |||||||
|
| |||||||
Total Investments – 101.7% | 875,180,016 | |||||||
Other assets less liabilities – (1.7)% | (14,973,697 | ) | ||||||
|
| |||||||
Net Assets – 100.0% | $ | 860,206,319 | ||||||
|
| |||||||
INFLATION (CPI) SWAPS (see Note D)
| Rate Type | ||||||||||||||||||||
Swap Counterparty | Notional Amount (000) | Termination Date | Payments made by the Fund | Payments received by the Fund | Unrealized Appreciation/ (Depreciation) | |||||||||||||||
Barclays Bank PLC | $ | 2,000 | 4/08/15 | 2.220 | % | CPI | # | $ | (38,062 | ) | ||||||||||
Barclays Bank PLC | 38,000 | 4/24/15 | 2.020 | % | CPI | # | (556,070 | ) | ||||||||||||
Barclays Bank PLC | 5,500 | 6/01/15 | 2.038 | % | CPI | # | (29,545 | ) | ||||||||||||
Barclays Bank PLC | 6,000 | 2/26/17 | 2.370 | % | CPI | # | (253,515 | ) | ||||||||||||
Barclays Bank PLC | 3,000 | 7/19/17 | 2.038 | % | CPI | # | (22,122 | ) | ||||||||||||
Barclays Bank PLC | 37,000 | 8/07/17 | 2.124 | % | CPI | # | (554,687 | ) | ||||||||||||
Barclays Bank PLC | 5,500 | 6/02/19 | 2.580 | % | CPI | # | (333,195 | ) | ||||||||||||
Barclays Bank PLC | 4,000 | 6/15/20 | 2.480 | % | CPI | # | (203,026 | ) | ||||||||||||
Barclays Bank PLC | 35,000 | 7/02/20 | 2.256 | % | CPI | # | (717,259 | ) | ||||||||||||
Barclays Bank PLC | 1,500 | 8/04/20 | 2.308 | % | CPI | # | (42,108 | ) | ||||||||||||
Barclays Bank PLC | 2,000 | 11/10/20 | 2.500 | % | CPI | # | (92,121 | ) | ||||||||||||
Barclays Bank PLC | 6,000 | 5/04/21 | 2.845 | % | CPI | # | (537,590 | ) | ||||||||||||
Barclays Bank PLC | 3,000 | 5/12/21 | 2.815 | % | CPI | # | (261,470 | ) | ||||||||||||
Barclays Bank PLC | 14,000 | 4/03/22 | 2.663 | % | CPI | # | (978,713 | ) | ||||||||||||
Barclays Bank PLC | 16,700 | 10/05/22 | 2.765 | % | CPI | # | (1,193,083 | ) | ||||||||||||
| ALLIANCEBERNSTEIN MUNICIPAL BOND INFLATION STRATEGY • | 25 |
Portfolio of Investments
| Rate Type | ||||||||||||||||||||
Swap Counterparty | Notional Amount (000) | Termination Date | Payments made by the Fund | Payments received by the Fund | Unrealized Appreciation/ (Depreciation) | |||||||||||||||
Barclays Bank PLC | $ | 25,000 | 8/07/24 | 2.573 | % | CPI | # | $ | (840,599 | ) | ||||||||||
Barclays Bank PLC | 5,400 | 3/06/27 | 2.695 | % | CPI | # | (394,982 | ) | ||||||||||||
Citibank, NA | 10,000 | 5/04/16 | 2.710 | % | CPI | # | (495,634 | ) | ||||||||||||
Citibank, NA | 14,000 | 5/30/17 | 2.125 | % | CPI | # | (387,448 | ) | ||||||||||||
Citibank, NA | 11,500 | 6/21/17 | 2.153 | % | CPI | # | (330,655 | ) | ||||||||||||
Citibank, NA | 22,000 | 7/02/18 | 2.084 | % | CPI | # | (285,874 | ) | ||||||||||||
Citibank, NA | 9,000 | 6/29/22 | 2.398 | % | CPI | # | (374,907 | ) | ||||||||||||
Citibank, NA | 5,400 | 7/19/22 | 2.400 | % | CPI | # | (213,037 | ) | ||||||||||||
Citibank, NA | 4,000 | 8/10/22 | 2.550 | % | CPI | # | (210,314 | ) | ||||||||||||
Citibank, NA | 15,500 | 12/07/22 | 2.748 | % | CPI | # | (1,150,089 | ) | ||||||||||||
Citibank, NA | 47,000 | 5/24/23 | 2.533 | % | CPI | # | (2,079,314 | ) | ||||||||||||
Citibank, NA | 30,000 | 10/29/23 | 2.524 | % | CPI | # | (1,077,220 | ) | ||||||||||||
Citibank, NA | 15,800 | 2/08/28 | 2.940 | % | CPI | # | (1,586,827 | ) | ||||||||||||
Deutsche Bank AG | 11,000 | 6/20/21 | 2.655 | % | CPI | # | (803,308 | ) | ||||||||||||
Deutsche Bank AG | 9,800 | 9/07/21 | 2.400 | % | CPI | # | (451,475 | ) | ||||||||||||
JPMorgan Chase Bank, NA | 1,000 | 7/29/20 | 2.305 | % | CPI | # | (28,204 | ) | ||||||||||||
JPMorgan Chase Bank, NA | 19,000 | 8/17/22 | 2.523 | % | CPI | # | (931,959 | ) | ||||||||||||
JPMorgan Chase Bank, NA | 1,400 | 6/30/26 | 2.890 | % | CPI | # | (154,991 | ) | ||||||||||||
JPMorgan Chase Bank, NA | 3,300 | 7/21/26 | 2.935 | % | CPI | # | (393,754 | ) | ||||||||||||
JPMorgan Chase Bank, NA | 2,400 | 10/03/26 | 2.485 | % | CPI | # | (111,191 | ) | ||||||||||||
JPMorgan Chase Bank, NA | 5,400 | 11/14/26 | 2.488 | % | CPI | # | (253,618 | ) | ||||||||||||
JPMorgan Chase Bank, NA | 4,850 | 12/23/26 | 2.484 | % | CPI | # | (213,146 | ) | ||||||||||||
JPMorgan Chase Bank, NA | 21,350 | 2/20/28 | 2.899 | % | CPI | # | (1,987,765 | ) | ||||||||||||
JPMorgan Chase Bank, NA | 12,000 | 3/26/28 | 2.880 | % | CPI | # | (1,066,943 | ) | ||||||||||||
Morgan Stanley Capital Services LLC | 6,000 | 4/05/16 | 2.535 | % | CPI | # | (232,454 | ) | ||||||||||||
Morgan Stanley Capital Services LLC | 6,000 | 4/16/16 | 2.110 | % | CPI | # | (118,186 | ) | ||||||||||||
Morgan Stanley Capital Services LLC | 50,000 | 4/16/18 | 2.395 | % | CPI | # | (1,786,344 | ) | ||||||||||||
Morgan Stanley Capital Services LLC | 2,000 | 10/14/20 | 2.370 | % | CPI | # | (65,211 | ) | ||||||||||||
Morgan Stanley Capital Services LLC | 13,000 | 5/23/21 | 2.680 | % | CPI | # | (951,364 | ) | ||||||||||||
Morgan Stanley Capital Services LLC | 10,000 | 4/16/23 | 2.690 | % | CPI | # | (615,382 | ) | ||||||||||||
Morgan Stanley Capital Services LLC | 5,000 | 8/15/26 | 2.885 | % | CPI | # | (552,790 | ) | ||||||||||||
|
| |||||||||||||||||||
| $ | (25,957,551 | ) | ||||||||||||||||||
|
| |||||||||||||||||||
| # | Variable interest rate based on the rate of inflation as determined by the Consumer Price Index (CPI). |
| (a) | Variable rate coupon, rate shown as of October 31, 2014. |
| (b) | Position, or a portion thereof, has been segregated to collateralize OTC derivatives outstanding. |
| (c) | To obtain a copy of the fund’s financial statements, please go to the Securities and Exchange Commission’s website at www.sec.gov, or call AllianceBernstein at (800) 227-4618. |
| (d) | Investment in affiliated money market mutual fund. The rate shown represents the 7-day yield as of period end. |
As of October 31, 2014, the Strategy’s percentages of investments in municipal bonds that are insured and in insured municipal bonds that have been pre-refunded or escrowed to maturity are 7.16% and 0.70%, respectively.
| 26 | • ALLIANCEBERNSTEIN MUNICIPAL BOND INFLATION STRATEGY |
Portfolio of Investments
Glossary:
AGM – Assured Guaranty Municipal
AMBAC – Ambac Assurance Corporation
COP – Certificate of Participation
CPI – Consumer Price Index
DOT – Department of Transportation
EDA – Economic Development Agency
ETM – Escrowed to Maturity
NATL – National Interstate Corporation
SRF – State Revolving Fund
See notes to financial statements.
| ALLIANCEBERNSTEIN MUNICIPAL BOND INFLATION STRATEGY • | 27 |
Portfolio of Investments
STATEMENT OF ASSETS & LIABILITIES
October 31, 2014
| Assets | ||||
Investments in securities, at value | ||||
Unaffiliated issuers (cost $844,044,025) | $ | 866,802,846 | ||
Affiliated issuers (cost $8,377,170) | 8,377,170 | |||
Interest receivable | 11,007,843 | |||
Receivable for capital stock sold | 1,063,268 | |||
Receivable for investment securities sold | 105,000 | |||
|
| |||
Total assets | 887,356,127 | |||
|
| |||
| Liabilities | ||||
Unrealized depreciation on inflation swaps | 25,957,551 | |||
Payable for capital stock redeemed | 591,464 | |||
Advisory fee payable | 357,556 | |||
Distribution fee payable | 71,987 | |||
Administrative fee payable | 19,039 | |||
Transfer Agent fee payable | 11,092 | |||
Dividends payable | 86 | |||
Accrued expenses | 141,033 | |||
|
| |||
Total liabilities | 27,149,808 | |||
|
| |||
Net Assets | $ | 860,206,319 | ||
|
| |||
| Composition of Net Assets | ||||
Capital stock, at par | $ | 82,216 | ||
Additional paid-in capital | 865,501,232 | |||
Undistributed net investment income | 1,011,224 | |||
Accumulated net realized loss on investment transactions | (3,189,623 | ) | ||
Net unrealized depreciation on investments | (3,198,730 | ) | ||
|
| |||
| $ | 860,206,319 | |||
|
|
Net Asset Value Per Share—27 billion shares of capital stock authorized, $.001 par value
| Class | Net Assets | Shares Outstanding | Net Asset Value | |||||||||
| ||||||||||||
| A | $ | 60,016,203 | 5,728,367 | $ | 10.48 | * | ||||||
| ||||||||||||
| C | $ | 20,872,776 | 1,996,322 | $ | 10.46 | |||||||
| ||||||||||||
| Advisor | $ | 185,105,673 | 17,658,644 | $ | 10.48 | |||||||
| ||||||||||||
| 1 | $ | 408,307,285 | 39,059,724 | $ | 10.45 | |||||||
| ||||||||||||
| 2 | $ | 185,904,382 | 17,772,831 | $ | 10.46 | |||||||
| ||||||||||||
| * | The maximum offering price per share for Class A shares was $10.80 which reflects a sales charge of 3.0%. |
See notes to financial statements.
| 28 | • ALLIANCEBERNSTEIN MUNICIPAL BOND INFLATION STRATEGY |
Statement of Assets & Liabilities
STATEMENT OF OPERATIONS
Year Ended October 31, 2014
| Investment Income | ||||||||
Interest | $ | 18,378,288 | ||||||
Dividends—Affiliated issuers | 10,724 | $ | 18,389,012 | |||||
|
| |||||||
| Expenses | ||||||||
Advisory fee (see Note B) | 4,497,915 | |||||||
Distribution fee—Class A | 236,100 | |||||||
Distribution fee—Class C | 242,488 | |||||||
Distribution fee—Class 1 | 448,029 | |||||||
Transfer agency—Class A | 30,408 | |||||||
Transfer agency—Class C | 9,699 | |||||||
Transfer agency—Advisor Class | 66,834 | |||||||
Transfer agency—Class 1 | 26 | |||||||
Transfer agency—Class 2 | 10 | |||||||
Custodian | 199,535 | |||||||
Registration fees | 79,937 | |||||||
Audit and tax | 77,376 | |||||||
Administrative | 60,253 | |||||||
Printing | 44,030 | |||||||
Legal | 40,487 | |||||||
Directors’ fees | 7,742 | |||||||
Miscellaneous | 36,317 | |||||||
|
| |||||||
Total expenses | 6,077,186 | |||||||
Less: expenses waived and reimbursed by the Adviser (see Note B) | (650,568 | ) | ||||||
|
| |||||||
Net expenses | 5,426,618 | |||||||
|
| |||||||
Net investment income | 12,962,394 | |||||||
|
| |||||||
| Realized and Unrealized Gain (Loss) on Investment Transactions | ||||||||
Net realized loss on: | ||||||||
Investment transactions | (3,013,104 | ) | ||||||
Swaps | (176,519 | ) | ||||||
Net change in unrealized appreciation/ | ||||||||
Investments | 25,199,302 | |||||||
Swaps | (11,829,179 | ) | ||||||
|
| |||||||
Net gain on investment transactions | 10,180,500 | |||||||
|
| |||||||
Net Increase in Net Assets from Operations | $ | 23,142,894 | ||||||
|
|
See notes to financial statements.
| ALLIANCEBERNSTEIN MUNICIPAL BOND INFLATION STRATEGY • | 29 |
Statement of Operations
STATEMENT OF CHANGES IN NET ASSETS
| Year Ended October 31, 2014 | Year Ended October 31, 2013 | |||||||
| Increase (Decrease) in Net Assets from Operations | ||||||||
Net investment income | $ | 12,962,394 | $ | 9,598,410 | ||||
Net realized gain (loss) on investment transactions | (3,189,623 | ) | 46,823 | |||||
Net change in unrealized appreciation/depreciation of investments | 13,370,123 | (36,238,100 | ) | |||||
|
|
|
| |||||
Net increase (decrease) in net assets from operations | 23,142,894 | (26,592,867 | ) | |||||
| Dividends and Distributions to Shareholders from | ||||||||
Net investment income | ||||||||
Class A | (916,215 | ) | (1,074,315 | ) | ||||
Class C | (109,940 | ) | (132,143 | ) | ||||
Advisor Class | (2,396,855 | ) | (1,802,696 | ) | ||||
Class 1 | (6,290,282 | ) | (4,310,206 | ) | ||||
Class 2 | (2,769,394 | ) | (2,053,393 | ) | ||||
Net realized gain on investment transactions | ||||||||
Class A | (2,586 | ) | (135,299 | ) | ||||
Class C | (790 | ) | (58,740 | ) | ||||
Advisor Class | (4,191 | ) | (140,734 | ) | ||||
Class 1 | (12,245 | ) | (388,019 | ) | ||||
Class 2 | (5,233 | ) | (156,157 | ) | ||||
| Capital Stock Transactions | ||||||||
Net increase (decrease) | (58,073,019 | ) | 414,744,535 | |||||
|
|
|
| |||||
Total increase (decrease) | (47,437,856 | ) | 377,899,966 | |||||
| Net Assets | ||||||||
Beginning of period | 907,644,175 | 529,744,209 | ||||||
|
|
|
| |||||
End of period (including undistributed net investment income of $1,011,224 and $534,279, respectively) | $ | 860,206,319 | $ | 907,644,175 | ||||
|
|
|
| |||||
See notes to financial statements.
| 30 | • ALLIANCEBERNSTEIN MUNICIPAL BOND INFLATION STRATEGY |
Statement of Changes in Net Assets
NOTES TO FINANCIAL STATEMENTS
October 31, 2014
NOTE A
Significant Accounting Policies
AllianceBernstein Bond Fund, Inc. (the “Fund”) is registered under the Investment Company Act of 1940 as an open-end management investment company. The Fund, which is a Maryland corporation, operates as a series company comprised of nine portfolios currently in operation: the Intermediate Bond Portfolio, the Bond Inflation Strategy Portfolio, the Municipal Bond Inflation Strategy Portfolio, the Real Asset Strategy Portfolio, the Government Reserves Portfolio, the Tax-Aware Fixed Income Portfolio, the Limited Duration High Income Portfolio, the AllianceBernstein Credit Long/Short Portfolio and the AllianceBernstein High Yield Portfolio. They are each diversified Portfolios, with the exception of the Limited Duration High Income Portfolio, which is non-diversified. The Government Reserves Portfolio commenced operations on May 1, 2013. The Tax-Aware Fixed Income Portfolio commenced operations on December 11, 2013. The AllianceBernstein Credit Long/Short Portfolio commenced operations on May 7, 2014. The AllianceBernstein High Yield Portfolio commenced operations July 15, 2014. Each Portfolio is considered to be a separate entity for financial reporting and tax purposes. This report relates only to the Municipal Bond Inflation Strategy Portfolio (the “Strategy”). The Strategy offers Class A, Class C, Advisor Class, Class 1 and Class 2 shares. Class B shares are not publically offered. Class 1 shares are sold only to the private clients of Sanford C. Bernstein & Co. LLC by its registered representatives. Class R, Class K and Class I shares have been authorized by the Strategy but are not currently being offered. Class A shares are sold with a front-end sales charge of up to 3.0% for purchases not exceeding $500,000. With respect to purchases of $500,000 or more, Class A shares redeemed within one year of purchase may be subject to a contingent deferred sales charge of 1%. Class C shares are subject to a contingent deferred sales charge of 1% on redemptions made within the first year after purchase. Advisor Class, Class I, and Class 2 shares are sold without an initial or contingent deferred sales charge and are not subject to ongoing distribution expenses. All nine classes of shares have identical voting, dividend, liquidation and other rights, except that the classes bear different distribution and transfer agency expenses. Each class has exclusive voting rights with respect to its distribution plan. The financial statements have been prepared in conformity with U.S. generally accepted accounting principles (“U.S. GAAP”) which require management to make certain estimates and assumptions that affect the reported amounts of assets and liabilities in the financial statements and amounts of income and expenses during the reporting period. Actual results could differ from those estimates. The following is a summary of significant accounting policies followed by the Strategy.
1. Security Valuation
Portfolio securities are valued at their current market value determined on the basis of market quotations or, if market quotations are not readily available or are deemed unreliable, at “fair value” as determined in accordance with procedures established by and under the general supervision of the Fund’s Board of Directors (the “Board”).
| ALLIANCEBERNSTEIN MUNICIPAL BOND INFLATION STRATEGY • | 31 |
Notes to Financial Statements
In general, the market values of securities which are readily available and deemed reliable are determined as follows: securities listed on a national securities exchange (other than securities listed on the NASDAQ Stock Market, Inc. (“NASDAQ”)) or on a foreign securities exchange are valued at the last sale price at the close of the exchange or foreign securities exchange. If there has been no sale on such day, the securities are valued at the last traded price from the previous day. Securities listed on more than one exchange are valued by reference to the principal exchange on which the securities are traded; securities listed only on NASDAQ are valued in accordance with the NASDAQ Official Closing Price; listed or over the counter (“OTC”) market put or call options are valued at the mid level between the current bid and ask prices. If either a current bid or current ask price is unavailable, AllianceBernstein L.P. (the “Adviser”) will have discretion to determine the best valuation (e.g. last trade price in the case of listed options); open futures are valued using the closing settlement price or, in the absence of such a price, the most recent quoted bid price. If there are no quotations available for the day of valuation, the last available closing settlement price is used; U.S. government securities and other debt instruments having 60 days or less remaining until maturity are valued at amortized cost if their original maturity was 60 days or less. If the original term to maturity exceeded 60 days, the securities are valued by a pricing service, if a market price is available. If a market price is not available, the securities are valued by using amortized cost as of the 61st day prior to maturity. Fixed-income securities, including mortgage-backed and asset-backed securities, may be valued on the basis of prices provided by a pricing service or at a price obtained from one or more of the major broker-dealers. In cases where broker-dealer quotes are obtained, the Adviser may establish procedures whereby changes in market yields or spreads are used to adjust, on a daily basis, a recently obtained quoted price on a security. Swaps and other derivatives are valued daily, primarily using independent pricing services, independent pricing models using market inputs, as well as third party broker-dealers or counterparties. Investment companies are valued at their net asset value each day.
Securities for which market quotations are not readily available (including restricted securities) or are deemed unreliable are valued at fair value. Factors considered in making this determination may include, but are not limited to, information obtained by contacting the issuer, analysts, analysis of the issuer’s financial statements or other available documents. In addition, the Strategy may use fair value pricing for securities primarily traded in non-U.S. markets because most foreign markets close well before the Strategy values its securities at 4:00 p.m., Eastern Time. The earlier close of these foreign markets gives rise to the possibility that significant events, including broad market moves, may have occurred in the interim and may materially affect the value of those securities.
| 32 | • ALLIANCEBERNSTEIN MUNICIPAL BOND INFLATION STRATEGY |
Notes to Financial Statements
2. Fair Value Measurements
In accordance with U.S. GAAP regarding fair value measurements, fair value is defined as the price that the Strategy would receive to sell an asset or pay to transfer a liability in an orderly transaction between market participants at the measurement date. U.S. GAAP establishes a framework for measuring fair value, and a three-level hierarchy for fair value measurements based upon the transparency of inputs to the valuation of an asset or liability (including those valued based on their market values as described in Note A.1 above). Inputs may be observable or unobservable and refer broadly to the assumptions that market participants would use in pricing the asset or liability. Observable inputs reflect the assumptions market participants would use in pricing the asset or liability based on market data obtained from sources independent of the Strategy. Unobservable inputs reflect the Strategy’s own assumptions about the assumptions that market participants would use in pricing the asset or liability based on the best information available in the circumstances. Each investment is assigned a level based upon the observability of the inputs which are significant to the overall valuation. The three-tier hierarchy of inputs is summarized below.
| • | Level 1—quoted prices in active markets for identical investments |
| • | Level 2—other significant observable inputs (including quoted prices for similar investments, interest rates, prepayment speeds, credit risk, etc.) |
| • | Level 3—significant unobservable inputs (including the Strategy’s own assumptions in determining the fair value of investments) |
The fair value of debt instruments, such as bonds, and over-the-counter derivatives is generally based on market price quotations, recently executed market transactions (where observable) or industry recognized modeling techniques and are generally classified as Level 2. Pricing vendor inputs to Level 2 valuations may include quoted prices for similar investments in active markets, interest rates, coupon rates, yield curves, option adjusted spreads, default rates, credit spreads and other unique security features in order to estimate the relevant cash flows which is then discounted to calculate fair values. If these inputs are unobservable and significant to the fair value, these investments will be classified as Level 3. In addition, non-agency rated investments are classified as Level 3.
Other fixed income investments, including non-U.S. government and corporate debt, are generally valued using quoted market prices, if available, which are typically impacted by current interest rates, maturity dates and any perceived credit risk of the issuer. Additionally, in the absence of quoted market prices, these inputs are used by pricing vendors to derive a valuation based upon industry or proprietary models which incorporate issuer specific data with relevant yield/spread comparisons with more widely quoted bonds with similar key characteristics. Those investments for which there are observable inputs are classified as Level 2. Where the inputs are not observable, the investments are classified as Level 3.
| ALLIANCEBERNSTEIN MUNICIPAL BOND INFLATION STRATEGY • | 33 |
Notes to Financial Statements
The following table summarizes the valuation of the Strategy’s investments by the above fair value hierarchy levels as of October 31, 2014:
Investments in Securities: | Level 1 | Level 2 | Level 3 | Total | ||||||||||||
Assets: | ||||||||||||||||
Long-Term Municipal Bonds | $ | – 0 | – | $ | 821,857,130 | $ | 3,858,510 | $ | 825,715,640 | |||||||
Corporates—Investment Grade | – 0 | – | 34,068,050 | – 0 | – | 34,068,050 | ||||||||||
Agencies | – 0 | – | 5,719,546 | – 0 | – | 5,719,546 | ||||||||||
Short-Term Investments: | ||||||||||||||||
Investment Companies | 8,377,170 | – 0 | – | – 0 | – | 8,377,170 | ||||||||||
U.S. Treasury Bills | – 0 | – | 1,299,610 | – 0 | – | 1,299,610 | ||||||||||
|
|
|
|
|
|
|
| |||||||||
Total Investments in Securities | 8,377,170 | 862,944,336 | 3,858,510 | 875,180,016 | ||||||||||||
Other Financial Instruments*: | ||||||||||||||||
Liabilities: | ||||||||||||||||
Inflation Swaps | – 0 | – | (25,957,551 | ) | – 0 | – | (25,957,551 | ) | ||||||||
|
|
|
|
|
|
|
| |||||||||
Total^ | $ | 8,377,170 | $ | 836,986,785 | $ | 3,858,510 | $ | 849,222,465 | ||||||||
|
|
|
|
|
|
|
| |||||||||
| * | Other financial instruments are derivative instruments, such as futures, forwards and swaps, which are valued at the unrealized appreciation/depreciation on the instrument. |
| ^ | There were no transfers between any levels during the reporting period |
The Strategy recognizes all transfers between levels of the fair value hierarchy assuming the financial instruments were transferred at the beginning of the reporting period.
The following is a reconciliation of investments in which significant unobservable inputs (Level 3) were used in determining fair value.
| Long-Term Municipal Bonds | Total | |||||||
Balance as of 10/31/13 | $ | 1,406,832 | $ | 1,406,832 | ||||
Accrued discounts/(premiums) | (16,638 | ) | (16,638 | ) | ||||
Realized gain (loss) | 339 | 339 | ||||||
Change in unrealized appreciation/depreciation | 107,977 | 107,977 | ||||||
Purchases | 2,390,000 | 2,390,000 | ||||||
Sales | (30,000 | ) | (30,000 | ) | ||||
Transfers in to Level 3 | – 0 | – | – 0 | – | ||||
Transfers out of Level 3 | – 0 | – | – 0 | – | ||||
|
|
|
| |||||
Balance as of 10/31/14 | $ | 3,858,510 | $ | 3,858,510 | ||||
|
|
|
| |||||
Net change in unrealized appreciation/depreciation from investments held as of 10/31/14* | $ | 108,367 | $ | 108,367 | ||||
|
|
|
| |||||
| * | The unrealized appreciation/depreciation is included in the net change in unrealized appreciation/depreciation of investments in the accompanying statement of operations. |
As of October 31, 2014 all level 3 securities were priced by third party vendors.
The Adviser has established a Valuation Committee (the “Committee”) which is responsible for overseeing the pricing and valuation of all securities held in the Strategy. The Committee operates under pricing and valuation policies and procedures established by the Adviser and approved by the Board, including
| 34 | • ALLIANCEBERNSTEIN MUNICIPAL BOND INFLATION STRATEGY |
Notes to Financial Statements
pricing policies which set forth the mechanisms and processes to be employed on a daily basis to implement these policies and procedures. In particular, the pricing policies describe how to determine market quotations for securities and other instruments. The Committee’s responsibilities include: 1) fair value and liquidity determinations (and oversight of any third parties to whom any responsibility for fair value and liquidity determinations is delegated), and 2) regular monitoring of the Adviser’s pricing and valuation policies and procedures and modification or enhancement of these policies and procedures (or recommendation of the modification of these policies and procedures) as the Committee believes appropriate.
The Committee is also responsible for monitoring the implementation of the pricing policies by the Adviser’s Pricing Group (the “Pricing Group”) and a third party which performs certain pricing functions in accordance with the pricing policies. The Pricing Group is responsible for the oversight of the third party on a day-to-day basis. The Committee and the Pricing Group perform a series of activities to provide reasonable assurance of the accuracy of prices including: 1) periodic vendor due diligence meetings, review of methodologies, new developments and processes at vendors, 2) daily comparison of security valuation versus prior day for all securities that exceeded established thresholds, and 3) daily review of unpriced, stale, and variance reports with exceptions reviewed by senior management and the Committee.
In addition, several processes outside of the pricing process are used to monitor valuation issues including: 1) performance and performance attribution reports are monitored for anomalous impacts based upon benchmark performance, and 2) portfolio managers review all portfolios for performance and analytics (which are generated using the Adviser’s prices).
3. Taxes
It is the Strategy’s policy to meet the requirements of the Internal Revenue Code applicable to regulated investment companies and to distribute all of its investment company taxable income and net realized gains, if any, to shareholders. Therefore, no provisions for federal income or excise taxes are required.
In accordance with U.S. GAAP requirements regarding accounting for uncertainties in income taxes, management has analyzed the Strategy’s tax positions taken or expected to be taken on federal and state income tax returns for all open tax years (the current and the prior three tax years) and has concluded that no provision for income tax is required in the Strategy’s financial statements.
4. Investment Income and Investment Transactions
Dividend income is recorded on the ex-dividend date or as soon as the Strategy is informed of the dividend. Interest income is accrued daily. Investment transactions are accounted for on the date the securities are purchased or sold. Investment gains or losses are determined on the identified cost basis. The
| ALLIANCEBERNSTEIN MUNICIPAL BOND INFLATION STRATEGY • | 35 |
Notes to Financial Statements
Strategy amortizes premiums and accretes original issue discounts and market discounts as adjustments to interest income.
5. Class Allocations
All income earned and expenses incurred by the Strategy are borne on a pro-rata basis by each outstanding class of shares, based on the proportionate interest in the Strategy represented by the net assets of such class, except for class specific expenses which are allocated to the respective class. Expenses of the Fund are charged proportionately to each Strategy or based on other appropriate methods. Realized and unrealized gains and losses are allocated among the various share classes based on respective net assets.
6. Dividends and Distributions
Dividends and distributions to shareholders, if any, are recorded on the ex-dividend date. Income dividends and capital gains distributions are determined in accordance with federal tax regulations and may differ from those determined in accordance with U.S. GAAP. To the extent these differences are permanent, such amounts are reclassified within the capital accounts based on their federal tax basis treatment; temporary differences do not require such reclassification.
NOTE B
Advisory Fee and Other Transactions with Affiliates
Under the terms of the investment advisory agreement, the Strategy pays the Adviser an advisory fee at an annual rate of .50% of the first $2.5 billion, .45% of the next $2.5 billion and .40% in excess of $5 billion, of the Strategy’s average daily net assets. The fee is accrued daily and paid monthly. The Adviser has agreed to waive its fees and bear certain expenses to the extent necessary to limit total operating expenses on an annual basis to .80%, 1.50%, .50%, .60% and .50% of the daily average net assets for the Class A, Class C, Advisor Class, Class 1 and Class 2 shares, respectively. This fee waiver and/or expense reimbursement agreement will remain in effect until January 31, 2015 and then may be extended by the Adviser for additional one-year terms. For the year ended October 31, 2014, such reimbursement amounted to $650,568.
Pursuant to the investment advisory agreement, the Strategy may reimburse the Adviser for certain legal and accounting services provided to the Strategy by the Adviser. For the year ended October 31, 2014, the reimbursement for such services amounted to $60,253.
The Strategy compensates AllianceBernstein Investor Services, Inc. (“ABIS”), a wholly-owned subsidiary of the Adviser, under a Transfer Agency Agreement for providing personnel and facilities to perform transfer agency services for the Strategy. ABIS may make payments to intermediaries that provide omnibus account services, sub-accounting services and/or networking services. Such compensation retained by ABIS amounted to $46,498 for the year ended October 31, 2014.
| 36 | • ALLIANCEBERNSTEIN MUNICIPAL BOND INFLATION STRATEGY |
Notes to Financial Statements
AllianceBernstein Investments, Inc. (the “Distributor”), a wholly-owned subsidiary of the Adviser, serves as the distributor of the Strategy’s shares. The Distributor has advised the Strategy that it has retained front-end sales charges of $0 from the sale of Class A shares and received $35,125 and $4,148 in contingent deferred sales charges imposed upon redemptions by shareholders of Class A and Class C shares, respectively, for the year ended October 31, 2014.
The Strategy may invest in the AllianceBernstein Fixed-Income Shares, Inc. – Government STIF Portfolio (“Government STIF Portfolio”), an open-end management investment company managed by the Adviser. The Government STIF Portfolio is offered as a cash management option to mutual funds and other institutional accounts of the Adviser, and is not available for direct purchase by members of the public. The Government STIF Portfolio pays no investment management fees but does bear its own expenses. A summary of the Strategy’s transactions in shares of the Government STIF Portfolio for the year ended October 31, 2014 is as follows:
Market Value October 31, 2013 (000) | Purchases at Cost (000) | Sales Proceeds (000) | Market Value October 31, 2014 (000) | Dividend Income (000) | ||||||||||||
| $ 4,287 | $ | 261,881 | $ | 257,791 | $ | 8,377 | $ | 11 | ||||||||
NOTE C
Distribution Services Agreement
The Strategy has adopted a Distribution Services Agreement (the “Agreement”) pursuant to Rule 12b-1 under the Investment Company Act of 1940. Under the Agreement, the Strategy pays distribution and servicing fees to the Distributor at an annual rate of up to .30% of the Strategy’s average daily net assets attributable to Class A shares, 1% of the Strategy’s average daily net assets attributable to Class C shares and .10% of the Strategy’s average daily net assets attributable to Class 1 shares. There are no distribution and servicing fees on the Advisor Class and Class 2 shares. The fees are accrued daily and paid monthly. The Agreement provides that the Distributor will use such payments in their entirety for distribution assistance and promotional activities. Since the commencement of the Strategy’s operations, the Distributor has incurred expenses in excess of the distribution costs reimbursed by the Strategy in the amount of $291,434 and $1,666,557 for Class C and Class 1 shares, respectively. While such costs may be recovered from the Strategy in future periods so long as the Agreement is in effect, the rate of the distribution and servicing fees payable under the Agreement may not be increased without a shareholder vote. In accordance with the Agreement, there is no provision for recovery of unreimbursed distribution costs incurred by the Distributor beyond the current fiscal year for Class A shares. The Agreement also provides that the Adviser may use its own resources to finance the distribution of the Strategy’s shares.
| ALLIANCEBERNSTEIN MUNICIPAL BOND INFLATION STRATEGY • | 37 |
Notes to Financial Statements
NOTE D
Investment Transactions
Purchases and sales of investment securities (excluding short-term investments) for the year ended October 31, 2014 were as follows:
| Purchases | Sales | |||||||
Investment securities (excluding | $ | 158,118,153 | $ | 206,863,602 | ||||
The cost of investments for federal income tax purposes, gross unrealized appreciation and unrealized depreciation (excluding swap transactions) are as follows:
Cost | $ | 852,421,195 | ||
|
| |||
Gross unrealized appreciation | $ | 23,350,889 | ||
Gross unrealized depreciation | (592,068 | ) | ||
|
| |||
Net unrealized appreciation | $ | 22,758,821 | ||
|
|
1. Derivative Financial Instruments
The Strategy may use derivatives in an effort to earn income and enhance returns, to replace more traditional direct investments, to obtain exposure to otherwise inaccessible markets (collectively, “investment purposes”), or to hedge or adjust the risk profile of its portfolio.
The principal type of derivatives utilized by the Strategy, as well as the methods in which they may be used are:
| • | Swaps |
The Strategy may enter into swaps to hedge its exposure to interest rates or credit risk. A swap is an agreement that obligates two parties to exchange a series of cash flows at specified intervals based upon or calculated by reference to changes in specified prices or rates for a specified amount of an underlying asset. The payment flows are usually netted against each other, with the difference being paid by one party to the other. In addition, collateral may be pledged or received by the Strategy in accordance with the terms of the respective swaps to provide value and recourse to the Strategy or its counterparties in the event of default, bankruptcy or insolvency by one of the parties to the swap.
Risks may arise as a result of the failure of the counterparty to the swap to comply with the terms of the swap. The loss incurred by the failure of a counterparty is generally limited to the net interim payment to be received by the Strategy, and/or the termination value at the end of the contract. Therefore, the Strategy considers the creditworthiness of each counterparty to a swap in evaluating potential counterparty risk. This risk is mitigated by having a netting arrangement between the Strategy and the counterparty and by the posting of collateral by the counterparty to the Strategy to
| 38 | • ALLIANCEBERNSTEIN MUNICIPAL BOND INFLATION STRATEGY |
Notes to Financial Statements
cover the Strategy’s exposure to the counterparty. Additionally, risks may arise from unanticipated movements in interest rates or in the value of the underlying securities. The Strategy accrues for the interim payments on swaps on a daily basis, with the net amount recorded within unrealized appreciation/depreciation of swaps on the statement of assets and liabilities, where applicable. Once the interim payments are settled in cash, the net amount is recorded as realized gain/(loss) on swaps on the statement of operations, in addition to any realized gain/(loss) recorded upon the termination of swaps. Upfront premiums paid or received are recognized as cost or proceeds on the statement of assets and liabilities and are amortized on a straight line basis over the life of the contract. Amortized upfront premiums are included in net realized gain/(loss) from swaps on the statement of operations. Fluctuations in the value of swaps are recorded as a component of net change in unrealized appreciation/depreciation of swaps on the statement of operations.
Inflation (CPI) Swaps:
Inflation swaps are contracts in which one party agrees to pay the cumulative percentage increase in a price index (the Consumer Price Index with respect to CPI swaps) over the term of the swap (with some lag on the inflation index), and the other pays a compounded fixed rate. Inflation swaps may be used to protect the net asset value, or NAV, of a Strategy against an unexpected change in the rate of inflation measured by an inflation index since the value of these agreements is expected to increase if unexpected inflation increases.
During the year ended October 31, 2014, the Strategy held inflation (CPI) swaps for hedging purposes.
The Strategy typically enters into International Swaps and Derivatives Association, Inc. Master Agreements (“ISDA Master Agreement”) or similar master agreements (collectively, “Master Agreements”) with its OTC derivative contract counterparties in order to, among other things, reduce its credit risk to counterparties. ISDA Master Agreements include provisions for general obligations, representations, collateral and events of default or termination. Under an ISDA Master Agreement, the Strategy typically may offset with the counterparty certain derivative financial instrument’s payables and/or receivables with collateral held and/or posted and create one single net payment (close-out netting) in the event of default or termination.
Various Master Agreements govern the terms of certain transactions with counterparties, including transactions such as exchange-traded derivative transactions, repurchase and reverse repurchase agreements. These Master Agreements typically attempt to reduce the counterparty risk associated with such transactions by specifying credit protection mechanisms and providing standardization that improves legal certainty. Cross-termination provisions under Master Agreements
| ALLIANCEBERNSTEIN MUNICIPAL BOND INFLATION STRATEGY • | 39 |
Notes to Financial Statements
typically provide that a default in connection with one transaction between the Strategy and a counterparty gives the non-defaulting party the right to terminate any other transactions in place with the defaulting party to create one single net payment due to/due from the defaulting party. In the event of a default by a Master Agreements counterparty, the return of collateral with market value in excess of the Strategy’s net liability, held by the defaulting party, may be delayed or denied.
The Strategy’s Master Agreements may contain provisions for early termination of OTC derivative transactions in the event the net assets of the Strategy decline below specific levels (“net asset contingent features”). If these levels are triggered, the Strategy’s counterparty has the right to terminate such transaction and require the Strategy to pay or receive a settlement amount in connection with the terminated transaction. For additional details, please refer to netting arrangements by counterparty tables below.
At October 31, 2014, the Strategy had entered into the following derivatives:
Asset Derivatives | Liability Derivatives | |||||||||
Derivative Type | Statement of | Fair Value | Statement of | Fair Value | ||||||
Interest rate contracts | Unrealized depreciation on inflation swaps | $ | 25,957,551 |
| ||||||
|
| |||||||||
Total | $ | 25,957,551 | ||||||||
|
| |||||||||
The effect of derivative instruments on the statement of operations for the year ended October 31, 2014:
Derivative Type | Location of Gain | Realized Gain or (Loss) on Derivatives | Change in Unrealized Appreciation or (Depreciation) | |||||||
Interest rate contracts | Net realized gain (loss) on swaps; Net change in unrealized appreciation/depreciation of swaps | $ | (176,519 | ) | $ | (11,829,179 | ) | |||
|
|
|
| |||||||
Total | $ | (176,519 | ) | $ | (11,829,179 | ) | ||||
|
|
|
| |||||||
The following table represents the volume of the Strategy’s derivative transactions during the year ended October 31, 2014:
Inflation Swaps: | ||||
Average notional amount | $ | 590,392,308 |
| 40 | • ALLIANCEBERNSTEIN MUNICIPAL BOND INFLATION STRATEGY |
Notes to Financial Statements
For financial reporting purposes, the Strategy does not offset derivative assets and derivative liabilities that are subject to netting arrangements in the statement of assets and liabilities.
All derivatives held at period end were subject to netting arrangements. The following table presents the Strategy’s derivative assets and liabilities by counterparty net of amounts available for offset under Master Agreements (“MA”) and net of the related collateral received/ pledged by the Strategy as of October 31, 2014:
Counterparty | Derivative Liabilities Subject to a MA | Derivative Available for Offset | Cash Collateral Pledged | Security Collateral Pledged* | Net Amount of Derivatives Liabilities | |||||||||||||||
OTC Derivatives: | ||||||||||||||||||||
Barclays Bank PLC | $ | 7,048,147 | $ | – 0 | – | $ | – 0 | – | $ | (7,048,147 | ) | $ | – 0 | – | ||||||
Citibank, NA | 8,191,319 | – 0 | – | – 0 | – | (8,191,319 | ) | – 0 | – | |||||||||||
Deutsche Bank AG | 1,254,783 | – 0 | – | – 0 | – | (1,153,654 | ) | 101,129 | ||||||||||||
JPMorgan Chase Bank, NA | 5,141,571 | – 0 | – | – 0 | – | (5,141,571 | ) | – 0 | – | |||||||||||
Morgan Stanley Capital Services LLC | 4,321,731 | – 0 | – | – 0 | – | (4,321,731 | ) | – 0 | – | |||||||||||
|
|
|
|
|
|
|
|
|
| |||||||||||
Total | $ | 25,957,551 | $ | – 0 | – | $ | – 0 | – | $ | (25,856,422 | ) | $ | 101,129 | ^ | ||||||
|
|
|
|
|
|
|
|
|
| |||||||||||
| * | The actual collateral received/pledged may be more than the amount reported due to overcollateralization. |
| ^ | Net amount represents the net receivable/payable that would be due from/to the counterparty in the event of default or termination. The net amount from OTC financial derivative instruments can only be netted across transactions governed under the same master agreement with the same counterparty. |
NOTE E
Capital Stock
Each class consists of 3,000,000,000 authorized shares. Transactions in capital shares for Class A, Class C, Advisor Class, Class 1 and Class 2 were as follows:
| Shares | Amount | |||||||||||||||||||
| Year Ended October 31, 2014 | Year Ended October 31, 2013 | Year Ended October 31, 2014 | Year Ended 2013 | |||||||||||||||||
|
| |||||||||||||||||||
| Class A | ||||||||||||||||||||
Shares sold | 1,381,976 | 6,974,968 | $ | 14,378,468 | $ | 74,440,982 | ||||||||||||||
| ||||||||||||||||||||
Shares issued in reinvestment of dividends and distributions | 64,886 | 82,038 | 676,433 | 870,145 | ||||||||||||||||
| ||||||||||||||||||||
Shares redeemed | (4,945,588 | ) | (5,212,924 | ) | (51,592,286 | ) | (54,662,914 | ) | ||||||||||||
| ||||||||||||||||||||
Net increase (decrease) | (3,498,726 | ) | 1,844,082 | $ | (36,537,385 | ) | $ | 20,648,213 | ||||||||||||
| ||||||||||||||||||||
| ALLIANCEBERNSTEIN MUNICIPAL BOND INFLATION STRATEGY • | 41 |
Notes to Financial Statements
| Shares | Amount | |||||||||||||||||||
| Year Ended October 31, 2014 | Year Ended October 31, 2013 | Year Ended October 31, 2014 | Year Ended 2013 | |||||||||||||||||
|
| |||||||||||||||||||
| Class C | ||||||||||||||||||||
Shares sold | 186,022 | 1,146,689 | $ | 1,936,753 | $ | 12,285,428 | ||||||||||||||
| ||||||||||||||||||||
Shares issued in reinvestment of dividends and distributions | 8,462 | 14,045 | 88,112 | 149,967 | ||||||||||||||||
| ||||||||||||||||||||
Shares redeemed | (1,079,313 | ) | (1,567,753 | ) | (11,205,231 | ) | (16,410,571 | ) | ||||||||||||
| ||||||||||||||||||||
Net decrease | (884,829 | ) | (407,019 | ) | $ | (9,180,366 | ) | $ | (3,975,176 | ) | ||||||||||
| ||||||||||||||||||||
| Advisor Class | ||||||||||||||||||||
Shares sold | 8,998,760 | 15,767,725 | $ | 93,830,198 | $ | 167,340,611 | ||||||||||||||
| ||||||||||||||||||||
Shares issued in reinvestment of dividends and distributions | 153,682 | 134,229 | 1,604,984 | 1,415,758 | ||||||||||||||||
| ||||||||||||||||||||
Shares redeemed | (8,845,646 | ) | (6,488,992 | ) | (91,557,536 | ) | (67,633,418 | ) | ||||||||||||
| ||||||||||||||||||||
Net increase | 306,796 | 9,412,962 | $ | 3,877,646 | $ | 101,122,951 | ||||||||||||||
| ||||||||||||||||||||
| Class 1 | ||||||||||||||||||||
Shares sold | 11,373,052 | 25,868,903 | $ | 118,277,228 | $ | 274,285,379 | ||||||||||||||
| ||||||||||||||||||||
Shares issued in reinvestment of dividends and distributions | 447,445 | 335,276 | 4,657,848 | 3,536,271 | ||||||||||||||||
| ||||||||||||||||||||
Shares redeemed | (13,388,007 | ) | (7,488,984 | ) | (139,824,360 | ) | (78,946,564 | ) | ||||||||||||
| ||||||||||||||||||||
Net increase (decrease) | (1,567,510 | ) | 18,715,195 | $ | (16,889,284 | ) | $ | 198,875,086 | ||||||||||||
| ||||||||||||||||||||
| Class 2 | ||||||||||||||||||||
Shares sold | 3,899,558 | 12,001,612 | $ | 40,622,722 | $ | 128,058,638 | ||||||||||||||
| ||||||||||||||||||||
Shares issued in reinvestment of dividends and distributions | 173,015 | 150,930 | 1,801,773 | 1,591,030 | ||||||||||||||||
| ||||||||||||||||||||
Shares redeemed | (4,031,011 | ) | (2,994,419 | ) | (41,768,125 | ) | (31,576,207 | ) | ||||||||||||
| ||||||||||||||||||||
Net increase | 41,562 | 9,158,123 | $ | 656,370 | $ | 98,073,461 | ||||||||||||||
| ||||||||||||||||||||
NOTE F
Risks Involved in Investing in the Strategy
Interest Rate Risk and Credit Risk—Interest rate risk is the risk that changes in interest rates will affect the value of the Strategy’s investments in fixed-income debt securities such as bonds or notes. Increases in interest rates may cause the value of the Strategy’s investments to decline. Credit risk is the risk that the issuer or guarantor of a debt security, or the counterparty to a derivative contract, will be unable or unwilling to make timely principal and/or interest payments, or to otherwise honor its obligations. The degree of risk for a particular
| 42 | • ALLIANCEBERNSTEIN MUNICIPAL BOND INFLATION STRATEGY |
Notes to Financial Statements
security may be reflected in its credit rating. Credit risk is greater for medium quality and lower-rated securities. Lower-rated debt securities and similar unrated securities (commonly known as “junk bonds”) have speculative elements or are predominantly speculative risks.
Inflation Risk—This is the risk that the value of assets or income from investments will be less in the future as inflation decreases the value of money. As inflation increases, the value of the Strategy’s assets can decline as can the value of the Strategy’s distributions. This risk is significantly greater for fixed-income securities with longer maturities.
Municipal Market Risk—This is the risk that special factors may adversely affect the value of municipal securities and have a significant effect on the yield or value of the Strategy’s investments in municipal securities. These factors include economic conditions, political or legislative changes, uncertainties related to the tax status of municipal securities, or the rights of investors in these securities. To the extent that the Strategy invests more of its assets in a particular state’s municipal securities, the Strategy may be vulnerable to events adversely affecting that state, including economic, political and regulatory occurrences, court decisions, terrorism and catastrophic natural disasters, such as hurricanes or earthquakes. The Strategy’s investments in certain municipal securities with principal and interest payments that are made from the revenues of a specific project or facility, and not general tax revenues, may have increased risks. Factors affecting the project or facility, such as local business or economic conditions, could have a significant effect on the project’s ability to make payments of principal and interest on these securities.
Derivatives Risk—The Strategy may enter into derivative transactions such as forwards, options, futures and swaps. Derivatives may be illiquid, difficult to price, and leveraged so that small changes may produce disproportionate losses for the Strategy, and subject to counterparty risk to a greater degree than more traditional investments. Derivatives may result in significant losses, including losses that are far greater than the value of the derivatives reflected in the statement of assets and liabilities.
Tax Risk—There is no guarantee that all of the Strategy’s income will remain exempt from federal or state income taxes. From time to time, the U.S. Government and the U.S. Congress consider changes in federal tax law that could limit or eliminate the federal tax exemption for municipal bond income, which would in effect reduce the net income received by shareholders from the Strategy by increasing taxes on that income. In such event, the Strategy’s NAV could also decline as yields on municipal bonds, which are typically lower than those on taxable bonds, would be expected to increase to approximately the yield of comparable taxable bonds. Actions or anticipated actions affecting the tax exempt status of municipal bonds could also result in significant shareholder redemptions of Strategy shares as investors anticipate adverse effects on the
| ALLIANCEBERNSTEIN MUNICIPAL BOND INFLATION STRATEGY • | 43 |
Notes to Financial Statements
Strategy or seek higher yields to offset the potential loss of the tax deduction. As a result, the Strategy would be required to maintain higher levels of cash to meet the redemptions, which would negatively affect the Strategy’s yield.
Duration Risk—Duration is the measure that relates the expected price volatility of a fixed-income security to changes in interest rates. The duration of a fixed-income security may be shorter than or equal to full maturity of a fixed-income security. Fixed-income securities with longer durations have more risk and will decrease in price as interest rates rise. For example, a fixed-income security with a duration of three years will decrease in value by approximately 3% if interest rates increase by 1%.
Below Investment Grade Securities Risk—Investments in fixed-income securities with lower ratings (commonly known as “junk bonds”) tend to have a higher probability that an issuer will default or fail to meet its payment obligations. These securities may be subject to greater price volatility due to such factors as specific corporate developments, interest rate sensitivity, negative performance of the junk bond market generally and less secondary market liquidity.
Indemnification Risk—In the ordinary course of business, the Strategy enters into contracts that contain a variety of indemnifications. The Strategy’s maximum exposure under these arrangements is unknown. However, the Strategy has not had prior claims or losses pursuant to these indemnification provisions and expects the risk of loss thereunder to be remote. Therefore, the Strategy has not accrued any liability in connection with these indemnification provisions.
NOTE G
Joint Credit Facility
A number of open-end mutual funds managed by the Adviser, including the Strategy, participate in a $280 million revolving credit facility (the “Facility”) intended to provide short-term financing, if necessary, subject to certain restrictions in connection with abnormal redemption activity. Commitment fees related to the Facility are paid by the participating funds and are included in miscellaneous expenses in the statement of operations. The Strategy did not utilize the Facility during the year ended October 31, 2014.
NOTE H
Distributions to Shareholders
The tax character of distributions paid during the fiscal years ended October 31, 2014 and October 31, 2013 were as follows:
| 2014 | 2013 | |||||||
Distributions paid from: | ||||||||
Ordinary income | $ | 483,823 | $ | 714,057 | ||||
Long-term capital gains | 22,282 | 631,579 | ||||||
|
|
|
| |||||
Total taxable distributions | 506,105 | 1,345,636 | ||||||
Tax-exempt distributions | 12,001,626 | 8,906,066 | ||||||
|
|
|
| |||||
Total distributions paid | $ | 12,507,731 | $ | 10,251,702 | ||||
|
|
|
| |||||
| 44 | • ALLIANCEBERNSTEIN MUNICIPAL BOND INFLATION STRATEGY |
Notes to Financial Statements
As of October 31, 2014, the components of accumulated earnings/(deficit) on a tax basis were as follows:
Undistributed tax-exempt income | $ | 1,027,561 | ||
Accumulated capital and other losses | (3,189,623 | ) | ||
Unrealized appreciation/(depreciation) | (3,198,730 | ) | ||
|
| |||
Total accumulated earnings/(deficit) | $ | (5,360,792 | )(a) | |
|
|
| (a) | The differences between book-basis and tax-basis components of accumulated earnings/(deficit) are attributable primarily to the amortization of offering costs and dividends payable. |
For tax purposes, net capital losses may be carried over to offset future capital gains, if any. Funds are permitted to carry forward capital losses incurred in taxable years beginning after December 22, 2010 for an indefinite period, and such losses will retain their character as either short-term or long-term capital losses. As of October 31, 2014, the Strategy had a net short-term capital loss carryforward of $486,150 and a net long-term capital loss carryforward of $2,703,473 which may be carried forward for an indefinite period.
During the current fiscal year, permanent differences primarily due to the tax treatment of swaps and the redesignation of dividends resulted in a net decrease in undistributed net investment income and a net decrease in accumulated net realized loss on investment transactions. These reclassifications had no effect on net assets.
NOTE I
Subsequent Events
Management has evaluated subsequent events for possible recognition or disclosure in the financial statements through the date the financial statements are issued. Management has determined that there are no material events that would require disclosure in the Strategy’s financial statements through this date.
| ALLIANCEBERNSTEIN MUNICIPAL BOND INFLATION STRATEGY • | 45 |
Notes to Financial Statements
FINANCIAL HIGHLIGHTS
Selected Data For A Share Of Capital Stock Outstanding Throughout Each Period
| Class A | ||||||||||||||||||||
| Year Ended October 31, | January 26, 2010(a) to October 31, | |||||||||||||||||||
| 2014 | 2013 | 2012 | 2011 | 2010 | ||||||||||||||||
|
| |||||||||||||||||||
Net asset value, beginning of period | $ 10.35 | $ 10.80 | $ 10.32 | $ 10.09 | $ 10.00 | |||||||||||||||
|
| |||||||||||||||||||
Income From Investment Operations | ||||||||||||||||||||
Net investment income(b)(c) | .13 | .12 | .14 | .16 | .11 | |||||||||||||||
Net realized and unrealized gain (loss) on investment transactions | .12 | (.44 | ) | .50 | .26 | .06 | ||||||||||||||
|
| |||||||||||||||||||
Net increase (decrease) in net asset value from operations | .25 | (.32 | ) | .64 | .42 | .17 | ||||||||||||||
|
| |||||||||||||||||||
Less: Dividends and Distributions | ||||||||||||||||||||
Dividends from net investment income | (.12 | ) | (.11 | ) | (.14 | ) | (.17 | ) | (.08 | ) | ||||||||||
Distributions from net realized gain on investment | (.00 | )(d) | (.02 | ) | (.02 | ) | (.02 | ) | – 0 | – | ||||||||||
|
| |||||||||||||||||||
Total dividends and distributions | (.12 | ) | (.13 | ) | (.16 | ) | (.19 | ) | (.08 | ) | ||||||||||
|
| |||||||||||||||||||
Net asset value, end of period | $ 10.48 | $ 10.35 | $ 10.80 | $ 10.32 | $ 10.09 | |||||||||||||||
|
| |||||||||||||||||||
Total Return | ||||||||||||||||||||
Total investment return based on net asset value(e) | 2.44 | % | (2.98 | )% | 6.22 | % | 4.24 | % | 1.70 | % | ||||||||||
Ratios/Supplemental Data | ||||||||||||||||||||
Net assets, end of period (000’s omitted) | $60,016 | $95,466 | $79,735 | $64,342 | $28,200 | |||||||||||||||
Ratio to average net assets of: | ||||||||||||||||||||
Expenses, net of | .80 | % | .80 | % | .80 | % | .80 | % | .80 | %^ | ||||||||||
Expenses, before waivers/reimbursements | .90 | % | .91 | % | .95 | % | 1.20 | % | 2.15 | %^ | ||||||||||
Net investment income(b) | 1.24 | % | 1.10 | % | 1.34 | % | 1.57 | % | 1.43 | %^ | ||||||||||
Portfolio turnover rate | 18 | % | 15 | % | 10 | % | 26 | % | 1 | % | ||||||||||
See footnote summary on page 51.
| 46 | • ALLIANCEBERNSTEIN MUNICIPAL BOND INFLATION STRATEGY |
Financial Highlights
Selected Data For A Share Of Capital Stock Outstanding Throughout Each Period
| Class C | ||||||||||||||||||||
| Year Ended October 31, | January 26, 2010(a) to October 31, | |||||||||||||||||||
| 2014 | 2013 | 2012 | 2011 | 2010 | ||||||||||||||||
|
| |||||||||||||||||||
Net asset value, beginning | $ 10.33 | $ 10.78 | $ 10.30 | $ 10.08 | $ 10.00 | |||||||||||||||
|
| |||||||||||||||||||
Income From Investment Operations | ||||||||||||||||||||
Net investment income(b)(c) | .06 | .04 | .07 | .09 | .06 | |||||||||||||||
Net realized and unrealized gain (loss) on investment transactions | .12 | (.43 | ) | .50 | .25 | .06 | ||||||||||||||
|
| |||||||||||||||||||
Net increase (decrease) in net asset value from operations | .18 | (.39 | ) | .57 | .34 | .12 | ||||||||||||||
|
| |||||||||||||||||||
Less: Dividends and Distributions | ||||||||||||||||||||
Dividends from net investment income | (.05 | ) | (.04 | ) | (.07 | ) | (.10 | ) | (.04 | ) | ||||||||||
Distributions from net realized gain on investment | (.00 | )(d) | (.02 | ) | (.02 | ) | (.02 | ) | – 0 | – | ||||||||||
|
| |||||||||||||||||||
Total dividends and distributions | (.05 | ) | (.06 | ) | (.09 | ) | (.12 | ) | (.04 | ) | ||||||||||
|
| |||||||||||||||||||
Net asset value, end of period | $ 10.46 | $ 10.33 | $ 10.78 | $ 10.30 | $ 10.08 | |||||||||||||||
|
| |||||||||||||||||||
Total Return | ||||||||||||||||||||
Total investment return based on net asset value(e) | 1.72 | % | (3.67 | )% | 5.51 | % | 3.45 | % | 1.23 | % | ||||||||||
Ratios/Supplemental Data | ||||||||||||||||||||
Net assets, end of period (000’s omitted) | $20,873 | $29,748 | $35,436 | $23,919 | $11,804 | |||||||||||||||
Ratio to average net assets of: | ||||||||||||||||||||
Expenses, net of | 1.50 | % | 1.50 | % | 1.50 | % | 1.50 | % | 1.50 | %^ | ||||||||||
Expenses, before | 1.60 | % | 1.61 | % | 1.65 | % | 1.91 | % | 2.76 | %^ | ||||||||||
Net investment income(b) | .54 | % | .41 | % | .64 | % | .87 | % | .78 | %^ | ||||||||||
Portfolio turnover rate | 18 | % | 15 | % | 10 | % | 26 | % | 1 | % | ||||||||||
See footnote summary on page 51.
| ALLIANCEBERNSTEIN MUNICIPAL BOND INFLATION STRATEGY • | 47 |
Financial Highlights
Selected Data For A Share Of Capital Stock Outstanding Throughout Each Period
| Advisor Class | ||||||||||||||||||||
| Year Ended October 31, | January 26, 2010 | |||||||||||||||||||
| 2014 | 2013 | 2012 | 2011 | |||||||||||||||||
|
| |||||||||||||||||||
Net asset value, beginning of period | $ 10.35 | $ 10.81 | $ 10.32 | $ 10.10 | $ 10.00 | |||||||||||||||
|
| |||||||||||||||||||
Income From Investment Operations | ||||||||||||||||||||
Net investment income(b)(c) | .16 | .15 | .17 | .19 | .12 | |||||||||||||||
Net realized and unrealized gain (loss) on investment transactions | .12 | (.45 | ) | .51 | .25 | .08 | ||||||||||||||
|
| |||||||||||||||||||
Net increase (decrease) in net asset value from operations | .28 | (.30 | ) | .68 | .44 | .20 | ||||||||||||||
|
| |||||||||||||||||||
Less: Dividends and Distributions | ||||||||||||||||||||
Dividends from net investment income | (.15 | ) | (.14 | ) | (.17 | ) | (.20 | ) | (.10 | ) | ||||||||||
Distributions from net realized gain on investment | (.00 | )(d) | (.02 | ) | (.02 | ) | (.02 | ) | – 0 | – | ||||||||||
|
| |||||||||||||||||||
Total dividends and distributions | (.15 | ) | (.16 | ) | (.19 | ) | (.22 | ) | (.10 | ) | ||||||||||
|
| |||||||||||||||||||
Net asset value, end of period | $ 10.48 | $ 10.35 | $ 10.81 | $ 10.32 | $ 10.10 | |||||||||||||||
|
| |||||||||||||||||||
Total Return | ||||||||||||||||||||
Total investment return based on net asset value(e) | 2.75 | % | (2.78 | )% | 6.64 | % | 4.44 | % | 1.97 | % | ||||||||||
Ratios/Supplemental Data | ||||||||||||||||||||
Net assets, end of period | $185,106 | $179,620 | $85,781 | $41,924 | $12,310 | |||||||||||||||
Ratio to average net assets of: | ||||||||||||||||||||
Expenses, net of | .50 | % | .50 | % | .50 | % | .50 | % | .50 | %^ | ||||||||||
Expenses, before waivers/reimbursements | .60 | % | .61 | % | .65 | % | .88 | % | 1.57 | %^ | ||||||||||
Net investment income(b) | 1.55 | % | 1.39 | % | 1.63 | % | 1.85 | % | 1.81 | %^ | ||||||||||
Portfolio turnover rate | 18 | % | 15 | % | 10 | % | 26 | % | 1 | % | ||||||||||
See footnote summary on page 51.
| 48 | • ALLIANCEBERNSTEIN MUNICIPAL BOND INFLATION STRATEGY |
Financial Highlights
Selected Data For A Share Of Capital Stock Outstanding Throughout Each Period
| Class 1 | ||||||||||||||||||||
| Year Ended October 31, | January 26, 2010 | |||||||||||||||||||
| 2014 | 2013 | 2012 | 2011 | |||||||||||||||||
|
| |||||||||||||||||||
Net asset value, beginning of period | $ 10.33 | $ 10.78 | $ 10.30 | $ 10.08 | $ 10.00 | |||||||||||||||
|
| |||||||||||||||||||
Income From Investment Operations | ||||||||||||||||||||
Net investment income(b)(c) | .15 | .14 | .16 | .17 | .11 | |||||||||||||||
Net realized and unrealized gain (loss) on investment transactions | .12 | (.43 | ) | .50 | .27 | .07 | ||||||||||||||
|
| |||||||||||||||||||
Net increase (decrease) in net asset value from operations | .27 | (.29 | ) | .66 | .44 | .18 | ||||||||||||||
|
| |||||||||||||||||||
Less: Dividends and Distributions | ||||||||||||||||||||
Dividends from net investment income | (.15 | ) | (.14 | ) | (.16 | ) | (.20 | ) | (.10 | ) | ||||||||||
Distributions from net realized gain on investment | (.00 | )(d) | (.02 | ) | (.02 | ) | (.02 | ) | – 0 | – | ||||||||||
|
| |||||||||||||||||||
Total dividends and distributions | (.15 | ) | (.16 | ) | (.18 | ) | (.22 | ) | (.10 | ) | ||||||||||
|
| |||||||||||||||||||
Net asset value, end of period | $ 10.45 | $ 10.33 | $ 10.78 | $ 10.30 | $ 10.08 | |||||||||||||||
|
| |||||||||||||||||||
Total Return | ||||||||||||||||||||
Total investment return based on net asset value(e) | 2.60 | % | (2.76 | )% | 6.45 | % | 4.40 | % | 1.78 | % | ||||||||||
Ratios/Supplemental Data | ||||||||||||||||||||
Net assets, end of period | $408,307 | $419,573 | $236,285 | $111,857 | $10 | |||||||||||||||
Ratio to average net assets of: | ||||||||||||||||||||
Expenses, net of | .60 | % | .60 | % | .60 | % | .60 | % | .60 | %^ | ||||||||||
Expenses, before waivers/reimbursements | .66 | % | .67 | % | .74 | % | .92 | % | 2.70 | %^ | ||||||||||
Net investment income(b) | 1.44 | % | 1.30 | % | 1.54 | % | 1.66 | % | 1.38 | %^ | ||||||||||
Portfolio turnover rate | 18 | % | 15 | % | 10 | % | 26 | % | 1 | % | ||||||||||
See footnote summary on page 51.
| ALLIANCEBERNSTEIN MUNICIPAL BOND INFLATION STRATEGY • | 49 |
Financial Highlights
Selected Data For A Share Of Capital Stock Outstanding Throughout Each Period
| Class 2 | ||||||||||||||||||||
| Year Ended October 31, | January 26, 2010 | |||||||||||||||||||
| 2014 | 2013 | 2012 | 2011 | |||||||||||||||||
|
| |||||||||||||||||||
Net asset value, beginning of period | $ 10.33 | $ 10.79 | $ 10.31 | $ 10.08 | $ 10.00 | |||||||||||||||
|
| |||||||||||||||||||
Income From Investment Operations | ||||||||||||||||||||
Net investment income(b)(c) | .16 | .15 | .17 | .17 | .11 | |||||||||||||||
Net realized and unrealized gain (loss) on investment transactions | .13 | (.44 | ) | .50 | .28 | .07 | ||||||||||||||
|
| |||||||||||||||||||
Net increase (decrease) in net asset value from operations | .29 | (.29 | ) | .67 | .45 | .18 | ||||||||||||||
|
| |||||||||||||||||||
Less: Dividends and Distributions | ||||||||||||||||||||
Dividends from net investment income | (.16 | ) | (.15 | ) | (.17 | ) | (.20 | ) | (.10 | ) | ||||||||||
Distributions from net realized gain on investment | (.00 | )(d) | (.02 | ) | (.02 | ) | (.02 | ) | – 0 | – | ||||||||||
|
| |||||||||||||||||||
Total dividends and distributions | (.16 | ) | (.17 | ) | (.19 | ) | (.22 | ) | (.10 | ) | ||||||||||
|
| |||||||||||||||||||
Net asset value, end of period | $ 10.46 | $ 10.33 | $ 10.79 | $ 10.31 | $ 10.08 | |||||||||||||||
|
| |||||||||||||||||||
Total Return | ||||||||||||||||||||
Total investment return based on net asset value(e) | 2.79 | % | (2.75 | )% | 6.54 | % | 4.54 | % | 1.85 | % | ||||||||||
Ratios/Supplemental Data | ||||||||||||||||||||
Net assets, end of period | $185,904 | $183,237 | $92,507 | $43,368 | $10,044 | |||||||||||||||
Ratio to average net assets of: | ||||||||||||||||||||
Expenses, net of waivers | .50 | % | .50 | % | .50 | % | .50 | % | .50 | %^ | ||||||||||
Expenses, before waivers | .56 | % | .57 | % | .64 | % | .85 | % | 2.61 | %^ | ||||||||||
Net investment income(b) | 1.54 | % | 1.39 | % | 1.64 | % | 1.77 | % | 1.49 | %^ | ||||||||||
Portfolio turnover rate. | 18 | % | 15 | % | 10 | % | 26 | % | 1 | % | ||||||||||
See footnote summary on page 51.
| 50 | • ALLIANCEBERNSTEIN MUNICIPAL BOND INFLATION STRATEGY |
Financial Highlights
| (a) | Commencement of operations. |
| (b) | Net of fees waived and expenses reimbursed by the Adviser. |
| (c) | Based on average shares outstanding. |
| (d) | Amount is less than $.005. |
| (e) | Total investment return is calculated assuming an initial investment made at the net asset value at the beginning of the period, reinvestment of all dividends and distributions at net asset value during the period, and redemption on the last day of the period. Initial sales charges or contingent deferred sales charges are not reflected in the calculation of total investment return. Total return does not reflect the deduction of taxes that a shareholder would pay on portfolio distributions or the redemption of portfolio shares. Total investment return calculated for a period of less than one year is not annualized. |
| ^ | Annualized. |
See notes to financial statements.
| ALLIANCEBERNSTEIN MUNICIPAL BOND INFLATION STRATEGY • | 51 |
Financial Highlights
REPORT OF INDEPENDENT REGISTERED
PUBLIC ACCOUNTING FIRM
To the Board of Directors of AllianceBernstein Bond Fund, Inc. and Shareholders of the AllianceBernstein Municipal Bond Inflation Strategy Portfolio
We have audited the accompanying statement of assets and liabilities, including the portfolio of investments, of AllianceBernstein Municipal Bond Inflation Strategy Portfolio (one of the portfolios constituting AllianceBernstein Bond Fund, Inc. (the “Fund”)), as of October 31, 2014, and the related statement of operations for the year then ended, the statements of changes in net assets for each of the two years in the period then ended and the financial highlights for each of the four years in the period then ended and the period January 26, 2010 (commencement of operations) through October 31, 2010. These financial statements and financial highlights are the responsibility of the Fund’s management. Our responsibility is to express an opinion on these financial statements and financial highlights based on our audits.
We conducted our audits in accordance with the standards of the Public Company Accounting Oversight Board (United States). Those standards require that we plan and perform the audit to obtain reasonable assurance about whether the financial statements and financial highlights are free of material misstatement. We were not engaged to perform an audit of the Fund’s internal control over financial reporting. Our audit included consideration of internal control over financial reporting as a basis for designing audit procedures that are appropriate in the circumstances, but not for the purpose of expressing an opinion on the effectiveness of the Fund’s internal control over financial reporting. Accordingly, we express no such opinion. An audit also includes examining, on a test basis, evidence supporting the amounts and disclosures in the financial statements and financial highlights, assessing the accounting principles used and significant estimates made by management, and evaluating the overall financial statement presentation. Our procedures included confirmation of securities owned as of October 31, 2014, by correspondence with the custodian and others or by other appropriate auditing procedures where replies from others were not received. We believe that our audits provide a reasonable basis for our opinion.
In our opinion, the financial statements and financial highlights referred to above present fairly, in all material respects, the financial position of the AllianceBernstein Municipal Bond Inflation Strategy Portfolio (one of the portfolios constituting the AllianceBernstein Bond Fund, Inc.) at October 31, 2014, the results of its operations for the year then ended, the changes in its net assets for each of the two years in the period then ended and the financial highlights for each of four years in the period then ended and the period January 26, 2010 (commencement of operations) through October 31, 2010, in conformity with U.S. generally accepted accounting principles.

New York, New York
December 26, 2014
| 52 | • ALLIANCEBERNSTEIN MUNICIPAL BOND INFLATION STRATEGY |
Report of Independent Registered Public Accounting Firm
BOARD OF DIRECTORS
Marshall C. Turner, Jr.(1), Chairman John H. Dobkin(1) Michael J. Downey(1) William H. Foulk, Jr.(1) D. James Guzy(1) | Nancy P. Jacklin(1) Robert M. Keith, President and Chief Executive Officer Garry L. Moody(1) Earl D. Weiner(1) |
OFFICERS
Philip L. Kirstein, Michael G. Brooks(2), Vice President Robert (“Guy”) B. Davidson III(2) , Vice President Wayne D. Godlin(2), Vice President | Terrance T. Hults(2), Vice President Emilie D. Wrapp, Secretary Joseph J. Mantineo, Treasurer and Chief Financial Officer Phyllis J. Clarke, Controller Vincent S. Noto, Chief Compliance Officer |
Custodian and Accounting Agent State Street Bank and Trust Company State Street Corporation CCB/5 1 Iron Street Boston, MA 02210
Principal Underwriter AllianceBernstein Investments, Inc. 1345 Avenue of the Americas New York, NY 10105
Transfer Agent AllianceBernstein Investor Services, Inc. P.O. Box 786003 San Antonio, TX 78278-6003 Toll-Free (800) 221-5672 | Independent Registered Public Ernst & Young LLP 5 Times Square New York, NY 10036
Legal Counsel Seward & Kissel LLP One Battery Park Plaza New York, NY 10004 |
| (1) | Member of the Audit Committee, the Governance and Nominating Committee and the Independent Directors Committee. |
| (2) | The day-to-day management of, and investment decisions for, the Strategy’s portfolio are made by the Adviser’s Municipal Bond Investment Team. Messrs. Michael G. Brooks, Robert “Guy” B. Davidson III, Wayne D. Godlin and Terrance T. Hults are the investment professionals with the most significant responsibility for the day-to-day management of the Strategy’s portfolio. |
| ALLIANCEBERNSTEIN MUNICIPAL BOND INFLATION STRATEGY • | 53 |
Board of Directors
MANAGEMENT OF THE FUND
Board of Directors Information
The business and affairs of the Strategy are managed under the direction of the Board of Directors. Certain information concerning the Strategy’s Directors is set forth below.
| NAME, ADDRESS*, AGE, (YEAR FIRST ELECTED**) | PRINCIPAL DURING PAST FIVE | PORTFOLIOS IN FUND COMPLEX OVERSEEN BY DIRECTOR | OTHER DIRECTORSHIP HELD BY DIRECTOR IN THE PAST FIVE YEARS | |||||
| INTERESTED DIRECTOR | ||||||||
Robert M. Keith, + 1345 Avenue of the Americas New York, NY 10105 54 (2010) | Senior Vice President of AllianceBernstein L.P. (the “Adviser”) and the head of AllianceBernstein Investments, Inc. (“ABI”) since July 2008; Director of ABI and President of the AllianceBernstein Mutual Funds. Previously, he served as Executive Managing Director of ABI from December 2006 to June 2008. Prior to joining ABI in 2006, Executive Managing Director of Bernstein Global Wealth Management, and prior thereto, Senior Managing Director and Global Head of Client Service and Sales of the Adviser’s institutional investment management business since 2004. Prior thereto, he was Managing Director and Head of North American Client Service and Sales in the Adviser’s institutional investment management business, with which he had been associated since prior to 2004. | 117 | None | |||||
| 54 | • ALLIANCEBERNSTEIN MUNICIPAL BOND INFLATION STRATEGY |
Management of the Fund
| NAME, ADDRESS*, AGE, (YEAR FIRST ELECTED**) | PRINCIPAL DURING PAST FIVE | PORTFOLIOS IN FUND COMPLEX OVERSEEN BY DIRECTOR | OTHER DIRECTORSHIP HELD BY DIRECTOR IN THE PAST FIVE YEARS | |||||
| DISINTERESTED DIRECTORS | ||||||||
Marshall C. Turner, Jr., ++ Chairman of the Board 73 (2005) | Private Investor since prior to 2009. Former CEO of Dupont Photomasks, Inc. (components of semi-conductor manufacturing), 2003-2006, and interim CEO 1999-2000. He has extensive operating and early-stage investment experience, including prior service as general partner of three institutional venture capital partnerships, and serves on the boards of three education and science-related non-profit organizations. He has served as a director of one AllianceBernstein fund since 1992, and director or trustee of multiple AllianceBernstein funds since 2005. He has been Chairman of the AllianceBernstein Funds since January 2014, and the Chairman of the Independent Directors Committees of such Funds since February 2014. | 117 | Xilinx, Inc. (programmable logic semi-conductors) and SunEdison, Inc. (semi-conductor substrates, solar materials and solar power plants) since prior to 2009 until July 2014 | |||||
John H. Dobkin, ++ 72 (1998) | Independent Consultant since prior to 2009. Formerly, President of Save Venice, Inc. (preservation organization) from 2001-2002; Senior Advisor from June 1999-June 2000 and President of Historic Hudson Valley (historic preservation) from December 1989-May 1999. Previously, Director of the National Academy of Design. He has served as a director or trustee of various AllianceBernstein Funds since 1992, and as Chairman of the Audit Committees of a number of such Funds from 2001-2008. | 117 | None | |||||
| ALLIANCEBERNSTEIN MUNICIPAL BOND INFLATION STRATEGY • | 55 |
Management of the Fund
| NAME, ADDRESS*, AGE, (YEAR FIRST ELECTED**) | PRINCIPAL DURING PAST FIVE | PORTFOLIOS IN FUND COMPLEX OVERSEEN BY DIRECTOR | OTHER DIRECTORSHIP HELD BY DIRECTOR IN THE PAST FIVE YEARS | |||||
| DISINTERESTED DIRECTORS (continued) | ||||||||
Michael J. Downey, ++ 70 (2005) | Private Investor since prior to 2009. Formerly, managing partner of Lexington Capital, LLC (investment advisory firm) from December 1997 until December 2003. From 1987 until 1993, Chairman and CEO of Prudential Mutual Fund Management, director of the Prudential mutual funds, and member of the Executive Committee of Prudential Securities Inc. He has served as a director or trustee of the AllianceBernstein Funds since 2005 and is a director and Chairman of one other registered investment company. | 117 | Asia Pacific Fund, Inc. (registered investment company) since prior to 2009, Prospect Acquisition Corp. (financial services) from 2007 until 2009, and The Merger Fund (registered investment company) since prior to 2009 until 2013 | |||||
William H. Foulk, Jr., ++ 82 (1998) | Investment Adviser and an Independent Consultant since prior to 2009. Previously, he was Senior Manager of Barrett Associates, Inc., a registered investment adviser. He was formerly Deputy Comptroller and Chief Investment Officer of the State of New York and, prior thereto, Chief Investment Officer of the New York Bank for Savings. He has served as a director or trustee of various AllianceBernstein Funds since 1983, and was Chairman of the Independent Directors Committees of the AllianceBernstein Funds from 2003 until early February 2014. He served as Chairman of such Funds from 2003 through December 2013. He is also active in a number of mutual fund related organizations and committees. | 117 | None | |||||
| 56 | • ALLIANCEBERNSTEIN MUNICIPAL BOND INFLATION STRATEGY |
Management of the Fund
| NAME, ADDRESS*, AGE, (YEAR FIRST ELECTED**) | PRINCIPAL DURING PAST FIVE | PORTFOLIOS IN FUND COMPLEX OVERSEEN BY DIRECTOR | OTHER DIRECTORSHIP HELD BY DIRECTOR IN THE PAST FIVE YEARS | |||||
| DISINTERESTED DIRECTORS (continued) | ||||||||
D. James Guzy, ++ 78 (2005) | Chairman of the Board of SRC Computers, Inc. (semi-conductors), with which he has been associated since prior to 2009. He served as Chairman of the Board of PLX Technology (semi-conductors) since prior to 2009 until November 2013. He was a director of Intel Corporation (semi-conductors) from 1969 until 2008, and served as Chairman of the Finance Committee of such company for several years until May 2008. He has served as a director or trustee of one or more of the AllianceBernstein Funds since 1982. | 117 | PLX Technology (semi-conductors) since prior to 2009 until November 2013, and Cirrus Logic Corporation (semi-conductors) since prior to 2009 until July 2011 | |||||
Nancy P. Jacklin, ++ 66 (2006) | Professorial Lecturer at the Johns Hopkins School of Advanced International Studies since 2008. Formerly, U.S. Executive Director of the International Monetary Fund (which is responsible for ensuring the stability of the international monetary system), (December 2002-May 2006); Partner, Clifford Chance (1992-2002); Sector Counsel, International Banking and Finance, and Associate General Counsel, Citicorp (1985-1992); Assistant General Counsel (International), Federal Reserve Board of Governors (1982-1985); and Attorney Advisor, U.S. Department of the Treasury (1973-1982). Member of the Bar of the District of Columbia and of New York; and member of the Council on Foreign Relations. She has served as a director or trustee of the AllianceBernstein Funds since 2006 and has been Chairman of the Governance and Nominating Committees of the Funds since August 2014. | 117 | None | |||||
| ALLIANCEBERNSTEIN MUNICIPAL BOND INFLATION STRATEGY • | 57 |
Management of the Fund
| NAME, ADDRESS*, AGE, (YEAR FIRST ELECTED**) | PRINCIPAL DURING PAST FIVE | PORTFOLIOS IN FUND COMPLEX OVERSEEN BY DIRECTOR | OTHER DIRECTORSHIP HELD BY DIRECTOR IN THE PAST FIVE YEARS | |||||
| DISINTERESTED DIRECTORS (continued) | ||||||||
Garry L. Moody, ++ 62 (2008) | Independent Consultant. Formerly, Partner, Deloitte & Touche LLP (1995-2008) where he held a number of senior positions, including Vice Chairman, and U.S. and Global Investment Management Practice Managing Partner; President, Fidelity Accounting and Custody Services Company (1993-1995); and Partner, Ernst & Young LLP (1975-1993), where he served as the National Director of Mutual Fund Tax Services and Managing Partner of its Chicago Office Tax department. He is a member of both the Governing Council of the Independent Directors Council (IDC), an organization of independent directors of mutual funds, and the Trustee Advisory Board of BoardIQ, a biweekly publication focused on issues and news affecting directors of mutual funds. He has served as a director or trustee, and as Chairman of the Audit Committees, of the AllianceBernstein Funds since 2008. | 117 | None | |||||
| 58 | • ALLIANCEBERNSTEIN MUNICIPAL BOND INFLATION STRATEGY |
Management of the Fund
| NAME, ADDRESS*, AGE, (YEAR FIRST ELECTED**) | PRINCIPAL DURING PAST FIVE | PORTFOLIOS IN FUND COMPLEX OVERSEEN BY DIRECTOR | OTHER DIRECTORSHIP HELD BY DIRECTOR IN THE PAST FIVE YEARS | |||||
| DISINTERESTED DIRECTORS (continued) | ||||||||
Earl D. Weiner, ++ 75 (2007) | Of Counsel, and Partner prior to January 2007, of the law firm Sullivan & Cromwell LLP and is a former member of the ABA Federal Regulation of Securities Committee Task Force to draft editions of the Fund Director’s Guidebook. He also serves as a director or trustee of various non-profit organizations and has served as Chairman or Vice Chairman of a number of them. He has served as a director or trustee of the AllianceBernstein Funds since 2007 and served as Chairman of the Governance and Nominating Committees of the AllianceBernstein Funds from 2007 until August 2014. | 117 | None | |||||
| * | The address for each of the Strategy’s disinterested Directors is c/o AllianceBernstein L.P., Attention: Philip L. Kirstein, 1345 Avenue of the Americas, New York, NY 10105. |
| ** | There is no stated term of office for the Strategy’s Directors. |
| *** | The information above includes each Director’s principal occupation during the last five years and other information relating to the experience, attributes and skills relevant to each Director’s qualifications to serve as a Director, which led to the conclusion that each Director should serve as a Director for the Strategy. |
| + | Mr. Keith is an “interested person” of the Strategy as defined in the “40 Act,” due to his position as a Senior Vice President of the Adviser. |
| ++ | Member of the Audit Committee, the Governance and Nominating Committee and the Independent Directors Committee. |
| ALLIANCEBERNSTEIN MUNICIPAL BOND INFLATION STRATEGY • | 59 |
Management of the Fund
Officer Information
Certain information concerning the Strategy’s Officers is listed below.
| NAME, ADDRESS* AND AGE | PRINCIPAL POSITION(S) HELD WITH FUND | PRINCIPAL OCCUPATION DURING PAST 5 YEARS | ||
| Robert M. Keith 54 | President and Chief Executive Officer | See biography above. | ||
| Philip L. Kirstein 69 | Senior Vice President and Independent Compliance Officer | Senior Vice President and Independent Compliance Officer of the AllianceBernstein Funds, with which he has been associated since October 2004. Prior thereto, he was Of Counsel to Kirkpatrick & Lockhart, LLP from October 2003 to October 2004, and General Counsel of Merrill Lynch Investment Managers, L.P. since prior to March 2003. | ||
Michael G. Brooks | Vice President | Senior Vice President of the Adviser,** with which he has been associated since prior to 2009. | ||
Robert “Guy” B. Davidson III | Vice President | Senior Vice President of the Adviser,** with which he has been associated since prior to 2009. | ||
| Wayne D. Godlin 53 | Vice President | Senior Vice President of the Adviser,** with which he has been associated since December 2009. Prior thereto, he was an investment manager and a Managing Director of Van Kampen Asset Management with which he had been associated since prior to 2009. | ||
| Terrance T. Hults 48 | Vice President | Senior Vice President of the Adviser,** with which he has been associated since prior to 2009. | ||
| Emilie D. Wrapp 58 | Secretary | Senior Vice President, Assistant General Counsel and Assistant Secretary of ABI,** with which she has been associated since prior to 2009. | ||
| Joseph J. Mantineo 55 | Treasurer and Chief Financial Officer | Senior Vice President of AllianceBernstein Investor Services, Inc. (“ABIS”),** with which he has been associated since prior to 2009. | ||
| Phyllis J. Clarke 53 | Controller | Vice President of ABIS,** with which she has been associated since prior to 2009. | ||
| Vincent S. Noto 50 | Chief Compliance Officer | Vice President and Mutual Fund Chief Compliance Officer of the Adviser** since 2014. Prior thereto, he was Vice President and Director of Mutual Fund Compliance of the Adviser** since 2009. |
| 60 | • ALLIANCEBERNSTEIN MUNICIPAL BOND INFLATION STRATEGY |
Management of the Fund
| * | The address for each of the Fund’s Officers is 1345 Avenue of the Americas, New York, NY 10105. |
| ** | The Adviser, ABI and ABIS are affiliates of the Strategy. |
| The Fund’s Statement of Additional Information (“SAI”) has additional information about the Strategy’s Directors and Officers and is available without charge upon request. Contact your financial representative or AllianceBernstein at 1-800-227-4618, or visit www.alliancebernstein.com, for a free prospectus or SAI. |
| ALLIANCEBERNSTEIN MUNICIPAL BOND INFLATION STRATEGY • | 61 |
Management of the Fund
THE FOLLOWING IS NOT PART OF THE SHAREHOLDER REPORT OR THE FINANCIAL STATEMENTS
SUMMARY OF SENIOR OFFICER’S EVALUATION OF INVESTMENT ADVISORY AGREEMENT1
The following is a summary of the evaluation of the Investment Advisory Agreement between AllianceBernstein L.P. (the “Adviser”) and AllianceBernstein Bond Fund, Inc. (the “Fund”) in respect of AllianceBernstein Municipal Bond Inflation Strategy (the “Strategy”).2 The evaluation of the Investment Advisory Agreement was prepared by Philip L. Kirstein, the Senior Officer of the Fund, for the Directors of the Fund, as required by the September 1, 2004 Assurance of Discontinuance (“AoD”) between the Adviser and the New York State Attorney General (the “NYAG”). The Senior Officer’s evaluation of the Investment Advisory Agreement is not meant to diminish the responsibility or authority of the Board of Directors of the Fund to perform its duties pursuant to Section 15 of the Investment Company Act of 1940 (the “40 Act”) and applicable state law. The purpose of this summary is to provide shareholders with a synopsis of the independent evaluation of the reasonableness of the advisory fees proposed to be paid by the Strategy which was provided to the Directors in connection with their review of the proposed approval of the continuance of the Investment Advisory Agreement. The Senior Officer’s evaluation considered the following factors:
| 1. | Advisory fees charged to institutional and other clients of the Adviser for like services; |
| 2. | Advisory fees charged by other mutual fund companies for like services; |
| 3. | Costs to the Adviser and its affiliates of supplying services pursuant to the advisory agreement, excluding any intra-corporate profit; |
| 4. | Profit margins of the Adviser and its affiliates from supplying such services; |
| 5. | Possible economies of scale as the Strategy grows larger; and |
| 6. | Nature and quality of the Adviser’s services including the performance of the Strategy. |
These factors, with the exception of the first factor, are generally referred to as the “Gartenberg factors,” which were articulated by the United States Court of Appeals for the Second Circuit in 1982. Gartenberg v. Merrill Lynch Asset Management, Inc., 694 F. 2d 923 (2d Cir. 1982). On March 30, 2010, the Supreme Court held the Gartenberg decision was correct in its basic formulation of what Section 36(b) requires: to face liability under Section 36(b), “an investment adviser must charge a fee that is so disproportionately large that it bears no reasonable relationship to the services rendered and could not have been the
| 1 | The Senior Officer’s fee evaluation was completed on October 23, 2014 and discussed with the Board of Directors on November 4-6, 2014. |
| 2 | Future references to the Fund or the Strategy do not include “AllianceBernstein.” |
| 62 | • ALLIANCEBERNSTEIN MUNICIPAL BOND INFLATION STRATEGY |
product of arm’s length bargaining.” Jones v. Harris Associates L.P., 130 S. Ct. 1418 (2010). In Jones, the Court stated the Gartenberg approach fully incorporates the correct understanding of fiduciary duty within the context of Section 36(b) and noted with approval that “Gartenberg insists that all relevant circumstances be taken into account” and “uses the range of fees that might result from arm’s length bargaining as the benchmark for reviewing challenged fees.”3
INVESTMENT ADVISORY FEES, NET ASSETS, EXPENSE CAPS & RATIOS
The Adviser proposed that the Strategy pay the advisory fee set forth in the table below for receiving the services to be provided pursuant to the Investment Advisory Agreement. The fee schedule below, implemented in January 2004 in connection with the Adviser’s settlement with the NYAG in December 2003, is based on a master schedule that contemplates eight categories of funds with almost all funds in each category having the same advisory fee schedule.4
| Strategy | Category | Advisory Fee Based on % of Average Daily Net Assets | Net Assets 09/30/14 ($ MM) | |||||
| Municipal Bond Inflation Strategy | High Income | 0.50% on 1st $2.5 billion 0.45% on next $2.5 billion 0.40% on the balance | $ | 923.6 | ||||
The Adviser is reimbursed as specified in the Investment Advisory Agreement for certain clerical, legal, accounting, administrative and other services provided to the Strategy. During the Strategy’s fiscal year ended October 31, 2013, the Adviser received $52,718 (0.006% of the Strategy’s average daily net assets) for such services.
The Adviser agreed to waive that portion of its advisory fees and/or reimburse the Strategy for that portion of the Strategy’s total operating expenses to the degree necessary to limit the Strategy’s expense ratios to the amounts set forth below for the Strategy’s current fiscal year. The waiver is terminable by the Adviser upon at least 60 days’ notice prior to the Strategy’s prospectus update. In addition, set forth below are the Strategy’s gross expense ratios for the most recent semi-annual period:5
| Strategy | Expense Cap Pursuant to Expense Limitation Undertaking | Gross Expense Ratio6 | Fiscal Year End | |||||||
| Municipal Bond Inflation Strategy | Advisor Class A Class C Class 1 Class 2 |
| 0.50 0.80 1.50 0.60 0.50 | % % % % % | 0.60% 0.90% 1.60% 0.66% 0.56% | October 31 (ratio as of April 30, 2014) | ||||
| 3 | Jones v. Harris at 1427. |
| 4 | Most of the AllianceBernstein Mutual Funds, which the Adviser manages, were affected by the Adviser’s settlement with the NYAG. |
| 5 | Semi-annual total expense ratios are unaudited. |
| 6 | Annualized. |
| ALLIANCEBERNSTEIN MUNICIPAL BOND INFLATION STRATEGY • | 63 |
| I. | ADVISORY FEES CHARGED TO INSTITUTIONAL AND OTHER CLIENTS |
The advisory fees charged to investment companies which the Adviser manages and sponsors are normally higher than those charged to similar sized institutional accounts, including pension plans and sub-advised investment companies. The fee differential reflects, among other things, different services provided to such clients, and different liabilities assumed. Services provided by the Adviser to the Strategy that are not provided to non-investment company clients include providing office space and personnel to serve as Fund Officers, who among other responsibilities make the certifications required under the Sarbanes–Oxley Act of 2002, and coordinating with and monitoring the Strategy’s third party service providers such as Fund counsel, auditors, custodians, transfer agents and pricing services. The accounting, administrative, legal and compliance requirements for the Strategy are more costly than those for institutional client assets due to the greater complexities and time required for investment companies, although as previously noted, the Adviser is reimbursed for providing such services. Also, retail mutual funds managed by the Adviser are widely held and accordingly, servicing the Strategy’s investors is more time consuming and labor intensive compared to servicing institutional clients since the Adviser needs to communicate with a more extensive network of financial intermediaries and shareholders. The Adviser also believes that it incurs substantial entrepreneurial risk when offering a new mutual fund since establishing a new mutual fund requires a large upfront investment and it may take a long time for the fund to achieve profitability since the fund must be priced to scale from inception in order to be competitive and assets are acquired one account at a time. In addition, managing the cash flow of an investment company may be more difficult than that of a stable pool of assets, such as an institutional account with little cash movement in either direction, particularly if the Strategy is in net redemption and the Adviser is frequently forced to sell securities to raise cash for redemptions. However, managing a fund with positive cash flow may be easier at times than managing a stable pool of assets. Finally, in recent years, investment advisers have been sued by institutional clients and have suffered reputational damage both by the attendant publicity and outcomes other than complete victories. Accordingly, the legal and reputational risks associated with institutional accounts are greater than previously thought, although arguably still not equal to those related to the mutual fund industry.
Notwithstanding the Adviser’s view that managing an investment company is not comparable to managing other institutional accounts because the services provided are different, the Supreme Court has indicated consideration should be given to the advisory fees charged to institutional accounts with a similar investment style as the Strategy.7 However, with respect to the Strategy, the
| 7 | The Supreme Court stated that “courts may give such comparisons the weight that they merit in light of the similarities and differences between the services that the clients in question require, but the courts must be wary of inapt comparisons.” Among the significant differences the Supreme Court noted that may exist between services provided to mutual funds and institutional accounts are “higher marketing costs.” Jones v. Harris at 1428. |
| 64 | • ALLIANCEBERNSTEIN MUNICIPAL BOND INFLATION STRATEGY |
Adviser represented that there is no category in the Form ADV for institutional products that have a substantially similar investment styles as the Strategy.
The Adviser represented that it does not sub-advise any registered investment companies that have a similar investment strategy as the Strategy.
| II. | MANAGEMENT FEES CHARGED BY OTHER MUTUAL FUND COMPANIES FOR LIKE SERVICES. |
Lipper, Inc. (“Lipper”), an analytical service that is not affiliated with the Adviser, compared the fees charged to the Strategy with fees charged to other investment companies for similar services offered by other investment advisers.8 Lipper’s analysis included the comparison of the Strategy’s contractual management fee, estimated at the approximate current asset level of the Strategy, to the median of the Strategy’s Lipper Expense Group (“EG”)9 and the Strategy’s contractual management fee ranking.10
Lipper describes an EG as a representative sample of comparable funds. Lipper’s standard methodology for screening funds to be included in an EG entails the consideration of several fund criteria, including fund type, investment classification/objective, load type and similar 12b-1/non-12b-1 service fees, asset (size) comparability, expense components and attributes. An EG will typically consist of seven to twenty funds.
| Strategy | Contractual Management Fee (%) | Lipper Expense Group Median (%) | Rank | |||||||||
| Municipal Bond Inflation Strategy | 0.500 | 0.500 | 7/15 | |||||||||
| 8 | The Supreme Court cautioned against accepting mutual fund fee comparisons without careful scrutiny since “these comparisons are problematic because these fees, like those challenged, may not be the product of negotiations conducted at arm’s length.” Jones v. Harris at 1429. |
| 9 | Lipper does not consider average account size when constructing EGs. Funds with relatively small average account sizes tend to have higher transfer agent expense ratios than comparable sized funds that have relatively large average account sizes. There are limitations to Lipper expense category data because different funds categorize expenses differently. |
| 10 | The contractual management fee is calculated by Lipper using the Strategy’s contractual management fee rate at a hypothetical asset level. The hypothetical asset level is based on the combined net assets of all classes of the Strategy, rounded up to the next $25 million. Lipper’s total expense ratio information is based on the most recent annual report except as otherwise noted. A ranking of “1” would mean that Strategy had the lowest effective fee rate in the Lipper peer group. |
| ALLIANCEBERNSTEIN MUNICIPAL BOND INFLATION STRATEGY • | 65 |
Lipper also compared the Strategy’s total expense ratio to the medians of the Strategy’s EG and Lipper Expense Universe (“EU”). The EU is a broader group compared to the EG, consisting of all funds that have the same investment classification/objective and load type as the subject Strategy.11
| Strategy | Total Expense Ratio (%)12 | Lipper Exp. Group Median (%) | Lipper Group Rank | Lipper Exp. Universe Median (%) | Lipper Universe Rank | |||||||||||
| Municipal Bond Inflation Strategy | 0.800 | 0.860 | 5/15 | 0.750 | 30/43 | |||||||||||
Based on this analysis, the Strategy has a more favorable ranking on a total expense ratio basis than on a contractual management fee basis.
| III. | COSTS TO THE ADVISER AND ITS AFFILIATES OF SUPPLYING SERVICES PURSUANT TO THE ADVISORY FEE ARRANGEMENT, EXCLUDING ANY INTRA-CORPORATE PROFIT. |
The Adviser utilizes two profitability reporting systems, which operate independently but are aligned with each other, to estimate the Adviser’s profitability in connection with investment advisory services provided to the Strategy. The Senior Officer has retained an independent consultant to provide independent advice regarding the alignment of the two profitability systems as well as the methodologies and allocations utilized by both profitability systems. See Section IV for additional discussion.
| IV. | PROFIT MARGINS OF THE ADVISER AND ITS AFFILIATES FOR SUPPLYING SUCH SERVICES. |
The profitability information for the Strategy, prepared by the Adviser for the Board of Directors, was reviewed by the Senior Officer and the independent consultant. The Adviser’s profitability from providing investment advisory services to the Strategy increased during calendar year 2013, relative to 2012.
In addition to the Adviser’s direct profits from managing the Strategy, certain of the Adviser’s affiliates have business relationships with the Strategy and may earn a profit from providing other services to the Strategy. The courts have referred to this type of business opportunity as “fall-out benefits” to the Adviser and indicated that such benefits should be factored into the evaluation of the total relationship between the Strategy and the Adviser. Neither case law nor common business practice precludes the Adviser’s affiliates from earning a reasonable profit on this type of relationship provided the affiliates’ charges and services are competitive. These affiliates provide transfer agent and distribution related services to the Strategy and receive transfer agent fees, front-end sales loads,
| 11 | Except for asset (size) comparability, Lipper uses the same criteria for selecting an EG when selecting an EU. Unlike the EG, the EU allows for the same adviser to be represented by more than just one fund. |
| 12 | Most recently completed fiscal year Class A share total expense ratio. |
| 66 | • ALLIANCEBERNSTEIN MUNICIPAL BOND INFLATION STRATEGY |
Rule 12b-1 payments and contingent deferred sales charges (“CDSC”). During the Strategy’s fiscal year ended October 31, 2013, ABI received from the Strategy $0, $1,005,045 and $46,386 in front-end sales charges, Rule 12b-1 and CDSC fees, respectively.13
AllianceBernstein Investments, Inc. (“ABI”), an affiliate of the Adviser, is the Strategy’s principal underwriter. ABI and the Adviser have disclosed in the Strategy’s prospectus that they may make revenue sharing payments from their own resources, in addition to revenues derived from sales loads and Rule 12b-1 fees, to firms that sell shares of the Strategy. In 2013, ABI paid approximately 0.05% of the average monthly assets of the AllianceBernstein Mutual Funds or approximately $19.4 million for distribution services and educational support (revenue sharing payments).
Fees and reimbursements for out of pocket expenses charged by AllianceBernstein Investor Services, Inc. (“ABIS”), the affiliated transfer agent for the Strategy, are charged on a per account basis, based on the level of service provided and the class of share held by the account. ABIS also receives a fee per shareholder sub-account for each account maintained by an intermediary on an omnibus basis. During the Strategy’s fiscal year ended October 31, 2013, ABIS received $26,015 in fees from the Strategy.
| V. | POSSIBLE ECONOMIES OF SCALE |
The Adviser has indicated that economies of scale are being shared with shareholders through pricing to scale, breakpoints, fee reductions/waivers and enhancement to services.
In May 2012, an independent consultant, retained by the Senior Officer, provided the Board of Directors information on the Adviser’s firm-wide average costs from 2005 through 2011 and the potential economies of scale. The independent consultant noted that from 2005 through 2007 the Adviser experienced significant growth in assets under management (“AUM”). During this period, operating expenses increased, in part to keep up with growth, and in part reflecting market returns. However, from 2008 through the first quarter of 2009, AUM rapidly and significantly decreased due to declines in market value and client withdrawals. When AUM rapidly decreased, some operating expenses categories, including base compensation and office space, adjusted more slowly during this period, resulting in an increase in average costs. Since 2009, AUM has experienced less significant changes. The independent consultant noted that changes in operating expenses reflect changes in business composition and business practices in response to changes in financial markets. Finally, the
| 13 | As a result of discussions between the Board and the Adviser, ABI is planning to phase in reductions of the Strategy’s Class A shares Rule 12b-1 fee payment rate from 0.30% to 0.25% effective on February 1, 2015. |
| ALLIANCEBERNSTEIN MUNICIPAL BOND INFLATION STRATEGY • | 67 |
independent consultant concluded that the increase in average cost and the decline in net operating margin across the Adviser since late 2008 are inconsistent with the view that there are currently reductions in average costs due to economies of scale that can be shared with the AllianceBernstein Mutual Funds managed by the Adviser through lower fees.
Previously, in February 2008, the independent consultant provided the Board of Directors an update of the Deli14 study on advisory fees and various fund characteristics.15 The independent consultant first reiterated the results of his previous two dimensional comparison analysis (fund size and family size) with the Board of Directors.16 The independent consultant then discussed the results of the regression model that was utilized to study the effects of various factors on advisory fees. The regression model output indicated that the bulk of the variation in fees predicted were explained by various factors, but substantially by fund AUM, family AUM, index fund indicator and investment style. The independent consultant also compared the advisory fees of the AllianceBernstein Mutual Funds to similar funds managed by 19 other large asset managers, regardless of the fund size and each Adviser’s proportion of mutual fund assets to non-mutual fund assets.
| VI. | NATURE AND QUALITY OF THE ADVISER’S SERVICES INCLUDING THE PERFORMANCE OF THE PORTFOLIO. |
With assets under management of approximately $473 billion as of September 30, 2014, the Adviser has the investment experience to manage and provide non-investment services (described in Section I) to the Strategy.
| 14 | The Deli study, originally published in 2002 based on 1997 data and updated for the February 2008 Presentation, may be of diminished value due to the age of the data used in the presentation and the changes experienced in the industry since 2008. |
| 15 | As mentioned previously, the Supreme Court cautioned against accepting mutual fund fee comparisons without careful scrutiny since the fees may not be the product of negotiations conducted at arm’s length. See Jones v. Harris at 1429. |
| 16 | The two dimensional analysis showed patterns of lower advisory fees for funds with larger asset sizes and funds from larger family sizes compared to funds with smaller asset sizes and funds from smaller family sizes, which according to the independent consultant is indicative of a sharing of economies of scale and scope. However, in less liquid and active markets, such is not the case, as the empirical analysis showed potential for diseconomies of scale in those markets. The empirical analysis also showed diminishing economies of scale and scope as funds surpassed a certain high level of assets. |
| 68 | • ALLIANCEBERNSTEIN MUNICIPAL BOND INFLATION STRATEGY |
The information below shows the 1 and 3 year performance return and rankings of the Strategy 17 relative to its Lipper Performance Group (“PG”) and Lipper Performance Universe (“PU”)18 for the periods ended July 31, 2014.19
| Strategy | Strategy Return (%) | PG Median (%) | PU Median (%) | PG Rank | PU Rank | |||||||||||
| Municipal Bond Inflation Strategy | ||||||||||||||||
1 year | 3.98 | 5.63 | 5.52 | 14/15 | 45/51 | |||||||||||
3 year | 2.09 | 3.91 | 3.81 | 15/15 | 43/45 | |||||||||||
Set forth below are the 1, 3 year and since inception net performance returns of the Strategy (in bold)20 versus its benchmark.21 Strategy and benchmark volatility and reward-to-variability ratio (“Sharpe Ratio”) information is also shown.22
| Periods Ending July 31, 2014 Annualized Performance | ||||||||||||||||||||||||
| Since Inception (%) | Annualized | Risk Period (Year) | ||||||||||||||||||||||
| 1 Year (%) | 3 Year (%) | Volatility (%) | Sharpe (%) | |||||||||||||||||||||
| Municipal Bond Inflation Strategy | 3.98 | 2.09 | 2.70 | 3.21 | 0.63 | 3 | ||||||||||||||||||
| Barclays Capital 1-10yr TIPS Index | 2.39 | 1.26 | 3.39 | 3.55 | 0.35 | 3 | ||||||||||||||||||
| Inception Date: January 26, 2010 | ||||||||||||||||||||||||
| 17 | The performance returns and rankings are for the Class A shares of the Strategy. The performance returns of the Strategy were provided Lipper. |
| 18 | The Strategy’s PG is identical to the Strategy’s EG. The Strategy’s PU is not identical to the Strategy’s EU as the criteria for including/excluding a Strategy in/from a PU are somewhat different from that of an EU. |
| 19 | The current Lipper investment classification/objective dictates the PG and PU throughout the life of the Strategy even if the Strategy may have had a different investment classification/objective at different points in time. |
| 20 | The performance returns and risk measures shown in the table are for the Class A shares of the Strategy. |
| 21 | The Adviser provided Strategy and benchmark performance return information for the periods through July 31, 2014. |
| 22 | Strategy and benchmark volatility and Sharpe Ratio information was obtained through Lipper LANA, a database maintained by Lipper. Volatility is a statistical measure of the tendency of a market price or yield to vary over time. A Sharpe Ratio is a risk adjusted measure of return that divides a fund’s return in excess of the riskless return by the fund’s standard deviation. A strategy with a greater volatility would be viewed as more risky than a strategy with equivalent performance but lower volatility; for that reason, a greater return would be demanded for the more risky fund. A strategy with a higher Sharpe Ratio would be viewed as better performing than a strategy with a lower Sharpe Ratio. |
| ALLIANCEBERNSTEIN MUNICIPAL BOND INFLATION STRATEGY • | 69 |
CONCLUSION:
Based on the factors discussed above the Senior Officer’s conclusion is that the proposed advisory fee for the Strategy is reasonable and within the range of what would have been negotiated at arm’s-length in light of all the surrounding circumstances. This conclusion in respect of the Strategy is based on an evaluation of all of these factors and no single factor was dispositive.
Dated: November 18, 2014
| 70 | • ALLIANCEBERNSTEIN MUNICIPAL BOND INFLATION STRATEGY |
THIS PAGE IS NOT PART OF THE SHAREHOLDER REPORT OR THE FINANCIAL STATEMENTS
ALLIANCEBERNSTEIN FAMILY OF FUNDS
US Equity
US Core
Core Opportunities Fund
Select US Equity Portfolio
US Growth
Concentrated Growth Fund
Discovery Growth Fund
Growth Fund
Large Cap Growth Fund
Small Cap Growth Portfolio
US Value
Discovery Value Fund
Equity Income Fund
Growth & Income Fund
Value Fund
International/Global Equity
International/Global Core
Global Equity & Covered Call Strategy Fund
Global Thematic Growth Fund
International Portfolio
Tax-Managed International Portfolio
International/Global Growth
International Growth Fund
International/Global Value
International Value Fund
Fixed Income
Municipal
High Income Municipal Portfolio
Intermediate California Portfolio
Intermediate Diversified Portfolio
Intermediate New York Portfolio
Municipal Bond Inflation Strategy
Tax-Aware Fixed Income Portfolio
National Portfolio
Arizona Portfolio
California Portfolio
Massachusetts Portfolio
Michigan Portfolio
Minnesota Portfolio
New Jersey Portfolio
New York Portfolio
Ohio Portfolio
Pennsylvania Portfolio
Virginia Portfolio
Taxable
Bond Inflation Strategy
Global Bond Fund
Fixed Income (continued)
Taxable
High Income Fund
High Yield Portfolio
Intermediate Bond Portfolio
Limited Duration High Income Portfolio
Short Duration Portfolio
Alternatives
All Market Real Return Portfolio*
Credit Long/Short Portfolio
Global Real Estate Investment Fund
Long/Short Multi-Manager Fund
Market Neutral Strategy-U.S.
Multi-Manager Alternative Strategies Fund
Select US Long/Short Portfolio
Unconstrained Bond Fund
Multi-Asset
All Market Growth Portfolio*
Emerging Markets Multi-Asset Portfolio
Global Risk Allocation Fund
Retirement Strategies
2000 Retirement Strategy
2005 Retirement Strategy
2010 Retirement Strategy
2015 Retirement Strategy
2020 Retirement Strategy
2025 Retirement Strategy
2030 Retirement Strategy
2035 Retirement Strategy
2040 Retirement Strategy
2045 Retirement Strategy
2050 Retirement Strategy
2055 Retirement Strategy
Wealth Strategies
Balanced Wealth Strategy
Conservative Wealth Strategy
Wealth Appreciation Strategy
Tax-Managed Balanced Wealth Strategy
Tax-Managed Conservative Wealth Strategy
Tax-Managed Wealth Appreciation Strategy
Closed-End Funds
Alliance California Municipal Income Fund
Alliance New York Municipal Income Fund
AllianceBernstein Global High Income Fund
AllianceBernstein Income Fund
AllianceBernstein Multi-Manager Alternative Fund
AllianceBernstein National Municipal Income Fund
We also offer Exchange Reserves, which serves as the money market fund exchange vehicle for the AllianceBernstein mutual funds. An investment in Exchange Reserves is not a deposit in a bank and is not insured or guaranteed by the Federal Deposit Insurance Corporation or any other government agency. Although the Fund seeks to preserve the value of your investment at $1.00 per share, it is possible to lose money by investing in the Fund.
Investors should consider the investment objectives, risks, charges and expenses of the Fund carefully before investing. For copies of our prospectus or summary prospectus, which contain this and other information, visit us online at www.alliancebernstein.com or contact your AllianceBernstein investments representative. Please read the prospectus and/or summary prospectus carefully before investing.
| * | Prior to December 15, 2014, All Market Growth Portfolio was named Dynamic All Market Fund; All Market Real Return Portfolio was named Real Asset Strategy. |
| ALLIANCEBERNSTEIN MUNICIPAL BOND INFLATION STRATEGY • | 71 |
AllianceBernstein Family of Funds
NOTES
| 72 | • ALLIANCEBERNSTEIN MUNICIPAL BOND INFLATION STRATEGY |
NOTES
| ALLIANCEBERNSTEIN MUNICIPAL BOND INFLATION STRATEGY • | 73 |
NOTES
| 74 | • ALLIANCEBERNSTEIN MUNICIPAL BOND INFLATION STRATEGY |
NOTES
| ALLIANCEBERNSTEIN MUNICIPAL BOND INFLATION STRATEGY • | 75 |
NOTES
| 76 | • ALLIANCEBERNSTEIN MUNICIPAL BOND INFLATION STRATEGY |
ALLIANCEBERNSTEIN MUNICIPAL BOND INFLATION STRATEGY
1345 Avenue of the Americas
New York, NY 10105
800.221.5672
| MBIS-0151-1014 |  | |
ANNUAL REPORT
AllianceBernstein
Real Asset Strategy
October 31, 2014
Annual Report

Investment Products Offered
• Are Not FDIC Insured • May Lose Value • Are Not Bank Guaranteed |
Investors should consider the investment objectives, risks, charges and expenses of the Fund carefully before investing. For copies of our prospectus or summary prospectus, which contain this and other information, visit us online at www.alliancebernstein.com or contact your AllianceBernstein Investments representative. Please read the prospectus and/or summary prospectus carefully before investing.
This shareholder report must be preceded or accompanied by the Fund’s prospectus for individuals who are not current shareholders of the Fund.
You may obtain a description of the Fund’s proxy voting policies and procedures, and information regarding how the Fund voted proxies relating to portfolio securities during the most recent 12-month period ended June 30, without charge. Simply visit AllianceBernstein’s website at www.alliancebernstein.com, or go to the Securities and Exchange Commission’s (the “Commission”) website at www.sec.gov, or call AllianceBernstein at (800) 227-4618.
The Fund files its complete schedule of portfolio holdings with the Commission for the first and third quarters of each fiscal year on Form N-Q. The Fund’s Forms N-Q are available on the Commission’s website at www.sec.gov. The Fund’s Forms N-Q may also be reviewed and copied at the Commission’s Public Reference Room in Washington, DC; information on the operation of the Public Reference Room may be obtained by calling (800) SEC-0330. AllianceBernstein publishes full portfolio holdings for the Fund monthly at www.alliancebernstein.com.
AllianceBernstein Investments, Inc. (ABI) is the distributor of the AllianceBernstein family of mutual funds. ABI is a member of FINRA and is an affiliate of AllianceBernstein L.P., the manager of the funds.
AllianceBernstein® and the AB Logo are registered trademarks and service marks used by permission of the owner, AllianceBernstein L.P.
December 16, 2014
Annual Report
This report provides management’s discussion of fund performance for AllianceBernstein Real Asset Strategy (the “Strategy”) for the annual reporting period ended October 31, 2014. Effective December 15, 2014, the Strategy’s name changed to All Market Real Return Portfolio.
Investment Objective and Policies
The Strategy’s investment objective is to maximize real return. Real return is the rate of return after adjusting for inflation. The Strategy pursues an aggressive investment strategy involving a variety of asset classes. The Strategy invests primarily in instruments that AllianceBernstein L.P. (the “Adviser”) expects to outperform broad equity indices during periods of rising inflation. Under normal circumstances, the Strategy expects to invest its assets principally in the following instruments that, in the judgment of the Adviser, are affected directly or indirectly by the level and change in rate of inflation: inflation-indexed fixed-income securities, such as Treasury Inflation-Protected Securities (“TIPS”) and similar bonds issued by governments outside of the United States, commodities, equity securities, such as commodity-related stocks, real estate securities, utility securities, infrastructure-related securities, securities and derivatives linked to the price of other assets (such as commodities, stock indices and real estate) and currencies. The Strategy expects its investments in fixed-income securities to have a broad range of maturities and quality levels.
The Strategy will seek inflation protection from investments around the globe, both in developed and emerging market countries. In selecting securities for purchase and sale, the Adviser will utilize its qualitative and quantitative resources to determine overall inflation sensitivity, asset allocation, and security selection. The Adviser assesses the securities’ risks and inflation sensitivity as well as the securities’ impact on the overall risks and inflation sensitivity of the Strategy. When its analysis indicates that changes are necessary, the Adviser intends to implement them through a combination of changes to underlying positions and the use of inflation swaps and other types of derivatives, such as interest rate swaps.
The Strategy anticipates that its investments, other than its investments in inflation-indexed securities, will focus roughly equally on commodity-related equity securities, commodities and commodity derivatives, and real estate equity securities to provide a balance between expected return and inflation protection. Its commodities investments will include significant exposure to energy commodities, but will also include agricultural products, and industrial and precious metals, such as gold. The Strategy’s investments in real estate equity securities will include Real Estate Investment Trusts (“REITs”), other real estate-related securities, and infrastructure-related securities.
The Strategy will invest in both U.S. and non-U.S. dollar-denominated equity or fixed-income securities. The Strategy may invest in currencies for
| ALLIANCEBERNSTEIN REAL ASSET STRATEGY • | 1 |
hedging or for investment purposes, both in the spot market and through long or short positions in currency-related derivatives. The Strategy does not ordinarily expect to hedge its foreign currency exposure because it will be balanced by investments in U.S. dollar-denominated securities, although it may hedge the exposure under certain circumstances.
The Strategy may invest significantly to the extent permitted by applicable law in derivatives, such as options, futures, forwards, swaps or structured notes. The Strategy intends to use leverage for investment purposes through the use of cash made available by derivatives transactions to make other investments in accordance with its investment policies. In determining when and to what extent to employ leverage or enter into derivatives transactions, the Adviser will consider factors such as the relative risks and returns expected of potential investments and the cost of such transactions. The Adviser will consider the impact of derivatives in making its assessments of the Strategy’s risks. The resulting exposures to markets, sectors, issuers or specific securities will be continuously monitored by the Adviser.
The Strategy may seek to gain exposure to physical commodities traded in the commodities markets through investments in a variety of derivative instruments, including investments in commodity index-linked notes. The Adviser expects that the Strategy will seek to gain exposure to commodities and commodity-related instruments and derivatives primarily through investments in
AllianceBernstein Cayman Inflation Strategy, Ltd., a wholly-owned subsidiary of the Strategy organized under the laws of the Cayman Islands (the “Subsidiary”). The Subsidiary is advised by the Adviser and has the same investment objective and substantially similar investment policies and restrictions as the Strategy except that the Subsidiary, unlike the Strategy, may invest, without limitation, in commodities and commodity-related instruments. The Strategy will be subject to the risks associated with the commodities, derivatives and other instruments in which the Subsidiary invests, to the extent of its investment in the Subsidiary. The Strategy limits its investment in the Subsidiary to no more than 25% of its net assets. Investment in the Subsidiary is expected to provide the Strategy with commodity exposure within the limitations of federal tax requirements that apply to the Strategy.
The Strategy is “non-diversified”, which means that it may concentrate its assets in a smaller number of issuers than a diversified fund.
Investment Results
The table on page 7 shows the Strategy’s performance compared to its primary benchmark, the Morgan Stanley Capital International All Country (“MSCI AC”) World Commodity Producers Index (net) and the Real Asset Strategy Benchmark, composed of equal weightings of the MSCI AC World Commodity Producers Index, the Financial Times Stock Exchange European Public Real Estate Association/National Association of Real
| 2 | • ALLIANCEBERNSTEIN REAL ASSET STRATEGY |
Estate Investment Trusts (“FTSE EPRA/NAREIT”) Global Index and the Dow Jones-UBS Commodity Index, for the six- and 12-month periods ended October 31, 2014.
During the 12-month period, all share classes of the Strategy outperformed the primary benchmark, while all share classes underperformed the Real Asset Strategy Benchmark (except for Class Z shares whose inception date is January 31, 2014, and performance period is less than 12 months). During the six-month period, all share classes of the Strategy outperformed the primary benchmark but underperformed the Real Asset Strategy Benchmark. The outperformance against the primary benchmark during both periods was driven by the strategic allocation to real estate equity, which outperformed the primary benchmark (which has zero exposure to real estate equities). Allocation to commodity futures detracted from performance, although to a lesser extent. The underperformance relative to the Real Asset Strategy Benchmark was driven largely by sector selection in commodity equities, real estate equities and commodity equity security selection. Sector selection in commodity futures added to performance, albeit to a smaller extent.
The Strategy utilized derivatives including interest rate swaps, inflation swaps and Treasury futures for hedging and investment purposes, total return swaps for investment purposes, and purchased options for hedging purposes, which detracted from returns during both periods. Currency forwards were utilized for hedging and investment purposes, which contributed to returns during both periods.
Market Review and Investment Strategy
The 12-month period ended October 31, 2014 was very volatile for real assets broadly, and particularly for energy-related assets. The second quarter of 2014 began with unrest in Iraq, which led to higher volatility and geopolitical risk premiums at the front-end of the crude futures curve. Far-dated crude however, remained fairly muted initially. At around $85/barrel, far-dated crude was added to the Strategy on the hypothesis that these levels would be a soft floor because of the Organization of Petroleum Exporting Companies (“OPEC”) budgets and marginal cost economics, and that any risk of disruption in Iraqi supply is to future production rather than current supply. During the third quarter however, the entire crude curve collapsed due to higher than expected production and lower official prices. Since then, markets have been gripped by uncertainty on OPEC’s intentions and the market-balancing mechanism going forward. The Strategy’s overweight positions in energy stocks and energy futures were hurt by these events.
The other major impact on the Strategy came from the fact that interest rates moved to the downside. The Strategy had an underweight to REITs coming into the reporting period on the hypothesis that a rise in rates would have a negative impact on risk assets in general, and U.S. REITs in particular, and that a disorderly reversal of flows from Japanese retail investors into high-yielding structured products poses further downside risk to U.S. REITs. However, falling yields led to strong performance for U.S. REITs, which negatively impacted the Strategy’s underweight positioning.
| ALLIANCEBERNSTEIN REAL ASSET STRATEGY • | 3 |
DISCLOSURES AND RISKS
Benchmark Disclosure
The unmanaged MSCI AC World Commodity Producers Index (net), the FTSE® EPRA/NAREIT Global Index and the Dow Jones-UBS Commodity Index do not reflect fees and expenses associated with the active management of a mutual fund portfolio. The Real Asset Strategy Benchmark is an equally-weighted blend of the MSCI AC World Commodity Producers Index, the FTSE EPRA/NAREIT Global Index and the Dow Jones-UBS Commodity Index. The MSCI AC World Commodity Producers Index is a free float-adjusted, market capitalization index designed to track the performance of global listed commodity producers, including emerging markets. Net returns include the reinvestment of dividends after deduction of non-U.S. withholding tax. The FTSE EPRA/NAREIT Global Index (market-value-weighted index based upon the last closing price of the month) represents the performance of tax-qualified REITs listed on the NYSE, AMEX and the NASDAQ. The Dow Jones-UBS Commodity Index measures price movements of the commodities included in the appropriate sub index. It does not account for effects of rolling futures contracts or costs associated with holding the physical commodity. Commodities sectors include: energy, grains, industrial metals, petroleum, precious metals and softs. MSCI makes no express or implied warranties or representations, and shall have no liability whatsoever with respect to any MSCI data contained herein. The MSCI data may not be further redistributed or used as a basis for other indices, any securities or financial products. This report is not approved, reviewed or produced by MSCI. An investor cannot invest directly in an index, and its results are not indicative of the performance for any specific investment, including the Strategy.
A Word About Risk
Market Risk: The value of the Strategy’s assets will fluctuate as the stock, commodity and bond markets fluctuate. The value of the Strategy’s investments may decline, sometimes rapidly and unpredictably, simply because of economic changes or other events that affect large portions of the market.
Credit Risk: An issuer or guarantor of a fixed-income security, or the counterparty to a derivatives or other contract, may be unable or unwilling to make timely payments of interest or principal, or to otherwise honor its obligations. The issuer or guarantor may default, causing a loss of the full principal amount of a security. The degree of risk for a particular security may be reflected in its credit rating. There is the possibility that the credit rating of a fixed-income security may be downgraded after purchase, which may adversely affect the value of the security. Investments in fixed-income securities with lower ratings tend to have a higher probability that an issuer will default or fail to meet its payment obligations.
Interest Rate Risk: Changes in interest rates will affect the value of investments in fixed-income securities. When interest rates rise, the value of investments in fixed-income securities tends to fall and this decrease in value may not be offset by higher income from new investments. Interest rate risk is generally greater for fixed-income securities with longer maturities or durations.
Commodity Risk: Investing in commodities and commodity-linked derivative instruments, either directly or through the Subsidiary, may subject the Strategy to greater volatility than investments in traditional securities. The value of commodity-linked derivative instruments may be affected by changes in overall market movements, commodity index volatility, changes in interest rates, or factors affecting a particular industry or commodity, such as drought, floods, weather, livestock disease, embargoes, tariffs and international economic, political and regulatory developments.
(Disclosures, Risks and Note about Historical Performance continued on next page)
| 4 | • ALLIANCEBERNSTEIN REAL ASSET STRATEGY |
Disclosures and Risks
DISCLOSURES AND RISKS
(continued from previous page)
Derivatives Risk: Derivatives may be illiquid, difficult to price, and leveraged so that small changes may produce disproportionate losses for the Strategy, and may be subject to counterparty risk to a greater degree than more traditional investments.
Leverage Risk: To the extent the Strategy uses leveraging techniques, its net asset value (“NAV”) may be more volatile because leverage tends to exaggerate the effect of changes in interest rates and any increase or decrease in the value of the Strategy’s investments.
Liquidity Risk: Liquidity risk exists when particular investments are difficult to purchase or sell, possibly preventing the Strategy from selling out of these illiquid securities at an advantageous price. The Strategy invests in derivatives and securities involving substantial market and credit risk, which tend to involve greater liquidity risk.
Foreign (Non-U.S.) Risk: Investments in securities of non-U.S. issuers may involve more risk than those of U.S. issuers. These securities may fluctuate more widely in price and may be less liquid due to adverse market, economic, political, regulatory or other factors.
Currency Risk: Fluctuations in currency exchange rates may negatively affect the value of the Strategy’s investments or reduce its returns.
Subsidiary Risk: By investing in the Subsidiary, the Strategy is indirectly exposed to the risks associated with the Subsidiary’s investments. The derivatives and other investments held by the Subsidiary are generally similar to those that are permitted to be held by the Strategy and are subject to the same risks that apply to similar investments if held directly by the Strategy. The Subsidiary is not registered under the Investment Company Act of 1940, as amended (the “1940 Act”), and, unless otherwise noted in this Prospectus, is not subject to all of the investor protections of the 1940 Act. However, the Strategy wholly owns and controls the Subsidiary, and the Strategy and the Subsidiary are managed by the Adviser, making it unlikely the Subsidiary will take actions contrary to the interests of the Strategy or its shareholders.
Real Estate Risk: The Strategy’s investments in real estate securities have many of the same risks as direct ownership of real estate, including the risk that the value of real estate could decline due to a variety of factors that affect the real estate market generally. Investments in REITs may have additional risks. REITs are dependent on the capability of their managers, may have limited diversification, and could be significantly affected by changes in taxes.
Diversification Risk: The Strategy may have more risk because it is “non-diversified”, meaning that it can invest more of its assets in a smaller number of issuers and that adverse changes in the value of one security could have a more significant effect on the Strategy’s NAV.
Management Risk: The Strategy is subject to management risk because it is an actively-managed investment fund. The Adviser will apply its investment techniques and risk analyses in making investment decisions, but there is no guarantee that its techniques will produce the intended results.
These risks are fully discussed in the Strategy’s prospectus.
An Important Note About Historical Performance
The investment return and principal value of an investment in the Strategy will fluctuate, so that shares, when redeemed, may be worth more or less than their original cost. Performance shown on the following pages represents past performance and does not guarantee future results. Current performance may be lower or higher than the performance information shown. You may obtain performance information current to the most recent month-end by visiting www.alliancebernstein.com.
(Disclosures, Risks and Note about Historical Performance continued on next page)
| ALLIANCEBERNSTEIN REAL ASSET STRATEGY�� • | 5 |
Disclosures and Risks
DISCLOSURES AND RISKS
(continued from previous page)
Investors should consider the investment objectives, risks, charges and expenses of the Strategy carefully before investing. For copies of our prospectus or summary prospectus, which contain this and other information, visit us online at www.alliancebernstein.com. For Class 1 shares, Click on “Private Clients”, then “Investments”, then “Stocks” or “Bonds”, then “Prospectuses, SAIs, and Shareholder Reports”. Please read the prospectus and/or summary prospectus carefully before investing.
All fees and expenses related to the operation of the Strategy have been deducted. NAV returns do not reflect sales charges; if sales charges were reflected, the Strategy’s quoted performance would be lower. SEC returns reflect the applicable sales charges for each share class: a 4.25% maximum frontend sales charge for Class A shares; a 1% 1-year contingent deferred sales charge for Class C shares. Returns for the different share classes will vary due to different expenses associated with each class. Performance assumes reinvestment of distributions and does not account for taxes.
| 6 | • ALLIANCEBERNSTEIN REAL ASSET STRATEGY |
Disclosures and Risks
HISTORICAL PERFORMANCE
THE STRATEGY VS. ITS BENCHMARK PERIODS ENDED OCTOBER 31, 2014 (unaudited) | NAV Returns | |||||||||
| 6 Months | 12 Months | |||||||||
| AllianceBernstein Real Asset Strategy | ||||||||||
Class 1* | -8.25% | -3.35% | ||||||||
| ||||||||||
Class 2* | -8.09% | -3.12% | ||||||||
| ||||||||||
Class A | -8.36% | -3.45% | ||||||||
| ||||||||||
Class C | -8.69% | -4.13% | ||||||||
| ||||||||||
Advisor Class† | -8.17% | -3.20% | ||||||||
| ||||||||||
Class R† | -8.45% | -3.66% | ||||||||
| ||||||||||
Class K† | -8.30% | -3.39% | ||||||||
| ||||||||||
Class I† | -8.11% | -3.09% | ||||||||
| ||||||||||
Class Z† | -8.10% | 0.19% | ‡ | |||||||
| ||||||||||
| Primary Benchmark: MSCI AC World Commodity Producers Index (net) | -9.51% | -4.98% | ||||||||
| ||||||||||
| Real Asset Strategy Benchmark | -6.20% | -0.75% | ||||||||
| ||||||||||
* Class 1 shares are only available to Bernstein Global Wealth Management private client accounts. Class 2 shares are only available to the Adviser’s institutional clients or through other limited arrangements.
† Please note that these share classes are for investors purchasing shares through accounts established under certain fee-based programs sponsored and maintained by certain broker-dealers and financial intermediaries, institutional pension plans and/or investment advisory clients of, and certain other persons associated with, the Adviser and its affiliates or the Strategy.
‡ Since inception on 1/31/2014. | ||||||||||
See Disclosures, Risks and Note about Historical Performance on pages 4-6.
(Historical Performance continued on next page)
| ALLIANCEBERNSTEIN REAL ASSET STRATEGY • | 7 |
Historical Performance
HISTORICAL PERFORMANCE
(continued from previous page)
GROWTH OF A $10,000 INVESTMENT IN THE STRATEGY
3/8/10* TO 10/31/14
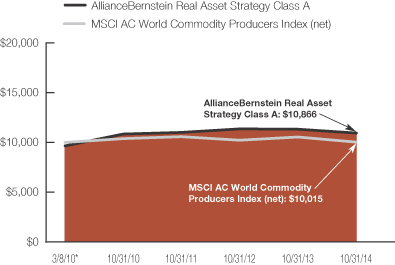
This chart illustrates the total value of an assumed $10,000 investment in AllianceBernstein Real Asset Strategy’s Class A shares (from 3/8/10* to 10/31/14) as compared to the performance of its benchmark. The chart reflects the deduction of the maximum 4.25% sales charge from the initial $10,000 investment in the Strategy and assumes the reinvestment of dividends and capital gains distributions.
| * | Inception date: 3/8/2010. |
See Disclosures, Risks and Note about Historical Performance on pages 4-6.
(Historical Performance continued on next page)
| 8 | • ALLIANCEBERNSTEIN REAL ASSET STRATEGY |
Historical Performance
HISTORICAL PERFORMANCE
(continued from previous page)
| AVERAGE ANNUAL RETURNS AS OF OCTOBER 31, 2014 (unaudited) | ||||||||
| NAV Returns | SEC Returns (reflects applicable sales charges) | |||||||
| Class 1 Shares* | ||||||||
1 Year | -3.35 | % | -3.35 | % | ||||
Since Inception† | 2.80 | % | 2.80 | % | ||||
| Class 2 Shares* | ||||||||
1 Year | -3.12 | % | -3.12 | % | ||||
Since Inception† | 3.05 | % | 3.05 | % | ||||
| Class A Shares | ||||||||
1 Year | -3.45 | % | -7.56 | % | ||||
Since Inception† | 2.75 | % | 1.80 | % | ||||
| Class C Shares | ||||||||
1 Year | -4.13 | % | -5.08 | % | ||||
Since Inception† | 2.01 | % | 2.01 | % | ||||
| Advisor Class Shares‡ | ||||||||
1 Year | -3.20 | % | -3.20 | % | ||||
Since Inception† | 3.03 | % | 3.03 | % | ||||
| Class R Shares‡ | ||||||||
1 Year | -3.66 | % | -3.66 | % | ||||
Since Inception† | 2.52 | % | 2.52 | % | ||||
| Class K Shares‡ | ||||||||
1 Year | -3.39 | % | -3.39 | % | ||||
Since Inception† | 2.80 | % | 2.80 | % | ||||
| Class I Shares‡ | ||||||||
1 Year | -3.09 | % | -3.09 | % | ||||
Since Inception† | 3.06 | % | 3.06 | % | ||||
| Class Z Shares‡ | ||||||||
Since Inception† | 0.19 | % | 0.19 | % | ||||
See Disclosures, Risks and Historical Performance on pages 4-6.
(Historical Performance continued on next page)
| ALLIANCEBERNSTEIN REAL ASSET STRATEGY • | 9 |
Historical Performance
HISTORICAL PERFORMANCE
(continued from previous page)
The Strategy’s prospectus fee table shows the Strategy’s total annual operating expense ratios as 1.16%, 1.93%, 1.34%, 2.04%, 1.04%, 1.65%, 1.33%, 0.97% and 0.93% for Class 1, Class 2, Class A, Class C, Advisor Class, Class R, Class K, Class I and Class Z shares, respectively, gross of any fee waivers or expense reimbursements. Contractual fee waivers and/or expense reimbursements limit the Strategy’s annual operating expense ratios (exclusive of interest expense) to 1.25%, 1.00%, 1.30%, 2.00%, 1.00%, 1.50%, 1.25%, 1.00% and 1.00% for Class 1, Class 2, Class A, Class C, Advisor Class, Class R, Class K, Class I and Class Z shares, respectively. These waivers/reimbursements may not be terminated before January 31, 2015 and may be extended by the Adviser for additional one-year terms. Absent reimbursements or waivers, performance would have been lower, with the exception of Class 1, Class I and Class Z shares, as these share classes are currently operating below their respective contractual expense caps. The Financial Highlights section of this report sets forth expense ratio data for the current reporting period; the expense ratios shown above may differ from the expense ratios in the Financial Highlights sections since they are based on different time periods.
| * | Class 1 shares are only available to Bernstein Global Wealth Management private client accounts. Class 2 shares are only available to the Adviser’s institutional clients or through other limited arrangements. These share classes do not carry front end sales charges; therefore their respective NAV and SEC returns are the same. |
| † | Inception dates: 3/8/2010 for all share classes excluding Class Z shares; 1/31/2014 for Class Z shares. |
| ‡ | These share classes are offered at NAV to eligible investors and their SEC returns are the same as their NAV returns. Please note that these share classes are for investors purchasing shares through accounts established under certain fee-based programs sponsored and maintained by certain broker-dealers and financial intermediaries, institutional pension plans and/or investment advisory clients of, and certain other persons associated with, the Adviser and its affiliates or the Strategy. The inception dates for these share classes are listed above. |
See Disclosures, Risks and Historical Performance on pages 4-6.
(Historical Performance continued on next page)
| 10 | • ALLIANCEBERNSTEIN REAL ASSET STRATEGY |
Historical Performance
HISTORICAL PERFORMANCE
(continued from previous page)
| SEC AVERAGE ANNUAL RETURNS AS OF THE MOST RECENT CALENDAR QUARTER-END SEPTEMBER 30, 2014 (unaudited) | ||||
| SEC Returns (reflects applicable sales charges) | ||||
| Class 1 Shares* | ||||
1 Year | 0.23 | % | ||
Since Inception† | 3.30 | % | ||
| Class 2 Shares* | ||||
1 Year | 0.49 | % | ||
Since Inception† | 3.54 | % | ||
| Class A Shares | ||||
1 Year | -4.13 | % | ||
Since Inception† | 2.28 | % | ||
| Class C Shares | ||||
1 Year | -1.54 | % | ||
Since Inception† | 2.52 | % | ||
| Advisor Class Shares‡ | ||||
1 Year | 0.45 | % | ||
Since Inception† | 3.54 | % | ||
| Class R Shares‡ | ||||
1 Year | -0.02 | % | ||
Since Inception† | 3.03 | % | ||
| Class K Shares‡ | ||||
1 Year | 0.18 | % | ||
Since Inception† | 3.30 | % | ||
| Class I Shares‡ | ||||
1 Year | 0.39 | % | ||
Since Inception† | 3.54 | % | ||
| Class Z Shares‡ | ||||
Since Inception† | 2.09 | % | ||
| * | Class 1 shares are only available to Bernstein Global Wealth Management private client accounts. Class 2 shares are only available to the Adviser’s institutional clients or through other limited arrangements. |
| † | Inception dates: 3/8/2010 for all share classes excluding Class Z shares; 1/31/2014 for Class Z shares. |
| ‡ | Please note that these share classes are for investors purchasing shares through accounts established under certain fee-based programs sponsored and maintained by certain broker-dealers and financial intermediaries, institutional pension plans and/or investment advisory clients of, and certain other persons associated with, the Adviser and its affiliates or the Strategy. The inception dates for these share classes are listed above. |
See Disclosures, Risks and Historical Performance on pages 4-6.
| ALLIANCEBERNSTEIN REAL ASSET STRATEGY • | 11 |
Historical Performance
EXPENSE EXAMPLE
(unaudited)
As a shareholder of a mutual fund, you may incur two types of costs: (1) transaction costs, including sales charges (loads) on purchase payments, contingent deferred sales charges on redemptions and (2) ongoing costs, including management fees; distribution (12b-1) fees; and other fund expenses. This example is intended to help you understand your ongoing costs (in dollars) of investing in the Fund and to compare these costs with the ongoing costs of investing in other mutual funds.
The Example is based on an investment of $1,000 invested at the beginning of the period and held for the entire period as indicated below.
Actual Expenses
The table below provides information about actual account values and actual expenses. You may use the information in this line, together with the amount you invested, to estimate the expenses that you paid over the period. Simply divide your account value by $1,000 (for example, an $8,600 account value divided by $1,000 = 8.6), then multiply the result by the number in the first line under the heading entitled “Expenses Paid During Period” to estimate the expenses you paid on your account during this period.
Hypothetical Example for Comparison Purposes
The table below provides information about hypothetical account values and hypothetical expenses based on the Fund’s actual expense ratio and an assumed annual rate of return of 5% before expenses, which is not the Fund’s actual return. The hypothetical account values and expenses may not be used to estimate the actual ending account balance or expenses you paid for the period. You may use this information to compare the ongoing costs of investing in the Fund and other funds by comparing this 5% hypothetical example with the 5% hypothetical examples that appear in the shareholder reports of other funds.
Please note that the expenses shown in the table are meant to highlight your ongoing costs only and do not reflect any transactional costs, such as sales charges (loads), or contingent deferred sales charges on redemptions. Therefore, the hypothetical example is useful in comparing ongoing costs only, and will not help you determine the relative total costs of owning different funds. In addition, if these transactional costs were included, your costs would have been higher.
| Beginning Account Value May 1, 2014 | Ending Account Value October 31, 2014 | Expenses Paid During Period* | Annualized Expense Ratio* | |||||||||||||
| Class A | ||||||||||||||||
Actual | $ | 1,000 | $ | 916.40 | $ | 6.28 | 1.30 | % | ||||||||
Hypothetical** | $ | 1,000 | $ | 1,018.65 | $ | 6.61 | 1.30 | % | ||||||||
| Class C | ||||||||||||||||
Actual | $ | 1,000 | $ | 913.10 | $ | 9.64 | 2.00 | % | ||||||||
Hypothetical** | $ | 1,000 | $ | 1,015.12 | $ | 10.16 | 2.00 | % | ||||||||
| Advisor Class | ||||||||||||||||
Actual | $ | 1,000 | $ | 918.30 | $ | 4.84 | 1.00 | % | ||||||||
Hypothetical** | $ | 1,000 | $ | 1,020.16 | $ | 5.09 | 1.00 | % | ||||||||
| Class R | ||||||||||||||||
Actual | $ | 1,000 | $ | 915.50 | $ | 7.24 | 1.50 | % | ||||||||
Hypothetical** | $ | 1,000 | $ | 1,017.64 | $ | 7.68 | 1.50 | % | ||||||||
| Class K | ||||||||||||||||
Actual | $ | 1,000 | $ | 917.00 | $ | 6.04 | 1.25 | % | ||||||||
Hypothetical** | $ | 1,000 | $ | 1,018.90 | $ | 6.36 | 1.25 | % | ||||||||
| 12 | • ALLIANCEBERNSTEIN REAL ASSET STRATEGY |
Expense Example
EXPENSE EXAMPLE
(unaudited)
(continued from previous page)
| Beginning Account Value May 1, 2014 | Ending Account Value October 31, 2014 | Expenses Paid During Period* | Annualized Expense Ratio* | |||||||||||||
| Class I | ||||||||||||||||
Actual | $ | 1,000 | $ | 918.90 | $ | 4.55 | 0.94 | % | ||||||||
Hypothetical** | $ | 1,000 | $ | 1,020.47 | $ | 4.79 | 0.94 | % | ||||||||
| Class 1 | ||||||||||||||||
Actual | $ | 1,000 | $ | 917.50 | $ | 5.51 | 1.14 | % | ||||||||
Hypothetical** | $ | 1,000 | $ | 1,019.46 | $ | 5.80 | 1.14 | % | ||||||||
| Class 2 | ||||||||||||||||
Actual | $ | 1,000 | $ | 919.10 | $ | 4.35 | 0.90 | % | ||||||||
Hypothetical** | $ | 1,000 | $ | 1,020.67 | $ | 4.58 | 0.90 | % | ||||||||
| Class Z | ||||||||||||||||
Actual | $ | 1,000 | $ | 919.00 | $ | 4.26 | 0.88 | % | ||||||||
Hypothetical** | $ | 1,000 | $ | 1,021.00 | $ | 4.48 | 0.88 | % | ||||||||
| * | Expenses are equal to the Strategy’s annualized expense ratio, multiplied by the average account value over the period, multiplied by 184/365 (to reflect the one-half year period). |
| ** | Assumes 5% annual return before expenses. |
| ALLIANCEBERNSTEIN REAL ASSET STRATEGY • | 13 |
Expense Example
PORTFOLIO SUMMARY
October 31, 2014 (unaudited)
PORTFOLIO STATISTICS
Net Assets ($mil): $632.7
| STRATEGY BREAKDOWN* | ||||||
Commodity Related Stocks | 47.4 | % | ||||
Commodity Related Derivatives | 42.4 | % | ||||
Real Estate Stocks | 18.6 | % | ||||
Other | (8.4 | )% | ||||
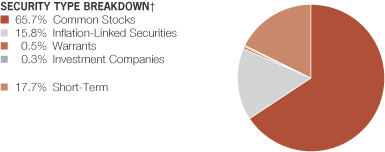
| * | All data are as of October 31, 2014. The Strategy breakdown is expressed as an approximate percentage of the Strategy’s net assets inclusive of derivative exposure, based on the Advisor’s internal classification guidelines. |
| † | The Strategy’s security type breakdown is expressed as a percentage of total investments and may vary over time. The Strategy also enters into derivative transactions, which may be used for hedging or investment purposes (see “Portfolio of Investments” section of the report for additional details). |
| 14 | • ALLIANCEBERNSTEIN REAL ASSET STRATEGY |
Portfolio Summary
TEN LARGEST EQUITY HOLDINGS*
October 31, 2014 (unaudited)
| Company | U.S. $ Value | Percent of Net Assets | ||||||
Exxon Mobil Corp. | $ | 31,249,806 | 4.9 | % | ||||
Royal Dutch Shell PLC | 22,764,569 | 3.6 | ||||||
Chevron Corp. | 16,808,833 | 2.7 | ||||||
Total SA | 14,330,991 | 2.3 | ||||||
BP PLC | 10,200,830 | 1.6 | ||||||
BG Group PLC | 7,677,757 | 1.2 | ||||||
Occidental Petroleum Corp. | 7,575,146 | 1.2 | ||||||
ConocoPhillips | 7,537,222 | 1.2 | ||||||
Rio Tinto PLC | 6,557,818 | 1.0 | ||||||
Glencore PLC | 4,865,755 | 0.8 | ||||||
| $ | 129,568,727 | 20.5 | % | |||||
| * | Long-term investments. |
| ALLIANCEBERNSTEIN REAL ASSET STRATEGY • | 15 |
Ten Largest Equity Holdings
CONSOLIDATED PORTFOLIO OF INVESTMENTS
October 31, 2014
| Company | Shares | U.S. $ Value | ||||||
| ||||||||
COMMON STOCKS – 65.5% | ||||||||
Energy – 29.7% | ||||||||
Coal & Consumable Fuels – 0.2% | ||||||||
Cameco Corp. | 19,112 | $ | 331,859 | |||||
China Shenhua Energy Co., Ltd. – Class H | 159,800 | 449,371 | ||||||
CONSOL Energy, Inc. | 11,081 | 407,781 | ||||||
Peabody Energy Corp. | 13,113 | 136,769 | ||||||
|
| |||||||
| 1,325,780 | ||||||||
|
| |||||||
Integrated Oil & Gas – 18.2% | ||||||||
BG Group PLC | 460,683 | 7,677,757 | ||||||
BP PLC | 1,417,786 | 10,200,830 | ||||||
Chevron Corp. | 140,132 | 16,808,833 | ||||||
China Petroleum & Chemical Corp. – Class H | 1,464,000 | 1,269,598 | ||||||
Exxon Mobil Corp. | 323,129 | 31,249,806 | ||||||
Galp Energia SGPS SA | 40,650 | 589,363 | ||||||
Gazprom OAO (Sponsored ADR) | 44,820 | 295,722 | ||||||
Hess Corp. | 23,230 | 1,970,136 | ||||||
LUKOIL OAO (London) (Sponsored ADR) | 46,220 | 2,267,091 | ||||||
PetroChina Co., Ltd. – Class H | 1,384,000 | 1,734,474 | ||||||
Petroleo Brasileiro SA (ADR) | 222,930 | 2,608,281 | ||||||
Petroleo Brasileiro SA (Sponsored ADR) | 108,260 | 1,324,020 | ||||||
Royal Dutch Shell PLC (Euronext Amsterdam) – Class A | 223,486 | 7,991,950 | ||||||
Royal Dutch Shell PLC – Class A | 188,619 | 6,737,801 | ||||||
Royal Dutch Shell PLC – Class B | 217,478 | 8,034,818 | ||||||
Total SA | 240,037 | 14,330,991 | ||||||
|
| |||||||
| 115,091,471 | ||||||||
|
| |||||||
Oil & Gas Drilling – 0.1% | ||||||||
Nabors Industries Ltd. | 35,580 | 635,103 | ||||||
Odfjell Drilling Ltd. | 104,210 | 305,680 | ||||||
|
| |||||||
| 940,783 | ||||||||
|
| |||||||
Oil & Gas Equipment & Services – 0.6% | ||||||||
Aker Solutions ASA(a)(b) | 125,940 | 815,955 | ||||||
Deep Sea Supply PLC | 547,947 | 620,520 | ||||||
Halliburton Co. | 16,510 | 910,362 | ||||||
Helix Energy Solutions Group, Inc.(b) | 25,260 | 672,926 | ||||||
Petroleum Geo-Services ASA | 105,750 | 525,240 | ||||||
|
| |||||||
| 3,545,003 | ||||||||
|
| |||||||
Oil & Gas Exploration & Production – 8.5% | ||||||||
Anadarko Petroleum Corp. | 48,195 | 4,423,337 | ||||||
Apache Corp. | 19,088 | 1,473,593 | ||||||
Cabot Oil & Gas Corp. | 20,411 | 634,782 | ||||||
Canadian Natural Resources Ltd. | 129,876 | 4,532,206 | ||||||
Chesapeake Energy Corp. | 25,689 | 569,782 | ||||||
CNOOC Ltd. | 870,200 | 1,360,399 | ||||||
Concho Resources, Inc.(b) | 5,400 | 588,762 | ||||||
ConocoPhillips | 104,466 | 7,537,222 | ||||||
Crescent Point Energy Corp. | 19,852 | 656,126 | ||||||
| 16 | • ALLIANCEBERNSTEIN REAL ASSET STRATEGY |
Consolidated Portfolio of Investments
| Company | Shares | U.S. $ Value | ||||||
| ||||||||
Det Norske Oljeselskap ASA(b) | 154,347 | $ | 999,016 | |||||
Devon Energy Corp. | 18,718 | 1,123,080 | ||||||
EnCana Corp. | 35,791 | 666,883 | ||||||
EOG Resources, Inc. | 51,034 | 4,850,782 | ||||||
EQT Corp. | 7,299 | 686,398 | ||||||
Inpex Corp. | 95,800 | 1,225,324 | ||||||
Marathon Oil Corp. | 33,696 | 1,192,838 | ||||||
MEG Energy Corp.(b) | 33,510 | 808,724 | ||||||
Murphy Oil Corp. | 22,840 | 1,219,428 | ||||||
Noble Energy, Inc. | 17,402 | 1,002,877 | ||||||
Occidental Petroleum Corp. | 85,181 | 7,575,146 | ||||||
Pioneer Natural Resources Co. | 6,911 | 1,306,594 | ||||||
Rosetta Resources, Inc.(b) | 31,230 | 1,187,677 | ||||||
SM Energy Co. | 20,290 | 1,142,327 | ||||||
Southwestern Energy Co.(b) | 17,068 | 554,881 | ||||||
Whiting Petroleum Corp.(b) | 8,860 | 542,586 | ||||||
Williams Cos., Inc. (The) | 80,580 | 4,472,996 | ||||||
Woodside Petroleum Ltd. | 31,719 | 1,126,670 | ||||||
|
| |||||||
| 53,460,436 | ||||||||
|
| |||||||
Oil & Gas Refining & Marketing – 0.3% | ||||||||
JX Holdings, Inc. | 199,600 | 855,016 | ||||||
Valero Energy Corp. | 21,050 | 1,054,395 | ||||||
|
| |||||||
| 1,909,411 | ||||||||
|
| |||||||
Oil & Gas Storage & Transportation – 1.8% | ||||||||
Enbridge, Inc. | 87,620 | 4,146,022 | ||||||
Kinder Morgan, Inc./DE | 96,670 | 3,741,129 | ||||||
TransCanada Corp. | 71,230 | 3,510,782 | ||||||
|
| |||||||
| 11,397,933 | ||||||||
|
| |||||||
| 187,670,817 | ||||||||
|
| |||||||
Materials – 9.4% | ||||||||
Aluminum – 0.3% | ||||||||
Alcoa, Inc. | 33,662 | 564,175 | ||||||
Norsk Hydro ASA | 224,179 | 1,255,160 | ||||||
|
| |||||||
| 1,819,335 | ||||||||
|
| |||||||
Commodity Chemicals – 0.4% | ||||||||
Denki Kagaku Kogyo KK | 189,000 | 617,368 | ||||||
LyondellBasell Industries NV – Class A | 12,840 | 1,176,529 | ||||||
Westlake Chemical Corp. | 11,640 | 821,202 | ||||||
|
| |||||||
| 2,615,099 | ||||||||
|
| |||||||
Construction Materials – 0.1% | ||||||||
West China Cement Ltd. | 6,404,000 | 636,143 | ||||||
|
| |||||||
Diversified Chemicals – 0.6% | ||||||||
Arkema SA | 14,510 | 895,585 | ||||||
Eastman Chemical Co. | 11,770 | 950,781 | ||||||
Huntsman Corp. | 50,490 | 1,231,956 | ||||||
Mitsubishi Gas Chemical Co., Inc. | 156,000 | 933,376 | ||||||
|
| |||||||
| 4,011,698 | ||||||||
|
| |||||||
| ALLIANCEBERNSTEIN REAL ASSET STRATEGY • | 17 |
Consolidated Portfolio of Investments
| Company | Shares | U.S. $ Value | ||||||
| ||||||||
Diversified Metals & Mining – 3.8% | ||||||||
Anglo American PLC | 43,551 | $ | 919,516 | |||||
Aurubis AG | 20,130 | 1,050,835 | ||||||
BHP Billiton Ltd. | 148,755 | 4,450,278 | ||||||
BHP Billiton PLC | 65,978 | 1,704,647 | ||||||
Boliden AB | 43,780 | 723,568 | ||||||
Freeport-McMoRan, Inc. | 32,437 | 924,454 | ||||||
Glencore PLC(b) | 948,373 | 4,865,755 | ||||||
Korea Zinc Co., Ltd. | 2,630 | 990,439 | ||||||
MMC Norilsk Nickel OJSC (ADR) | 89,130 | 1,658,709 | ||||||
Rio Tinto PLC | 137,823 | 6,557,818 | ||||||
|
| |||||||
| 23,846,019 | ||||||||
|
| |||||||
Fertilizers & Agricultural Chemicals – 0.9% | ||||||||
Monsanto Co. | 27,997 | 3,220,775 | ||||||
Mosaic Co. (The) | 10,183 | 451,209 | ||||||
Potash Corp. of Saskatchewan, Inc. | 26,861 | 916,856 | ||||||
Syngenta AG | 2,931 | 906,433 | ||||||
|
| |||||||
| 5,495,273 | ||||||||
|
| |||||||
Forest Products – 0.0% | ||||||||
Duratex SA | 9,430 | 33,898 | ||||||
|
| |||||||
Gold – 0.9% | ||||||||
Agnico Eagle Mines Ltd. | 6,150 | 144,931 | ||||||
Barrick Gold Corp. | 123,516 | 1,466,345 | ||||||
Franco-Nevada Corp. | 4,404 | 206,162 | ||||||
Goldcorp, Inc. | 120,879 | 2,268,392 | ||||||
Koza Altin Isletmeleri AS | 85,740 | 552,632 | ||||||
New Gold, Inc.(b) | 62,800 | 227,898 | ||||||
Newcrest Mining Ltd.(b) | 23,156 | 189,916 | ||||||
Newmont Mining Corp. | 14,915 | 279,805 | ||||||
Real Gold Mining Ltd.(b)(c)(d) | 124,500 | 2 | ||||||
Yamana Gold, Inc. | 26,061 | 103,823 | ||||||
|
| |||||||
| 5,439,906 | ||||||||
|
| |||||||
Paper Products – 0.4% | ||||||||
International Paper Co. | 13,130 | 664,641 | ||||||
Mondi PLC | 57,610 | 973,636 | ||||||
OJI Holdings Corp. | 25,000 | 90,389 | ||||||
Sappi Ltd.(b) | 192,690 | 763,176 | ||||||
Stora Enso Oyj – Class R | 17,338 | 143,179 | ||||||
UPM-Kymmene Oyj | 16,667 | 264,380 | ||||||
|
| |||||||
| 2,899,401 | ||||||||
|
| |||||||
Precious Metals & Minerals – 0.1% | ||||||||
Fresnillo PLC | 6,620 | 73,980 | ||||||
Impala Platinum Holdings Ltd.(b) | 16,188 | 118,070 | ||||||
Industrias Penoles SAB de CV | 4,175 | 94,561 | ||||||
North American Palladium Ltd.(b) | 2,174,730 | 343,607 | ||||||
Silver Wheaton Corp. | 10,713 | 186,210 | ||||||
|
| |||||||
| 816,428 | ||||||||
|
| |||||||
| 18 | • ALLIANCEBERNSTEIN REAL ASSET STRATEGY |
Consolidated Portfolio of Investments
| Company | Shares | U.S. $ Value | ||||||
| ||||||||
Specialty Chemicals – 0.2% | ||||||||
Johnson Matthey PLC | 13,420 | $ | 640,692 | |||||
Koninklijke DSM NV | 9,958 | 623,948 | ||||||
|
| |||||||
| 1,264,640 | ||||||||
|
| |||||||
Steel – 1.7% | ||||||||
ArcelorMittal (Euronext Amsterdam) | 31,206 | 409,927 | ||||||
BlueScope Steel Ltd.(b) | 123,636 | 576,386 | ||||||
China Steel Corp. (Sponsored GDR)(a) | 18,757 | 315,118 | ||||||
JFE Holdings, Inc. | 15,272 | 302,996 | ||||||
Nippon Steel & Sumitomo Metal Corp. | 235,495 | 621,435 | ||||||
Nucor Corp. | 9,941 | 537,410 | ||||||
POSCO | 2,047 | 591,249 | ||||||
Tata Steel Ltd. (GDR)(a) | 129,290 | 1,034,320 | ||||||
Ternium SA (Sponsored ADR) | 30,910 | 680,329 | ||||||
ThyssenKrupp AG(b) | 14,083 | 339,423 | ||||||
Vale SA | 40,753 | 411,165 | ||||||
Vale SA (Preference Shares) | 59,333 | 516,012 | ||||||
Vale SA (Sponsored ADR) (Local Preference Shares) | 412,360 | 3,612,274 | ||||||
Voestalpine AG | 16,120 | 645,733 | ||||||
|
| |||||||
| 10,593,777 | ||||||||
|
| |||||||
| 59,471,617 | ||||||||
|
| |||||||
Equity: Other – 7.5% | ||||||||
Diversified/Specialty – 6.7% | ||||||||
Alam Sutera Realty Tbk PT | 1,029,400 | 39,524 | ||||||
Alexandria Real Estate Equities, Inc. | 1,118 | 92,794 | ||||||
Armada Hoffler Properties, Inc. | 28,711 | 269,309 | ||||||
Ayala Land, Inc. | 743,960 | 555,903 | ||||||
Azrieli Group | 3,444 | 111,320 | ||||||
Beni Stabili SpA SIIQ | 78,535 | 54,152 | ||||||
British Land Co. PLC (The) | 173,949 | 2,031,151 | ||||||
Bumi Serpong Damai Tbk PT | 639,600 | 84,998 | ||||||
Buzzi Unicem SpA | 23,100 | 312,565 | ||||||
CA Immobilien Anlagen AG(b) | 33,751 | 647,363 | ||||||
Canadian Real Estate Investment Trust | 1,090 | 47,863 | ||||||
Capital Property Fund | 285,797 | 331,148 | ||||||
CapitaLand Ltd. | 235,400 | 581,183 | ||||||
Central Pattana PCL | 117,851 | 174,587 | ||||||
Cheung Kong Holdings Ltd. | 38,000 | 676,057 | ||||||
Ciputra Development Tbk PT | 903,500 | 85,679 | ||||||
City Developments Ltd. | 53,900 | 396,700 | ||||||
ClubCorp Holdings, Inc. | 32,550 | 620,403 | ||||||
Cofinimmo SA | 5,265 | 611,532 | ||||||
Country Garden Holdings Co., Ltd. | 388,000 | 152,436 | ||||||
CSR Ltd. | 95,080 | 291,005 | ||||||
Digital Realty Trust, Inc. | 2,120 | 146,259 | ||||||
Duke Realty Corp. | 5,141 | 97,473 | ||||||
East Japan Railway Co. | 4,300 | 335,844 | ||||||
Eastern & Oriental Bhd | 64,400 | 54,846 | ||||||
| ALLIANCEBERNSTEIN REAL ASSET STRATEGY • | 19 |
Consolidated Portfolio of Investments
| Company | Shares | U.S. $ Value | ||||||
| ||||||||
Evergrande Real Estate Group Ltd. | 514,250 | $ | 197,615 | |||||
Fibra Uno Administracion SA de CV | 390,832 | 1,356,538 | ||||||
Folkestone Education Trust | 90,810 | 149,037 | ||||||
Fonciere Des Regions | 3,169 | 291,344 | ||||||
Fukuoka REIT Corp. | 95 | 177,109 | ||||||
Gecina SA | 3,221 | 435,928 | ||||||
Globe Trade Centre SA(b) | 21,734 | 39,272 | ||||||
GPT Group (The) | 243,198 | 883,994 | ||||||
Gramercy Property Trust, Inc. | 106,954 | 668,463 | ||||||
Great Portland Estates PLC | 32,253 | 354,978 | ||||||
Grivalia Properties REIC | 3,692 | 39,906 | ||||||
Growthpoint Properties Ltd. | 298,411 | 724,496 | ||||||
Guangzhou R&F Properties Co., Ltd. – Class H | 82,700 | 90,201 | ||||||
H&R Real Estate Investment Trust | 4,293 | 85,437 | ||||||
Hang Lung Properties Ltd. | 200,000 | 624,546 | ||||||
Hemfosa Fastigheter AB(b) | 20,647 | 342,485 | ||||||
Henderson Land Development Co., Ltd. | 124,331 | 839,952 | ||||||
Home Depot, Inc. (The) | 2,300 | 224,296 | ||||||
Hufvudstaden AB – Class A | 10,343 | 134,210 | ||||||
Hulic Co., Ltd. | 27,350 | 302,586 | ||||||
IGB Corp. Bhd | 67,100 | 58,751 | ||||||
IJM Land Bhd | 36,500 | 38,173 | ||||||
IMMOFINANZ AG(b) | 76,215 | 230,734 | ||||||
Kennedy Wilson Europe Real Estate PLC | 36,143 | 601,307 | ||||||
Kennedy-Wilson Holdings, Inc. | 25,100 | 679,959 | ||||||
Kiwi Income Property Trust | 93,620 | 87,580 | ||||||
KLCCP Stapled Group | 38,300 | 80,111 | ||||||
Land & Houses PCL | 239,600 | 74,300 | ||||||
Land Securities Group PLC | 74,663 | 1,324,824 | ||||||
Lend Lease Group | 22,270 | 310,600 | ||||||
Lippo Karawaci Tbk PT | 1,671,600 | 148,058 | ||||||
Longfor Properties Co., Ltd. | 121,700 | �� | 141,334 | |||||
Mah Sing Group Bhd | 69,900 | 50,577 | ||||||
Mapletree Greater China Commercial Trust(a) | 157,000 | 115,443 | ||||||
Merlin Properties Socimi SA(b) | 89,130 | 1,055,502 | ||||||
Mitchells & Butlers PLC(b) | 52,660 | 320,530 | ||||||
Mitsubishi Estate Co., Ltd. | 145,600 | 3,709,124 | ||||||
Mitsui Fudosan Co., Ltd. | 108,400 | 3,486,840 | ||||||
New World China Land Ltd. | 222,000 | 134,670 | ||||||
New World Development Co., Ltd. | 137,630 | 173,357 | ||||||
Nomura Real Estate Master Fund, Inc. | 157 | 189,813 | ||||||
Orix JREIT, Inc. | 286 | 381,313 | ||||||
PLA Administradora Industrial S de RL de CV(b) | 106,140 | 245,601 | ||||||
Pruksa Real Estate PCL | 53,500 | 55,028 | ||||||
Quality Houses PCL | 304,900 | 40,254 | ||||||
Redefine Properties Ltd. | 294,830 | 267,153 | ||||||
Regal Entertainment Group – Class A | 29,930 | 662,950 | ||||||
Resilient Property Income Fund Ltd. | 20,726 | 153,109 | ||||||
| 20 | • ALLIANCEBERNSTEIN REAL ASSET STRATEGY |
Consolidated Portfolio of Investments
| Company | Shares | U.S. $ Value | ||||||
| ||||||||
SM Prime Holdings, Inc. | 647,600 | $ | 252,244 | |||||
SOHO China Ltd. | 135,000 | 98,890 | ||||||
SP Setia Bhd Group | 70,600 | 70,616 | ||||||
Spirit Realty Capital, Inc. | 18,470 | 219,793 | ||||||
Sponda Oyj | 22,771 | 104,258 | ||||||
Sumitomo Realty & Development Co., Ltd. | 58,700 | 2,200,602 | ||||||
Summarecon Agung Tbk PT | 892,300 | 93,017 | ||||||
Sun Hung Kai Properties Ltd. | 193,923 | 2,901,053 | ||||||
Sunac China Holdings Ltd. | 157,600 | 136,865 | ||||||
Suntec Real Estate Investment Trust | 224,000 | 311,208 | ||||||
Supalai PCL | 311,200 | 246,036 | ||||||
Swiss Prime Site AG(b) | 5,186 | 394,276 | ||||||
Taiheiyo Cement Corp. | 44,000 | 161,434 | ||||||
Tokyu Fudosan Holdings Corp. | 22,900 | 162,757 | ||||||
Top REIT, Inc. | 45 | 185,741 | ||||||
United Urban Investment Corp. | 236 | 372,456 | ||||||
Vornado Realty Trust | 4,266 | 467,042 | ||||||
Wallenstam AB – Class B | 9,404 | 141,883 | ||||||
Wharf Holdings Ltd. (The) | 255,000 | 1,890,949 | ||||||
Wihlborgs Fastigheter AB | 6,299 | 110,474 | ||||||
WP Carey, Inc. | 1,335 | 90,406 | ||||||
|
| |||||||
| 42,193,482 | ||||||||
|
| |||||||
Health Care – 0.8% | ||||||||
Chartwell Retirement Residences | 31,610 | 322,537 | ||||||
HCP, Inc. | 28,540 | 1,254,903 | ||||||
Health Care REIT, Inc. | 4,858 | 345,452 | ||||||
LTC Properties, Inc. | 13,050 | 547,317 | ||||||
Medical Properties Trust, Inc. | 57,870 | 780,666 | ||||||
Omega Healthcare Investors, Inc. | 19,103 | 728,971 | ||||||
Senior Housing Properties Trust | 3,190 | 72,062 | ||||||
Ventas, Inc. | 13,787 | 944,548 | ||||||
|
| |||||||
| 4,996,456 | ||||||||
|
| |||||||
Triple Net – 0.0% | ||||||||
Realty Income Corp. | 3,471 | 159,770 | ||||||
|
| |||||||
| 47,349,708 | ||||||||
|
| |||||||
Utilities – 5.0% | ||||||||
Electric Utilities – 1.8% | ||||||||
CLP Holdings Ltd. | 105,000 | 903,490 | ||||||
Electricite de France SA | 76,580 | 2,261,284 | ||||||
Endesa SA | 48,270 | 941,645 | ||||||
Enel SpA | 457,680 | 2,338,708 | ||||||
Fortum Oyj | 40,220 | 932,773 | ||||||
Iberdrola SA | 280,850 | 1,988,113 | ||||||
Korea Electric Power Corp. | 24,460 | 1,073,691 | ||||||
SSE PLC | 45,730 | 1,172,105 | ||||||
|
| |||||||
| 11,611,809 | ||||||||
|
| |||||||
Gas Utilities – 0.7% | ||||||||
Gas Natural SDG SA | 47,880 | 1,382,618 | ||||||
Hong Kong & China Gas Co., Ltd. | 475,000 | 1,109,213 | ||||||
| ALLIANCEBERNSTEIN REAL ASSET STRATEGY • | 21 |
Consolidated Portfolio of Investments
| Company | Shares | U.S. $ Value | ||||||
| ||||||||
Petronas Gas Bhd | 96,900 | $ | 664,452 | |||||
Snam SpA | 165,970 | 897,480 | ||||||
|
| |||||||
| 4,053,763 | ||||||||
|
| |||||||
Independent Power Producers & Energy Traders – 0.4% | ||||||||
Aboitiz Power Corp. | 216,800 | 198,103 | ||||||
AES Corp./VA | 22,830 | 321,218 | ||||||
Calpine Corp.(b) | 13,260 | 302,593 | ||||||
China Resources Power Holdings Co., Ltd. | 144,000 | 419,133 | ||||||
EDP Renovaveis SA | 31,940 | 207,663 | ||||||
Electric Power Development Co., Ltd. | 5,000 | 174,856 | ||||||
Enel Green Power SpA | 188,650 | 463,753 | ||||||
NRG Energy, Inc. | 12,620 | 378,348 | ||||||
Tractebel Energia SA | 20,700 | 281,942 | ||||||
|
| |||||||
| 2,747,609 | ||||||||
|
| |||||||
Multi-Utilities – 1.9% | ||||||||
Centrica PLC | 203,860 | 988,715 | ||||||
Dominion Resources, Inc./VA | 23,340 | 1,664,142 | ||||||
E.ON SE | 88,500 | 1,525,748 | ||||||
GDF Suez | 102,570 | 2,490,392 | ||||||
National Grid PLC | 147,480 | 2,188,598 | ||||||
PG&E Corp. | 19,010 | 956,583 | ||||||
RWE AG | 26,640 | 945,234 | ||||||
Sempra Energy | 9,650 | 1,061,500 | ||||||
United Utilities Group PLC | 30,970 | 424,545 | ||||||
|
| |||||||
| 12,245,457 | ||||||||
|
| |||||||
Water Utilities – 0.2% | ||||||||
American Water Works Co., Inc. | 7,620 | 406,679 | ||||||
Cia de Saneamento Basico do Estado de Sao Paulo | 35,500 | 277,837 | ||||||
Severn Trent PLC | 10,720 | 342,649 | ||||||
|
| |||||||
| 1,027,165 | ||||||||
|
| |||||||
| 31,685,803 | ||||||||
|
| |||||||
Retail – 3.9% | ||||||||
Regional Mall – 1.2% | ||||||||
BR Malls Participacoes SA | 58,240 | 467,725 | ||||||
CapitaMall Trust | 239,000 | 366,576 | ||||||
General Growth Properties, Inc. | 7,963 | 206,321 | ||||||
Macerich Co. (The) | 6,209 | 437,734 | ||||||
Multiplan Empreendimentos Imobiliarios SA | 14,480 | 299,488 | ||||||
Pennsylvania Real Estate Investment Trust | 31,860 | 682,760 | ||||||
Simon Property Group, Inc. | 15,496 | 2,777,038 | ||||||
Taubman Centers, Inc. | 2,764 | 210,203 | ||||||
Washington Prime Group, Inc. | 42,521 | 749,645 | ||||||
Westfield Corp. | 219,069 | 1,539,396 | ||||||
|
| |||||||
| 7,736,886 | ||||||||
|
| |||||||
| 22 | • ALLIANCEBERNSTEIN REAL ASSET STRATEGY |
Consolidated Portfolio of Investments
| Company | Shares | U.S. $ Value | ||||||
| ||||||||
Shopping Center/Other Retail – 2.7% | ||||||||
Aeon Mall Co., Ltd. | 14,600 | $ | 267,994 | |||||
American Realty Capital Properties, Inc. | 14,317 | 126,992 | ||||||
Atrium European Real Estate Ltd.(b) | 13,358 | 69,955 | ||||||
Calloway Real Estate Investment Trust | 1,640 | 40,132 | ||||||
Capital & Counties Properties PLC | 68,263 | 373,438 | ||||||
CapitaMalls Malaysia Trust | 91,800 | 40,189 | ||||||
Citycon Oyj | 78,589 | 254,622 | ||||||
DDR Corp. | 34,166 | 619,771 | ||||||
Deutsche Euroshop AG | 4,329 | 193,682 | ||||||
Federal Realty Investment Trust | 1,049 | 138,258 | ||||||
Federation Centres | 196,460 | 471,778 | ||||||
Hammerson PLC | 102,448 | 1,006,448 | ||||||
Harvey Norman Holdings Ltd. | 46,480 | 156,302 | ||||||
Hyprop Investments Ltd. | 42,100 | 367,534 | ||||||
IGB Real Estate Investment Trust | 141,800 | 56,915 | ||||||
Iguatemi Empresa de Shopping Centers SA | 4,800 | 48,622 | ||||||
Intu Properties PLC | 83,628 | 456,209 | ||||||
Japan Retail Fund Investment Corp. | 388 | 781,217 | ||||||
Kimco Realty Corp. | 6,308 | 157,385 | ||||||
Kite Realty Group Trust | 25,229 | 653,179 | ||||||
Klepierre | 25,389 | 1,098,884 | ||||||
Link REIT (The) | 221,923 | 1,306,472 | ||||||
Ramco-Gershenson Properties Trust | 38,643 | 675,480 | ||||||
Regency Centers Corp. | 5,290 | 321,103 | ||||||
Retail Opportunity Investments Corp. | 42,030 | 686,770 | ||||||
RioCan Real Estate Investment Trust | 11,418 | 268,974 | ||||||
Scentre Group(b) | 762,762 | 2,433,163 | ||||||
Unibail-Rodamco SE | 13,037 | 3,342,783 | ||||||
Vastned Retail NV | 11,515 | 525,853 | ||||||
Weingarten Realty Investors | 4,540 | 164,575 | ||||||
|
| |||||||
| 17,104,679 | ||||||||
|
| |||||||
| 24,841,565 | ||||||||
|
| |||||||
Residential – 3.0% | ||||||||
Multi-Family – 2.7% | ||||||||
Apartment Investment & Management Co. – Class A | 2,262 | 80,957 | ||||||
Associated Estates Realty Corp. | 49,560 | 967,907 | ||||||
AvalonBay Communities, Inc. | 4,991 | 777,798 | ||||||
Barratt Developments PLC | 46,740 | 314,204 | ||||||
Boardwalk Real Estate Investment Trust | 621 | 39,341 | ||||||
BUWOG AG(b) | 3,810 | 70,437 | ||||||
Camden Property Trust | 1,334 | 102,278 | ||||||
Canadian Apartment Properties REIT | 1,767 | 39,195 | ||||||
China Overseas Land & Investment Ltd. | 732,140 | 2,128,977 | ||||||
China Resources Land Ltd. | 149,380 | 354,918 | ||||||
China Vanke Co., Ltd. – Class H(b) | 619,274 | 1,164,869 | ||||||
CIFI Holdings Group Co., Ltd. | 1,732,000 | 321,503 | ||||||
Comforia Residential REIT, Inc. | 95 | 176,963 | ||||||
Corp. GEO SAB de CV Series B(b)(c)(d) | 23,600 | 181 | ||||||
| ALLIANCEBERNSTEIN REAL ASSET STRATEGY • | 23 |
Consolidated Portfolio of Investments
| Company | Shares | U.S. $ Value | ||||||
| ||||||||
Cyrela Brazil Realty SA Empreendimentos e Participacoes | 22,100 | $ | 109,880 | |||||
Desarrolladora Homex SAB de CV(b)(c)(d) | 14,600 | 2,405 | ||||||
Deutsche Wohnen AG | 27,195 | 613,836 | ||||||
Emlak Konut Gayrimenkul Yatirim Ortakligi AS | 332,777 | 373,772 | ||||||
Equity Residential | 9,594 | 667,358 | ||||||
Essex Property Trust, Inc. | 1,471 | 296,789 | ||||||
Even Construtora e Incorporadora SA | 92,000 | 199,007 | ||||||
GAGFAH SA(b) | 60,365 | 1,128,888 | ||||||
Irish Residential Properties REIT PLC(b) | 151,700 | 204,361 | ||||||
Kaisa Group Holdings Ltd. | 805,000 | 298,124 | ||||||
Kenedix Residential Investment Corp. | 68 | 178,172 | ||||||
KWG Property Holding Ltd. | 816,500 | 566,971 | ||||||
LEG Immobilien AG(b) | 12,709 | 878,376 | ||||||
Meritage Homes Corp.(b) | 14,620 | 537,870 | ||||||
Mid-America Apartment Communities, Inc. | 11,839 | 836,544 | ||||||
Mirvac Group | 336,211 | 533,402 | ||||||
MRV Engenharia e Participacoes SA | 23,550 | 77,892 | ||||||
PDG Realty SA Empreendimentos e Participacoes(b) | 107,100 | 52,731 | ||||||
PulteGroup, Inc. | 15,690 | 301,091 | ||||||
Shimao Property Holdings Ltd. | 107,500 | 231,643 | ||||||
Sino-Ocean Land Holdings Ltd. | 318,080 | 180,637 | ||||||
Stockland | 407,014 | 1,521,734 | ||||||
Sun Communities, Inc. | 10,226 | 592,801 | ||||||
UDR, Inc. | 3,937 | 119,016 | ||||||
Urbi Desarrollos Urbanos SAB de CV(b)(c)(d) | 120,400 | – 0 | – | |||||
Wing Tai Holdings Ltd. | 241,000 | 335,794 | ||||||
|
| |||||||
| 17,378,622 | ||||||||
|
| |||||||
Self Storage – 0.2% | ||||||||
Extra Space Storage, Inc. | 1,714 | 99,686 | ||||||
Public Storage | 3,629 | 668,970 | ||||||
Safestore Holdings PLC | 94,440 | 314,238 | ||||||
|
| |||||||
| 1,082,894 | ||||||||
|
| |||||||
Single Family – 0.1% | ||||||||
Fortune Brands Home & Security, Inc. | 13,880 | 600,310 | ||||||
|
| |||||||
| 19,061,826 | ||||||||
|
| |||||||
Transportation – 2.6% | ||||||||
Airport Services – 1.0% | ||||||||
Aeroports de Paris | 13,600 | 1,609,751 | ||||||
Airports of Thailand PCL | 175,800 | 1,306,220 | ||||||
Auckland International Airport Ltd. | 177,860 | 537,704 | ||||||
Flughafen Zuerich AG | 850 | 541,635 | ||||||
Fraport AG Frankfurt Airport Services Worldwide | 13,740 | 851,341 | ||||||
Kobenhavns Lufthavne | 1,070 | 516,410 | ||||||
SIA Engineering Co., Ltd. | 173,000 | 641,528 | ||||||
|
| |||||||
| 6,004,589 | ||||||||
|
| |||||||
| 24 | • ALLIANCEBERNSTEIN REAL ASSET STRATEGY |
Consolidated Portfolio of Investments
| Company | Shares | U.S. $ Value | ||||||
| ||||||||
Highways & Railtracks – 1.3% | ||||||||
Abertis Infraestructuras SA | 141,660 | $ | 2,953,942 | |||||
Atlantia SpA | 136,210 | 3,216,899 | ||||||
CCR SA | 244,800 | 1,822,327 | ||||||
|
| |||||||
| 7,993,168 | ||||||||
|
| |||||||
Marine Ports & Services – 0.3% | ||||||||
COSCO Pacific Ltd. | 302,000 | 398,182 | ||||||
International Container Terminal Services, Inc. | 219,480 | 567,113 | ||||||
Kamigumi Co., Ltd. | 30,000 | 289,255 | ||||||
Mitsubishi Logistics Corp. | 20,000 | 304,630 | ||||||
Westports Holdings Bhd | 343,600 | 313,416 | ||||||
Westshore Terminals Investment Corp. | 8,040 | 245,042 | ||||||
|
| |||||||
| 2,117,638 | ||||||||
|
| |||||||
| 16,115,395 | ||||||||
|
| |||||||
Office – 2.0% | ||||||||
Office – 2.0% | ||||||||
Allied Properties Real Estate Investment Trust | 14,239 | 449,387 | ||||||
Ascendas India Trust | 58,800 | 37,507 | ||||||
Befimmo SA | 1,576 | 121,460 | ||||||
Boston Properties, Inc. | 6,080 | 770,639 | ||||||
CapitaCommercial Trust | 180,000 | 234,049 | ||||||
Castellum AB | 15,452 | 236,958 | ||||||
Columbia Property Trust, Inc. | 25,000 | 630,750 | ||||||
Cominar Real Estate Investment Trust | 8,929 | 151,160 | ||||||
Cousins Properties, Inc. | 11,665 | 151,762 | ||||||
Derwent London PLC | 8,693 | 413,593 | ||||||
Dream Office Real Estate Investment Trust | 15,321 | 387,834 | ||||||
Entra ASA(a)(b) | 31,464 | 347,529 | ||||||
Fabege AB | 42,302 | 543,017 | ||||||
Hongkong Land Holdings Ltd. | 216,000 | 1,506,366 | ||||||
Inmobiliaria Colonial SA(b) | 163,210 | 115,154 | ||||||
Investa Office Fund | 83,920 | 264,776 | ||||||
Japan Excellent, Inc. | 362 | 480,299 | ||||||
Japan Prime Realty Investment Corp. | 116 | 427,191 | ||||||
Japan Real Estate Investment Corp. | 207 | 1,127,995 | ||||||
Kenedix Office Investment Corp. – Class A | 90 | 481,266 | ||||||
Kilroy Realty Corp. | 4,767 | 322,917 | ||||||
Liberty Property Trust | 10,476 | 364,250 | ||||||
Nippon Building Fund, Inc. | 126 | 706,185 | ||||||
Norwegian Property ASA(b) | 46,179 | 70,518 | ||||||
NTT Urban Development Corp. | 17,500 | 198,066 | ||||||
Parkway Properties, Inc./MD | 33,460 | 670,873 | ||||||
PSP Swiss Property AG(b) | 3,775 | 323,996 | ||||||
SL Green Realty Corp. | 5,788 | 669,672 | ||||||
Tokyo Tatemono Co., Ltd. | 36,000 | 314,257 | ||||||
Workspace Group PLC | 33,600 | 352,868 | ||||||
|
| |||||||
| 12,872,294 | ||||||||
|
| |||||||
| ALLIANCEBERNSTEIN REAL ASSET STRATEGY • | 25 |
Consolidated Portfolio of Investments
| Company | Shares | U.S. $ Value | ||||||
| ||||||||
Industrials – 0.9% | ||||||||
Industrial Warehouse Distribution – 0.7% | ||||||||
Ascendas Real Estate Investment Trust | 183,000 | $ | 317,865 | |||||
Global Logistic Properties Ltd. | 278,000 | 595,744 | ||||||
Granite Real Estate Investment Trust | 17,906 | 645,690 | ||||||
Hansteen Holdings PLC | 121,900 | 206,704 | ||||||
Japan Logistics Fund, Inc. | 83 | 186,503 | ||||||
Mapletree Industrial Trust | 265,000 | 304,361 | ||||||
Mapletree Logistics Trust | 353,709 | 323,830 | ||||||
Mexico Real Estate Management SA de CV(b) | 135,620 | 247,145 | ||||||
ProLogis, Inc. | 8,767 | 365,145 | ||||||
Segro PLC | 69,665 | 424,419 | ||||||
STAG Industrial, Inc. | 34,380 | 838,872 | ||||||
Warehouses De Pauw SCA | 1,036 | 73,988 | ||||||
|
| |||||||
| 4,530,266 | ||||||||
|
| |||||||
Mixed Office Industrial – 0.2% | ||||||||
BR Properties SA | 16,240 | 82,051 | ||||||
Goodman Group | 233,967 | 1,142,272 | ||||||
|
| |||||||
| 1,224,323 | ||||||||
|
| |||||||
| 5,754,589 | ||||||||
|
| |||||||
Lodging – 0.9% | ||||||||
Lodging – 0.9% | ||||||||
Ashford Hospitality Prime, Inc. | 36,524 | 632,961 | ||||||
Ashford Hospitality Trust, Inc. | 59,856 | 676,373 | ||||||
Chatham Lodging Trust | 24,380 | 624,616 | ||||||
DiamondRock Hospitality Co. | 51,790 | 743,186 | ||||||
FelCor Lodging Trust, Inc. | 46,130 | 494,975 | ||||||
Hersha Hospitality Trust | 94,130 | 686,208 | ||||||
Host Hotels & Resorts, Inc. | 11,750 | 273,893 | ||||||
Intrawest Resorts Holdings, Inc.(b) | 15,630 | 166,303 | ||||||
Japan Hotel REIT Investment Corp. | 425 | 263,620 | ||||||
Pebblebrook Hotel Trust | 6,410 | 273,066 | ||||||
Starwood Hotels & Resorts Worldwide, Inc. | 7,850 | 601,781 | ||||||
Wyndham Worldwide Corp. | 3,890 | 302,136 | ||||||
|
| |||||||
| 5,739,118 | ||||||||
|
| |||||||
Food Beverage & Tobacco – 0.5% | ||||||||
Agricultural Products – 0.4% | ||||||||
Archer-Daniels-Midland Co. | 33,138 | 1,557,486 | ||||||
Bunge Ltd. | 12,022 | 1,065,751 | ||||||
Wilmar International Ltd. | 61,041 | 152,156 | ||||||
|
| |||||||
| 2,775,393 | ||||||||
|
| |||||||
Packaged Foods & Meats – 0.1% | ||||||||
Tyson Foods, Inc. – Class A | 15,110 | 609,688 | ||||||
|
| |||||||
| 3,385,081 | ||||||||
|
| |||||||
| 26 | • ALLIANCEBERNSTEIN REAL ASSET STRATEGY |
Consolidated Portfolio of Investments
| Company | Shares | U.S. $ Value | ||||||
| ||||||||
Financial: Other – 0.1% | ||||||||
Financial: Other – 0.1% | ||||||||
HFF, Inc. – Class A | 16,900 | $ | 532,012 | |||||
|
| |||||||
Total Common Stocks | 414,479,825 | |||||||
|
| |||||||
| Principal Amount (000) | ||||||||
INFLATION-LINKED SECURITIES – 15.8% | ||||||||
United States – 15.8% | ||||||||
U.S. Treasury Inflation Index | $ | 94,789 | 95,848,073 | |||||
0.625%, 7/15/21 (TIPS) | 3,706 | 3,809,001 | ||||||
|
| |||||||
Total Inflation-Linked Securities | 99,657,074 | |||||||
|
| |||||||
| Shares | ||||||||
WARRANTS – 0.5% | ||||||||
Materials – 0.2% | ||||||||
Fertilizers & Agricultural Chemicals – 0.2% | ||||||||
UPL Ltd., Deutsche Bank, expiring 1/30/17(b) | 215,850 | 1,221,122 | ||||||
|
| |||||||
Equity: Other – 0.2% | ||||||||
Diversified/Specialty – 0.2% | ||||||||
Emaar Properties PJSC, Merrill Lynch Intl & Co., expiring 10/01/15(b) | 402,940 | 1,097,062 | ||||||
|
| |||||||
Energy – 0.1% | ||||||||
Coal & Consumable Fuels – 0.0% | ||||||||
Coal India Ltd., Merrill Lynch Intl & Co., expiring 11/02/15(b) | 13,520 | 81,343 | ||||||
|
| |||||||
Oil & Gas Storage & Transportation – 0.1% | ||||||||
Petronet LNG Ltd., Deutsche Bank AG London, expiring 8/14/18(b) | 187,375 | 606,626 | ||||||
|
| |||||||
| 687,969 | ||||||||
|
| |||||||
Financial: Other – 0.0% | ||||||||
Financial: Other – 0.0% | ||||||||
DLF Ltd., Merrill Lynch Intl & Co., expiring 5/23/18(b) | 36,590 | 73,967 | ||||||
|
| |||||||
Total Warrants | 3,080,120 | |||||||
|
| |||||||
| ALLIANCEBERNSTEIN REAL ASSET STRATEGY • | 27 |
Consolidated Portfolio of Investments
| Company | Shares | U.S. $ Value | ||||||
| ||||||||
INVESTMENT COMPANIES – 0.3% | ||||||||
Funds and Investment Trusts – 0.3% | ||||||||
CPN Retail Growth Leasehold Property Fund | 143,850 | $ | 72,875 | |||||
iShares US Real Estate ETF | 27,630 | 2,071,697 | ||||||
|
| |||||||
Total Investment Companies | 2,144,572 | |||||||
|
| |||||||
| Contracts | ||||||||
OPTIONS PURCHASED – PUTS – 0.0% | ||||||||
Options on Funds and Investment Trusts – 0.0% | ||||||||
iShares US Real Estate ETF | 1,452 | 16,698 | ||||||
iShares US Real Estate ETF | 743 | 10,402 | ||||||
|
| |||||||
Total Options Purchased – Puts | 27,100 | |||||||
|
| |||||||
| Shares | ||||||||
SHORT-TERM INVESTMENTS – 17.7% |
| |||||||
Investment Companies – 17.7% | ||||||||
AllianceBernstein Fixed-Income Shares, Inc. – Government STIF Portfolio, 0.07%(g)(h) | 111,861,671 | 111,861,671 | ||||||
|
| |||||||
Total Investments – 99.8% | 631,250,362 | |||||||
Other assets less liabilities – 0.2% | 1,464,413 | |||||||
|
| |||||||
Net Assets – 100.0% | $ | 632,714,775 | ||||||
|
| |||||||
FUTURES (see Note D)
| Type | Number of Contracts | Expiration Month | Original Value | Value at October 31, 2014 | Unrealized Appreciation/ (Depreciation) | |||||||||||||||
Purchased Contracts |
| |||||||||||||||||||
Brent Crude Futures | 71 | November 2014 | $ | 6,117,396 | $ | 6,096,060 | $ | (21,336 | ) | |||||||||||
Cattle Feeder Futures | 18 | January 2015 | 2,081,352 | 2,056,275 | (25,077 | ) | ||||||||||||||
Cocoa Futures | 74 | March 2015 | 2,288,278 | 2,140,820 | (147,458 | ) | ||||||||||||||
Coffee C Futures | 15 | March 2015 | 1,100,579 | 1,081,688 | (18,891 | ) | ||||||||||||||
Copper London Metal Exchange Futures | 19 | November 2014 | 3,370,966 | 3,207,200 | (163,766 | ) | ||||||||||||||
Corn Futures | 124 | March 2015 | 2,324,299 | 2,413,350 | 89,051 | |||||||||||||||
Cotton No. 2 Futures | 134 | March 2015 | 4,155,546 | 4,215,640 | 60,094 | |||||||||||||||
Gasoline RBOB Futures | 52 | November 2014 | 5,403,454 | 4,690,795 | (712,659 | ) | ||||||||||||||
Gold 100 OZ Futures | 74 | December 2014 | 9,024,238 | 8,669,840 | (354,398 | ) | ||||||||||||||
LME Lead Futures | 53 | November 2014 | 2,779,964 | 2,651,656 | (128,308 | ) | ||||||||||||||
| 28 | • ALLIANCEBERNSTEIN REAL ASSET STRATEGY |
Consolidated Portfolio of Investments
| Type | Number of Contracts | Expiration Month | Original Value | Value at October 31, 2014 | Unrealized Appreciation/ (Depreciation) | |||||||||||||||
Natural Gas Futures | 107 | December 2014 | $ | 4,456,069 | $ | 4,236,130 | $ | (219,939 | ) | |||||||||||
Nickel London Metal Exchange Futures | 28 | November 2014 | 3,124,884 | 2,642,808 | (482,076 | ) | ||||||||||||||
Palladium Futures | 13 | December 2014 | 1,143,839 | 1,029,340 | (114,499 | ) | ||||||||||||||
Platinum Futures | 61 | January 2015 | 4,154,370 | 3,767,360 | (387,010 | ) | ||||||||||||||
PRI Aluminum London Metal Exchange Futures | 99 | November 2014 | 4,932,888 | 5,109,638 | 176,750 | |||||||||||||||
PRI Aluminum London Metal Exchange Futures | 49 | January 2015 | 2,408,459 | 2,507,575 | 99,116 | |||||||||||||||
Soybean Meal Futures | 37 | March 2015 | 1,177,035 | 1,280,940 | 103,905 | |||||||||||||||
WTI Crude Futures | 55 | November 2014 | 5,509,373 | 4,429,700 | (1,079,673 | ) | ||||||||||||||
WTI Crude Futures | 37 | May 2015 | 3,464,641 | 2,968,140 | (496,501 | ) | ||||||||||||||
WTI Crude Futures | 151 | November 2017 | 12,940,399 | 12,187,210 | (753,189 | ) | ||||||||||||||
WTI Crude Futures | 230 | November 2018 | 19,157,066 | 18,620,800 | (536,266 | ) | ||||||||||||||
Zinc London Metal Exchange Futures | 62 | November 2014 | 3,670,083 | 3,581,275 | (88,808 | ) | ||||||||||||||
Sold Contracts | ||||||||||||||||||||
Brent Crude Oil Futures | 36 | May 2015 | 3,763,735 | 3,191,040 | 572,695 | |||||||||||||||
Gas Oil Futures (ICE) | 54 | December 2014 | 4,555,738 | 4,002,750 | 552,988 | |||||||||||||||
KC HRW Wheat Futures | 34 | March 2015 | 1,032,224 | 1,018,300 | 13,924 | |||||||||||||||
Lead London Metal Exchange Futures | 118 | November 2014 | 6,500,708 | 5,903,688 | 597,020 | |||||||||||||||
Lean Hogs Futures | 18 | December 2014 | 641,345 | 633,780 | 7,565 | |||||||||||||||
Live Cattle Futures | 11 | December 2014 | 704,913 | 730,620 | (25,707 | ) | ||||||||||||||
LME Copper Futures | 9 | November 2014 | 1,551,456 | 1,519,200 | 32,256 | |||||||||||||||
LME Nickel Futures | 14 | November 2014 | 1,254,929 | 1,321,404 | (66,475 | ) | ||||||||||||||
LME Zinc Futures | 55 | November 2014 | 3,110,132 | 3,176,938 | (66,806 | ) | ||||||||||||||
Natural Gas Futures | 104 | November 2014 | 3,819,605 | 4,027,920 | (208,315 | ) | ||||||||||||||
NY Harbor USLD Futures | 47 | November 2014 | 5,452,436 | 4,956,517 | 495,919 | |||||||||||||||
PRI Aluminum London Metal Exchange Futures | 99 | November 2014 | 4,969,137 | 5,109,638 | (140,501 | ) | ||||||||||||||
S&P 500 E mini Index Futures | 586 | December 2014 | 58,222,634 | 58,934,020 | (711,386 | ) | ||||||||||||||
Soybean Futures | 24 | March 2015 | 1,207,729 | 1,263,900 | (56,171 | ) | ||||||||||||||
Sugar 11 (World) Futures | 266 | February 2015 | 5,001,543 | 4,778,637 | 222,906 | |||||||||||||||
Wheat (CBT) Futures | 40 | March 2015 | 1,079,881 | 1,091,500 | (11,619 | ) | ||||||||||||||
|
| |||||||||||||||||||
| $ | (3,992,645 | ) | ||||||||||||||||||
|
| |||||||||||||||||||
| ALLIANCEBERNSTEIN REAL ASSET STRATEGY • | 29 |
Consolidated Portfolio of Investments
FORWARD CURRENCY EXCHANGE CONTRACTS (see Note D)
| Counterparty | Contracts to Deliver (000) | In Exchange For (000) | Settlement Date | Unrealized Appreciation/ (Depreciation) | ||||||||||||||||||||
Barclays Bank PLC | KRW | 776,074 | USD | 758 | 12/15/14 | $ | 36,727 | |||||||||||||||||
Barclays Bank PLC | USD | 2,677 | CNY | 16,558 | 12/15/14 | 13,309 | ||||||||||||||||||
Barclays Bank PLC | USD | 847 | IDR | 10,096,953 | 12/15/14 | (15,971 | ) | |||||||||||||||||
Barclays Bank PLC | USD | 1,735 | SGD | 2,180 | 12/15/14 | (38,794 | ) | |||||||||||||||||
BNP Paribas SA | INR | 172,140 | USD | 2,785 | 12/15/14 | (3,623 | ) | |||||||||||||||||
BNP Paribas SA | USD | 1,835 | CHF | 1,709 | 12/15/14 | (57,669 | ) | |||||||||||||||||
BNP Paribas SA | USD | 18,833 | CNY | 116,304 | 12/15/14 | 64,549 | ||||||||||||||||||
Citibank | USD | 1,770 | RUB | 66,960 | 12/15/14 | (230,581 | ) | |||||||||||||||||
Credit Suisse International | USD | 1,909 | ZAR | 20,863 | 12/15/14 | (30,298 | ) | |||||||||||||||||
Deutsche Bank AG | EUR | 15,800 | USD | 20,751 | 12/15/14 | 945,796 | ||||||||||||||||||
Deutsche Bank AG | USD | 1,906 | INR | 116,651 | 12/15/14 | (16,043 | ) | |||||||||||||||||
Deutsche Bank AG | USD | 817 | MYR | 2,611 | 12/15/14 | (30,757 | ) | |||||||||||||||||
Goldman Sachs Bank USA | BRL | 15,084 | USD | 6,312 | 11/04/14 | 224,552 | ||||||||||||||||||
Goldman Sachs Bank USA | USD | 6,126 | BRL | 15,084 | 11/04/14 | (38,095 | ) | |||||||||||||||||
Goldman Sachs Bank USA | BRL | 9,962 | USD | 3,998 | 12/02/14 | 12,510 | ||||||||||||||||||
Goldman Sachs Bank USA | AUD | 6,927 | USD | 6,045 | 12/15/14 | (33,514 | ) | |||||||||||||||||
Goldman Sachs Bank USA | CAD | 16,963 | USD | 15,034 | 12/15/14 | (1,090 | ) | |||||||||||||||||
Goldman Sachs Bank USA | CNY | 13,040 | USD | 2,117 | 12/15/14 | (1,408 | ) | |||||||||||||||||
Goldman Sachs Bank USA | EUR | 14,090 | USD | 18,256 | 12/15/14 | 594,112 | ||||||||||||||||||
Goldman Sachs Bank USA | GBP | 11,438 | USD | 18,590 | 12/15/14 | 298,184 | ||||||||||||||||||
Goldman Sachs Bank USA | JPY | 2,433,355 | USD | 23,047 | 12/15/14 | 1,374,852 | ||||||||||||||||||
Goldman Sachs Bank USA | NOK | 19,943 | USD | 3,146 | 12/15/14 | 193,775 | ||||||||||||||||||
Goldman Sachs Bank USA | USD | 1,972 | AUD | 2,140 | 12/15/14 | (93,865 | ) | |||||||||||||||||
HSBC Bank USA | GBP | 1,533 | USD | 2,461 | 12/15/14 | 9,365 | ||||||||||||||||||
HSBC Bank USA | USD | 2,494 | HKD | 19,324 | 12/15/14 | (1,717 | ) | |||||||||||||||||
JPMorgan Chase Bank | USD | 8,716 | GBP | 5,364 | 12/15/14 | (138,303 | ) | |||||||||||||||||
JPMorgan Chase Bank | USD | 1,629 | RUB | 61,365 | 12/15/14 | (219,065 | ) | |||||||||||||||||
Royal Bank of Scotland PLC | BRL | 5,664 | USD | 2,317 | 11/04/14 | 31,516 | ||||||||||||||||||
Royal Bank of Scotland PLC | USD | 2,318 | BRL | 5,664 | 11/04/14 | (32,180 | ) | |||||||||||||||||
Royal Bank of Scotland PLC | AUD | 7,068 | USD | 6,171 | 12/15/14 | (31,227 | ) | |||||||||||||||||
Standard Chartered Bank | USD | 992 | HKD | 7,691 | 12/15/14 | (731 | ) | |||||||||||||||||
State Street Bank & Trust Co. | EUR | 1,867 | USD | 2,361 | 12/15/14 | 20,613 | ||||||||||||||||||
State Street Bank & Trust Co. | USD | 1,634 | CAD | 1,845 | 12/15/14 | 899 | ||||||||||||||||||
State Street Bank & Trust Co. | USD | 5,389 | EUR | 4,236 | 12/15/14 | (79,387 | ) | |||||||||||||||||
State Street Bank & Trust Co. | USD | 2,287 | JPY | 243,734 | 12/15/14 | (116,115 | ) | |||||||||||||||||
State Street Bank & Trust Co. | USD | 1,425 | ZAR | 15,628 | 12/15/14 | (17,850 | ) | |||||||||||||||||
UBS AG | BRL | 10,504 | USD | 4,544 | 11/04/14 | 304,572 | ||||||||||||||||||
UBS AG | USD | 4,298 | BRL | 10,504 | 11/04/14 | (58,447 | ) | |||||||||||||||||
UBS AG | USD | 3,321 | AUD | 3,822 | 12/15/14 | 33,091 | ||||||||||||||||||
UBS AG | USD | 4,178 | CAD | 4,589 | 12/15/14 | (110,648 | ) | |||||||||||||||||
|
| |||||||||||||||||||||||
| $ | 2,761,044 | |||||||||||||||||||||||
|
| |||||||||||||||||||||||
| 30 | • ALLIANCEBERNSTEIN REAL ASSET STRATEGY |
Consolidated Portfolio of Investments
INTEREST RATE SWAPS (see Note D)
| Rate Type | ||||||||||||||||||||
Swap Counterparty | Notional Amount (000) | Termination Date | Payments by the Fund | Payments by the Fund | Unrealized Appreciation/ (Depreciation) | |||||||||||||||
Bank of America, NA | $ | 3,830 | 3/30/22 | 2.263 | % | 3 Month LIBOR | $ | (27,452 | ) | |||||||||||
INFLATION (CPI) SWAPS (see Note D)
| Rate Type | ||||||||||||||||||||
Swap Counterparty | Notional Amount (000) | Termination Date | Payments made by the Fund | Payments received by the Fund | Unrealized Appreciation/ (Depreciation) | |||||||||||||||
Barclays Bank PLC | $ | 26,768 | 6/17/24 | 2.514 | % | CPI | # | $ | (740,253 | ) | ||||||||||
Citibank, NA | 1,000 | 3/27/18 | 2.450 | % | CPI | # | (46,215 | ) | ||||||||||||
JPMorgan Chase Bank, NA | 85,342 | 10/01/16 | 1.918 | % | CPI | # | (877,242 | ) | ||||||||||||
JPMorgan Chase Bank, NA | 100,450 | 6/06/17 | 2.040 | % | CPI | # | (1,140,054 | ) | ||||||||||||
JPMorgan Chase Bank, NA | 28,419 | 6/17/24 | 2.513 | % | CPI | # | (781,716 | ) | ||||||||||||
JPMorgan Chase Bank, NA | 26,768 | 6/17/24 | 2.513 | % | CPI | # | (736,302 | ) | ||||||||||||
JPMorgan Chase Bank, NA | 10,000 | 7/30/24 | 2.596 | % | CPI | # | (358,127 | ) | ||||||||||||
|
| |||||||||||||||||||
| $ | (4,679,909 | ) | ||||||||||||||||||
|
| |||||||||||||||||||
| # | Variable interest rate based on the rate of inflation as determined by the Consumer Price Index (CPI). |
TOTAL RETURN SWAPS (see Note D)
| Counterparty & Referenced Obligation | # of Shares or Units | Rate Paid/ Received | Notional Amount (000) | Maturity Date | Unrealized Appreciation/ (Depreciation) | |||||||||||||||
Receive Total Return on Reference Obligation |
| |||||||||||||||||||
Citibank, NA | $ | 345,581 | 0.11 | % | $ | 86,943 | 12/15/14 | $ | 527,354 | |||||||||||
Goldman Sachs International Bloomberg Commodity Index 2 Months Forwards | 335,195 | 0.11 | % | 84,331 | 12/15/14 | 511,505 | ||||||||||||||
JPMorgan Chase Bank, NA Bloomberg Commodity Index 2 Months Forwards | 155,407 | 0.11 | % | 39,098 | 12/15/14 | 237,150 | ||||||||||||||
|
| |||||||||||||||||||
| $ | 1,276,009 | |||||||||||||||||||
|
| |||||||||||||||||||
| (a) | Security is exempt from registration under Rule 144A of the Securities Act of 1933. These securities are considered liquid and may be resold in transactions exempt from registration, normally to qualified institutional buyers. At October 31, 2014, the aggregate market value of these securities amounted to $2,628,365 or 0.4% of net assets. |
| (b) | Non-income producing security. |
| (c) | Illiquid security. |
| (d) | Fair valued by the Adviser. |
| ALLIANCEBERNSTEIN REAL ASSET STRATEGY • | 31 |
Consolidated Portfolio of Investments
| (e) | Position, or a portion thereof, has been segregated to collateralize OTC derivatives outstanding. |
| (f) | One contract relates to 100 shares. |
| (g) | To obtain a copy of the fund’s financial statements, please go to the Securities and Exchange Commission’s website at www.sec.gov, or call AllianceBernstein at (800) 227-4618. |
| (h) | Investment in affiliated money market mutual fund. The rate shown represents the 7-day yield as of period end. |
Currency Abbreviations:
AUD – Australian Dollar
BRL – Brazilian Real
CAD – Canadian Dollar
CHF – Swiss Franc
CNY – Chinese Yuan Renminbi
EUR – Euro
GBP – Great British Pound
HKD – Hong Kong Dollar
IDR – Indonesian Rupiah
INR – Indian Rupee
JPY – Japanese Yen
KRW – South Korean Won
MYR – Malaysian Ringgit
NOK – Norwegian Krone
RUB – Russian Ruble
SGD – Singapore Dollar
USD – United States Dollar
ZAR – South African Rand
Glossary:
ADR – American Depositary Receipt
CBT – Chicago Board of Trade
ETF – Exchange Traded Fund
GDR – Global Depositary Receipt
ICE – Intercontinental Exchange
LIBOR – London Interbank Offered Rates
OJSC – Open Joint Stock Company
PJSC – Public Joint Stock Company
REIT – Real Estate Investment Trust
TIPS – Treasury Inflation Protected Security
WTI – West Texas Intermediate
See notes to consolidated financial statements.
| 32 | • ALLIANCEBERNSTEIN REAL ASSET STRATEGY |
Consolidated Portfolio of Investments
CONSOLIDATED STATEMENT OF ASSETS & LIABILITIES
October 31, 2014
| Assets | ||||
Investments in securities, at value | ||||
Unaffiliated issuers (cost $523,129,367) | $ | 519,388,691 | ||
Affiliated issuers (cost $111,861,671) | 111,861,671 | (a) | ||
Cash | 338,875 | |||
Due from broker | 3,491,983 | (b) | ||
Foreign currencies, at value (cost $2,247,197) | 2,214,955 | |||
Unrealized appreciation on forward currency exchange contracts | 4,158,422 | |||
Receivable for investment securities sold and foreign currency transactions | 1,845,394 | |||
Unrealized appreciation on total return swaps | 1,276,009 | |||
Receivable for capital stock sold | 1,160,280 | |||
Dividends and interest receivable | 726,231 | |||
|
| |||
Total assets | 646,462,511 | |||
|
| |||
| Liabilities | ||||
Unrealized depreciation on inflation swaps | 4,679,909 | |||
Payable for investment securities purchased and foreign currency transactions | 2,822,003 | |||
Payable for capital stock redeemed | 1,879,821 | |||
Collateral received from broker | 1,420,000 | |||
Unrealized depreciation on forward currency exchange contracts | 1,397,378 | |||
Payable for variation margin on exchange-traded derivatives | 724,979 | |||
Management fee payable | 361,710 | |||
Distribution fee payable | 121,483 | |||
Unrealized depreciation on interest rate swaps | 27,452 | |||
Administrative fee payable | 18,389 | |||
Transfer Agent fee payable | 18,057 | |||
Interest expense payable | 3,371 | |||
Accrued expenses and other liabilities | 273,184 | |||
|
| |||
Total liabilities | 13,747,736 | |||
|
| |||
Net Assets | $ | 632,714,775 | ||
|
| |||
| Composition of Net Assets | ||||
Capital stock, at par | $ | 60,402 | ||
Additional paid-in capital | 643,161,184 | |||
Undistributed net investment income | 7,153,574 | |||
Accumulated net realized loss investment and foreign currency transactions | (9,177,368 | ) | ||
Net unrealized depreciation on investments and foreign currency denominated assets and liabilities | (8,483,017 | ) | ||
|
| |||
| $ | 632,714,775 | |||
|
|
| (a) | Includes investment of cash collateral of $1,420,000 received from broker for OTC derivatives outstanding at October 31, 2014. |
| (b) | Represents amounts on deposit at the broker as collateral for open derivative contracts. |
See notes to consolidated financial statements.
| ALLIANCEBERNSTEIN REAL ASSET STRATEGY • | 33 |
Consolidated Statement of Assets & Liabilities
Net Asset Value Per Share—30 billion shares of capital stock authorized, $.001 par value
| Class | Net Assets | Shares Outstanding | Net Asset Value | |||||||||
| ||||||||||||
| A | $ | 28,433,555 | 2,701,918 | $ | 10.52 | * | ||||||
| ||||||||||||
| C | $ | 8,530,980 | 819,929 | $ | 10.40 | |||||||
| ||||||||||||
| Advisor | $ | 58,398,822 | 5,528,366 | $ | 10.56 | |||||||
| ||||||||||||
| R | $ | 182,199 | 17,331 | $ | 10.51 | |||||||
| ||||||||||||
| K | $ | 2,174,191 | 207,081 | $ | 10.50 | |||||||
| ||||||||||||
| I | $ | 21,341,553 | 2,024,852 | $ | 10.54 | |||||||
| ||||||||||||
| 1 | $ | 513,632,772 | 49,100,693 | $ | 10.46 | |||||||
| ||||||||||||
| 2 | $ | 10,683 | 1,000 | $ | 10.68 | |||||||
| ||||||||||||
| Z | $ | 10,020 | 950 | $ | 10.55 | |||||||
| ||||||||||||
| * | The maximum offering price per share for Class A shares was $10.99 which reflects a sales charge of 4.25%. |
See notes to consolidated financial statements.
| 34 | • ALLIANCEBERNSTEIN REAL ASSET STRATEGY |
Consolidated Statement of Assets & Liabilities
CONSOLIDATED STATEMENT OF OPERATIONS
Year Ended October 31, 2014
| Investment Income | ||||||||
Dividends | ||||||||
Unaffiliated issuers (net of foreign taxes withheld of $924,360) | $ | 13,722,969 | ||||||
Affiliated issuers | 36,550 | |||||||
Interest | 677,744 | $ | 14,437,263 | |||||
|
| |||||||
| Expenses | ||||||||
Management fee (see Note B) | 4,736,595 | |||||||
Distribution fee—Class A | 160,099 | |||||||
Distribution fee—Class C | 107,358 | |||||||
Distribution fee—Class R | 189 | |||||||
Distribution fee—Class K | 4,695 | |||||||
Distribution fee—Class 1 | 1,198,762 | |||||||
Transfer agency—Class A | 67,503 | |||||||
Transfer agency—Class C | 14,834 | |||||||
Transfer agency—Advisor Class | 89,825 | |||||||
Transfer agency—Class R | 59 | |||||||
Transfer agency—Class K | 2,089 | |||||||
Transfer agency—Class I | 6,501 | |||||||
Transfer agency—Class 1 | 18,903 | |||||||
Transfer agency—Class Z | 2 | |||||||
Custodian | 313,861 | |||||||
Registration fees | 125,385 | |||||||
Audit and tax | 111,936 | |||||||
Administrative | 57,849 | |||||||
Printing | 53,641 | |||||||
Legal | 49,879 | |||||||
Directors’ fees | 7,741 | |||||||
Miscellaneous | 105,285 | |||||||
|
| |||||||
Total expenses | 7,232,991 | |||||||
Less: expenses waived and reimbursed by the Adviser (see Note B) | (103,010 | ) | ||||||
|
| |||||||
Net expenses | 7,129,981 | |||||||
|
| |||||||
Net investment income | 7,307,282 | |||||||
|
| |||||||
| Realized and Unrealized Gain (Loss) on Investment and Foreign Currency Transactions | ||||||||
Net realized gain (loss) on: | ||||||||
Investment transactions | 15,470,776 | (a) | ||||||
Futures | (63,406 | ) | ||||||
Swaps | (18,884,215 | ) | ||||||
Foreign currency transactions | 1,720,910 | |||||||
Net change in unrealized appreciation/depreciation of: | ||||||||
Investments | (29,599,903 | )(b) | ||||||
Futures | (3,562,168 | ) | ||||||
Swaps | 487,320 | |||||||
Foreign currency denominated assets and liabilities | 4,000,681 | |||||||
|
| |||||||
Net loss on investment and foreign currency transactions | (30,430,005 | ) | ||||||
|
| |||||||
Contributions from Adviser (see Note B) | 119,942 | |||||||
|
| |||||||
Net Decrease in Net Assets from Operations | $ | (23,002,781 | ) | |||||
|
|
| (a) | Net of foreign capital gains taxes of $52,131. |
| (b) | Net of increase in accrued foreign capital gains taxes of $9,548. |
See notes to consolidated financial statements.
| ALLIANCEBERNSTEIN REAL ASSET STRATEGY • | 35 |
Consolidated Statement of Operations
CONSOLIDATED STATEMENT OF CHANGES IN NET ASSETS
| Year Ended October 31, 2014 | Year Ended October 31, 2013 | |||||||
| Increase (Decrease) in Net Assets from Operations | ||||||||
Net investment income | $ | 7,307,282 | $ | 4,641,114 | ||||
Net realized loss investment and foreign currency transactions | (1,755,935 | ) | (16,505,253 | ) | ||||
Net change in unrealized appreciation/depreciation of investments and foreign currency denominated assets and liabilities | (28,674,070 | ) | 10,513,940 | |||||
Contributions from Adviser (see Note B) | 119,942 | – 0 | – | |||||
|
|
|
| |||||
Net decrease in net assets from operations | (23,002,781 | ) | (1,350,199 | ) | ||||
| Dividends to Shareholders from | ||||||||
Net investment income | ||||||||
Class A | (792,091 | ) | (1,562,186 | ) | ||||
Class C | (58,007 | ) | (258,770 | ) | ||||
Advisor Class | (985,378 | ) | (1,822,536 | ) | ||||
Class R | (423 | ) | (348 | ) | ||||
Class K | (26,710 | ) | (30,815 | ) | ||||
Class I | (354,919 | ) | (503,361 | ) | ||||
Class 1 | (6,782,380 | ) | (5,327,983 | ) | ||||
Class 2 | (161 | ) | (295 | ) | ||||
| Capital Stock Transactions | ||||||||
Net increase | 80,314,554 | 196,692,584 | ||||||
|
|
|
| |||||
Total increase | 48,311,704 | 185,836,091 | ||||||
| Net Assets | ||||||||
Beginning of period | 584,403,071 | 398,566,980 | ||||||
|
|
|
| |||||
End of period (including undistributed net investment income of $7,153,574 and $3,766,361, respectively) | $ | 632,714,775 | $ | 584,403,071 | ||||
|
|
|
| |||||
See notes to consolidated financial statements.
| 36 | • ALLIANCEBERNSTEIN REAL ASSET STRATEGY |
Consolidated Statement of Changes in Net Assets
NOTES TO CONSOLIDATED FINANCIAL STATEMENTS
October 31, 2014
NOTE A
Significant Accounting Policies
AllianceBernstein Bond Fund, Inc. (the “Fund”) is registered under the Investment Company Act of 1940 as an open-end management investment company. The Fund, which is a Maryland corporation, operates as a series company comprised of nine portfolios currently in operation: the Intermediate Bond Portfolio, the Bond Inflation Strategy Portfolio, the Municipal Bond Inflation Strategy Portfolio, the Real Asset Strategy Portfolio (Effective December 15, 2014, the Strategy’s name changed to All Market Real Return Portfolio), the Government Reserves Portfolio, the Tax-Aware Fixed Income Portfolio, the Limited Duration High Income Portfolio, the AllianceBernstein Credit Long/Short Portfolio and the AllianceBernstein High Yield Portfolio. They are each diversified Portfolios, with the exception of the Limited Duration High Income Portfolio, which is non-diversified. The Government Reserves Portfolio commenced operations on May 1, 2013. The Tax-Aware Fixed Income Portfolio commenced operations on December 11, 2013. The AllianceBernstein Credit Long/Short commenced operations on May 7, 2014. The AllianceBernstein High Yield Portfolio commenced operations on July 15, 2014. Each Portfolio is considered to be a separate entity for financial reporting and tax purposes. This report relates only to the Real Asset Strategy Portfolio (“the Strategy”). As part of the Strategy’s investment strategy, the Strategy seeks to gain exposure to commodities and commodities-related instruments and derivatives primarily through investments in AllianceBernstein Cayman Inflation Strategy, Ltd., a wholly-owned subsidiary of the Strategy organized under the laws of the Cayman Islands (the “Subsidiary”). The Strategy and the Subsidiary commenced operations on March 8, 2010. The Subsidiary was incorporated on February 1, 2010. The Strategy is the sole shareholder of the Subsidiary and it is intended that the Strategy will remain the sole shareholder and will continue to control the Subsidiary. Under the Articles of Association of the Subsidiary, shares issued by the Subsidiary confer upon a shareholder the right to receive notice of, to attend and to vote at general meetings of the Subsidiary and shall confer upon the shareholder rights in a winding-up or repayment of capital and the right to participate in the profits or assets of the Subsidiary. As of October 31, 2014, net assets of the Strategy were $632,714,775, of which $125,412,103, or approximately 19.82%, represented the Strategy’s ownership of all issued shares and voting rights of the Subsidiary. This report presents the consolidated financial statements of AllianceBernstein Real Asset Strategy and the Subsidiary. All intercompany transactions and balances have been eliminated in consolidation. The Strategy has authorized the issuance of Class A, Class B, Class C, Advisor Class, Class R, Class K, Class I, Class 1, Class 2 and Class Z shares. Effective January 31, 2014 the fund commenced offering of Class Z shares. Class B shares are not currently being offered. Class 1 shares are sold only to the private clients of Sanford C. Bernstein & Co. LLC by its registered representatives. Class A shares are sold with a front-end sales charge of up to 4.25% for purchases not exceeding $1,000,000. With respect to purchases of $1,000,000 or more, Class A shares redeemed within one year of purchase may be subject to a contingent deferred
| ALLIANCEBERNSTEIN REAL ASSET STRATEGY • | 37 |
Notes to Consolidated Financial Statements
sales charge of 1%. Class C shares are subject to a contingent deferred sales charge of 1% on redemptions made within the first year after purchase. Class R, Class K, and Class 1 shares are sold without an initial or contingent deferred sales charge. Advisor Class, Class I, Class 2 and Class Z shares are sold without an initial or contingent deferred sales charge and are not subject to ongoing distribution expenses. All ten classes of shares have identical voting, dividend, liquidation and other rights, except that the classes bear different distribution and transfer agency expenses. Each class has exclusive voting rights with respect to its distribution plan. The consolidated financial statements have been prepared in conformity with U.S. generally accepted accounting principles (“U.S. GAAP”) which require management to make certain estimates and assumptions that affect the reported amounts of assets and liabilities in the consolidated financial statements and amounts of income and expenses during the reporting period. Actual results could differ from those estimates. The following is a summary of significant accounting policies followed by the Strategy.
1. Security Valuation
Portfolio securities are valued at their current market value determined on the basis of market quotations or, if market quotations are not readily available or are deemed unreliable, at “fair value” as determined in accordance with procedures established by and under the general supervision of the Fund’s Board of Directors (the “Board”).
In general, the market values of securities which are readily available and deemed reliable are determined as follows: securities listed on a national securities exchange (other than securities listed on the NASDAQ Stock Market, Inc. (“NASDAQ”)) or on a foreign securities exchange are valued at the last sale price at the close of the exchange or foreign securities exchange. If there has been no sale on such day, the securities are valued at the last traded price from the previous day. Securities listed on more than one exchange are valued by reference to the principal exchange on which the securities are traded; securities listed only on NASDAQ are valued in accordance with the NASDAQ Official Closing Price; listed or over the counter (“OTC”) market put or call options are valued at the mid level between the current bid and ask prices. If either a current bid or current ask price is unavailable, AllianceBernstein L.P. (the “Adviser”) will have discretion to determine the best valuation (e.g. last trade price in the case of listed options); open futures are valued using the closing settlement price or, in the absence of such a price, the most recent quoted bid price. If there are no quotations available for the day of valuation, the last available closing settlement price is used; U.S. government securities and other debt instruments having 60 days or less remaining until maturity are valued at amortized cost if their original maturity was 60 days or less.
If the original term to maturity exceeded 60 days, the securities are valued by a pricing service, if a market price is available. If a market price is not available, the securities are valued by using amortized cost as of the 61st day prior to maturity. Fixed-income securities, including mortgage-backed and asset-backed securities,
| 38 | • ALLIANCEBERNSTEIN REAL ASSET STRATEGY |
Notes to Consolidated Financial Statements
may be valued on the basis of prices provided by a pricing service or at a price obtained from one or more of the major broker-dealers. In cases where broker-dealer quotes are obtained, the Adviser may establish procedures whereby changes in market yields or spreads are used to adjust, on a daily basis, a recently obtained quoted price on a security. Swaps and other derivatives are valued daily, primarily using independent pricing services, independent pricing models using market inputs, as well as third party broker-dealers or counterparties. Investment companies are valued at their net asset value each day.
Securities for which market quotations are not readily available (including restricted securities) or are deemed unreliable are valued at fair value. Factors considered in making this determination may include, but are not limited to, information obtained by contacting the issuer, analysts, analysis of the issuer’s financial statements or other available documents. In addition, the Strategy may use fair value pricing for securities primarily traded in non-U.S. markets because most foreign markets close well before the Strategy values its securities at 4:00 p.m., Eastern Time. The earlier close of these foreign markets gives rise to the possibility that significant events, including broad market moves, may have occurred in the interim and may materially affect the value of those securities.
2. Fair Value Measurements
In accordance with U.S. GAAP regarding fair value measurements, fair value is defined as the price that the Strategy would receive to sell an asset or pay to transfer a liability in an orderly transaction between market participants at the measurement date. U.S. GAAP establishes a framework for measuring fair value, and a three-level hierarchy for fair value measurements based upon the transparency of inputs to the valuation of an asset or liability (including those valued based on their market values as described in Note A.1 above). Inputs may be observable or unobservable and refer broadly to the assumptions that market participants would use in pricing the asset or liability. Observable inputs reflect the assumptions market participants would use in pricing the asset or liability based on market data obtained from sources independent of the Strategy. Unobservable inputs reflect the Strategy’s own assumptions about the assumptions that market participants would use in pricing the asset or liability based on the best information available in the circumstances. Each investment is assigned a level based upon the observability of the inputs which are significant to the overall valuation. The three-tier hierarchy of inputs is summarized below.
| • | Level 1—quoted prices in active markets for identical investments |
| • | Level 2—other significant observable inputs (including quoted prices for similar investments, interest rates, prepayment speeds, credit risk, etc.) |
| • | Level 3—significant unobservable inputs (including the Strategy’s own assumptions in determining the fair value of investments) |
The fair value of debt instruments, such as bonds, and over-the-counter derivatives is generally based on market price quotations, recently executed
| ALLIANCEBERNSTEIN REAL ASSET STRATEGY • | 39 |
Notes to Consolidated Financial Statements
market transactions (where observable) or industry recognized modeling techniques and are generally classified as Level 2. Pricing vendor inputs to Level 2 valuations may include quoted prices for similar investments in active markets, interest rates, coupon rates, yield curves, option adjusted spreads, default rates, credit spreads and other unique security features in order to estimate the relevant cash flows which is then discounted to calculate fair values. If these inputs are unobservable and significant to the fair value, these investments will be classified as Level 3. In addition, non-agency rated investments are classified as Level 3.
Other fixed income investments, including non-U.S. government and corporate debt, are generally valued using quoted market prices, if available, which are typically impacted by current interest rates, maturity dates and any perceived credit risk of the issuer. Additionally, in the absence of quoted market prices, these inputs are used by pricing vendors to derive a valuation based upon industry or proprietary models which incorporate issuer specific data with relevant yield/spread comparisons with more widely quoted bonds with similar key characteristics. Those investments for which there are observable inputs are classified as Level 2. Where the inputs are not observable, the investments are classified as Level 3.
Where readily available market prices or relevant bid prices are not available for certain equity investments, such investments may be valued based on similar publicly traded investments, movements in relevant indices since last available prices or based upon underlying company fundamentals and comparable company data (such as multiples to earnings or other multiples to equity). Where an investment is valued using an observable input, by pricing vendors, such as another publicly traded security, the investment will be classified as Level 2. If management determines that an adjustment is appropriate based on restrictions on resale, illiquidity or uncertainty, and such adjustment is a significant component of the valuation, the investment will be classified as Level 3. An investment will also be classified as Level 3 where management uses company fundamentals and other significant inputs to determine the valuation.
Options are valued using market-based inputs to models, broker or dealer quotations, or alternative pricing sources with reasonable levels of price transparency, where such inputs and models are available. Alternatively the values may be obtained through unobservable management determined inputs and/or management’s proprietary models. Where models are used, the selection of a particular model to value an option depends upon the contractual terms of, and specific risks inherent in, the option as well as the availability of pricing information in the market. Valuation models require a variety of inputs, including contractual terms, market prices, measures of volatility and correlations of such inputs. Exchange traded options will be classified as Level 2. For options that do not trade on exchange but trade in liquid markets, inputs can generally be verified and model selection does not involve significant management
| 40 | • ALLIANCEBERNSTEIN REAL ASSET STRATEGY |
Notes to Consolidated Financial Statements
judgment. Options are classified within Level 2 on the fair value hierarchy when all of the significant inputs can be corroborated to market evidence. Otherwise such instruments are classified as Level 3.
The following table summarizes the valuation of the Strategy’s investments by the above fair value hierarchy levels as of October 31, 2014:
Investments in Securities: | Level 1 | Level 2 | Level 3 | Total | ||||||||||||
Assets: | ||||||||||||||||
Common Stock: | ||||||||||||||||
Energy | $ | 121,635,999 | $ | 66,034,818 | $ | – 0 | – | $ | 187,670,817 | |||||||
Materials | 24,884,447 | 34,587,168 | 2 | 59,471,617 | ||||||||||||
Equity: Other | 13,668,566 | 33,681,142 | – 0 | – | 47,349,708 | |||||||||||
Utilities | 5,373,005 | 26,312,798 | – 0 | – | 31,685,803 | |||||||||||
Retail | 10,209,833 | 14,631,732 | – 0 | – | 24,841,565 | |||||||||||
Residential | 7,608,128 | 11,451,112 | 2,586 | ^ | 19,061,826 | |||||||||||
Transportation | 245,042 | 15,870,353 | – 0 | – | 16,115,395 | |||||||||||
Office | 5,461,619 | 7,410,675 | – 0 | – | 12,872,294 | |||||||||||
Industrials | 2,377,544 | 3,377,045 | – 0 | – | 5,754,589 | |||||||||||
Lodging | 5,475,498 | 263,620 | – 0 | – | 5,739,118 | |||||||||||
Food Beverage & Tobacco | 3,232,925 | 152,156 | – 0 | – | 3,385,081 | |||||||||||
Financial: Other | 532,012 | – 0 | – | – 0 | – | 532,012 | ||||||||||
Inflation-Linked Securities | – 0 | – | 99,657,074 | – 0 | – | 99,657,074 | ||||||||||
Warrants | – 0 | – | 3,080,120 | – 0 | – | 3,080,120 | ||||||||||
Investment Companies | 2,144,572 | – 0 | – | – 0 | – | 2,144,572 | ||||||||||
Options Purchased – Puts | – 0 | – | 27,100 | – 0 | – | 27,100 | ||||||||||
Short-Term Investments | 111,861,671 | – 0 | – | – 0 | – | 111,861,671 | ||||||||||
|
|
|
|
|
|
|
| |||||||||
Total Investments in Securities | 314,710,861 | 316,536,913 | + | 2,588 | 631,250,362 | |||||||||||
Other Financial Instruments* : | ||||||||||||||||
Assets: | ||||||||||||||||
Futures | 3,024,189 | – 0 | – | – 0 | – | 3,024,189 | # | |||||||||
Forward Currency Exchange Contracts | – 0 | – | 4,158,422 | – 0 | – | 4,158,422 | ||||||||||
Total Return Swaps | – 0 | – | 1,276,009 | – 0 | – | 1,276,009 | ||||||||||
Liabilities: | ||||||||||||||||
Futures | (7,016,834 | ) | – 0 | – | – 0 | – | (7,016,834 | )# | ||||||||
Forward Currency Exchange Contracts | – 0 | – | (1,397,378 | ) | – 0 | – | (1,397,378 | ) | ||||||||
Interest Rate Swaps | – 0 | – | (27,452 | ) | – 0 | – | (27,452 | ) | ||||||||
Inflation (CPI) Swaps | – 0 | – | (4,679,909 | ) | – 0 | – | (4,679,909 | ) | ||||||||
|
|
|
|
|
|
|
| |||||||||
Total(a) | $ | 310,718,216 | $ | 315,866,605 | $ | 2,588 | $ | 626,587,409 | ||||||||
|
|
|
|
|
|
|
| |||||||||
| ^ | The Strategy held securities with zero market value at period end. |
| * | Other financial instruments are derivative instruments, such as futures, forwards and swaps, which are valued at the unrealized appreciation/depreciation on the instrument. |
| + | A significant portion of the Strategy’s foreign equity investments are categorized as Level 2 investments since they are valued using fair value prices based on third party vendor modeling tools to the extent available, see Note A.1. |
| # | Only variation margin receivable/payable at period end is reported within the consolidated statement of assets and liabilities. This amount reflects cumulative appreciation/(depreciation) of exchange-traded derivatives as reported in the consolidated portfolio of investments. |
| (a) | There were de minimus transfers under 1% of net assets between Level 1 and Level 2 during the reporting period. |
| ALLIANCEBERNSTEIN REAL ASSET STRATEGY • | 41 |
Notes to Consolidated Financial Statements
The Strategy recognizes all transfers between levels of the fair value hierarchy assuming the financial instruments were transferred at the beginning of the reporting period.
The following is a reconciliation of investments in which significant unobservable inputs (Level 3) were used in determining fair value.
| Materials | Residential^ | Warrants | ||||||||||
Balance as of 10/31/13 | $ | 2 | $ | 17,879 | $ | 1,069,240 | ||||||
Accrued discounts/(premiums) | – 0 | – | – 0 | – | – 0 | – | ||||||
Realized gain (loss) | – 0 | – | – 0 | – | 126,907 | |||||||
Change in unrealized appreciation/depreciation | – 0 | – | (18,913 | ) | 16,418 | |||||||
Purchases | – 0 | – | – 0 | – | 876,283 | |||||||
Sales | – 0 | – | – 0 | – | (1,160,774 | ) | ||||||
Transfers in to Level 3 | – 0 | – | 3,620 | – 0 | – | |||||||
Transfers out of Level 3 | – 0 | – | – 0 | – | (928,074 | ) | ||||||
|
|
|
|
|
| |||||||
Balance as of 10/31/14 | $ | 2 | $ | 2,586 | $ | – 0 | – | |||||
|
|
|
|
|
| |||||||
Net change in unrealized appreciation/depreciation from Investments held as of 10/31/14* | $ | – 0 | – | $ | (18,913 | ) | $ | – 0 | – | |||
|
|
|
|
|
| |||||||
| Total | ||||||||||||
Balance as of 10/31/13 | $ | 1,087,121 | ||||||||||
Accrued discounts/(premiums) | – 0 | – | ||||||||||
Realized gain (loss) | 126,907 | |||||||||||
Change in unrealized appreciation/depreciation | (2,495 | ) | ||||||||||
Purchases | 876,283 | |||||||||||
Sales | (1,160,774 | ) | ||||||||||
Transfers in to Level 3 | 3,620 | |||||||||||
Transfers out of Level 3 | (928,074 | ) | ||||||||||
|
| |||||||||||
Balance as of 10/31/14 | $ | 2,588 | + | |||||||||
|
| |||||||||||
Net change in unrealized appreciation/depreciation from Investments held as of 10/31/14* | $ | (18,913 | ) | |||||||||
|
| |||||||||||
| ^ | The Strategy held securities with zero market value at period end. |
| * | The unrealized appreciation/depreciation is included in net change in unrealized appreciation/depreciation of investments in the accompanying consolidated statement of operations. |
| + | There were de minimus transfers under 1% of net assets during the reporting period. |
The Adviser has established a Valuation Committee (the “Committee”) which is responsible for overseeing the pricing and valuation of all securities held in the Strategy. The Committee operates under pricing and valuation policies and procedures established by the Adviser and approved by the Board, including pricing policies which set forth the mechanisms and processes to be employed on a daily basis to implement these policies and procedures. In particular, the pricing policies describe how to determine market quotations for securities and other instruments. The Committee’s responsibilities include: 1) fair value and
| 42 | • ALLIANCEBERNSTEIN REAL ASSET STRATEGY |
Notes to Consolidated Financial Statements
liquidity determinations (and oversight of any third parties to whom any responsibility for fair value and liquidity determinations is delegated), and 2) regular monitoring of the Adviser’s pricing and valuation policies and procedures and modification or enhancement of these policies and procedures (or recommendation of the modification of these policies and procedures) as the Committee believes appropriate.
The Committee is also responsible for monitoring the implementation of the pricing policies by the Adviser’s Pricing Group (the “Pricing Group”) and a third party which performs certain pricing functions in accordance with the pricing policies. The Pricing Group is responsible for the oversight of the third party on a day-to-day basis. The Committee and the Pricing Group perform a series of activities to provide reasonable assurance of the accuracy of prices including: 1) periodic vendor due diligence meetings, review of methodologies, new developments and processes at vendors, 2) daily comparison of security valuation versus prior day for all securities that exceeded established thresholds, and 3) daily review of unpriced, stale, and variance reports with exceptions reviewed by senior management and the Committee.
In addition, several processes outside of the pricing process are used to monitor valuation issues including: 1) performance and performance attribution reports are monitored for anomalous impacts based upon benchmark performance, and 2) portfolio managers review all portfolios for performance and analytics (which are generated using the Adviser’s prices).
3. Currency Translation
Assets and liabilities denominated in foreign currencies and commitments under forward currency exchange contracts are translated into U.S. dollars at the mean of the quoted bid and ask prices of such currencies against the U.S. dollar. Purchases and sales of portfolio securities are translated into U.S. dollars at the rates of exchange prevailing when such securities were acquired or sold. Income and expenses are translated into U.S. dollars at rates of exchange prevailing when accrued.
Net realized gain or loss on foreign currency transactions represents foreign exchange gains and losses from sales and maturities of foreign fixed income investments, foreign currency exchange contracts, holding of foreign currencies, currency gains or losses realized between the trade and settlement dates on foreign investment transactions, and the difference between the amounts of dividends, interest and foreign withholding taxes recorded on the Strategy’s books and the U.S. dollar equivalent amounts actually received or paid. Net unrealized currency gains and losses from valuing foreign currency denominated assets and liabilities at period end exchange rates are reflected as a component of net unrealized appreciation or depreciation of foreign currency denominated assets and liabilities.
| ALLIANCEBERNSTEIN REAL ASSET STRATEGY • | 43 |
Notes to Consolidated Financial Statements
4. Taxes
It is the Strategy’s policy to meet the requirements of the Internal Revenue Code applicable to regulated investment companies and to distribute all of its investment company taxable income and net realized gains, if any, to shareholders. Therefore, no provisions for federal income or excise taxes are required. The Strategy may be subject to taxes imposed by countries in which it invests. Such taxes are generally based on income and/or capital gains earned or repatriated. Taxes are accrued and applied to net investment income, net realized gains and net unrealized appreciation/depreciation as such income and/or gains are earned.
If, during a taxable year, the Subsidiary’s taxable losses (and other deductible items) exceed its income and gains, the net loss will not pass through to the Strategy as a deductible amount for Federal income tax purposes. Note that the loss from the Subsidiary’s contemplated activities also cannot be carried forward to reduce future Subsidiary’s income in subsequent years. However, if the Subsidiary’s taxable gains exceed its losses and other deductible items during a taxable year, the net gain will pass through to the Strategy as income for Federal income tax purposes.
In accordance with U.S. GAAP requirements regarding accounting for uncertainties in income taxes, management has analyzed the Strategy’s tax positions taken or expected to be taken on federal and state income tax returns for all open tax years (all years since inception of the Strategy’s) and has concluded that no provision for income tax is required in the Strategy’s consolidated financial statements.
5. Investment Income and Investment Transactions
Dividend income is recorded on the ex-dividend date or as soon as the Strategy is informed of the dividend. Interest income is accrued daily. Investment transactions are accounted for on the date the securities are purchased or sold. Investment gains or losses are determined on the identified cost basis. The Strategy amortizes premiums and accretes discounts as adjustments to interest income.
6. Class Allocations
All income earned and expenses incurred by the Strategy are borne on a pro-rata basis by each outstanding class of shares, based on the proportionate interest in the Strategy represented by the net assets of such class, except for class specific expenses which are allocated to the respective class. Expenses of the Fund are charged proportionately to each Strategy or based on other appropriate methods. Realized and unrealized gains and losses are allocated among the various share classes based on respective net assets.
| 44 | • ALLIANCEBERNSTEIN REAL ASSET STRATEGY |
Notes to Consolidated Financial Statements
7. Dividends and Distributions
Dividends and distributions to shareholders, if any, are recorded on the ex-dividend date. Income dividends and capital gains distributions are determined in accordance with federal tax regulations and may differ from those determined in accordance with U.S. GAAP. To the extent these differences are permanent, such amounts are reclassified within the capital accounts based on their federal tax basis treatment; temporary differences do not require such reclassification.
NOTE B
Management Fee and Other Transactions with Affiliates
Under the terms of the investment advisory agreement, the Strategy pays the Adviser a management fee at an annual rate of .75% of the Strategy’s average daily net assets. Effective February 1, 2014, the Adviser agreed to waive its fees and bear certain expenses to the extent necessary to limit total operating expenses on an annual basis to 1.30%, 2.00%, 1.00%, 1.50%, 1.25%, 1.00%, 1.25%, 1.00% and 1.00% of daily average net assets for Class A, Class C, Advisor Class, Class R, Class K, Class I, Class 1, Class 2 and Class Z shares, respectively. This fee waiver and/or expense reimbursement agreement will remain in effect until January 31, 2015. For the year ended October 31, 2014, such reimbursement amounted to $103,010. Prior to February 1, 2014, the Adviser had agreed to waive its fees and bear certain expenses to the extent necessary to limit total operating expenses on an annual basis to 1.05%, 1.75%, 0.75%, 1.25%, 1.00%, 0.75%, 1.00% and 0.75% of daily average net assets for Class A, Class C, Advisor Class, Class R, Class K, Class I, Class 1 and Class 2 shares, respectively.
The Subsidiary has entered into a separate agreement with the Adviser for the management of the Subsidiary’s portfolio. The Adviser receives no compensation from the Subsidiary for its services under the agreement.
During the year ended October 31, 2014, the Adviser reimbursed the Strategy $119,942 for trading losses incurred due to a trade entry error.
Pursuant to the investment advisory agreement, the Strategy may reimburse the Adviser for certain legal and accounting services provided to the Strategy by the Adviser. For the year ended October 31, 2014, the reimbursement for such services amounted to $57,849.
The Strategy compensates AllianceBernstein Investor Services, Inc. (“ABIS”), a wholly-owned subsidiary of the Adviser, under a Transfer Agency Agreement for providing personnel and facilities to perform transfer agency services for the Strategy. ABIS may make payments to intermediaries that provide omnibus account services, sub-accounting services and/or networking services. Such compensation retained by ABIS amounted to $88,332 for the year ended October 31, 2014.
AllianceBernstein Investments, Inc. (the “Distributor”), a wholly-owned subsidiary of the Adviser, serves as the distributor of the Strategy’s shares. The
| ALLIANCEBERNSTEIN REAL ASSET STRATEGY • | 45 |
Notes to Consolidated Financial Statements
Distributor has advised the Strategy that it has retained front-end sales charges of $996 from the sale of Class A shares and received $150 and $625 in contingent deferred sales charges imposed upon redemptions by shareholders of Class A and Class C shares, respectively, for the year ended October 31, 2014.
The Strategy may invest in the AllianceBernstein Fixed-Income Shares, Inc. – Government STIF Portfolio (“Government STIF Portfolio”), an open-end management investment company managed by the Adviser. The Government STIF Portfolio is offered as a cash management option to mutual funds and other institutional accounts of the Adviser, and is not available for direct purchase by members of the public. The Government STIF Portfolio pays no investment management fees but does bear its own expenses. A summary of the Strategy’s transactions in shares of the Government STIF Portfolio for the year ended October 31, 2014 is as follows:
Market Value October 31, 2013 (000) | Purchases at Cost (000) | Sales Proceeds (000) | Market Value October 31, 2014 (000) | Dividend Income (000) | ||||||||||||||
| $ 13,659 | $ | 448,645 | $ | 350,442 | $ | 111,862 | $ | 37 | ||||||||||
Brokerage commissions paid on investment transactions for the year ended October 31, 2014 amounted to $629,704, of which $2,329 and $191, respectively, was paid to Sanford C. Bernstein & Co. LLC and Sanford C. Bernstein Limited, affiliates of the Adviser.
NOTE C
Distribution Services Agreement
The Strategy has adopted a Distribution Services Agreement (the “Agreement”) pursuant to Rule 12b-1 under the Investment Company Act of 1940. Under the Agreement, the Strategy pays distribution and servicing fees to AllianceBernstein Investments, Inc. (the “Distributor”) at an annual rate of up to .30% of the Strategy’s average daily net assets attributable to Class A shares, 1% of the Strategy’s average daily net assets attributable to Class C shares, .50% of the Strategy’s average daily net assets attributable to Class R shares, .25% of the Strategy’s average daily net assets attributable to Class K shares and .25% of the Strategy’s average daily net assets attributable to Class 1 shares. There are no distribution and servicing fees on the Advisor Class, Class I, Class 2 and Class Z shares. The fees are accrued daily and paid monthly. The Agreement provides that the Distributor will use such payments in their entirety for distribution assistance and promotional activities. Since the commencement of the Strategy’s operations, the Distributor has incurred expenses in excess of the distribution costs reimbursed by the Strategy in the amounts of $140,594, $13,943, $18,640 and $1,789,511 for Class C, Class R, Class K and Class 1 shares, respectively. While such costs may be recovered from the Strategy in future periods so long as the Agreement is in effect, the rate of the distribution and servicing fees payable under the Agreement may not be increased without a shareholder vote. In accordance with the Agreement, there is no provision for recovery of
| 46 | • ALLIANCEBERNSTEIN REAL ASSET STRATEGY |
Notes to Consolidated Financial Statements
unreimbursed distribution costs incurred by the Distributor beyond the current fiscal year for Class A shares. The Agreement also provides that the Adviser may use its own resources to finance the distribution of the Strategy’s shares.
NOTE D
Investment Transactions
Purchases and sales of investment securities (excluding short-term investments) for the year ended October 31, 2014 were as follows:
| Purchases | Sales | |||||||
Investment securities (excluding | $ | 402,454,610 | $ | 338,822,155 | ||||
U.S. government securities | 52,183,712 | 96,547,291 | ||||||
The cost of investments for federal income tax purposes, gross unrealized appreciation and unrealized depreciation (excluding futures, foreign currency, written options and swap transactions) are as follows:
Cost | $ | 691,982,864 | ||
|
| |||
Gross unrealized appreciation | $ | 3,346,969 | ||
Gross unrealized depreciation | (62,087,365 | ) | ||
|
| |||
Net unrealized depreciation | $ | (58,740,396 | ) | |
|
|
1. Derivative Financial Instruments
The Strategy may use derivatives in an effort to earn income and enhance returns, to replace more traditional direct investments, to obtain exposure to otherwise inaccessible markets (collectively, “investment purposes”), or to hedge or adjust the risk profile of its portfolio.
The principal types of derivatives utilized by the Strategy, as well as the methods in which they may be used are:
| • | Futures |
The Strategy may buy or sell futures for investment purposes or for the purpose of hedging its portfolio against adverse effects of potential movements in the market. The Strategy bears the market risk that arises from changes in the value of these instruments and the imperfect correlation between movements in the price of the futures and movements in the price of the assets, reference rates or indices which they are designed to track. Among other things, the Strategy may purchase or sell futures for foreign currencies or options thereon for non-hedging purposes as a means of making direct investment in foreign currencies, as described below under “Currency Transactions”.
At the time the Strategy enters into futures, the Strategy deposits and maintains as collateral an initial margin with the broker, as required by the exchange on which the transaction is effected. Such amount is shown as
| ALLIANCEBERNSTEIN REAL ASSET STRATEGY • | 47 |
Notes to Consolidated Financial Statements
due from broker on the consolidated statement of assets and liabilities. Pursuant to the contract, the Strategy agrees to receive from or pay to the broker an amount of cash equal to the daily fluctuation in the value of the contract. Such receipts or payments are known as variation margin and are recorded by the Strategy as unrealized gains or losses. Risks may arise from the potential inability of a counterparty to meet the terms of the contract. The credit/counterparty risk for exchange-traded futures is generally less than privately negotiated futures, since the clearinghouse, which is the issuer or counterparty to each exchange-traded future, has robust risk mitigation standards, including the requirement to provide initial and variation margin. When the contract is closed, the Strategy records a realized gain or loss equal to the difference between the value of the contract at the time it was opened and the time it was closed.
Use of long futures subjects the Strategy to risk of loss in excess of the amounts shown on the consolidated statement of assets and liabilities, up to the notional value of the futures. Use of short futures subjects the Strategy to unlimited risk of loss. Under some circumstances, futures exchanges may establish daily limits on the amount that the price of futures can vary from the previous day’s settlement price, which could effectively prevent liquidation of unfavorable positions.
During the year ended October 31, 2014, the Strategy held futures for hedging and non-hedging purposes.
| • | Forward Currency Exchange Contracts |
The Strategy may enter into forward currency exchange contracts in order to hedge its exposure to changes in foreign currency exchange rates on its foreign portfolio holdings, to hedge certain firm purchase and sale commitments denominated in foreign currencies and for non-hedging purposes as a means of making direct investments in foreign currencies, as described below under “Currency Transactions”.
A forward currency exchange contract is a commitment to purchase or sell a foreign currency at a future date at a negotiated forward rate. The gain or loss arising from the difference between the original contract and the closing of such contract would be included in net realized gain or loss on foreign currency transactions. Fluctuations in the value of open forward currency exchange contracts are recorded for financial reporting purposes as unrealized appreciation and/or depreciation by the Strategy. Risks may arise from the potential inability of a counterparty to meet the terms of a contract and from unanticipated movements in the value of a foreign currency relative to the U.S. dollar.
During the year ended October 31, 2014, the Strategy held forward currency exchange contracts for hedging and non-hedging purposes.
| 48 | • ALLIANCEBERNSTEIN REAL ASSET STRATEGY |
Notes to Consolidated Financial Statements
| • | Option Transactions |
For hedging and investment purposes, the Strategy may purchase and write (sell) put and call options on U.S. and foreign securities, including government securities, and foreign currencies that are traded on U.S. and foreign securities exchanges and over-the-counter markets. Among other things, the Strategy may use options transactions for non-hedging purposes as a means of making direct investments in foreign currencies, as described below under “Currency Transactions” and may use options strategies involving the purchase and/or writing of various combinations of call and/or put options, for hedging and investment purposes.
The risk associated with purchasing an option is that the Strategy pays a premium whether or not the option is exercised. Additionally, the Strategy bears the risk of loss of the premium and change in market value should the counterparty not perform under the contract. Put and call options purchased are accounted for in the same manner as portfolio securities. The cost of securities acquired through the exercise of call options is increased by premiums paid. The proceeds from securities sold through the exercise of put options are decreased by the premiums paid.
When the Strategy writes an option, the premium received by the Strategy is recorded as a liability and is subsequently adjusted to the current market value of the option written. Premiums received from written options which expire unexercised are recorded by the Strategy on the expiration date as realized gains from options written. The difference between the premium received and the amount paid on effecting a closing purchase transaction, including brokerage commissions, is also treated as a realized gain, or if the premium received is less than the amount paid for the closing purchase transaction, as a realized loss. If a call option is exercised, the premium received is added to the proceeds from the sale of the underlying security or currency in determining whether the Strategy has realized a gain or loss. If a put option is exercised, the premium received reduces the cost basis of the security or currency purchased by the Strategy. In writing an option, the Strategy bears the market risk of an unfavorable change in the price of the security or currency underlying the written option. Exercise of an option written by the Strategy could result in the Strategy selling or buying a security or currency at a price different from the current market value.
During the year ended October 31, 2014, the Strategy held purchased options for hedging purposes.
For the year ended October 31, 2014, the Strategy had no transactions in written options.
| • | Swaps |
The Strategy may enter into swaps to hedge its exposure to interest rates, credit risk, equity markets and currencies. The Strategy may also enter into swaps for non-hedging purposes as a means of gaining market exposures,
| ALLIANCEBERNSTEIN REAL ASSET STRATEGY • | 49 |
Notes to Consolidated Financial Statements
making direct investments in foreign currencies, as described below under “Currency Transactions” or in order to take a “long” or “short” position with respect to an underlying referenced asset described below under “Total Return Swaps”. A swap is an agreement that obligates two parties to exchange a series of cash flows at specified intervals based upon or calculated by reference to changes in specified prices or rates for a specified amount of an underlying asset. The payment flows are usually netted against each other, with the difference being paid by one party to the other. In addition, collateral may be pledged or received by the Strategy in accordance with the terms of the respective swaps to provide value and recourse to the Strategy or its counterparties in the event of default, bankruptcy or insolvency by one of the parties to the swap.
Risks may arise as a result of the failure of the counterparty to the swap to comply with the terms of the swap. The loss incurred by the failure of a counterparty is generally limited to the net interim payment to be received by the Strategy, and/or the termination value at the end of the contract. Therefore, the Strategy considers the creditworthiness of each counterparty to a swap in evaluating potential counterparty risk. This risk is mitigated by having a netting arrangement between the Strategy and the counterparty and by the posting of collateral by the counterparty to the Strategy to cover the Strategy��s exposure to the counterparty. Additionally, risks may arise from unanticipated movements in interest rates or in the value of the underlying securities. The Strategy accrues for the interim payments on swaps on a daily basis, with the net amount recorded within unrealized appreciation/depreciation of swaps on the consolidated statement of assets and liabilities, where applicable. Once the interim payments are settled in cash, the net amount is recorded as realized gain/(loss) on swaps on the consolidated statement of operations, in addition to any realized gain/(loss) recorded upon the termination of swaps. Upfront premiums paid or received are recognized as cost or proceeds on the consolidated statement of assets and liabilities and are amortized on a straight line basis over the life of the contract. Amortized upfront premiums are included in net realized gain/(loss) from swaps on the consolidated statement of operations. Fluctuations in the value of swaps are recorded as a component of net change in unrealized appreciation/depreciation of swaps on the consolidated statement of operations.
Interest Rate Swaps:
The Strategy is subject to interest rate risk exposure in the normal course of pursuing its investment objectives. Because the Strategy holds fixed rate bonds, the value of these bonds may decrease if interest rates rise. To help hedge against this risk and to maintain its ability to generate income at prevailing market rates, the Strategy may enter into interest rate swaps. Interest rate swaps are agreements between two parties to exchange cash flows based on a notional amount. The Strategy may elect to pay a fixed rate and receive a floating rate, or, receive a fixed rate and pay a floating rate on a notional amount.
| 50 | • ALLIANCEBERNSTEIN REAL ASSET STRATEGY |
Notes to Consolidated Financial Statements
In addition, a Strategy may also enter into interest rate swap transactions to preserve a return or spread on a particular investment or portion of its portfolio, or protecting against an increase in the price of securities the Strategy anticipates purchasing at a later date. Interest rate swaps involve the exchange by a Strategy with another party of their respective commitments to pay or receive interest (e.g., an exchange of floating rate payments for fixed rate payments) computed based on a contractually-based principal (or “notional”) amount. Interest rate swaps are entered into on a net basis (i.e., the two payment streams are netted out, with the Strategy receiving or paying, as the case may be, only the net amount of the two payments).
During the year ended October 31, 2014, the Strategy held interest rate swaps for hedging and non-hedging purposes.
Inflation (CPI) Swaps:
Inflation swap agreements are contracts in which one party agrees to pay the cumulative percentage increase in a price index (the Consumer Price Index with respect to CPI swaps) over the term of the swap (with some lag on the inflation index), and the other pays a compounded fixed rate. Inflation swaps may be used to protect the net asset value, or NAV, of Strategy against an unexpected change in the rate of inflation measured by an inflation index since the value of these agreements is expected to increase if unexpected inflation increases.
During the year ended October 31, 2014, the Strategy held inflation (CPI) swaps for hedging and non-hedging purposes.
Total Return Swaps:
The Strategy may enter into total return swaps in order to take a “long” or “short” position with respect to an underlying referenced asset. The Strategy is subject to market price volatility of the underlying referenced asset. A total return swap involves commitments to pay interest in exchange for a market linked return based on a notional amount. To the extent that the total return of the security, group of securities or index underlying the transaction exceeds or falls short of the offsetting interest obligation, the Strategy will receive a payment from or make a payment to the counterparty.
During the year ended October 31, 2014, the Strategy held total return swaps for non-hedging purposes.
The Strategy typically enters into International Swaps and Derivatives Association, Inc. Master Agreements (“ISDA Master Agreement”) or similar master agreements (collectively, “Master Agreements”) with its OTC derivative contract counterparties in order to, among other things, reduce its credit risk to counterparties. ISDA Master Agreements include provisions for general obligations, representations, collateral and events of default or termination. Under an ISDA
| ALLIANCEBERNSTEIN REAL ASSET STRATEGY • | 51 |
Notes to Consolidated Financial Statements
Master Agreement, the Strategy typically may offset with the counterparty certain derivative financial instrument’s payables and/or receivables with collateral held and/or posted and create one single net payment (close-out netting) in the event of default or termination.
Various Master Agreements govern the terms of certain transactions with counterparties, including transactions such as exchange-traded derivative transactions, repurchase and reverse repurchase agreements. These Master Agreements typically attempt to reduce the counterparty risk associated with such transactions by specifying credit protection mechanisms and providing standardization that improves legal certainty. Cross-termination provisions under Master Agreements typically provide that a default in connection with one transaction between the Strategy and a counterparty gives the non-defaulting party the right to terminate any other transactions in place with the defaulting party to create one single net payment due to/due from the defaulting party. In the event of a default by a Master Agreements counterparty, the return of collateral with market value in excess of the Strategy’s net liability, held by the defaulting party, may be delayed or denied.
The Strategy’s Master Agreements may contain provisions for early termination of OTC derivative transactions in the event the net assets of the Strategy decline below specific levels (“net asset contingent features”). If these levels are triggered, the Strategy’s counterparty has the right to terminate such transaction and require the Strategy to pay or receive a settlement amount in connection with the terminated transaction. For additional details, please refer to netting arrangements by counterparty tables below.
At October 31, 2014, the Strategy had entered into the following derivatives:
Asset Derivatives | Liability Derivatives | |||||||||||
Derivative Type | Statement of | Fair Value | Statement of | Fair Value | ||||||||
Commodity contracts | Receivable/Payable for variation margin on exchange-traded derivatives | $ | 3,024,189 | * | Receivable/Payable for variation margin on exchange-traded derivatives | $ | 6,305,448 | * | ||||
Equity contracts | Receivable/Payable for variation margin on exchange-traded derivatives | 711,386 | * | |||||||||
Equity contracts | Investments in securities, at value | 27,100 | ||||||||||
| 52 | • ALLIANCEBERNSTEIN REAL ASSET STRATEGY |
Notes to Consolidated Financial Statements
Asset Derivatives | Liability Derivatives | |||||||||||
Derivative Type | Statement of | Fair Value | Statement of | Fair Value | ||||||||
Foreign exchange contracts | Unrealized appreciation on forward currency exchange contracts | $ | 4,158,422 | | Unrealized depreciation on forward currency exchange contracts | $ | 1,397,378 | | ||||
Interest rate contracts | Unrealized depreciation on interest rate swaps | | 27,452 | | ||||||||
Interest rate contracts | Unrealized depreciation on inflation swaps | | 4,679,909 | | ||||||||
Equity contracts | Unrealized appreciation on total return swaps | 1,276,009 | ||||||||||
|
|
|
| |||||||||
Total | $ | 8,485,720 | $ | 13,121,573 | ||||||||
|
|
|
| |||||||||
| * | Only variation margin receivable/payable at period end is reported within the consolidated statement of assets and liabilities. This amount reflects cumulative appreciation/(depreciation) of exchange-traded derivatives as reported in the consolidated portfolio of investments. |
The effect of derivative instruments on the consolidated statement of operations for the year ended October 31, 2014:
Derivative Type | Location of Gain | Realized Gain or (Loss) on Derivatives | Change in Unrealized Appreciation or (Depreciation) | |||||||
Commodity contracts | Net realized gain (loss) on futures; Net change in unrealized appreciation/depreciation of futures | $ | (1,568,243 | ) | $ | (2,850,782 | ) | |||
Equity contracts | Net realized gain (loss) on futures; Net change in unrealized appreciation/depreciation of futures | 1,504,837 | (711,386 | ) | ||||||
Foreign exchange contracts | Net realized gain (loss) on foreign currency transactions; Net change in unrealized appreciation/depreciation of foreign currency denominated assets and liabilities | 2,081,646 | 4,037,008 | |||||||
| ALLIANCEBERNSTEIN REAL ASSET STRATEGY • | 53 |
Notes to Consolidated Financial Statements
Derivative Type | Location of Gain | Realized Gain or (Loss) on Derivatives | Change in Unrealized Appreciation or (Depreciation) | |||||||
Equity contracts | Net realized gain (loss) on investment transactions; Net change in unrealized appreciation/ depreciation of investments | $ | – 0 | – | $ | (836,383 | ) | |||
Interest rate contracts | Net realized gain (loss) on swaps; Net change in unrealized appreciation/depreciation of swaps | (592,309 | ) | (4,614,930 | ) | |||||
Equity contracts | Net realized gain (loss) on swaps; Net change in unrealized appreciation/depreciation of swaps | (18,291,906 | ) | 5,102,250 | ||||||
|
|
|
| |||||||
Total | $ | (16,865,975 | ) | $ | 125,777 | |||||
|
|
|
| |||||||
The following table represents the volume of the Strategy’s derivative transactions during the year ended October 31, 2014:
Futures: | ||||
Average original value of buy contracts | $ | 53,823,524 | ||
Average original value of sale contracts | $ | 58,979,242 | ||
Forward Currency Exchange Contracts: | ||||
Average principal amount of buy contracts | $ | 52,481,924 | ||
Average principal amount of sale contracts | $ | 74,730,869 | ||
Purchased Options: | ||||
Average monthly cost | $ | 818,029 | ||
Interest Rate Swaps: | ||||
Average notional amount | $ | 7,781,923 | ||
Inflation Swaps: | ||||
Average notional amount | $ | 165,855,846 | ||
Total Return Swaps: | ||||
Average monthly cost | $ | 211,314,147 | ||
For financial reporting purposes, the Strategy does not offset derivative assets and derivative liabilities that are subject to netting arrangements in the consolidated statement of assets and liabilities.
| 54 | • ALLIANCEBERNSTEIN REAL ASSET STRATEGY |
Notes to Consolidated Financial Statements
All derivatives held at period end were subject to netting arrangements. The following table presents the Strategy’s derivative assets and liabilities by counterparty net of amounts available for offset under Master Agreements (“MA”) and net of the related collateral received/ pledged by the Strategy as of October 31, 2014:
AllianceBernstein Real Asset Strategy
Counterparty | Derivative Assets Subject to a MA | Derivative Available for Offset | Cash Collateral Received* | Security Collateral Received* | Net Amount of Derivatives Assets | |||||||||||||||
Exchange-Traded Derivatives: | ||||||||||||||||||||
Morgan Stanley & Co., LLC | $ | 27,100 | $ | – 0 | – | $ | – 0 | – | $ | – 0 | – | $ | 27,100 | |||||||
|
|
|
|
|
|
|
|
|
| |||||||||||
Total | $ | 27,100 | $ | – 0 | – | $ | – 0 | – | $ | – 0 | – | $ | 27,100 | |||||||
|
|
|
|
|
|
|
|
|
| |||||||||||
OTC Derivatives: | ||||||||||||||||||||
Barclays Bank PLC | $ | 50,036 | $ | (50,036 | ) | $ | – 0 | – | $ | – 0 | – | $ | – 0 | – | ||||||
BNP Paribas SA | 64,549 | (61,292 | ) | – 0 | – | – 0 | – | 3,257 | ||||||||||||
Deutsche Bank AG | 945,796 | (46,800 | ) | – 0 | – | – 0 | – | 898,996 | ||||||||||||
Goldman Sachs Bank USA | 2,697,985 | (167,972 | ) | – 0 | – | – 0 | – | 2,530,013 | ||||||||||||
HSBC Bank USA | 9,365 | (1,717 | ) | – 0 | – | – 0 | – | 7,648 | ||||||||||||
Royal Bank of Scotland PLC | 31,516 | (31,516 | ) | – 0 | – | – 0 | – | – 0 | – | |||||||||||
State Street Bank & Trust Co. | 21,512 | (21,512 | ) | – 0 | – | – 0 | – | – 0 | – | |||||||||||
UBS AG | 337,663 | (169,095 | ) | – 0 | – | – 0 | – | 168,568 | ||||||||||||
|
|
|
|
|
|
|
|
|
| |||||||||||
Total | $ | 4,158,422 | $ | (549,940 | ) | $ | – 0 | – | $ | – 0 | – | $ | 3,608,482^ | |||||||
|
|
|
|
|
|
|
|
|
| |||||||||||
Counterparty | Derivative Liabilities Subject to a MA | Derivative Available for Offset | Cash Collateral Pledged | Security Collateral Pledged* | Net Amount of Derivatives Liabilities | |||||||||||||||
Exchange-Traded Derivatives: | ||||||||||||||||||||
Goldman Sachs & Co.** | $ | 668,040 | $ | – 0 | – | $ | – 0 | – | $ | – 0 | – | $ | 668,040 | |||||||
|
|
|
|
|
|
|
|
|
| |||||||||||
Total | $ | 668,040 | $ | – 0 | – | $ | – 0 | – | $ | – 0 | – | $ | 668,040 | |||||||
|
|
|
|
|
|
|
|
|
| |||||||||||
OTC Derivatives: | ||||||||||||||||||||
Bank of America, NA | $ | 27,452 | $ | – 0 | – | $ | – 0 | – | $ | – 0 | – | $ | 27,452 | |||||||
Barclays Bank PLC | 795,018 | (50,036 | ) | – 0 | – | (744,982 | ) | – 0 | – | |||||||||||
BNP Paribas SA | 61,292 | (61,292 | ) | – 0 | – | – 0 | – | – 0 | – | |||||||||||
Citibank, NA | 276,796 | – 0 | – | – 0 | – | – 0 | – | 276,796 | ||||||||||||
Credit Suisse International | 30,298 | – 0 | – | – 0 | – | – 0 | – | 30,298 | ||||||||||||
Deutsche Bank AG | 46,800 | (46,800 | ) | – 0 | – | – 0 | – | – 0 | – | |||||||||||
Goldman Sachs Bank USA | 167,972 | (167,972 | ) | – 0 | – | – 0 | – | – 0 | – | |||||||||||
| ALLIANCEBERNSTEIN REAL ASSET STRATEGY • | 55 |
Notes to Consolidated Financial Statements
Counterparty | Derivative Liabilities Subject to a MA | Derivative Available for Offset | Cash Collateral Pledged | Security Collateral Pledged* | Net Amount of Derivatives Liabilities | |||||||||||||||
HSBC Bank USA | $ | 1,717 | $ | (1,717 | ) | $ | – 0 | – | $ | – 0 | – | $ | – 0 | – | ||||||
JPMorgan Chase Bank, NA | 4,250,809 | – 0 | – | – 0 | – | (4,250,809 | ) | – 0 | – | |||||||||||
Royal Bank of Scotland PLC | 63,407 | (31,516 | ) | – 0 | – | – 0 | – | 31,891 | ||||||||||||
Standard Chartered Bank | 731 | – 0 | – | – 0 | – | – 0 | – | 731 | ||||||||||||
State Street Bank & Trust Co. | 213,352 | (21,512 | ) | – 0 | – | – 0 | – | 191,840 | ||||||||||||
UBS AG | 169,095 | (169,095 | ) | – 0 | – | – 0 | – | – 0 | – | |||||||||||
|
|
|
|
|
|
|
|
|
| |||||||||||
Total | $ | 6,104,739 | $ | (549,940 | ) | $ | – 0 | – | $ | (4,995,791 | ) | $ | 559,008 | ^ | ||||||
|
|
|
|
|
|
|
|
|
| |||||||||||
| * | The actual collateral received/pledged may be more than the amount reported due to overcollateralization. |
| ** | Cash has been posted for initial margin requirements for exchange traded derivatives outstanding at October 31, 2014. |
| ^ | Net amount represents the net receivable/payable that would be due from/to the counterparty in the event of default or termination. The net amount from OTC financial derivative instruments can only be netted across transactions governed under the same master agreement with the same counterparty. |
AllianceBernstein Cayman Inflation Strategy, Ltd.
Counterparty | Derivative Assets Subject to a MA | Derivative Available for Offset | Cash Collateral Received* | Security Collateral Received* | Net Amount of Derivatives Assets | |||||||||||||||
OTC Derivatives: | ||||||||||||||||||||
Citibank, NA | $ | 527,354 | $ | – 0 | – | $ | (527,354 | ) | $ | – 0 | – | $ | – 0 | – | ||||||
Goldman Sachs International | 511,505 | – 0 | – | (511,505 | ) | – 0 | – | – 0 | – | |||||||||||
JPMorgan Chase Bank, NA | 237,150 | – 0 | – | – 0 | – | – 0 | – | 237,150 | ||||||||||||
|
|
|
|
|
|
|
|
|
| |||||||||||
Total | $ | 1,276,009 | $ | – 0 | – | $ | (1,038,859 | ) | $ | – 0 | – | $ | 237,150 | ^ | ||||||
|
|
|
|
|
|
|
|
|
| |||||||||||
Counterparty | Derivative Liabilities Subject to a MA | Derivative Available for Offset | Cash Collateral Pledged | Security Collateral Pledged | Net Amount of Derivatives Liabilities | |||||||||||||||
Exchange-Traded Derivatives: | ||||||||||||||||||||
Morgan Stanley & Co., LLC ** | $ | 56,939 | $ | – 0 | – | $ | (56,939 | ) | $ | – 0 | – | $ | – 0 | – | ||||||
|
|
|
|
|
|
|
|
|
| |||||||||||
Total | $ | 56,939 | $ | – 0 | – | $ | (56,939 | ) | $ | – 0 | – | $ | – 0 | – | ||||||
|
|
|
|
|
|
|
|
|
| |||||||||||
| * | The actual collateral received/pledged may be more than the amount reported due to overcollateralization. |
| ** | Cash has been posted for initial margin requirements for exchange traded derivatives outstanding at October 31, 2014. |
| ^ | Net amount represents the net receivable/payable that would be due from/to the counterparty in the event of default or termination. The net amount from OTC financial derivative instruments can only be netted across transactions governed under the same master agreement with the same counterparty. |
| 56 | • ALLIANCEBERNSTEIN REAL ASSET STRATEGY |
Notes to Consolidated Financial Statements
2. Currency Transactions
The Strategy may invest in non-U.S. dollar securities on a currency hedged or unhedged basis. The Strategy may seek investment opportunities by taking long or short positions in currencies through the use of currency-related derivatives, including forward currency exchange contracts, futures and options on futures, swaps, and other options. The Strategy may enter into transactions for investment opportunities when it anticipates that a foreign currency will appreciate or depreciate in value but securities denominated in that currency are not held by the Strategy and do not present attractive investment opportunities. Such transactions may also be used when the Adviser believes that it may be more efficient than a direct investment in a foreign currency-denominated security. The Strategy may also conduct currency exchange contracts on a spot basis (i.e., for cash at the spot rate prevailing in the currency exchange market for buying or selling currencies).
NOTE E
Capital Stock
Each class consists of 3,000,000,000 authorized shares. Transactions in capital shares for Class A, Class C, Advisor Class, Class R, Class K, Class I, Class 1 and Class Z were as follows:
| Shares | Amount | |||||||||||||||||||
| Year Ended October 31, 2014 | Year Ended October 31, 2013 | Year Ended 2014 | Year Ended 2013 | |||||||||||||||||
|
| |||||||||||||||||||
| Class A | ||||||||||||||||||||
Shares sold | 711,126 | 1,972,753 | $ | 7,769,044 | $ | 21,884,520 | ||||||||||||||
| ||||||||||||||||||||
Shares issued in reinvestment of dividends | 46,030 | 92,311 | 488,844 | 1,020,960 | ||||||||||||||||
| ||||||||||||||||||||
Shares redeemed | (3,924,160 | ) | (2,198,377 | ) | (44,056,119 | ) | (24,151,459 | ) | ||||||||||||
| ||||||||||||||||||||
Net decrease | (3,167,004 | ) | (133,313 | ) | $ | (35,798,231 | ) | $ | (1,245,979 | ) | ||||||||||
| ||||||||||||||||||||
| Class C | ||||||||||||||||||||
Shares sold | 66,006 | 317,063 | $ | 733,585 | $ | 3,497,660 | ||||||||||||||
| ||||||||||||||||||||
Shares issued in reinvestment of dividends | 4,929 | 21,649 | 52,050 | 237,922 | ||||||||||||||||
| ||||||||||||||||||||
Shares redeemed | (449,168 | ) | (568,756 | ) | (4,892,133 | ) | (6,218,213 | ) | ||||||||||||
| ||||||||||||||||||||
Net decrease | (378,233 | ) | (230,044 | ) | $ | (4,106,498 | ) | $ | (2,482,631 | ) | ||||||||||
| ||||||||||||||||||||
| Advisor Class | ||||||||||||||||||||
Shares sold | 3,229,636 | 2,733,581 | $ | 36,855,186 | $ | 30,448,510 | ||||||||||||||
| ||||||||||||||||||||
Shares issued in reinvestment of dividends | 65,150 | 122,260 | 692,544 | 1,354,636 | ||||||||||||||||
| ||||||||||||||||||||
Shares redeemed | (3,621,284 | ) | (3,378,020 | ) | (39,903,399 | ) | (37,225,296 | ) | ||||||||||||
| ||||||||||||||||||||
Net decrease | (326,498 | ) | (522,179 | ) | $ | (2,355,669 | ) | $ | (5,422,150 | ) | ||||||||||
| ||||||||||||||||||||
| ALLIANCEBERNSTEIN REAL ASSET STRATEGY • | 57 |
Notes to Consolidated Financial Statements
| Shares | Amount | |||||||||||||||||||
| Year Ended October 31, 2014 | Year Ended October 31, 2013 | Year Ended 2014 | Year Ended 2013 | |||||||||||||||||
|
| |||||||||||||||||||
| Class R | ||||||||||||||||||||
Shares sold | 16,124 | 2,043 | $ | 168,739 | $ | 22,606 | ||||||||||||||
| ||||||||||||||||||||
Shares issued in reinvestment of dividends | 28 | 11 | 296 | 120 | ||||||||||||||||
| ||||||||||||||||||||
Shares redeemed | (2,285 | ) | (84 | ) | (24,289 | ) | (903 | ) | ||||||||||||
| ||||||||||||||||||||
Net increase | 13,867 | 1,970 | $ | 144,746 | $ | 21,823 | ||||||||||||||
| ||||||||||||||||||||
| Class K | ||||||||||||||||||||
Shares sold | 101,455 | 54,655 | $ | 1,094,794 | $ | 604,459 | ||||||||||||||
| ||||||||||||||||||||
Shares issued in reinvestment of dividends | 2,522 | 2,788 | 26,710 | 30,815 | ||||||||||||||||
| ||||||||||||||||||||
Shares redeemed | (49,545 | ) | (18,439 | ) | (530,428 | ) | (200,230 | ) | ||||||||||||
| ||||||||||||||||||||
Net increase | 54,432 | 39,004 | $ | 591,076 | $ | 435,044 | ||||||||||||||
| ||||||||||||||||||||
| Class I | ||||||||||||||||||||
Shares sold | 453,087 | 508,706 | $ | 4,971,354 | $ | 5,691,441 | ||||||||||||||
| ||||||||||||||||||||
Shares issued in reinvestment of dividends | 33,483 | 45,471 | 354,918 | 503,361 | ||||||||||||||||
| ||||||||||||||||||||
Shares redeemed | (205,125 | ) | (464,738 | ) | (2,347,148 | ) | (5,170,396 | ) | ||||||||||||
| ||||||||||||||||||||
Net increase | 281,445 | 89,439 | $ | 2,979,124 | $ | 1,024,406 | ||||||||||||||
| ||||||||||||||||||||
| Class 1 | ||||||||||||||||||||
Shares sold | 17,658,838 | 22,862,114 | $ | 192,145,101 | $ | 251,401,447 | ||||||||||||||
| ||||||||||||||||||||
Shares issued in reinvestment of dividends | 569,369 | 405,500 | 6,001,142 | 4,464,553 | ||||||||||||||||
| ||||||||||||||||||||
Shares redeemed | (7,369,828 | ) | (4,690,415 | ) | (79,296,240 | ) | (51,503,929 | ) | ||||||||||||
| ||||||||||||||||||||
Net increase | 10,858,379 | 18,577,199 | $ | 118,850,003 | $ | 204,362,071 | ||||||||||||||
| ||||||||||||||||||||
| Class Z(a) | ||||||||||||||||||||
Shares sold | 950 | – 0 | – | $ | 10,003 | $ | – 0 | – | ||||||||||||
| ||||||||||||||||||||
Net increase | 950 | – 0 | – | $ | 10,003 | $ | – 0 | – | ||||||||||||
| ||||||||||||||||||||
| (a) | Commenced distribution on January 31, 2014. |
NOTE F
Risks Involved in Investing in the Strategy
Interest Rate Risk and Credit Risk—Interest rate risk is the risk that changes in interest rates will affect the value of the Strategy’s investments in fixed-income debt securities such as bonds or notes. Increases in interest rates may cause the value of the Strategy’s investments to decline. Credit risk is the risk that the issuer or guarantor of a debt security, or the counterparty to a derivative contract, will be unable or unwilling to make timely principal and/or interest payments, or to otherwise honor its obligations. The degree of risk for a particular security may be reflected in its credit rating. Credit risk is greater for medium
| 58 | • ALLIANCEBERNSTEIN REAL ASSET STRATEGY |
Notes to Consolidated Financial Statements
quality and lower-rated securities. Lower-rated debt securities and similar unrated securities (commonly known as “junk bonds”) have speculative elements or are predominantly speculative risks.
Foreign Securities Risk—Investing in securities of foreign companies or foreign governments involves special risks which include changes in foreign currency exchange rates and the possibility of future political and economic developments which could adversely affect the value of such securities. Moreover, securities of many foreign companies or foreign governments and their markets may be less liquid and their prices more volatile than those of comparable U.S. companies or of the U.S. government.
Currency Risk—This is the risk that changes in foreign currency exchange rates may negatively affect the value of the Strategy’s investments or reduce the returns of the Strategy. For example, the value of the Strategy’s investments in foreign currency-denominated securities or currencies may decrease if the U.S. dollar is strong (i.e., gaining value relative to other currencies) and other currencies are weak (i.e., losing value relative to the U.S. dollar). Currency markets are generally not as regulated as securities markets. Independent of the Strategy’s investments denominated in foreign currencies, the Strategy’s positions in various foreign currencies may cause the Strategy to experience investment losses due to the changes in exchange rates and interest rates.
Commodity Risk—Investing in commodity-linked derivative instruments may subject the Strategy to greater volatility than investments in traditional securities. The value of commodity-linked derivative instruments may be affected by changes in overall market movements, commodity index volatility, changes in interest rates, or factors affecting a particular industry or commodity, such as drought, floods, weather, livestock disease, embargoes, tariffs and international economic, political and regulatory developments.
Derivatives Risk—The Strategy may enter into derivative transactions such as forwards, options, futures and swaps. Derivatives may be illiquid, difficult to price, and leveraged so that small changes may produce disproportionate losses for the Strategy, and subject to counterparty risk to a greater degree than more traditional investments. Derivatives may result in significant losses, including losses that are far greater than the value of the derivatives reflected in the consolidated statement of assets and liabilities.
Leverage Risk—When the Strategy borrows money or otherwise leverages its portfolio, it may be volatile because leverage tends to exaggerate the effect of any increase or decrease in the value of the Strategy’s investments. The Strategy may create leverage through the use of reverse repurchase arrangements, forward currency exchange contracts, forward commitments, dollar rolls or futures contracts or by borrowing money. The use of derivative instruments by the Strategy,
| ALLIANCEBERNSTEIN REAL ASSET STRATEGY • | 59 |
Notes to Consolidated Financial Statements
such as forwards, futures, options and swaps, may also result in a form of leverage. Leverage may result in higher returns to the Strategy than if the Strategy were not leveraged, but may also adversely affect returns, particularly if the market is declining.
Indemnification Risk—In the ordinary course of business, the Strategy enters into contracts that contain a variety of indemnifications. The Strategy’s maximum exposure under these arrangements is unknown. However, the Strategy has not had prior claims or losses pursuant to these indemnification provisions and expects the risk of loss thereunder to be remote. Therefore, the Strategy has not accrued any liability in connection with these indemnification provisions.
NOTE G
Joint Credit Facility
A number of open-end mutual funds managed by the Adviser, including the Strategy, participate in a $280 million revolving credit facility (the “Facility”) intended to provide short-term financing, if necessary, subject to certain restrictions in connection with abnormal redemption activity. Commitment fees related to the Facility are paid by the participating funds and are included in miscellaneous expenses in the consolidated statement of operations. The Strategy did not utilize the Facility during the year ended October 31, 2014.
NOTE H
Distributions to Shareholders
The tax character of distributions paid during the fiscal years ended October 31, 2014 and October 31, 2013 were as follows:
| 2014 | 2013 | |||||||
Distributions paid from: | ||||||||
Ordinary income | $ | 9,000,069 | $ | 9,506,294 | ||||
|
|
|
| |||||
Total distributions paid | $ | 9,000,069 | $ | 9,506,294 | ||||
|
|
|
| |||||
As of October 31, 2014, the components of accumulated earnings/(deficit) on a tax basis were as follows:
Undistributed ordinary income | $ | 12,575,484 | ||
Accumulated capital and other losses | (5,993,250 | )(a) | ||
Unrealized appreciation/(depreciation) | (63,558,973 | )(b) | ||
|
| |||
Total accumulated earnings/(deficit) | $ | (56,976,739 | ) | |
|
|
| (a) | On October 31, 2014, the Strategy had a net capital loss carryforward of $5,993,250. During the fiscal year, the Strategy utilized $8,392,003 of capital loss carryforwards to offset current year net realized gains. |
| (b) | The differences between book-basis and tax-basis unrealized appreciation/(depreciation) are attributable primarily to the tax deferral of losses on wash sales, the tax treatment of swaps and passive foreign investment companies (PFICs), the tax treatment of Treasury inflation-protected securities, the realization for tax purposes of gains/losses on certain derivative instruments, and the tax treatment of earnings from the Subsidiary. |
| 60 | • ALLIANCEBERNSTEIN REAL ASSET STRATEGY |
Notes to Consolidated Financial Statements
For tax purposes, net capital losses may be carried over to offset future capital gains, if any. Funds are permitted to carry forward capital losses incurred in taxable years beginning after December 22, 2010 for an indefinite period. These post-enactment capital losses must be utilized prior to the pre-enactment capital losses, which are subject to expiration. Post-enactment capital loss carryforwards will retain their character as either short-term or long-term capital losses rather than being considered short-term as under previous regulation. As of October 31, 2014, the Strategy had a net capital loss carryforward of $5,993,250 which will expire in 2019.
During the current fiscal year, permanent differences primarily due to the tax treatment of swaps and passive foreign investment companies (PFICs), reclassifications of foreign currency and foreign capital gains tax, the book/tax differences associated with the treatment of earnings from the Subsidiary, the tax treatment of Treasury inflation-protected securities, and contributions from the Adviser resulted in a net increase in undistributed net investment income, a net decrease in accumulated net realized loss on investment and foreign currency transactions, and a net decrease in additional paid-in capital. These reclassifications had no effect on net assets.
NOTE I
Subsequent Events
Management has evaluated subsequent events for possible recognition or disclosure in the financial statements through the date the financial statements are issued. Management has determined that there are no material events that would require disclosure in the Strategy’s financial statements through this date.
| ALLIANCEBERNSTEIN REAL ASSET STRATEGY • | 61 |
Notes to Consolidated Financial Statements
CONSOLIDATED FINANCIAL HIGHLIGHTS
Selected Data For A Share Of Capital Stock Outstanding Throughout Each Period
| Class A | ||||||||||||||||||||
| Year Ended October 31, | March 8, 2010(a) to October 31, | |||||||||||||||||||
| 2014 | 2013 | 2012 | 2011 | 2010 | ||||||||||||||||
|
| |||||||||||||||||||
Net asset value, beginning of period | $ 11.04 | $ 11.33 | $ 11.05 | $ 11.25 | $ 10.00 | |||||||||||||||
|
| |||||||||||||||||||
Income From Investment Operations | ||||||||||||||||||||
Net investment income(b)(c) | .12 | .10 | .11 | .16 | .04 | |||||||||||||||
Net realized and unrealized gain (loss) on investment and foreign currency transactions | (.50 | ) | (.13 | ) | .25 | (.01 | ) | 1.21 | ||||||||||||
Contributions from Adviser | .00 | (d) | .00 | – 0 | – | – 0 | – | .00 | (d) | |||||||||||
|
| |||||||||||||||||||
Net increase (decrease) in net asset value from operations | (.38 | ) | (.03 | ) | .36 | .15 | 1.25 | |||||||||||||
|
| |||||||||||||||||||
Less: Dividends | ||||||||||||||||||||
Dividends from net investment income | (.14 | ) | (.26 | ) | (.08 | ) | (.35 | ) | – 0 | – | ||||||||||
|
| |||||||||||||||||||
Net asset value, end of period | $ 10.52 | $ 11.04 | $ 11.33 | $ 11.05 | $ 11.25 | |||||||||||||||
|
| |||||||||||||||||||
Total Return | ||||||||||||||||||||
Total investment return based on net asset value(e) | (3.45 | ) % | (.27 | ) % | 3.36 | % | 1.32 | % | 12.50 | % | ||||||||||
Ratios/Supplemental Data | ||||||||||||||||||||
Net assets, end of period (000’s omitted) | $28,434 | $64,800 | $67,989 | $70,081 | $1,123 | |||||||||||||||
Ratio to average net | ||||||||||||||||||||
Expenses, net of waivers/reimbursements | 1.23 | % | 1.05 | % | 1.05 | % | 1.05 | % | 1.05 | %^+ | ||||||||||
Expenses, before waivers/reimbursements | 1.30 | % | 1.34 | % | 1.28 | % | 1.61 | % | 7.68 | %^+ | ||||||||||
Net investment income(c) | 1.03 | % | .86 | % | 1.02 | % | 1.44 | % | .80 | %^+ | ||||||||||
Portfolio turnover rate | 73 | % | 54 | % | 118 | % | 120 | % | 42 | % | ||||||||||
See footnote summary on page 70.
| 62 | • ALLIANCEBERNSTEIN REAL ASSET STRATEGY |
Consolidated Financial Highlights
Selected Data For A Share Of Capital Stock Outstanding Throughout Each Period
| Class C | ||||||||||||||||||||
| Year Ended October 31, | March 8, 2010(a) to October 31, | |||||||||||||||||||
| 2014 | 2013 | 2012 | 2011 | 2010 | ||||||||||||||||
|
| |||||||||||||||||||
Net asset value, beginning | $ 10.90 | $ 11.18 | $ 10.93 | $ 11.19 | $ 10.00 | |||||||||||||||
|
| |||||||||||||||||||
Income From Investment Operations | ||||||||||||||||||||
Net investment income(b)(c) | .04 | .02 | .03 | .08 | .04 | |||||||||||||||
Net realized and unrealized | (.49 | ) | (.12 | ) | .25 | (.01 | ) | 1.15 | ||||||||||||
Contributions from | .00 | (d) | .00 | – 0 | – | – 0 | – | .00 | (d) | |||||||||||
|
| |||||||||||||||||||
Net increase (decrease) in | (.45 | ) | (.10 | ) | .28 | .07 | 1.19 | |||||||||||||
|
| |||||||||||||||||||
Less: Dividends | ||||||||||||||||||||
Dividends from net | (.05 | ) | (.18 | ) | (.03 | ) | (.33 | ) | – 0 | – | ||||||||||
|
| |||||||||||||||||||
Net asset value, end of | $ 10.40 | $ 10.90 | $ 11.18 | $ 10.93 | $ 11.19 | |||||||||||||||
|
| |||||||||||||||||||
Total Return | ||||||||||||||||||||
Total investment return | (4.13 | )% | (.92 | )% | 2.58 | % | .61 | % | 11.90 | % | ||||||||||
Ratios/Supplemental | ||||||||||||||||||||
Net assets, end of period (000’s omitted) | $8,531 | $13,063 | $15,974 | $17,414 | $280 | |||||||||||||||
Ratio to average net | ||||||||||||||||||||
Expenses, net of waivers/reimbursements | 1.93 | % | 1.75 | % | 1.75 | % | 1.75 | % | 1.75 | %^+ | ||||||||||
Expenses, before waivers/reimbursements | 2.02 | % | 2.04 | % | 1.99 | % | 2.31 | % | 11.21 | %^+ | ||||||||||
Net investment income(c) | .34 | % | .16 | % | .32 | % | .73 | % | .65 | %^+ | ||||||||||
Portfolio turnover rate | 73 | % | 54 | % | 118 | % | 120 | % | 42 | % | ||||||||||
See footnote summary on page 70.
| ALLIANCEBERNSTEIN REAL ASSET STRATEGY • | 63 |
Consolidated Financial Highlights
Selected Data For A Share Of Capital Stock Outstanding Throughout Each Period
| Advisor Class | ||||||||||||||||||||
| Year Ended October 31, | March 8, 2010(a) to October 31, | |||||||||||||||||||
| 2014 | 2013 | 2012 | 2011 | 2010 | ||||||||||||||||
|
| |||||||||||||||||||
Net asset value, beginning | $ 11.09 | $ 11.37 | $ 11.08 | $ 11.26 | $ 10.00 | |||||||||||||||
|
| |||||||||||||||||||
Income From Investment Operations | ||||||||||||||||||||
Net investment income(b)(c) | .15 | .13 | .15 | .19 | .08 | |||||||||||||||
Net realized and unrealized gain (loss) on investment and foreign currency transactions | (.50 | ) | (.12 | ) | .25 | (.01 | ) | 1.18 | ||||||||||||
Contributions from | .00 | (d) | .00 | – 0 | – | – 0 | – | .00 | (d) | |||||||||||
|
| |||||||||||||||||||
Net increase (decrease) in | (.35 | ) | .01 | .40 | .18 | 1.26 | ||||||||||||||
|
| |||||||||||||||||||
Less: Dividends | ||||||||||||||||||||
Dividends from net investment income | (.18 | ) | (.29 | ) | (.11 | ) | (.36 | ) | – 0 | – | ||||||||||
|
| |||||||||||||||||||
Net asset value, end of period | $ 10.56 | $ 11.09 | $ 11.37 | $ 11.08 | $ 11.26 | |||||||||||||||
|
| |||||||||||||||||||
Total Return | ||||||||||||||||||||
Total investment return | (3.20 | )% | .12 | % | 3.69 | % | 1.55 | % | 12.60 | % | ||||||||||
Ratios/Supplemental Data | ||||||||||||||||||||
Net assets, end of period | $58,399 | $64,911 | $72,529 | $50,795 | $963 | |||||||||||||||
Ratio to average net | ||||||||||||||||||||
Expenses, net of waivers/reimbursements | .94 | % | .75 | % | .75 | % | .75 | % | .75 | %^+ | ||||||||||
Expenses, before waivers/reimbursements | 1.02 | % | 1.04 | % | .99 | % | 1.29 | % | 8.89 | %^+ | ||||||||||
Net investment income(c) | 1.33 | % | 1.18 | % | 1.33 | % | 1.69 | % | 1.46 | %^+ | ||||||||||
Portfolio turnover rate | 73 | % | 54 | % | 118 | % | 120 | % | 42 | % | ||||||||||
See footnote summary on page 70.
| 64 | • ALLIANCEBERNSTEIN REAL ASSET STRATEGY |
Consolidated Financial Highlights
Selected Data For A Share Of Capital Stock Outstanding Throughout Each Period
| Class R | ||||||||||||||||||||
| Year Ended October 31, | March 8, 2010 | |||||||||||||||||||
| 2014 | 2013 | 2012 | 2011 | |||||||||||||||||
|
| |||||||||||||||||||
Net asset value, beginning of period | $ 11.04 | $ 11.32 | $ 11.02 | $ 11.23 | $ 10.00 | |||||||||||||||
|
| |||||||||||||||||||
Income From Investment Operations | ||||||||||||||||||||
Net investment income(b)(c) | .15 | .08 | .09 | .16 | .10 | |||||||||||||||
Net realized and unrealized gain (loss) on investment and foreign currency transactions | (.55 | ) | (.13 | ) | .26 | (.04 | ) | 1.13 | ||||||||||||
Contributions from Adviser | .00 | (d) | .00 | – 0 | – | – 0 | – | .00 | (d) | |||||||||||
|
| |||||||||||||||||||
Net increase (decrease) in net asset value from operations | (.40 | ) | (.05 | ) | .35 | .12 | 1.23 | |||||||||||||
|
| |||||||||||||||||||
Less: Dividends | ||||||||||||||||||||
Dividends from net investment income | (.13 | ) | (.23 | ) | (.05 | ) | (.33 | ) | – 0 | – | ||||||||||
|
| |||||||||||||||||||
Net asset value, end of period | $ 10.51 | $ 11.04 | $ 11.32 | $ 11.02 | $ 11.23 | |||||||||||||||
|
| |||||||||||||||||||
Total Return | ||||||||||||||||||||
Total investment return based on net asset value(e) | (3.66 | ) % | (.47 | ) % | 3.20 | % | 1.03 | % | 12.30 | % | ||||||||||
Ratios/Supplemental Data | ||||||||||||||||||||
Net assets, end of period (000’s omitted) | $182 | $38 | $17 | $11 | $11 | |||||||||||||||
Ratio to average net | ||||||||||||||||||||
Expenses, net of waivers/reimbursements | 1.44 | % | 1.25 | % | 1.25 | % | 1.25 | % | 1.25 | %^+ | ||||||||||
Expenses, before waivers/reimbursements | 1.55 | % | 1.65 | % | 1.64 | % | 2.87 | % | 8.66 | %^+ | ||||||||||
Net investment income(c) | 1.36 | % | .76 | % | .82 | % | 1.39 | % | 1.50 | %^+ | ||||||||||
Portfolio turnover rate | 73 | % | 54 | % | 118 | % | 120 | % | 42 | % | ||||||||||
See footnote summary on page 70.
| ALLIANCEBERNSTEIN REAL ASSET STRATEGY • | 65 |
Consolidated Financial Highlights
Selected Data For A Share Of Capital Stock Outstanding Throughout Each Period
| Class K | ||||||||||||||||||||
| Year Ended October 31, | March 8, 2010(a) to October 31, | |||||||||||||||||||
| 2014 | 2013 | 2012 | 2011 | 2010 | ||||||||||||||||
|
| |||||||||||||||||||
Net asset value, beginning of period | $ 11.03 | $ 11.32 | $ 11.05 | $ 11.25 | $ 10.00 | |||||||||||||||
|
| |||||||||||||||||||
Income From Investment Operations | ||||||||||||||||||||
Net investment income(b)(c) | .12 | .10 | .10 | .15 | .12 | |||||||||||||||
Net realized and unrealized gain (loss) on investment and foreign currency transactions | (.49 | ) | (.12 | ) | .27 | – 0 | – | 1.13 | ||||||||||||
Contributions from Adviser | .00 | (d) | .00 | – 0 | – | – 0 | – | .00 | (d) | |||||||||||
|
| |||||||||||||||||||
Net increase (decrease) in net asset value from operations | (.37 | ) | (.02 | ) | .37 | .15 | 1.25 | |||||||||||||
|
| |||||||||||||||||||
Less: Dividends | ||||||||||||||||||||
Dividends from net investment income | (.16 | ) | (.27 | ) | (.10 | ) | (.35 | ) | – 0 | – | ||||||||||
|
| |||||||||||||||||||
Net asset value, end of period | $ 10.50 | $ 11.03 | $ 11.32 | $ 11.05 | $ 11.25 | |||||||||||||||
|
| |||||||||||||||||||
Total Return | ||||||||||||||||||||
Total investment return based on net asset value(e) | (3.39 | )% | (.19 | )% | 3.43 | % | 1.33 | % | 12.50 | % | ||||||||||
Ratios/Supplemental Data | ||||||||||||||||||||
Net assets, end of period | $2,174 | $1,684 | $1,286 | $128 | $11 | |||||||||||||||
Ratio to average net | ||||||||||||||||||||
Expenses, net of waivers/reimbursements | 1.19 | % | 1.00 | % | 1.00 | % | 1.00 | % | 1.00 | %^+ | ||||||||||
Expenses, before waivers/reimbursements | 1.24 | % | 1.33 | % | 1.35 | % | 1.91 | % | 8.39 | %^+ | ||||||||||
Net investment income(c) | 1.10 | % | .95 | % | .89 | % | 1.38 | % | 1.76 | %^+ | ||||||||||
Portfolio turnover rate | 73 | % | 54 | % | 118 | % | 120 | % | 42 | % | ||||||||||
See footnote summary on page 70.
| 66 | • ALLIANCEBERNSTEIN REAL ASSET STRATEGY |
Consolidated Financial Highlights
Selected Data For A Share Of Capital Stock Outstanding Throughout Each Period
| Class I | ||||||||||||||||||||
| Year Ended October 31, | March 8, 2010(a) to October 31, | |||||||||||||||||||
| 2014 | 2013 | 2012 | 2011 | 2010 | ||||||||||||||||
|
| |||||||||||||||||||
Net asset value, beginning of period | $ 11.07 | $ 11.36 | $ 11.07 | $ 11.27 | $ 10.00 | |||||||||||||||
|
| |||||||||||||||||||
Income From Investment Operations | ||||||||||||||||||||
Net investment income(b)(c) | .15 | .13 | .14 | .15 | .13 | |||||||||||||||
Net realized and unrealized gain (loss) on investment and foreign currency transactions | (.49 | ) | (.13 | ) | .26 | .02† | 1.14 | |||||||||||||
Contributions from Adviser | .00 | (d) | .00 | – 0 | – | – 0 | – | .00 | (d) | |||||||||||
|
| |||||||||||||||||||
Net increase (decrease) in net asset value from operations | (.34 | ) | – 0 | – | .40 | .17 | 1.27 | |||||||||||||
|
| |||||||||||||||||||
Less: Dividends | ||||||||||||||||||||
Dividends from net investment income | (.19 | ) | (.29 | ) | (.11 | ) | (.37 | ) | – 0 | – | ||||||||||
|
| |||||||||||||||||||
Net asset value, end of period | $ 10.54 | $ 11.07 | $ 11.36 | $ 11.07 | $ 11.27 | |||||||||||||||
|
| |||||||||||||||||||
Total Return | ||||||||||||||||||||
Total investment return based on net asset value(e) | (3.09 | )% | .04 | % | 3.69 | % | 1.53 | % | 12.70 | % | ||||||||||
Ratios/Supplemental Data | ||||||||||||||||||||
Net assets, end of period (000’s omitted) | $21,341 | $19,303 | $18,790 | $15,850 | $11 | |||||||||||||||
Ratio to average net | ||||||||||||||||||||
Expenses, net of waivers/reimbursements | .91 | % | .75 | % | .75 | % | .75 | % | .75 | %^+ | ||||||||||
Expenses, before waivers/reimbursements | .91 | % | .97 | % | .98 | % | 1.38 | % | 8.11 | %^+ | ||||||||||
Net investment income(c) | 1.37 | % | 1.17 | % | 1.32 | % | 1.42 | % | 1.99 | %^+ | ||||||||||
Portfolio turnover rate | 73 | % | 54 | % | 118 | % | 120 | % | 42 | % | ||||||||||
See footnote summary on page 70.
| ALLIANCEBERNSTEIN REAL ASSET STRATEGY • | 67 |
Consolidated Financial Highlights
Selected Data For A Share Of Capital Stock Outstanding Throughout Each Period
| Class 1 | ||||||||||||||||||||
| Year Ended October 31, | March 8, 2010(a) to October 31, | |||||||||||||||||||
| 2014 | 2013 | 2012 | 2011 | 2010 | ||||||||||||||||
|
| |||||||||||||||||||
Net asset value, beginning of period | $11.00 | $11.29 | $11.01 | $11.25 | $10.00 | |||||||||||||||
|
| |||||||||||||||||||
Income From Investment Operations | ||||||||||||||||||||
Net investment income(b)(c) | .13 | .10 | .12 | .15 | .12 | |||||||||||||||
Net realized and unrealized gain (loss) on investment and foreign currency transactions | (.50 | ) | (.12 | ) | .25 | (.01 | ) | 1.13 | ||||||||||||
Contributions from Adviser | .00 | (d) | .00 | – 0 | – | – 0 | – | .00 | (d) | |||||||||||
|
| |||||||||||||||||||
Net increase (decrease) in net asset value from operations | (.37 | ) | (.02 | ) | .37 | .14 | 1.25 | |||||||||||||
|
| |||||||||||||||||||
Less: Dividends | ||||||||||||||||||||
Dividends from net investment income | (.17 | ) | (.27 | ) | (.09 | ) | (.38 | ) | – 0 | – | ||||||||||
|
| |||||||||||||||||||
Net asset value, end of period | $ 10.46 | $ 11.00 | $ 11.29 | $ 11.01 | $ 11.25 | |||||||||||||||
|
| |||||||||||||||||||
Total Return | ||||||||||||||||||||
Total investment return based on net asset value(e) | (3.35 | )% | (.19 | )% | 3.47 | % | 1.25 | % | 12.50 | % | ||||||||||
Ratios/Supplemental Data | ||||||||||||||||||||
Net assets, end of period (000’s omitted) | $513,633 | $420,593 | $221,971 | $182,720 | $11 | |||||||||||||||
Ratio to average net | ||||||||||||||||||||
Expenses, net of waivers/reimbursements | 1.14 | % | 1.00 | % | 1.00 | % | 1.00 | % | 1.00 | %^+ | ||||||||||
Expenses, before waivers/reimbursements | 1.14 | % | 1.16 | % | 1.21 | % | 1.47 | % | 8.39 | %^+ | ||||||||||
Net investment income(c) | 1.16 | % | .95 | % | 1.07 | % | 1.40 | % | 1.78 | %^+ | ||||||||||
Portfolio turnover rate | 73 | % | 54 | % | 118 | % | 120 | % | 42 | % | ||||||||||
See footnote summary on page 70.
| 68 | • ALLIANCEBERNSTEIN REAL ASSET STRATEGY |
Consolidated Financial Highlights
Selected Data For A Share Of Capital Stock Outstanding Throughout Each Period
| Class 2 | ||||||||||||||||||||
| Year Ended October 31, | March 8, 2010(a) to October 31, | |||||||||||||||||||
| 2014 | 2013 | 2012 | 2011 | 2010 | ||||||||||||||||
|
| |||||||||||||||||||
Net asset value, beginning of period | $ 11.19 | $ 11.48 | $ 11.07 | $ 11.27 | $ 10.00 | |||||||||||||||
|
| |||||||||||||||||||
Income From Investment Operations | ||||||||||||||||||||
Net investment income(b)(c) | .15 | .13 | .15 | .14 | .13 | |||||||||||||||
Net realized and unrealized gain (loss) on investment and foreign currency transactions | (.50 | ) | (.12 | ) | .26 | .03† | 1.14 | |||||||||||||
Contributions from Adviser | .00 | (d) | .00 | – 0 | – | – 0 | – | .00 | (d) | |||||||||||
|
| |||||||||||||||||||
Net increase (decrease) in net asset value from operations | (.35 | ) | .01 | .41 | .17 | 1.27 | ||||||||||||||
|
| |||||||||||||||||||
Less: Dividends | ||||||||||||||||||||
Dividends from net investment income | (.16 | ) | (.30 | ) | – 0 | – | (.37 | ) | – 0 | – | ||||||||||
|
| |||||||||||||||||||
Net asset value, end of period | $ 10.68 | $ 11.19 | $ 11.48 | $ 11.07 | $ 11.27 | |||||||||||||||
|
| |||||||||||||||||||
Total Return | ||||||||||||||||||||
Total investment return based on net asset value(e) | (3.12 | )% | .05 | % | 3.70 | % | 1.50 | % | 12.70 | % | ||||||||||
Ratios/Supplemental Data | ||||||||||||||||||||
Net assets, end of period (000’s omitted) | $11 | $11 | $11 | $11 | $11,187 | |||||||||||||||
Ratio to average net | ||||||||||||||||||||
Expenses, net of waivers | .89 | % | .75 | % | .75 | % | .75 | % | .75 | %^+ | ||||||||||
Expenses, before waivers | .89 | % | 1.93 | % | .96 | % | 3.72 | % | 8.14 | %^+ | ||||||||||
Net investment income(c) | 1.36 | % | 1.16 | % | 1.32 | % | 1.19 | % | 2.01 | %^+ | ||||||||||
Portfolio turnover rate | 73 | % | 54 | % | 118 | % | 120 | % | 42 | % | ||||||||||
See footnote summary on page 70.
| ALLIANCEBERNSTEIN REAL ASSET STRATEGY • | 69 |
Consolidated Financial Highlights
Selected Data For A Share Of Capital Stock Outstanding Throughout Each Period
| Class Z | ||||
| January 31, 2014(f) to October 31, 2014 | ||||
|
| |||
Net asset value, beginning of period | $ 10.53 | |||
|
| |||
Income From Investment Operations | ||||
Net investment income(b)(c) | .13 | |||
Net realized and unrealized loss on investment and foreign currency transactions | (.11 | ) | ||
Contributions from Adviser | .00 | (d) | ||
|
| |||
Net increase in net asset value from operations | .02 | |||
|
| |||
Net asset value, end of period | $ 10.55 | |||
|
| |||
Total Return | ||||
Total investment return based on net asset value(e) | .19 | % | ||
Ratios/Supplemental Data | ||||
Net assets, end of period (000”s omitted) | $10 | |||
Ratio to average net assets of: | ||||
Expenses, net of waivers^ | .88 | % | ||
Expenses, before waivers^ | .88 | % | ||
Net investment income(c)^ | 1.59 | % | ||
Portfolio turnover rate | 73 | % | ||
| (a) | Commencement of operations. |
| (b) | Based on average shares outstanding. |
| (c) | Net of fees and expenses waived/reimbursed by the Adviser. |
| (d) | Amount is less than $.005. |
| (e) | Total investment return is calculated assuming an initial investment made at the net asset value at the beginning of the period, reinvestment of all dividends and distributions at net asset value during the period, and redemption on the last day of the period. Initial sales charges or contingent deferred sales charges are not reflected in the calculation of total investment return. Total return does not reflect the deduction of taxes that a shareholder would pay on strategy distributions or the redemption of strategy shares. Total investment return calculated for a period of less than one year is not annualized. |
| (f) | Commencement of distribution. |
| ^ | Annualized. |
| + | The ratio includes expenses attributable to costs of proxy solicitation. |
| † | Due to timing of sales and repurchase of capital shares, the net realized and unrealized gain (loss) per share is not in accord with the Strategy’s change in net realized and unrealized gain (loss) on investment transactions for the period. |
See notes to consolidated financial statements.
| 70 | • ALLIANCEBERNSTEIN REAL ASSET STRATEGY |
Consolidated Financial Highlights
REPORT OF INDEPENDENT REGISTERED
PUBLIC ACCOUNTING FIRM
To the Board of Directors of AllianceBernstein Bond Fund, Inc. and Shareholders of the AllianceBernstein Real Asset Strategy Portfolio
We have audited the accompanying consolidated statement of assets and liabilities, including the consolidated portfolio of investments, of AllianceBernstein Real Asset Strategy Portfolio (one of the portfolios constituting AllianceBernstein Bond Fund, Inc. (the “Fund”)), as of October 31, 2014, and the related consolidated statement of operations for the year then ended, the consolidated statements of changes in net assets for each of the two years in the period then ended and the consolidated financial highlights for each of the periods indicated therein. These financial statements and financial highlights are the responsibility of the Fund’s management. Our responsibility is to express an opinion on these financial statements and financial highlights based on our audits.
We conducted our audits in accordance with the standards of the Public Company Accounting Oversight Board (United States). Those standards require that we plan and perform the audit to obtain reasonable assurance about whether the financial statements and financial highlights are free of material misstatement. We were not engaged to perform an audit of the Fund’s internal control over financial reporting. Our audit included consideration of internal control over financial reporting as a basis for designing audit procedures that are appropriate in the circumstances, but not for the purpose of expressing an opinion on the effectiveness of the Fund’s internal control over financial reporting. Accordingly, we express no such opinion. An audit also includes examining, on a test basis, evidence supporting the amounts and disclosures in the financial statements and financial highlights, assessing the accounting principles used and significant estimates made by management, and evaluating the overall financial statement presentation. Our procedures included confirmation of securities owned as of October 31, 2014, by correspondence with the custodian and others or by other appropriate auditing procedures where replies from others were not received. We believe that our audits provide a reasonable basis for our opinion.
In our opinion, the financial statements and financial highlights referred to above present fairly, in all material respects, the consolidated financial position of AllianceBernstein Real Asset Strategy Portfolio (one of the portfolios constituting the AllianceBernstein Bond Fund, Inc.) at October 31, 2014, the consolidated results of its operations for the year then ended, the consolidated changes in its net assets for each of the two years in the period then ended and the consolidated financial highlights for each of the periods indicated therein, in conformity with U.S. generally accepted accounting principles.

New York, New York
December 26, 2014
| ALLIANCEBERNSTEIN REAL ASSET STRATEGY • | 71 |
Report of Independent Registered Public Accounting Firm
2014 FEDERAL TAX INFORMATION
(unaudited)
For Federal income tax purposes, the following information is furnished with respect to the distributions paid by the Strategy during the taxable year ended October 31, 2014. For corporate shareholders, 16.00% of dividends paid qualify for the dividends received deduction. For foreign shareholders, 1.18% of ordinary income dividends paid may be considered to be qualifying to be taxed as interest-related dividends.
For the taxable year ended October 31, 2014, the Strategy designates $7,804,348 as the maximum amount that may be considered qualified dividend income for individual shareholders.
Shareholders should not use the above information to prepare their income tax returns. The information necessary to complete your income tax returns will be included with your Form 1099-DIV which will be sent to you separately in January 2015.
| 72 | • ALLIANCEBERNSTEIN REAL ASSET STRATEGY |
BOARD OF DIRECTORS
Marshall C. Turner, Jr.(1), Chairman John H. Dobkin(1) Michael J. Downey(1) William H. Foulk, Jr.(1) D. James Guzy(1) | Nancy P. Jacklin(1) Robert M. Keith, President and Chief Executive Officer Garry L. Moody(1) Earl D. Weiner(1) |
OFFICERS
Philip L. Kirstein, Senior Vice President and Independent Compliance Officer Jonathan E. Ruff(2), Vice President Emilie D. Wrapp, Secretary | Joseph J. Mantineo, Treasurer and Chief Financial Officer Phyllis J. Clarke, Controller Vincent S. Noto, Chief Compliance Officer |
Custodian and Accounting Agent State Street Bank and Trust Company State Street Corporation CCB/5 1 Iron Street Boston, MA 02210
Principal Underwriter AllianceBernstein Investments, Inc. 1345 Avenue of the Americas New York, NY 10105
Transfer Agent AllianceBernstein Investor Services, Inc. P.O. Box 786003 San Antonio, TX 78278-6003 Toll-Free (800) 221-5672 | Independent Registered Public Ernst & Young LLP 5 Times Square New York, NY 10036
Legal Counsel Seward & Kissel LLP One Battery Park Plaza New York, NY 10004 |
| (1) | Member of the Audit Committee, the Governance and Nominating Committee, and the Independent Directors Committee. |
| (2) | The day-to-day management of, and investment decisions for, the Strategy’s portfolio are made by the Adviser’s Real Asset Strategy Team. Mr. Jonathan E. Ruff is the investment professional with the most significant responsibility for the day-to-day management of the Strategy’s portfolio. |
| ALLIANCEBERNSTEIN REAL ASSET STRATEGY • | 73 |
Board of Directors
MANAGEMENT OF THE FUND
Board of Directors Information
The business and affairs of the Strategy are managed under the direction of the Board of Directors. Certain information concerning the Strategy’s Directors is set forth below.
| NAME, ADDRESS*, AGE, (YEAR FIRST ELECTED**) | PRINCIPAL OCCUPATION(S) DURING PAST FIVE YEARS AND OTHER RELEVANT QUALIFICATIONS*** | PORTFOLIOS IN FUND COMPLEX OVERSEEN BY DIRECTOR | OTHER IN THE PAST FIVE YEARS | |||||
| INTERESTED DIRECTOR | ||||||||
Robert M. Keith, + 1345 Avenue of the Americas New York, NY 10105 54 (2010) | Senior Vice President of AllianceBernstein L.P. (the “Adviser”) and the head of AllianceBernstein Investments, Inc. (“ABI”) since July 2008; Director of ABI and President of the AllianceBernstein Mutual Funds. Previously, he served as Executive Managing Director of ABI from December 2006 to June 2008. Prior to joining ABI in 2006, Executive Managing Director of Bernstein Global Wealth Management, and prior thereto, Senior Managing Director and Global Head of Client Service and Sales of the Adviser’s institutional investment management business since 2004. Prior thereto, he was Managing Director and Head of North American Client Service and Sales in the Adviser’s institutional investment management business, with which he had been associated since prior to 2004. | 117 | None | |||||
| 74 | • ALLIANCEBERNSTEIN REAL ASSET STRATEGY |
Management of the Fund
| NAME, ADDRESS*, AGE, (YEAR FIRST ELECTED**) | PRINCIPAL OCCUPATION(S) DURING PAST FIVE YEARS AND OTHER RELEVANT QUALIFICATIONS*** | PORTFOLIOS IN FUND COMPLEX OVERSEEN BY DIRECTOR | OTHER IN THE PAST FIVE YEARS | |||||
| DISINTERESTED DIRECTORS | ||||||||
Marshall C. Turner, Jr., ++ Chairman of the Board 73 (2005) | Private Investor since prior to 2009. Former CEO of Dupont Photomasks, Inc. (components of semi-conductor manufacturing), 2003-2006, and interim CEO 1999-2000. He has extensive operating and early-stage investment experience, including prior service as general partner of three institutional venture capital partnerships, and serves on the boards of three education and science-related non-profit organizations. He has served as a director of one AllianceBernstein fund since 1992, and director or trustee of multiple AllianceBernstein funds since 2005. He has been Chairman of the AllianceBernstein Funds since January 2014, and the Chairman of the Independent Directors Committees of such Funds since February 2014. | 117 | Xilinx, Inc. (programmable logic semi-conductors) and SunEdison, Inc. (semi-conductor substrates, solar materials and solar power plants) since prior to 2009 until July 2014 | |||||
John H. Dobkin, ++ 72 (1998) | Independent Consultant since prior to 2009. Formerly, President of Save Venice, Inc. (preservation organization) from 2001–2002; Senior Advisor from June 1999-June 2000 and President of Historic Hudson Valley (historic preservation) from December 1989-May 1999. Previously, Director of the National Academy of Design. He has served as a director or trustee of various AllianceBernstein Funds since 1992, and as Chairman of the Audit Committees of a number of such Funds from 2001-2008. | 117 | None | |||||
| ALLIANCEBERNSTEIN REAL ASSET STRATEGY • | 75 |
Management of the Fund
| NAME, ADDRESS*, AGE, (YEAR FIRST ELECTED**) | PRINCIPAL OCCUPATION(S) DURING PAST FIVE YEARS AND OTHER RELEVANT QUALIFICATIONS*** | PORTFOLIOS IN FUND COMPLEX OVERSEEN BY DIRECTOR | OTHER IN THE PAST FIVE YEARS | |||||
| DISINTERESTED DIRECTORS (continued) | ||||||||
Michael J. Downey, ++ 70 (2005) | Private Investor since prior to 2009. Formerly, managing partner of Lexington Capital, LLC (investment advisory firm) from December 1997 until December 2003. From 1987 until 1993, Chairman and CEO of Prudential Mutual Fund Management, director of the Prudential mutual funds, and member of the Executive Committee of Prudential Securities Inc. He has served as a director or trustee of the AllianceBernstein Funds since 2005 and is a director and Chairman of one other registered investment company. | 117 | Asia Pacific Fund, Inc. (registered investment company) since prior to 2009, Prospect Acquisition Corp. (financial services) from 2007 until 2009, and The Merger Fund (registered investment company) since prior to 2009 until 2013 | |||||
William H. Foulk, Jr., ++ 82 (1998) | Investment Adviser and an Independent Consultant since prior to 2009. Previously, he was Senior Manager of Barrett Associates, Inc., a registered investment adviser. He was formerly Deputy Comptroller and Chief Investment Officer of the State of New York and, prior thereto, Chief Investment Officer of the New York Bank for Savings. He has served as a director or trustee of various AllianceBernstein Funds since 1983, and was Chairman of the Independent Directors Committees of the AllianceBernstein Funds from 2003 until early February 2014. He served as Chairman of such Funds from 2003 through December 2013. He is also active in a number of mutual fund related organizations and committees. | 117 | None | |||||
| 76 | • ALLIANCEBERNSTEIN REAL ASSET STRATEGY |
Management of the Fund
| NAME, ADDRESS*, AGE, (YEAR FIRST ELECTED**) | PRINCIPAL OCCUPATION(S) DURING PAST FIVE YEARS AND OTHER RELEVANT QUALIFICATIONS*** | PORTFOLIOS IN FUND COMPLEX OVERSEEN BY DIRECTOR | OTHER IN THE PAST FIVE YEARS | |||||
| DISINTERESTED DIRECTORS (continued) | ||||||||
D. James Guzy, ++ 78 (2005) | Chairman of the Board of SRC Computers, Inc. (semi-conductors), with which he has been associated since prior to 2009. He served as Chairman of the Board of PLX Technology (semi-conductors) since prior to 2009 until November 2013. He was a director of Intel Corporation (semi-conductors) from 1969 until 2008, and served as Chairman of the Finance Committee of such company for several years until May 2008. He has served as a director or trustee of one or more of the AllianceBernstein Funds since 1982. | 117 | PLX Technology (semi-conductors) since prior to 2009 until November 2013, and Cirrus Logic Corporation (semi-conductors) since prior to 2009 until July 2011 | |||||
Nancy P. Jacklin, ++ 66 (2006) | Professorial Lecturer at the Johns Hopkins School of Advanced International Studies since 2008. Formerly, U.S. Executive Director of the International Monetary Fund (which is responsible for ensuring the stability of the international monetary system), (December 2002-May 2006); Partner, Clifford Chance (1992-2002); Sector Counsel, International Banking and Finance, and Associate General Counsel, Citicorp (1985-1992); Assistant General Counsel (International), Federal Reserve Board of Governors (1982-1985); and Attorney Advisor, U.S. Department of the Treasury (1973-1982). Member of the Bar of the District of Columbia and of New York; and member of the Council on Foreign Relations. She has served as a director or trustee of the AllianceBernstein Funds since 2006 and has been Chairman of the Governance and Nominating Committees of the Funds since August 2014. | 117 | None | |||||
| ALLIANCEBERNSTEIN REAL ASSET STRATEGY • | 77 |
Management of the Fund
| NAME, ADDRESS*, AGE, (YEAR FIRST ELECTED**) | PRINCIPAL OCCUPATION(S) DURING PAST FIVE YEARS AND OTHER RELEVANT QUALIFICATIONS*** | PORTFOLIOS IN FUND COMPLEX OVERSEEN BY DIRECTOR | OTHER IN THE PAST FIVE YEARS | |||||
| DISINTERESTED DIRECTORS (continued) | ||||||||
Garry L. Moody, ++ 62 (2008) | Independent Consultant. Formerly, Partner, Deloitte & Touche LLP (1995-2008) where he held a number of senior positions, including Vice Chairman, and U.S. and Global Investment Management Practice Managing Partner; President, Fidelity Accounting and Custody Services Company (1993-1995); and Partner, Ernst & Young LLP (1975-1993), where he served as the National Director of Mutual Fund Tax Services and Managing Partner of its Chicago Office Tax department. He is a member of both the Governing Council of the Independent Directors Council (IDC), an organization of independent directors of mutual funds, and the Trustee Advisory Board of BoardIQ, a biweekly publication focused on issues and news affecting directors of mutual funds. He has served as a director or trustee, and as Chairman of the Audit Committees, of the AllianceBernstein Funds since 2008. | 117 | None | |||||
Earl D. Weiner, ++ 75 (2007) | Of Counsel, and Partner prior to January 2007, of the law firm Sullivan & Cromwell LLP and is a former member of the ABA Federal Regulation of Securities Committee Task Force to draft editions of the Fund Director’s Guidebook. He also serves as a director or trustee of various non-profit organizations and has served as Chairman or Vice Chairman of a number of them. He has served as a director or trustee of the AllianceBernstein Funds since 2007 and served as Chairman of the Governance and Nominating Committees of the AllianceBernstein Funds from 2007 until August 2014. | 117 | None | |||||
| 78 | • ALLIANCEBERNSTEIN REAL ASSET STRATEGY |
Management of the Fund
| * | The address for each of the Strategy’s disinterested Directors is c/o AllianceBernstein L.P., Attention: Philip L. Kirstein, 1345 Avenue of the Americas, New York, NY 10105. |
| ** | There is no stated term of office for the Strategy’s Directors. |
| *** | The information above includes each Director’s principal occupation during the last five years and other information relating to the experience, attributes and skills relevant to each Director’s qualifications to serve as a Director, which led to the conclusion that each Director should serve as a Director for the Strategy. |
| + | Mr. Keith is an “interested person” of the Strategy as defined in the “40 Act”, due to his position as a Senior Vice President of the Adviser. |
| ++ | Member of the Audit Committee, the Governance and Nominating Committee and the Independent Directors Committee. |
| ALLIANCEBERNSTEIN REAL ASSET STRATEGY • | 79 |
Management of the Fund
Officer Information
Certain information concerning the Strategy’s Officers is listed below.
| NAME, ADDRESS* AND AGE | PRINCIPAL POSITION(S) HELD WITH FUND | PRINCIPAL OCCUPATION DURING PAST 5 YEARS | ||
Robert M. Keith 54 | President and Chief Executive Officer | See biography above. | ||
Philip L. Kirstein 69 | Senior Vice President and Independent Compliance Officer | Senior Vice President and Independent Compliance Officer of the AllianceBernstein Funds, with which he has been associated since October 2004. Prior thereto, he was Of Counsel to Kirkpatrick & Lockhart, LLP from October 2003 to October 2004, and General Counsel of Merrill Lynch Investment Managers, L.P. since prior to March 2003. | ||
Jonathan E. Ruff 44 | Vice President | Senior Vice President of the Adviser,** with which he has been associated since prior to 2009. | ||
Emilie D. Wrapp 58 | Secretary | Senior Vice President, Assistant General Counsel and Assistant Secretary of ABI,** with which she has been associated since prior to 2009. | ||
Joseph J. Mantineo 55 | Treasurer and Chief Financial Officer | Senior Vice President of AllianceBernstein Investor Services, Inc, (“ABIS”),** with which he has been associated since prior to 2009. | ||
Phyllis J. Clarke 53 | Controller | Vice President of ABIS,** with which she has been associated since prior to 2009. | ||
Vincent S. Noto 50 | Chief Compliance Officer | Vice President and Mutual Fund Chief Compliance Officer of the Adviser** since 2014. Prior thereto, he was Vice President and Director of Mutual Fund Compliance of the Adviser** since 2009. |
| * | The address for each of the Fund’s Officers is 1345 Avenue of the Americas, New York, NY 10105. |
| ** | The Adviser, ABI and ABIS are affiliates of the Strategy. |
| The Fund’s Statement of Additional Information (“SAI”) has additional information about the Strategy’s Directors and Officers and is available without charge upon request. Contact your financial representative or AllianceBernstein at 1-800-227-4618, or visit www.alliancebernstein.com, for a free prospectus or SAI. |
| 80 | • ALLIANCEBERNSTEIN REAL ASSET STRATEGY |
Management of the Fund
THE FOLLOWING IS NOT PART OF THE SHAREHOLDER REPORT OR THE FINANCIAL STATEMENTS
SUMMARY OF SENIOR OFFICER’S EVALUATION OF INVESTMENT ADVISORY AGREEMENT1
The following is a summary of the evaluation of the Investment Advisory Agreement between AllianceBernstein L.P. (the “Adviser”) and AllianceBernstein Bond Fund, Inc. (the “Fund”), in respect of AllianceBernstein Real Asset Strategy (the “Strategy”).2 The evaluation of the Investment Advisory Agreement was prepared by Philip L. Kirstein, the Senior Officer of the Fund, for the Directors of the Fund, as required by the August 2004 agreement between the Adviser and the New York State Attorney General (the “NYAG”). The Senior Officer’s evaluation of the Investment Advisory Agreement is not meant to diminish the responsibility or authority of the Board of Directors of the Fund to perform its duties pursuant to Section 15 of the Investment Company Act of 1940 (the “40 Act”) and applicable state law. The purpose of this summary is to provide shareholders with a synopsis of the independent evaluation of the reasonableness of the advisory fees proposed to be paid by the Strategy which was provided to the Directors in connection with their review of the proposed continuance of the Investment Advisory Agreement. The Senior Officer’s evaluation considered the following factors:
| 1. | Advisory fees charged to institutional and other clients of the Adviser for like services; |
| 2. | Advisory fees charged by other mutual fund companies for like services; |
| 3. | Costs to the Adviser and its affiliates of supplying services pursuant to the advisory agreement, excluding any intra-corporate profit; |
| 4. | Profit margins of the Adviser and its affiliates from supplying such services; |
| 5. | Possible economies of scale as the Strategy grows larger; and |
| 6. | Nature and quality of the Adviser’s services including the performance of the Strategy. |
These factors, with the exception of the first factor, are generally referred to as the “Gartenberg factors,” which were articulated by the United States Court of Appeals for the Second Circuit in 1982. Gartenberg v. Merrill Lynch Asset Management, Inc., 694 F. 2d 923 (2d Cir. 1982). On March 30, 2010, the Supreme Court held the Gartenberg decision was correct in its basic formulation
| 1 | The Senior Officer’s fee evaluation was completed on October 23, 2014 and discussed with the Board of Directors on November 4-6, 2014. |
| 2 | Future references to the Fund or the Strategy do not include “AllianceBernstein.” |
| ALLIANCEBERNSTEIN REAL ASSET STRATEGY • | 81 |
of what Section 36(b) requires: to face liability under Section 36(b), “an investment adviser must charge a fee that is so disproportionately large that it bears no reasonable relationship to the services rendered and could not have been the product of arm’s length bargaining.” Jones v. Harris Associates L.P., 130 S. Ct. 1418 (2010). In Jones, the Court stated the Gartenberg approach fully incorporates the correct understanding of fiduciary duty within the context of Section 36(b) and noted with approval that “Gartenberg insists that all relevant circumstances be taken into account” and “uses the range of fees that might result from arm’s length bargaining as the benchmark for reviewing challenged fees.“3
INVESTMENT ADVISORY FEES, NET ASSETS & EXPENSE RATIOS
The Adviser proposed that the Strategy pay the advisory fee set forth below for receiving the services to be provided pursuant to the Investment Advisory Agreement.
| Strategy | Net Assets 9/30/14 ($MM) | Advisory Fee Schedule Based on the Average Daily Net Assets of the Portfolio | ||||
| Real Asset Strategy | $ | 639.1 | 0.75% (flat fee) | |||
The Adviser is reimbursed as specified in the Investment Advisory Agreement for certain clerical, legal, accounting, administrative and other services provided to the Strategy. During the Strategy’s fiscal year ended October 31, 2013, the Adviser received $52,467 (0.011% of the Strategy’s average daily net assets) for such services.
The Adviser agreed to waive that portion of its advisory fees and/or reimburse the Strategy for that portion of the Strategy’s total operating expenses to the degree necessary to limit the Strategy’s expense ratios to the amounts set forth below for the Strategy’s current fiscal year. The waiver is terminable by the
| 3 | Jones v. Harris at 1427. |
| 82 | • ALLIANCEBERNSTEIN REAL ASSET STRATEGY |
Adviser upon at least 60 days’ notice prior to the Strategy’s prospectus update. In addition, set forth below are the Strategy’s gross expense ratios for the most recent semi-annual period:4
| Strategy | Expense Cap Pursuant to Expense Limitation Undertaking | Gross Expense Ratio5 | Fiscal Year End | |||||||||
| Real Asset Strategy6,7,8 | Advisor | 1.00 | % | 0.99 | % | October 31 | ||||||
| Class A | 1.30 | % | 1.29 | % | (ratio as of April 30, 2014) | |||||||
| Class C | 2.00 | % | 1.99 | % | ||||||||
| Class R | 1.50 | % | 1.63 | % | ||||||||
| Class K | 1.25 | % | 1.30 | % | ||||||||
| Class I | 1.00 | % | 0.91 | % | ||||||||
| Class Z9 | 1.00 | % | 0.84 | % | ||||||||
| Class 1 | 1.25 | % | 0.89 | % | ||||||||
| Class 2 | 1.00 | % | 0.89 | % | ||||||||
| I. | ADVISORY FEES CHARGED TO INSTITUTIONAL AND OTHER CLIENTS |
The advisory fees charged to investment companies which the Adviser manages and sponsors are normally higher than those charged to similar sized institutional accounts, including pension plans and sub-advised investment companies. The fee differential reflects, among other things, different services provided to such clients, and different liabilities assumed. Services provided by the Adviser to the Strategy that are not provided to non-investment company clients include providing office space and personnel to serve as Fund Officers, who among other responsibilities make the certifications required under the Sarbanes–Oxley Act of 2002, and coordinating with and monitoring the Strategy’s third party service providers such as Fund counsel, auditors, custodians, transfer agents and pricing services. The accounting, administrative, legal and compliance requirements for the Strategy are more costly than those for institutional client assets due to the greater complexities and time required for investment companies, although as previously noted, the Adviser is entitled to be reimbursed for providing such services. Also, retail mutual funds managed by the Adviser are widely held and accordingly, servicing the Strategy’s investors is more time consuming and labor
| 4 | Semi-annual total expense ratios are unaudited. |
| 5 | Annualized. |
| 6 | Prior to February 1, 2014, the Adviser had agreed to waive its fees and bear certain expenses to the extent necessary to limit total operating expenses on an annual basis. |
| 7 | The Strategy’s net expense ratios for the most recent semi-annual period (four month period for Class Z shares) are 0.87%, 1.17%, 1.87%, 1.37%, 1.12%, 0.88%, 0.84%, 1.13%, 0.89% for Advisor Class, Class A, Class C, Class R, Class K, Class I, Class Z, Class 1 and Class 2 shares, respectively. |
| 8 | The Strategy’s current fiscal percentage of net assets allocated to ETFs is 0.30%. The Strategy’s acquired funds expense ratio related to such ETF holdings is 0.001%. |
| 9 | The Strategy’s expense ratio for Class Z shares is for the period since inception of the share class, January 1, 2014 through April 30, 2014. |
| ALLIANCEBERNSTEIN REAL ASSET STRATEGY • | 83 |
intensive compared to servicing institutional clients since the Adviser needs to communicate with a more extensive network of financial intermediaries and shareholders. The Adviser also believes that it incurs substantial entrepreneurial risk when offering a new mutual fund since establishing a new mutual fund requires a large upfront investment and it may take a long time for the fund to achieve profitability since the fund must be priced to scale from inception in order to be competitive and assets are acquired one account at a time. In addition, managing the cash flow of an investment company may be more difficult than that of a stable pool of assets, such as an institutional account with little cash movement in either direction, particularly if the Strategy is in net redemption and the Adviser is frequently forced to sell securities to raise cash for redemptions. However, managing a fund with positive cash flow may be easier at times than managing a stable pool of assets. Finally, in recent years, investment advisers have been sued by institutional clients and have suffered reputational damage both by the attendant publicity and outcomes other than complete victories. Accordingly, the legal and reputational risks associated with institutional accounts are greater than previously thought, although arguably still not equal to those related to the mutual fund industry.
Notwithstanding the Adviser’s view that managing an investment company is not comparable to managing other institutional accounts because the services provided are different, the Supreme Court has indicated consideration should be given to the advisory fees charged to institutional accounts with a similar investment style as the Strategy.10 In addition to the AllianceBernstein Institutional fee schedule, set forth below is what would have been the effective advisory fee for the Strategy had the AllianceBernstein Institutional fee schedule been applicable to the Strategy versus the Strategy’s advisory fees based on September 30, 2014 net assets:11
| Strategy | Net Assets 09/30/14 ($MM) | AllianceBernstein (“AB”) Institutional (“Inst.”) Fee Schedule | Effective AB Inst. Adv. Fee | Strategy Advisory Fee | ||||||||
| Real Asset Strategy | $639.1 | Real Asset Strategy Schedule 0.75% on 1st $150 million 0.60% on next $150 million 0.50% on the balance Minimum acct size: $150 million | 0.582% | 0.750% | ||||||||
| 10 | The Supreme Court stated that “courts may give such comparisons the weight that they merit in light of the similarities and differences between the services that the clients in question require, but the courts must be wary of inapt comparisons.” Among the significant differences the Supreme Court noted that may exist between services provided to mutual funds and institutional accounts are “higher marketing costs.” Jones v. Harris at 1428. |
| 11 | The Adviser has indicated that with respect to institutional accounts with assets greater than $300 million, it will negotiate a fee schedule. Discounts that are negotiated vary based upon each client relationship. |
| 84 | • ALLIANCEBERNSTEIN REAL ASSET STRATEGY |
The Adviser also manages and sponsors retail mutual funds, which are organized in jurisdictions outside the United States, generally Luxembourg and Japan, and sold to non-United States resident investors. The Adviser charges the following fees for Real Asset Portfolio, a Luxembourg fund that has a somewhat similar investment style as the Strategy:
| Strategy | Luxembourg Fund | Fee12 | ||
| Real Asset Strategy | Real Asset Portfolio | |||
| Class A | 1.55% | |||
| Class I (Institutional) | 0.75% |
The Adviser provides sub-advisory investment services to certain other investment companies managed by other fund families. The Adviser charges the following fee for the sub-advisory relationship that has a somewhat similar investment style as the Strategy. Also shown are the Strategy’s advisory fee and what would have been the effective advisory fee of the Strategy had the fee schedule of the sub-advisory relationship been applicable to the Strategy based on September 30, 2014 net assets:
| Strategy | Sub-advised Fund | Sub-advised Fund Fee Schedule | Sub-Advised Management Fund Effective Fee | Strategy Advisory Fee | ||||||||
| Real Asset Strategy | Client #1 | 0.35% on first $250 million 0.25% on first $250 million 0.23% thereafter | 0.285% | 0.750% | ||||||||
It is fair to note that the services the Adviser provides pursuant to sub-advisory agreements are generally confined to the services related to the investment process; in other words, they are not as comprehensive as the services provided to the Strategy by the Adviser.
While it appears that the sub-advisory relationship is paying a lower fee than the Strategy, it is difficult to evaluate the relevance of such fees due to the differences in the services provided, risks involved and other competitive factors between the Strategy and the sub-advisory relationship. There could be various business reasons why an investment adviser would be willing to provide a sub-advised relationship investment related services at a different fee level than an investment company it is sponsoring where the investment adviser is provided all the services, not just investment management service generally required by a registered investment company.
| 12 | Class A shares of the fund are charged an “all-in” fee, which includes investment advisory services and distribution related services, while Class I shares, whose fee is for investment advisory services only. |
| ALLIANCEBERNSTEIN REAL ASSET STRATEGY • | 85 |
| II. | MANAGEMENT FEES CHARGED BY OTHER MUTUAL FUND COMPANIES FOR LIKE SERVICES. |
Lipper, Inc. (“Lipper”), an analytical service that is not affiliated with the Adviser, compared the fees charged to the Strategy with fees charged to other investment companies for similar services offered by other investment advisers.13 Lipper’s analysis included the comparison of the Strategy’s contractual management fee, estimated at the approximate current asset level of the Strategy, to the median of the Strategy’s Lipper Expense Group (“EG”)14 and the Strategy’s contractual management fee ranking.15
Lipper describes an EG as a representative sample of comparable funds. Lipper’s standard methodology for screening funds to be included in an EG entails the consideration of several fund criteria, including fund type, investment classification/objective, load type and similar 12b-1/non-12b-1 service fees, asset (size) comparability, expense components and attributes. An EG will typically consist of seven to twenty funds.
| Strategy | Contractual Management Fee (%) | Lipper Expense Median (%) | Rank | |||||||||
| Real Asset Strategy | 0.750 | 0.877 | 4/16 | |||||||||
| 13 | The Supreme Court cautioned against accepting mutual fund fee comparisons without careful scrutiny since “these comparisons are problematic because these fees, like those challenged, may not be the product of negotiations conducted at arm’s length.” Jones v. Harris at 1429. |
| 14 | Lipper does not consider average account size when constructing EGs. Funds with relatively small average account sizes tend to have higher transfer agent expense ratios than comparable sized funds that have relatively large average account sizes. There are limitations to Lipper expense category data because different funds categorize expenses differently. |
| 15 | The contractual management fee is calculated by Lipper using the Strategy’s contractual management fee rate at a hypothetical asset level. The hypothetical asset level is based on the combined net assets of all classes of the Strategy, rounded up to the next $25 million. Lipper’s total expense ratio information is based on the most recent annual report except as otherwise noted. A ranking of “1” would mean that Strategy had the lowest effective fee rate in the Lipper peer group. |
| 86 | • ALLIANCEBERNSTEIN REAL ASSET STRATEGY |
Lipper also compared the Strategy’s total expense ratio to the medians of the Strategy’s EG and Lipper Expense Universe (“EU”). The EU is a broader group compared to the EG, consisting of all funds that have the same investment classification/objective and load type as the subject Strategy.16
| Strategy | Expense Ratio (%) | Lipper Exp. Group Median (%) | Lipper Group Rank | Lipper Exp. Universe Median (%) | Lipper Universe Rank | |||||||||||||||
| Real Asset Strategy | 1.050 | 1.307 | 2/16 | 1.269 | 8/49 | |||||||||||||||
Based on this analysis, the Strategy has a more favorable ranking on a total expense ratio basis than on a contractual management fee basis.
| III. | COSTS TO THE ADVISER AND ITS AFFILIATES OF SUPPLYING SERVICES PURSUANT TO THE MANAGEMENT FEE ARRANGEMENT, EXCLUDING ANY INTRA-CORPORATE PROFIT. |
The Adviser utilizes two profitability reporting systems, which operate independently but are aligned with each other, to estimate the Adviser’s profitability in connection with investment advisory services provided to the Strategy. The Senior Officer has retained a consultant to provide independent advice regarding the alignment of the two profitability systems as well as the methodologies and allocations utilized by both profitability systems. See Section IV for additional discussion.
| IV. | PROFIT MARGINS OF THE ADVISER AND ITS AFFILIATES FOR SUPPLYING SUCH SERVICES. |
The profitability information for the Strategy, prepared by the Adviser for the Board of Directors, was reviewed by the Senior Officer and the independent consultant. The Adviser’s profitability from providing investment advisory services to the Strategy increased during calendar year 2013, relative to 2012.
In addition to the Adviser’s direct profits from managing the Strategy, certain of the Adviser’s affiliates have business relationships with the Strategy and may earn a profit from providing other services to the Strategy. The courts have referred to this type of business opportunity as “fall-out benefits” to the Adviser and indicated that such benefits should be factored into the evaluation of the total relationship between the Strategy and the Adviser. Neither case law nor common business practice precludes the Adviser’s affiliates from earning a reasonable
| 16 | Except for asset (size) comparability, Lipper uses the same criteria for selecting an EG when selecting an EU. Unlike the EG, the EU allows for the same adviser to be represented by more than just one fund. |
| ALLIANCEBERNSTEIN REAL ASSET STRATEGY • | 87 |
profit on this type of relationship provided the affiliates’ charges and services are competitive. These affiliates provide transfer agent, distribution and brokerage related services to the Strategy and receive transfer agent fees, front-end sales loads, Rule 12b-1 payments, contingent deferred sales charges (“CDSC”) and brokerage commissions. In addition, the Adviser benefits from soft dollar arrangements which offset expenses the Adviser would otherwise incur. During the Strategy’s most recently completed fiscal year, ABI received from the Strategy $4,924, $1,137,425 and $6,807 in front-end sales charges, Rule 12b-1 and CDSC fees, respectively.17
AllianceBernstein Investments, Inc. (“ABI”), an affiliate of the Adviser, is the Strategy’s principal underwriter. ABI and the Adviser have disclosed in the Strategy’s prospectus that they may make revenue sharing payments from their own resources, in addition to revenues derived from sales loads and Rule 12b-1 fees, to firms that sell shares of the Strategy. In 2013, ABI paid approximately 0.05% of the average monthly assets of the AllianceBernstein Mutual Funds or approximately $19.4 million for distribution services and educational support (revenue sharing payments).
Fees and reimbursements for out of pocket expenses charged by AllianceBernstein Investor Services, Inc. (“ABIS”), the affiliated transfer agent for the Strategy, are charged on a per account basis, based on the level of service provided and the class of share held by the account. ABIS also receives a fee per shareholder sub-account for each account maintained by an intermediary on an omnibus basis. During the Strategy’s most recently completed fiscal year, ABIS received $1,541,078 in fees from the Strategy.
The Strategy effected brokerage transactions through the Adviser’s affiliate, Sanford C. Bernstein & Co., LLC (“SCB & Co.”) and its U.K. affiliate, Sanford C. Bernstein Limited (“SCB Ltd.”), collectively “SCB,” and paid commissions for such transactions during the Strategy’s most recently completed fiscal year. The Adviser represented that SCB’s profitability from business conducted with the Strategy is comparable to the profitability of SCB’s dealings with other similar third party clients. In the ordinary course of business, SCB receives and pays liquidity rebates from electronic communications networks (“ECNs”) derived from trading for its clients. These credits and charges are not being passed onto to any SCB client. The Adviser also receives certain soft dollar benefits from brokers that execute agency trades for its clients. These soft dollar benefits reduce the Adviser’s research expense and increase its profitability.
| 17 | As a result of discussions between the Board and the Adviser, ABI is planning to phase into reductions of the Strategy’s Class A shares Rule 12b-1 fee payment rate from 0.30% to 0.25% effective on February 1, 2016. |
| 88 | • ALLIANCEBERNSTEIN REAL ASSET STRATEGY |
| V. | POSSIBLE ECONOMIES OF SCALE |
The Adviser has indicated that economies of scale are being shared with shareholders through pricing to scale, breakpoints, fee reductions/waivers and enhancement to services.
In May 2012, an independent consultant, retained by the Senior Officer, provided the Board of Directors information on the Adviser’s firm-wide average costs from 2005 through 2011 and the potential economies of scale. The independent consultant noted that from 2005 through 2007 the Adviser experienced significant growth in assets under management (“AUM”). During this period, operating expenses increased, in part to keep up with growth, and in part reflecting market returns. However, from 2008 through the first quarter of 2009, AUM rapidly and significantly decreased due to declines in market value and client withdrawals. When AUM rapidly decreased, some operating expenses categories, including base compensation and office space, adjusted more slowly during this period, resulting in an increase in average costs. Since 2009, AUM has experienced less significant changes. The independent consultant noted that changes in operating expenses reflect changes in business composition and business practices in response to changes in financial markets. Finally, the independent consultant concluded that the increase in average cost and the decline in net operating margin across the Adviser since late 2008 are inconsistent with the view that there are currently reductions in average costs due to economies of scale that can be shared with the AllianceBernstein Mutual Funds managed by the Adviser through lower fees.
Previously, in February 2008, the independent consultant provided the Board of Directors an update of the Deli18 study on advisory fees and various fund characteristics.19 The independent consultant first reiterated the results of his previous two dimensional comparison analysis (fund size and family size) with the Board of Directors.20 The independent consultant then discussed the results of the
| 18 | The Deli study, originally published in 2002 based on 1997 data and updated for the February 2008 Presentation, may be of diminished value due to the age of the data used in the presentation and the changes experienced in the industry since 2008. |
| 19 | As mentioned previously, the Supreme Court cautioned against accepting mutual fund fee comparisons without careful scrutiny since the fees may not be the product of negotiations conducted at arm’s length. See Jones V. Harris at 1429. |
| 20 | The two dimensional analysis showed patterns of lower advisory fees for funds with larger asset sizes and funds from larger family sizes compared to funds with smaller asset sizes and funds from smaller family sizes, which according to the independent consultant is indicative of a sharing of economies of scale and scope. However, in less liquid and active markets, such is not the case, as the empirical analysis showed potential for diseconomies of scale in those markets. The empirical analysis also showed diminishing economies of scale and scope as funds surpassed a certain high level of assets. |
| ALLIANCEBERNSTEIN REAL ASSET STRATEGY • | 89 |
regression model that was utilized to study the effects of various factors on advisory fees. The regression model output indicated that the bulk of the variation in fees predicted were explained by various factors, but substantially by fund AUM, family AUM, index fund indicator and investment style. The independent consultant also compared the advisory fees of the AllianceBernstein Mutual Funds to similar funds managed by 19 other large asset managers, regardless of the fund size and each Adviser’s proportion of mutual fund assets to non-mutual fund assets.
| VI. | NATURE AND QUALITY OF THE ADVISER’S SERVICES, INCLUDING THE PERFORMANCE OF THE FUND |
With assets under management of approximately $473 billion as of September 30, 2014, the Adviser has the investment experience to manage and provide non-investment services (described in Section I) to the Strategy.
The information below shows the 1 and 3 year performance returns and rankings of the Strategy 21 relative to its Lipper Performance Group (“PG”) and Lipper Performance Universe (“PU”)22 for the periods ended July 31, 2014.23
| Strategy | Strategy Return (%) | PG Median (%) | PU Median (%) | PG Rank | PU Rank | |||||||||||
| Real Asset Strategy | ||||||||||||||||
1 year | 10.78 | 9.27 | 9.18 | 5/16 | 27/93 | |||||||||||
3 year | 0.40 | 5.73 | 6.27 | 11/13 | 55/60 | |||||||||||
| 21 | The performance returns and rankings are for the Class A shares of the Strategy. The performance returns of the Strategy were provided Lipper. |
| 22 | The Strategy’s PG is identical to the Strategy’s EG. The Strategy’s PU is not identical to the Strategy’s EU as the criteria for including/excluding a strategy in/from a PU are somewhat different from that of an EU. |
| 23 | The current Lipper investment classification/objective dictates the PG and PU throughout the life of the Strategy even if the Strategy may have had a different investment classification/objective at different points in time. |
| 90 | • ALLIANCEBERNSTEIN REAL ASSET STRATEGY |
Set forth below are the 1, 3 year and since inception net performance returns of the Strategy (in bold)24 versus its benchmark.25 Strategy and benchmark volatility and reward-to-variability ratio (“Sharpe Ratio”) information is also shown.26
Periods Ending July 31, 2014 Annualized Performance | ||||||||||||||||||||||||
| Annualized | ||||||||||||||||||||||||
| 1 Year (%) | 3 Year (%) | Since Inception (%) | Volatility (%) | Sharpe (%) | Risk Period (Year) | |||||||||||||||||||
| Real Asset Strategy | 10.78 | 0.40 | 5.20 | 14.47 | 0.09 | 3 | ||||||||||||||||||
| MSCI AC World Commodity Producers Index | 16.98 | -0.98 | 3.00 | 15.25 | 0.08 | 3 | ||||||||||||||||||
| Real Asset Strategy Benchmark | 10.23 | 0.09 | 4.63 | |||||||||||||||||||||
| Inception Date: March 8, 2010 | ||||||||||||||||||||||||
CONCLUSION:
Based on the factors discussed above the Senior Officer’s conclusion is that the proposed advisory fee for the Strategy is reasonable and within the range of what would have been negotiated at arm’s-length in light of all the surrounding circumstances. This conclusion in respect of the Strategy is based on an evaluation of all of these factors and no single factor was dispositive.
Dated: November 18, 2014
| 24 | The performance returns and risk measures shown in the table are for the Class A shares of the Strategy. |
| 25 | The Adviser provided Strategy and benchmark performance return information for the periods through July 31, 2014. |
| 26 | Strategy and benchmark volatility and Sharpe Ratio information was obtained through Lipper LANA, a database maintained by Lipper. Volatility is a statistical measure of the tendency of a market price or yield to vary over time. A Sharpe Ratio is a risk adjusted measure of return that divides a fund’s return in excess of the riskless return by the fund’s standard deviation. A fund with a greater volatility would be viewed as more risky than a fund with equivalent performance but lower volatility; for that reason, a greater return would be demanded for the more risky fund. A fund with a higher Sharpe Ratio would be viewed as better performing than a fund with a lower Sharpe Ratio. |
| ALLIANCEBERNSTEIN REAL ASSET STRATEGY • | 91 |
THIS PAGE IS NOT PART OF THE SHAREHOLDER REPORT OR THE FINANCIAL STATEMENTS
ALLIANCEBERNSTEIN FAMILY OF FUNDS
US Equity
US Core
Core Opportunities Fund
Select US Equity Portfolio
US Growth
Concentrated Growth Fund
Discovery Growth Fund
Growth Fund
Large Cap Growth Fund
Small Cap Growth Portfolio
US Value
Discovery Value Fund
Equity Income Fund
Growth & Income Fund
Value Fund
International/Global Equity
International/Global Core
Global Equity & Covered Call Strategy Fund
Global Thematic Growth Fund
International Portfolio
Tax-Managed International Portfolio
International/Global Growth
International Growth Fund
International/Global Value
International Value Fund
Fixed Income
Municipal
High Income Municipal Portfolio
Intermediate California Portfolio
Intermediate Diversified Portfolio
Intermediate New York Portfolio
Municipal Bond Inflation Strategy
Tax-Aware Fixed Income Portfolio
National Portfolio
Arizona Portfolio
California Portfolio
Massachusetts Portfolio
Michigan Portfolio
Minnesota Portfolio
New Jersey Portfolio
New York Portfolio
Ohio Portfolio
Pennsylvania Portfolio
Virginia Portfolio
Taxable
Bond Inflation Strategy
Global Bond Fund
Fixed Income (continued)
Taxable
High Income Fund
High Yield Portfolio
Intermediate Bond Portfolio
Limited Duration High Income Portfolio
Short Duration Portfolio
Alternatives
All Market Real Return Portfolio*
Credit Long/Short Portfolio
Global Real Estate Investment Fund
Long/Short Multi-Manager Fund
Market Neutral Strategy-U.S.
Multi-Manager Alternative Strategies Fund
Select US Long/Short Portfolio
Unconstrained Bond Fund
Multi-Asset
All Market Growth Portfolio*
Emerging Markets Multi-Asset Portfolio
Global Risk Allocation Fund
Retirement Strategies
2000 Retirement Strategy
2005 Retirement Strategy
2010 Retirement Strategy
2015 Retirement Strategy
2020 Retirement Strategy
2025 Retirement Strategy
2030 Retirement Strategy
2035 Retirement Strategy
2040 Retirement Strategy
2045 Retirement Strategy
2050 Retirement Strategy
2055 Retirement Strategy
Wealth Strategies
Balanced Wealth Strategy
Conservative Wealth Strategy
Wealth Appreciation Strategy
Tax-Managed Balanced Wealth Strategy
Tax-Managed Conservative Wealth Strategy
Tax-Managed Wealth Appreciation Strategy
Closed-End Funds
Alliance California Municipal Income Fund
Alliance New York Municipal Income Fund
AllianceBernstein Global High Income Fund
AllianceBernstein Income Fund
AllianceBernstein Multi-Manager Alternative Fund
AllianceBernstein National Municipal Income Fund
We also offer Exchange Reserves, which serves as the money market fund exchange vehicle for the AllianceBernstein mutual funds. An investment in Exchange Reserves is not a deposit in a bank and is not insured or guaranteed by the Federal Deposit Insurance Corporation or any other government agency. Although the Fund seeks to preserve the value of your investment at $1.00 per share, it is possible to lose money by investing in the Fund.
Investors should consider the investment objectives, risks, charges and expenses of the Fund carefully before investing. For copies of our prospectus or summary prospectus, which contain this and other information, visit us online at www.alliancebernstein.com or contact your AllianceBernstein investments representative. Please read the prospectus and/or summary prospectus carefully before investing.
* Prior to December 15, 2014, All Market Growth Portfolio was named Dynamic All Market Fund; All Market Real Return Portfolio was named Real Asset Strategy.
| 92 | • ALLIANCEBERNSTEIN REAL ASSET STRATEGY |
AllianceBernstein Family of Funds
ALLIANCEBERNSTEIN REAL ASSET STRATEGY
1345 Avenue of the Americas
New York, NY 10105
800.221.5672
| RAS-0151-1014 |  | |
ANNUAL REPORT
AllianceBernstein
Tax-Aware Fixed Income Portfolio
October 31, 2014
Annual Report

Investment Products Offered
• Are Not FDIC Insured • May Lose Value • Are Not Bank Guaranteed |
Investors should consider the investment objectives, risks, charges and expenses of the Fund carefully before investing. For copies of our prospectus or summary prospectus, which contain this and other information, visit us online at www.alliancebernstein.com or contact your AllianceBernstein Investments representative. Please read the prospectus and/or summary prospectus carefully before investing.
This shareholder report must be preceded or accompanied by the Fund’s prospectus for individuals who are not current shareholders of the Fund.
You may obtain a description of the Fund’s proxy voting policies and procedures, and information regarding how the Fund voted proxies relating to portfolio securities during the most recent 12-month period ended June 30, without charge. Simply visit AllianceBernstein’s website at www.alliancebernstein.com, or go to the Securities and Exchange Commission’s (the “Commission”) website at www.sec.gov, or call AllianceBernstein at (800) 227-4618.
The Fund files its complete schedule of portfolio holdings with the Commission for the first and third quarters of each fiscal year on Form N-Q. The Fund’s Forms N-Q are available on the Commission’s website at www.sec.gov. The Fund’s Forms N-Q may also be reviewed and copied at the Commission’s Public Reference Room in Washington, DC; information on the operation of the Public Reference Room may be obtained by calling (800) SEC-0330. AllianceBernstein publishes full portfolio holdings for the Fund monthly at www.alliancebernstein.com.
AllianceBernstein Investments, Inc. (ABI) is the distributor of the AllianceBernstein family of mutual funds. ABI is a member of FINRA and is an affiliate of AllianceBernstein L.P., the manager of the funds.
AllianceBernstein® and the AB Logo are registered trademarks and service marks used by permission of the owner, AllianceBernstein L.P.
December 12, 2014
Annual Report
This report provides management’s discussion of fund performance for AllianceBernstein Tax-Aware Fixed Income Portfolio (the “Fund”) for the six-month period and the period since inception through October 31, 2014. The Fund commenced operations on December 11, 2013.
Investment Objectives and Policies
The investment objective of the Fund is to maximize after-tax return and income. The Fund pursues its objective by investing principally in a national portfolio of both municipal and taxable fixed-income securities. The Fund invests, under normal circumstances, at least 80% of its net assets in fixed-income securities. The Fund also invests, under normal circumstances, at least 65% of its total assets in municipal securities that pay interest that is exempt from Federal income tax. These securities may pay interest that is subject to the Federal alternative minimum tax (“AMT”) for certain taxpayers. The income earned and distributed to shareholders on non-municipal securities would not be exempt from Federal income tax. The Fund may invest in fixed-income securities rated below investment grade (commonly known as “junk bonds”), although such securities are not expected to be the Fund’s primary focus.
AllianceBernstein L.P. (the “Adviser”) selects securities for the Fund based on a variety of factors, including credit quality, maturity, diversification benefits, and the relative expected after-tax returns of taxable and municipal securities (considering Federal tax rates and without regard to
state and local income taxes). As the objective is to increase the after-tax return of the portfolio, an investor in the Fund may incur a tax liability that will generally be greater than the same investor would have in a fund investing exclusively in municipal securities, and that will be higher if the investor is in a higher tax bracket. In addition, the tax implications of the Fund’s trading activity, such as realizing taxable gains, are considered in making purchase and sale decisions for the Fund. The Fund may invest in fixed-income securities of any maturity from short- to long-term.
The Fund may also invest in forward commitments, zero-coupon municipal securities and variable, floating and inverse floating rate municipal securities.
The Fund may use derivatives, such as swaps, options, futures, and forwards, to achieve its investment strategies. For example, the Fund may enter into credit default and interest rate swaps relating to municipal and taxable fixed-income securities or securities indices. Derivatives may provide more efficient and economical exposure to fixed-income securities markets than direct investments. The Fund may also enter into tender option bond transactions (“TOBs”), which may be used as a form of leverage.
Investment Results
The table on page 6 shows the Fund’s performance compared to its benchmark, the Barclays Municipal Bond Index, for the six-month period and the period since the Fund’s inception, through October 31, 2014.
| ALLIANCEBERNSTEIN TAX-AWARE FIXED INCOME PORTFOLIO • | 1 |
For the six-month period, all share classes of the Fund underperformed its benchmark. An overweight in higher-yielding, credit-sensitive, bonds benefited performance; an underweight in long-maturity, lower-coupon, high-grade bonds detracted. In addition, security selection in the industrial and local and state general obligation sectors detracted most from performance, as did an overweight in Treasuries. Contributing to performance was security selection in the health care, special tax and education sectors.
For the period since inception, all share classes of the Fund underperformed its benchmark. The transition from cash during the initial investment period detracted from performance versus the benchmark which has no weight in cash. An overweight to the industrial sector and security selection in the pre-refunded sector contributed to performance. Security selection in the transportation, industrial and local general obligation sector detracted most from performance.
The Fund did not use derivatives during either period.
Market Review and Investment Strategy
Limited supply and continued demand supported municipal bond prices over the six- and 12-month periods ended October 31, 2014. As a result municipal
issues outperformed most other bond sectors. According to estimates by the Municipal Bond Investment Team (the “Team”) municipal yields declined between 0.10% and 0.50% over the six-month period and between 0.35% and roughly 1% over the 12-month period. During both periods, the yields for long-maturity bonds declined more than yields for shorter-maturity bonds and municipal bonds generally outperformed Treasury bonds. In the last few months of the reporting period, volatility increased in the markets in response to multiple factors: stronger U.S. economic growth prompted concerns that the U.S. Federal Reserve (the “Fed”) might raise interest rates sooner than expected; faltering economic growth overseas; and strife in the Middle East and Ukraine also heightened uncertainty.
The Team also targeted medium-grade, primarily BBB credit quality* bonds, as an attractive part of the market to overweight. This strategy has allowed the Fund to capture historically high yields relative to AAA bonds. In addition, the Team expects the yield spread (the amount by which a bond’s yield exceeds the yield of AAA-rated bonds) of such bonds to fall (improving prices) when the Fed begins to increase rates.
The Fund may purchase municipal securities that are insured under policies issued by certain insurance companies.
| * | A measure of the quality and safety of a bond or portfolio, based on the issuer’s financial condition and not of the Fund itself. AAA is highest (best) and D is lowest (worst). Investment grade securities are those rated BBB and above. Ratings are subject to change. If applicable, the pre-refunded category includes bonds which are secured by U.S. Government Securities and therefore have been deemed high-quality investment grade by the Adviser. |
| 2 | • ALLIANCEBERNSTEIN TAX-AWARE FIXED INCOME PORTFOLIO |
Historically, insured municipal securities typically received a higher credit rating, which meant that the issuer of the securities paid a lower interest rate. As a result of declines in the credit quality and associated downgrades of most fund insurers, insurance has less value than it did in the past. The market now values insured municipal securities primarily based on the credit quality of the issuer of the security with little value given to the insurance feature. In purchasing such insured securities, the
Adviser evaluates the risk and return of municipal securities through its own research. If an insurance company’s rating is downgraded or the company becomes insolvent, the prices of municipal securities insured by the insurance company may decline. As of October 31, 2014, the Fund’s percentages of investments in municipal bonds that are insured and in insured municipal bonds that have been pre-refunded or escrowed to maturity are 2.89% and 0%, respectively.
| ALLIANCEBERNSTEIN TAX-AWARE FIXED INCOME PORTFOLIO • | 3 |
DISCLOSURES AND RISKS
Benchmark Disclosure
The unmanaged Barclays Municipal Bond Index does not reflect fees and expenses associated with the active management of a mutual fund portfolio. The Barclays Municipal Bond Index represents the performance of the long-term tax-exempt bond market consisting of investment grade bonds. An investor cannot invest directly in an index, and its results are not indicative of the performance for any specific investment, including the Fund.
A Word About Risk
Market Risk: The value of the Fund’s assets will fluctuate as the stock or bond market fluctuates. The value of the Fund’s investments may decline, sometimes rapidly and unpredictably, simply because of economic changes or other events that affect large portions of the market.
Credit Risk: An issuer or guarantor of a fixed-income security, or the counterparty to a derivatives or other contract, may be unable or unwilling to make timely payments of interest or principal, or to otherwise honor its obligations. The issuer or guarantor may default causing a loss of the full principal amount of a security. The degree of risk for a particular security may be reflected in its credit rating. There is the possibility that the credit rating of a fixed-income security may be downgraded after purchase, which may adversely affect the value of the security.
Below Investment Grade Securities Risk: Investments in fixed-income securities with lower ratings are subject to higher probability that an issuer will default or fail to meet its payment obligations. These securities may be subject to greater price volatility due to such factors as specific municipal or corporate developments, negative performance of the junk bond market generally and less secondary market liquidity.
Municipal Market Risk: This is the risk that special factors may adversely affect the value of municipal securities and have a significant effect on the yield or value of the Fund’s investments in municipal securities. These factors include economic conditions, political or legislative changes, uncertainties related to the tax status of municipal securities, or the rights of investors in these securities. To the extent that the Fund invests more of its assets in a particular state’s municipal securities, the Fund may be vulnerable to events adversely affecting that state, including economic, political and regulatory occurrences, court decisions, terrorism and catastrophic natural disasters, such as hurricanes or earthquakes. The Fund’s investments in certain municipal securities with principal and interest payments that are made from the revenues of a specific project or facility, and not general tax revenues, may have increased risks. Factors affecting the project or facility, such as local business or economic conditions, could have a significant effect on the project’s ability to make payments of principal and interest on these securities.
Tax Risk: From time to time, the U.S. Government and the U.S. Congress consider changes in federal tax law that could limit or eliminate the federal tax exemption for municipal bond income, which would in effect reduce the income received by shareholders from the Fund by increasing taxes on that income. In such event, the Fund’s net asset value (“NAV”) could also decline as yields on municipal bonds, which are typically lower than those on taxable bonds, would be expected to increase to approximately the yield of comparable taxable bonds. Actions or anticipated actions affecting the tax exempt status of municipal bonds could also result in significant shareholder redemptions of Fund shares as investors anticipate adverse effects on the Fund or seek higher yields to offset the potential loss of the tax deduction. As a result, the Fund would be required to maintain higher levels of cash to meet the redemptions, which would negatively affect the Fund’s yield.
(Disclosures, Risks and Note about Historical Performance continued on next page)
| 4 | • ALLIANCEBERNSTEIN TAX-AWARE FIXED INCOME PORTFOLIO |
Disclosures and Risks
DISCLOSURES AND RISKS
(continued from previous page)
Interest Rate Risk: Changes in interest rates will affect the value of investments in fixed-income securities. When interest rates rise, the value of investments in fixed income securities tends to fall and this decrease in value may not be offset by higher income from new investments. Interest rate risk is generally greater for fixed-income securities with longer maturities or durations.
Duration Risk: Duration is a measure that relates the expected price volatility of a fixed-income security to changes in interest rates. The duration of a fixed-income security may be shorter than or equal to full maturity of a fixed-income security. Fixed income securities with longer durations have more risk and will decrease in price as interest rates rise. For example, a fixed income security with a duration of three years will decrease in value by approximately 3% if interest rates increase by 1%.
Inflation Risk: This is the risk that the value of assets or income from investments will be less in the future as inflation decreases the value of money. As inflation increases, the value of the Fund’s assets can decline as can the value of the Fund’s distributions. This risk is significantly greater for fixed-income securities with longer maturities.
Liquidity Risk: Liquidity risk exists when particular investments, such as lower-rated securities, are difficult to purchase or sell, possibly preventing the Fund from selling out of these illiquid securities at an advantageous price. Derivatives and securities involving substantial market and credit risk tend to involve greater liquidity risk. The Fund is subject to liquidity risk because the market for municipal securities is generally smaller than many other markets.
Derivatives Risk: Investments in derivatives may be illiquid, difficult to price, and leveraged so that small changes may produce disproportionate losses for the Portfolios, and may be subject to counterparty risk to a greater degree than more traditional investments.
Management Risk: The Fund is subject to management risk because it is an actively managed investment fund. The Adviser will apply its investment techniques and risk analyses in making investment decisions, but there is no guarantee that its techniques will produce the intended results.
These and other risks are more fully discussed in the Fund’s prospectus.
An Important Note About Historical Performance
The investment return and principal value of an investment in the Fund will fluctuate, so that shares, when redeemed, may be worth more or less than their original cost. Performance shown on the following pages represents past performance and does not guarantee future results. Current performance may be lower or higher than the performance information shown. You may obtain performance information current to the most recent month-end by visiting www.alliancebernstein.com. The Fund has been in operation only for a short period of time, and therefore has a very limited historical performance period. This limited performance period is unlikely to be representative of the performance the Fund will achieve over a longer period.
All fees and expenses related to the operation of the Fund have been deducted. NAV returns do not reflect sales charges; if sales charges were reflected, the Portfolios’ quoted performance would be lower. SEC returns and the Portfolios’ returns shown in the line graphs reflect the applicable sales charges for each share class: a 3% maximum front-end sales charge for Class A shares; a 1% 1 year contingent deferred sales charge for Class C shares. Returns for the different share classes will vary due to their different expenses associated with each class. Performance assumes reinvestment of distributions and does not account for taxes.
| ALLIANCEBERNSTEIN TAX-AWARE FIXED INCOME PORTFOLIO • | 5 |
Disclosures and Risks
HISTORICAL PERFORMANCE
| THE FUND VS. ITS BENCHMARK PERIODS ENDED OCTOBER 31, 2014 (unaudited) | NAV Returns | |||||||||
| 6 Months | Since Inception* | |||||||||
| AllianceBernstein Tax-Aware Fixed Income Portfolio | ||||||||||
Class A | 2.66% | 6.44% | ||||||||
| ||||||||||
Class C | 2.38% | 5.92% | ||||||||
| ||||||||||
Advisor Class† | 2.81% | 6.84% | ||||||||
| ||||||||||
| Barclays Municipal Bond Index | 3.59% | 8.26% | ||||||||
| ||||||||||
* Inception date: 12/11/2013
† Please note that Advisor Class shares are for investors purchasing shares through accounts established under certain fee-based programs sponsored and maintained by certain broker-dealers and financial intermediaries, institutional pension plans and/ or investment advisory clients of, and certain other persons associated with, the Adviser and its affiliates or the Fund. | ||||||||||
See Disclosures, Risks and Note about Historical Performance on pages 4-5.
(Historical Performance continued on next page)
| 6 | • ALLIANCEBERNSTEIN TAX-AWARE FIXED INCOME PORTFOLIO |
Historical Performance
HISTORICAL PERFORMANCE
(continued from previous page)
| AVERAGE ANNUAL RETURNS AS OF OCTOBER 31, 2014 (unaudited) | ||||||||
| NAV Returns | SEC Returns (reflects applicable sales charges) | |||||||
| Class A | ||||||||
Since Inception* | 6.44 | % | 3.24 | % | ||||
| Class C | ||||||||
Since Inception* | 5.92 | % | 4.92 | % | ||||
| Advisor Class† | ||||||||
Since Inception* | 6.84 | % | 6.84 | % | ||||
The Fund’s current prospectus fee table shows the Fund’s total annual operating expense ratios as 1.24%, 1.94% and 0.94% for Class A, Class C and Advisor Class, respectively, gross of any fee waivers or expense reimbursements. Contractual fee waivers and/or expense reimbursements will limit the Fund’s annual operating expenses, excluding any interest expense, to 0.85%, 1.55% and 0.55% for Class A, Class C and Advisor Class, respectively. These waivers/ reimbursements may not be terminated prior to December 11, 2014 and may be extended by the Adviser for additional one-year terms. Absent reimbursements or waivers, performance would have been lower. The Financial Highlights section of this report sets forth expense ratio data for the current reporting period; the expense ratios shown above may differ from the expense ratios in the Financial Highlights section since they are based on different time periods.
| * | Inception date: 12/11/2013. |
| † | Please note that this share class is for investors purchasing shares through accounts established under certain fee-based programs sponsored and maintained by certain broker-dealers and financial intermediaries, institutional pension plans and/or investment advisory clients of, and certain other persons associated with, the Adviser and its affiliates or the Fund. |
See Disclosures, Risks and Note about Historical Performance on pages 4-5.
(Historical Performance continued on next page)
| ALLIANCEBERNSTEIN TAX-AWARE FIXED INCOME PORTFOLIO • | 7 |
Historical Performance
HISTORICAL PERFORMANCE
(continued from previous page)
SEC AVERAGE ANNUAL RETURNS SEPTEMBER 30, 2014 (unaudited) | ||||
| SEC Returns (reflects applicable sales charges) | ||||
| Class A | ||||
Since Inception* | 2.81 | % | ||
| Class C | ||||
Since Inception* | 4.44 | % | ||
| Advisor Class† | ||||
Since Inception* | 6.27 | % | ||
| * | Inception date: 12/11/2013. |
| † | Please note that this share class is for investors purchasing shares through accounts established under certain fee-based programs sponsored and maintained by certain broker-dealers and financial intermediaries, institutional pension plans and/or investment advisory clients of, and certain other persons associated with, the Adviser and its affiliates or the Fund. |
See Disclosures, Risks and Note about Historical Performance on pages 4-5.
| 8 | • ALLIANCEBERNSTEIN TAX-AWARE FIXED INCOME PORTFOLIO |
Historical Performance
EXPENSE EXAMPLE
(unaudited)
As a shareholder of the Fund, you incur two types of costs: (1) transaction costs, including sales charges (loads) on purchase payments, contingent deferred sales charges on redemptions and (2) ongoing costs, including management fees; distribution (12b-1) fees; and other Fund expenses. This example is intended to help you understand your ongoing costs (in dollars) of investing in the Fund and to compare these costs with the ongoing costs of investing in other mutual funds.
The Example is based on an investment of $1,000 invested at the beginning of the period and held for the entire period as indicated below.
Actual Expenses
The table below provides information about actual account values and actual expenses. You may use the information, together with the amount you invested, to estimate the expenses that you paid over the period. Simply divide your account value by $1,000 (for example, an $8,600 account value divided by $1,000 = 8.6), then multiply the result by the number under the heading entitled “Expenses Paid During Period” to estimate the expenses you paid on your account during this period.
Hypothetical Example for Comparison Purposes
The table below also provides information about hypothetical account values and hypothetical expenses based on the Fund’s actual expense ratio and an assumed annual rate of return of 5% before expenses, which is not the Fund’s actual return. The hypothetical account values and expenses may not be used to estimate the actual ending account balance or expenses you paid for the period. You may use this information to compare the ongoing costs of investing in the Fund and other funds by comparing this 5% hypothetical example with the 5% hypothetical examples that appear in the shareholder reports of other funds.
Please note that the expenses shown in the table are meant to highlight your ongoing costs only and do not reflect any transactional costs, such as sales charges (loads), or contingent deferred sales charges on redemptions. Therefore, the hypothetical example is useful in comparing ongoing costs only, and will not help you determine the relative total costs of owning different funds. In addition, if these transactional costs were included, your costs would have been higher.
| Beginning Account Value May 1, 2014 | Ending Account Value October 31, 2014 | Expenses Paid During Period* | Annualized Expense Ratio* | |||||||||||||
| Class A | ||||||||||||||||
Actual | $ | 1,000 | $ | 1,026.60 | $ | 4.34 | 0.85 | % | ||||||||
Hypothetical** | $ | 1,000 | $ | 1,020.92 | $ | 4.33 | 0.85 | % | ||||||||
| Class C | ||||||||||||||||
Actual | $ | 1,000 | $ | 1,023.80 | $ | 7.91 | 1.55 | % | ||||||||
Hypothetical** | $ | 1,000 | $ | 1,017.39 | $ | 7.88 | 1.55 | % | ||||||||
| Advisor Class | ||||||||||||||||
Actual | $ | 1,000 | $ | 1,028.10 | $ | 2.81 | 0.55 | % | ||||||||
Hypothetical** | $ | 1,000 | $ | 1,022.43 | $ | 2.80 | 0.55 | % | ||||||||
| * | Expenses are equal to the classes’ annualized expense ratios multiplied by the average account value over the period, multiplied by 184/365 (to reflect the one-half year period). |
| ** | Assumes 5% annual return before expenses. |
| ALLIANCEBERNSTEIN TAX-AWARE FIXED INCOME PORTFOLIO • | 9 |
Expense Example
PORTFOLIO SUMMARY
October 31, 2014 (unaudited)
PORTFOLIO STATISTICS
Net Assets ($mil): $16.9
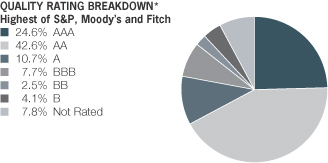
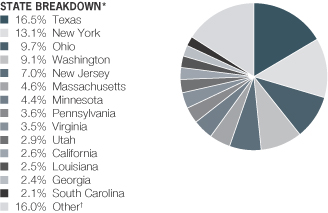
| * | All data are as of October 31, 2014. The Fund’s quality rating breakdown and state breakdown are expressed as a percentage of the Fund’s total investments in municipal securities and may vary over time. The quality ratings are determined by using the Standard & Poor’s Ratings Services (“S&P”), Moody’s Investors Services, Inc.(“Moody’s”) and Fitch Ratings, Ltd.(“Fitch”).The Fund considers the credit ratings issued by S&P, Moody’s and Fitch and uses the highest rating issued by the agencies. These ratings are a measure of the quality and safety of a bond or portfolio, based on the issuer’s financial condition. AAA is the highest (best) and D is the lowest (worst). If applicable, the pre-refunded category includes bonds which are secured by US Government Securities and therefore are deemed high-quality investment grade by the Adviser. If applicable, Not Applicable (N/A) includes non credit worthy investments; such as, equities, currency contracts, futures and options. If applicable, the Not Rated category includes bonds that are not rated by a Nationally Recognized Statistical Rating Organization. The Adviser evaluates the creditworthiness of non-rated securities based on a number of factors including, but not limited to, cash flows, enterprise value and economic environment. |
| † | “Other” represents less than 2.0% in 13 different states and Puerto Rico. |
| 10 | • ALLIANCEBERNSTEIN TAX-AWARE FIXED INCOME PORTFOLIO |
Portfolio Summary
PORTFOLIO OF INVESTMENTS
October 31, 2014
| Principal Amount (000) | U.S. $ Value | |||||||
| ||||||||
MUNICIPAL OBLIGATIONS – 87.0% | ||||||||
Long-Term Municipal Bonds – 87.0% | ||||||||
Alabama – 0.7% | ||||||||
County of Jefferson AL Sewer Revenue | $ | 110 | $ | 119,998 | ||||
|
| |||||||
Arizona – 1.7% | ||||||||
Arizona Health Facilities Authority | 70 | 66,407 | ||||||
Industrial Development Authority of the City of Phoenix (The) | 100 | 102,067 | ||||||
Salt Verde Financial Corp. | 100 | 113,181 | ||||||
|
| |||||||
| 281,655 | ||||||||
|
| |||||||
California – 2.2% | ||||||||
California Pollution Control Financing Authority (Poseidon Resources Channelside LP) | 250 | 265,825 | ||||||
Golden State Tobacco Securitization Corp. | 150 | 111,670 | ||||||
|
| |||||||
| 377,495 | ||||||||
|
| |||||||
Colorado – 1.1% | ||||||||
Colorado Health Facilities Authority | 170 | 191,454 | ||||||
|
| |||||||
Connecticut – 0.9% | ||||||||
State of Connecticut | 130 | 157,979 | ||||||
|
| |||||||
Florida – 0.7% | ||||||||
Collier County Industrial Development Authority (Arlington of Naples (The)) | 100 | 111,030 | ||||||
|
| |||||||
| ALLIANCEBERNSTEIN TAX-AWARE FIXED INCOME PORTFOLIO • | 11 |
Portfolio of Investments
| Principal Amount (000) | U.S. $ Value | |||||||
| ||||||||
Georgia – 2.1% | ||||||||
City of Atlanta Department of Aviation | $ | 310 | $ | 357,845 | ||||
|
| |||||||
Idaho – 0.6% | ||||||||
Idaho Health Facilities Authority | ||||||||
Series 2014A | 100 | 105,347 | ||||||
|
| |||||||
Illinois – 1.8% | ||||||||
Chicago Board of Education | 40 | 40,210 | ||||||
Illinois Finance Authority | 50 | 53,116 | ||||||
Illinois Finance Authority | 100 | 67,795 | ||||||
State of Illinois | 130 | 139,967 | ||||||
|
| |||||||
| 301,088 | ||||||||
|
| |||||||
Indiana – 1.6% | ||||||||
Indiana Finance Authority | 160 | 171,664 | ||||||
Indiana Finance Authority | 100 | 106,422 | ||||||
|
| |||||||
| 278,086 | ||||||||
|
| |||||||
Kentucky – 0.4% | ||||||||
Kentucky Economic Development Finance | 65 | 65,908 | ||||||
|
| |||||||
| 12 | • ALLIANCEBERNSTEIN TAX-AWARE FIXED INCOME PORTFOLIO |
Portfolio of Investments
| Principal Amount (000) | U.S. $ Value | |||||||
| ||||||||
Louisiana – 2.2% | ||||||||
City of New Orleans LA Water Revenue | $ | 100 | $ | 112,007 | ||||
Louisiana Public Facilities Authority | 250 | 254,735 | ||||||
|
| |||||||
| 366,742 | ||||||||
|
| |||||||
Massachusetts – 4.0% | ||||||||
Massachusetts Clean Water Trust (The) | 610 | 683,328 | ||||||
|
| |||||||
Michigan – 0.8% | ||||||||
City of Detroit MI Sewage Disposal System | ||||||||
5.00%, 7/01/22 | 115 | 129,534 | ||||||
|
| |||||||
Minnesota – 3.8% | ||||||||
State of Minnesota | 580 | 649,049 | ||||||
|
| |||||||
Nebraska – 0.6% | ||||||||
Central Plains Energy Project | 100 | 107,699 | ||||||
|
| |||||||
New Hampshire – 0.7% | ||||||||
New Hampshire Health and Education Facilities Authority Act | 115 | 119,547 | ||||||
|
| |||||||
New Jersey – 6.1% | ||||||||
Burlington County Bridge Commission | 140 | 143,252 | ||||||
New Jersey Economic Development Authority | 290 | 330,719 | ||||||
New Jersey Economic Development Authority | 85 | 90,322 | ||||||
| ALLIANCEBERNSTEIN TAX-AWARE FIXED INCOME PORTFOLIO • | 13 |
Portfolio of Investments
| Principal Amount (000) | U.S. $ Value | |||||||
| ||||||||
New Jersey State Turnpike Authority | $ | 315 | $ | 357,796 | ||||
Tobacco Settlement Financing Corp. NJ | 135 | 100,548 | ||||||
|
| |||||||
| 1,022,637 | ||||||||
|
| |||||||
New York – 11.4% | ||||||||
Build NYC Resource Corp. | 100 | 98,063 | ||||||
City of New York NY | 340 | 406,127 | ||||||
Metropolitan Transportation Authority | 315 | 363,630 | ||||||
New York State Dormitory Authority | 425 | 507,042 | ||||||
New York State Thruway Authority | 365 | 430,112 | ||||||
Ulster County Industrial Development Agency (Kingston Regional Senior Living Corp.) | 120 | 114,913 | ||||||
|
| |||||||
| 1,919,887 | ||||||||
|
| |||||||
North Carolina – 1.7% | ||||||||
State of North Carolina | 260 | 289,650 | ||||||
|
| |||||||
Ohio – 8.4% | ||||||||
Buckeye Tobacco Settlement Financing Authority | 135 | 106,649 | ||||||
City of Akron OH | 445 | 512,030 | ||||||
City of Columbus OH | 225 | 248,173 | ||||||
Series 2014A | 110 | 132,981 | ||||||
| 14 | • ALLIANCEBERNSTEIN TAX-AWARE FIXED INCOME PORTFOLIO |
Portfolio of Investments
| Principal Amount (000) | U.S. $ Value | |||||||
| ||||||||
County of Cuyahoga OH | $ | 365 | $ | 420,746 | ||||
|
| |||||||
| 1,420,579 | ||||||||
|
| |||||||
Pennsylvania – 3.1% | ||||||||
Commonwealth of Pennsylvania | 380 | 419,968 | ||||||
Pennsylvania Economic Development Financing Authority | 100 | 111,630 | ||||||
|
| |||||||
| 531,598 | ||||||||
|
| |||||||
Puerto Rico – 0.6% | ||||||||
Puerto Rico Industrial Tourist Educational Medical & Envirml Ctl Facs Fing Auth | 100 | 95,153 | ||||||
|
| |||||||
South Carolina – 1.8% | ||||||||
Spartanburg County School District No 1/SC | 250 | 302,738 | ||||||
|
| |||||||
Texas – 14.4% | ||||||||
Central Texas Regional Mobility Authority | 100 | 106,038 | ||||||
City of Houston TX | 260 | 299,879 | ||||||
City of Lubbock TX AGM | 420 | 425,704 | ||||||
Cypress-Fairbanks Independent School District Series 2014B | 400 | 404,900 | ||||||
Grand Parkway Transportation Corp. | 285 | 299,820 | ||||||
Travis County Cultural Education Facilities Finance Corp. | 160 | 162,907 | ||||||
| ALLIANCEBERNSTEIN TAX-AWARE FIXED INCOME PORTFOLIO • | 15 |
Portfolio of Investments
| Principal Amount (000) | U.S. $ Value | |||||||
| ||||||||
Travis County Health Facilities Development Corp. (Longhorn Village) | $ | 55 | $ | 59,968 | ||||
Trinity River Authority Central Regional Wastewater System Revenue | 565 | 675,056 | ||||||
|
| |||||||
| 2,434,272 | ||||||||
|
| |||||||
Utah – 2.5% | ||||||||
State of Utah | 380 | 424,407 | ||||||
|
| |||||||
Virginia – 3.1% | ||||||||
Tobacco Settlement Financing Corp. VA | 145 | 98,738 | ||||||
Virginia Public School Authority | ||||||||
(Virginia Public School Authority State Lease) | 380 | 420,903 | ||||||
|
| |||||||
| 519,641 | ||||||||
|
| |||||||
Washington – 8.0% | ||||||||
City of Seattle WA | 125 | 138,501 | ||||||
City of Seattle WA Municipal Light & Power Revenue | 555 | 673,653 | ||||||
State of Washington | 380 | 424,088 | ||||||
Washington State Housing Finance Commission (Rockwood Retirement Communities) | ||||||||
7.375%, 1/01/44(a) | 100 | 109,346 | ||||||
|
| |||||||
| 1,345,588 | ||||||||
|
| |||||||
Total Municipal Obligations | 14,709,934 | |||||||
|
| |||||||
GOVERNMENTS – TREASURIES – 10.3% | ||||||||
United States – 10.3% | ||||||||
U.S. Treasury Notes | 585 | 585,503 | ||||||
4.125%, 5/15/15 | 1,130 | 1,154,012 | ||||||
|
| |||||||
Total Governments – Treasuries | 1,739,515 | |||||||
|
| |||||||
| 16 | • ALLIANCEBERNSTEIN TAX-AWARE FIXED INCOME PORTFOLIO |
Portfolio of Investments
| Principal Amount (000) | U.S. $ Value | |||||||
| ||||||||
CORPORATES – INVESTMENT | ||||||||
Industrial – 4.2% | ||||||||
Communications - Media – 0.7% | ||||||||
Cox Communications, Inc. | $ | 65 | $ | 67,862 | ||||
DirecTV Holdings LLC/DirecTV Financing Co., Inc. | 60 | 61,454 | ||||||
|
| |||||||
| 129,316 | ||||||||
|
| |||||||
Consumer Cyclical - Automotive – 0.3% | ||||||||
Ford Motor Credit Co. LLC | 50 | 52,037 | ||||||
|
| |||||||
Consumer Cyclical - Retailers – 0.6% | ||||||||
CVS Health Corp. | 50 | 50,733 | ||||||
Walgreen Co. | 50 | 50,079 | ||||||
|
| |||||||
| 100,812 | ||||||||
|
| |||||||
Consumer Non- Cyclical – 1.1% | ||||||||
Kraft Foods Group, Inc. | 60 | 60,368 | ||||||
Thermo Fisher Scientific, Inc. | 70 | 71,205 | ||||||
Bunge Ltd. Finance Corp. | 50 | 52,071 | ||||||
|
| |||||||
| 183,644 | ||||||||
|
| |||||||
Energy – 0.3% | ||||||||
Kinder Morgan Energy Partners LP | 50 | 51,514 | ||||||
|
| |||||||
Technology – 1.2% | ||||||||
Xerox Corp. | 50 | 53,658 | ||||||
Hewlett-Packard Co. | 60 | 61,478 | ||||||
Kla-tencor Corp. | 85 | 85,413 | ||||||
|
| |||||||
| 200,549 | ||||||||
|
| |||||||
| 717,872 | ||||||||
|
| |||||||
Financial Institutions – 1.7% | ||||||||
Banking – 0.4% | ||||||||
Morgan Stanley | 70 | 70,628 | ||||||
|
| |||||||
Insurance – 0.7% | ||||||||
American International Group, Inc. | 55 | 60,497 | ||||||
| ALLIANCEBERNSTEIN TAX-AWARE FIXED INCOME PORTFOLIO • | 17 |
Portfolio of Investments
| Principal Amount (000) | U.S. $ Value | |||||||
| ||||||||
Prudential Financial, Inc. | $ | 50 | $ | 51,724 | ||||
|
| |||||||
| 112,221 | ||||||||
|
| |||||||
REITS – 0.6% | ||||||||
HCP, Inc. | 50 | 51,773 | ||||||
Health Care REIT, Inc. | 50 | 51,787 | ||||||
|
| |||||||
| 103,560 | ||||||||
|
| |||||||
Utility – 0.4% | ||||||||
Electric – 0.4% | ||||||||
Constellation Energy Group, Inc. | 60 | 61,353 | ||||||
|
| |||||||
Total Corporates – Investment Grade | 1,065,634 | |||||||
|
| |||||||
INFLATION-LINKED SECURITIES – 1.5% | ||||||||
United States – 1.5% | ||||||||
U.S. Treasury Inflation Index | 246 | 249,952 | ||||||
|
| |||||||
ASSET-BACKED SECURITIES – 1.2% | ||||||||
Credit Cards - Floating Rate – 0.6% | ||||||||
Cabela’s Credit Card Master Note Trust | 100 | 100,688 | ||||||
|
| |||||||
Autos - Fixed Rate – 0.6% | ||||||||
Chrysler Capital Auto Receivables Trust | 100 | 100,036 | ||||||
|
| |||||||
Total Asset-Backed Securities | 200,724 | |||||||
|
| |||||||
COMMERCIAL MORTGAGE-BACKED SECURITY – 0.7% | ||||||||
Non-Agency Fixed Rate CMBS – 0.7% | ||||||||
WF-RBS Commercial Mortgage Trust | 121 | 126,437 | ||||||
|
| |||||||
| 18 | • ALLIANCEBERNSTEIN TAX-AWARE FIXED INCOME PORTFOLIO |
Portfolio of Investments
| Company | Shares | U.S. $ Value | ||||||
| ||||||||
SHORT-TERM INVESTMENTS – 1.1% | ||||||||
Investment Companies – 1.1% | ||||||||
AllianceBernstein Fixed-Income Shares, Inc. –Government STIF Portfolio, 0.07%(d)(e) | 181,223 | $ | 181,223 | |||||
|
| |||||||
Total Investments – 108.1% | 18,273,419 | |||||||
Other assets less liabilities – (8.1)% | (1,366,863 | ) | ||||||
|
| |||||||
Net Assets – 100.0% | $ | 16,906,556 | ||||||
|
| |||||||
| (a) | Security is exempt from registration under Rule 144A of the Securities Act of 1933. These securities are considered liquid and may be resold in transactions exempt from registration, normally to qualified institutional buyers. At October 31, 2014, the aggregate market value of these securities amounted to $686,925 or 4.1% of net assets. |
| (b) | When-Issued or delayed delivery security. |
| (c) | Floating Rate Security. Stated interest rate was in effect at October 31, 2014. |
| (d) | To obtain a copy of the Fund’s financial statements, please go to the Securities and Exchange Commission’s website at www.sec.gov, or call AllianceBernstein at (800) 227-4618. |
| (e) | Investment in affiliated money market mutual fund. The rate shown represents the 7- day yield as of period end. |
As of October 31, 2014, the Portfolio’s percentages of investments in municipal bonds that are insured and in insured municipal bonds that have been pre-refunded or escrowed to maturity are 2.89% and 0.00%, respectively.
Glossary:
AGM – Assured Guaranty Municipal
CMBS – Commercial Mortgage-Backed Securities
REIT – Real Estate Investment Trust
TIPS – Treasury Inflation Protected Security
See notes to financial statements.
| ALLIANCEBERNSTEIN TAX-AWARE FIXED INCOME PORTFOLIO • | 19 |
Portfolio of Investments
STATEMENT OF ASSETS & LIABILITIES
October 31, 2014
| Assets | ||||
Investments in securities, at value | ||||
Unaffiliated issuers (cost $17,503,727) | $ | 18,092,196 | ||
Affiliated issuers (cost $181,223) | 181,223 | |||
Interest receivable | 200,953 | |||
Prepaid expenses | 15,066 | |||
Receivable for capital stock sold | 10,736 | |||
|
| |||
Total assets | 18,500,174 | |||
|
| |||
| Liabilities | ||||
Due to custodian | 2,921 | |||
Payable for investment securities purchased | 1,439,158 | |||
Advisory fee payable | 26,994 | |||
Dividends payable | 17,460 | |||
Transfer Agent fee payable | 2,999 | |||
Distribution fee payable | 805 | |||
Payable for capital stock redeemed | 500 | |||
Accrued expenses | 102,781 | |||
|
| |||
Total liabilities | 1,593,618 | |||
|
| |||
Net Assets | $ | 16,906,556 | ||
|
| |||
| Composition of Net Assets | ||||
Capital stock, at par | $ | 1,608 | ||
Additional paid-in capital | 16,290,068 | |||
Undistributed net investment income | 4,558 | |||
Accumulated net realized gain on investment transactions | 21,853 | |||
Net unrealized appreciation on investments | 588,469 | |||
|
| |||
| $ | 16,906,556 | |||
|
|
Net Asset Value Per Share—18 billion shares of capital stock authorized, $ .001 par value
| Class | Net Assets | Shares Outstanding | Net Asset Value | |||||||||
| ||||||||||||
| A | $ | 1,954,410 | 185,891 | $ | 10.51 | * | ||||||
| ||||||||||||
| C | $ | 368,566 | 35,044 | $ | 10.52 | |||||||
| ||||||||||||
| Advisor | $ | 14,583,580 | 1,386,855 | $ | 10.52 | |||||||
| ||||||||||||
| * | The maximum offering price per share for Class A shares was $10.84 which reflects a sales charge of 3.0%. |
See notes to financial statements.
| 20 | • ALLIANCEBERNSTEIN TAX-AWARE FIXED INCOME PORTFOLIO |
Statement of Assets & Liabilities
STATEMENT OF OPERATIONS
For the Period December 11, 2013(a) to October 31, 2014
| Investment Income | ||||||||
Interest | $ | 268,574 | ||||||
Dividends—Affiliated issuers | 1,086 | $ | 269,660 | |||||
|
| |||||||
| Expenses | ||||||||
Advisory fee (see Note B) | 58,177 | |||||||
Distribution fee—Class A | 1,610 | |||||||
Distribution fee—Class C | 1,093 | |||||||
Transfer agency—Class A | 739 | |||||||
Transfer agency—Class C | 164 | |||||||
Transfer agency—Advisor Class | 16,054 | |||||||
Amortization of offering expenses | 121,841 | |||||||
Custodian | 67,164 | |||||||
Administrative | 56,885 | |||||||
Audit and tax | 43,457 | |||||||
Registration fees | 33,270 | |||||||
Legal | 23,834 | |||||||
Printing | 8,912 | |||||||
Directors’ fees | 6,104 | |||||||
Miscellaneous | 4,613 | |||||||
|
| |||||||
Total expenses | 443,917 | |||||||
Less: expenses waived and reimbursed by the Adviser | (377,117 | ) | ||||||
|
| |||||||
Net expenses | 66,800 | |||||||
|
| |||||||
Net investment income | 202,860 | |||||||
|
| |||||||
| Realized and Unrealized Gain on Investment Transactions | ||||||||
Net realized gain on investment transactions | 21,853 | |||||||
Net change in unrealized appreciation/depreciation of investments | 588,469 | |||||||
|
| |||||||
Net gain on investment transactions | 610,322 | |||||||
|
| |||||||
Net Increase in Net Assets from Operations | $ | 813,182 | ||||||
|
|
| (a) | Commencement of operations. |
See notes to financial statements.
| ALLIANCEBERNSTEIN TAX-AWARE FIXED INCOME PORTFOLIO • | 21 |
Statement of Operations
STATEMENT OF CHANGES IN NET ASSETS
| December 11, 2013(a) to October 31, 2014 | ||||
| Increase in Net Assets from Operations | ||||
Net investment income | $ | 202,860 | ||
Net realized gain on investment transactions | 21,853 | |||
Net change in unrealized appreciation/depreciation of investments | 588,469 | |||
|
| |||
Net increase in net assets from operations | 813,182 | |||
| Dividends to Shareholders from | ||||
Net investment income | ||||
Class A | (8,422 | ) | ||
Class C | (900 | ) | ||
Advisor Class | (193,956 | ) | ||
| Capital Stock Transactions | ||||
Net increase | 16,296,652 | |||
|
| |||
Total increase | 16,906,556 | |||
| Net Assets | ||||
Beginning of period | – 0 | – | ||
|
| |||
End of period (including undistributed net investment income of $4,558) | $ | 16,906,556 | ||
|
| |||
| (a) | Commencement of operations. |
See notes to financial statements.
| 22 | • ALLIANCEBERNSTEIN TAX-AWARE FIXED INCOME PORTFOLIO |
Statement of Changes in Net Assets
NOTES TO FINANCIAL STATEMENTS
October 31, 2014
NOTE A
Significant Accounting Policies
AllianceBernstein Bond Fund, Inc. (the “Fund”) is registered under the Investment Company Act of 1940 as an open-end management investment company. The Fund, which is a Maryland corporation, operates as a series company currently comprised of nine portfolios currently in operation: the Intermediate Bond Portfolio, the Bond Inflation Strategy Portfolio, the Municipal Bond Inflation Strategy Portfolio, the Real Asset Strategy Portfolio, the Government Reserves Portfolio, the Tax-Aware Fixed Income Portfolio, the Limited Duration High Income Portfolio, the AllianceBernstein Credit Long/Short Portfolio and the AllianceBernstein High Yield Portfolio. They are each diversified Portfolios, with the exception of the Limited Duration High Income Portfolio, which is non-diversified. The Government Reserves Portfolio commenced operations on May 1, 2013. The Tax-Aware Fixed Income Portfolio commenced operations on December 11, 2013. The AllianceBernstein Credit Long/Short commenced operations on May 7, 2014. The AllianceBernstein High Yield Portfolio commenced operations on July 5, 2014. Each Portfolio is considered to be a separate entity for financial reporting and tax purposes. This report relates only to the Tax-Aware Fixed Income Portfolio (the “Portfolio”). The Portfolio has authorized the issuance of Class A, Class B, Class C, Advisor Class, Class 1 and Class 2 shares. Class B, Class 1 and Class 2 shares are not currently being offered. Class A shares are sold with a front-end sales charge of up to 3.0% for purchases not exceeding $1,000,000. With respect to purchases of $1,000,000 or more, Class A shares redeemed within one year of purchase may be subject to a contingent deferred sales charge of 1%. Class C shares are subject to a contingent deferred sales charge of 1% on redemptions made within the first year after purchase. Advisor Class shares are sold without any initial or contingent deferred sales charge and are not subject to ongoing distribution expenses. All six classes of shares have identical voting, dividend, liquidation and other rights, except that the classes bear different distribution and transfer agency expenses. Each class has exclusive voting rights with respect to its distribution plan. The financial statements have been prepared in conformity with U.S. generally accepted accounting principles (“U.S. GAAP”) which require management to make certain estimates and assumptions that affect the reported amounts of assets and liabilities in the financial statements and amounts of income and expenses during the reporting period. Actual results could differ from those estimates. The following is a summary of significant accounting policies followed by the Portfolio.
1. Security Valuation
Portfolio securities are valued at their current market value determined on the basis of market quotations or, if market quotations are not readily available or are deemed unreliable, at “fair value” as determined in accordance with procedures established by and under the general supervision of the Fund’s Board of Directors (the “Board”).
| ALLIANCEBERNSTEIN TAX-AWARE FIXED INCOME PORTFOLIO • | 23 |
Notes to Financial Statements
In general, the market values of securities which are readily available and deemed reliable are determined as follows: securities listed on a national securities exchange (other than securities listed on the NASDAQ Stock Market, Inc. (“NASDAQ”)) or on a foreign securities exchange are valued at the last sale price at the close of the exchange or foreign securities exchange. If there has been no sale on such day, the securities are valued at the last traded price from the previous day. Securities listed on more than one exchange are valued by reference to the principal exchange on which the securities are traded; securities listed only on NASDAQ are valued in accordance with the NASDAQ Official Closing Price; listed or over the counter (“OTC”) market put or call options are valued at the mid level between the current bid and ask prices. If either a current bid or current ask price is unavailable, AllianceBernstein L.P. (the “Adviser”) will have discretion to determine the best valuation (e.g. last trade price in the case of listed options); open futures are valued using the closing settlement price or, in the absence of such a price, the most recent quoted bid price. If there are no quotations available for the day of valuation, the last available closing settlement price is used; U.S. government securities and other debt instruments having 60 days or less remaining until maturity are valued at amortized cost if their original maturity was 60 days or less. If the original term to maturity exceeded 60 days, the securities are valued by a pricing service, if a market price is available. If a market price is not available, the securities are valued by using amortized cost as of the 61st day prior to maturity. Fixed-income securities, including mortgage-backed and asset-backed securities, may be valued on the basis of prices provided by a pricing service or at a price obtained from one or more of the major broker-dealers. In cases where broker-dealer quotes are obtained, the Adviser may establish procedures whereby changes in market yields or spreads are used to adjust, on a daily basis, a recently obtained quoted price on a security. Swaps and other derivatives are valued daily, primarily using independent pricing services, independent pricing models using market inputs, as well as third party broker-dealers or counterparties. Investment companies are valued at their net asset value each day.
Securities for which market quotations are not readily available (including restricted securities) or are deemed unreliable are valued at fair value. Factors considered in making this determination may include, but are not limited to, information obtained by contacting the issuer, analysts, analysis of the issuer’s financial statements or other available documents. In addition, the Portfolio may use fair value pricing for securities primarily traded in non-U.S. markets because most foreign markets close well before the Portfolio values its securities at 4:00 p.m., Eastern Time. The earlier close of these foreign markets gives rise to the possibility that significant events, including broad market moves, may have occurred in the interim and may materially affect the value of those securities.
2. Fair Value Measurements
In accordance with U.S. GAAP regarding fair value measurements, fair value is defined as the price that the Portfolio would receive to sell an asset or pay to
| 24 | • ALLIANCEBERNSTEIN TAX-AWARE FIXED INCOME PORTFOLIO |
Notes to Financial Statements
transfer a liability in an orderly transaction between market participants at the measurement date. U.S. GAAP establishes a framework for measuring fair value, and a three-level hierarchy for fair value measurements based upon the transparency of inputs to the valuation of an asset or liability (including those valued based on their market values as described in Note A.1 above). Inputs may be observable or unobservable and refer broadly to the assumptions that market participants would use in pricing the asset or liability. Observable inputs reflect the assumptions market participants would use in pricing the asset or liability based on market data obtained from sources independent of the Portfolio. Unobservable inputs reflect the Portfolio’s own assumptions about the assumptions that market participants would use in pricing the asset or liability based on the best information available in the circumstances. Each investment is assigned a level based upon the observability of the inputs which are significant to the overall valuation. The three-tier hierarchy of inputs is summarized below.
| • | Level 1—quoted prices in active markets for identical investments |
| • | Level 2—other significant observable inputs (including quoted prices for similar investments, interest rates, prepayment speeds, credit risk, etc.) |
| • | Level 3—significant unobservable inputs (including the Portfolio’s own assumptions in determining the fair value of investments) |
The fair value of debt instruments, such as bonds, and over-the-counter derivatives is generally based on market price quotations, recently executed market transactions (where observable) or industry recognized modeling techniques and are generally classified as Level 2. Pricing vendor inputs to Level 2 valuations may include quoted prices for similar investments in active markets, interest rate curves, coupon rates, currency rates, yield curves, option adjusted spreads, default rates, credit spreads and other unique security features in order to estimate the relevant cash flows which are then discounted to calculate fair values. If these inputs are unobservable and significant to the fair value, these investments will be classified as Level 3. In addition, non-agency rated investments are classified as Level 3.
Valuations of mortgage-backed or other asset-backed securities, by pricing vendors, are based on both proprietary and industry recognized models and discounted cash flow techniques. Significant inputs to the valuation of these instruments are value of the collateral, the rates and timing of delinquencies, the rates and timing of prepayments, and default and loss expectations, which are driven in part by housing prices for residential mortgages. Significant inputs are determined based on relative value analyses, which incorporate comparisons to instruments with similar collateral and risk profiles, including relevant indices. Mortgage and asset-backed securities for which management has collected current observable data through pricing services are generally categorized within Level 2. Those investments for which current observable data has not been provided are classified as Level 3.
Other fixed income investments, including non-U.S. government and corporate debt, are generally valued using quoted market prices, if available, which are typically impacted by current interest rates, maturity dates and any perceived credit risk of the issuer. Additionally, in the absence of quoted market prices, these inputs are used by pricing vendors to derive a valuation based upon
| ALLIANCEBERNSTEIN TAX-AWARE FIXED INCOME PORTFOLIO • | 25 |
Notes to Financial Statements
industry or proprietary models which incorporate issuer specific data with relevant yield/spread comparisons with more widely quoted bonds with similar key characteristics. Those investments for which there are observable inputs are classified as Level 2. Where the inputs are not observable, the investments are classified as Level 3.
The following table summarizes the valuation of the Portfolio’s investments by the above fair value hierarchy levels as of October 31, 2014:
Investments in | Level 1 | Level 2 | Level 3 | Total | ||||||||||||
Assets: | ||||||||||||||||
Long-Term Municipal Bonds | $ | – 0 | – | $ | 13,558,117 | $ | 1,151,817 | $ | 14,709,934 | |||||||
Governments - Treasuries | – 0 | – | 1,739,515 | – 0 | – | 1,739,515 | ||||||||||
Corporates - Investment Grade | – 0 | – | 1,065,634 | – 0 | – | 1,065,634 | ||||||||||
Inflation-Linked Securities | – 0 | – | 249,952 | – 0 | – | 249,952 | ||||||||||
Asset-Backed Securities | – 0 | – | 200,724 | – 0 | – | 200,724 | ||||||||||
Commercial Mortgage-Backed Security | – 0 | – | 126,437 | – 0 | – | 126,437 | ||||||||||
Short-Term Investments | 181,223 | – 0 | – | – 0 | – | 181,223 | ||||||||||
|
|
|
|
|
|
|
| |||||||||
Total Investments in Securities | 181,223 | 16,940,379 | 1,151,817 | 18,273,419 | ||||||||||||
Other Financial Instruments* | – 0 | – | – 0 | – | – 0 | – | – 0 | – | ||||||||
|
|
|
|
|
|
|
| |||||||||
Total^ | $ | 181,223 | $ | 16,940,379 | $ | 1,151,817 | $ | 18,273,419 | ||||||||
|
|
|
|
|
|
|
| |||||||||
| * | Other financial instruments are derivative instruments, such as futures, forwards and swaps, which are valued at the unrealized appreciation/depreciation on the instrument. |
| ^ | There were no transfers between Level 1 and Level 2 during the reporting period. |
The Portfolio recognizes all transfers between levels of the fair value hierarchy assuming the financial instruments were transferred at the beginning of the reporting period.
The following is a reconciliation of investments in which significant unobservable inputs (Level 3) were used in determining fair value.
| Long-Term Municipal Bonds | Total | |||||||
Balance as of 12/11/13^^ | $ | – 0 | – | $ | – 0 | – | ||
Accrued discounts/(premiums) | 960 | 960 | ||||||
Realized gain (loss) | – 0 | – | – 0 | – | ||||
Change in unrealized appreciation/depreciation | 74,962 | 74,962 | ||||||
Purchases | 929,887 | 929,887 | ||||||
Sales | – 0 | – | – 0 | – | ||||
Transfers in to Level 3 | 146,008 | 146,008 | ||||||
Transfers out of Level 3 | – 0 | – | – 0 | – | ||||
|
|
|
| |||||
Balance as of 10/31/14 | $ | 1,151,817 | $ | 1,151,817 | + | |||
|
|
|
| |||||
Net change in unrealized appreciation/depreciation from Investments held as of 10/31/14* | $ | 74,962 | $ | 74,962 | ||||
|
|
|
| |||||
| ^^ | Commencement of operations. |
| * | The unrealized appreciation/depreciation is included in net change in unrealized appreciation/depreciation of investments in the accompanying statement of operations. |
| + | There were de minimis transfers under 1% of net assets during the reporting period. |
| 26 | • ALLIANCEBERNSTEIN TAX-AWARE FIXED INCOME PORTFOLIO |
Notes to Financial Statements
As of October 31, 2014, all level 3 securities were priced by third party vendors.
The Adviser has established a Valuation Committee (the “Committee”) which is responsible for overseeing the pricing and valuation of all securities held in the Portfolio. The Committee operates under pricing and valuation policies and procedures established by the Adviser and approved by the Board, including pricing policies which set forth the mechanisms and processes to be employed on a daily basis to implement these policies and procedures. In particular, the pricing policies describe how to determine market quotations for securities and other instruments. The Committee’s responsibilities include: 1) fair value and liquidity determinations (and oversight of any third parties to whom any responsibility for fair value and liquidity determinations is delegated), and 2) regular monitoring of the Adviser’s pricing and valuation policies and procedures and modification or enhancement of these policies and procedures (or recommendation of the modification of these policies and procedures) as the Committee believes appropriate.
The Committee is also responsible for monitoring the implementation of the pricing policies by the Adviser’s Pricing Group (the “Pricing Group”) and a third party which performs certain pricing functions in accordance with the pricing policies. The Pricing Group is responsible for the oversight of the third party on a day-to-day basis. The Committee and the Pricing Group perform a series of activities to provide reasonable assurance of the accuracy of prices including: 1) periodic vendor due diligence meetings, review of methodologies, new developments and processes at vendors, 2) daily comparison of security valuation versus prior day for all securities that exceeded established thresholds, and 3) daily review of unpriced, stale, and variance reports with exceptions reviewed by senior management and the Committee.
In addition, several processes outside of the pricing process are used to monitor valuation issues including: 1) performance and performance attribution reports are monitored for anomalous impacts based upon benchmark performance, and 2) portfolio managers review all portfolios for performance and analytics (which are generated using the Adviser’s prices).
3. Currency Translation
Assets and liabilities denominated in foreign currencies and commitments under forward currency exchange contracts are translated into U.S. dollars at the mean of the quoted bid and ask prices of such currencies against the U.S. dollar. Purchases and sales of portfolio securities are translated into U.S. dollars at the rates of exchange prevailing when such securities were acquired or sold. Income and expenses are translated into U.S. dollars at rates of exchange prevailing when accrued.
Net realized gain or loss on foreign currency transactions represents foreign exchange gains and losses from sales and maturities of foreign fixed income investments, foreign currency exchange contracts, holding of foreign currencies,
| ALLIANCEBERNSTEIN TAX-AWARE FIXED INCOME PORTFOLIO • | 27 |
Notes to Financial Statements
currency gains or losses realized between the trade and settlement dates on foreign investment transactions, and the difference between the amounts of dividends, interest and foreign withholding taxes recorded on the Portfolio’s books and the U.S. dollar equivalent amounts actually received or paid. Net unrealized currency gains and losses from valuing foreign currency denominated assets and liabilities at period end exchange rates are reflected as a component of net unrealized appreciation or depreciation of foreign currency denominated assets and liabilities.
4. Taxes
It is the Portfolio’s policy to meet the requirements of the Internal Revenue Code applicable to regulated investment companies and to distribute all of its investment company taxable income and net realized gains, if any, to shareholders. Therefore, no provisions for federal income or excise taxes are required. The Portfolio may be subject to taxes imposed by countries in which it invests. Such taxes are generally based on income and/or capital gains earned or repatriated. Taxes are accrued and applied to net investment income, net realized gains and net unrealized appreciation/depreciation as such income and/or gains are earned.
In accordance with U.S. GAAP requirements regarding accounting for uncertainties in income taxes, management has analyzed the Portfolio’s tax positions taken or expected to be taken on federal and state income tax returns for the current tax year and has concluded that no provision for income tax is required in the Portfolio’s financial statements.
5. Investment Income and Investment Transactions
Dividend income is recorded on the ex-dividend date or as soon as the Portfolio is informed of the dividend. Interest income is accrued daily. Investment transactions are accounted for on the date the securities are purchased or sold. Investment gains or losses are determined on the identified cost basis. The Portfolio amortizes premiums and accretes discounts as adjustments to interest income.
6. Class Allocations
All income earned and expenses incurred by the Portfolio are borne on a pro-rata basis by each outstanding class of shares, based on the proportionate interest in the Portfolio represented by the net assets of such class, except for class specific expenses which are allocated to the respective class. Expenses of the Fund are charged proportionately to each Portfolio or based on other appropriate methods. Realized and unrealized gains and losses are allocated among the various share classes based on respective net assets.
7. Dividends and Distributions
Dividends and distributions to shareholders, if any, are recorded on the ex-dividend date. Income dividends and capital gains distributions are determined in accordance with federal tax regulations and may differ from those determined in accordance with U.S. GAAP. To the extent these differences are permanent, such amounts are reclassified within the capital accounts based on their federal tax basis treatment; temporary differences do not require such reclassification.
| 28 | • ALLIANCEBERNSTEIN TAX-AWARE FIXED INCOME PORTFOLIO |
Notes to Financial Statements
8. Offering Expenses
Offering expenses of $136,907 have been deferred and are being amortized on a straight line basis over a one year period starting from December 11, 2013 (commencement of the Portfolio’s operations).
NOTE B
Advisory Fee and Other Transactions with Affiliates
Under the terms of the investment advisory agreement, the Portfolio pays the Adviser a management fee at an annual rate of .50% of the Portfolio’s average daily net assets. The Adviser has agreed to waive its fees and bear certain expenses to the extent necessary to limit total operating expenses on an annual basis to .85%, 1.55% and .55%, of average daily net assets for Class A, Class C and Advisor Class shares, respectively. Under the agreement, fees waived and expenses borne by the Adviser are subject to repayment by the Portfolio until December 11, 2016. No repayment will be made that would cause the Portfolio’s total annualized operating expenses to exceed the net fee percentage set forth above or would exceed the amount of offering expenses as recorded by the Portfolio on or before December 11, 2014. This fee waiver and/or expense reimbursement agreement may not be terminated before December 11, 2014. For the period ended October 31, 2014, such reimbursements/waivers amounted to $320,232.
Pursuant to the investment advisory agreement, the Portfolio may reimburse the Adviser for certain legal and accounting services provided to the Portfolio by the Adviser. For the period ended October 31, 2014, the Adviser voluntarily agreed to waive such fees in the amount of $56,885.
The Portfolio compensates AllianceBernstein Investor Services, Inc. (“ABIS”), a wholly-owned subsidiary of the Adviser, under a Transfer Agency Agreement for providing personnel and facilities to perform transfer agency services for the Portfolio. ABIS may make payments to intermediaries that provide omnibus account services, sub-accounting services and/or networking services. Such compensation retained by ABIS amounted to $15,037 for the period ended October 31, 2014.
AllianceBernstein Investments, Inc. (the “Distributor”), a wholly-owned subsidiary of the Adviser, serves as the distributor of the Portfolio’s shares. The Distributor has advised the Portfolio that it has retained front-end sales charges of $-0- from the sale of Class A shares and received $-0- and $10 in contingent deferred sales charges imposed upon redemptions by shareholders of Class A and Class C shares, respectively, for the period ended October 31, 2014.
The Portfolio may invest in the AllianceBernstein Fixed-Income Shares, Inc.— Government STIF Portfolio (“Government STIF Portfolio”), an open-end management investment company managed by the Adviser. The Government STIF Portfolio is offered as a cash management option to mutual funds and
| ALLIANCEBERNSTEIN TAX-AWARE FIXED INCOME PORTFOLIO • | 29 |
Notes to Financial Statements
other institutional accounts of the Adviser, and is not available for direct purchase by members of the public. The Government STIF Portfolio pays no investment management fees but does bear its own expenses. A summary of the Portfolio’s transactions in shares of the Government STIF Portfolio for the period ended October 31, 2014 is as follows:
Market Value | Purchases at Cost (000) | Sales Proceeds (000) | Market Value October 31, 2014 (000) | Dividend Income (000) | ||||||||||||||
| $ – 0 | – | $ | 18,289 | $ | 18,108 | $ | 181 | $ | 1 | |||||||||
| (a) | Commencement of operations. |
Brokerage commissions paid on investment transactions for the period ended October 31, 2014 amounted to $0, of which $0 and $0, respectively, was paid to Sanford C. Bernstein & Co. LLC and Sanford C. Bernstein Limited, affiliates of the Adviser.
NOTE C
Distribution Services Agreement
The Portfolio has adopted a Distribution Services Agreement (the “Agreement”) pursuant to Rule 12b-1 under the Investment Company Act of 1940. Under the Agreement, the Portfolio pays distribution and servicing fees to the Distributor at an annual rate of up to .30% of the Portfolio’s average daily net assets attributable to Class A shares and 1% of the Portfolio’s average daily net assets attributable to Class C shares. The fees are accrued daily and paid monthly. The Agreement provides that the Distributor will use such payments in their entirety for distribution assistance and promotional activities. Since the commencement of the Portfolio’s operations, the Distributor has incurred expenses in excess of the distribution costs reimbursed by the Portfolio in the amount of $2,719 for Class C shares. While such costs may be recovered from the Portfolio in future periods so long as the Agreement is in effect, the rate of the distribution and servicing fees payable under the Agreement may not be increased without a shareholder vote. In accordance with the Agreement, there is no provision for recovery of unreimbursed distribution costs incurred by the Distributor beyond the current fiscal year for Class A shares. The Agreement also provides that the Adviser may use its own resources to finance the distribution of the Portfolio’s shares.
NOTE D
Investment Transactions
Purchases and sales of investment securities (excluding short-term investments) for the period ended October 31, 2014 were as follows:
| Purchases | Sales | |||||||
Investment securities (excluding | $ | 17,299,567 | $ | 1,660,020 | ||||
U.S. government securities | 3,988,362 | 3,131,279 | ||||||
| 30 | • ALLIANCEBERNSTEIN TAX-AWARE FIXED INCOME PORTFOLIO |
Notes to Financial Statements
The cost of investments for federal income tax purposes, gross unrealized appreciation and unrealized depreciation are as follows:
Cost | $ | 17,685,642 | ||
|
| |||
Gross unrealized appreciation | $ | 610,999 | ||
Gross unrealized depreciation | (23,222 | ) | ||
|
| |||
Net unrealized appreciation | $ | 587,777 | ||
|
|
1. Derivative Financial Instruments
The Portfolio may use derivatives in an effort to earn income and enhance returns, to replace more traditional direct investments, to obtain exposure to otherwise inaccessible markets (collectively, “investment purposes”), or to hedge or adjust the risk profile of its portfolio.
The Portfolio did not engage in derivatives transactions for the period ended October 31, 2014.
2. Currency Transactions
The Portfolio may invest in non-U.S. dollar securities on a currency hedged or unhedged basis. The Portfolio may seek investment opportunities by taking long or short positions in currencies through the use of currency-related derivatives, including forward currency exchange contracts, futures and options on futures, swaps, and other options. The Portfolio may enter into transactions for investment opportunities when it anticipates that a foreign currency will appreciate or depreciate in value but securities denominated in that currency are not held by the Portfolio and do not present attractive investment opportunities. Such transactions may also be used when the Adviser believes that it may be more efficient than a direct investment in a foreign currency-denominated security. The Portfolio may also conduct currency exchange contracts on a spot basis (i.e., for cash at the spot rate prevailing in the currency exchange market for buying or selling currencies).
| ALLIANCEBERNSTEIN TAX-AWARE FIXED INCOME PORTFOLIO • | 31 |
Notes to Financial Statements
NOTE E
Capital Stock
Each class consists of 3,000,000,000 authorized shares. Transactions in capital shares for each class were as follows:
| Shares | Amount | |||||||||||
| December 11, 2013(a) to October 31, 2014 | December 11, 2013(a) to October 31, 2014 | |||||||||||
|
| |||||||||||
| Class A | ||||||||||||
Shares sold | 186,230 | $ | 1,934,806 | |||||||||
| ||||||||||||
Shares issued in reinvestment of dividends | 153 | 1,594 | ||||||||||
| ||||||||||||
Shares redeemed | (492 | ) | (5,039 | ) | ||||||||
| ||||||||||||
Net increase | 185,891 | $ | 1,931,361 | |||||||||
| ||||||||||||
| Class C | ||||||||||||
Shares sold | 35,246 | $ | 365,925 | |||||||||
| ||||||||||||
Shares issued in reinvestment of dividends | 22 | 240 | ||||||||||
| ||||||||||||
Shares redeemed | (224 | ) | (2,321 | ) | ||||||||
| ||||||||||||
Net increase | 35,044 | $ | 363,844 | |||||||||
| ||||||||||||
| Advisor Class | ||||||||||||
Shares sold | 1,564,205 | $ | 15,850,833 | |||||||||
| ||||||||||||
Shares issued in reinvestment of dividends | 3,466 | 36,046 | ||||||||||
| ||||||||||||
Shares redeemed | (180,816 | ) | (1,885,432 | ) | ||||||||
| ||||||||||||
Net increase | 1,386,855 | $ | 14,001,447 | |||||||||
| ||||||||||||
| (a) | Commencement of operations. |
At October 31, 2014, the Adviser owns approximately 56.28% of the Portfolio’s outstanding shares.
NOTE F
Risks Involved in Investing in the Portfolio
Municipal Market Risk and Concentration of Credit Risk—This is the risk that special factors may adversely affect the value of municipal securities and have a significant effect on the yield or value of the Portfolio’s investments in municipal securities. These factors include economic conditions, political or legislative changes, uncertainties related to the tax status of municipal securities, or the rights of investors in these securities. Recent adverse economic conditions have not affected the Portfolio’s investments or performance. To the extent that the Portfolio invests more of its assets in a particular state’s municipal securities, the Portfolio may be vulnerable to events adversely affecting that state, including economic, political and regulatory occurrences, court decisions, terrorism and catastrophic natural disasters, such as hurricanes or earthquakes. The Portfolio’s investments in certain municipal securities with principal and interest payments that are made from the revenues of a specific project or facility, and not general tax revenues, may have increased risks. Factors affecting the project or facility, such as local business
| 32 | • ALLIANCEBERNSTEIN TAX-AWARE FIXED INCOME PORTFOLIO |
Notes to Financial Statements
or economic conditions, could have a significant effect on the project’s ability to make payments of principal and interest on these securities.
Credit Risk—An issuer or guarantor of a fixed-income security, or the counterparty to a derivatives or other contract, may be unable or unwilling to make timely payments of interest or principal, or to otherwise honor its obligations. The issuer or guarantor may default, causing a loss of the full principal amount of a security. The degree of risk for a particular security may be reflected in its credit rating. There is the possibility that the credit rating of a fixed-income security may be downgraded after purchase, which may adversely affect the value of the security. Investments in fixed-income securities with lower ratings tend to have a higher probability that an issuer will default or fail to meet its payment obligations.
Interest Rate Risk—Changes in interest rates will affect the value of investments in fixed-income securities. When interest rates rise, the value of investments in fixed-income securities tends to fall and this decrease in value may not be offset by higher income from new investments. Interest rate risk is generally greater for fixed-income securities with longer maturities or durations.
Inflation Risk—This is the risk that the value of assets or income from investments will be less in the future as inflation decreases the value of money. As inflation increases, the real value of the Portfolio’s assets can decline as can the real value of the Portfolio’s distributions. This risk is significantly greater for fixed-income securities with longer maturities.
Derivatives Risk—The Portfolio may enter into derivative transactions such as forwards, options, futures and swaps. Derivatives may be illiquid, difficult to price, and leveraged so that small changes may produce disproportionate losses for the Portfolio, and subject to counterparty risk to a greater degree than more traditional investments. Derivatives may result in significant losses, including losses that are far greater than the value of the derivatives reflected in the statement of assets and liabilities.
Tax Risk—There is no guarantee that all of the Portfolio’s income will remain exempt from federal or state income taxes. From time to time, the U.S. Government and the U.S. Congress consider changes in federal tax law that could limit or eliminate the federal tax exemption for municipal bond income, which would in effect reduce the net income received by shareholders from the Portfolio by increasing taxes on that income. In such event, the Portfolio’s NAV could also decline as yields on municipal bonds, which are typically lower than those on taxable bonds, would be expected to increase to approximately the yield of comparable taxable bonds. Actions or anticipated actions affecting the tax exempt status of municipal bonds could also result in significant shareholder redemptions of Portfolio shares as investors anticipate adverse effects on the Portfolio or seek higher yields to offset the potential loss of the tax deduction. As a result, the Portfolio would be required to maintain higher levels of cash to meet the redemptions, which would negatively affect the Portfolio’s yield.
| ALLIANCEBERNSTEIN TAX-AWARE FIXED INCOME PORTFOLIO • | 33 |
Notes to Financial Statements
Duration Risk—Duration is the measure that relates the expected price volatility of a fixed-income security to changes in interest rates. The duration of a fixed-income security may be shorter than or equal to full maturity of a fixed-income security. Fixed-income securities with longer durations have more risk and will decrease in price as interest rates rise. For example, a fixed-income security with a duration of three years will decrease in value by approximately 3% if interest rates increase by 1%.
Liquidity Risk—Liquidity risk exists when particular investments are difficult to purchase or sell, possibly preventing the Portfolio from selling out of these illiquid or relatively less liquid securities at an advantageous price. Causes of liquidity risk may include low trading volume, lack of a market maker, a large position, heavy redemptions, or legal restrictions that limit or prevent a Portfolio from selling securities or closing derivative positions at desirable prices or opportune times. Over recent years, the capacity of dealers to make markets in fixed income securities has been outpaced by the growth in the size of the fixed income markets. Liquidity risk may be magnified in a rising interest rate environment, where the value and liquidity of fixed income securities generally go down. Derivatives and securities involving substantial market and credit risk tend to involve greater liquidity risk. Because the Portfolio invests in municipal securities, the Portfolio is subject to more liquidity risk because the market for municipal securities is generally smaller than many other markets. Illiquid securities and relatively less liquid securities may also be difficult to value.
Redemption Risk—A Portfolio may experience heavy redemptions that could cause the Portfolio to liquidate its assets at inopportune times or at a loss or depressed value, which could cause the value of your investment to decline.
Below Investment Grade Securities Risk—Investments in fixed-income securities with lower ratings (commonly known as “junk bonds”) tend to have a higher probability that an issuer will default or fail to meet its payment obligations. These securities may be subject to greater price volatility due to such factors as specific corporate developments, interest rate sensitivity, negative performance of the junk bond market generally and less secondary market liquidity.
Indemnification Risk—In the ordinary course of business, the Portfolio enters into contracts that contain a variety of indemnifications. The Portfolio’s maximum exposure under these arrangements is unknown. However, the Portfolio has not had prior claims or losses pursuant to these indemnification provisions and expects the risk of loss thereunder to be remote. Therefore, the Portfolio has not accrued any liability in connection with these indemnification provisions.
NOTE G
Joint Credit Facility
A number of open-end mutual funds managed by the Adviser, including the Portfolio, participate in a $280 million revolving credit facility (the “Facility”)
| 34 | • ALLIANCEBERNSTEIN TAX-AWARE FIXED INCOME PORTFOLIO |
Notes to Financial Statements
intended to provide short-term financing, if necessary, subject to certain restrictions in connection with abnormal redemption activity. Commitment fees related to the Facility are paid by the participating funds and are included in miscellaneous expenses in the statement of operations. The Portfolio was included as a part of the Facility on July 10, 2014. The Portfolio did not utilize the Facility during the period ended October 31, 2014.
NOTE H
Distributions to Shareholders
The tax character of distributions paid during the fiscal period ended October 31, 2014 were as follows:
| 2014 | ||||
Distributions paid from: | ||||
Ordinary income | $ | 5,493 | ||
|
| |||
Total taxable distributions | 5,493 | |||
Tax-exempt distributions | 197,785 | |||
|
| |||
Total distributions paid | $ | 203,278 | ||
|
| |||
As of October 31, 2014, the components of accumulated earnings/(deficit) on a tax basis were as follows:
Undistributed tax exempt income | $ | 35,046 | ||
Undistributed ordinary income | 21,853 | |||
Unrealized appreciation/(depreciation) | 587,777 | (a) | ||
|
| |||
Total accumulated earnings/(deficit) | $ | 644,676 | (b) | |
|
|
| (a) | The difference between book-basis and tax-basis unrealized appreciation/(depreciation) is attributable primarily to the tax treatment of Treasury inflation-protected securities. |
| (b) | The difference between book-basis and tax-basis components of accumulated earnings/(deficit) is attributable primarily to the amortization of offering costs and dividends payable. |
For tax purposes, net capital losses may be carried over to offset future capital gains, if any. Funds are permitted to carry forward capital losses incurred in taxable years beginning after December 22, 2010 for an indefinite period, and such losses will retain their character as either short-term or long-term capital losses. As of October 31, 2014, the Portfolio did not have any capital loss carryforwards.
During the current fiscal period, permanent differences primarily due to the tax treatment of offering costs resulted in a net decrease in distributions in excess of net investment income and a net decrease in additional paid-in capital. These reclassifications had no effect on net assets.
NOTE I
Subsequent Event
Management has evaluated subsequent events for possible recognition or disclosure in the financial statements through the date the financial statements are issued. Management has determined that there are no material events that would require disclosure in the Portfolio’s financial statements through this date.
| ALLIANCEBERNSTEIN TAX-AWARE FIXED INCOME PORTFOLIO • | 35 |
Notes to Financial Statements
FINANCIAL HIGHLIGHTS
Selected Data For A Share Of Capital Stock Outstanding Throughout Each Period
| Class A | ||||
| December 11, 2013(a) to October 31, 2014 | ||||
Net asset value, beginning of period | $ 10.00 | |||
|
| |||
Income From Investment Operations | ||||
Net investment income(b)(c) | .14 | |||
Net realized and unrealized gain on investment transactions | .50 | |||
|
| |||
Net increase in net asset value from operations | .64 | |||
|
| |||
Less: Dividends | ||||
Dividends from net investment income | (.13 | ) | ||
|
| |||
Net asset value, end of period | $ 10.51 | |||
|
| |||
Total Return | ||||
Total investment return based on net asset value(d) | 6.44 | % | ||
Ratios/Supplemental Data | ||||
Net assets, end of period (000’s omitted) | $1,954 | |||
Ratio to average net assets of: | ||||
Expenses, net of waivers/reimbursements^ | .85 | % | ||
Expenses, before waivers/reimbursements^ | 3.59 | % | ||
Net investment income(c)^ | 1.57 | % | ||
Portfolio turnover rate | 42 | % | ||
See footnote summary on page 38.
| 36 | • ALLIANCEBERNSTEIN TAX-AWARE FIXED INCOME PORTFOLIO |
Financial Highlights
Selected Data For A Share Of Capital Stock Outstanding Throughout Each Period
| Class C | ||||
| December 11, 2013(a) to October 31, 2014 | ||||
Net asset value, beginning of period | $ 10.00 | |||
|
| |||
Income From Investment Operations | ||||
Net investment income(b)(c) | .07 | |||
Net realized and unrealized gain on investment transactions | .52 | |||
|
| |||
Net increase in net asset value from operations | .59 | |||
|
| |||
Less: Dividends | ||||
Dividends from net investment income | (.07 | ) | ||
|
| |||
Net asset value, end of period | $ 10.52 | |||
|
| |||
Total Return | ||||
Total investment return based on net asset value(d) | 5.92 | % | ||
Ratios/Supplemental Data | ||||
Net assets, end of period (000’s omitted) | $369 | |||
Ratio to average net assets of: | ||||
Expenses, net of waivers/reimbursements^ | 1.55 | % | ||
Expenses, before waivers/reimbursements^ | 4.33 | % | ||
Net investment income(c)^ | .82 | % | ||
Portfolio turnover rate | 42 | % | ||
See footnote summary on page 38.
| ALLIANCEBERNSTEIN TAX-AWARE FIXED INCOME PORTFOLIO • | 37 |
Financial Highlights
Selected Data For A Share Of Capital Stock Outstanding Throughout Each Period
| Advisor Class | ||||
| December 11, 2013(a) to October 31, 2014 | ||||
Net asset value, beginning of period | $ 10.00 | |||
|
| |||
Income From Investment Operations | ||||
Net investment income(b)(c) | .16 | |||
Net realized and unrealized gain on investment transactions | .52 | |||
|
| |||
Net increase in net asset value from operations | .68 | |||
|
| |||
Less: Dividends | ||||
Dividends from net investment income | (.16 | ) | ||
|
| |||
Net asset value, end of period | $ 10.52 | |||
|
| |||
Total Return | ||||
Total investment return based on net asset value(d) | 6.84 | % | ||
Ratios/Supplemental Data | ||||
Net assets, end of period (000’s omitted) | $14,584 | |||
Ratio to average net assets of: | ||||
Expenses, net of waivers/reimbursements^ | .55 | % | ||
Expenses, before waivers/reimbursements^ | 3.82 | % | ||
Net investment income(c)^ | 1.76 | % | ||
Portfolio turnover rate | 42 | % | ||
| (a) | Commencement of operations. |
| (b) | Based on average shares outstanding. |
| (c) | Net of fees and expenses waived/reimbursed by the Adviser. |
| (d) | Total investment return is calculated assuming an initial investment made at the net asset value at the beginning of the period, reinvestment of all dividends and distributions at net asset value during the period, and redemption on the last day of the period. Initial sales charges or contingent deferred sales charges are not reflected in the calculation of total investment return. Total return does not reflect the deduction of taxes that a shareholder would pay on fund distributions or the redemption of fund shares. Total investment return calculated for a period of less than one year is not annualized. |
| ^ | Annualized. |
See notes to financial statements.
| 38 | • ALLIANCEBERNSTEIN TAX-AWARE FIXED INCOME PORTFOLIO |
Financial Highlights
REPORT OF INDEPENDENT REGISTERED
PUBLIC ACCOUNTING FIRM
To the Board of Directors of AllianceBernstein Bond Fund, Inc. and Shareholders of the AllianceBernstein Tax-Aware Fixed Income Portfolio
We have audited the accompanying statement of assets and liabilities, including the portfolio of investments, of AllianceBernstein Tax-Aware Fixed Income Portfolio (one of the portfolios constituting AllianceBernstein Bond Fund, Inc. (the “Fund”)), as of October 31, 2014, and the related statement of operations, statement of changes in net assets, and the financial highlights for the period December 11, 2013 (commencement of operations) through October 31, 2014. These financial statements and financial highlights are the responsibility of the Fund’s management. Our responsibility is to express an opinion on these financial statements and financial highlights based on our audit.
We conducted our audit in accordance with the standards of the Public Company Accounting Oversight Board (United States). Those standards require that we plan and perform the audit to obtain reasonable assurance about whether the financial statements and financial highlights are free of material misstatement. We were not engaged to perform an audit of the Fund’s internal control over financial reporting. Our audit included consideration of internal control over financial reporting as a basis for designing audit procedures that are appropriate in the circumstances, but not for the purpose of expressing an opinion on the effectiveness of the Fund’s internal control over financial reporting. Accordingly, we express no such opinion. An audit also includes examining, on a test basis, evidence supporting the amounts and disclosures in the financial statements and financial highlights, assessing the accounting principles used and significant estimates made by management, and evaluating the overall financial statement presentation. Our procedures included confirmation of securities owned as of October 31, 2014, by correspondence with the custodian and others or by other appropriate auditing procedures where replies from others were not received. We believe that our audit provides a reasonable basis for our opinion.
In our opinion, the financial statements and financial highlights referred to above present fairly, in all material respects, the financial position of the AllianceBernstein Tax-Aware Fixed Income Portfolio (one of the portfolios constituting the AllianceBernstein Bond Fund, Inc.) at October 31, 2014, and the results of its operations, the changes in its net assets, and financial highlights for the period December 11, 2013 (commencement of operations) through October 31, 2014, in conformity with U.S. generally accepted accounting principles.

New York, New York
December 26, 2014
| ALLIANCEBERNSTEIN TAX-AWARE FIXED INCOME PORTFOLIO • | 39 |
Report of Independent Registered Public Accounting Firm
2014 FEDERAL TAX INFORMATION
(unaudited)
For Federal income tax purposes, the following information is furnished with respect to the distributions paid by the Portfolio during the taxable period ended October 31, 2014. For foreign shareholders, 21.60% of ordinary dividends paid may be considered to be qualifying to be taxed as interest-related dividends.
Shareholders should not use the above information to prepare their income tax returns. The information necessary to complete your income tax returns will be included with your Form 1099-DIV which will be sent to you separately in January 2015.
| 40 | • ALLIANCEBERNSTEIN TAX-AWARE FIXED INCOME PORTFOLIO |
BOARD OF DIRECTORS
Marshall C. Turner, Jr.(1), Chairman John H. Dobkin(1) Michael J. Downey(1) William H. Foulk, Jr.(1) D. James Guzy(1) | Nancy P. Jacklin(1) Robert M. Keith, President and Chief Executive Officer Garry L. Moody(1) Earl D. Weiner(1) |
OFFICERS
Philip L. Kirstein, Senior Vice President and Independent Compliance Officer Robert “Guy” B. Davidson III(2), Vice President Jon P. Denfeld(2), Vice President Terrance T. Hults(2), Vice President | Shawn E. Keegan(2), Vice President Emilie D. Wrapp, Secretary Joseph J. Mantineo, Treasurer and Chief Financial Officer Phyllis J. Clarke, Controller Vincent S. Noto, Chief Compliance Officer |
Custodian and Accounting Agent State Street Bank and Trust Company State Street Corporation CCB/5 1 Iron Street Boston, MA 02210
Principal Underwriter AllianceBernstein Investments, Inc. 1345 Avenue of the Americas New York, NY 10105
Transfer Agent AllianceBernstein Investor Services, Inc. P.O. Box 786003 San Antonio, TX 78278-6003 Toll-Free (800) 221-5672 | Independent Registered Public Accounting Firm Ernst & Young LLP 5 Times Square New York, NY 10036
Legal Counsel Seward & Kissel LLP One Battery Park Plaza New York, NY 10004 |
| (1) | Member of the Audit Committee, the Governance and Nominating Committee and the Independent Directors Committee. |
| (2) | The day-to-day management of, and investment decisions for, the Fund are made by its senior investment management team. Messrs. Davidson, Denfeld, Hults and Keegan are the investment professionals with the most significant responsibility for the day-to-day management of the Fund’s portfolio. |
| ALLIANCEBERNSTEIN TAX-AWARE FIXED INCOME PORTFOLIO • | 41 |
Board of Directors
MANAGEMENT OF THE FUND
Board of Directors Information
The business and affairs of the Fund are managed under the direction of the Board of Directors. Certain information concerning the Fund’s Directors is set forth below.
NAME, ADDRESS*, AGE, (YEAR FIRST ELECTED**) | PRINCIPAL OCCUPATION(S) DURING PAST FIVE YEARS | PORTFOLIOS IN FUND OVERSEEN BY | OTHER DIRECTORSHIPS HELD BY DIRECTOR IN THE PAST FIVE YEARS | |||||
| INTERESTED DIRECTOR | ||||||||
Robert M. Keith, # 1345 Avenue of the Americas New York, NY 10105 54 (2013) | Senior Vice President of AllianceBernstein L.P. (the “Adviser”) and the head of AllianceBernstein Investments, Inc. (“ABI”) since July 2008; Director of ABI and President of the AllianceBernstein Mutual Funds. Previously, he served as Executive Managing Director of ABI from December 2006 to June 2008. Prior to joining ABI in 2006, Executive Managing Director of Bernstein Global Wealth Management, and prior thereto, Senior Managing Director and Global Head of Client Service and Sales of the Adviser’s institutional investment management business since 2004. Prior thereto, he was Managing Director and Head of North American Client Service and Sales in the Adviser’s institutional investment management business, with which he had been associated since prior to 2004. | 117 | None | |||||
| 42 | • ALLIANCEBERNSTEIN TAX-AWARE FIXED INCOME PORTFOLIO |
Management of the Fund
NAME, ADDRESS*, AGE, (YEAR FIRST ELECTED**) | PRINCIPAL OCCUPATION(S) DURING PAST FIVE YEARS | PORTFOLIOS IN FUND OVERSEEN BY | OTHER DIRECTORSHIPS HELD BY DIRECTOR IN THE PAST FIVE YEARS | |||||
| DISINTERESTED DIRECTORS | ||||||||
Marshall C. Turner, Jr., ## Chairman of the Board 73 (2013) | Private Investor since prior to 2009. Former CEO of Dupont Photomasks, Inc. (components of semi-conductor manufacturing), 2003-2006, and interim CEO 1999-2000. He has extensive operating and early-stage investment experience, including prior service as general partner of three institutional venture capital partnerships, and serves on the boards of three education and science-related non-profit organizations. He has served as a director of one AllianceBernstein fund since 1992, and director or trustee of multiple AllianceBernstein funds since 2005. He has been Chairman of the AllianceBernstein Funds since January 2014, and the Chairman of the Independent Directors Committees of such Funds since February 2014. | 117 | Xilinx, Inc. (programmable logic semi-conductors) and SunEdison, Inc. (semi-conductor substrates, solar materials and solar power plants) since prior to 2009 until July 2014 | |||||
John H. Dobkin, ## 72 (2013) | Independent Consultant since prior to 2009. Formerly, President of Save Venice, Inc. (preservation organization) from 2001-2002; Senior Advisor from June 1999-June 2000 and President of Historic Hudson Valley (historic preservation) from December 1989-May 1999. Previously, Director of the National Academy of Design. He has served as a director or trustee of various AllianceBernstein Funds since 1992, and as Chairman of the Audit Committees of a number of such Funds from 2001-2008. | 117 | None | |||||
| ALLIANCEBERNSTEIN TAX-AWARE FIXED INCOME PORTFOLIO • | 43 |
Management of the Fund
NAME, ADDRESS*, AGE, (YEAR FIRST ELECTED**) | PRINCIPAL OCCUPATION(S) DURING PAST FIVE YEARS | PORTFOLIOS IN FUND OVERSEEN BY | OTHER DIRECTORSHIPS HELD BY DIRECTOR IN THE PAST FIVE YEARS | |||||
DISINTERESTED DIRECTORS (continued) | ||||||||
Michael J. Downey, ## 70 (2013) | Private Investor since prior to 2009. Formerly, managing partner of Lexington Capital, LLC (investment advisory firm) from December 1997 until December 2003. From 1987 until 1993, Chairman and CEO of Prudential Mutual Fund Management, director of the Prudential mutual funds, and member of the Executive Committee of Prudential Securities Inc. He has served as a director or trustee of the AllianceBernstein Funds since 2005 and is a director and Chairman of one other registered investment company. | 117 | Asia Pacific Fund, Inc. (registered investment company) since prior to 2009, Prospect Acquisition Corp. (financial services) from 2007 until 2009, and The Merger Fund (registered investment company) since prior to 2009 until 2013 | |||||
William H. Foulk, Jr., ## 82 (2013) | Investment Adviser and an Independent Consultant since prior to 2009. Previously, he was Senior Manager of Barrett Associates, Inc., a registered investment adviser. He was formerly Deputy Comptroller and Chief Investment Officer of the State of New York and, prior thereto, Chief Investment Officer of the New York Bank for Savings. He has served as a director or trustee of various AllianceBernstein Funds since 1983, and was Chairman of the Independent Directors Committees of the AllianceBernstein Funds from 2003 until early February 2014. He served as Chairman of such Funds from 2003 through December 2013. He is also active in a number of mutual fund related organizations and committees. | 117 | None | |||||
| 44 | • ALLIANCEBERNSTEIN TAX-AWARE FIXED INCOME PORTFOLIO |
Management of the Fund
NAME, ADDRESS*, AGE, (YEAR FIRST ELECTED**) | PRINCIPAL OCCUPATION(S) DURING PAST FIVE YEARS | PORTFOLIOS IN FUND OVERSEEN BY | OTHER DIRECTORSHIPS HELD BY DIRECTOR IN THE PAST FIVE YEARS | |||||
DISINTERESTED DIRECTORS (continued) | ||||||||
D. James Guzy, ## 78 (2013) | Chairman of the Board of SRC Computers, Inc. (semi-conductors), with which he has been associated since prior to 2009. He served as Chairman of the Board of PLX Technology (semi-conductors) since prior to 2009 until November 2013. He was a director of Intel Corporation (semi-conductors) from 1969 until 2008, and served as Chairman of the Finance Committee of such company for several years until May 2008. He has served as a director or trustee of one or more of the AllianceBernstein Funds since 1982. | 117 | PLX Technology (semi-conductors) since prior to 2009 until November 2013 and Cirrus Logic Corporation (semi-conductors) since prior to 2009 until July 2011 | |||||
Nancy P. Jacklin, ## 66 (2013) | Professorial Lecturer at the Johns Hopkins School of Advanced International Studies since 2008. Formerly, U.S. Executive Director of the International Monetary Fund (which is responsible for ensuring the stability of the international monetary system), (December 2002-May 2006); Partner, Clifford Chance (1992-2002); Sector Counsel, International Banking and Finance, and Associate General Counsel, Citicorp (1985-1992); Assistant General Counsel (International), Federal Reserve Board of Governors (1982-1985); and Attorney Advisor, U.S. Department of the Treasury (1973-1982). Member of the Bar of the District of Columbia and of New York; and member of the Council on Foreign Relations. She has served as a director or trustee of the AllianceBernstein Funds since 2006 and has been Chairman of the Governance and Nominating Committees of the Funds since August 2014. | 117 | None | |||||
| ALLIANCEBERNSTEIN TAX-AWARE FIXED INCOME PORTFOLIO • | 45 |
Management of the Fund
NAME, ADDRESS*, AGE, (YEAR FIRST ELECTED**) | PRINCIPAL OCCUPATION(S) DURING PAST FIVE YEARS | PORTFOLIOS IN FUND OVERSEEN BY | OTHER DIRECTORSHIPS HELD BY DIRECTOR IN THE PAST FIVE YEARS | |||||
DISINTERESTED DIRECTORS (continued) | ||||||||
Garry L. Moody, ## 62 (2013) | Independent Consultant. Formerly, Partner, Deloitte & Touche LLP (1995-2008) where he held a number of senior positions, including Vice Chairman, and U.S. and Global Investment Management Practice Managing Partner; President, Fidelity Accounting and Custody Services Company (1993-1995); and Partner, Ernst & Young LLP (1975-1993), where he served as the National Director of Mutual Fund Tax Services and Managing Partner of its Chicago Office Tax department. He is a member of both the Governing Council of the Independent Directors Council (IDC), an organization of independent directors of mutual funds, and the Trustee Advisory Board of BoardIQ, a biweekly publication focused on issues and news affecting directors of mutual funds. He has served as a director or trustee, and as Chairman of the Audit Committees, of the AllianceBernstein Funds since 2008. | 117 | None | |||||
Earl D. Weiner, ## 75 (2013) | Of Counsel, and Partner prior to January 2007, of the law firm Sullivan & Cromwell LLP and is a former member of the ABA Federal Regulation of Securities Committee Task Force to draft editions of the Fund Director’s Guidebook. He also serves as a director or trustee of various non-profit organizations and has served as Chairman or Vice Chairman of a number of them. He has served as a director or trustee of the AllianceBernstein Funds since 2007 and served as Chairman of the Governance and Nominating Committees of the AllianceBernstein Funds from 2007 until August 2014. | 117 | None | |||||
| 46 | • ALLIANCEBERNSTEIN TAX-AWARE FIXED INCOME PORTFOLIO |
Management of the Fund
| * | The address for each of the Fund’s disinterested Directors is c/o AllianceBernstein L.P., Attention: Philip L. Kirstein, 1345 Avenue of the Americas, New York, NY 10105. |
| ** | There is no stated term of office for the Fund’s Directors. |
| *** | The information above includes each Director’s principal occupation during the last five years and other information relating to the experience, attributes and skills relevant to each Director’s qualifications to serve as a Director, which led to the conclusion that each Director should serve as a Director for the Fund. |
| # | Mr. Keith is an “interested person” of the Fund, as defined in the 1940 Act, due to his position as a Senior Vice President of the Adviser. |
| ## | Member of the Audit Committee, the Governance and Nominating Committee and the Independent Directors Committee. |
| ALLIANCEBERNSTEIN TAX-AWARE FIXED INCOME PORTFOLIO • | 47 |
Management of the Fund
Officer Information
Certain information concerning the Fund’s Officers is listed below.
| NAME, ADDRESS* AND AGE | POSITION(S) HELD WITH FUND | PRINCIPAL OCCUPATION DURING PAST 5 YEARS | ||
Robert M. Keith 54 | President and Chief Executive Officer | See biography above. | ||
Philip L. Kirstein 69 | Senior Vice President and Independent Compliance Officer | Senior Vice President and Independent Compliance Officer of the AllianceBernstein Funds, with which he has been associated since October 2004. Prior thereto, he was Of Counsel to Kirkpatrick & Lockhart, LLP from October 2003 to October 2004, and General Counsel of Merrill Lynch Investment Managers, L.P. since prior to March 2003. | ||
Robert “Guy” 53 | Vice President | Senior Vice President of the Adviser,** with which he has been associated since prior to 2009. | ||
Jon P. Denfeld 44 | Vice President | Vice President of the Adviser,** with which he has been associated since prior to 2009. | ||
Terrance T. Hults 48 | Vice President | Senior Vice President of the Adviser,** with which he has been associated since prior to 2009. | ||
Shawn E. Keegan 43 | Vice President | Vice President of the Adviser,** with which he has been associated since prior to 2009. | ||
Emilie D. Wrapp 58 | Secretary | Senior Vice President, Assistant General Counsel and Assistant Secretary of ABI,** with which she has been associated since prior to 2009. | ||
Joseph J. Mantineo 55 | Treasurer and Chief Financial Officer | Senior Vice President of AllianceBernstein Investor Services, Inc. (“ABIS”),** with which he has been associated since prior to 2009. | ||
Phyllis J. Clarke 53 | Controller | Vice President of ABIS,** with which she has been associated since prior to 2009. | ||
Vincent S. Noto 50 | Chief Compliance Officer | Vice President and Mutual Fund Chief Compliance Officer of the Adviser** since 2014. Prior thereto, he was Vice President and Director of Mutual Fund Compliance of the Adviser** since 2009. |
| * | The address for the Fund’s Officers is 1345 Avenue of the Americas, New York, NY 10105. |
| ** | The Adviser, ABI and ABIS are affiliates of the Fund. |
| 48 | • ALLIANCEBERNSTEIN TAX-AWARE FIXED INCOME PORTFOLIO |
Management of the Fund
THE FOLLOWING IS NOT PART OF THE SHAREHOLDER REPORT OR THE FINANCIAL STATEMENTS
SUMMARY OF SENIOR OFFICER’S EVALUATION OF INVESTMENT ADVISORY AGREEMENT1
The following is a summary of the evaluation of the Investment Advisory Agreement between AllianceBernstein L.P. (the “Adviser”) and The AllianceBernstein Bond Fund, Inc. (the “Fund”), in respect of AllianceBernstein Tax-Aware Fixed Income Portfolio (the “Portfolio”),2 prepared by Philip L. Kirstein, the Senior Officer of the Fund for the Directors of the Fund, as required by the August 2004 agreement between the Adviser and the New York State Attorney General (the “NYAG”). The Senior Officer’s evaluation of the Investment Advisory Agreement is not meant to diminish the responsibility or authority of the Board of Directors of the Fund to perform its duties pursuant to Section 15 of the Investment Company Act of 1940 (the “40 Act”) and applicable state law. The purpose of the summary is to provide shareholders with a synopsis of the independent evaluation of the reasonableness of the advisory fees proposed to be paid by the Portfolio which was provided to the Directors in connection with their review of the proposed initial approval of the Investment Advisory Agreement.
The Portfolio’s investment objective is to seek the highest available level of after-tax income, without assuming what the Adviser considers to be undue risk. The Portfolio invests principally in a national portfolio of both municipal and taxable fixed-income securities. Under normal circumstances, at least 80% of the Portfolio’s net assets is invested in fixed-income securities, and at least 65% of its total assets in securities exempt from federal income tax. The Portfolio may invest in tender option bonds and credit default swaps relating to municipal and taxable fixed income securities, as well as ETFs. The Portfolio’s average duration is in the 4-6 years range. The Adviser proposed the Barclays Municipal Bond Index to be the primary benchmark for the Portfolio. The Adviser expects Lipper, Inc. (“Lipper”) to place the Portfolio in its General & Insured Municipal Debt Fund category and Morningstar to place the Portfolio in its Intermediate Municipal Debt category.
The Senior Officer’s evaluation considered the following factors:
| 1. | Advisory fees charged to institutional and other clients of the Adviser for like services; |
| 2. | Advisory fees charged by other mutual fund companies for like services; |
| 3. | Costs to the Adviser and its affiliates of supplying services pursuant to the advisory agreement, excluding any intra-corporate profit; |
| 4. | Profit margins of the Adviser and its affiliates from supplying such services; |
| 1 | The information in the fee evaluation was completed on October 24, 2013 and discussed with the Board of Directors on November 5-7, 2013. |
| 2 | Future references to the Portfolio do not include “AllianceBernstein.” |
| ALLIANCEBERNSTEIN TAX-AWARE FIXED INCOME PORTFOLIO • | 49 |
| 5. | Possible economies of scale as the Portfolio grows larger; and |
| 6. | Nature and quality of the Adviser’s services including the performance of the Portfolio. |
These factors, with the exception of the first factor, are generally referred to as the “Gartenberg factors,” which were articulated by the United States Court of Appeals for the Second Circuit in 1982. Gartenberg v. Merrill Lynch Asset Management, Inc., 694 F.2d 923 (2d Cir. 1982). On March 30, 2010, the Supreme Court held the Gartenberg decision was correct in its basic formulation of what Section 36(b) requires: to face liability under Section 36(b), “an investment adviser must charge a fee that is so disproportionately large that it bears no reasonable relationship to the services rendered and could not have been the product of arm’s length bargaining.” Jones v. Harris Associates L.P., 130 S. Ct. 1418 (2010). In the Jones decision, the Court stated the Gartenberg approach fully incorporates the correct understanding of fiduciary duty within the context of Section 36(b) and noted with approval that “Gartenberg insists that all relevant circumstances be taken into account” and “uses the range of fees that might result from arm’s length bargaining as the benchmark for reviewing challenged fees.”3
ADVISORY FEES, NET ASSETS, & EXPENSE RATIOS
The Adviser proposed that the Portfolio pays the advisory fee set forth below for receiving the services to be provided pursuant to the Investment Advisory Agreement.
| Portfolio | Advisory Fee | |
| Tax-Aware Fixed Income Portfolio4 | 0.50% of average daily net assets |
In addition to paying the advisory fee, the Investment Advisory Agreement provides for the Adviser to be reimbursed for providing administrative and accounting services.
The Portfolio’s Expense Limitation Agreement calls for the Adviser to establish expense caps, set forth below, for a one year period after the Portfolio commences operations. Under the Expense Limitation Agreement, the Adviser may be able to recoup all or a portion of the Portfolio’s offering expenses within a three year period after the Portfolio commences operations to the extent that the
| 3 | Jones v. Harris at 1427. |
| 4 | The advisory fee schedule for the Portfolio has a higher effective fee rate than the advisory fee schedule of the Low Risk and High Income categories, in which the Portfolio would have been categorized had the Adviser proposed to implement the NYAG related fee schedule. The advisory fee schedules for the Low Risk and High Income categories are as follows: 0.45% on the first $2.5 billion, 0.40% on the next $2.5 billion, 0.35% on the balance for the Low Income category and 0.50% on the first $2.5 billion, 0.45% on the next $2.5 billion and 0.40% on the balance for the High Income category. |
| 50 | • ALLIANCEBERNSTEIN TAX-AWARE FIXED INCOME PORTFOLIO |
reimbursements do not cause the expense ratios of the Portfolio’s share classes to exceed their expense caps and that the aggregate reimbursements do not exceed the offering expenses.5
| Portfolio | Expense Cap Pursuant to Expense Limitation Undertaking | Estimated Gross Expense Ratio6 | Fiscal Year End | |||||||||
| Tax-Aware Fixed Income Portfolio | Advisor Class A Class C Class 1 Class 2 |
| 0.50 0.85 1.50 0.60 0.50 | % % % % % |
| 0.67 0.97 1.67 0.77 0.67 | % % % % % | To be determined | ||||
| I. | ADVISORY FEES CHARGED TO INSTITUTIONAL AND OTHER CLIENTS |
The advisory fees charged to investment companies which the Adviser manages and sponsors are normally higher than those charged to similar sized institutional accounts, including pension plans and sub-advised investment companies. The fee differential reflects, among other things, different services provided to such clients, and different liabilities assumed. Services to be provided by the Adviser to the Portfolio that are not provided to non-investment company clients and sub-advised investment companies include providing office space and personnel to serve as Fund Officers, who among other responsibilities, make the certifications required under the Sarbanes–Oxley Act of 2002, and coordinating with and monitoring the Portfolio’s third party service providers such as Fund counsel, auditors, custodians, transfer agents and pricing services. The accounting, administrative, legal and compliance requirements for the Portfolio will be more costly than those for institutional assets due to the greater complexities and time required for investment companies, although the Adviser will be reimbursed for providing such services. Managing the cash flow of an investment company may be more difficult than that of a stable pool of assets, such as an institutional account with little cash movement in either direction, particularly if a fund is in net redemption, and the Adviser is frequently forced to sell securities to raise cash for redemptions. However, managing a fund with positive cash flow may be easier at times than managing a stable pool of assets. In recent years, investment advisers have been sued by institutional clients and have suffered reputational damage both by the attendant publicity and outcomes other than complete victories. Accordingly, the legal and reputational risks associated with institutional accounts are greater than previously thought, although still not equal to those related to the mutual fund industry.
Notwithstanding the Adviser’s view that managing an investment company is not comparable to managing other institutional accounts because the services
| 5 | Offering expenses consist principally of the legal, accounting and federal and states securities registration fees paid by the Portfolio. |
| 6 | The Portfolio’s estimated gross expense ratios are based on an initial estimate of the Portfolio’s net assets at $250 million. |
| ALLIANCEBERNSTEIN TAX-AWARE FIXED INCOME PORTFOLIO • | 51 |
provided are different, the Supreme Court has indicated consideration should be given to the advisory fees charged to institutional accounts with a similar investment style as the Portfolio.7 However, the Adviser has represented that there is no category in the Form ADV for institutional products that have a substantially similar investment style as the Portfolio.
The Adviser has represented that it does not provide sub-advisory investment services to other investment companies that have a substantially similar investment style as the Portfolio.
| II. | MANAGEMENT FEES CHARGED BY OTHER MUTUAL FUND COMPANIES FOR LIKE SERVICES. |
Lipper, an analytical service that is not affiliated with the Adviser, compared the fees charged to the Portfolio with fees charged to other investment companies for similar services offered by other investment advisers.8 Lipper’s analysis included the comparison of the Portfolio’s contractual management fee, estimated at an initial asset level of $250 million, to the median of the Portfolio’s Lipper Expense Group (“EG”)9 and the Portfolio’s contractual management fee ranking.10
Lipper describes an EG as a representative sample of comparable funds. Lipper’s standard methodology for screening funds to be included in an EG entails the consideration of several fund criteria, including fund type, investment classification/objective, load type and similar 12b-1/non-12b-1 service fees, asset (size) comparability, expense components and attributes. An EG will typically consist of seven to twenty funds.
| 7 | The Supreme Court stated that “courts may give such comparisons the weight that they merit in light of the similarities and differences between the services that the clients in question require, but the courts must be wary of inapt comparisons.” Among the significant differences the Supreme Court noted that may exist between services provided to mutual funds and institutional accounts are “higher marketing costs.” Jones v. Harris at 1428. |
| 8 | The Supreme Court cautioned against accepting mutual fund fee comparisons without careful scrutiny since “these comparisons are problematic because these fees, like those challenged, may not be the product of negotiations conducted at arm’s length.” Jones v. Harris at 1429. |
| 9 | Lipper does not consider average account size when constructing EGs. Funds with relatively small average account sizes tend to have higher transfer agent expense ratio than comparable sized funds that have relatively large average account sizes. There are limitations to Lipper expense category data because different funds categorize expenses differently. |
| 10 | The contractual management fee is calculated by Lipper using the Portfolio’s contractual management fee rate at a hypothetical asset level. The hypothetical asset level is based on the combined net assets of all classes of the Portfolio, rounded up to the next $25 million. Lipper’s total expense ratio information is based on the most recent annual report except as otherwise noted. A ranking of “1” would mean that Fund had the lowest effective fee rate in the Lipper peer group. |
| 52 | • ALLIANCEBERNSTEIN TAX-AWARE FIXED INCOME PORTFOLIO |
| Portfolio | Contractual Management Fee (%)11 | Lipper Exp. Group Median (%) | Rank | |||||||
| Tax Aware Fixed Income Portfolio | 0.500 | 0.533 | 7/18 | |||||||
Lipper also compared the Portfolio’s projected total expense ratio to the medians of the Portfolio’s EG and Lipper Expense Universe (“EU”). The EU is a broader group compared to the EG, consisting of all funds that have the same investment classification/objective and load type as the subject Portfolio.12 The Portfolio’s total expense ratio ranking is also shown.
| Portfolio | Expense Ratio (%)13 | Lipper Exp. Group Median (%) | Lipper Group Rank | Lipper Exp. Universe Median (%) | Lipper Universe Rank | |||||||||||
| Tax Aware Fixed Income Portfolio | 0.850 | 0.859 | 9/18 | 0.797 | 40/59 | |||||||||||
Based on this analysis, the Portfolio has a more favorable ranking on a contractual management fee basis than on a total expense ratio basis.
| III. | COSTS TO THE ADVISER AND ITS AFFILIATES OF SUPPLYING SERVICES PURSUANT TO THE MANAGEMENT FEE ARRANGEMENT, EXCLUDING ANY INTRA-CORPORATE PROFIT. |
The Adviser utilizes two profitability reporting systems, which operate independently but are aligned with each other, to estimate the Adviser’s profitability in connection with investment advisory services provided to the Portfolio. The Senior Officer has retained a consultant to provide independent advice regarding the alignment of the two profitability systems as well as the methodologies and allocations utilized by both profitability systems. See Section IV for additional discussion.
| IV. | PROFIT MARGINS OF THE ADVISER AND ITS AFFILIATES FOR SUPPLYING SUCH SERVICES. |
The Portfolio has not yet commenced operations. Therefore, there is no historic profitability data with respect to the Adviser’s investment services to the Portfolio.
In addition to the Adviser’s direct profits from managing the Portfolio, certain of the Adviser’s affiliates have business relationships with the Portfolio and may earn a profit from providing other services to the Portfolio. The courts have
| 11 | The contractual management fee does not reflect any expense reimbursements made by the Portfolio to the Adviser for certain clerical, legal, accounting, administrative, and other services. In addition, the contractual management fee does not reflect any advisory fee waivers for expense caps. |
| 12 | Except for asset (size) comparability, Lipper uses the same criteria for selecting an EG peer when selecting an EU peer. Unlike the EG, the EU allows for the same adviser to be represented by more than just one fund. |
| 13 | Projected total expense ratio information pertains to the Portfolio’s Class A shares. |
| ALLIANCEBERNSTEIN TAX-AWARE FIXED INCOME PORTFOLIO • | 53 |
referred to this type of business opportunity as “fall-out benefits” to the Adviser and indicated that such benefits should be factored into the evaluation of the total relationship between the Portfolio and the Adviser. Neither case law nor common business practice precludes the Adviser’s affiliates from earning a reasonable profit on this type of relationship provided the affiliates’ charges and services are competitive and the relationship otherwise complies with the 40 Act restrictions. These affiliates will provide transfer agent and distribution related services to the Portfolio and will receive transfer agent fees, Rule 12b-1 payments, front-end sales loads and contingent deferred sales charges (“CDSC”).
AllianceBernstein Investments, Inc. (“ABI”), an affiliate of the Adviser, is the Fund’s principal underwriter. ABI and the Adviser will disclose in the Portfolio’s prospectus that they may make revenue sharing payments from their own resources, in addition to resources derived from sales loads and Rule 12b-1 fees, to firms that sell shares of the Portfolio. In 2012, ABI paid approximately 0.05% of the average monthly assets of the AllianceBernstein Mutual Funds or approximately $19 million for distribution services and educational support (revenue sharing payments).
| V. | POSSIBLE ECONOMIES OF SCALE |
The Adviser has indicated that economies of scale are being shared with shareholders through pricing to scale, breakpoints, fee reductions/waivers and enhancement to services.
An independent consultant, retained by the Senior Officer, provided the Board of Directors information on the Adviser’s firm-wide average costs from 2005 through 2011 and the potential economies of scale. The independent consultant noted that from 2005 through 2007 the Adviser experienced significant growth in assets under management (“AUM”). During this period, operating expenses increased, in part to keep up with growth, and in part reflecting market returns. However, from 2008 through the first quarter of 2009, AUM rapidly and significantly decreased due to declines in market value and client withdrawals. When AUM rapidly decreased, some operating expenses categories, including base compensation and office space, adjusted more slowly during this period, resulting in an increase in average costs. Since 2009, AUM have experienced less significant changes. The independent consultant noted that changes in operating expenses reflect changes in business composition and business practices in response to changes in financial markets. Finally, the independent consultant concluded that the increase in average cost and the decline in net operating margin across the Adviser since late 2008 are inconsistent with the view that there are currently reductions in average costs due to economies of scale that can be shared with the AllianceBernstein Mutual Funds managed by the Adviser through lower fees.
| 54 | • ALLIANCEBERNSTEIN TAX-AWARE FIXED INCOME PORTFOLIO |
In February 2008, the independent consultant provided the Board of Directors an update of the Deli14 study on advisory fees and various fund characteristics.15 The independent consultant first reiterated the results of his previous two dimensional comparison analysis (fund size and family size) with the Board of Directors.16 The independent consultant then discussed the results of the regression model that was utilized to study the effects of various factors on advisory fees. The regression model output indicated that the bulk of the variation in fees predicted were explained by various factors, but substantially by fund AUM, family AUM, index fund indicator and investment style. The independent consultant also compared the advisory fees of the AllianceBernstein Mutual Funds to similar funds managed by 19 other large asset managers, regardless of the fund size and each Adviser’s proportion of mutual fund assets to non-mutual fund assets.
| VI. | NATURE AND QUALITY OF THE ADVISER’S SERVICES, INCLUDING THE PERFORMANCE OF THE FUND |
With assets under management of approximately $445 billion as of September 30, 2013, the Adviser has the investment experience to manage and provide non-investment services (described in Section I) to the Portfolio.
Since the Portfolio has not yet commenced operations, the Portfolio has no performance history.
CONCLUSION:
Based on the factors discussed above, the Senior Officer’s conclusion is that the Investment Advisory Agreement for the Portfolio is reasonable and within the range of what would have been negotiated at arm’s length in light of all the surrounding circumstances. The Senior Officer recommended that the Directors may want to consider discussing with the Adviser the addition of breakpoints to the Portfolio’s advisory fee schedule. This conclusion in respect of the Portfolio is based on an evaluation of all of these factors and no single factor was dispositive.
Dated: December 5, 2013
| 14 | The Deli study, originally published in 2002 based on 1997 data and updated for the February 2008 Presentation, may be of diminished value due to the age of the data used in the presentation and the changes experienced in the industry over the last four years. |
| 15 | As mentioned previously, the Supreme Court cautioned against accepting mutual fund fee comparisons without careful scrutiny since the fees may not be the product of negotiations conducted at arm’s length. See Jones v. Harris at 1429. |
| 16 | The two dimensional analysis showed patterns of lower advisory fees for funds with larger asset sizes and funds from larger family sizes compared to funds with smaller asset sizes and funds from smaller family sizes, which according to the independent consultant is indicative of a sharing of economies of scale and scope. However, in less liquid and active markets, such is not the case, as the empirical analysis showed potential for diseconomies of scale in those markets. The empirical analysis also showed diminishing economies of scale and scope as funds surpassed a certain high level of assets. |
| ALLIANCEBERNSTEIN TAX-AWARE FIXED INCOME PORTFOLIO • | 55 |
THIS PAGE IS NOT PART OF THE SHAREHOLDER REPORT OR THE FINANCIAL STATEMENTS
ALLIANCEBERNSTEIN FAMILY OF FUNDS
US Equity
US Core
Core Opportunities Fund
Select US Equity Portfolio
US Growth
Concentrated Growth Fund
Discovery Growth Fund
Growth Fund
Large Cap Growth Fund
Small Cap Growth Portfolio
US Value
Discovery Value Fund
Equity Income Fund
Growth & Income Fund
Value Fund
International/Global Equity
International/Global Core
Global Equity & Covered Call Strategy Fund
Global Thematic Growth Fund
International Portfolio
Tax-Managed International Portfolio
International/Global Growth
International Growth Fund
International/Global Value
International Value Fund
Fixed Income
Municipal
High Income Municipal Portfolio
Intermediate California Portfolio
Intermediate Diversified Portfolio
Intermediate New York Portfolio
Municipal Bond Inflation Strategy
Tax-Aware Fixed Income Portfolio
National Portfolio
Arizona Portfolio
California Portfolio
Massachusetts Portfolio
Michigan Portfolio
Minnesota Portfolio
New Jersey Portfolio
New York Portfolio
Ohio Portfolio
Pennsylvania Portfolio
Virginia Portfolio
Taxable
Bond Inflation Strategy
Global Bond Fund
Fixed Income (continued)
Taxable
High Income Fund
High Yield Portfolio
Intermediate Bond Portfolio
Limited Duration High Income Portfolio
Short Duration Portfolio
Alternatives
All Market Real Return Portfolio*
Credit Long/Short Portfolio
Global Real Estate Investment Fund
Long/Short Multi-Manager Fund
Market Neutral Strategy-U.S.
Multi-Manager Alternative Strategies Fund
Select US Long/Short Portfolio
Unconstrained Bond Fund
Multi-Asset
All Market Growth Portfolio*
Emerging Markets Multi-Asset Portfolio
Global Risk Allocation Fund
Retirement Strategies
2000 Retirement Strategy
2005 Retirement Strategy
2010 Retirement Strategy
2015 Retirement Strategy
2020 Retirement Strategy
2025 Retirement Strategy
2030 Retirement Strategy
2035 Retirement Strategy
2040 Retirement Strategy
2045 Retirement Strategy
2050 Retirement Strategy
2055 Retirement Strategy
Wealth Strategies
Balanced Wealth Strategy
Conservative Wealth Strategy
Wealth Appreciation Strategy
Tax-Managed Balanced Wealth Strategy
Tax-Managed Conservative Wealth Strategy
Tax-Managed Wealth Appreciation Strategy
Closed-End Funds
Alliance California Municipal Income Fund
Alliance New York Municipal Income Fund
AllianceBernstein Global High Income Fund
AllianceBernstein Income Fund
AllianceBernstein Multi-Manager Alternative Fund
AllianceBernstein National Municipal Income Fund
We also offer Exchange Reserves, which serves as the money market fund exchange vehicle for the AllianceBernstein mutual funds. An investment in Exchange Reserves is not a deposit in a bank and is not insured or guaranteed by the Federal Deposit Insurance Corporation or any other government agency. Although the Fund seeks to preserve the value of your investment at $1.00 per share, it is possible to lose money by investing in the Fund.
Investors should consider the investment objectives, risks, charges and expenses of the Fund carefully before investing. For copies of our prospectus or summary prospectus, which contain this and other information, visit us online at www.alliancebernstein.com or contact your AllianceBernstein investments representative. Please read the prospectus and/or summary prospectus carefully before investing.
| * | Prior to December 15, 2014, All Market Growth Portfolio was named Dynamic All Market Fund; All Market Real Return Portfolio was named Real Asset Strategy. |
| 56 | • ALLIANCEBERNSTEIN TAX-AWARE FIXED INCOME PORTFOLIO |
AllianceBernstein Family of Funds
NOTES
| ALLIANCEBERNSTEIN TAX-AWARE FIXED INCOME PORTFOLIO • | 57 |
NOTES
| 58 | • ALLIANCEBERNSTEIN TAX-AWARE FIXED INCOME PORTFOLIO |
NOTES
| ALLIANCEBERNSTEIN TAX-AWARE FIXED INCOME PORTFOLIO • | 59 |
NOTES
| 60 | • ALLIANCEBERNSTEIN TAX-AWARE FIXED INCOME PORTFOLIO |
ALLIANCEBERNSTEIN TAX-AWARE FIXED INCOME PORTFOLIO
1345 Avenue of the Americas
New York, NY 10105
800.221.5672
| TAFI-0151-1014 |  | |
ITEM 2. CODE OF ETHICS.
(a) The registrant has adopted a code of ethics that applies to its principal executive officer, principal financial officer and principal accounting officer. A copy of the registrant’s code of ethics is filed herewith as Exhibit 12(a)(1).
(b) During the period covered by this report, no material amendments were made to the provisions of the code of ethics adopted in
2(a) above.
(c) During the period covered by this report, no implicit or explicit waivers to the provisions of the code of ethics adopted in 2(a) above were granted.
ITEM 3. AUDIT COMMITTEE FINANCIAL EXPERT.
The registrant’s Board of Directors has determined that independent directors Garry L. Moody and William H. Foulk, Jr. qualify as audit committee financial experts.
ITEM 4. PRINCIPAL ACCOUNTANT FEES AND SERVICES.
(a) - (c) The following table sets forth the aggregate fees billed by the independent registered public accounting firm Ernst & Young LLP, for the Fund’s last two fiscal years for professional services rendered for: (i) the audit of the Fund’s annual financial statements included in the Fund’s annual report to stockholders; (ii) assurance and related services that are reasonably related to the performance of the audit of the Fund’s financial statements and are not reported under (i), which include advice and education related to accounting and auditing issues and quarterly press release review (for those Funds which issue press releases), and preferred stock maintenance testing (for those Funds that issue preferred stock); and (iii) tax compliance, tax advice and tax return preparation.
| Audit Fees | Audit-Related Fees | Tax Fees | ||||||||||||||
AB Intermediate Bond | 2013 | $ | 44,500 | $ | — | $ | 13,338 | |||||||||
| 2014 | $ | 65,781 | $ | — | $ | 13,839 | ||||||||||
AB Bond Inflation Strategy | 2013 | $ | 40,500 | $ | — | $ | 13,337 | |||||||||
| 2014 | $ | 67,918 | $ | — | $ | 15,678 | ||||||||||
AB Municipal Bond Inflation Strategy | 2013 | $ | 31,290 | $ | — | $ | 14,149 | |||||||||
| 2014 | $ | 62,424 | $ | — | $ | 13,838 | ||||||||||
AB Real Asset Strategy | 2013 | $ | 42,000 | $ | — | $ | 33,317 | |||||||||
| 2014 | $ | 74,939 | $ | — | $ | 26,069 | ||||||||||
AB Credit Long/Short | 2013 | $ | — | $ | — | $ | — | |||||||||
| 2014 | $ | 63,750 | $ | — | $ | 15,552 | ||||||||||
AB High Yield | 2013 | $ | — | $ | — | $ | — | |||||||||
| 2014 | $ | 67,500 | $ | — | $ | 17,573 | ||||||||||
AB Tax Aware Fixed Income | 2013 | $ | — | $ | — | $ | — | |||||||||
| 2014 | $ | 25,500 | $ | — | $ | 17,957 | ||||||||||
(d) Not applicable.
(e) (1) Beginning with audit and non-audit service contracts entered into on or after May 6, 2003, the Fund’s Audit Committee policies and procedures require the pre-approval of all audit and non-audit services provided to the Fund by the Fund’s independent
registered public accounting firm. The Fund’s Audit Committee policies and procedures also require pre-approval of all audit and non-audit services provided to the Adviser and Service Affiliates to the extent that these services are directly related to the operations or financial reporting of the Fund.
(e) (2) All of the amounts for Audit Fees, Audit-Related Fees and Tax Fees in the table under Item 4 (a) – (c) are for services pre-approved by the Fund’s Audit Committee.
(f) Not applicable.
(g) The following table sets forth the aggregate non-audit services provided to the Fund, the Fund’s Adviser and entities that control, are controlled by or under common control with the Adviser that provide ongoing services to the Fund:
| All Fees for Non-Audit Services Provided to the Portfolio, the Adviser and Service Affiliates | Total Amount of Foregoing Column Pre- approved by the Audit Committee (Portion Comprised of Audit Related Fees) (Portion Comprised of Tax Fees) | |||||||||||
AB Intermediate Bond | 2013 | $ | 334,849 | $ | 13,338 | | ||||||
| $ | — | | ||||||||||
| $ | (13,338 | ) | ||||||||||
| 2014 | $ | 424,494 | $ | 13,839 | | |||||||
| $ | — | | ||||||||||
| $ | (13,839 | ) | ||||||||||
AB Bond Inflation Strategy | 2013 | $ | 334,848 | $ | 13,337 | | ||||||
| $ | — | | ||||||||||
| $ | (13,337 | ) | ||||||||||
| 2014 | $ | 426,333 | $ | 15,678 | | |||||||
| $ | — | | ||||||||||
| $ | (15,678 | ) | ||||||||||
AB Municipal Bond Inflation Strategy | 2013 | $ | 335,661 | $ | 14,149 | | ||||||
| $ | — | | ||||||||||
| �� | $ | (14,149 | ) | |||||||||
| 2014 | $ | 424,493 | $ | 13,838 | | |||||||
| $ | — | | ||||||||||
| $ | (13,838 | ) | ||||||||||
AB Real Asset Strategy | 2013 | $ | 354,828 | $ | 33,317 | | ||||||
| $ | — | | ||||||||||
| $ | (33,317 | ) | ||||||||||
| 2014 | $ | 436,724 | $ | 26,069 | | |||||||
| $ | — | | ||||||||||
| $ | (26,069 | ) | ||||||||||
AB Credit Long/Short | 2013 | $ | — | $ | — | | ||||||
| $ | — | | ||||||||||
| $ | — | | ||||||||||
| 2014 | $ | 426,207 | $ | 15,552 | | |||||||
| $ | — | | ||||||||||
| $ | (15,552 | ) | ||||||||||
AB High Yield | 2013 | $ | — | $ | — | | ||||||
| $ | — | | ||||||||||
| 2014 | $ | 428,228 | $ | 17,573 | | |||||||
| $ | — | | ||||||||||
| $ | (17,573 | ) | ||||||||||
AB Tax Aware Fixed Income | 2013 | $ | — | $ | — | | ||||||
| $ | — | | ||||||||||
| $ | — | | ||||||||||
| 2014 | $ | 428,612 | $ | 17,957 | | |||||||
| $ | — | | ||||||||||
| $ | (17,957 | ) | ||||||||||
(h) The Audit Committee of the Fund has considered whether the provision of any non-audit services not pre-approved by the Audit Committee provided by the Fund’s independent registered public accounting firm to the Adviser and Service Affiliates is compatible with maintaining the auditor’s independence.
ITEM 5. AUDIT COMMITTEE OF LISTED REGISTRANTS.
Not applicable to the registrant.
ITEM 6. SCHEDULE OF INVESTMENTS.
Please see Schedule of Investments contained in the Report to Shareholders included under Item 1 of this Form N-CSR.
ITEM 7. DISCLOSURE OF PROXY VOTING POLICIES AND PROCEDURES FOR CLOSED-END MANAGEMENT INVESTMENT COMPANIES.
Not applicable to the registrant.
ITEM 8. PORTFOLIO MANAGERS OF CLOSED-END MANAGEMENT INVESTMENT COMPANIES.
Not applicable to the registrant.
ITEM 9. PURCHASES OF EQUITY SECURITIES BY CLOSED-END MANAGEMENT INVESTMENT COMPANY AND AFFILIATED PURCHASERS.
Not applicable to the registrant.
ITEM 10. SUBMISSION OF MATTERS TO A VOTE OF SECURITY HOLDERS.
There have been no material changes to the procedures by which shareholders may recommend nominees to the Fund’s Board of Directors since the Fund last provided disclosure in response to this item.
ITEM 11. CONTROLS AND PROCEDURES.
(a) The registrant’s principal executive officer and principal financial officer have concluded that the registrant’s disclosure controls and procedures (as defined in Rule 30a-3 (c) under the Investment Company Act of 1940, as amended) are effective at the reasonable assurance level based on their evaluation of these controls and procedures as of a date within 90 days of the filing date of this document.
(b) There were no changes in the registrant’s internal controls over financial reporting that occurred during the second fiscal quarter of the period that has materially affected, or is reasonably likely to materially affect, the registrant’s internal control over financial reporting.
ITEM 12. EXHIBITS.
The following exhibits are attached to this Form N-CSR:
EXHIBIT NO. | DESCRIPTION OF EXHIBIT | |
| 12 (a) (1) | Code of Ethics that is subject to the disclosure of Item 2 hereof | |
| 12 (b) (1) | Certification of Principal Executive Officer Pursuant to Section 302 of the Sarbanes-Oxley Act of 2002 | |
| 12 (b) (2) | Certification of Principal Financial Officer Pursuant to Section 302 of the Sarbanes-Oxley Act of 2002 | |
| 12 (c) | Certification of Principal Executive Officer and Principal Financial Officer Pursuant to Section 906 of the Sarbanes-Oxley Act of 2002 | |
SIGNATURES
Pursuant to the requirements of the Securities Exchange Act of 1934 and the Investment Company Act of 1940, the registrant has duly caused this report to be signed on its behalf by the undersigned, thereunto duly authorized.
(Registrant): AllianceBernstein Bond Fund, Inc.
| By: | /s/ Robert M. Keith | |
| Robert M. Keith | ||
| President | ||
| Date: | December 19, 2014 | |
Pursuant to the requirements of the Securities Exchange Act of 1934 and the Investment Company Act of 1940, this report has been signed below by the following persons on behalf of the registrant and in the capacities and on the dates indicated.
| By: | /s/ Robert M. Keith | |
| Robert M. Keith | ||
| President | ||
| Date: | December 19, 2014 | |
| By: | /s/ Joseph J. Mantineo | |
| Joseph J. Mantineo | ||
| Treasurer and Chief Financial Officer | ||
| Date: | December 19, 2014 | |