UNITED STATES
SECURITIES AND EXCHANGE COMMISSION
WASHINGTON, D.C. 20549
FORM N-CSR
CERTIFIED SHAREHOLDER REPORT OF REGISTERED
MANAGEMENT INVESTMENT COMPANIES
Investment Company Act file number: 811-02383
AB BOND FUND, INC.
(Exact name of registrant as specified in charter)
1345 Avenue of the Americas, New York, New York 10105
(Address of principal executive offices) (Zip code)
Joseph J. Mantineo
AllianceBernstein L.P.
1345 Avenue of the Americas
New York, New York 10105
(Name and address of agent for service)
Registrant’s telephone number, including area code: (800) 221-5672
Date of fiscal year end: December 31, 2018
Date of reporting period: June 30, 2018
| ITEM 1. | REPORTS TO STOCKHOLDERS. |
JUN 06.30.18

SEMI-ANNUAL REPORT
AB FLEXFEETM INTERNATIONAL BOND PORTFOLIO

| Investment Products Offered | • Are Not FDIC Insured • May Lose Value • Are Not Bank Guaranteed | |
Investors should consider the investment objectives, risks, charges and expenses of the Fund carefully before investing. For copies of our prospectus or summary prospectus, which contain this and other information, visit us online at www.abfunds.com or contact your AB representative. Please read the prospectus and/or summary prospectus carefully before investing.
This shareholder report must be preceded or accompanied by the Fund’s prospectus for individuals who are not current shareholders of the Fund.
You may obtain a description of the Fund’s proxy voting policies and procedures, and information regarding how the Fund voted proxies relating to portfolio securities during the most recent 12-month period ended June 30, without charge. Simply visit AB’s website at www.abfunds.com, or go to the Securities and Exchange Commission’s (the “Commission”) website at www.sec.gov, or call AB at (800) 227 4618.
The Fund files its complete schedule of portfolio holdings with the Commission for the first and third quarters of each fiscal year on Form N-Q. The Fund’s Forms N-Q are available on the Commission’s website at www.sec.gov. The Fund’s Forms N-Q may also be reviewed and copied at the Commission’s Public Reference Room in Washington, DC; information on the operation of the Public Reference Room may be obtained by calling (800) SEC 0330. AB publishes full portfolio holdings for the Fund monthly at www.abfunds.com.
AllianceBernstein Investments, Inc. (ABI) is the distributor of the AB family of mutual funds. ABI is a member of FINRA and is an affiliate of AllianceBernstein L.P., the Adviser of the funds.
The [A/B] logo is a registered service mark of AllianceBernstein and AllianceBernstein® is a registered service mark used by permission of the owner, AllianceBernstein L.P.
| FROM THE PRESIDENT |  |
Dear Shareholder,
We are pleased to provide this report for AB FlexFee International Bond Portfolio (the “Fund”). Please review the discussion of Fund performance, the market conditions during the reporting period and the Fund’s investment strategy.
As always, AB strives to keep clients ahead of what’s next by:
| + | Transforming uncommon insights into uncommon knowledge with a global research scope |
| + | Navigating markets with seasoned investment experience and sophisticated solutions |
| + | Providing thoughtful investment insights and actionable ideas |
Whether you’re an individual investor or a multi-billion-dollar institution, we put knowledge and experience to work for you.
AB’s global research organization connects and collaborates across platforms and teams to deliver impactful insights and innovative products. Better insights lead to better opportunities—anywhere in the world.
For additional information about AB’s range of products and shareholder resources, please log on to www.abfunds.com.
Thank you for your investment in the AB Mutual Funds.
Sincerely,

Robert M. Keith
President and Chief Executive Officer, AB Mutual Funds
| abfunds.com | AB FLEXFEE INTERNATIONAL BOND PORTFOLIO | 1 |
SEMI-ANNUAL REPORT
August 10, 2018
This report provides management’s discussion of fund performance for AB FlexFee International Bond Portfolio for the semi-annual reporting period ended June 30, 2018.
The Fund’s investment objective is to generate current income consistent with preservation of capital.
NAV RETURNS AS OF JUNE 30, 2018 (unaudited)
| 6 Months | 12 Months | |||||||
| AB FLEXFEE INTERNATIONAL BOND PORTFOLIO | ||||||||
| Advisor Class Shares | 0.73% | 2.31% | ||||||
| Bloomberg Barclays Global Aggregate ex-USD Index (USD hedged) | 1.42% | 3.27% | ||||||
INVESTMENT RESULTS
The table above shows the Fund’s performance compared to its benchmark, the Bloomberg Barclays Global Aggregate ex-USD Index (USD hedged), for the six- and 12-month periods ended June 30, 2018.
The Fund underperformed the benchmark for both periods. The Fund’s advisory fee, which is performance-based, was being accrued at its minimum rate. (The actual advisory fee payable by the Fund for its current performance period will be determined based on the Fund’s performance relative to the benchmark as of the end of such period, which is from inception on June 28, 2017 through December 31, 2018.)
In the six-month period, active currency positions detracted from relative performance, as gains from a short position in the Israeli new shekel were outweighed by losses from a short euro position as well as long positions in the Argentine peso and Brazilian real. Sector allocation was negative, primarily because of an overweight position in eurozone high-yield corporates and an off-benchmark allocation to US investment-grade corporates. Exposure to US commercial mortgage-backed securities added to returns. Positive returns from the Fund’s eurozone yield-curve positioning offset detrimental positioning along the UK yield curve. From a country allocation standpoint, an overweight in Mexico and positions in the US added. Security selection was also positive, largely the result of selection within eurozone treasuries.
In the 12-month period, country and yield-curve positioning detracted from performance; positioning along the UK yield curve, an underweight in the eurozone and an overweight in Canada were negative, while eurozone yield-curve positioning and an off-benchmark exposure to the US contributed. Currency investments also detracted, as gains from a long position
| 2 | AB FLEXFEE INTERNATIONAL BOND PORTFOLIO | abfunds.com |
in the Polish zloty were more than offset by losses from a short position in the euro and long in the Argentine peso. Security selection contributed to performance, primarily within eurozone treasuries. Sector allocation was also positive in the period.
During both periods, derivatives in the form of futures, interest rate swaps and interest rate swaptions, both purchased and written, were used to manage and hedge duration risk and/or for active yield-curve positioning. Currency forwards were used to hedge foreign currency exposure and to take active currency risk. Currency options, both purchased and written, were used to take active currency risk. Credit default swaps, both single name and index, were used to manage credit risks and/or replicate sector risks. Variance swaps were used to hedge corporate credit risk.
MARKET REVIEW AND INVESTMENT STRATEGY
Fixed-income markets were volatile in the six-month period, with emerging-market debt sectors underperforming other fixed-income sectors. Global high yield and investment-grade corporates declined amid subdued appetite for risk, while developed-market treasuries rallied. Local-currency emerging-market government bonds also declined. Developed-market yields generally either rose across the curve (particularly in Italy and the US) or flattened, as shorter maturities rose while longer maturities moved lower (bond yields move inversely to price). The US Federal Reserve raised interest rates twice and began to formally reduce its balance sheet, as widely expected, but in June signaled more rate increases than previously expected for the rest of this year. The European Central Bank started to scale back asset purchases, but updated forward guidance to say that it would not change its policy rate until summer 2019 at the earliest. The Bank of Japan maintained its easy policy stance.
The Fund’s Senior Investment Management Team (the “Team”) continues to utilize a core fixed-income strategy with a global ex-US, multi-sector approach, and continues to pursue an attractive/risk return profile by managing currency exposure. The Team invests in fixed-income securities, including US dollar- and local currency-denominated debt securities, as well as select below investment-grade securities.
INVESTMENT POLICIES
The Fund invests primarily in fixed-income securities of non-US companies and governments. Under normal circumstances, the Fund invests at least 80% of its net assets in fixed-income securities and related derivatives. In addition, the Fund invests, under normal circumstances, in the fixed-income securities of companies located in at least three countries other than the United States. The Fund invests
(continued on next page)
| abfunds.com | AB FLEXFEE INTERNATIONAL BOND PORTFOLIO | 3 |
in a broad range of fixed-income securities in both developed and emerging markets and across all fixed-income sectors, including non-US government and corporate debt securities. Under normal circumstances, the Fund invests at least 75% of its net assets in fixed-income securities rated investment-grade at the time of investment and may invest up to 25% of its net assets in below investment-grade fixed-income securities (commonly known as “junk bonds”).
The Fund may at times invest in mortgage-related securities and inflation-indexed securities. The Fund’s investments may be denominated in local currency or be US dollar-denominated. The Fund may invest in debt securities with a range of maturities from short- to long-term.
The Adviser selects securities for purchase or sale by the Fund based on its assessment of the securities’ risk and return characteristics as well as the securities’ impact on the overall risk and return characteristics of the Fund. In making this assessment, the Adviser takes into account various factors, including the credit quality and sensitivity to interest rates of the securities under consideration and of the Fund’s other holdings.
The Adviser seeks to actively manage the Fund’s assets in relation to market conditions and general economic conditions and adjust the Fund’s investments in an effort to best enable the Fund to achieve its investment objective. Thus, the percentage of the Fund’s assets invested in a particular country or denominated in a particular currency will vary in accordance with the Adviser’s assessment of the relative yield and appreciation potential of such securities and the relationship of the country’s currency to the US dollar.
In order to reduce the Fund’s volatility, the Adviser expects under normal circumstances to hedge the majority of the Fund’s foreign currency exposure to the US dollar through the use of foreign currency forward contracts and similar derivatives, although it will not be required to do so. The Fund may take a long position in one currency and a short position in another when it believes that the first currency will appreciate relative to the other.
The Fund expects to use derivatives, such as options, futures contracts, forwards or swaps. Derivatives may provide a more efficient and economical exposure to market segments than direct investments, and may also be a more efficient way to alter the Fund’s exposure. The Fund may, for example, use interest rate futures contracts to gain exposure to the fixed-income markets and, as noted above, may use currency derivatives to hedge foreign currency exposure.
| 4 | AB FLEXFEE INTERNATIONAL BOND PORTFOLIO | abfunds.com |
DISCLOSURES AND RISKS
Benchmark Disclosure
The Bloomberg Barclays Global Aggregate ex-USD Index (USD hedged) is unmanaged and does not reflect fees and expenses associated with the active management of a mutual fund portfolio. The Bloomberg Barclays Global Aggregate ex-USD Index (USD hedged) represents the performance of the global investment-grade developed fixed-income markets, excluding the United States. An investor cannot invest directly in an index, and its results are not indicative of the performance for any specific investment, including the Fund.
A Word About Risk
Market Risk: The value of the Fund’s assets will fluctuate as the bond or stock market fluctuates. The value of its investments may decline, sometimes rapidly and unpredictably, simply because of economic changes or other events that affect large portions of the market.
Interest-Rate Risk: Changes in interest rates will affect the value of investments in fixed-income securities. When interest rates rise, the value of existing investments in fixed-income securities tends to fall and this decrease in value may not be offset by higher income from new investments. The Fund may be subject to heightened interest-rate risk due to rising rates as the recent period of historically low interest rates may be ending. Interest-rate risk is generally greater for fixed-income securities with longer maturities or durations.
Credit Risk: An issuer or guarantor of a fixed-income security, or the counterparty to a derivatives or other contract, may be unable or unwilling to make timely payments of interest or principal, or to otherwise honor its obligations. The issuer or guarantor may default, causing a loss of the full principal amount of a security and accrued interest. The degree of risk for a particular security may be reflected in its credit rating. There is the possibility that the credit rating of a fixed-income security may be downgraded after purchase, which may adversely affect the value of the security.
Below Investment Grade Securities Risk: Investments in fixed-income securities with lower ratings (commonly known as “junk bonds”) are subject to a higher probability that an issuer will default or fail to meet its payment obligations. These securities may be subject to greater price volatility, due to such factors as specific corporate developments, negative perceptions of the junk bond market generally and less secondary market liquidity.
Duration Risk: Duration is a measure that relates the expected price volatility of a fixed-income security to changes in interest rates. The duration of a fixed-income security may be shorter than or equal to full maturity of a
| abfunds.com | AB FLEXFEE INTERNATIONAL BOND PORTFOLIO | 5 |
DISCLOSURES AND RISKS (continued)
fixed-income security. Fixed-income securities with longer durations have more risk and will decrease in price as interest rates rise.
Inflation Risk: This is the risk that the value of assets or income from investments will be less in the future as inflation decreases the value of money. As inflation increases, the value of the Fund’s assets can decline as can the value of the Fund’s distributions. This risk is significantly greater if the Fund invests a significant portion of its assets in fixed-income securities with longer maturities.
Foreign (Non-US) Risk: Investments in securities of non-US issuers may involve more risk than those of US issuers. These securities may fluctuate more widely in price and may be less liquid due to adverse market, economic, political, regulatory or other factors.
Emerging-Market Risk: Investments in emerging-market countries may have more risk because the markets are less developed and less liquid, and because these investments may be subject to increased economic, political, regulatory or other uncertainties.
Currency Risk: Fluctuations in currency exchange rates may negatively affect the value of the Fund’s investments in fixed-income securities denominated in foreign currencies or reduce the Fund’s returns.
Derivatives Risk: Derivatives may be illiquid, difficult to price, and leveraged so that small changes may produce disproportionate losses for the Fund, and may be subject to counterparty risk to a greater degree than more traditional investments.
Liquidity Risk: Liquidity risk occurs when certain investments become difficult to purchase or sell. Difficulty in selling less liquid securities may result in sales at disadvantageous prices affecting the value of your investment in the Fund. Causes of liquidity risk may include low trading volumes, large positions and heavy redemptions of Fund shares. Over recent years liquidity risk has also increased because the capacity of dealers in the secondary market for fixed-income securities to make markets in these securities has decreased, even as the overall bond market has grown significantly, due to, among other things, structural changes, additional regulatory requirements and capital and risk restraints that have led to reduced inventories. Liquidity risk may be higher in a rising interest-rate environment, when the value and liquidity of fixed-income securities generally decline.
Management Risk: The Fund is subject to management risk because it is an actively managed investment fund. The Adviser will apply its investment techniques and risk analyses in making investment decisions, but there is no guarantee that its techniques will produce the intended results.
| 6 | AB FLEXFEE INTERNATIONAL BOND PORTFOLIO | abfunds.com |
DISCLOSURES AND RISKS (continued)
These risks are fully discussed in the Fund’s prospectus. As with all investments, you may lose money by investing in the Fund.
An Important Note About Historical Performance
The investment return and principal value of an investment in the Fund will fluctuate, so that shares, when redeemed, may be worth more or less than their original cost. Performance shown in this report represents past performance and does not guarantee future results. Current performance may be lower or higher than the performance information shown. You may obtain performance information current to the most recent month-end by visiting www.abfunds.com. The Fund has been in operation only for a short period of time, and therefore has a very limited historical performance period. This limited performance period is unlikely to be representative of the performance the Fund will achieve over a longer period.
All fees and expenses related to the operation of the Fund have been deducted. Net asset value (“NAV”) returns do not reflect sales charges; if sales charges were reflected, the Fund’s quoted performance would be lower. SEC returns reflect the applicable sales charges for each share class. Returns for the different share classes will vary due to different expenses associated with each class. Performance assumes reinvestment of distributions and does not account for taxes.
| abfunds.com | AB FLEXFEE INTERNATIONAL BOND PORTFOLIO | 7 |
HISTORICAL PERFORMANCE
AVERAGE ANNUAL RETURNS AS OF JUNE 30, 2018 (unaudited)
| NAV Returns | SEC Returns (reflects applicable sales charges) | |||||||
| ADVISOR CLASS SHARES1 | ||||||||
| 1 Year | 2.31% | 2.31% | ||||||
| Since Inception2 | 1.78% | 1.78% | ||||||
SEC AVERAGE ANNUAL RETURNS
AS OF THE MOST RECENT CALENDAR QUARTER-END
JUNE 30, 2018 (unaudited)
| SEC Returns (reflects applicable sales charges) | ||||
| ADVISOR CLASS SHARES | ||||
| 1 Year | 2.31% | |||
| Since Inception2 | 1.78% | |||
The Fund’s current prospectus fee table shows the Fund’s total annual operating expense ratio as 2.22% for Advisor Class shares, gross of any fee waivers or expense reimbursements. Contractual fee waivers and/or expense reimbursements limit the Fund’s annual operating expense ratio exclusive of the Fund’s advisory fees, acquired fund fees and expenses other than the advisory fees of any AB mutual funds in which the Fund may invest, interest expense, taxes, extraordinary expenses, and brokerage commissions and other transaction costs to 0.10% for Advisor Class shares. These waivers/reimbursements may not be terminated before April 30, 2019. Any fees waived and expenses borne by the Adviser may be reimbursed by the Fund until the end of the third fiscal year after the fiscal period in which the fee was waived or the expense was borne, provided that no reimbursement payment will be made that would cause the Fund’s total annual operating expenses to exceed these expense limitations. Absent reimbursements or waivers, performance would have been lower. The Financial Highlights section of this report sets forth expense ratio data for the current reporting period; the expense ratio shown above may differ from the expense ratio in the Financial Highlights section since they are based on different time periods.
| 1 | This share class is offered at NAV to eligible investors and the SEC returns are the same as the NAV returns. |
| 2 | Inception date: 6/28/2017. |
| 8 | AB FLEXFEE INTERNATIONAL BOND PORTFOLIO | abfunds.com |
EXPENSE EXAMPLE
(unaudited)
As a shareholder of the Fund, you incur two types of costs: (1) transaction costs, including sales charges (loads) on purchase payments, contingent deferred sales charges on redemptions and (2) ongoing costs, including advisory fees; distribution (12b-1) fees; and other Fund expenses. This example is intended to help you understand your ongoing costs (in dollars) of investing in the Fund and to compare these costs with the ongoing costs of investing in other mutual funds.
The Example is based on an investment of $1,000 invested at the beginning of the period and held for the entire period as indicated below.
Actual Expenses
The table below provides information about actual account values and actual expenses. You may use the information in this line, together with the amount you invested, to estimate the expenses that you paid over the period. Simply divide your account value by $1,000 (for example, an $8,600 account value divided by $1,000 = 8.6), then multiply the result by the number in the first line under the heading entitled “Expenses Paid During Period” to estimate the expenses you paid on your account during this period.
Hypothetical Example for Comparison Purposes
The table below provides information about hypothetical account values and hypothetical expenses based on the Fund’s actual expense ratio and an assumed annual rate of return of 5% before expenses, which is not the Fund’s actual return. The hypothetical account values and expenses may not be used to estimate the actual ending account balance or expenses you paid for the period. You may use this information to compare the ongoing costs of investing in the Fund and other funds by comparing this 5% hypothetical example with the 5% hypothetical examples that appear in the shareholder reports of other funds.
Please note that the expenses shown in the table are meant to highlight your ongoing costs only and do not reflect any transactional costs, such as sales charges (loads), or contingent deferred sales charges on redemptions. Therefore, the hypothetical example is useful in comparing ongoing costs only, and will not help you determine the relative total costs of owning different funds. In addition, if these transactional costs were included, your costs would have been higher.
| abfunds.com | AB FLEXFEE INTERNATIONAL BOND PORTFOLIO | 9 |
EXPENSE EXAMPLE (continued)
| Beginning Account Value 1/1/2018 | Ending Account Value 6/30/2018 | Expenses Paid During Period* | Annualized Expense Ratio* | |||||||||||||
| Advisor Class | ||||||||||||||||
Actual | $ | 1,000 | $ | 1,007.30 | $ | 1.00 | 0.20 | % | ||||||||
Hypothetical** | $ | 1,000 | $ | 1,023.80 | $ | 1.00 | 0.20 | % | ||||||||
| * | Expenses are equal to the classes’ annualized expense ratios multiplied by the average account value over the period, multiplied by 181/365 (to reflect the one-half year period). |
| ** | Assumes 5% annual return before expenses. |
| 10 | AB FLEXFEE INTERNATIONAL BOND PORTFOLIO | abfunds.com |
PORTFOLIO SUMMARY
June 30, 2018 (unaudited)
PORTFOLIO STATISTICS
Net Assets ($mil): $45.4
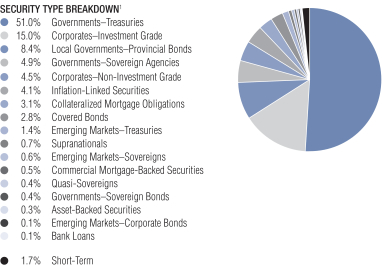
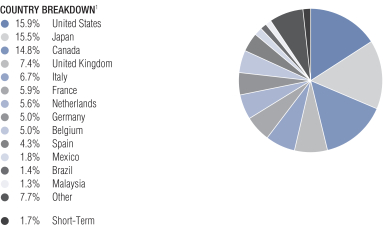
| 1 | All data are as of June 30, 2018. The Fund’s security type and country breakdowns are expressed as a percentage of total investments and may vary over time. The Fund also enters into derivative transactions, which may be used for hedging or investment purposes (see “Portfolio of Investments” section of the report for additional details). “Other” country weightings represent 1.2% or less in the following countries or classifications: Argentina, Australia, Austria, Costa Rica, Denmark, Ireland, New Zealand, Qatar, Russia, Singapore, South Korea, Supranational, Switzerland and Uruguay. |
| abfunds.com | AB FLEXFEE INTERNATIONAL BOND PORTFOLIO | 11 |
PORTFOLIO OF INVESTMENTS
June 30, 2018 (unaudited)
| Principal Amount (000) | U.S. $ Value | |||||||||||
| ||||||||||||
GOVERNMENTS – TREASURIES – 49.9% | ||||||||||||
Austria – 0.9% | ||||||||||||
Republic of Austria Government Bond | EUR | 280 | $ | 337,092 | ||||||||
2.40%, 5/23/34(a) | 45 | 63,453 | ||||||||||
|
| |||||||||||
| 400,545 | ||||||||||||
|
| |||||||||||
Belgium – 4.9% | ||||||||||||
Kingdom of Belgium Government Bond | 975 | 1,248,910 | ||||||||||
Series 75 | 270 | 317,748 | ||||||||||
Series 81 | 565 | 674,071 | ||||||||||
|
| |||||||||||
| 2,240,729 | ||||||||||||
|
| |||||||||||
Canada – 0.7% | ||||||||||||
Canadian Government Bond | CAD | 447 | 321,896 | |||||||||
|
| |||||||||||
France – 5.0% | ||||||||||||
French Republic Government Bond OAT Zero Coupon, 5/25/22(a) | EUR | 637 | 753,421 | |||||||||
1.00%, 5/25/27(a) | 45 | 55,002 | ||||||||||
1.75%, 5/25/23(a) | 455 | 581,938 | ||||||||||
2.00%, 5/25/48(a) | 345 | 447,842 | ||||||||||
2.25%, 10/25/22(a) | 210 | 272,128 | ||||||||||
3.25%, 5/25/45(a) | 90 | 147,772 | ||||||||||
|
| |||||||||||
| 2,258,103 | ||||||||||||
|
| |||||||||||
Germany – 4.9% | ||||||||||||
Bundesrepublik Deutschland Bundesanleihe | 610 | 725,661 | ||||||||||
2.50%, 7/04/44-8/15/46(a) | 866 | 1,380,436 | ||||||||||
Series 03 | 72 | 136,721 | ||||||||||
|
| |||||||||||
| 2,242,818 | ||||||||||||
|
| |||||||||||
Ireland – 0.7% | ||||||||||||
Ireland Government Bond | 278 | 337,096 | ||||||||||
|
| |||||||||||
Italy – 5.3% | ||||||||||||
Italy Buoni Poliennali Del Tesoro | 212 | 239,025 | ||||||||||
1.35%, 4/15/22 | 683 | 794,386 | ||||||||||
2.05%, 8/01/27 | 101 | 112,601 | ||||||||||
2.20%, 6/01/27 | 255 | 289,185 | ||||||||||
4.50%, 5/01/23 | 45 | 59,084 | ||||||||||
5.50%, 11/01/22 | 675 | 912,760 | ||||||||||
|
| |||||||||||
| 2,407,041 | ||||||||||||
|
| |||||||||||
| 12 | AB FLEXFEE INTERNATIONAL BOND PORTFOLIO | abfunds.com |
PORTFOLIO OF INVESTMENTS (continued)
| Principal Amount (000) | U.S. $ Value | |||||||||||
| ||||||||||||
Japan – 11.3% | ||||||||||||
Japan Government Ten Year Bond | JPY | 36,850 | $ | 335,720 | ||||||||
Japan Government Twenty Year Bond | 158,050 | 1,741,034 | ||||||||||
Series 143 | 42,450 | 457,853 | ||||||||||
Series 144 | ||||||||||||
1.50%, 3/20/33 | 34,350 | 365,838 | ||||||||||
Series 150 | 126,300 | 1,333,806 | ||||||||||
Series 158 | 100,050 | 915,902 | ||||||||||
|
| |||||||||||
| 5,150,153 | ||||||||||||
|
| |||||||||||
Malaysia – 1.2% | ||||||||||||
Malaysia Government Bond | MYR | 482 | 122,113 | |||||||||
Series 511 | 1,773 | 439,165 | ||||||||||
|
| |||||||||||
| 561,278 | ||||||||||||
|
| |||||||||||
Mexico – 1.7% | ||||||||||||
Mexican Bonos | MXN | 3,460 | 175,125 | |||||||||
Series M 20 | 10,656 | 603,334 | ||||||||||
|
| |||||||||||
| 778,459 | ||||||||||||
|
| |||||||||||
Netherlands – 4.9% | ||||||||||||
Netherlands Government Bond | EUR | 771 | 932,564 | |||||||||
3.25%, 7/15/21(a) | 987 | 1,287,349 | ||||||||||
|
| |||||||||||
| 2,219,913 | ||||||||||||
|
| |||||||||||
Russia – 0.5% | ||||||||||||
Russian Federal Bond – OFZ | RUB | 13,485 | 212,309 | |||||||||
|
| |||||||||||
Singapore – 0.7% | ||||||||||||
Singapore Government Bond | SGD | 325 | 231,850 | |||||||||
3.375%, 9/01/33 | 90 | 70,852 | ||||||||||
|
| |||||||||||
| 302,702 | ||||||||||||
|
| |||||||||||
| abfunds.com | AB FLEXFEE INTERNATIONAL BOND PORTFOLIO | 13 |
PORTFOLIO OF INVESTMENTS (continued)
| Principal Amount (000) | U.S. $ Value | |||||||||||
| ||||||||||||
Spain – 3.4% | ||||||||||||
Spain Government Bond | EUR | 365 | $ | 437,688 | ||||||||
1.95%, 4/30/26(a) | 583 | 728,826 | ||||||||||
4.40%, 10/31/23(a) | 255 | 359,318 | ||||||||||
|
| |||||||||||
| 1,525,832 | ||||||||||||
|
| |||||||||||
United Kingdom – 3.5% | ||||||||||||
United Kingdom Gilt | GBP | 346 | 452,128 | |||||||||
2.50%, 7/22/65(a) | 46 | 79,403 | ||||||||||
3.25%, 1/22/44(a) | 42 | 72,366 | ||||||||||
4.25%, 12/07/40(a) | 91 | 176,213 | ||||||||||
4.50%, 12/07/42(a) | 227 | 463,566 | ||||||||||
4.75%, 12/07/30(a) | 181 | 326,964 | ||||||||||
|
| |||||||||||
| 1,570,640 | ||||||||||||
|
| |||||||||||
United States – 0.1% | ||||||||||||
U.S. Treasury Bonds | U.S.$ | 43 | 42,927 | |||||||||
|
| |||||||||||
Uruguay – 0.2% | ||||||||||||
Uruguay Government International Bond | UYU | 1,198 | 32,528 | |||||||||
9.875%, 6/20/22(a) | 1,225 | 38,523 | ||||||||||
|
| |||||||||||
| 71,051 | ||||||||||||
|
| |||||||||||
Total Governments – Treasuries | 22,643,492 | |||||||||||
|
| |||||||||||
CORPORATES – INVESTMENT GRADE – 14.5% | ||||||||||||
Financial Institutions – 9.3% | ||||||||||||
Banking – 7.7% | ||||||||||||
Bank of America Corp. | EUR | 100 | 125,744 | |||||||||
3.824%, 1/20/28 | U.S.$ | 135 | 131,752 | |||||||||
Series DD | 29 | 30,666 | ||||||||||
Series FF | 8 | 7,831 | ||||||||||
Series Z | 49 | 52,008 | ||||||||||
Bank of Scotland PLC | GBP | 90 | 141,960 | |||||||||
Barclays Bank PLC | EUR | 81 | 111,562 | |||||||||
BNP Paribas SA | U.S.$ | 205 | 214,052 | |||||||||
Citigroup, Inc. | 165 | 166,004 | ||||||||||
| 14 | AB FLEXFEE INTERNATIONAL BOND PORTFOLIO | abfunds.com |
PORTFOLIO OF INVESTMENTS (continued)
| Principal Amount (000) | U.S. $ Value | |||||||||||
| ||||||||||||
Cooperatieve Rabobank UA | EUR | 90 | $ | 123,703 | ||||||||
Countrywide Capital III | U.S.$ | 315 | 389,733 | |||||||||
Credit Agricole SA | EUR | 135 | 165,897 | |||||||||
Danske Bank A/S | GBP | 226 | 300,564 | |||||||||
Goldman Sachs Group, Inc. (The) | EUR | 180 | 211,382 | |||||||||
2.905%, 7/24/23 | U.S.$ | 51 | 49,157 | |||||||||
HSBC Bank Capital Funding Sterling 2 LP | GBP | 91 | 126,855 | |||||||||
HSBC Holdings PLC | EUR | 200 | 261,879 | |||||||||
Intesa Sanpaolo SpA | U.S.$ | 200 | 183,981 | |||||||||
JPMorgan Chase & Co. | 135 | 131,819 | ||||||||||
Morgan Stanley | EUR | 100 | 122,536 | |||||||||
Series G | 100 | 121,223 | ||||||||||
Rabobank Capital Funding Trust IV | GBP | 90 | 123,504 | |||||||||
Santander Holdings USA, Inc. | U.S.$ | 110 | 105,255 | |||||||||
US Bancorp | 90 | 89,667 | ||||||||||
|
| |||||||||||
| 3,488,734 | ||||||||||||
|
| |||||||||||
Finance – 0.5% | ||||||||||||
GE Capital UK Funding Unlimited Co. | GBP | 90 | 119,391 | |||||||||
Synchrony Financial | U.S.$ | 90 | 83,104 | |||||||||
|
| |||||||||||
| 202,495 | ||||||||||||
|
| |||||||||||
Insurance – 0.7% | ||||||||||||
Assicurazioni Generali SpA | EUR | 112 | 138,547 | |||||||||
MetLife Capital Trust IV | U.S.$ | 100 | 123,867 | |||||||||
Nationwide Mutual Insurance Co. | 45 | 70,827 | ||||||||||
|
| |||||||||||
| 333,241 | ||||||||||||
|
| |||||||||||
| abfunds.com | AB FLEXFEE INTERNATIONAL BOND PORTFOLIO | 15 |
PORTFOLIO OF INVESTMENTS (continued)
| Principal Amount (000) | U.S. $ Value | |||||||||||
| ||||||||||||
REITS – 0.4% | ||||||||||||
American Tower Corp. | U.S.$ | 10 | $ | 10,321 | ||||||||
5.05%, 9/01/20 | 10 | 10,349 | ||||||||||
Healthcare Trust of America Holdings LP | 38 | 37,848 | ||||||||||
Spirit Realty LP | 3 | 2,889 | ||||||||||
VEREIT Operating Partnership LP | 7 | 7,007 | ||||||||||
WPC Eurobond BV | EUR | 110 | 128,387 | |||||||||
|
| |||||||||||
| 196,801 | ||||||||||||
|
| |||||||||||
| 4,221,271 | ||||||||||||
|
| |||||||||||
Industrial – 5.0% | ||||||||||||
Basic – 0.3% | ||||||||||||
Glencore Finance Europe Ltd. | 100 | 115,855 | ||||||||||
Glencore Funding LLC | U.S.$ | 20 | 20,127 | |||||||||
Yamana Gold, Inc. | 10 | 9,990 | ||||||||||
|
| |||||||||||
| 145,972 | ||||||||||||
|
| |||||||||||
Communications - Media – 0.3% | ||||||||||||
Charter Communications Operating LLC/Charter Communications Operating Capital | 10 | 9,989 | ||||||||||
4.908%, 7/23/25 | 90 | 90,881 | ||||||||||
Warner Media LLC | 45 | 43,436 | ||||||||||
|
| |||||||||||
| 144,306 | ||||||||||||
|
| |||||||||||
Communications - Telecommunications – 0.6% | ||||||||||||
AT&T, Inc. | 215 | 215,225 | ||||||||||
Bell Canada, Inc. | CAD | 10 | 7,676 | |||||||||
Series M-26 | 45 | 34,634 | ||||||||||
Rogers Communications, Inc. | 10 | 7,907 | ||||||||||
TELUS Corp. | 10 | 7,973 | ||||||||||
|
| |||||||||||
| 273,415 | ||||||||||||
|
| |||||||||||
| 16 | AB FLEXFEE INTERNATIONAL BOND PORTFOLIO | abfunds.com |
PORTFOLIO OF INVESTMENTS (continued)
| Principal Amount (000) | U.S. $ Value | |||||||||||
| ||||||||||||
Consumer Cyclical - Automotive – 0.6% | ||||||||||||
Ford Motor Credit Co. LLC | U.S.$ | 200 | $ | 194,769 | ||||||||
General Motors Co. | 35 | 33,535 | ||||||||||
General Motors Financial Co., Inc. | 17 | 16,696 | ||||||||||
5.25%, 3/01/26 | 7 | 7,238 | ||||||||||
|
| |||||||||||
| 252,238 | ||||||||||||
|
| |||||||||||
Consumer Cyclical - Entertainment – 0.5% | ||||||||||||
Carnival Corp. | EUR | 180 | 218,365 | |||||||||
|
| |||||||||||
Consumer Non-Cyclical – 1.1% | ||||||||||||
Celgene Corp. | U.S.$ | 78 | 74,526 | |||||||||
3.25%, 2/20/23 | 80 | 78,135 | ||||||||||
3.45%, 11/15/27 | 92 | 84,699 | ||||||||||
Leisureworld Senior Care LP | CAD | 150 | 116,060 | |||||||||
Philip Morris International, Inc. | EUR | 100 | 114,230 | |||||||||
Reynolds American, Inc. | U.S.$ | 45 | 45,266 | |||||||||
|
| |||||||||||
| 512,916 | ||||||||||||
|
| |||||||||||
Energy – 0.4% | ||||||||||||
Apache Corp. | 45 | 45,366 | ||||||||||
Enbridge Energy Partners LP | 20 | 20,356 | ||||||||||
Energy Transfer Partners LP | 10 | 10,256 | ||||||||||
4.90%, 2/01/24 | 10 | 10,183 | ||||||||||
Noble Energy, Inc. | 20 | 19,719 | ||||||||||
Plains All American Pipeline LP/PAA Finance Corp. | 20 | 18,966 | ||||||||||
3.85%, 10/15/23 | 10 | 9,763 | ||||||||||
Williams Partners LP | 45 | 43,874 | ||||||||||
|
| |||||||||||
| 178,483 | ||||||||||||
|
| |||||||||||
Services – 0.0% | ||||||||||||
Expedia Group, Inc. | 13 | 11,937 | ||||||||||
|
| |||||||||||
| abfunds.com | AB FLEXFEE INTERNATIONAL BOND PORTFOLIO | 17 |
PORTFOLIO OF INVESTMENTS (continued)
| Principal Amount (000) | U.S. $ Value | |||||||||||
| ||||||||||||
Technology – 1.2% | ||||||||||||
Apple, Inc. | CAD | 120 | $ | 88,867 | ||||||||
Broadcom Corp./Broadcom Cayman Finance Ltd. | U.S.$ | 10 | 9,472 | |||||||||
Dell International LLC/EMC Corp. | 20 | 20,928 | ||||||||||
6.02%, 6/15/26(a) | 45 | 47,287 | ||||||||||
Fidelity National Information Services, Inc. | EUR | 100 | 117,027 | |||||||||
Hewlett Packard Enterprise Co. | U.S.$ | 135 | 135,659 | |||||||||
KLA-Tencor Corp. | 20 | 20,684 | ||||||||||
Seagate HDD Cayman | 10 | 9,593 | ||||||||||
4.875%, 3/01/24 | 80 | 77,854 | ||||||||||
|
| |||||||||||
| 527,371 | ||||||||||||
|
| |||||||||||
| 2,265,003 | ||||||||||||
|
| |||||||||||
Utility – 0.2% | ||||||||||||
Electric – 0.0% | ||||||||||||
Union Electric Co. | 10 | 10,211 | ||||||||||
|
| |||||||||||
Other Utility – 0.2% | ||||||||||||
Anglian Water Services Financing PLC | GBP | 45 | 74,147 | |||||||||
|
| |||||||||||
| 84,358 | ||||||||||||
|
| |||||||||||
Total Corporates – Investment Grade | 6,570,632 | |||||||||||
|
| |||||||||||
LOCAL GOVERNMENTS – PROVINCIAL BONDS – 8.2% | ||||||||||||
Canada – 8.2% | ||||||||||||
Province of British Columbia Canada | CAD | 587 | 606,661 | |||||||||
Province of Manitoba Canada | 70 | 55,850 | ||||||||||
Province of Ontario Canada | 135 | 100,142 | ||||||||||
2.60%, 6/02/25-6/02/27 | 655 | 493,428 | ||||||||||
3.15%, 6/02/22 | 316 | 246,865 | ||||||||||
Province of Quebec Canada | 280 | 214,207 | ||||||||||
4.50%, 12/01/19 | 2,550 | 2,007,346 | ||||||||||
|
| |||||||||||
Total Local Governments – Provincial Bonds | 3,724,499 | |||||||||||
|
| |||||||||||
| 18 | AB FLEXFEE INTERNATIONAL BOND PORTFOLIO | abfunds.com |
PORTFOLIO OF INVESTMENTS (continued)
| Principal Amount (000) | U.S. $ Value | |||||||||||
| ||||||||||||
GOVERNMENTS – SOVEREIGN AGENCIES – 4.8% | ||||||||||||
Canada – 4.8% | ||||||||||||
Canada Housing Trust No. 1 | CAD | 1,190 | $ | 881,158 | ||||||||
2.00%, 12/15/19(a) | 575 | 437,788 | ||||||||||
3.80%, 6/15/21(a) | 1,085 | 863,133 | ||||||||||
|
| |||||||||||
Total Governments – Sovereign Agencies | 2,182,079 | |||||||||||
|
| |||||||||||
CORPORATES – NON-INVESTMENT GRADE – 4.5% | ||||||||||||
Financial Institutions – 2.5% | ||||||||||||
Banking – 2.4% | ||||||||||||
Banco Bilbao Vizcaya Argentaria SA | EUR | 200 | 239,127 | |||||||||
Banco Santander SA | 100 | 123,057 | ||||||||||
Credit Suisse Group AG | U.S.$ | 200 | 195,776 | |||||||||
Goldman Sachs Group, Inc. (The) | 59 | 55,506 | ||||||||||
Intesa Sanpaolo SpA | EUR | 200 | 252,245 | |||||||||
UBS Group Funding Switzerland AG | U.S.$ | 200 | 206,176 | |||||||||
|
| |||||||||||
| 1,071,887 | ||||||||||||
|
| |||||||||||
Finance – 0.1% | ||||||||||||
Navient Corp. | 45 | 46,541 | ||||||||||
|
| |||||||||||
| 1,118,428 | ||||||||||||
|
| |||||||||||
Industrial – 1.9% | ||||||||||||
Basic – 0.2% | ||||||||||||
NOVA Chemicals Corp. | 45 | 44,992 | ||||||||||
Novelis Corp. | 45 | 44,990 | ||||||||||
|
| |||||||||||
| 89,982 | ||||||||||||
|
| |||||||||||
Communications - Telecommunications – 0.2% | ||||||||||||
CenturyLink, Inc. | 45 | 46,248 | ||||||||||
Series T | 51 | 50,484 | ||||||||||
|
| |||||||||||
| 96,732 | ||||||||||||
|
| |||||||||||
| abfunds.com | AB FLEXFEE INTERNATIONAL BOND PORTFOLIO | 19 |
PORTFOLIO OF INVESTMENTS (continued)
| Principal Amount (000) | U.S. $ Value | |||||||||||
| ||||||||||||
Consumer Non-Cyclical – 0.4% | ||||||||||||
CHS/Community Health Systems, Inc. | U.S.$ | 10 | $ | 9,159 | ||||||||
Mallinckrodt International Finance SA/Mallinckrodt CB LLC | 8 | 7,873 | ||||||||||
5.75%, 8/01/22(a) | 41 | 36,900 | ||||||||||
Spectrum Brands, Inc. | 62 | 61,237 | ||||||||||
Tenet Healthcare Corp. | 39 | 38,435 | ||||||||||
4.50%, 4/01/21 | 25 | 24,747 | ||||||||||
|
| |||||||||||
| 178,351 | ||||||||||||
|
| |||||||||||
Energy – 0.8% | ||||||||||||
Antero Resources Corp. | 57 | 57,094 | ||||||||||
Diamond Offshore Drilling, Inc. | 10 | 7,097 | ||||||||||
Energy Transfer Equity LP | 15 | 14,499 | ||||||||||
EnLink Midstream Partners LP | 90 | 83,264 | ||||||||||
Hess Infrastructure Partners LP/Hess Infrastructure Partners Finance Corp. | 35 | 34,905 | ||||||||||
PDC Energy, Inc. | 50 | 49,712 | ||||||||||
QEP Resources, Inc. | 68 | 66,971 | ||||||||||
Southern Star Central Corp. | 10 | 10,042 | ||||||||||
Sunoco LP/Sunoco Finance Corp. | 59 | 56,632 | ||||||||||
|
| |||||||||||
| 380,216 | ||||||||||||
|
| |||||||||||
Services – 0.1% | ||||||||||||
Aramark Services, Inc. | 38 | 36,276 | ||||||||||
|
| |||||||||||
Technology – 0.1% | ||||||||||||
Western Digital Corp. | 68 | 66,060 | ||||||||||
|
| |||||||||||
Transportation - Services – 0.1% | ||||||||||||
Hertz Corp. (The) | 45 | 35,390 | ||||||||||
|
| |||||||||||
| 883,007 | ||||||||||||
|
| |||||||||||
| 20 | AB FLEXFEE INTERNATIONAL BOND PORTFOLIO | abfunds.com |
PORTFOLIO OF INVESTMENTS (continued)
| Principal Amount (000) | U.S. $ Value | |||||||||||
| ||||||||||||
Utility – 0.1% | ||||||||||||
Electric – 0.1% | ||||||||||||
AES Corp./VA | U.S.$ | 65 | $ | 64,760 | ||||||||
|
| |||||||||||
Total Corporates – Non-Investment Grade | 2,066,195 | |||||||||||
|
| |||||||||||
INFLATION-LINKED SECURITIES – 4.0% | ||||||||||||
Japan – 3.8% | ||||||||||||
Japanese Government CPI Linked Bond | JPY | 12,311 | 116,589 | |||||||||
Series 21 | 168,457 | 1,604,479 | ||||||||||
|
| |||||||||||
| 1,721,068 | ||||||||||||
|
| |||||||||||
New Zealand – 0.2% | ||||||||||||
New Zealand Government Inflation Linked Bond | NZD | 136 | 103,024 | |||||||||
|
| |||||||||||
Total Inflation-Linked Securities | 1,824,092 | |||||||||||
|
| |||||||||||
COLLATERALIZED MORTGAGE OBLIGATIONS – 3.1% | ||||||||||||
Risk Share Floating Rate – 3.1% | ||||||||||||
Federal Home Loan Mortgage Corp. Structured Agency Credit Risk Debt Notes | U.S.$ | 350 | 403,960 | |||||||||
Federal National Mortgage Association Connecticut Avenue Securities | 76 | 82,978 | ||||||||||
Series 2015-C02, Class 2M2 | 70 | 75,241 | ||||||||||
Series 2015-C04, Class 2M2 | 290 | 328,185 | ||||||||||
Series 2016-C01, Class 1M2 | 100 | 121,135 | ||||||||||
| abfunds.com | AB FLEXFEE INTERNATIONAL BOND PORTFOLIO | 21 |
PORTFOLIO OF INVESTMENTS (continued)
| Principal Amount (000) | U.S. $ Value | |||||||||||
| ||||||||||||
Series 2016-C05, Class 2M2 | U.S.$ | 350 | $ | 389,824 | ||||||||
|
| |||||||||||
Total Collateralized Mortgage Obligations | 1,401,323 | |||||||||||
|
| |||||||||||
COVERED BONDS – 2.7% | ||||||||||||
Australia & New Zealand Banking Group Ltd. | EUR | 100 | 133,277 | |||||||||
Bank of Scotland PLC | 225 | 310,709 | ||||||||||
National Bank of Canada | 100 | 121,868 | ||||||||||
Nationwide Building Society | 250 | 338,232 | ||||||||||
Santander UK PLC | 250 | 327,198 | ||||||||||
|
| |||||||||||
Total Covered Bonds | 1,231,284 | |||||||||||
|
| |||||||||||
EMERGING MARKETS – TREASURIES – 1.4% | ||||||||||||
Argentina – 0.5% | ||||||||||||
Argentina POM Politica Monetaria | ARS | 4,724 | 166,778 | |||||||||
Argentine Bonos del Tesoro | 1,718 | 52,730 | ||||||||||
16.00%, 10/17/23 | 775 | 23,756 | ||||||||||
|
| |||||||||||
| 243,264 | ||||||||||||
|
| |||||||||||
Brazil – 0.9% | ||||||||||||
Brazil Notas do Tesouro Nacional | BRL | 1,625 | 385,979 | |||||||||
|
| |||||||||||
Total Emerging Markets — Treasuries | 629,243 | |||||||||||
|
| |||||||||||
SUPRANATIONALS – 0.7% | ||||||||||||
Supranational – 0.7% | ||||||||||||
European Financial Stability Facility | EUR | 259 | 302,663 | |||||||||
|
| |||||||||||
| 22 | AB FLEXFEE INTERNATIONAL BOND PORTFOLIO | abfunds.com |
PORTFOLIO OF INVESTMENTS (continued)
| Principal Amount (000) | U.S. $ Value | |||||||||||
| ||||||||||||
EMERGING MARKETS – SOVEREIGNS – 0.6% | ||||||||||||
Argentina – 0.1% | ||||||||||||
Argentine Republic Government International Bond | U.S.$ | 45 | $ | 42,097 | ||||||||
|
| |||||||||||
Brazil – 0.4% | ||||||||||||
Brazilian Government International Bond | 200 | 180,250 | ||||||||||
|
| |||||||||||
Costa Rica – 0.1% | ||||||||||||
Costa Rica Government International Bond | 34 | 33,905 | ||||||||||
|
| |||||||||||
Total Emerging Markets – Sovereigns | 256,252 | |||||||||||
|
| |||||||||||
COMMERCIAL MORTGAGE-BACKED SECURITIES – 0.5% | ||||||||||||
Non-Agency Fixed Rate CMBS – 0.5% | ||||||||||||
Commercial Mortgage Trust | 200 | 207,594 | ||||||||||
GS Mortgage Securities Trust | 20 | 19,357 | ||||||||||
|
| |||||||||||
Total Commercial Mortgage-Backed Securities | 226,951 | |||||||||||
|
| |||||||||||
QUASI-SOVEREIGNS – 0.4% | ||||||||||||
Quasi-Sovereign Bonds – 0.4% | ||||||||||||
South Korea – 0.4% | ||||||||||||
Export-Import Bank of Korea | AUD | 270 | 201,845 | |||||||||
|
| |||||||||||
GOVERNMENTS – SOVEREIGN BONDS – 0.4% | ||||||||||||
Qatar – 0.4% | ||||||||||||
Qatar Government International Bond | U.S.$ | 200 | 199,977 | |||||||||
|
| |||||||||||
| abfunds.com | AB FLEXFEE INTERNATIONAL BOND PORTFOLIO | 23 |
PORTFOLIO OF INVESTMENTS (continued)
| Principal Amount (000) | U.S. $ Value | |||||||||||
| ||||||||||||
ASSET-BACKED SECURITIES – 0.3% | ||||||||||||
Other ABS - Fixed Rate – 0.3% | ||||||||||||
Sofi Consumer Loan Program Trust | U.S.$ | 115 | $ | 113,940 | ||||||||
|
| |||||||||||
EMERGING MARKETS – CORPORATE BONDS – 0.1% | ||||||||||||
Industrial – 0.1% | ||||||||||||
Energy – 0.1% | ||||||||||||
Petrobras Global Finance BV | 28 | 27,727 | ||||||||||
|
| |||||||||||
Utility – 0.0% | ||||||||||||
Electric – 0.0% | ||||||||||||
Terraform Global Operating LLC | 18 | 17,842 | ||||||||||
|
| |||||||||||
Total Emerging Markets — Corporate Bonds | 45,569 | |||||||||||
|
| |||||||||||
BANK LOANS – 0.1% | ||||||||||||
Industrial – 0.1% | ||||||||||||
Other Industrial – 0.1% | ||||||||||||
American Tire Distributors, Inc. | 56 | 36,008 | ||||||||||
|
| |||||||||||
| Notional Amount | ||||||||||||
OPTIONS PURCHASED – CALLS – 0.0% | ||||||||||||
Options on Forward Contracts – 0.0% | ||||||||||||
MXN/USD | MXN | 2,500,000 | 2,275 | |||||||||
CNH/USD | CNH | 3,015,000 | 2,710 | |||||||||
USD/EUR | USD | 453,750 | 2,580 | |||||||||
|
| |||||||||||
| 7,565 | ||||||||||||
|
| |||||||||||
| 24 | AB FLEXFEE INTERNATIONAL BOND PORTFOLIO | abfunds.com |
PORTFOLIO OF INVESTMENTS (continued)
Notional Amount | U.S. $ Value | |||||||||||
| ||||||||||||
Swaptions – 0.0% | ||||||||||||
IRS Swaption | USD | 4,850,000 | $ | 1,585 | ||||||||
|
| |||||||||||
Total Options Purchased – Calls | 9,150 | |||||||||||
|
| |||||||||||
OPTIONS PURCHASED – PUTS – 0.0% | ||||||||||||
Options on Forward Contracts – 0.0% | ||||||||||||
MXN/USD | MXN | 2,242,625 | 63 | |||||||||
|
| |||||||||||
| Shares | ||||||||||||
SHORT-TERM INVESTMENTS – 1.7% | ||||||||||||
Investment Companies – 1.7% | ||||||||||||
AB Fixed Income Shares, Inc. – Government Money Market Portfolio – Class AB, 1.71%(g)(h)(i) | 773,279 | 773,279 | ||||||||||
|
| |||||||||||
Total Investments – 97.9% | 44,438,536 | |||||||||||
Other assets less liabilities – 2.1% | 965,449 | |||||||||||
|
| |||||||||||
Net Assets – 100.0% | $ | 45,403,985 | ||||||||||
|
| |||||||||||
FUTURES (see Note C)
| Description | Number of Contracts | Expiration Month | Notional (000) | Original Value | Value at June 30, 2018 | Unrealized Appreciation/ (Depreciation) | ||||||||||||||||||||||
Purchased Contracts |
| |||||||||||||||||||||||||||
3 Yr Australian Bond Futures | 13 | September 2018 | AUD | 13,000 | $ | 1,068,854 | $ | 1,071,197 | $ | 2,343 | ||||||||||||||||||
Euro-BOBL Futures | 4 | September 2018 | EUR | 4,000 | 614,730 | 617,393 | 2,663 | |||||||||||||||||||||
Euro-Bund Futures | 7 | September 2018 | EUR | 7,000 | 1,320,770 | 1,328,781 | 8,011 | |||||||||||||||||||||
Euro-OAT Futures | 3 | September 2018 | EUR | 3,000 | 535,984 | 541,415 | 5,431 | |||||||||||||||||||||
Long Gilt Bond Futures | 10 | September 2018 | GBP | 10,000 | 1,621,339 | 1,624,084 | 2,745 | |||||||||||||||||||||
| abfunds.com | AB FLEXFEE INTERNATIONAL BOND PORTFOLIO | 25 |
PORTFOLIO OF INVESTMENTS (continued)
| Description | Number of Contracts | Expiration Month | Notional (000) | Original Value | Value at June 30, 2018 | Unrealized Appreciation/ (Depreciation) | ||||||||||||||||||||||
U.S. T-Note 2 Yr (CBT) Futures | 14 | September 2018 | USD | 28,000 | $ | 2,964,063 | $ | 2,965,594 | $ | 1,531 | ||||||||||||||||||
U.S. Ultra Bond (CBT) Futures | 6 | September 2018 | USD | 6,000 | 920,523 | 957,375 | 36,852 | |||||||||||||||||||||
Sold Contracts |
| |||||||||||||||||||||||||||
Euro Buxl 30 Yr Bond Futures | 14 | September 2018 | EUR | 14,000 | 2,836,586 | 2,905,253 | (68,667 | ) | ||||||||||||||||||||
U.S. T-Note 5 Yr (CBT) Futures | 56 | September 2018 | USD | 56,000 | 6,350,125 | 6,362,563 | (12,438 | ) | ||||||||||||||||||||
U.S. T-Note 10 Yr (CBT) Futures | 2 | September 2018 | USD | 2,000 | 239,094 | 240,375 | (1,281 | ) | ||||||||||||||||||||
U.S. Ultra Bond (CBT) Futures | 16 | September 2018 | USD | 16,000 | 2,040,578 | 2,051,750 | (11,172 | ) | ||||||||||||||||||||
|
| |||||||||||||||||||||||||||
| $ | (33,982 | ) | ||||||||||||||||||||||||||
|
| |||||||||||||||||||||||||||
FORWARD CURRENCY EXCHANGE CONTRACTS (see Note C)
| Counterparty | Contracts to Deliver (000) | In Exchange For (000) | Settlement Date | Unrealized Appreciation/ (Depreciation) | ||||||||||||||||
Bank of America, NA | BRL | 1,154 | USD | 306 | 7/03/18 | $ | 7,814 | |||||||||||||
Bank of America, NA | USD | 301 | BRL | 1,154 | 7/03/18 | (3,684 | ) | |||||||||||||
Bank of America, NA | USD | 142 | ILS | 509 | 7/12/18 | (2,623 | ) | |||||||||||||
Bank of America, NA | NZD | 984 | USD | 690 | 8/09/18 | 23,001 | ||||||||||||||
Bank of America, NA | ZAR | 593 | GBP | 34 | 10/17/18 | 1,838 | ||||||||||||||
Barclays Bank PLC | MYR | 834 | USD | 206 | 7/12/18 | (748 | ) | |||||||||||||
Barclays Bank PLC | KRW | 49,840 | USD | 45 | 7/19/18 | 308 | ||||||||||||||
Barclays Bank PLC | TWD | 17,930 | USD | 605 | 9/13/18 | 13,821 | ||||||||||||||
Barclays Bank PLC | USD | 205 | MYR | 834 | 11/29/18 | 615 | ||||||||||||||
BNP Paribas SA | EUR | 585 | USD | 686 | 7/18/18 | 2,023 | ||||||||||||||
BNP Paribas SA | GBP | 1,976 | USD | 2,652 | 8/03/18 | 40,064 | ||||||||||||||
Brown Brothers Harriman & Co. | TRY | 206 | USD | 45 | 7/16/18 | 485 | ||||||||||||||
Brown Brothers Harriman & Co. | TRY | 1,068 | USD | 223 | 7/16/18 | (8,607 | ) | |||||||||||||
Brown Brothers Harriman & Co. | USD | 269 | TRY | 1,246 | 7/16/18 | 1,095 | ||||||||||||||
Brown Brothers Harriman & Co. | USD | 261 | TRY | 1,179 | 7/16/18 | (5,612 | ) | |||||||||||||
Brown Brothers Harriman & Co. | EUR | 114 | CHF | 133 | 7/18/18 | 693 | ||||||||||||||
Brown Brothers Harriman & Co. | EUR | 1,574 | USD | 1,833 | 7/18/18 | (6,438 | ) | |||||||||||||
Brown Brothers Harriman & Co. | EUR | 292 | USD | 341 | 7/18/18 | 136 | ||||||||||||||
Brown Brothers Harriman & Co. | USD | 1,031 | EUR | 875 | 7/18/18 | (8,233 | ) | |||||||||||||
Brown Brothers Harriman & Co. | EUR | 116 | SEK | 1,173 | 7/26/18 | (4,015 | ) | |||||||||||||
Brown Brothers Harriman & Co. | SEK | 2,382 | USD | 277 | 7/26/18 | 10,267 | ||||||||||||||
Brown Brothers Harriman & Co. | USD | 120 | NOK | 967 | 7/26/18 | (772 | ) | |||||||||||||
Brown Brothers Harriman & Co. | USD | 184 | SEK | 1,606 | 7/26/18 | (4,210 | ) | |||||||||||||
Brown Brothers Harriman & Co. | MXN | 8,435 | USD | 406 | 8/07/18 | (16,705 | ) | |||||||||||||
Brown Brothers Harriman & Co. | USD | 106 | MXN | 2,123 | 8/07/18 | 519 | ||||||||||||||
Brown Brothers Harriman & Co. | SGD | 1,017 | USD | 762 | 8/16/18 | 14,574 | ||||||||||||||
| 26 | AB FLEXFEE INTERNATIONAL BOND PORTFOLIO | abfunds.com |
PORTFOLIO OF INVESTMENTS (continued)
| Counterparty | Contracts to Deliver (000) | In Exchange For (000) | Settlement Date | Unrealized Appreciation/ (Depreciation) | ||||||||||||||||
Brown Brothers Harriman & Co. | CAD | 1,162 | USD | 896 | 8/30/18 | $ | 11,221 | |||||||||||||
Brown Brothers Harriman & Co. | USD | 67 | ZAR | 913 | 9/07/18 | (1,046 | ) | |||||||||||||
Brown Brothers Harriman & Co. | CHF | 174 | USD | 177 | 9/18/18 | 240 | ||||||||||||||
Brown Brothers Harriman & Co. | TRY | 603 | USD | 125 | 9/18/18 | (1,963 | ) | |||||||||||||
Brown Brothers Harriman & Co. | USD | 46 | CHF | 46 | 9/18/18 | 160 | ||||||||||||||
Brown Brothers Harriman & Co. | USD | 107 | JPY | 11,589 | 10/04/18 | (1,261 | ) | |||||||||||||
Citibank, NA | BRL | 2,395 | USD | 655 | 7/03/18 | 37,079 | ||||||||||||||
Citibank, NA | USD | 621 | BRL | 2,395 | 7/03/18 | (3,197 | ) | |||||||||||||
Citibank, NA | ARS | 2,085 | USD | 81 | 7/05/18 | 8,879 | ||||||||||||||
Citibank, NA | USD | 78 | ARS | 2,125 | 7/05/18 | (4,539 | ) | |||||||||||||
Citibank, NA | EUR | 13,606 | USD | 15,920 | 7/18/18 | 13,103 | ||||||||||||||
Citibank, NA | COP | 633,183 | USD | 219 | 7/25/18 | 2,795 | ||||||||||||||
Citibank, NA | ARS | 2,125 | USD | 76 | 7/26/18 | 4,861 | ||||||||||||||
Citibank, NA | KRW | 136,642 | USD | 127 | 7/26/18 | 4,233 | ||||||||||||||
Citibank, NA | USD | 697 | SEK | 6,040 | 7/26/18 | (21,558 | ) | |||||||||||||
Citibank, NA | UYU | 1,231 | USD | 41 | 8/07/18 | 1,980 | ||||||||||||||
Citibank, NA | AUD | 666 | USD | 507 | 8/09/18 | 13,622 | ||||||||||||||
Citibank, NA | INR | 18,287 | USD | 268 | 8/09/18 | 2,617 | ||||||||||||||
Citibank, NA | USD | 444 | INR | 30,186 | 8/09/18 | (5,650 | ) | |||||||||||||
Credit Suisse International | USD | 221 | TRY | 1,038 | 7/02/18 | 5,563 | ||||||||||||||
Credit Suisse International | USD | 25 | ZAR | 298 | 7/05/18 | (3,054 | ) | |||||||||||||
Credit Suisse International | USD | 309 | ILS | 1,116 | 7/12/18 | (3,775 | ) | |||||||||||||
Credit Suisse International | TRY | 1,175 | USD | 247 | 7/31/18 | (5,722 | ) | |||||||||||||
Credit Suisse International | USD | 61 | MXN | 1,146 | 8/02/18 | (3,809 | ) | |||||||||||||
Credit Suisse International | CHF | 47 | SGD | 67 | 8/27/18 | 1,626 | ||||||||||||||
Credit Suisse International | CNH | 609 | USD | 92 | 8/28/18 | 687 | ||||||||||||||
Credit Suisse International | GBP | 12 | ZAR | 217 | 10/17/18 | (538 | ) | |||||||||||||
Goldman Sachs Bank USA | KRW | 147,282 | USD | 137 | 7/26/18 | 4,527 | ||||||||||||||
Goldman Sachs Bank USA | JPY | 755,691 | USD | 6,934 | 10/04/18 | 62,675 | ||||||||||||||
JPMorgan Chase Bank, NA | ARS | 4,573 | USD | 177 | 7/05/18 | 19,615 | ||||||||||||||
JPMorgan Chase Bank, NA | USD | 86 | ILS | 308 | 7/12/18 | (1,648 | ) | |||||||||||||
JPMorgan Chase Bank, NA | EUR | 77 | TRY | 430 | 7/16/18 | 2,620 | ||||||||||||||
JPMorgan Chase Bank, NA | USD | 217 | IDR | 3,018,458 | 7/26/18 | (6,682 | ) | |||||||||||||
JPMorgan Chase Bank, NA | USD | 20 | MXN | 366 | 8/02/18 | (1,408 | ) | |||||||||||||
JPMorgan Chase Bank, NA | USD | 92 | CNH | 609 | 8/28/18 | (687 | ) | |||||||||||||
JPMorgan Chase Bank, NA | TWD | 3,832 | USD | 130 | 9/13/18 | 3,372 | ||||||||||||||
Morgan Stanley Capital Services LLC | BRL | 2,942 | USD | 763 | 7/03/18 | 3,928 | ||||||||||||||
Morgan Stanley Capital Services LLC | USD | 779 | BRL | 2,942 | 7/03/18 | (20,262 | ) | |||||||||||||
Morgan Stanley Capital Services LLC | ZAR | 298 | USD | 25 | 7/05/18 | 3,054 | ||||||||||||||
Morgan Stanley Capital Services LLC | USD | 213 | MYR | 834 | 7/12/18 | (6,626 | ) | |||||||||||||
Morgan Stanley Capital Services LLC | SEK | 6,935 | USD | 795 | 7/26/18 | 19,683 | ||||||||||||||
Morgan Stanley Capital Services LLC | USD | 680 | KRW | 722,528 | 7/26/18 | (30,469 | ) | |||||||||||||
Morgan Stanley Capital Services LLC | BRL | 2,942 | USD | 777 | 8/02/18 | 20,850 | ||||||||||||||
Royal Bank of Scotland PLC | ILS | 3,157 | USD | 902 | 7/12/18 | 37,883 | ||||||||||||||
Royal Bank of Scotland PLC | ARS | 1,754 | USD | 61 | 7/26/18 | 2,010 | ||||||||||||||
| abfunds.com | AB FLEXFEE INTERNATIONAL BOND PORTFOLIO | 27 |
PORTFOLIO OF INVESTMENTS (continued)
| Counterparty | Contracts to Deliver (000) | In Exchange For (000) | Settlement Date | Unrealized Appreciation/ (Depreciation) | ||||||||||||||||||||
Royal Bank of Scotland PLC | MXN | 1,146 | USD | 61 | 8/02/18 | $ | 3,809 | |||||||||||||||||
Royal Bank of Scotland PLC | CAD | 7,623 | USD | 5,894 | 8/30/18 | 89,704 | ||||||||||||||||||
Standard Chartered Bank | KRW | 194,784 | USD | 180 | 7/26/18 | 5,379 | ||||||||||||||||||
Standard Chartered Bank | KRW | 242,371 | USD | 217 | 7/26/18 | (483 | ) | |||||||||||||||||
Standard Chartered Bank | USD | 232 | BRL | 881 | 8/02/18 | (5,576 | ) | |||||||||||||||||
Standard Chartered Bank | INR | 14,277 | USD | 207 | 8/09/18 | (587 | ) | |||||||||||||||||
UBS AG | SGD | 67 | CHF | 47 | 8/27/18 | (1,625 | ) | |||||||||||||||||
UBS AG | ZAR | 217 | GBP | 12 | 10/17/18 | 539 | ||||||||||||||||||
|
| |||||||||||||||||||||||
| $ | 311,755 | |||||||||||||||||||||||
|
| |||||||||||||||||||||||
INTEREST RATE SWAPTIONS WRITTEN (see Note C)
| Description | Index | Counterparty | Strike Rate | Expiration Date | Notional Amount (000) | Premiums Received | Market Value | |||||||||||||||||||||
Put | ||||||||||||||||||||||||||||
OTC – 1 Year Interest Rate Swap | | 3 Month LIBOR | | | Morgan Stanley Capital Services LLC | | 2.82 | % | 7/06/18 | USD 11,650 | $ | 12,515 | $ | (4,168 | ) | |||||||||||||
CURRENCY OPTIONS WRITTEN (see Note C)
| Description/ Counterparty | Exercise Price | Expiration Month | Contracts | Notional Amount (000) | Premiums Received | U.S. $ Value | ||||||||||||||||||||||||||
Call | ||||||||||||||||||||||||||||||||
CHF vs. SGD/ | SGD | 1.480 | 08/2018 | 370,000 | SGD | 370 | $ | 1,922 | $ | (164 | ) | |||||||||||||||||||||
CHF vs. TRY/ | TRY | 5.900 | 02/2019 | 590,000 | TRY | 590 | 1,079 | (2,251 | ) | |||||||||||||||||||||||
EUR vs. USD/ | USD | 1.250 | 10/2018 | 468,750 | USD | 469 | 2,595 | (604 | ) | |||||||||||||||||||||||
GBP vs. ZAR/ | ZAR | 19.520 | 10/2018 | 1,464,000 | ZAR | 1,464 | 1,328 | (1,507 | ) | |||||||||||||||||||||||
USD vs. INR/ | INR | 71.320 | 02/2019 | 7,132,000 | INR | 7,132 | 926 | (1,726 | ) | |||||||||||||||||||||||
USD vs. KRW/ | KRW | 1,098.000 | 07/2018 | 137,250,000 | KRW | 137,250 | 820 | (2,034 | ) | |||||||||||||||||||||||
USD vs. MXN/ | MXN | 20.000 | 07/2018 | 2,500,000 | MXN | 2,500 | 1,833 | (2,274 | ) | |||||||||||||||||||||||
USD vs. MXN/ | MXN | 23.820 | 02/2019 | 2,382,000 | MXN | 2,382 | 1,332 | (1,120 | ) | |||||||||||||||||||||||
USD vs. ZAR/ | ZAR | 12.640 | 07/2018 | 1,579,550 | ZAR | 1,580 | 1,440 | (9,886 | ) | |||||||||||||||||||||||
| 28 | AB FLEXFEE INTERNATIONAL BOND PORTFOLIO | abfunds.com |
PORTFOLIO OF INVESTMENTS (continued)
Description/ Counterparty | Exercise Price | Expiration Month | Contracts | Notional Amount (000) | Premiums Received | U.S. $ Value | ||||||||||||||||||||||||||||||
Put | ||||||||||||||||||||||||||||||||||||
EUR vs. USD/ | USD | 1.170 | 10/2018 | 438,750 | USD | 439 | $ | 3,675 | $ | (5,821 | ) | |||||||||||||||||||||||||
|
|
|
| |||||||||||||||||||||||||||||||||
| $ | 16,950 | $ | (27,387 | ) | ||||||||||||||||||||||||||||||||
|
|
|
| |||||||||||||||||||||||||||||||||
CENTRALLY CLEARED CREDIT DEFAULT SWAPS (see Note C)
Description | Fixed Rate (Pay) Receive | Payment Frequency | Implied Credit Spread at June 30, 2018 | Notional Amount (000) | Market Value | Upfront Premiums Paid (Received) | Unrealized Appreciation/ (Depreciation) | |||||||||||||||||||||||||
Buy Contracts |
| |||||||||||||||||||||||||||||||
iTraxx Australia Series 29, 5 Year Index, 6/20/23* | (1.00 | )% | Quarterly | 0.81 | % | USD | 4,500 | $ | (41,043 | ) | $ | (59,377 | ) | $ | 18,334 | |||||||||||||||||
Sale Contracts |
| |||||||||||||||||||||||||||||||
CDX-NAIG Series 30, 5 Year Index, 6/20/23* | 1.00 | Quarterly | 0.67 | USD | 4,500 | 69,256 | 75,727 | (6,471 | ) | |||||||||||||||||||||||
|
|
|
|
|
| |||||||||||||||||||||||||||
| $ | 28,213 | $ | 16,350 | $ | 11,863 | |||||||||||||||||||||||||||
|
|
|
|
|
| |||||||||||||||||||||||||||
| * | Termination date |
CENTRALLY CLEARED INTEREST RATE SWAPS (see Note C)
| Rate Type | ||||||||||||||||||||||
| Notional Amount (000) | Termination Date | Payments made by the Fund | Payments received by the Fund | Payment Frequency | Unrealized Appreciation/ (Depreciation) | |||||||||||||||||
USD | 5,610 | 1/17/20 | 3 Month LIBOR | 2.170% | Quarterly/ Semi-Annual | $ | (20,048 | ) | ||||||||||||||
USD | 5,610 | 1/17/20 | 3 Month LIBOR | 2.204% | Quarterly/ Semi-Annual | (16,313 | ) | |||||||||||||||
USD | 2,355 | 1/17/23 | 2.389% | 3 Month LIBOR | Semi-Annual/ Quarterly | 37,192 | ||||||||||||||||
USD | 2,355 | 1/17/23 | 2.420% | 3 Month LIBOR | Semi-Annual/ Quarterly | 33,706 | ||||||||||||||||
GBP | 130 | 12/27/47 | 1.419% | 6 Month LIBOR | Semi-Annual/ Semi-Annual | 8,499 | ||||||||||||||||
EUR | 1,550 | 6/08/48 | 6 Month EURIBOR | 1.544% | Semi-Annual/ Annual | 42,662 | ||||||||||||||||
|
| |||||||||||||||||||||
| $ | 85,698 | |||||||||||||||||||||
|
| |||||||||||||||||||||
| abfunds.com | AB FLEXFEE INTERNATIONAL BOND PORTFOLIO | 29 |
PORTFOLIO OF INVESTMENTS (continued)
CREDIT DEFAULT SWAPS (see Note C)
| Swap Counterparty & Referenced Obligation | Fixed Rate (Pay) Receive | Payment Frequency | Implied Credit Spread at June 30, 2018 | Notional Amount (000) | Market Value | Upfront Premiums Paid (Received) | Unrealized Appreciation/ (Depreciation) | |||||||||||||||||||||
Sale Contracts | ||||||||||||||||||||||||||||
Deutsche Bank AG | ||||||||||||||||||||||||||||
CDX-CMBX.NA.A Series 6, 5/11/63* | 2.00 | % | Monthly | 2.14 | % | USD | 100 | $ | (491 | ) | $ | (4,014 | ) | $ | 3,523 | |||||||||||||
Morgan Stanley & Co. International PLC | ||||||||||||||||||||||||||||
CDX-CMBX.NA.A Series 6, 5/11/63* | 2.00 | Monthly | 2.14 | USD | 360 | (1,768 | ) | (18,528 | ) | 16,760 | ||||||||||||||||||
CDX-CMBX.NA.A Series 6, 5/11/63* | 2.00 | Monthly | 2.14 | USD | 470 | (2,308 | ) | (23,129 | ) | 20,821 | ||||||||||||||||||
|
|
|
|
|
| |||||||||||||||||||||||
| $ | (4,567 | ) | $ | (45,671 | ) | $ | 41,104 | |||||||||||||||||||||
|
|
|
|
|
| |||||||||||||||||||||||
| * | Termination date |
VARIANCE SWAPS (see Note C)
Swap Counterparty & | Volatility Strike Price | Payment Frequency | Notional Amount (000) | Market Value | Upfront Premiums (Paid) Received | Unrealized Appreciation/ (Depreciation) | ||||||||||||||||||||||
Buy Contracts | ||||||||||||||||||||||||||||
Deutsche Bank AG | ||||||||||||||||||||||||||||
AUD/JPY 1/14/20* | 11.12 | % | Maturity | AUD | 6 | $ | 1,428 | $ | – 0 | – | $ | 1,428 | ||||||||||||||||
AUD/JPY 3/03/20* | 12.75 | Maturity | AUD | 3 | (512 | ) | – 0 | – | (512 | ) | ||||||||||||||||||
AUD/JPY 4/16/20* | 12.25 | Maturity | AUD | 7 | 177 | – 0 | – | 177 | ||||||||||||||||||||
AUD/JPY 5/07/20* | 12.22 | Maturity | AUD | 5 | 219 | – 0 | – | 219 | ||||||||||||||||||||
Goldman Sachs Bank USA | ||||||||||||||||||||||||||||
AUD/JPY 3/10/20* | 12.90 | Maturity | AUD | 1 | (209 | ) | – 0 | – | (209 | ) | ||||||||||||||||||
AUD/JPY 3/11/20* | 12.80 | Maturity | AUD | 2 | (350 | ) | – 0 | – | (350 | ) | ||||||||||||||||||
|
|
|
|
|
| |||||||||||||||||||||||
| $ | 753 | $ | – 0 | – | $ | 753 | ||||||||||||||||||||||
|
|
|
|
|
| |||||||||||||||||||||||
| * | Termination date |
| (a) | Security is exempt from registration under Rule 144A of the Securities Act of 1933. These securities are considered restricted, but liquid and may be resold in transactions exempt from registration, normally to qualified institutional buyers. At June 30, 2018, the aggregate market value of these securities amounted to $20,187,228 or 44.5% of net assets. |
| (b) | Securities are perpetual and, thus, do not have a predetermined maturity date. The date shown, if applicable, reflects the next call date. |
| (c) | Floating Rate Security. Stated interest/floor/ceiling rate was in effect at June 30, 2018. |
| (d) | Security in which significant unobservable inputs (Level 3) were used in determining fair value. |
| (e) | The stated coupon rate represents the greater of the LIBOR or the LIBOR floor rate plus a spread at June 30, 2018. |
| 30 | AB FLEXFEE INTERNATIONAL BOND PORTFOLIO | abfunds.com |
PORTFOLIO OF INVESTMENTS (continued)
| (f) | Non-income producing security. |
| (g) | Affiliated investments. |
| (h) | To obtain a copy of the fund’s shareholder report, please go to the Securities and Exchange Commission’s website at www.sec.gov, or call AB at (800) 227-4618. |
| (i) | The rate shown represents the 7-day yield as of period end. |
Currency Abbreviations:
ARS – Argentine Peso
AUD – Australian Dollar
BRL – Brazilian Real
CAD – Canadian Dollar
CHF – Swiss Franc
CNH – Chinese Yuan Renminbi (Offshore)
COP – Colombian Peso
EUR – Euro
GBP – Great British Pound
IDR – Indonesian Rupiah
ILS – Israeli Shekel
INR – Indian Rupee
JPY – Japanese Yen
KRW – South Korean Won
MXN – Mexican Peso
MYR – Malaysian Ringgit
NOK – Norwegian Krone
NZD – New Zealand Dollar
RUB – Russian Ruble
SEK – Swedish Krona
SGD – Singapore Dollar
TRY – Turkish Lira
TWD – New Taiwan Dollar
USD – United States Dollar
UYU – Uruguayan Peso
ZAR – South African Rand
Glossary:
ABS – Asset-Backed Securities
ARPP7DRR – Argentina Central Bank 7Day Repo Reference Rate
BOBL – Bundesobligationen
CBT – Chicago Board of Trade
CDX-CMBX.NA – North American Commercial Mortgage-Backed Index
CDX-NAIG – North American Investment Grade Credit Default Swap Index
CMBS – Commercial Mortgage-Backed Securities
CPI – Consumer Price Index
EURIBOR – Euro Interbank Offered Rate
IRS – Interest Rate Swaption
LIBOR – London Interbank Offered Rates
OAT – Obligations Assimilables du Trésor
REIT – Real Estate Investment Trust
See notes to financial statements.
| abfunds.com | AB FLEXFEE INTERNATIONAL BOND PORTFOLIO | 31 |
STATEMENT OF ASSETS & LIABILITIES
June 30, 2018 (unaudited)
| Assets | ||||
Investments in securities, at value | ||||
Unaffiliated issuers (cost $44,499,120) | $ | 43,665,257 | ||
Affiliated issuers (cost $773,279) | 773,279 | |||
Cash collateral due from broker | 494,119 | |||
Foreign currencies, at value (cost $277,716) | 278,460 | |||
Unrealized appreciation on forward currency exchange contracts | 505,567 | |||
Unaffiliated interest receivable | 386,582 | |||
Unrealized appreciation on credit default swaps | 41,104 | |||
Receivable for investment securities sold and foreign currency transactions | 29,448 | |||
Receivable from Adviser | 26,564 | |||
Receivable for variation margin on centrally cleared swaps | 12,565 | |||
Unrealized appreciation on variance swaps | 1,824 | |||
Affiliated dividends receivable | 559 | |||
Receivable for capital stock sold | 41 | |||
|
| |||
Total assets | 46,215,369 | |||
|
| |||
| Liabilities | ||||
Options written, at value (premiums received $16,950) | 27,387 | |||
Swaptions written, at value (premiums received $12,515) | 4,168 | |||
Payable for investment securities purchased and foreign currency transactions | 388,107 | |||
Unrealized depreciation on forward currency exchange contracts | 193,812 | |||
Dividends payable | 48,202 | |||
Upfront premiums received on credit default swaps | 45,671 | |||
Payable for variation margin on futures | 14,432 | |||
Directors’ fee payable | 3,058 | |||
Transfer Agent fee payable | 2,960 | |||
Unrealized depreciation on variance swaps | 1,071 | |||
Due to Custodian | 655 | |||
Accrued expenses and other liabilities | 81,861 | |||
|
| |||
Total liabilities | 811,384 | |||
|
| |||
Net Assets | $ | 45,403,985 | ||
|
| |||
| Composition of Net Assets | ||||
Capital stock, at par | $ | 4,554 | ||
Additional paid-in capital | 45,501,323 | |||
Distributions in excess of net investment income | (218,573 | ) | ||
Accumulated net realized gain on investment and foreign currency transactions | 542,492 | |||
Net unrealized depreciation on investments and foreign currency denominated assets and liabilities | (425,811 | ) | ||
|
| |||
| $ | 45,403,985 | |||
|
|
Net Asset Value Per Share—33 billion shares of capital stock authorized, $.001 par value
| Class | Net Assets | Shares Outstanding | Net Asset Value | |||||||||
| ||||||||||||
| Advisor | $ | 45,403,985 | 4,554,178 | $ | 9.97 | |||||||
| ||||||||||||
See notes to financial statements.
| 32 | AB FLEXFEE INTERNATIONAL BOND PORTFOLIO | abfunds.com |
STATEMENT OF OPERATIONS
Six Months Ended June 30, 2018 (unaudited)
| Investment Income | ||||||||
Interest (net of foreign taxes withheld of $8,161) | $ | 479,466 | ||||||
Affiliated issuers | 3,770 | $ | 483,236 | |||||
|
| |||||||
| Expenses | ||||||||
Advisory fee (see Note B) | 22,466 | |||||||
Transfer agency—Advisor Class | 8,960 | |||||||
Custodian | 49,471 | |||||||
Amortization of offering expenses | 46,189 | |||||||
Administrative | 33,449 | |||||||
Audit and tax | 28,060 | |||||||
Legal | 27,296 | |||||||
Registration fees | 16,860 | |||||||
Printing | 14,584 | |||||||
Directors’ fees | 8,194 | |||||||
Miscellaneous | 11,525 | |||||||
|
| |||||||
Total expenses | 267,054 | |||||||
Less: expenses waived and reimbursed by the Adviser (see Note B) | (222,272 | ) | ||||||
|
| |||||||
Net expenses | 44,782 | |||||||
|
| |||||||
Net investment income | 438,454 | |||||||
|
| |||||||
| Realized and Unrealized Gain (Loss) on Investment and Foreign Currency Transactions | ||||||||
Net realized gain (loss) on: | ||||||||
Investment transactions | (79,021 | ) | ||||||
Forward currency exchange contracts | 568,121 | |||||||
Futures | 156,593 | |||||||
Options written | 22,672 | |||||||
Swaps | 4,364 | |||||||
Swaptions written | 29,252 | |||||||
Foreign currency transactions | (105,766 | ) | ||||||
Net change in unrealized appreciation/depreciation on: | ||||||||
Investments | (1,358,789 | ) | ||||||
Forward currency exchange contracts | 636,701 | |||||||
Futures | (70,781 | ) | ||||||
Options written | (10,098 | ) | ||||||
Swaps | 124,279 | |||||||
Swaptions written | 8,347 | |||||||
Foreign currency denominated assets and liabilities | (17,692 | ) | ||||||
|
| |||||||
Net loss on investment and foreign currency transactions | (91,818 | ) | ||||||
|
| |||||||
Net Increase in Net Assets from Operations | $ | 346,636 | ||||||
|
|
See notes to financial statements.
| abfunds.com | AB FLEXFEE INTERNATIONAL BOND PORTFOLIO | 33 |
STATEMENT OF CHANGES IN NET ASSETS
| Six Months Ended June 30, 2018 (unaudited) | June 28, 2017(a) to December 31, 2017 | |||||||
| Increase (Decrease) in Net Assets from Operations | ||||||||
Net investment income | $ | 438,454 | $ | 262,955 | ||||
Net realized gain (loss) on investment and foreign currency transactions | 596,215 | (142,515 | ) | |||||
Net change in unrealized appreciation/depreciation on investments and foreign currency denominated assets and liabilities | (688,033 | ) | 262,222 | |||||
|
|
|
| |||||
Net increase in net assets from operations | 346,636 | 382,662 | ||||||
| Dividends to Shareholders from | ||||||||
Net investment income | ||||||||
Advisor Class | (329,423 | ) | (501,767 | ) | ||||
| Capital Stock Transactions | ||||||||
Net increase | 505,874 | 45,000,003 | ||||||
|
|
|
| |||||
Total increase | 523,087 | 44,880,898 | ||||||
| Net Assets | ||||||||
Beginning of period | 44,880,898 | – 0 | – | |||||
|
|
|
| |||||
End of period (including distributions in excess of net investment income of ($218,573) and ($327,604), respectively) | $ | 45,403,985 | $ | 44,880,898 | ||||
|
|
|
| |||||
| (a) | Commencement of operations. |
See notes to financial statements.
| 34 | AB FLEXFEE INTERNATIONAL BOND PORTFOLIO | abfunds.com |
NOTES TO FINANCIAL STATEMENTS
June 30, 2018 (unaudited)
NOTE A
Significant Accounting Policies
AB Bond Fund, Inc. (the “Company”) is registered under the Investment Company Act of 1940 as an open-end management investment company. The Company, which is a Maryland corporation, operates as a series company comprised of nine portfolios currently in operation. Each Portfolio is considered to be a separate entity for financial reporting and tax purposes. This report relates only to the AB FlexFee International Bond Portfolio (the “Fund”), a diversified portfolio. The Fund commenced operations on June 28, 2017. The Fund has authorized issuance of Class A, Class B, Class C, Advisor Class, Class R, Class K, Class I, Class Z, Class T, Class 1, and Class 2 shares. Class A, Class B, Class C, Class R, Class K, Class I, Class Z, Class T, Class 1 and Class 2 shares have not been issued. As of June 30, 2018, AllianceBernstein L.P. (the “Adviser”) was the sole shareholder of Advisor Class shares. Advisor Class shares are sold without an initial or contingent deferred sales charge and are not subject to ongoing distribution expenses. All eleven classes of shares have identical voting, dividend, liquidation and other rights, except that the classes bear different distribution and transfer agency expenses. Each class has exclusive voting rights with respect to its distribution plan. The financial statements have been prepared in conformity with U.S. generally accepted accounting principles (“U.S. GAAP”), which require management to make certain estimates and assumptions that affect the reported amounts of assets and liabilities in the financial statements and amounts of income and expenses during the reporting period. Actual results could differ from those estimates. The Fund is an investment company under U.S. GAAP and follows the accounting and reporting guidance applicable to investment companies. The following is a summary of significant accounting policies followed by the Fund.
1. Security Valuation
Portfolio securities are valued at their current market value determined on the basis of market quotations or, if market quotations are not readily available or are deemed unreliable, at “fair value” as determined in accordance with procedures established by and under the general supervision of the Fund’s Board of Directors (the “Board”).
In general, the market values of securities which are readily available and deemed reliable are determined as follows: securities listed on a national securities exchange (other than securities listed on the NASDAQ Stock Market, Inc. (“NASDAQ”)) or on a foreign securities exchange are valued at the last sale price at the close of the exchange or foreign securities exchange. If there has been no sale on such day, the securities are valued at the last traded price from the previous day. Securities listed on more
| abfunds.com | AB FLEXFEE INTERNATIONAL BOND PORTFOLIO | 35 |
NOTES TO FINANCIAL STATEMENTS (continued)
than one exchange are valued by reference to the principal exchange on which the securities are traded; securities listed only on NASDAQ are valued in accordance with the NASDAQ Official Closing Price; listed or over the counter (“OTC”) market put or call options are valued at the mid level between the current bid and ask prices. If either a current bid or current ask price is unavailable, the Adviser will have discretion to determine the best valuation (e.g., last trade price in the case of listed options); open futures are valued using the closing settlement price or, in the absence of such a price, the most recent quoted bid price. If there are no quotations available for the day of valuation, the last available closing settlement price is used; U.S. Government securities and any other debt instruments having 60 days or less remaining until maturity are generally valued at market by an independent pricing vendor, if a market price is available. If a market price is not available, the securities are valued at amortized cost. This methodology is commonly used for short term securities that have an original maturity of 60 days or less, as well as short term securities that had an original term to maturity that exceeded 60 days. In instances when amortized cost is utilized, the Valuation Committee (the “Committee”) must reasonably conclude that the utilization of amortized cost is approximately the same as the fair value of the security. Such factors the Committee will consider include, but are not limited to, an impairment of the creditworthiness of the issuer or material changes in interest rates. Fixed-income securities, including mortgage-backed and asset-backed securities, may be valued on the basis of prices provided by a pricing service or at a price obtained from one or more of the major broker-dealers. In cases where broker-dealer quotes are obtained, the Adviser may establish procedures whereby changes in market yields or spreads are used to adjust, on a daily basis, a recently obtained quoted price on a security. Swaps and other derivatives are valued daily, primarily using independent pricing services, independent pricing models using market inputs, as well as third party broker-dealers or counterparties. Open end mutual funds are valued at the closing net asset value per share, while exchange traded funds are valued at the closing market price per share.
Securities for which market quotations are not readily available (including restricted securities) or are deemed unreliable are valued at fair value as deemed appropriate by the Adviser. Factors considered in making this determination may include, but are not limited to, information obtained by contacting the issuer, analysts, analysis of the issuer’s financial statements or other available documents. In addition, the Fund may use fair value pricing for securities primarily traded in non-U.S. markets because most foreign markets close well before the Fund values its securities at 4:00 p.m., Eastern Time. The earlier close of these foreign markets gives rise to the possibility that significant events, including broad market moves, may have occurred in the interim and may materially affect the value of those securities. To
| 36 | AB FLEXFEE INTERNATIONAL BOND PORTFOLIO | abfunds.com |
NOTES TO FINANCIAL STATEMENTS (continued)
account for this, the Fund generally values many of its foreign equity securities using fair value prices based on third party vendor modeling tools to the extent available.
2. Fair Value Measurements
In accordance with U.S. GAAP regarding fair value measurements, fair value is defined as the price that the Fund would receive to sell an asset or pay to transfer a liability in an orderly transaction between market participants at the measurement date. U.S. GAAP establishes a framework for measuring fair value, and a three-level hierarchy for fair value measurements based upon the transparency of inputs to the valuation of an asset or liability (including those valued based on their market values as described in Note A.1 above). Inputs may be observable or unobservable and refer broadly to the assumptions that market participants would use in pricing the asset or liability. Observable inputs reflect the assumptions market participants would use in pricing the asset or liability based on market data obtained from sources independent of the Fund. Unobservable inputs reflect the Fund’s own assumptions about the assumptions that market participants would use in pricing the asset or liability based on the best information available in the circumstances. Each investment is assigned a level based upon the observability of the inputs which are significant to the overall valuation. The three-tier hierarchy of inputs is summarized below.
| • | Level 1—quoted prices in active markets for identical investments |
| • | Level 2—other significant observable inputs (including quoted prices for similar investments, interest rates, prepayment speeds, credit risk, etc.) |
| • | Level 3—significant unobservable inputs (including the Fund’s own assumptions in determining the fair value of investments) |
The fair value of debt instruments, such as bonds, and over-the-counter derivatives is generally based on market price quotations, recently executed market transactions (where observable) or industry recognized modeling techniques and are generally classified as Level 2. Pricing vendor inputs to Level 2 valuations may include quoted prices for similar investments in active markets, interest rate curves, coupon rates, currency rates, yield curves, option adjusted spreads, default rates, credit spreads and other unique security features in order to estimate the relevant cash flows which is then discounted to calculate fair values. If these inputs are unobservable and significant to the fair value, these investments will be classified as Level 3. In addition, non-agency rated investments are classified as Level 3.
Valuations of mortgage-backed or other asset-backed securities, by pricing vendors, are based on both proprietary and industry recognized models and discounted cash flow techniques. Significant inputs to the valuation of these instruments are value of the collateral, the rates and timing of
| abfunds.com | AB FLEXFEE INTERNATIONAL BOND PORTFOLIO | 37 |
NOTES TO FINANCIAL STATEMENTS (continued)
delinquencies, the rates and timing of prepayments, and default and loss expectations, which are driven in part by housing prices for residential mortgages. Significant inputs are determined based on relative value analyses, which incorporate comparisons to instruments with similar collateral and risk profiles, including relevant indices. Mortgage and asset backed securities for which management has collected current observable data through pricing services are generally categorized within Level 2. Those investments for which current observable data has not been provided are classified as Level 3.
Options are valued using market-based inputs to models, broker or dealer quotations, or alternative pricing sources with reasonable levels of price transparency, where such inputs and models are available. Alternatively the values may be obtained through unobservable management determined inputs and/or management’s proprietary models. Where models are used, the selection of a particular model to value an option depends upon the contractual terms of, and specific risks inherent in, the option as well as the availability of pricing information in the market. Valuation models require a variety of inputs, including contractual terms, market prices, measures of volatility and correlations of such inputs. Exchange-traded options generally will be classified as Level 2. For options that do not trade on exchange but trade in liquid markets, inputs can generally be verified and model selection does not involve significant management judgment. Options are classified within Level 2 on the fair value hierarchy when all of the significant inputs can be corroborated to market evidence. Otherwise such instruments are classified as Level 3.
Valuations of mortgage-backed or other asset-backed securities, by pricing vendors, are based on both proprietary and industry recognized models and discounted cash flow techniques. Significant inputs to the valuation of these instruments are value of the collateral, the rates and timing of delinquencies, the rates and timing of prepayments, and default and loss expectations, which are driven in part by housing prices for residential mortgages. Significant inputs are determined based on relative value analyses, which incorporate comparisons to instruments with similar collateral and risk profiles, including relevant indices. Mortgage and asset-backed securities for which management has collected current observable data through pricing services are generally categorized within Level 2. Those investments for which current observable data has not been provided are classified as Level 3.
Other fixed income investments, including non-U.S. government and corporate debt, are generally valued using quoted market prices, if available, which are typically impacted by current interest rates, maturity dates and any perceived credit risk of the issuer. Additionally, in the absence of
| 38 | AB FLEXFEE INTERNATIONAL BOND PORTFOLIO | abfunds.com |
NOTES TO FINANCIAL STATEMENTS (continued)
quoted market prices, these inputs are used by pricing vendors to derive a valuation based upon industry or proprietary models which incorporate issuer specific data with relevant yield/spread comparisons with more widely quoted bonds with similar key characteristics. Those investments for which there are observable inputs are classified as Level 2. Where the inputs are not observable, the investments are classified as Level 3.
The following table summarizes the valuation of the Fund’s investments by the above fair value hierarchy levels as of June 30, 2018:
Investments in | Level 1 | Level 2 | Level 3 | Total | ||||||||||||
Assets: | ||||||||||||||||
Governments – Treasuries | $ | – 0 | – | $ | 22,643,492 | $ | – 0 | – | $ | 22,643,492 | ||||||
Corporates – Investment Grade | – 0 | – | 6,570,632 | – 0 | – | 6,570,632 | ||||||||||
Local Governments – Provincial Bonds | – 0 | – | 3,724,499 | – 0 | – | 3,724,499 | ||||||||||
Governments – Sovereign Agencies | – 0 | – | 2,182,079 | – 0 | – | 2,182,079 | ||||||||||
Corporates – Non-Investment Grade | – 0 | – | 2,066,195 | – 0 | – | 2,066,195 | ||||||||||
Inflation-Linked Securities | – 0 | – | 1,824,092 | – 0 | – | 1,824,092 | ||||||||||
Collateralized Mortgage Obligations | – 0 | – | 1,401,323 | – 0 | – | 1,401,323 | ||||||||||
Covered Bonds | – 0 | – | 1,231,284 | – 0 | – | 1,231,284 | ||||||||||
Emerging Markets – Treasuries | – 0 | – | 629,243 | – 0 | – | 629,243 | ||||||||||
Supranationals | – 0 | – | 302,663 | – 0 | – | 302,663 | ||||||||||
Emerging Markets – Sovereigns | – 0 | – | 256,252 | – 0 | – | 256,252 | ||||||||||
Commercial Mortgage-Backed Securities | – 0 | – | 207,594 | 19,357 | 226,951 | |||||||||||
Quasi-Sovereigns | – 0 | – | 201,845 | – 0 | – | 201,845 | ||||||||||
Governments – Sovereign Bonds | – 0 | – | 199,977 | – 0 | – | 199,977 | ||||||||||
Asset-Backed Securities | – 0 | – | – 0 | – | 113,940 | 113,940 | ||||||||||
Emerging Markets – Corporate Bonds | – 0 | – | 45,569 | – 0 | – | 45,569 | ||||||||||
Bank Loans | – 0 | – | 36,008 | – 0 | – | 36,008 | ||||||||||
Options Purchased – Calls | – 0 | – | 9,150 | – 0 | – | 9,150 | ||||||||||
Options Purchased – Puts | – 0 | – | 63 | – 0 | – | 63 | ||||||||||
Short-Term Investments: | ||||||||||||||||
Investment Companies | 773,279 | – 0 | – | – 0 | – | 773,279 | ||||||||||
|
|
|
|
|
|
|
| |||||||||
Total Investments in Securities | 773,279 | 43,531,960 | 133,297 | 44,438,536 | ||||||||||||
Other Financial Instruments*: | ||||||||||||||||
Assets | ||||||||||||||||
Futures | 59,576 | – 0 | – | – 0 | – | 59,576 | † | |||||||||
Forward Currency Exchange Contracts | – 0 | – | 505,567 | – 0 | – | 505,567 | ||||||||||
Centrally Cleared Credit Default Swaps | – 0 | – | 69,256 | – 0 | – | 69,256 | † | |||||||||
Centrally Cleared Interest Rate Swaps | – 0 | – | 122,059 | – 0 | – | 122,059 | † | |||||||||
Variance Swaps | – 0 | – | 1,824 | – 0 | – | 1,824 | ||||||||||
Liabilities | ||||||||||||||||
Futures | (93,558 | ) | – 0 | – | – 0 | – | (93,558 | )† | ||||||||
Forward Currency Exchange Contracts | – 0 | – | (193,812 | ) | – 0 | – | (193,812 | ) | ||||||||
Interest Rate Swaptions Written | – 0 | – | (4,168 | ) | – 0 | – | (4,168 | ) | ||||||||
Currency Options Written | – 0 | – | (27,387 | ) | – 0 | – | (27,387 | ) | ||||||||
Centrally Cleared Credit Default Swaps | – 0 | – | (41,043 | ) | – 0 | – | (41,043 | )† | ||||||||
Centrally Cleared Interest Rate Swaps | – 0 | – | (36,361 | ) | – 0 | – | (36,361 | )† | ||||||||
Credit Default Swaps | – 0 | – | (4,567 | ) | – 0 | – | (4,567 | ) | ||||||||
Variance Swaps | – 0 | – | (1,071 | ) | – 0 | – | (1,071 | ) | ||||||||
|
|
|
|
|
|
|
| |||||||||
Total^ | $ | 739,297 | $ | 43,922,257 | $ | 133,297 | $ | 44,794,851 | ||||||||
|
|
|
|
|
|
|
| |||||||||
| * | Other financial instruments are derivative instruments, such as futures, forwards and swaps, which are valued at the unrealized appreciation/(depreciation) on the instrument. Other financial instruments may also include swaps with upfront premiums, options written and swaptions written which are valued at market value. |
| abfunds.com | AB FLEXFEE INTERNATIONAL BOND PORTFOLIO | 39 |
NOTES TO FINANCIAL STATEMENTS (continued)
| † | Only variation margin receivable/payable at period end is reported within the statements of assets and liabilities. This amount reflects cumulative unrealized appreciation/(depreciation) of futures and centrally cleared swaps as reported in the portfolio of investments. Centrally cleared swaps with upfront premiums are presented here at market value. |
| ^ | There were no transfers between any levels during the reporting period. |
The Fund recognizes all transfers between levels of the fair value hierarchy assuming the financial instrument was transferred at the beginning of the reporting period.
Following is a reconciliation of investments in which significant unobservable inputs (Level 3) were used in determining fair value.
| Commercial Mortgage- Backed Securities | Asset- Backed Securities | Total | ||||||||||
Balance as of 12/31/17 | $ | 19,769 | $ | – 0 | – | $ | 19,769 | |||||
Accrued discounts/(premiums) | 2 | 9 | 11 | |||||||||
Realized gain (loss) | – 0 | – | – 0 | – | – 0 | – | ||||||
Change in unrealized appreciation/depreciation | (414 | ) | (1,055 | ) | (1,469 | ) | ||||||
Purchases | – 0 | – | 114,986 | 114,986 | ||||||||
Sales | – 0 | – | – 0 | – | – 0 | – | ||||||
Transfers into Level 3 | – 0 | – | – 0 | – | – 0 | – | ||||||
Transfers out of Level 3 | – 0 | – | – 0 | – | – 0 | – | ||||||
|
|
|
|
|
| |||||||
Balance as of 6/30/18 | $ | 19,357 | $ | 113,940 | $ | 133,297 | + | |||||
|
|
|
|
|
| |||||||
Net change in unrealized appreciation/depreciation from investments held as of 6/30/18** | $ | (414 | ) | $ | (1,055 | ) | $ | (1,469 | ) | |||
|
|
|
|
|
| |||||||
| ** | The unrealized appreciation/depreciation is included in net change in unrealized appreciation/depreciation of investments and other financial instruments in the accompanying statement of operations. |
| + | There were no transfers into or out of Level 3 during the reporting period. |
The Adviser established the Committee to oversee the pricing and valuation of all securities held in the Fund. The Committee operates under pricing and valuation policies and procedures established by the Adviser and approved by the Board, including pricing policies which set forth the mechanisms and processes to be employed on a daily basis to implement these policies and procedures. In particular, the pricing policies describe how to determine market quotations for securities and other instruments. The Committee’s responsibilities include: 1) fair value and liquidity determinations (and oversight of any third parties to whom any responsibility for fair value and liquidity determinations is delegated), and 2) regular monitoring of the Adviser’s pricing and valuation policies and procedures and modification or enhancement of these policies and procedures (or recommendation of the modification of these policies and procedures) as the Committee believes appropriate.
| 40 | AB FLEXFEE INTERNATIONAL BOND PORTFOLIO | abfunds.com |
NOTES TO FINANCIAL STATEMENTS (continued)
The Committee is also responsible for monitoring the implementation of the pricing policies by the Adviser’s Pricing Group (the “Pricing Group”) and any third party which performs certain pricing functions in accordance with the pricing policies. The Pricing Group is responsible for the oversight of the third party on a day-to-day basis. The Committee and the Pricing Group perform a series of activities to provide reasonable assurance of the accuracy of prices including: 1) periodic vendor due diligence meetings, review of methodologies, new developments and process at vendors, 2) daily comparison of security valuation versus prior day for all securities that exceeded established thresholds, and 3) daily review of unpriced, stale, and variance reports with exceptions reviewed by senior management and the Committee.
In addition, several processes outside of the pricing process are used to monitor valuation issues including: 1) performance and performance attribution reports are monitored for anomalous impacts based upon benchmark performance, and 2) portfolio managers review all portfolios for performance and analytics (which are generated using the Adviser’s prices).
3. Currency Translation
Assets and liabilities denominated in foreign currencies and commitments under forward currency exchange contracts are translated into U.S. dollars at the mean of the quoted bid and ask prices of such currencies against the U.S. dollar. Purchases and sales of portfolio securities are translated into U.S. dollars at the rates of exchange prevailing when such securities were acquired or sold. Income and expenses are translated into U.S. dollars at the rates of exchange prevailing when accrued.
Net realized gain or loss on foreign currency transactions represents foreign exchange gains and losses from sales and maturities of foreign fixed income investments, holding of foreign currencies, currency gains or losses realized between the trade and settlement dates on foreign investment transactions, and the difference between the amounts of dividends, interest and foreign withholding taxes recorded on the Fund’s books and the U.S. dollar equivalent amounts actually received or paid. Net unrealized currency gains and losses from valuing foreign currency denominated assets and liabilities at period end exchange rates are reflected as a component of net unrealized appreciation and depreciation of foreign currency denominated assets and liabilities.
4. Taxes
It is the Fund’s policy to meet the requirements of the Internal Revenue Code applicable to regulated investment companies and to distribute all of its investment company taxable income and net realized gains, if any, to shareholders. Therefore, no provisions for federal income or excise taxes
| abfunds.com | AB FLEXFEE INTERNATIONAL BOND PORTFOLIO | 41 |
NOTES TO FINANCIAL STATEMENTS (continued)
are required. The Fund may be subject to taxes imposed by countries in which it invests. Such taxes are generally based on income and/or capital gains earned or repatriated. Taxes are accrued and applied to net investment income, net realized gains and net unrealized appreciation/depreciation as such income and/or gains are earned.
In accordance with U.S. GAAP requirements regarding accounting for uncertainties in income taxes, management has analyzed the Fund’s tax positions taken or expected to be taken on federal and state income tax returns for the current initial tax year, and has concluded that no provision for income tax is required in the Fund’s financial statements.
5. Investment Income and Investment Transactions
Dividend income is recorded on the ex-dividend date or as soon as the Fund is informed of the dividend. Interest income is accrued daily. Investment transactions are accounted for on the date securities are purchased or sold. Investment gains or losses are determined on the identified cost basis. The Fund amortizes premiums and accretes discounts as adjustments to interest income.
6. Expense Allocations
Expenses of the Company are charged proportionately to each portfolio or based on other appropriate methods.
7. Dividends and Distributions
Dividends and distributions to shareholders, if any, are recorded on the ex-dividend date. Income dividends and capital gains distributions are determined in accordance with federal tax regulations and may differ from those determined in accordance with U.S. GAAP. To the extent these differences are permanent, such amounts are reclassified within the capital accounts based on their federal tax basis treatment; temporary differences do not require such reclassification.
8. Offering Expenses
Offering expenses of $94,183 were deferred and amortized on a straight line basis over a one year period starting from June 28, 2017 (commencement of operations).
NOTE B
Advisory Fee and Other Transactions with Affiliates
Under the terms of the investment advisory agreement, the Fund pays the Adviser an advisory fee at an annual rate of .40% of the Fund’s average daily net assets (“Base Fee”). The advisory fee is increased or decreased from the Base Fee by a performance adjustment (“Performance Adjustment”) that depends on whether, and to what extent, the investment performance of the
| 42 | AB FLEXFEE INTERNATIONAL BOND PORTFOLIO | abfunds.com |
NOTES TO FINANCIAL STATEMENTS (continued)
Advisor Class shares of the Fund (“Measuring Class”) exceeds, or is exceeded by, the performance of the Bloomberg Barclays Global Aggregate ex-USD (USD Hedged) Index (“Index”) plus .70% (“Index Hurdle”) over the Performance Period (as defined below). The Performance Adjustment is calculated and accrued daily, according to a schedule that adds or subtracts .00429% of the Fund’s average daily net assets for each .01% of absolute performance by which the performance of the Measuring Class exceeds or lags the Index Hurdle for the period from the beginning of the Performance Period through the prior business day or, if the performance of the Index is made available to the Fund on a daily basis at a time sufficient to permit the calculation of the Performance Adjustment on a current-day basis while maintaining the Fund’s ability to meet applicable deadlines for publishing its daily net asset value per share, within a reasonable time after the commencement of such availability, through the current business day. The maximum Performance Adjustment (positive or negative) will not exceed an annualized rate of +/- .30% (“Maximum Performance Adjustment”) of the Fund’s average daily net assets, which would occur when the performance of the Measuring Class exceeds, or is exceeded by, the Index Hurdle by .70% or more for the Performance Period. On a monthly basis, the Fund will pay the Adviser the minimum fee rate of .10% on an annualized basis (Base Fee minus the Maximum Performance Adjustment) applied to the average daily net assets for the month. At the end of the Performance Period, the Fund will pay to the Adviser the total advisory fee, less the amount of any minimum fees paid during the Performance Period and any waivers described below. The period over which performance is measured (“Performance Period”) is initially from the commencement of operations to December 31, 2018 and thereafter each 12-month period beginning on the first day in the month of January through December 31 of the same year. In addition, the Adviser has agreed to waive its advisory fee by limiting the Fund’s accrual of the advisory fee (Base Fee plus Performance Adjustment) on any day to the amount corresponding to the maximum fee rate multiplied by the Fund’s current net assets if such amount is less than the amount that would have been accrued based on the Fund’s average daily net assets for the Performance Period. For the reporting period ended June 30, 2018, the Fund accrued advisory fees of $22,466, as reflected in the statement of operations, at an annual effective rate (excluding the impact from any expense waivers in effect) of .10% of the Fund’s average net assets, which reflected a (.30)% Performance Adjustment of $(107,878).
The Adviser has agreed to waive its fees and bear certain expenses through April 30, 2019 to the extent necessary to limit total expenses (other than the advisory fee, acquired fund fees and expenses other than the advisory fees of any AB mutual funds in which the Fund may invest, interest expense, taxes, extraordinary expenses, and brokerage commissions and other
| abfunds.com | AB FLEXFEE INTERNATIONAL BOND PORTFOLIO | 43 |
NOTES TO FINANCIAL STATEMENTS (continued)
transaction costs) on an annual basis from exceeding .10% of average daily net assets. Any fees waived and expenses borne by the Adviser through December 31, 2018 are subject to repayment by the Fund until the end of the third fiscal year after the fiscal period in which the fees were waived or the expenses were borne; such waivers/expenses borne that are subject to repayment amount to $262,859 for the fiscal period ended December 31, 2017 and $188,294 for the six months ended June 30, 2018. In any case, no repayment will be made that would cause the Fund’s total annual expenses (subject to the exclusions set forth above) to exceed ..10%.
Pursuant to the investment advisory agreement, the Fund may reimburse the Adviser for certain legal and accounting services provided to the Fund by the Adviser. For the six months ended June 30, 2018, the Adviser voluntarily agreed to waive such fees in the amount of $33,449.
The Fund compensates AllianceBernstein Investor Services, Inc. (“ABIS”), a wholly-owned subsidiary of the Adviser, under a Transfer Agency Agreement for providing personnel and facilities to perform transfer agency services for the Fund. ABIS may make payments to intermediaries that provide omnibus account services, sub-accounting services and/or networking services. The compensation retained by ABIS amounted to $9,000 for six months ended June 30, 2018.
The Fund may invest in AB Government Money Market Portfolio (the “Government Money Market Portfolio”) which has a contractual annual advisory fee rate of .20% of the portfolio’s average daily net assets and bears its own expenses. In connection with the investment by the Fund in the Government Money Market Portfolio, the Adviser has contractually agreed to waive its advisory fee from the Fund in an amount equal to the Fund’s pro rata share of the effective advisory fees of Government Money Market Portfolio, as borne indirectly by the Fund as an acquired fund fee and expense. For six months ended June 30, 2018, such waiver amounted to $529.
A summary of the Fund’s transactions in AB mutual funds for the six months ended June 30, 2018 is as follows:
Fund | Market Value 12/31/17 (000) | Purchases at Cost (000) | Sales Proceeds (000) | Market Value 06/30/18 (000) | Dividend Income (000) | |||||||||||||||
Government Money Market Portfolio | $ | 1,145 | $ | 9,342 | $ | 9,714 | $ | 773 | $ | 4 | ||||||||||
| 44 | AB FLEXFEE INTERNATIONAL BOND PORTFOLIO | abfunds.com |
NOTES TO FINANCIAL STATEMENTS (continued)
Brokerage commissions paid on investment transactions for the six months ended June 30, 2018 amounted to $1,179, of which $0 and $0, respectively, was paid to Sanford C. Bernstein & Co. LLC and Sanford C. Bernstein Limited, affiliates of the Adviser.
NOTE C
Investment Transactions
Purchases and sales of investment securities (excluding short-term investments) for the six months ended June 30, 2018, were as follows:
| Purchases | Sales | |||||||
Investment securities (excluding U.S. government securities) | $ | 23,814,785 | $ | 21,033,303 | ||||
U.S. government securities | 2,547,168 | 3,299,063 | ||||||
The cost of investments for federal income tax purposes was substantially the same as cost for financial reporting purposes. Accordingly, gross unrealized appreciation and unrealized depreciation are as follows:
Gross unrealized appreciation | $ | 1,199,902 | ||
Gross unrealized depreciation | (1,618,664 | ) | ||
|
| |||
Net unrealized depreciation | $ | (418,762 | ) | |
|
|
1. Derivative Financial Instruments
The Fund may use derivatives in an effort to earn income and enhance returns, to replace more traditional direct investments, to obtain exposure to otherwise inaccessible markets (collectively, “investment purposes”), or to hedge or adjust the risk profile of its portfolio.
The principal types of derivatives utilized by the Fund, as well as the methods in which they may be used are:
| • | Forward Currency Exchange Contracts |
The Fund may enter into forward currency exchange contracts in order to hedge its exposure to changes in foreign currency exchange rates on its foreign portfolio holdings, to hedge certain firm purchase and sales commitments denominated in foreign currencies and for non-hedging purposes as a means of making direct investments in foreign currencies, as described below under “Currency Transactions”.
A forward currency exchange contract is a commitment to purchase or sell a foreign currency at a future date at a negotiated forward rate. The gain or loss arising from the difference between the original contract and the closing of such contract would be included in net realized gain or loss on forward currency exchange contracts. Fluctuations in the value of open forward currency exchange contracts are recorded for financial reporting purposes as unrealized appreciation and/or depreciation by the
| abfunds.com | AB FLEXFEE INTERNATIONAL BOND PORTFOLIO | 45 |
NOTES TO FINANCIAL STATEMENTS (continued)
Fund. Risks may arise from the potential inability of a counterparty to meet the terms of a contract and from unanticipated movements in the value of a foreign currency relative to the U.S. dollar.
During the six months ended June 30, 2018, the Fund held forward currency exchange contracts for hedging and non-hedging purposes.
| • | Futures |
The Fund may buy or sell futures for investment purposes or for the purpose of hedging its portfolio against adverse effects of potential movements in the market. The Fund bears the market risk that arises from changes in the value of these instruments and the imperfect correlation between movements in the price of the futures and movements in the price of the assets, reference rates or indices which they are designed to track. Among other things, the Fund may purchase or sell futures for foreign currencies or options thereon for non-hedging purposes as a means of making direct investment in foreign currencies, as described below under “Currency Transactions”.
At the time the Fund enters into a future, the Fund deposits and maintains as collateral an initial margin with the broker, as required by the exchange on which the transaction is effected. Such amount of shown as due from broker on the statement of assets and liabilities. Pursuant to the contract, the Fund agrees to receive from or pay to the broker an amount of cash equal to the daily fluctuation in the value of the contract. Such receipts or payments are known as variation margin and are recorded by the Fund as unrealized gains or losses. Risks may arise from the potential inability of a counter party to meet the terms of the contract. The credit/counterparty risk for exchange-traded futures is generally less than privately negotiated futures, since the clearinghouse, which is the issuer or counterparty to each exchange-traded future, has robust risk mitigation standards, including the requirement to provide initial and variation margin. When the contract is closed, the Fund records realized gain or loss equal to the difference between the value of the contract at the time it was opened and the time it was closed.
Use of long futures subjects the Fund to risk of loss in excess of the amounts shown on the statement of assets and liabilities, up to the notional value of the future. Use of short futures subjects the Fund to unlimited risk of loss. Under some circumstances, futures exchanges may establish daily limits on the amount that the price of a future can vary from the previous day’s settlement price, which could effectively prevent liquidation of unfavorable positions.
During the six months ended June 30, 2018, the Fund held futures for hedging and non-hedging purposes.
| 46 | AB FLEXFEE INTERNATIONAL BOND PORTFOLIO | abfunds.com |
NOTES TO FINANCIAL STATEMENTS (continued)
| • | Option Transactions |
For hedging and investment purposes, the Fund may purchase and write (sell) put and call options on U.S. and foreign securities, including government securities, and foreign currencies that are traded on U.S. and foreign securities exchanges and over-the-counter markets. Among other things, the Fund may use options transactions for non-hedging purposes as a means of making direct investments in foreign currencies, as described below under “Currency Transactions” and may use options strategies involving the purchase and/or writing of various combinations of call and/or put options, for hedging and investment purposes.
The risk associated with purchasing an option is that the Fund pays a premium whether or not the option is exercised. Additionally, the Fund bears the risk of loss of the premium and change in market value should the counterparty not perform under the contract. If a put or call option purchased by the Fund were permitted to expire without being sold or exercised, its premium would represent a loss to the Fund. Put and call options purchased are accounted for in the same manner as portfolio securities. The cost of securities acquired through the exercise of call options is increased by premiums paid. The proceeds from securities sold through the exercise of put options are decreased by the premiums paid.
When the Fund writes an option, the premium received by the Fund is recorded as a liability and is subsequently adjusted to the current market value of the option written. Premiums received from written options which expire unexercised are recorded by the Fund on the expiration date as realized gains from options written. At June 30, 2018, the maximum payment for written put options amounted to $375,000. In certain circumstances maximum payout amounts may be partially offset by recovery values of the respective referenced assets and upfront premium received upon entering into the contract. The difference between the premium received and the amount paid on effecting a closing purchase transaction, including brokerage commissions, is also treated as a realized gain, or if the premium received is less than the amount paid for the closing purchase transaction, as a realized loss. If a call option is exercised, the premium received is added to the proceeds from the sale of the underlying security or currency in determining whether the Fund has realized a gain or loss. If a put option is exercised, the premium received reduces the cost basis of the security or currency purchased by the Fund. In writing an option, the Fund bears the market risk of an unfavorable change in the price of the security or currency underlying the written option. Exercise of an option written by the Fund could result in the Fund selling or buying a security or currency at a price different from the current market value.
| abfunds.com | AB FLEXFEE INTERNATIONAL BOND PORTFOLIO | 47 |
NOTES TO FINANCIAL STATEMENTS (continued)
The Fund may also invest in options on swaps, also called “swaptions”. A swaption is an option that gives the buyer the right, but not the obligation, to enter into a swap on a future date in exchange for paying a market-based “premium”. A receiver swaption gives the owner the right to receive the total return of a specified asset, reference rate, or index. A payer swaption gives the owner the right to pay the total return of a specified asset, reference rate, or index. Swaptions also include options that allow an existing swap to be terminated or extended by one of the counterparties. At June 30, 2018 the maximum payment for written put swaptions amounted to $11,650,000. In certain circumstances maximum payout amounts may be partially offset by recovery values of the respective referenced assets and upfront premium received upon entering into the contract.
During the six months ended June 30, 2018, the Fund held purchased options for non-hedging purposes.
During the six months ended June 30, 2018, the Fund held written options for hedging purposes.
During the six months ended June 30, 2018, the Fund held purchased swaptions for hedging and non-hedging purposes.
| • | Swaps |
The Fund may enter into swaps to hedge its exposure to interest rates, credit risk, or currencies. The Fund may also enter into swaps for non-hedging purposes as a means of gaining market exposures including by making direct investments in foreign currencies, as described below under “Currency Transactions” or in order to take a “long” or “short” position with respect to an underlying referenced asset described below under “Total Return Swaps”. A swap is an agreement that obligates two parties to exchange a series of cash flows at specified intervals based upon or calculated by reference to changes in specified prices or rates for a specified amount of an underlying asset. The payment flows are usually netted against each other, with the difference being paid by one party to the other. In addition, collateral may be pledged or received by the Fund in accordance with the terms of the respective swaps to provide value and recourse to the Fund or its counterparties in the event of default, bankruptcy or insolvency by one of the parties to the swap.
Risks may arise as a result of the failure of the counterparty to the swap to comply with the terms of the swap. The loss incurred by the failure of a counterparty is generally limited to the net interim payment to be received by the Fund, and/or the termination value at the end of the contract. Therefore, the Fund considers the creditworthiness of each counterparty to a swap in evaluating potential counterparty risk.
| 48 | AB FLEXFEE INTERNATIONAL BOND PORTFOLIO | abfunds.com |
NOTES TO FINANCIAL STATEMENTS (continued)
This risk is mitigated by having a netting arrangement between the Fund and the counterparty and by the posting of collateral by the counterparty to the Fund to cover the Fund’s exposure to the counterparty. Additionally, risks may arise from unanticipated movements in interest rates or in the value of the underlying securities. The Fund accrues for the interim payments on swaps on a daily basis, with the net amount recorded within unrealized appreciation/depreciation of swaps on the statement of assets and liabilities, where applicable. Once the interim payments are settled in cash, the net amount is recorded as realized gain/(loss) on swaps on the statement of operations, in addition to any realized gain/(loss) recorded upon the termination of swaps. Upfront premiums paid or received are recognized as cost or proceeds on the statement of assets and liabilities and are amortized on a straight line basis over the life of the contract. Amortized upfront premiums are included in net realized gain/(loss) from swaps on the statement of operations. Fluctuations in the value of swaps are recorded as a component of net change in unrealized appreciation/depreciation of swaps on the statement of operations.
Certain standardized swaps, including certain interest rate swaps and credit default swaps, are (or soon will be) subject to mandatory central clearing. Cleared swaps are transacted through futures commission merchants (“FCMs”) that are members of central clearinghouses, with the clearinghouse serving as central counterparty, similar to transactions in futures contracts. Centralized clearing will be required for additional categories of swaps on a phased-in basis based on requirements published by the Securities and Exchange Commission and Commodity Futures Trading Commission.
At the time the Fund enters into a centrally cleared swap, the Fund deposits and maintains as collateral an initial margin with the broker, as required by the clearinghouse on which the transaction is effected. Such amount is shown as cash collateral due from broker on the statement of assets and liabilities. Pursuant to the contract, the Fund agrees to receive from or pay to the broker an amount of cash equal to the daily fluctuation in the value of the contract. Such receipts or payments are known as variation margin and are recorded by the Fund as unrealized gains or losses. Risks may arise from the potential inability of a counterparty to meet the terms of the contract. The credit/counterparty risk for centrally cleared swaps is generally less than non-centrally cleared swaps, since the clearinghouse, which is the issuer or counterparty to each centrally cleared swap, has robust risk mitigation standards, including the requirement to provide initial and variation margin. When the contract is closed, the Fund records a realized gain or loss equal to the difference between the value of the contract at the time it was opened and the time it was closed.
| abfunds.com | AB FLEXFEE INTERNATIONAL BOND PORTFOLIO | 49 |
NOTES TO FINANCIAL STATEMENTS (continued)
Interest Rate Swaps:
The Fund is subject to interest rate risk exposure in the normal course of pursuing its investment objectives. Because the Fund holds fixed rate bonds, the value of these bonds may decrease if interest rates rise. To help hedge against this risk and to maintain its ability to generate income at prevailing market rates, the Fund may enter into interest rate swaps. Interest rate swaps are agreements between two parties to exchange cash flows based on a notional amount. The Fund may elect to pay a fixed rate and receive a floating rate, or, receive a fixed rate and pay a floating rate on a notional amount. In addition, the Fund may also enter into interest rate swap transactions to preserve a return or spread on a particular investment or portion of its portfolio, or protecting against an increase in the price of securities the Fund anticipates purchasing at a later date. Interest rate swaps involve the exchange by a Fund with another party of their respective commitments to pay or receive interest (e.g., an exchange of floating rate payments for fixed rate payments) computed based on a contractually-based principal (or “notional”) amount. Interest rate swaps are entered into on a net basis (i.e., the two payment streams are netted out, with the Fund receiving or paying, as the case may be, only the net amount of the two payments).
During the six months ended June 30, 2018, the Fund held interest rate swaps for hedging and non-hedging purposes.
Credit Default Swaps:
The Fund may enter into credit default swaps, including to manage its exposure to the market or certain sectors of the market, to reduce its risk exposure to defaults by corporate and sovereign issuers held by the Fund, or to create exposure to corporate or sovereign issuers to which it is not otherwise exposed. The Fund may purchase credit protection (“Buy Contract”) or provide credit protection (“Sale Contract”) on the referenced obligation of the credit default swap. During the term of the swap, the Fund receives/(pays) fixed payments from/(to) the respective counterparty, calculated at the agreed upon rate applied to the notional amount. If the Fund is a buyer/(seller) of protection and a credit event occurs, as defined under the terms of the swap, the Fund will either (i) receive from the seller/(pay to the buyer) of protection an amount equal to the notional amount of the swap (the “Maximum Payout Amount”) and deliver/(take delivery of) the referenced obligation or (ii) receive/(pay) a net settlement amount in the form of cash or securities equal to the notional amount of the swap less the recovery value of the referenced obligation.
In certain circumstances Maximum Payout Amounts may be partially offset by recovery values of the respective referenced obligations,
| 50 | AB FLEXFEE INTERNATIONAL BOND PORTFOLIO | abfunds.com |
NOTES TO FINANCIAL STATEMENTS (continued)
upfront premium received upon entering into the agreement, or net amounts received from settlement of buy protection credit default swaps entered into by the Fund for the same reference obligation with the same counterparty.
Credit default swaps may involve greater risks than if the Fund had invested in the referenced obligation directly. Credit default swaps are subject to general market risk, liquidity risk, counterparty risk and credit risk. If the Fund is a buyer of protection and no credit event occurs, it will lose the payments it made to its counterpart. If the Fund is a seller of protection and a credit event occurs, the value of the referenced obligation received by the Fund coupled with the periodic payments previously received may be less than the Maximum Payout Amount it pays to the buyer, resulting in a net loss to the Fund.
Implied credit spreads over Treasuries of comparable maturity utilized in determining the market value of credit default swaps on issuers as of period end are disclosed in the portfolio of investments. The implied spreads serve as an indicator of the current status of the payment/performance risk and typically reflect the market’s assessment of the likelihood of default by the issuer on the referenced obligation. The implied credit spread of a particular reference entity reflects the cost of buying/selling protection and may include upfront payments required to be made to enter into the agreement. Widening credit spreads typically represent a deterioration of the referenced entity’s credit soundness and greater likelihood of default or other credit event occurring as defined under the terms of the agreement. A credit spread identified as “Defaulted” indicates a credit event has occurred for the referenced entity or obligation.
During the six months ended June 30, 2018, the Fund held credit default swaps for non-hedging purposes.
Variance Swaps:
The Fund may enter into variance swaps to hedge equity market risk or adjust exposure to the equity markets. Variance swaps are contracts in which two parties agree to exchange cash payments based on the difference between the stated level of variance and the actual variance realized on underlying asset(s) or index(es). Actual “variance” as used here is defined as the sum of the square of the returns on the reference asset(s) or index(es) (which in effect is a measure of its “volatility”) over the length of the contract term. So the parties to a variance swap can be said to exchange actual volatility for a contractually stated rate of volatility.
During the six months ended June 30, 2018, the Fund held variance swaps for hedging purposes.
| abfunds.com | AB FLEXFEE INTERNATIONAL BOND PORTFOLIO | 51 |
NOTES TO FINANCIAL STATEMENTS (continued)
The Fund typically enters into International Swaps and Derivatives Association, Inc. Master Agreements (“ISDA Master Agreement”) with its OTC derivative contract counterparties in order to, among other things, reduce its credit risk to OTC counterparties. ISDA Master Agreements include provisions for general obligations, representations, collateral and events of default or termination. Under an ISDA Master Agreement, the Fund typically may offset with the OTC counterparty certain derivative financial instruments’ payables and/or receivables with collateral held and/or posted and create one single net payment (close-out netting) in the event of default or termination. In the event of a default by an OTC counterparty, the return of collateral with market value in excess of the Fund’s net liability, held by the defaulting party, may be delayed or denied.
The Fund’s ISDA Master Agreements may contain provisions for early termination of OTC derivative transactions in the event the net assets of the Fund decline below specific levels (“net asset contingent features”). If these levels are triggered, the Fund’s OTC counterparty has the right to terminate such transaction and require the Fund to pay or receive a settlement amount in connection with the terminated transaction. If OTC derivatives were held at period end, please refer to netting arrangements by the OTC counterparty table below for additional details.
During the six months ended June 30, 2018, the Fund had entered into the following derivatives:
Asset Derivatives | Liability Derivatives | |||||||||||
Derivative Type | Statement of | Fair Value | Statement of | Fair Value | ||||||||
Interest rate contracts | Receivable/Payable for variation margin on futures | $ | 59,576 | * | Receivable/Payable for variation margin on futures | $ | 93,558 | * | ||||
Interest rate contracts | Receivable/Payable for variation margin on centrally cleared swaps |
| 122,059 | * | Receivable/Payable for variation margin on centrally cleared swaps |
| 36,361 | * | ||||
Interest rate contracts | Investments in securities, at value |
| 1,585 |
| ||||||||
Interest rate contracts | Swaptions written, at value |
| 4,168 |
| ||||||||
Foreign currency contracts | Unrealized appreciation on forward currency exchange contracts |
| 505,567 |
| Unrealized depreciation on forward currency exchange contracts |
| 193,812 |
| ||||
| 52 | AB FLEXFEE INTERNATIONAL BOND PORTFOLIO | abfunds.com |
NOTES TO FINANCIAL STATEMENTS (continued)
Asset Derivatives | Liability Derivatives | |||||||||||
Derivative Type | Statement of | Fair Value | Statement of | Fair Value | ||||||||
Foreign currency contracts | Investments in securities, at value | $ | 7,628 |
| ||||||||
Foreign currency contracts | Options written, at value | $ | 27,387 |
| ||||||||
Credit contracts | Unrealized appreciation on credit default swaps | 41,104 | Unrealized depreciation on credit default swaps | – 0 | – | |||||||
Credit contracts | Receivable/Payable for variation margin on centrally cleared swaps | 18,334 | * | Receivable/Payable for variation margin on centrally cleared swaps | 6,471 | * | ||||||
Equity contracts | Unrealized appreciation on variance swaps | 1,824 | Unrealized depreciation on variance swaps | 1,071 | ||||||||
|
|
|
| |||||||||
Total | $ | 757,677 | $ | 362,828 | ||||||||
|
|
|
| |||||||||
| * | Only variation margin receivable/payable at period end is reported within the statement of assets and liabilities. This amount reflects cumulative unrealized appreciation/depreciation on futures and centrally cleared swaps as reported in the portfolio of investments. |
Derivative Type | Location of Gain or (Loss) on | Realized Gain or (Loss) on Derivatives | Change in | |||||
Interest rate contracts | Net realized gain/(loss) on swaps; Net change in unrealized appreciation/depreciation on swaps | $ | (5,498 | ) | $ 75,664 | |||
Interest rate contracts | Net realized gain/(loss) on futures; Net change in unrealized appreciation/depreciation on futures | 156,593 | (70,781) | |||||
Interest rate contracts | Net realized gain/(loss) on investment transactions; Net change in unrealized appreciation/depreciation on investments | (39,944 | ) | (14,373) | ||||
| abfunds.com | AB FLEXFEE INTERNATIONAL BOND PORTFOLIO | 53 |
NOTES TO FINANCIAL STATEMENTS (continued)
Derivative Type | Location of Gain or (Loss) on Statement of | Realized Gain or (Loss) on Derivatives | Change in Unrealized Appreciation or (Depreciation) | |||||||
Interest rate contracts | Net realized gain/(loss) on swaptions written; Net change in unrealized appreciation/depreciation on swaptions written | $ | 29,252 | $ | 8,347 | |||||
Foreign currency contracts | Net realized gain/(loss) on forward currency exchange contracts; Net change in unrealized appreciation/depreciation on forward currency exchange contracts | 568,121 | 636,701 | |||||||
Foreign currency contracts | Net realized gain/(loss) on investment transactions; Net change in unrealized appreciation/depreciation on investments | (5,311 | ) | (4,412 | ) | |||||
Foreign currency contracts | Net realized gain/(loss) on options written; Net change in unrealized appreciation/depreciation on options written | 22,672 | (10,098 | ) | ||||||
Foreign currency contracts | Net realized gain/(loss) on swaps; Net change in unrealized appreciation/depreciation on swaps | – 0 | – | 753 | ||||||
Credit contracts | Net realized gain/(loss) on swaps; Net change in unrealized appreciation/depreciation on swaps | 9,862 | 47,862 | |||||||
|
|
|
| |||||||
Total | $ | 735,747 | $ | 669,663 | ||||||
|
|
|
| |||||||
The following table represents the average monthly volume of the Fund’s derivative transactions during the six months ended June 30, 2018.
Centrally Cleared Credit Default Swaps: | ||||
Average notional amount of buy contracts | $ | 4,500,000 | (a) | |
Average notional amount of sale contracts | $ | 4,500,000 | (a) | |
Centrally Cleared Interest Rate Swaps: | ||||
Average notional amount | $ | 23,121,702 | ||
| 54 | AB FLEXFEE INTERNATIONAL BOND PORTFOLIO | abfunds.com |
NOTES TO FINANCIAL STATEMENTS (continued)
Credit Default Swaps: | ||||
Average notional amount of sale contracts | $ | 930,000 | ||
Forward Currency Exchange Contracts: | ||||
Average principal amount on buy contracts | $ | 10,068,678 | ||
Average principal amount on sale contracts | $ | 46,887,503 | ||
Futures: | ||||
Average original value on buy contracts | $ | 7,918,558 | ||
Average original value on sale contracts | $ | 9,003,075 | ||
Variance Swaps: | ||||
Average notional amount | $ | 90,795 | ||
Purchased Swaptions: | ||||
Average notional amount | $ | 3,018,485 | (b) | |
Purchased Options: | ||||
Average notional amount | $ | 727,824 | ||
Options Written: | ||||
Average notional amount | $ | 3,448,397 | ||
Swaptions Written: | ||||
Average notional amount | $ | 6,583,335 | (b) | |
| (a) | Positions were open for one month during the period. |
| (b) | Positions were open for four months during the period. |
For financial reporting purposes, the Fund does not offset derivative assets and derivative liabilities that are subject to netting arrangements in the statement of assets and liabilities.
All OTC derivatives held at period end were subject to netting arrangements. The following table presents the Fund’s derivative assets and liabilities by OTC counterparty net of amounts available for offset under ISDA Master Agreements (“MA”) and net of the related collateral received/pledged by the Fund as of June 30, 2018. Exchange-traded derivatives and centrally cleared swaps are not subject to netting arrangements and as such are excluded from the table.
Counterparty | Derivative Assets Subject to a MA | Derivatives Available for Offset | Cash Collateral Received* | Security Collateral Received* | Net Amount of Derivatives Assets | |||||||||||||||
Bank of America, NA | $ | 32,653 | $ | (8,341 | ) | $ | – 0 | – | $ | – 0 | – | $ | 24,312 | |||||||
Barclays Bank PLC | 14,744 | (748 | ) | – 0 | – | – 0 | – | 13,996 | ||||||||||||
BNP Paribas SA | 42,087 | – 0 | – | – 0 | – | – 0 | – | 42,087 | ||||||||||||
Brown Brothers Harriman & Co. | 39,390 | (39,390 | ) | – 0 | – | – 0 | – | – 0 | – | |||||||||||
Citibank, NA | 89,169 | (39,944 | ) | – 0 | – | – 0 | – | 49,225 | ||||||||||||
Credit Suisse International | 7,876 | (7,876 | ) | – 0 | – | – 0 | – | – 0 | – | |||||||||||
| abfunds.com | AB FLEXFEE INTERNATIONAL BOND PORTFOLIO | 55 |
NOTES TO FINANCIAL STATEMENTS (continued)
Counterparty | Derivative Assets Subject to a MA | Derivatives Available for Offset | Cash Collateral Received* | Security Collateral Received* | Net Amount of Derivatives Assets | |||||||||||||||
Deutsche Bank AG | $ | 1,824 | $ | (1,003 | ) | $ | – 0 | – | $ | – 0 | – | $ | 821 | |||||||
Goldman Sachs Bank USA | 67,202 | (559 | ) | – 0 | – | – 0 | – | 66,643 | ||||||||||||
JPMorgan Chase Bank, NA | 30,592 | (12,151 | ) | – 0 | – | – 0 | – | 18,441 | ||||||||||||
Morgan Stanley Capital Services LLC/Morgan Stanley & Co. International PLC | 49,100 | (49,100 | ) | – 0 | – | – 0 | – | – 0 | – | |||||||||||
Natwest Markets PLC. | 2,643 | (2,643 | ) | – 0 | – | – 0 | – | – 0 | – | |||||||||||
Royal Bank of Scotland PLC | 133,406 | – 0 | – | – 0 | – | – 0 | – | 133,406 | ||||||||||||
Standard Chartered Bank | 5,379 | (5,379 | ) | – 0 | – | – 0 | – | – 0 | – | |||||||||||
UBS AG | 539 | (539 | ) | – 0 | – | – 0 | – | – 0 | – | |||||||||||
|
|
|
|
|
|
|
|
|
| |||||||||||
Total | $ | 516,604 | $ | (167,673 | ) | $ | – 0 | – | $ | – 0 | – | $ | 348,931 | ^ | ||||||
|
|
|
|
|
|
|
|
|
| |||||||||||
Counterparty | Derivative Liabilities Subject to a MA | Derivatives Available for Offset | Cash Collateral Pledged* | Security Collateral Pledged* | Net Amount of Derivatives Liabilities | |||||||||||||||
Bank of America, NA | $ | 8,341 | $ | (8,341 | ) | $ | – 0 | – | $ | – 0 | – | $ | – 0 | – | ||||||
Barclays Bank PLC | 748 | (748 | ) | – 0 | – | – 0 | – | – 0 | – | |||||||||||
Brown Brothers Harriman & Co. | 58,862 | (39,390 | ) | – 0 | – | – 0 | – | 19,472 | ||||||||||||
Citibank, NA | 39,944 | (39,944 | ) | – 0 | – | – 0 | – | – 0 | – | |||||||||||
Credit Suisse International | 16,898 | (7,876 | ) | – 0 | – | – 0 | – | 9,022 | ||||||||||||
Deutsche Bank AG | 1,003 | (1,003 | ) | – 0 | – | – 0 | – | – 0 | – | |||||||||||
Goldman Sachs Bank USA | 559 | (559 | ) | – 0 | – | – 0 | – | – 0 | – | |||||||||||
JPMorgan Chase Bank, NA | 12,151 | (12,151 | ) | – 0 | – | – 0 | – | – 0 | – | |||||||||||
Morgan Stanley Capital Services LLC/Morgan Stanley & Co. International PLC | 76,607 | (49,100 | ) | – 0 | – | – 0 | – | 27,507 | ||||||||||||
Natwest Markets PLC | 8,699 | (2,643 | ) | – 0 | – | – 0 | – | 6,056 | ||||||||||||
Standard Chartered Bank | 6,646 | (5,379 | ) | – 0 | – | – 0 | – | 1,267 | ||||||||||||
UBS AG | 5,547 | (539 | ) | – 0 | – | – 0 | – | 5,008 | ||||||||||||
|
|
|
|
|
|
|
|
|
| |||||||||||
Total | $ | 236,005 | $ | (167,673 | ) | $ | – 0 | – | $ | – 0 | – | $ | 68,332 | ^ | ||||||
|
|
|
|
|
|
|
|
|
| |||||||||||
| * | The actual collateral received/pledged may be more than the amount reported due to overcollateralization. |
| ^ | Net amount represents the net receivable/payable that would be due from/to the counterparty in the event of default or termination. The net from OTC financial derivative instruments can only be netted across transactions governed under the same master agreement with the same counterparty. |
| 56 | AB FLEXFEE INTERNATIONAL BOND PORTFOLIO | abfunds.com |
NOTES TO FINANCIAL STATEMENTS (continued)
2. Currency Transactions
The Fund may invest in non-U.S. Dollar-denominated securities on a currency hedged or unhedged basis. The Fund may seek investment opportunities by taking long or short positions in currencies through the use of currency-related derivatives, including forward currency exchange contracts, futures and options on futures, swaps, and other options. The Fund may enter into transactions for investment opportunities when it anticipates that a foreign currency will appreciate or depreciate in value but securities denominated in that currency are not held by the Fund and do not present attractive investment opportunities. Such transactions may also be used when the Adviser believes that it may be more efficient than a direct investment in a foreign currency-denominated security. The Fund may also conduct currency exchange contracts on a spot basis (i.e., for cash at the spot rate prevailing in the currency exchange market for buying or selling currencies).
NOTE D
Capital Stock
Each class consists of 3,000,000,000 authorized shares. Transactions in capital shares for each class were as follows:
| Shares | Amount | |||||||||||||||||||||||
| Six Months Ended June 30, 2018 (unaudited) | June 28, 2017* to December 31, 2017 | Six Months Ended June 30, 2018 (unaudited) | June 28, 2017* to December 31, | |||||||||||||||||||||
|
| |||||||||||||||||||||||
| Advisor Class | ||||||||||||||||||||||||
Shares sold | 50,765 | 4,503,504 | $ | 506,775 | $ | 45,000,003 | ||||||||||||||||||
| ||||||||||||||||||||||||
Shares issued in reinvestment of dividends | 25 | 0 | (a) | 248 | 0 | (b) | ||||||||||||||||||
| ||||||||||||||||||||||||
Shares redeemed | (116 | ) | – 0 | – | (1,149 | ) | – 0 | – | ||||||||||||||||
| ||||||||||||||||||||||||
Net increase | 50,674 | 4,503,504 | $ | 505,874 | $ | 45,000,003 | ||||||||||||||||||
| ||||||||||||||||||||||||
| * | Commencement of operations. |
| (a) | less than 0.5 shares. |
| (b) | less than $0.5. |
NOTE E
Risks Involved in Investing in the Fund
Interest Rate Risk and Credit Risk—Interest rate risk is the risk that changes in interest rates will affect the value of the Fund’s investments in fixed-income debt securities such as bonds or notes. Increases in interest rates may cause the value of the Fund’s investments to decline. Credit risk is the risk that the issuer or guarantor of a debt security, or the counterparty to a derivative contract, will be unable or unwilling to make timely principal and/or interest payments, or to otherwise honor its obligations. The degree of risk for a particular security may be reflected in its credit rating. Credit risk is greater for medium quality and lower-rated securities. Lower-rated debt securities and similar unrated securities (commonly known as “junk bonds”) have speculative elements or are predominantly speculative risks.
| abfunds.com | AB FLEXFEE INTERNATIONAL BOND PORTFOLIO | 57 |
NOTES TO FINANCIAL STATEMENTS (continued)
Below Investment Grade Securities Risk—Investments in fixed-income securities with lower ratings (commonly known as “junk bonds”) tend to have a higher probability that an issuer will default or fail to meet its payment obligations. These securities may be subject to greater price volatility due to such factors as specific corporate developments, negative perceptions of the junk bond market generally and less secondary market liquidity.
Duration Risk—Duration is a measure that relates the expected price volatility of a fixed-income security to changes in interest rates. The duration of a fixed-income security may be shorter than or equal to full maturity of a fixed-income security. Fixed-income securities with longer durations have more risk and will decrease in price as interest rates rise.
Inflation Risk—This is the risk that the value of assets or income from investments will be less in the future as inflation decreases the value of money. As inflation increases, the value of the Fund’s assets can decline as can the value of the Fund’s distributions. This risk is significantly greater if the Fund invests a significant portion of its assets in fixed-income securities with longer maturities.
Foreign (Non-U.S.) Risk—Investments in securities of non-U.S. issuers may involve more risk than those of U.S. issuers. These securities may fluctuate more widely in price and may be less liquid due to adverse market, economic, political, regulatory or other factors.
Emerging Market Risk—Investments in emerging market countries may have more risk because the markets are less developed and less liquid, and because these investments may be subject to increased economic, political, regulatory or other uncertainties.
Currency Risk—Fluctuations in currency exchange rates may negatively affect the value of the Fund’s investments in fixed-income securities denominated in foreign currencies or reduce its returns.
Derivatives Risk—The Fund may enter into derivative transactions such as forwards, options, futures and swaps. Derivatives may be illiquid, difficult to price, and leveraged so that small changes may produce disproportionate losses for the Fund, and subject to counterparty risk to a greater degree than more traditional investments. Derivatives may result in significant losses, including losses that are far greater than the value of the derivatives reflected on the statement of assets and liabilities.
Liquidity Risk—Liquidity risk occurs when certain investments become difficult to purchase or sell. Difficulty in selling less liquid securities may result in sales at disadvantageous prices affecting the value of your
| 58 | AB FLEXFEE INTERNATIONAL BOND PORTFOLIO | abfunds.com |
NOTES TO FINANCIAL STATEMENTS (continued)
investment in the Fund. Causes of liquidity risk may include low trading volumes, large positions and heavy redemptions of Fund shares. Over recent years, liquidity risk has also increased because the capacity of dealers in the secondary market for fixed-income securities to make markets in these securities has decreased, even as the overall bond market has grown significantly, due to among other things, structural changes, additional regulatory requirements and capital and risk restraints that have led to reduced inventories. Liquidity risk may be higher in a rising interest rate environment, when the value and liquidity of fixed-income securities generally decline.
Indemnification Risk—In the ordinary course of business, the Fund enters into contracts that contain a variety of indemnifications. The Fund’s maximum exposure under these arrangements is unknown. However, the Fund has not had prior claims or losses pursuant to these indemnification provisions and expects the risk of loss thereunder to be remote. Therefore, the Fund has not accrued any liability in connection with these indemnification provisions.
NOTE F
Distributions to Shareholders
The tax character of distributions paid for the year ending December 31, 2018 will be determined at the end of the current fiscal year.
The tax character of distributions paid during the fiscal period ended December 31, 2017 was as follows:
| 2017 | ||||
Distributions paid from: | ||||
Ordinary income | $ | 501,767 | ||
|
| |||
Total taxable distributions paid | $ | 501,767 | ||
|
| |||
As of December 31, 2017, the components of accumulated earnings/(deficit) on a tax basis were as follows:
Undistributed capital gains | $ | 7,866 | ||
Other losses | (637,525 | )(a) | ||
Unrealized appreciation/(depreciation) | 514,388 | (b) | ||
|
| |||
Total accumulated earnings/(deficit) | $ | (115,271 | )(c) | |
|
|
| (a) | As of December 31, 2017, the Fund had a qualified late-year ordinary loss deferral of $619,211, and cumulative deferred loss on straddles of $18,314. |
| (b) | The differences between book-basis and tax-basis unrealized appreciation/(depreciation) are attributable primarily to the tax deferral of losses on wash sales, the tax treatment of swaps and the recognition for tax purposes of unrealized gains/losses on certain derivative instruments. |
| (c) | The difference between book-basis and tax-basis components of accumulated earnings/(deficit) is attributable primarily to the amortization of offering costs. |
| abfunds.com | AB FLEXFEE INTERNATIONAL BOND PORTFOLIO | 59 |
NOTES TO FINANCIAL STATEMENTS (continued)
For tax purposes, net realized capital losses may be carried over to offset future capital gains, if any. Funds are permitted to carry forward capital losses for an indefinite period, and such losses will retain their character as either short-term or long-term capital losses. As of December 31, 2017, the Fund did not have any capital loss carryforwards.
NOTE G
Recent Accounting Pronouncements
In March 2017, the Financial Accounting Standards Board issued an Accounting Standards Update, ASU 2017-08, Receivables—Nonrefundable Fees and Other Costs (Subtopic 310-20), Premium Amortization on Purchased Callable Debt Securities (the “ASU”) which amends the amortization period for certain purchased callable debt securities held at a premium, shortening such period to the earliest call date. The ASU does not require any accounting change for debt securities held at a discount; the discount continues to be amortized to maturity. The ASU is effective for fiscal years, and interim periods within those fiscal years, beginning after December 15, 2018. At this time, management is evaluating the implications of these changes on the financial statements.
NOTE H
Subsequent Events
Management has evaluated subsequent events for possible recognition or disclosure in the financial statements through the date the financial statements are issued. Management has determined that there are no material events that would require disclosure in the Fund’s financial statements through this date.
| 60 | AB FLEXFEE INTERNATIONAL BOND PORTFOLIO | abfunds.com |
FINANCIAL HIGHLIGHTS
Selected Data For A Share Of Capital Stock Outstanding Throughout Each Period
| Advisor Class | ||||||||
Six Months Ended June 30, 2018 | June 28, 2017(a) to December 31, 2017 | |||||||
|
| |||||||
Net asset value, beginning of period | $ 9.97 | $ 10.00 | ||||||
|
| |||||||
Income From Investment Operations | ||||||||
Net investment income(b)(c) | .10 | .10 | ||||||
Net realized and unrealized loss on investment and foreign currency transactions | (.03 | ) | .00 | (d) | ||||
|
| |||||||
Net increase in net asset value from operations | .07 | .10 | ||||||
|
| |||||||
Less: Dividends | ||||||||
Dividends from net investment income | (.07 | ) | (.13 | ) | ||||
|
| |||||||
Net asset value, end of period | $ 9.97 | $ 9.97 | ||||||
|
| |||||||
Total Return | ||||||||
Total investment return based on net asset value(e) | 0.73 | % | 1.05 | % | ||||
Ratios/Supplemental Data | ||||||||
Net assets, end of period (000’s omitted) | $45,404 | $44,881 | ||||||
Ratio to average net assets of: | ||||||||
Expenses, net of waivers/reimbursements(f)(g) | .20 | %(h) | .19 | % | ||||
Expenses, before waivers/reimbursements(f)(g) | 1.19 | %(h) | 2.39 | % | ||||
Net investment income(c)(g) | 1.95 | % | 1.95 | % | ||||
Portfolio turnover rate | 56 | % | 30 | % | ||||
| (a) | Commencement of operations. |
| (b) | Based on average shares outstanding. |
| (c) | Net of expenses waived/reimbursed by the Adviser. |
| (d) | Amount is less than $0.005. |
| (e) | Total investment return is calculated assuming an initial investment made at the net asset value at the beginning of the period, reinvestment of all dividends and distributions at net asset value during the period, and redemption on the last day of the period. Total investment return does not reflect the deduction of taxes that a shareholder would pay on fund distributions or the redemption of fund shares. Total investment return for a period of less than one year is not annualized. |
| (f) | In connection with the Fund’s investments in affiliated underlying portfolios, the Fund incurs no direct expenses but bears proportionate shares of the acquired fund fees and expenses (i.e. operating, administrative and investment advisory fees) of the affiliated underlying portfolios. The Adviser has contractually agreed to waive its fees from the Fund in an amount equal to the Fund’s pro rata share of certain acquired fund fees and expenses, and for the period ended December 31, 2017, such waiver amounted to 0.01% annualized. |
| (g) | Annualized. |
| (h) | The advisory fee reflected in the Fund’s expense ratio may be higher or lower than the Base Fee plus Performance Adjustment due to the different time periods over which the fee is calculated (i.e., the financial reporting period vs. the Performance Period). |
See notes to financial statements.
| abfunds.com | AB FLEXFEE INTERNATIONAL BOND PORTFOLIO | 61 |
BOARD OF DIRECTORS
Marshall C. Turner, Jr(1), Chairman Michael J. Downey(1) William H. Foulk, Jr.(1) Nancy P. Jacklin(1) | Robert M. Keith, President and Chief Executive Officer Carol C. McMullen(1) Garry L. Moody(1) Earl D. Weiner(1) |
OFFICERS Paul J. DeNoon(2), Vice President Scott A. DiMaggio(2), Vice President Douglas J. Peebles(2), Vice President Matthew S. Sheridan(2), Vice President | Emilie D. Wrapp, Secretary Joseph J. Mantineo, Treasurer and Chief Financial Officer Phyllis J. Clarke, Controller Vincent S. Noto, Chief Compliance Officer |
Custodian and Accounting Agent Brown Brothers Harriman & Co. 50 Post Office Square Boston, MA 02110
| Independent Registered Public Accounting Firm Ernst & Young LLP 5 Times Square New York, NY 10036
| |
Principal Underwriter AllianceBernstein Investments, Inc. 1345 Avenue of the Americas New York, NY 10105
| Legal Counsel Seward & Kissel LLP One Battery Park Plaza New York, NY 10004
| |
Transfer Agent AllianceBernstein Investor Services, Inc. P.O. Box 786003 San Antonio, TX 78278-6003 Toll-Free (800) 221-6003 |
| 1 | Member of the Audit Committee, the Governance and Nominating Committee and the Independent Directors Committee. |
| 2 | The day-to-day management of, and investment decisions for, the portfolio is made by the Adviser. Messrs. DeNoon, DiMaggio, Peebles and Sheridan are the investment professionals with the most significant responsibility for the day-to-day management of the Fund’s portfolio. |
| 62 | AB FLEXFEE INTERNATIONAL BOND PORTFOLIO | abfunds.com |
Information Regarding the Review and Approval of Amendment to the Fund’s Advisory Agreement
At a meeting of the Board of Directors of AB Cap Fund, Inc. (the “Company”) held on August 1-2, 2017, the Adviser recommended an amendment to the Company’s current Advisory Agreement with the Adviser (the “Amended Agreement”) relating to a change in the daily fee computation methodology in respect of AB FlexFeeTM International Bond Portfolio (the “Fund”). The amendment provided that, for purposes of calculating the incentive portion of the Adviser’s advisory fee, the Fund’s investment performance on each business day, which currently is compared with the performance of its benchmark index on the prior business day, would instead be compared with the performance of its benchmark index on the same business day in the event that index performance becomes reliably and timely available on the same business day.
The Adviser had provided the disinterested directors (the “directors”) with a memorandum explaining its analysis and the form of amendment prior to the meeting. After discussion with experienced counsel who are independent of the Adviser and with the Adviser, the directors concluded that the proposed amendment would result in a more precise calculation of the Adviser’s incentive fee and unanimously approved the Amended Agreement.
The directors approved the Fund’s current Advisory Agreement at a meeting held on January 31-February 1, 2017 (the “January/February Meeting”) and a discussion regarding the basis for the Board’s approval is set forth below.
Board’s Approval at the January/February 2017 Meeting
Information Regarding the Review and Approval of the Fund’s Advisory Agreement
The disinterested directors (the “directors”) of AB Bond Fund, Inc. (the “Company”) unanimously approved the Company’s Advisory Agreement with the Adviser in respect of AB FlexFeeTM International Bond Portfolio (the “Fund”) for an initial two-year period at meetings held on November 1-3, 2016 and January 31-February 1, 2017 (the “Meeting”). (The Fund was formerly known as AB International Bond Portfolio and, at the time of the approval of the Advisory Agreement, as AB Performance Fee Series—International Bond Portfolio.)
Prior to approval of the Advisory Agreement, the directors had requested from the Adviser, and received and evaluated, extensive materials. They reviewed the proposed Advisory Agreement with the Adviser and with experienced counsel who are independent of the Adviser, who advised on the relevant legal standards. The directors also reviewed an independent evaluation prepared by the Company’s Senior Officer (who is also the Company’s Independent Compliance Officer), who acted as their
| abfunds.com | AB FLEXFEE INTERNATIONAL BOND PORTFOLIO | 63 |
independent fee consultant, of the reasonableness of the proposed performance-based advisory fee (which consists of a base fee plus or minus a performance adjustment), in which the Senior Officer concluded that the proposed contractual fee for the Fund was reasonable. The directors also discussed the proposed approval in private sessions with counsel and the Company’s Senior Officer.
The directors considered their knowledge of the nature and quality of the services to be provided by the Adviser to the Fund gained from their experience as directors or trustees of most of the registered investment companies advised by the Adviser, their overall confidence in the Adviser’s integrity and competence they have gained from that experience, the Adviser’s initiative in identifying and raising potential issues with the directors and its responsiveness, frankness and attention to concerns raised by the directors in the past, including the Adviser’s willingness to consider and implement organizational and operational changes designed to improve investment results and the services provided to the AB Funds. The directors noted that they have four regular meetings each year, at each of which they receive presentations from the Adviser on the investment results of the AB Funds and review extensive materials and information presented by the Adviser.
The directors also considered all factors they believed relevant, including the specific matters discussed below. During the course of their deliberations, the directors evaluated, among other things, the reasonableness of the proposed advisory fee. The directors did not identify any particular information that was all-important or controlling, and different directors may have attributed different weights to the various factors. The directors determined that the selection of the Adviser to manage the Fund and the overall arrangements between the Fund and the Adviser, as provided in the Advisory Agreement, including the proposed advisory fee, were fair and reasonable in light of the services to be performed, expenses to be incurred and such other matters as the directors considered relevant in the exercise of their business judgment. The material factors and conclusions that formed the basis for the directors’ determinations included the following:
Nature, Extent and Quality of Services to be Provided
The directors considered the scope and quality of services to be provided by the Adviser under the Advisory Agreement, including the quality of the investment research capabilities of the Adviser and the other resources it has dedicated to performing services for the AB Funds. They also noted the professional experience and qualifications of the Fund’s portfolio management team and other senior personnel of the Adviser. The directors also considered that the Advisory Agreement provides that the Fund will reimburse the Adviser for the cost to it of providing certain clerical, accounting, administrative and other services to the Fund by employees of the Adviser or its affiliates. Requests for these reimbursements will be
| 64 | AB FLEXFEE INTERNATIONAL BOND PORTFOLIO | abfunds.com |
subject to the directors’ approval on a quarterly basis and, to the extent requested and paid, result in a higher rate of total compensation from the Fund to the Adviser than the fee rate stated in the Advisory Agreement. The directors noted that the methodology to be used to determine the reimbursement amounts had been reviewed by an independent consultant retained by the Company’s Senior Officer. The quality of administrative and other services, including the Adviser’s role in coordinating the activities of the Fund’s other service providers, also was considered. The directors concluded that, overall, they were satisfied with the nature, extent and quality of services to be provided to the Fund under the Advisory Agreement.
Costs of Services to be Provided and Profitability
Because the Fund had not yet commenced operations, the directors were unable to consider historical information about the profitability of the Fund. However, the Adviser agreed to provide the directors with profitability information in connection with future proposed continuances of the Advisory Agreement. They also considered the costs to be borne by the Adviser in providing services to the Fund and that the Fund was unlikely to be profitable to the Adviser unless it achieves a material level of net assets. The directors also noted that, due to the performance fee component of the advisory fee, profitability would tend to be higher with better performance relative to the Fund’s benchmark, which they considered to create an appropriate alignment of incentives.
Fall-Out Benefits
The directors considered the other benefits to the Adviser and its affiliates from their proposed relationships with the Fund, including, but not limited to, benefits relating to 12b-1 fees and sales charges to be received by the Fund’s principal underwriter (which is a wholly owned subsidiary of the Adviser) in respect of certain classes of the Fund’s shares; and transfer agency fees to be paid by the Fund to a wholly owned subsidiary of the Adviser. The directors recognized that the Adviser’s future profitability would be somewhat lower without these benefits. The directors understood that the Adviser also might derive reputational and other benefits from its association with the Fund.
Investment Results
Since the Fund had not yet commenced operations, no performance or other historical information for the Fund was available. The Adviser manages another AB Fund with a somewhat similar investment style, and, at the Meeting, the directors reviewed performance information for that AB Fund. Based on this information, together with the Adviser’s written and oral presentations regarding the management of the Fund and their general knowledge and confidence in the Adviser’s expertise in managing mutual funds, the directors concluded that they were satisfied that the Adviser was capable of providing high quality Fund management services to the Fund.
| abfunds.com | AB FLEXFEE INTERNATIONAL BOND PORTFOLIO | 65 |
Advisory Fees and Other Expenses
The directors considered the proposed advisory fee rate payable by the Fund to the Adviser and information prepared by three analytical services that are not affiliated with the Adviser (the “15(c) service providers”), concerning advisory fee rates paid by other funds in the same category as the Fund at a hypothetical common asset level of $250 million. The directors recognized that it is difficult to make comparisons of advisory fees because there are variations in the services that are included in the fees paid by other funds. The directors considered the Fund’s proposed contractual effective advisory fee rate against a peer group median.
The directors recognized that the Adviser’s total compensation from the Fund pursuant to the Advisory Agreement would be increased by amounts paid pursuant to the expense reimbursement provision in the Advisory Agreement, and that the impact of such expense reimbursement would depend on the size of the Fund and the extent to which the Adviser requests reimbursements pursuant to this provision.
The directors also considered the Adviser’s fee schedule for institutional clients pursuing a similar investment style. For this purpose, they reviewed the relevant advisory fee information from the Adviser’s Form ADV and the evaluation from the Company’s Senior Officer and noted the differences between the Fund’s proposed fee schedule, on the one hand, and the institutional fee schedule and the schedule of fees charged to any offshore funds and any sub-advised funds, on the other. The directors noted that the Adviser may, in some cases, agree to fee rates with large institutional clients that are lower than those reviewed by the directors and that they had previously discussed with the Adviser its policies in respect of such arrangements.
The Adviser reviewed with the directors the significantly greater scope of the services it provides to the Fund relative to institutional, offshore fund and sub-advised fund clients. In light of the substantial differences in services rendered by the Adviser to institutional, offshore fund and sub-advised fund clients as compared to funds such as the Fund, the directors considered these fee comparisons inapt and did not place significant weight on them in their deliberations.
The directors noted that the Fund may invest in shares of exchange-traded funds (“ETFs”), subject to the restrictions and limitations of the Investment Company Act of 1940 as these may be varied as a result of exemptive orders issued by the SEC. The directors also noted that ETFs pay advisory fees pursuant to their advisory contracts. The directors concluded, based on the Adviser’s explanation of how it may use ETFs when they are the most cost-effective way to obtain desired exposures or to “equitize” cash inflows pending purchases of underlying securities, that the proposed advisory fee would be for services in addition to, rather than duplicative of, the services provided under the advisory contracts of the ETFs in which the Fund may invest.
| 66 | AB FLEXFEE INTERNATIONAL BOND PORTFOLIO | abfunds.com |
The directors also considered the projected total expense ratio of the Advisor Class shares of the Fund in comparison to a peer group and a peer universe selected by each 15(c) service provider. The directors also considered the Adviser’s proposed expense cap for the “other expenses” of the Fund (expenses excluding the advisory fee, Rule 12b-1 fees, and certain other expenses typically excluded from the Adviser’s expense caps) for the period ending December 31, 2018. The directors noted that it was likely that the expense ratios of some of the other funds in the Fund’s category were lowered by waivers or reimbursements by those funds’ investment advisers, which in some cases might be voluntary or temporary. The directors view the projected expense ratio information as relevant to their evaluation of the Adviser’s services because the Adviser is responsible for coordinating services provided to the Fund by others. Based on their review, the directors concluded that the Fund’s projected expense ratio was acceptable.
Economies of Scale
The directors noted that the proposed advisory fee schedule for the Fund does not contain breakpoints and that they had previously discussed their strong preference for breakpoints in advisory contracts with the Adviser. The directors took into consideration prior presentations by an independent consultant on economies of scale in the mutual fund industry and for the AB Funds, and by the Adviser concerning certain of its views on economies of scale. The directors also had requested and received from the Adviser certain updates on economies of scale in advance of the Meeting. The directors believe that economies of scale may be realized (if at all) by the Adviser across a variety of products and services, and not only in respect of a single fund. The directors noted that there is no established methodology for setting breakpoints that give effect to the fund-specific services provided by a fund’s adviser and to the economies of scale that an adviser may realize in its overall mutual fund business or those components of it which directly or indirectly affect a fund’s operations. The directors observed that in the mutual fund industry as a whole, as well as among funds similar to the Fund, there is no uniformity or pattern in the fees and asset levels at which breakpoints (if any) apply. The directors also noted that the advisory agreements for many funds do not have breakpoints at all. The directors informed the Adviser that they would monitor the Fund’s assets and its profitability to the Adviser and anticipated revisiting the question of breakpoints in the future if circumstances warranted doing so.
| abfunds.com | AB FLEXFEE INTERNATIONAL BOND PORTFOLIO | 67 |
This page is not part of the Shareholder Report or the Financial Statements.
AB FAMILY OF FUNDS
US EQUITY
US CORE
Core Opportunities Fund
FlexFee™ US Thematic Portfolio
Select US Equity Portfolio
US GROWTH
Concentrated Growth Fund
Discovery Growth Fund
FlexFee™ Large Cap Growth Portfolio
Growth Fund
Large Cap Growth Fund
Small Cap Growth Portfolio
US VALUE
Discovery Value Fund
Equity Income Fund
Relative Value Fund
Small Cap Value Portfolio
Value Fund
INTERNATIONAL/ GLOBAL EQUITY
INTERNATIONAL/ GLOBAL CORE
All China Equity Portfolio
FlexFee™ International Strategic Core Portfolio
Global Core Equity Portfolio
International Portfolio
International Strategic Core Portfolio
Sustainable Global Thematic Fund
Tax-Managed International Portfolio
Tax-Managed Wealth Appreciation Strategy
Wealth Appreciation Strategy
INTERNATIONAL/ GLOBAL GROWTH
Concentrated International Growth Portfolio
FlexFee™ Emerging Markets Growth Portfolio
INTERNATIONAL/ GLOBAL EQUITY (continued)
Sustainable International Thematic Fund1
INTERNATIONAL/ GLOBAL VALUE
International Value Fund
FIXED INCOME
MUNICIPAL
High Income Municipal Portfolio
Intermediate California Municipal Portfolio
Intermediate Diversified Municipal Portfolio
Intermediate New York Municipal Portfolio
Municipal Bond Inflation Strategy
Tax-Aware Fixed Income Portfolio
National Portfolio
Arizona Portfolio
California Portfolio
Massachusetts Portfolio
Minnesota Portfolio
New Jersey Portfolio
New York Portfolio
Ohio Portfolio
Pennsylvania Portfolio
Virginia Portfolio
TAXABLE
Bond Inflation Strategy
FlexFee™ High Yield Portfolio1
FlexFee™ International Bond Portfolio
Global Bond Fund
High Income Fund
Income Fund
Intermediate Bond Portfolio
Limited Duration High Income Portfolio
Short Duration Portfolio
ALTERNATIVES
All Market Real Return Portfolio
Global Real Estate Investment Fund
Select US Long/Short Portfolio
Unconstrained Bond Fund
MULTI-ASSET
All Market Income Portfolio
All Market Total Return Portfolio
Conservative Wealth Strategy
Emerging Markets Multi-Asset Portfolio
Global Risk Allocation Fund
Tax-Managed All Market Income Portfolio
TARGET-DATE
Multi-Manager Select Retirement Allocation Fund
Multi-Manager Select 2010 Fund
Multi-Manager Select 2015 Fund
Multi-Manager Select 2020 Fund
Multi-Manager Select 2025 Fund
Multi-Manager Select 2030 Fund
Multi-Manager Select 2035 Fund
Multi-Manager Select 2040 Fund
Multi-Manager Select 2045 Fund
Multi-Manager Select 2050 Fund
Multi-Manager Select 2055 Fund
CLOSED-END FUNDS
Alliance California Municipal Income Fund
AllianceBernstein Global High Income Fund
AllianceBernstein National Municipal Income Fund
We also offer Government Money Market Portfolio1, which serves as the money market fund exchange vehicle for the AB mutual funds. An investment in Government Money Market Portfolio is not a deposit in a bank and is not insured or guaranteed by the Federal Deposit Insurance Corporation or any other government agency. Although the Fund seeks to preserve the value of your investment at $1.00 per share, it is possible to lose money by investing in the Fund.
Investors should consider the investment objectives, risks, charges and expenses of the Fund carefully before investing. For copies of our prospectus or summary prospectus, which contain this and other information, visit us online at www.abfunds.com or contact your AB representative. Please read the prospectus and/or summary prospectus carefully before investing.
| 1 | Prior to November 10, 2017, Government Money Market Portfolio was named Government Exchange Reserves; prior to January 8, 2018, Sustainable International Thematic Fund was named International Growth Fund; prior to February 23, 2018, FlexFee High Yield Portfolio was named High Yield Portfolio. |
| 68 | AB FLEXFEE INTERNATIONAL BOND PORTFOLIO | abfunds.com |
AB FLEXFEE INTERNATIONAL BOND PORTFOLIO
1345 Avenue of the Americas
New York, NY 10105
800 221 5672
FFIB-0152-0618 
| ITEM 2. | CODE OF ETHICS. |
Not applicable when filing a semi-annual report to shareholders.
| ITEM 3. | AUDIT COMMITTEE FINANCIAL EXPERT. |
Not applicable when filing a semi-annual report to shareholders.
| ITEM 4. | PRINCIPAL ACCOUNTANT FEES AND SERVICES. |
Not applicable when filing a semi-annual report to shareholders.
| ITEM 5. | AUDIT COMMITTEE OF LISTED REGISTRANTS. |
Not applicable to the registrant.
| ITEM 6. | SCHEDULE OF INVESTMENTS. |
Please see Schedule of Investments contained in the Report to Shareholders included under Item 1 of this Form N-CSR.
| ITEM 7. | DISCLOSURE OF PROXY VOTING POLICIES AND PROCEDURES FOR CLOSED-END MANAGEMENT INVESTMENT COMPANIES. |
Not applicable to the registrant.
| ITEM 8. | PORTFOLIO MANAGERS OF CLOSED-END MANAGEMENT INVESTMENT COMPANIES. |
Not applicable to the registrant.
| ITEM 9. | PURCHASES OF EQUITY SECURITIES BY CLOSED-END MANAGEMENT INVESTMENT COMPANY AND AFFILIATED PURCHASERS. |
Not applicable to the registrant.
| ITEM 10. | SUBMISSION OF MATTERS TO A VOTE OF SECURITY HOLDERS. |
There have been no material changes to the procedures by which shareholders may recommend nominees to the Fund’s Board of Directors since the Fund last provided disclosure in response to this item.
| ITEM 11. | CONTROLS AND PROCEDURES. |
(a) The registrant’s principal executive officer and principal financial officer have concluded that the registrant’s disclosure controls and procedures (as defined in Rule 30a-2(c) under the Investment Company Act of 1940, as amended) are effective at the reasonable assurance level based on their evaluation of these controls and procedures as of a date within 90 days of the filing date of this document.
(b) There were no changes in the registrant’s internal controls over financial reporting that occurred during the second fiscal quarter of the period that has materially affected, or is reasonably likely to materially affect, the registrant’s internal control over financial reporting.
| ITEM 12. | EXHIBITS. |
The following exhibits are attached to this Form N-CSR:
EXHIBIT NO. | DESCRIPTION OF EXHIBIT | |
| 12 (b) (1) | Certification of Principal Executive Officer Pursuant to Section 302 of the Sarbanes-Oxley Act of 2002 | |
| 12 (b) (2) | Certification of Principal Financial Officer Pursuant to Section 302 of the Sarbanes-Oxley Act of 2002 | |
| 12 (c) | Certification of Principal Executive Officer and Principal Financial Officer Pursuant to Section 906 of the Sarbanes-Oxley Act of 2002 | |
SIGNATURES
Pursuant to the requirements of the Securities Exchange Act of 1934 and the Investment Company Act of 1940, the registrant has duly caused this report to be signed on its behalf by the undersigned, thereunto duly authorized.
(Registrant): AB Bond Fund, Inc.
| By: | /s/ Robert M. Keith | |
| Robert M. Keith | ||
| President | ||
| Date: | August 27, 2018 | |
Pursuant to the requirements of the Securities Exchange Act of 1934 and the Investment Company Act of 1940, this report has been signed below by the following persons on behalf of the registrant and in the capacities and on the dates indicated.
| By: | /s/ Robert M. Keith | |
| Robert M. Keith | ||
| President | ||
| Date: | August 27, 2018 | |
| By: | /s/ Joseph J. Mantineo | |
| Joseph J. Mantineo | ||
| Treasurer and Chief Financial Officer | ||
| Date: | August 27, 2018 | |