UNITED STATES
SECURITIES AND EXCHANGE COMMISSION
WASHINGTON, D.C. 20549
FORM N-CSR
CERTIFIED SHAREHOLDER REPORT OF REGISTERED
MANAGEMENT INVESTMENT COMPANIES
Investment Company Act file number: 811-02383
AB BOND FUND, INC.
(Exact name of registrant as specified in charter)
1345 Avenue of the Americas, New York, New York 10105
(Address of principal executive offices) (Zip code)
Joseph J. Mantineo
AllianceBernstein L.P.
1345 Avenue of the Americas
New York, New York 10105
(Name and address of agent for service)
Registrant’s telephone number, including area code: (800) 221-5672
Date of fiscal year end: October 31, 2020
Date of reporting period: April 30, 2020
| ITEM 1. | REPORTS TO STOCKHOLDERS. |
APR 04.30.20

SEMI-ANNUAL REPORT
AB ALL MARKET REAL RETURN PORTFOLIO

Beginning January 1, 2021, as permitted by new regulations adopted by the Securities and Exchange Commission, the Fund’s annual and semi-annual shareholder reports will no longer be sent by mail, unless you specifically request paper copies of the reports. Instead, the reports will be made available on a website, and you will be notified by mail each time a report is posted and provided with a website address to access the report.
If you already elected to receive shareholder reports electronically, you will not be affected by this change and you need not take any action. You may elect to receive shareholder reports and other communications from the Fund electronically at any time by contacting your financial intermediary (such as a broker-dealer or bank) or, if you are a direct investor, by calling the Fund at (800) 221 5672.
You may elect to receive all future reports in paper form free of charge. If you invest through a financial intermediary, you can contact your financial intermediary to request that you continue to receive paper copies of your shareholder reports; if you invest directly with the Fund, you can call the Fund at (800) 221 5672. Your election to receive reports in paper form will apply to all funds held in your account with your financial intermediary or, if you invest directly, to all AB Mutual Funds you hold.
| Investment Products Offered | • Are Not FDIC Insured • May Lose Value • Are Not Bank Guaranteed | |
Investors should consider the investment objectives, risks, charges and expenses of the Fund carefully before investing. For copies of our prospectus or summary prospectus, which contain this and other information, visit us online at www.abfunds.com or contact your AB representative. Please read the prospectus and/or summary prospectus carefully before investing.
This shareholder report must be preceded or accompanied by the Fund’s prospectus for individuals who are not current shareholders of the Fund.
You may obtain a description of the Fund’s proxy voting policies and procedures, and information regarding how the Fund voted proxies relating to portfolio securities during the most recent 12-month period ended June 30, without charge. Simply visit AB’s website at www.abfunds.com, or go to the Securities and Exchange Commission’s (the “Commission”) website at www.sec.gov, or call AB at (800) 227 4618.
The Fund files its complete schedule of portfolio holdings with the Commission for the first and third quarters of each fiscal year as an exhibit to its reports on Form N-PORT. The Fund’s Form N-PORT reports are available on the Commission’s website at www.sec.gov. The Fund’s Forms N-PORT may also be reviewed and copied at the Commission’s Public Reference Room in Washington, DC; information on the operation of the Public Reference Room may be obtained by calling (800) SEC 0330. AB publishes full portfolio holdings for the Fund monthly at www.abfunds.com.
AllianceBernstein Investments, Inc. (ABI) is the distributor of the AB family of mutual funds. ABI is a member of FINRA and is an affiliate of AllianceBernstein L.P., the Adviser of the funds.
The [A/B] logo is a registered service mark of AllianceBernstein and AllianceBernstein® is a registered service mark used by permission of the owner, AllianceBernstein L.P.
| FROM THE PRESIDENT |  |
Dear Shareholder,
We are pleased to provide this report for AB All Market Real Return Portfolio (the “Fund”). Please review the discussion of Fund performance, the market conditions during the reporting period and the Fund’s investment strategy.
As always, AB strives to keep clients ahead of what’s next by:
| + | Transforming uncommon insights into uncommon knowledge with a global research scope |
| + | Navigating markets with seasoned investment experience and sophisticated solutions |
| + | Providing thoughtful investment insights and actionable ideas |
Whether you’re an individual investor or a multi-billion-dollar institution, we put knowledge and experience to work for you.
AB’s global research organization connects and collaborates across platforms and teams to deliver impactful insights and innovative products. Better insights lead to better opportunities—anywhere in the world.
For additional information about AB’s range of products and shareholder resources, please log on to www.abfunds.com.
Thank you for your investment in the AB Mutual Funds.
Sincerely,

Robert M. Keith
President and Chief Executive Officer, AB Mutual Funds
| abfunds.com | AB ALL MARKET REAL RETURN PORTFOLIO | 1 | |
SEMI-ANNUAL REPORT
June 10, 2020
This report provides management’s discussion of fund performance for AB All Market Real Return Portfolio for the semi-annual reporting period ended April 30, 2020.
The Fund’s investment objective is to maximize real return over inflation.
NAV RETURNS AS OF APRIL 30, 2020 (unaudited)
| 6 Months | 12 Months | |||||||
| AB ALL MARKET REAL RETURN PORTFOLIO1 | ||||||||
| Class 1 Shares2 | -17.61% | -17.41% | ||||||
| Class 2 Shares2 | -17.44% | -17.16% | ||||||
| Class A Shares | -17.73% | -17.64% | ||||||
| Class C Shares | -18.06% | -18.25% | ||||||
| Advisor Class Shares3 | -17.58% | -17.49% | ||||||
| Class R Shares3 | -17.70% | -17.79% | ||||||
| Class K Shares3 | -17.71% | -17.61% | ||||||
| Class I Shares3 | -17.49% | -17.20% | ||||||
| Class Z Shares3 | -17.49% | -17.30% | ||||||
| MSCI AC World Commodity Producers Index (net) | -24.41% | -29.66% | ||||||
| 1 | Includes the impact of proceeds received and credited to the Fund resulting from class-action settlements, which enhanced the performance of all share classes of the Fund for the six- and 12-month periods ended April 30, 2020, by 0.02% and 0.09%, respectively. |
| 2 | Class 1 shares are only available to Bernstein Global Wealth Management private client accounts. Class 2 shares are only available to the Adviser’s institutional clients or through other limited arrangements. |
| 3 | Please note that these share classes are for investors purchasing shares through accounts established under certain fee-based programs sponsored and maintained by certain broker-dealers and financial intermediaries, institutional pension plans and/or investment advisory clients of, and certain other persons associated with, the Adviser and its affiliates or the Fund. |
INVESTMENT RESULTS
The table above shows the Fund’s performance compared to its benchmark, the Morgan Stanley Capital International All Country (“MSCI AC”) World Commodity Producers Index (net), for the six- and 12-month periods ended April 30, 2020.
During both periods, all share classes of the Fund outperformed the benchmark, before sales charges. For the six-month period, strategic allocation was an overall contributor, relative to benchmark, primarily due to inflation-sensitive equities. Security selection within real estate investment trusts (“REITs”) and commodity futures contributed, while selection in
| 2 | AB ALL MARKET REAL RETURN PORTFOLIO | abfunds.com | |
commodity equities detracted. The Fund’s tactical allocation to deferred commodity futures also contributed.
For the 12-month period, strategic allocation contributed overall as diversification to real estate, commodity futures and inflation-sensitive equities added to returns. Security selection in real estate and currency contributed, while selection in commodity equities detracted. Similar to the six-month period, the Fund’s tactical allocation to deferred commodity futures contributed, as prompt commodity futures significantly underperformed the deferred commodity futures.
The Fund utilized derivatives for hedging and investment purposes in the form of futures, inflation swaps, total return swaps and written options, which detracted from absolute returns for both periods, while currency forwards, variance swaps and purchased options added for both periods.
MARKET REVIEW AND INVESTMENT STRATEGY
US, international and emerging-market equities recorded negative returns for the six-month period ended April 30, 2020. Markets rallied at the conclusion of the period, recovering from losses experienced in March as the novel coronavirus pandemic caused global equity markets to decline after they had reached all-time highs in mid-February. Unprecedented support from central banks and government stimulus programs, along with some signs of progress in the battle against the spread of the virus, offset negative investor sentiment. Growth stocks continued to outperform value stocks over the entire period, and large-cap stocks outperformed their small-cap peers.
Global fixed-income market returns were mixed over the six-month period. The UK’s exit from the European Union and a US-China trade truce in January led markets higher until investor sentiment turned negative in March amid the spread of COVID-19. The US Federal Reserve initiated several measures to provide liquidity in short-term repurchase agreements and US Treasuries, and it lowered interest rates 150 basis points to zero. Other central banks followed suit with substantial rate cuts. Longer-maturity and higher-quality developed-market treasuries were the strongest performers, along with investment-grade US corporate bonds. High-yield corporate bond returns were negative, and securitized asset results were mixed. Emerging-market returns fell as sharply lower oil prices impacted emerging-market commodity exporters. The US dollar advanced against most developed- and emerging-market currencies. The Swiss franc and the yen, which are also considered safe haven currencies, advanced against the US dollar.
Inflation assets fell during the six-month period, with commodities, natural resource equities, REITs and inflation breakevens all posting negative returns. The demand shock from the spread of COVID-19 and resulting lockdowns hit commodity and inflation-related assets hard. Energy assets
| abfunds.com | AB ALL MARKET REAL RETURN PORTFOLIO | 3 | |
collapsed as a price war between Saudi Arabia and Russia resulted in an oil supply glut at the same time global demand was reaching record lows. REITs, generally considered defensive exposure in the equity market, underperformed as the credit backdrop deteriorated and subsectors such as lodging and retail, among others, were directly impacted by the outbreak. Gold disappointed as a defensive exposure early in the selloff, due to crowded positioning, US dollar strength and liquidity issues that led to a rush for cash, but it recovered performance in April, ending positive for the six-month period.
The Fund’s Senior Investment Management Team continues to look for sources of value via asset allocation shifts, active security selection, risk overlay strategies and currency management. The Fund uses a blend of quantitative and fundamental research in order to determine overall portfolio risk, allocate risk across major real asset classes and identify idiosyncratic opportunities.
INVESTMENT POLICIES
The Fund seeks to maximize real return. Real return is the rate of return after adjusting for inflation. The Fund pursues an aggressive investment strategy involving a variety of asset classes. The Fund invests primarily in instruments that the Adviser expects to outperform broad equity indices during periods of rising inflation. Under normal circumstances, the Fund expects to invest its assets principally in the following instruments that, in the judgment of the Adviser, are affected directly or indirectly by the level and change in rate of inflation: inflation-indexed fixed-income securities, such as Treasury inflation-protected securities (“TIPS”) and similar bonds issued by governments outside of the United States; commodities; commodity-related equity securities; real estate equity securities; inflation-sensitive equity securities, which the Fund defines as equity securities of companies that the Adviser believes have the ability to pass along increasing costs to consumers and maintain or grow margins in rising inflation environments, including equity securities of utilities and infrastructure-related companies (“inflation-sensitive equities”); securities and derivatives linked to the price of other assets (such as commodities, stock indices and real estate); and currencies. The Fund expects its investments in fixed-income securities to have a broad range of maturities and quality levels.
The Fund seeks inflation protection from investments around the globe, both in developed- and emerging-market countries. In selecting securities for purchase and sale, the Adviser utilizes its qualitative and quantitative resources to determine overall inflation sensitivity, asset allocation and security selection. The Adviser assesses the securities’
(continued on next page)
| 4 | AB ALL MARKET REAL RETURN PORTFOLIO | abfunds.com | |
risks and inflation sensitivity as well as the securities’ impact on the overall risks and inflation sensitivity of the Fund. When its analysis indicates that changes are necessary, the Adviser intends to implement them through a combination of changes to underlying positions and the use of inflation swaps and other types of derivatives, such as interest rate swaps.
The Fund anticipates that its targeted investment mix, other than its investments in inflation-indexed fixed-income securities, will focus on commodity-related equity securities, commodities and commodity derivatives, real estate equity securities and inflation-sensitive equities to provide a balance between expected return and inflation protection. The Fund may vary its investment allocations among these asset classes, at times significantly. Its commodities investments will include significant exposure to energy commodities, but will also include agricultural products, and industrial and precious metals, such as gold. The Fund’s investments in real estate equity securities will include real estate investment trusts (“REITs”) and other real estate-related securities.
The Fund invests in both US and non-US dollar-denominated equity or fixed-income securities. The Fund may invest in currencies for hedging or investment purposes, both in the spot market and through long or short positions in currency-related derivatives. The Fund does not ordinarily expect to hedge its foreign currency exposure because it will be balanced by investments in US dollar-denominated securities, although it may hedge the exposure under certain circumstances.
The Fund may invest significantly to the extent permitted by applicable law in derivatives, such as options, futures contracts, forwards, swaps or structured notes. The Fund intends to use leverage for investment purposes through the use of cash made available by derivatives transactions to make other investments in accordance with its investment policies. In determining when and to what extent to employ leverage or enter into derivatives transactions, the Adviser considers factors such as the relative risks and returns expected of potential investments and the cost of such transactions. The Adviser considers the impact of derivatives in making its assessments of the Fund’s risks. The resulting exposures to markets, sectors, issuers or specific securities will be continuously monitored by the Adviser.
The Fund may seek to gain exposure to physical commodities traded in the commodities markets through investments in a variety of derivative instruments, including investments in commodity index-linked notes. The Adviser expects that the Fund will seek to gain
(continued on next page)
| abfunds.com | AB ALL MARKET REAL RETURN PORTFOLIO | 5 | |
exposure to commodities and commodity-related instruments and derivatives primarily through investments in AllianceBernstein Cayman Inflation Strategy, Ltd., a wholly-owned subsidiary of the Fund organized under the laws of the Cayman Islands (the “Subsidiary”). The Subsidiary is advised by the Adviser and has the same investment objective and substantially similar investment policies and restrictions as the Fund except that the Subsidiary, unlike the Fund, may invest, without limitation, in commodities and commodity-related instruments. The Fund is subject to the risks associated with the commodities, derivatives and other instruments in which the Subsidiary invests, to the extent of its investment in the Subsidiary. The Fund limits its investment in the Subsidiary to no more than 25% of its net assets. Investment in the Subsidiary is expected to provide the Fund with commodity exposure within the limitations of federal tax requirements that apply to the Fund.
The Fund is “non-diversified”, which means that it may concentrate its assets in a smaller number of issuers than a diversified fund.
| 6 | AB ALL MARKET REAL RETURN PORTFOLIO | abfunds.com | |
DISCLOSURES AND RISKS
Benchmark Disclosure
The MSCI AC World Commodity Producers Index is unmanaged and does not reflect fees and expenses associated with the active management of a mutual fund portfolio. The MSCI AC World Commodity Producers Index is a free float-adjusted, market capitalization index designed to track the performance of global listed commodity producers, including emerging markets. Commodities sectors include: energy, grains, industrial metals, petroleum, precious metals and softs. MSCI makes no express or implied warranties or representations, and shall have no liability whatsoever with respect to any MSCI data contained herein. The MSCI data may not be further redistributed or used as a basis for other indices, any securities or financial products. This report is not approved, reviewed or produced by MSCI. Net returns include the reinvestment of dividends after deduction of non-US withholding tax. An investor cannot invest directly in an index, and its results are not indicative of the performance for any specific investment, including the Fund.
A Word About Risk
Market Risk: The market value of a security may move up or down, sometimes rapidly and unpredictably. These fluctuations may cause a security to be worth less than the price originally paid for it, or less than it was worth at an earlier time. Market risk may affect a single issuer, industry, sector of the economy or the market as a whole. Global economies and financial markets are increasingly interconnected, which increases the probabilities that conditions in one country or region might adversely impact issuers in a different country or region. Conditions affecting the general economy, including political, social, or economic instability at the local, regional, or global level may also affect the market value of a security. Health crises, such as pandemic and epidemic diseases, as well as other incidents that interrupt the expected course of events, such as natural disasters, war or civil disturbance, acts of terrorism, power outages and other unforeseeable and external events, and the public response to or fear of such diseases or events, have and may in the future have an adverse effect on the Fund’s investments and net asset value and can lead to increased market volatility. For example, any preventative or protective actions that governments may take in respect of such diseases or events may result in periods of business disruption, inability to obtain raw materials, supplies and component parts, and reduced or disrupted operations for the Fund’s portfolio companies. The occurrence and pendency of such diseases or events could adversely affect the economies and financial markets either in specific countries or worldwide.
Credit Risk: An issuer or guarantor of a fixed-income security, or the counterparty to a derivatives or other contract, may be unable or unwilling to make timely payments of interest or principal, or to otherwise honor its
| abfunds.com | AB ALL MARKET REAL RETURN PORTFOLIO | 7 | |
DISCLOSURES AND RISKS (continued)
obligations. The issuer or guarantor may default, causing a loss of the full principal amount of a security and accrued interest. The degree of risk for a particular security may be reflected in its credit rating. There is the possibility that the credit rating of a fixed-income security may be downgraded after purchase, which may adversely affect the value of the security. Investments in fixed-income securities with lower ratings tend to have a higher probability that an issuer will default or fail to meet its payment obligations.
Interest-Rate Risk: Changes in interest rates will affect the value of investments in fixed-income securities. When interest rates rise, the value of existing investments in fixed-income securities tends to fall and this decrease in value may not be offset by higher income from new investments. Interest-rate risk is generally greater for fixed-income securities with longer maturities or durations.
Commodity Risk: Investing in commodities and commodity-linked derivative instruments, either directly or through the Subsidiary, may subject the Fund to greater volatility than investments in traditional securities. The value of commodity-linked derivative instruments may be affected by changes in overall market movements, commodity index volatility, changes in interest rates, or factors affecting a particular industry or commodity, such as drought, floods, weather, livestock disease, embargoes, tariffs and international economic, political and regulatory developments.
Derivatives Risk: Derivatives may be difficult to price or unwind and leveraged so that small changes may produce disproportionate losses for the Fund. Derivatives, especially over-the-counter derivatives, are also subject to counterparty risk.
Leverage Risk: To the extent the Fund uses leveraging techniques, its net asset value (“NAV”) may be more volatile because leverage tends to exaggerate the effect of changes in interest rates and any increase or decrease in the value of the Fund’s investments.
Illiquid Investments Risk: Illiquid investments risk exists when certain investments are or become difficult to purchase or sell. Difficulty in selling such investments may result in sales at disadvantageous prices affecting the value of your investment in the Fund. Causes of illiquid investments risk may include low trading volumes and large positions. Foreign fixed-income securities may have more illiquid investments risk because secondary trading markets for these securities may be smaller and less well-developed and the securities may trade less frequently. Illiquid investments risk may be higher in a rising interest-rate environment, when the value and liquidity of fixed-income securities generally go down.
| 8 | AB ALL MARKET REAL RETURN PORTFOLIO | abfunds.com | |
DISCLOSURES AND RISKS (continued)
Foreign (Non-US) Risk: Investments in securities of non-US issuers may involve more risk than those of US issuers. These securities may fluctuate more widely in price and may be more difficult to trade due to adverse market, economic, political, regulatory or other factors.
Currency Risk: Fluctuations in currency exchange rates may negatively affect the value of the Fund’s investments or reduce its returns.
Subsidiary Risk: By investing in the Subsidiary, the Fund is indirectly exposed to the risks associated with the Subsidiary’s investments. The derivatives and other investments held by the Subsidiary are generally similar to those that are permitted to be held by the Fund and are subject to the same risks that apply to similar investments if held directly by the Fund. The Subsidiary is not registered under the Investment Company Act of 1940, as amended (the “1940 Act”), and, unless otherwise noted in the Fund’s prospectus, is not subject to all of the investor protections of the 1940 Act. However, the Fund wholly owns and controls the Subsidiary, and the Fund and the Subsidiary are managed by the Adviser, making it unlikely the Subsidiary will take actions contrary to the interests of the Fund or its shareholders.
Real Estate Risk: The Fund’s investments in real estate securities have many of the same risks as direct ownership of real estate, including the risk that the value of real estate could decline due to a variety of factors that affect the real estate market generally. Investments in REITs may have additional risks. REITs are dependent on the capability of their managers, may have limited diversification, and could be significantly affected by changes in taxes.
Non-Diversification Risk: The Fund may have more risk because it is “non-diversified”, meaning that it can invest more of its assets in a smaller number of issuers. Accordingly, changes in the value of a single security may have a more significant effect, either negative or positive, on the Fund’s NAV.
Active Trading Risk: The Fund expects to engage in active and frequent trading of its portfolio securities and its portfolio turnover rate may greatly exceed 100%. A higher rate of portfolio turnover increases transaction costs, which may negatively affect the Fund’s return. In addition, a high rate of portfolio turnover may result in substantial short-term gains, which may have adverse tax consequences for Fund shareholders.
Management Risk: The Fund is subject to management risk because it is an actively managed investment fund. The Adviser will apply its investment techniques and risk analyses in making investment decisions, but there is no guarantee that its techniques will produce the intended results. Some
| abfunds.com | AB ALL MARKET REAL RETURN PORTFOLIO | 9 | |
DISCLOSURES AND RISKS (continued)
of these techniques may incorporate, or rely upon, quantitative models, but there is no guarantee that these models will generate accurate forecasts, reduce risk or otherwise perform as expected.
These risks are fully discussed in the Fund’s prospectus. As with all investments, you may lose money by investing in the Fund.
An Important Note About Historical Performance
The investment return and principal value of an investment in the Fund will fluctuate, so that shares, when redeemed, may be worth more or less than their original cost. Performance shown in this report represents past performance and does not guarantee future results. Current performance may be lower or higher than the performance information shown. You may obtain performance information current to the most recent month-end by visiting www.abfunds.com. For Class 1 shares, go to www.bernstein.com and click on “Investments”, then “Mutual Fund and Money Market Information—Mutual Fund Performance at a Glance”.
Investors should consider the investment objectives, risks, charges and expenses of the Fund carefully before investing. For copies of our prospectus or summary prospectus, which contain this and other information, visit us online at www.abfunds.com. For Class 1 shares, go to www.bernstein.com, click on “Investments”, then “Mutual Fund and Money Market Information—Prospectuses, SAIs, and Shareholder Reports”. Please read the prospectus and/or summary prospectus carefully before investing.
All fees and expenses related to the operation of the Fund have been deducted. NAV returns do not reflect sales charges; if sales charges were reflected, the Fund’s quoted performance would be lower. SEC returns reflect the applicable sales charges for each share class: a 4.25% maximum front-end sales charge for Class A shares and a 1% 1-year contingent deferred sales charge for Class C shares. Returns for the different share classes will vary due to different expenses associated with each class. Performance assumes reinvestment of distributions and does not account for taxes.
| 10 | AB ALL MARKET REAL RETURN PORTFOLIO | abfunds.com | |
HISTORICAL PERFORMANCE
AVERAGE ANNUAL RETURNS AS OF APRIL 30, 2020 (unaudited)
| NAV Returns | SEC Returns (reflects applicable sales charges) | |||||||
| CLASS 1 SHARES1 | ||||||||
| 1 Year | -17.41% | -17.41% | ||||||
| 5 Years | -4.00% | -4.00% | ||||||
| 10 Years | -1.74% | -1.74% | ||||||
| CLASS 2 SHARES1 | ||||||||
| 1 Year | -17.16% | -17.16% | ||||||
| 5 Years | -3.74% | -3.74% | ||||||
| 10 Years | -1.50% | -1.50% | ||||||
| CLASS A SHARES | ||||||||
| 1 Year | -17.64% | -21.11% | ||||||
| 5 Years | -4.18% | -5.00% | ||||||
| 10 Years | -1.86% | -2.29% | ||||||
| CLASS C SHARES | ||||||||
| 1 Year | -18.25% | -19.06% | ||||||
| 5 Years | -4.90% | -4.90% | ||||||
| 10 Years | -2.58% | -2.58% | ||||||
| ADVISOR CLASS SHARES2 | ||||||||
| 1 Year | -17.49% | -17.49% | ||||||
| 5 Years | -3.95% | -3.95% | ||||||
| 10 Years | -1.60% | -1.60% | ||||||
| CLASS R SHARES2 | ||||||||
| 1 Year | -17.79% | -17.79% | ||||||
| 5 Years | -4.41% | -4.41% | ||||||
| 10 Years | -2.09% | -2.09% | ||||||
| CLASS K SHARES2 | ||||||||
| 1 Year | -17.61% | -17.61% | ||||||
| 5 Years | -4.17% | -4.17% | ||||||
| 10 Years | -1.83% | -1.83% | ||||||
| CLASS I SHARES2 | ||||||||
| 1 Year | -17.20% | -17.20% | ||||||
| 5 Years | -3.77% | -3.77% | ||||||
| 10 Years | -1.51% | -1.51% | ||||||
| CLASS Z SHARES2 | ||||||||
| 1 Year | -17.30% | -17.30% | ||||||
| 5 Years | -3.78% | -3.78% | ||||||
| Since Inception3 | -4.14% | -4.14% | ||||||
(footnotes continued on next page)
| abfunds.com | AB ALL MARKET REAL RETURN PORTFOLIO | 11 | |
HISTORICAL PERFORMANCE (continued)
The Fund’s prospectus fee table shows the Fund’s total annual operating expense ratios as 1.12%, 0.83%, 1.34%, 2.09%, 1.09%, 1.59%, 1.30%, 0.88% and 0.87% for Class 1, Class 2, Class A, Class C, Advisor Class, Class R, Class K, Class I and Class Z shares, respectively, gross of any fee waivers or expense reimbursements. Contractual fee waivers and/or expense reimbursements limit the Fund’s annual operating expense ratios exclusive of extraordinary expenses, interest expense, and acquired fund fees and expenses other than the advisory fees of any AB mutual funds in which the Fund may invest, interest expense, taxes, extraordinary expenses, brokerage commissions and other transaction costs to 1.31%, 2.06%, 1.06%, 1.56%, 1.28%, 0.87% and 0.85% for Class A, Class C, Advisor Class, Class R, Class K, Class I and Class Z shares, respectively. These waivers/reimbursements may not be terminated before January 31, 2021 and may be extended by the Adviser for additional one-year terms. Absent reimbursements or waivers, performance would have been lower. The Financial Highlights section of this report sets forth expense ratio data for the current reporting period; the expense ratios shown above may differ from the expense ratios in the Financial Highlights section since they are based on different time periods.
| 1 | Class 1 shares are only available to Bernstein Global Wealth Management private client accounts. Class 2 shares are only available to the Adviser’s institutional clients or through other limited arrangements. |
| 2 | These share classes are offered at NAV to eligible investors and their SEC returns are the same as their NAV returns. Please note that these share classes are for investors purchasing shares through accounts established under certain fee-based programs sponsored and maintained by certain broker-dealers and financial intermediaries, institutional pension plans and/or investment advisory clients of, and certain other persons associated with, the Adviser and its affiliates or the Fund. |
| 3 | Inception date: 1/31/2014. |
| 12 | AB ALL MARKET REAL RETURN PORTFOLIO | abfunds.com | |
HISTORICAL PERFORMANCE (continued)
SEC AVERAGE ANNUAL RETURNS
AS OF THE MOST RECENT CALENDAR QUARTER-END
MARCH 31, 2020 (unaudited)
| SEC Returns (reflects applicable sales charges) | ||||
| CLASS 1 SHARES1 | ||||
| 1 Year | -22.63% | |||
| 5 Years | -4.21% | |||
| 10 Years | -2.21% | |||
| CLASS 2 SHARES1 | ||||
| 1 Year | -22.30% | |||
| 5 Years | -3.95% | |||
| 10 Years | -1.96% | |||
| CLASS A SHARES | ||||
| 1 Year | -26.12% | |||
| 5 Years | -5.21% | |||
| 10 Years | -2.76% | |||
| CLASS C SHARES | ||||
| 1 Year | -24.06% | |||
| 5 Years | -5.08% | |||
| 10 Years | -3.03% | |||
| ADVISOR CLASS SHARES2 | ||||
| 1 Year | -22.54% | |||
| 5 Years | -4.13% | |||
| 10 Years | -2.06% | |||
| CLASS R SHARES2 | ||||
| 1 Year | -22.96% | |||
| 5 Years | -4.61% | |||
| 10 Years | -2.55% | |||
| CLASS K SHARES2 | ||||
| 1 Year | -22.79% | |||
| 5 Years | -4.38% | |||
| 10 Years | -2.30% | |||
| CLASS I SHARES2 | ||||
| 1 Year | -22.52% | |||
| 5 Years | -4.01% | |||
| 10 Years | -1.99% | |||
| CLASS Z SHARES2 | ||||
| 1 Year | -22.40% | |||
| 5 Years | -3.97% | |||
| Since Inception3 | -5.24% | |||
(footnotes continued on next page)
| abfunds.com | AB ALL MARKET REAL RETURN PORTFOLIO | 13 | |
HISTORICAL PERFORMANCE (continued)
| 1 | Class 1 shares are only available to Bernstein Global Wealth Management private client accounts. Class 2 shares are only available to the Adviser’s institutional clients or through other limited arrangements. |
| 2 | Please note that these share classes are for investors purchasing shares through accounts established under certain fee-based programs sponsored and maintained by certain broker-dealers and financial intermediaries, institutional pension plans and/or investment advisory clients of, and certain other persons associated with, the Adviser and its affiliates or the Fund. |
| 3 | Inception date: 1/31/2014. |
| 14 | AB ALL MARKET REAL RETURN PORTFOLIO | abfunds.com | |
EXPENSE EXAMPLE
(unaudited)
As a shareholder of a mutual fund, you may incur two types of costs: (1) transaction costs, including sales charges (loads) on purchase payments, contingent deferred sales charges on redemptions and (2) ongoing costs, including management fees; distribution (12b-1) fees; and other fund expenses. This example is intended to help you understand your ongoing costs (in dollars) of investing in the Fund and to compare these costs with the ongoing costs of investing in other mutual funds.
The Example is based on an investment of $1,000 invested at the beginning of the period and held for the entire period as indicated below.
Actual Expenses
The table below provides information about actual account values and actual expenses. You may use the information in this line, together with the amount you invested, to estimate the expenses that you paid over the period. Simply divide your account value by $1,000 (for example, an $8,600 account value divided by $1,000 = 8.6), then multiply the result by the number in the first line under the heading entitled “Expenses Paid During Period” to estimate the expenses you paid on your account during this period.
Hypothetical Example for Comparison Purposes
The table below provides information about hypothetical account values and hypothetical expenses based on the Fund’s actual expense ratio and an assumed annual rate of return of 5% before expenses, which is not the Fund’s actual return. The hypothetical account values and expenses may not be used to estimate the actual ending account balance or expenses you paid for the period. You may use this information to compare the ongoing costs of investing in the Fund and other funds by comparing this 5% hypothetical example with the 5% hypothetical examples that appear in the shareholder reports of other funds.
Please note that the expenses shown in the table are meant to highlight your ongoing costs only and do not reflect any transactional costs, such as sales charges (loads), or contingent deferred sales charges on redemptions. Therefore, the hypothetical example is useful in comparing ongoing costs only, and will not help you determine the relative total costs of owning different funds. In addition, if these transactional costs were included, your costs would have been higher.
| abfunds.com | AB ALL MARKET REAL RETURN PORTFOLIO | 15 | |
EXPENSE EXAMPLE (continued)
| Beginning Account Value November 1, 2019 | Ending Account Value April 30, 2020 | Expenses Paid During Period* | Annualized Expense Ratio* | Total Expenses Paid During Period+ | Total Annualized Expense Ratio+ | |||||||||||||||||||
| Class A | ||||||||||||||||||||||||
Actual | $ | 1,000 | $ | 822.70 | $ | 5.85 | 1.29 | % | $ | 5.98 | 1.32 | % | ||||||||||||
Hypothetical** | $ | 1,000 | $ | 1,018.45 | $ | 6.47 | 1.29 | % | $ | 6.62 | 1.32 | % | ||||||||||||
| Class C | ||||||||||||||||||||||||
Actual | $ | 1,000 | $ | 819.40 | $ | 9.23 | 2.04 | % | $ | 9.36 | 2.07 | % | ||||||||||||
Hypothetical** | $ | 1,000 | $ | 1,014.72 | $ | 10.22 | 2.04 | % | $ | 10.37 | 2.07 | % | ||||||||||||
| Advisor Class | ||||||||||||||||||||||||
Actual | $ | 1,000 | $ | 824.20 | $ | 4.72 | 1.04 | % | $ | 4.85 | 1.07 | % | ||||||||||||
Hypothetical** | $ | 1,000 | $ | 1,019.69 | $ | 5.22 | 1.04 | % | $ | 5.37 | 1.07 | % | ||||||||||||
| Class R | ||||||||||||||||||||||||
Actual | $ | 1,000 | $ | 823.00 | $ | 6.98 | 1.54 | % | $ | 7.12 | 1.57 | % | ||||||||||||
Hypothetical** | $ | 1,000 | $ | 1,017.21 | $ | 7.72 | 1.54 | % | $ | 7.87 | 1.57 | % | ||||||||||||
| Class K | ||||||||||||||||||||||||
Actual | $ | 1,000 | $ | 822.90 | $ | 5.76 | 1.27 | % | $ | 5.89 | 1.30 | % | ||||||||||||
Hypothetical** | $ | 1,000 | $ | 1,018.55 | $ | 6.37 | 1.27 | % | $ | 6.52 | 1.30 | % | ||||||||||||
| Class I | ||||||||||||||||||||||||
Actual | $ | 1,000 | $ | 825.10 | $ | 3.95 | 0.87 | % | $ | 4.08 | 0.90 | % | ||||||||||||
Hypothetical** | $ | 1,000 | $ | 1,020.54 | $ | 4.37 | 0.87 | % | $ | 4.52 | 0.90 | % | ||||||||||||
| Class 1 | ||||||||||||||||||||||||
Actual | $ | 1,000 | $ | 823.90 | $ | 4.99 | 1.10 | % | $ | 5.12 | 1.13 | % | ||||||||||||
Hypothetical** | $ | 1,000 | $ | 1,019.39 | $ | 5.52 | 1.10 | % | $ | 5.67 | 1.13 | % | ||||||||||||
| Class 2 | ||||||||||||||||||||||||
Actual | $ | 1,000 | $ | 825.60 | $ | 3.72 | 0.82 | % | $ | 3.86 | 0.85 | % | ||||||||||||
Hypothetical** | $ | 1,000 | $ | 1,020.79 | $ | 4.12 | 0.82 | % | $ | 4.27 | 0.85 | % | ||||||||||||
| Class Z | ||||||||||||||||||||||||
Actual | $ | 1,000 | $ | 825.10 | $ | 3.81 | 0.84 | % | $ | 3.95 | 0.87 | % | ||||||||||||
Hypothetical** | $ | 1,000 | $ | 1,020.69 | $ | 4.22 | 0.84 | % | $ | 4.37 | 0.87 | % | ||||||||||||
| * | Expenses are equal to the Fund’s annualized expense ratio, multiplied by the average account value over the period, multiplied by 182/366 (to reflect the one-half year period). |
| ** | Assumes 5% annual return before expenses. |
| + | In connection with the Fund’s investments in affiliated/unaffiliated underlying portfolios, the Fund incurs no direct expenses, but bears proportionate shares of the fees and expenses (i.e., operating, administrative and investment advisory fees) of the affiliated/unaffiliated underlying portfolios. The Adviser has contractually agreed to waive its fees from the Fund in an amount equal to the Fund’s pro rata share of certain acquired fund fees and expenses of the affiliated underlying portfolios. The Fund’s total expenses are equal to the classes’ annualized expense ratio plus the Fund’s pro rata share of the weighted average expense ratio of the affiliated/unaffiliated underlying portfolios in which it invests, multiplied by the average account value over the period, multiplied by 182/366 (to reflect the one-half year period). |
| 16 | AB ALL MARKET REAL RETURN PORTFOLIO | abfunds.com | |
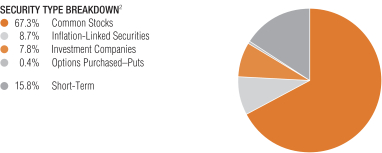
PORTFOLIO SUMMARY
April 30, 2020 (unaudited)
PORTFOLIO STATISTICS
Net Assets ($mil): $910.0
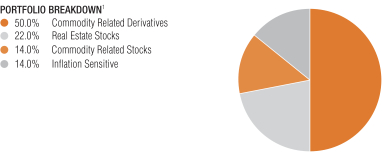
| 1 | All data are as of April 30, 2020. The portfolio breakdown is expressed as an approximate percentage of the Fund’s net assets inclusive of derivative exposure, based on the Adviser’s internal classification guidelines. |
| 2 | The Fund’s security type breakdown is expressed as a percentage of total investments (excluding security lending collateral) and may vary over time. The Fund also enters into derivative transactions, which may be used for hedging or investment purposes (see “Portfolio of Investments” section of the report for additional details). |
| abfunds.com | AB ALL MARKET REAL RETURN PORTFOLIO | 17 | |
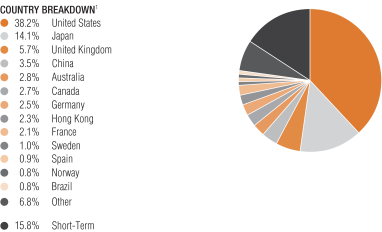
PORTFOLIO SUMMARY (continued)
April 30, 2020 (unaudited)
PORTFOLIO STATISTICS
Net Assets ($mil): $910.0
TEN LARGEST HOLDINGS2
| Company | U.S. $ Value | Percent of Net Assets | ||||||
| Japanese Government CPI Linked Bond Series 21 | $ | 74,797,693 | 8.2 | % | ||||
| iShares Global Energy ETF | 20,054,345 | 2.2 | ||||||
| Royal Dutch Shell PLC – Class B | 15,466,008 | 1.7 | ||||||
| Prologis, Inc. | 14,407,165 | 1.6 | ||||||
| Vanguard Real Estate ETF | 13,288,806 | 1.5 | ||||||
| Chevron Corp. | 12,306,288 | 1.3 | ||||||
| iShares MSCI Global Metals & Mining Producers ETF | 11,919,395 | 1.3 | ||||||
| Vanguard Global ex-U.S. Real Estate ETF | 11,546,981 | 1.3 | ||||||
| TOTAL SA | 9,400,119 | 1.0 | ||||||
| Digital Realty Trust, Inc. | 9,117,395 | 1.0 | ||||||
| $ | 192,304,195 | 21.1 | % | |||||
| 1 | All data are as of April 30, 2020. The Fund’s country breakdown is expressed as a percentage of total investments (excluding security lending collateral) and may vary over time. The Fund also enters into derivative transactions, which may be used for hedging or investment purposes (see “Portfolio of Investments” section of the report for additional details). “Other” country weightings represent 0.7% or less in the following: Austria, Belgium, Chile, Denmark, Finland, Greece, Ireland, Israel, Italy, Luxembourg, Mexico, Netherlands, New Zealand, Philippines, Russia, Singapore, South Africa, South Korea, Switzerland, Thailand, Turkey and United Arab Emirates. |
| 2 | Long-term investments. |
| 18 | AB ALL MARKET REAL RETURN PORTFOLIO | abfunds.com | |
CONSOLIDATED PORTFOLIO OF INVESTMENTS
April 30, 2020 (unaudited)
| Company | Shares | U.S. $ Value | ||||||||||
| ||||||||||||
COMMON STOCKS – 63.5% | ||||||||||||
Real Estate – 34.6% | ||||||||||||
Diversified Real Estate Activities – 2.4% | ||||||||||||
City Developments Ltd. | 249,700 | $ | 1,395,760 | |||||||||
Mitsubishi Estate Co., Ltd. | 168,300 | 2,722,779 | ||||||||||
Mitsui Fudosan Co., Ltd. | 447,400 | 8,226,319 | ||||||||||
New World Development Co., Ltd. | 1,579,000 | 1,865,499 | ||||||||||
Sumitomo Realty & Development Co., Ltd. | 50,600 | 1,355,196 | ||||||||||
Sun Hung Kai Properties Ltd. | 332,000 | 4,539,710 | ||||||||||
UOL Group Ltd. | 329,700 | 1,585,747 | ||||||||||
|
| |||||||||||
| 21,691,010 | ||||||||||||
|
| |||||||||||
Diversified REITs – 2.6% | ||||||||||||
Activia Properties, Inc. | 390 | 1,137,740 | ||||||||||
Alexander & Baldwin, Inc. | 111,570 | 1,466,030 | ||||||||||
Armada Hoffler Properties, Inc. | 164,533 | 1,581,162 | ||||||||||
Essential Properties Realty Trust, Inc. | 166,020 | 2,438,834 | ||||||||||
Fibra Uno Administracion SA de CV | 991,230 | 822,975 | ||||||||||
Growthpoint Properties Ltd. | 1,440,142 | 1,082,311 | ||||||||||
Hulic Reit, Inc. | 2,312 | 2,580,435 | ||||||||||
ICADE | 37,520 | 2,882,094 | ||||||||||
Kenedix Office Investment Corp. – Class A(a) | 311 | 1,536,400 | ||||||||||
Mirvac Group | 1,711,580 | 2,487,086 | ||||||||||
NIPPON REIT Investment Corp. | 277 | 825,065 | ||||||||||
Stockland | 988,549 | 1,835,642 | ||||||||||
United Urban Investment Corp. | 3,085 | 3,095,030 | ||||||||||
|
| |||||||||||
| 23,770,804 | ||||||||||||
|
| |||||||||||
Health Care REITs – 3.2% | ||||||||||||
Assura PLC | 4,242,710 | 4,069,403 | ||||||||||
Healthpeak Properties, Inc. | 203,660 | 5,323,673 | ||||||||||
Medical Properties Trust, Inc. | 255,880 | 4,385,783 | ||||||||||
Omega Healthcare Investors, Inc. | 139,476 | 4,065,725 | ||||||||||
Physicians Realty Trust | 210,056 | 3,239,064 | ||||||||||
Welltower, Inc. | 160,110 | 8,202,435 | ||||||||||
|
| |||||||||||
| 29,286,083 | ||||||||||||
|
| |||||||||||
Hotel & Resort REITs – 0.3% | ||||||||||||
Park Hotels & Resorts, Inc. | 228,808 | 2,175,964 | ||||||||||
RLJ Lodging Trust | 109,280 | 1,015,211 | ||||||||||
|
| |||||||||||
| 3,191,175 | ||||||||||||
|
| |||||||||||
Industrial REITs – 3.7% | ||||||||||||
Americold Realty Trust | 121,450 | 3,715,156 | ||||||||||
Dream Industrial Real Estate Investment Trust | 194,124 | 1,419,722 | ||||||||||
| abfunds.com | AB ALL MARKET REAL RETURN PORTFOLIO | 19 | |
CONSOLIDATED PORTFOLIO OF INVESTMENTS (continued)
| Company | Shares | U.S. $ Value | ||||||||||
| ||||||||||||
Industrial & Infrastructure Fund Investment Corp. | 1,244 | $ | 1,732,919 | |||||||||
Nippon Prologis REIT, Inc.(b) | 1,246 | 3,449,294 | ||||||||||
Prologis, Inc. | 161,461 | 14,407,165 | ||||||||||
Rexford Industrial Realty, Inc. | 59,160 | 2,408,995 | ||||||||||
Segro PLC | 247,272 | 2,591,787 | ||||||||||
STAG Industrial, Inc. | 151,130 | 3,967,163 | ||||||||||
|
| |||||||||||
| 33,692,201 | ||||||||||||
|
| |||||||||||
Office REITs – 3.8% | ||||||||||||
Alexandria Real Estate Equities, Inc. | 43,191 | 6,784,874 | ||||||||||
Allied Properties Real Estate Investment Trust | 77,560 | 2,482,901 | ||||||||||
Boston Properties, Inc. | 59,530 | 5,785,125 | ||||||||||
CapitaLand Commercial Trust | 2,343,000 | 2,662,458 | ||||||||||
Cousins Properties, Inc. | 125,565 | 3,788,296 | ||||||||||
Daiwa Office Investment Corp. | 277 | 1,532,424 | ||||||||||
Easterly Government Properties, Inc. | 86,140 | 2,318,027 | ||||||||||
Inmobiliaria Colonial Socimi SA | 164,560 | 1,589,474 | ||||||||||
Japan Real Estate Investment Corp. | 295 | 1,593,371 | ||||||||||
Kilroy Realty Corp. | 61,750 | 3,844,555 | ||||||||||
Mori Hills REIT Investment Corp. | 1,225 | 1,567,421 | ||||||||||
True North Commercial Real Estate Investment Trust | 146,620 | 624,632 | ||||||||||
|
| |||||||||||
| 34,573,558 | ||||||||||||
|
| |||||||||||
Real Estate Development – 3.8% | ||||||||||||
China Resources Land Ltd. | 1,152,000 | 4,760,298 | ||||||||||
CIFI Holdings Group Co., Ltd. | 7,208,000 | 5,506,460 | ||||||||||
CK Asset Holdings Ltd. | 886,000 | 5,598,404 | ||||||||||
Emaar Properties PJSC | 2,367,470 | 1,736,231 | ||||||||||
Instone Real Estate Group AG(b)(c) | 95,480 | 1,933,668 | ||||||||||
Megaworld Corp. | 17,716,000 | 894,000 | ||||||||||
Midea Real Estate Holding Ltd.(c) | 2,038,400 | 5,236,845 | ||||||||||
Sunac China Holdings Ltd. | 660,000 | 2,952,346 | ||||||||||
Times China Holdings Ltd. | 3,312,000 | 5,555,963 | ||||||||||
|
| |||||||||||
| 34,174,215 | ||||||||||||
|
| |||||||||||
Real Estate Operating Companies – 4.5% | ||||||||||||
Aroundtown SA | 712,713 | 3,833,592 | ||||||||||
Azrieli Group Ltd. | 24,850 | 1,471,451 | ||||||||||
CA Immobilien Anlagen AG | 80,379 | 2,551,816 | ||||||||||
Central Pattana PCL(b) | 421,300 | 638,037 | ||||||||||
Deutsche Wohnen SE | 62,210 | 2,521,256 | ||||||||||
Entra ASA(c) | 275,588 | 3,469,882 | ||||||||||
Fabege AB(b) | 300,115 | 3,555,137 | ||||||||||
Grainger PLC | 791,800 | 2,660,223 | ||||||||||
Hulic Co., Ltd. | 40,000 | 395,598 | ||||||||||
| 20 | AB ALL MARKET REAL RETURN PORTFOLIO | abfunds.com | |
CONSOLIDATED PORTFOLIO OF INVESTMENTS (continued)
| Company | Shares | U.S. $ Value | ||||||||||
| ||||||||||||
LEG Immobilien AG | 17,470 | $ | 2,005,641 | |||||||||
Parque Arauco SA | 499,500 | 838,243 | ||||||||||
PSP Swiss Property AG (REG) | 19,150 | 2,224,605 | ||||||||||
SM Prime Holdings, Inc. | 1,497,400 | 911,860 | ||||||||||
Swire Properties Ltd. | 661,000 | 1,853,951 | ||||||||||
Vonovia SE | 171,183 | 8,464,801 | ||||||||||
Wharf Real Estate Investment Co., Ltd. | 308,000 | 1,303,909 | ||||||||||
Wihlborgs Fastigheter AB | 142,890 | 2,038,921 | ||||||||||
|
| |||||||||||
| 40,738,923 | ||||||||||||
|
| |||||||||||
Real Estate Services – 0.2% | ||||||||||||
Times Neighborhood Holdings Ltd.(b)(c) | 868,769 | 739,721 | ||||||||||
Unibail-Rodamco-Westfield | 15,300 | 905,716 | ||||||||||
|
| |||||||||||
| 1,645,437 | ||||||||||||
|
| |||||||||||
Residential REITs – 4.5% | ||||||||||||
American Campus Communities, Inc. | 98,570 | 3,478,535 | ||||||||||
American Homes 4 Rent – Class A | 188,450 | 4,549,183 | ||||||||||
Bluerock Residential Growth REIT, Inc. | 80,910 | 470,896 | ||||||||||
Camden Property Trust | 41,290 | 3,636,411 | ||||||||||
Comforia Residential REIT, Inc. | 481 | 1,428,177 | ||||||||||
Daiwa Securities Living Investments Corp. | 1,655 | 1,383,033 | ||||||||||
Essex Property Trust, Inc. | 19,340 | 4,720,894 | ||||||||||
Independence Realty Trust, Inc. | 282,150 | 2,841,251 | ||||||||||
Killam Apartment Real Estate Investment Trust | 296,860 | 3,567,993 | ||||||||||
Mid-America Apartment Communities, Inc. | 48,900 | 5,472,888 | ||||||||||
Northview Apartment Real Estate Investment Trust | 87,840 | 2,221,321 | ||||||||||
Sun Communities, Inc. | 43,517 | 5,848,685 | ||||||||||
UNITE Group PLC (The) | 155,895 | 1,721,426 | ||||||||||
|
| |||||||||||
| 41,340,693 | ||||||||||||
|
| |||||||||||
Retail REITs – 3.2% | ||||||||||||
AEON REIT Investment Corp. | 973 | 967,698 | ||||||||||
Agree Realty Corp.(a) | 41,420 | 2,696,856 | ||||||||||
Brixmor Property Group, Inc. | 486,820 | 5,574,089 | ||||||||||
Link REIT | 496,401 | 4,425,038 | ||||||||||
Realty Income Corp. | 129,650 | 7,120,378 | ||||||||||
Retail Properties of America, Inc. – Class A | 686,080 | 4,253,696 | ||||||||||
Simon Property Group, Inc. | 9,162 | 611,747 | ||||||||||
SITE Centers Corp. | 254,090 | 1,539,785 | ||||||||||
Vicinity Centres | 1,987,820 | 1,903,007 | ||||||||||
|
| |||||||||||
| 29,092,294 | ||||||||||||
|
| |||||||||||
| abfunds.com | AB ALL MARKET REAL RETURN PORTFOLIO | 21 | |
CONSOLIDATED PORTFOLIO OF INVESTMENTS (continued)
| Company | Shares | U.S. $ Value | ||||||||||
| ||||||||||||
Specialized REITs – 2.4% | ||||||||||||
American Tower Corp. | 3,031 | $ | 721,378 | |||||||||
CubeSmart | 109,530 | 2,760,156 | ||||||||||
Digital Realty Trust, Inc. | 60,990 | 9,117,395 | ||||||||||
MGM Growth Properties LLC – Class A | 103,196 | 2,597,443 | ||||||||||
National Storage Affiliates Trust | 111,660 | 3,180,077 | ||||||||||
Public Storage | 4,940 | 916,123 | ||||||||||
Safestore Holdings PLC | 157,000 | 1,420,224 | ||||||||||
VICI Properties, Inc. | 45,074 | 785,189 | ||||||||||
|
| |||||||||||
| 21,497,985 | ||||||||||||
|
| |||||||||||
| 314,694,378 | ||||||||||||
|
| |||||||||||
Energy – 8.6% | ||||||||||||
Integrated Oil & Gas – 7.3% | ||||||||||||
BP PLC | 1,969,208 | 7,759,493 | ||||||||||
Chevron Corp. | 133,764 | 12,306,288 | ||||||||||
Exxon Mobil Corp. | 144,690 | 6,723,744 | ||||||||||
LUKOIL PJSC (Sponsored ADR) | 32,790 | 2,117,250 | ||||||||||
OMV AG | 5,897 | 192,548 | ||||||||||
PetroChina Co., Ltd. – Class H | 11,270,000 | 4,048,088 | ||||||||||
Petroleo Brasileiro SA (Preference Shares) | 1,045,800 | 3,471,320 | ||||||||||
Repsol SA | 534,714 | 4,853,506 | ||||||||||
Royal Dutch Shell PLC – Class B | 966,104 | 15,466,008 | ||||||||||
TOTAL SA | 264,849 | 9,400,119 | ||||||||||
|
| |||||||||||
| 66,338,364 | ||||||||||||
|
| |||||||||||
Oil & Gas Exploration & | ||||||||||||
Aker BP ASA | 71,303 | 1,170,616 | ||||||||||
EOG Resources, Inc. | 59,538 | 2,828,650 | ||||||||||
Inpex Corp. | 142,300 | 918,560 | ||||||||||
|
| |||||||||||
| 4,917,826 | ||||||||||||
|
| |||||||||||
Oil & Gas Refining & | ||||||||||||
JXTG Holdings, Inc. | 438,300 | 1,553,932 | ||||||||||
Motor Oil Hellas Corinth Refineries SA | 77,728 | 1,151,687 | ||||||||||
S-Oil Corp. | 28,430 | 1,632,305 | ||||||||||
Tupras Turkiye Petrol Rafinerileri AS(b) | 70,914 | 920,896 | ||||||||||
|
| |||||||||||
| 5,258,820 | ||||||||||||
|
| |||||||||||
Oil & Gas Storage & Transportation – 0.2% | ||||||||||||
Frontline Ltd./Bermuda(a) | 136,649 | 1,279,035 | ||||||||||
TC Energy Corp. | 10,116 | 465,556 | ||||||||||
|
| |||||||||||
| 1,744,591 | ||||||||||||
|
| |||||||||||
| 78,259,601 | ||||||||||||
|
| |||||||||||
| 22 | AB ALL MARKET REAL RETURN PORTFOLIO | abfunds.com | |
CONSOLIDATED PORTFOLIO OF INVESTMENTS (continued)
| Company | Shares | U.S. $ Value | ||||||||||
| ||||||||||||
Materials – 5.8% | ||||||||||||
Aluminum – 0.2% | ||||||||||||
Alcoa Corp.(b) | 192,280 | $ | 1,567,082 | |||||||||
|
| |||||||||||
Commodity Chemicals – 0.2% | ||||||||||||
Mitsui Chemicals, Inc. | 27,300 | 535,982 | ||||||||||
Orbia Advance Corp. SAB de CV | 1,144,609 | 1,361,601 | ||||||||||
|
| |||||||||||
| 1,897,583 | ||||||||||||
|
| |||||||||||
Construction Materials – 0.1% | ||||||||||||
Grupo Cementos de Chihuahua SAB de CV | 258,307 | 748,631 | ||||||||||
|
| |||||||||||
Copper – 0.6% | ||||||||||||
Antofagasta PLC | 158,668 | 1,624,747 | ||||||||||
First Quantum Minerals Ltd. | 269,333 | 1,644,693 | ||||||||||
Lundin Mining Corp. | 269,906 | 1,322,432 | ||||||||||
OZ Minerals Ltd. | 170,656 | 983,700 | ||||||||||
|
| |||||||||||
| 5,575,572 | ||||||||||||
|
| |||||||||||
Diversified Metals & Mining – 1.9% | ||||||||||||
Anglo American PLC | 102,661 | 1,825,831 | ||||||||||
BHP Group Ltd. | 4,118 | 84,066 | ||||||||||
Boliden AB(a) | 70,192 | 1,414,888 | ||||||||||
Glencore PLC(b) | 2,093,203 | 3,921,488 | ||||||||||
Korea Zinc Co., Ltd. | 5,216 | 1,657,823 | ||||||||||
MMC Norilsk Nickel PJSC (ADR)(a) | 33,837 | 925,104 | ||||||||||
Orocobre Ltd.(a)(b) | 156,436 | 227,068 | ||||||||||
Rio Tinto PLC | 136,853 | 6,352,526 | ||||||||||
Sumitomo Metal Mining Co., Ltd. | 46,900 | 1,168,890 | ||||||||||
|
| |||||||||||
| 17,577,684 | ||||||||||||
|
| |||||||||||
Gold – 1.8% | ||||||||||||
Agnico Eagle Mines Ltd. | 85,076 | 4,970,890 | ||||||||||
AngloGold Ashanti Ltd. | 140,955 | 3,440,732 | ||||||||||
Evolution Mining Ltd. | 634,290 | 2,065,588 | ||||||||||
Kirkland Lake Gold Ltd. | 63,700 | 2,633,211 | ||||||||||
Northern Star Resources Ltd. | 195,130 | 1,575,689 | ||||||||||
Polyus PJSC (GDR)(c) | 18,852 | 1,538,032 | ||||||||||
|
| |||||||||||
| 16,224,142 | ||||||||||||
|
| |||||||||||
Paper Products – 0.2% | ||||||||||||
Suzano SA(b) | 283,400 | 2,053,880 | ||||||||||
|
| |||||||||||
Precious Metals & Minerals – 0.0% | ||||||||||||
Industrias Penoles SAB de CV | 58,748 | 449,733 | ||||||||||
|
| |||||||||||
Silver – 0.1% | ||||||||||||
Wheaton Precious Metals Corp. | 13,127 | 498,787 | ||||||||||
|
| |||||||||||
| abfunds.com | AB ALL MARKET REAL RETURN PORTFOLIO | 23 | |
CONSOLIDATED PORTFOLIO OF INVESTMENTS (continued)
| Company | Shares | U.S. $ Value | ||||||||||
| ||||||||||||
Specialty Chemicals – 0.3% | ||||||||||||
Akzo Nobel NV(a) | 6,660 | $ | 505,426 | |||||||||
Chr Hansen Holding A/S | 3,037 | 261,861 | ||||||||||
Evonik Industries AG | 57,724 | 1,420,035 | ||||||||||
Umicore SA | 5,521 | 239,283 | ||||||||||
|
| |||||||||||
| 2,426,605 | ||||||||||||
|
| |||||||||||
Steel – 0.4% | ||||||||||||
APERAM SA | 70,230 | 1,819,718 | ||||||||||
ArcelorMittal SA | 135,978 | 1,485,312 | ||||||||||
Fortescue Metals Group Ltd. | 6,420 | 49,063 | ||||||||||
|
| |||||||||||
| 3,354,093 | ||||||||||||
|
| |||||||||||
| 52,373,792 | ||||||||||||
|
| |||||||||||
Software & Services – 2.0% | ||||||||||||
Application Software – 0.3% | ||||||||||||
Adobe, Inc.(b) | 952 | 336,665 | ||||||||||
Cadence Design Systems, Inc.(b) | 13,742 | 1,114,889 | ||||||||||
Constellation Software, Inc./Canada | 294 | 282,717 | ||||||||||
Intuit, Inc. | 4,705 | 1,269,456 | ||||||||||
|
| |||||||||||
| 3,003,727 | ||||||||||||
|
| |||||||||||
Data Processing & Outsourced Services – 0.4% | ||||||||||||
Mastercard, Inc. – Class A | 4,096 | 1,126,277 | ||||||||||
Paychex, Inc. | 9,194 | 629,973 | ||||||||||
Visa, Inc. – Class A | 10,915 | 1,950,729 | ||||||||||
|
| |||||||||||
| 3,706,979 | ||||||||||||
|
| |||||||||||
Internet Services & Infrastructure – 0.2% | ||||||||||||
GDS Holdings Ltd. (ADR)(b) | 24,330 | 1,394,596 | ||||||||||
VeriSign, Inc.(b) | 1,629 | 341,259 | ||||||||||
|
| |||||||||||
| 1,735,855 | ||||||||||||
|
| |||||||||||
IT Consulting & Other | ||||||||||||
Accenture PLC – Class A | 7,572 | 1,402,259 | ||||||||||
Atos SE | 2,077 | 148,535 | ||||||||||
Fujitsu Ltd. | 1,500 | 145,722 | ||||||||||
|
| |||||||||||
| 1,696,516 | ||||||||||||
|
| |||||||||||
Systems Software – 0.9% | ||||||||||||
Fortinet, Inc.(b) | 9,368 | 1,009,308 | ||||||||||
Microsoft Corp. | 17,291 | 3,098,720 | ||||||||||
NortonLifeLock, Inc. | 48,646 | 1,034,700 | ||||||||||
Oracle Corp. | 2,097 | 111,078 | ||||||||||
ServiceNow, Inc.(b) | 3,927 | 1,380,498 | ||||||||||
Trend Micro, Inc./Japan | 7,300 | 370,342 | ||||||||||
| 24 | AB ALL MARKET REAL RETURN PORTFOLIO | abfunds.com | |
CONSOLIDATED PORTFOLIO OF INVESTMENTS (continued)
| Company | Shares | U.S. $ Value | ||||||||||
| ||||||||||||
VMware, Inc. – Class A(a)(b) | 4,909 | $ | 645,632 | |||||||||
|
| |||||||||||
| 7,650,278 | ||||||||||||
|
| |||||||||||
| 17,793,355 | ||||||||||||
|
| |||||||||||
Pharmaceuticals & Biotechnology – 1.7% | ||||||||||||
Biotechnology – 0.3% | ||||||||||||
Amgen, Inc. | 2,685 | 642,306 | ||||||||||
Biogen, Inc.(b) | 231 | 68,568 | ||||||||||
Gilead Sciences, Inc. | 12,657 | 1,063,188 | ||||||||||
Incyte Corp.(b) | 4,635 | 452,654 | ||||||||||
Vertex Pharmaceuticals, Inc.(b) | 3,391 | 851,819 | ||||||||||
|
| |||||||||||
| 3,078,535 | ||||||||||||
|
| |||||||||||
Life Sciences Tools & Services – 0.2% | ||||||||||||
Bio-Rad Laboratories, Inc. – Class A(b) | 1,863 | 819,906 | ||||||||||
Lonza Group AG | 1,080 | 471,599 | ||||||||||
Sartorius Stedim Biotech(b) | 2,547 | 610,702 | ||||||||||
|
| |||||||||||
| 1,902,207 | ||||||||||||
|
| |||||||||||
Pharmaceuticals – 1.2% | ||||||||||||
Astellas Pharma, Inc. | 5,500 | 90,965 | ||||||||||
Bausch Health Cos., Inc.(b) | 19,682 | 355,618 | ||||||||||
Bayer AG | 11,389 | 749,047 | ||||||||||
Eli Lilly & Co. | 9,188 | 1,420,832 | ||||||||||
Johnson & Johnson | 14,312 | 2,147,372 | ||||||||||
Merck & Co., Inc. | 20,015 | 1,587,990 | ||||||||||
Novartis AG | 1,530 | 130,568 | ||||||||||
Novo Nordisk A/S – Class B | 13,769 | 878,325 | ||||||||||
Roche Holding AG | 3,729 | 1,291,343 | ||||||||||
UCB SA | 6,109 | 559,822 | ||||||||||
Zoetis, Inc. | 9,350 | 1,209,049 | ||||||||||
|
| |||||||||||
| 10,420,931 | ||||||||||||
|
| |||||||||||
| 15,401,673 | ||||||||||||
|
| |||||||||||
Food Beverage & Tobacco – 1.4% | ||||||||||||
Packaged Foods & Meats – 0.8% | ||||||||||||
a2 Milk Co., Ltd.(b) | 36,391 | 433,123 | ||||||||||
Ajinomoto Co., Inc. | 11,800 | 210,167 | ||||||||||
Hershey Co. (The) | 7,390 | 978,658 | ||||||||||
JBS SA | 608,400 | 2,667,253 | ||||||||||
Mowi ASA | 113,095 | 1,936,979 | ||||||||||
Nestle SA | 8,531 | 903,518 | ||||||||||
WH Group Ltd.(c) | 329,500 | 314,261 | ||||||||||
|
| |||||||||||
| 7,443,959 | ||||||||||||
|
| |||||||||||
Soft Drinks – 0.3% | ||||||||||||
Coca-Cola Amatil Ltd. | 60,268 | 335,548 | ||||||||||
Monster Beverage Corp.(b) | 4,383 | 270,913 | ||||||||||
| abfunds.com | AB ALL MARKET REAL RETURN PORTFOLIO | 25 | |
CONSOLIDATED PORTFOLIO OF INVESTMENTS (continued)
| Company | Shares | U.S. $ Value | ||||||||||
| ||||||||||||
PepsiCo, Inc. | 11,805 | $ | 1,561,683 | |||||||||
|
| |||||||||||
| 2,168,144 | ||||||||||||
|
| |||||||||||
Tobacco – 0.3% | ||||||||||||
Altria Group, Inc. | 28,946 | 1,136,131 | ||||||||||
Philip Morris International, Inc. | 17,662 | 1,317,585 | ||||||||||
Swedish Match AB | 5,832 | 360,397 | ||||||||||
|
| |||||||||||
| 2,814,113 | ||||||||||||
|
| |||||||||||
| 12,426,216 | ||||||||||||
|
| |||||||||||
Utilities – 1.1% | ||||||||||||
Electric Utilities – 0.5% | ||||||||||||
Endesa SA | 13,587 | 301,362 | ||||||||||
Enel SpA | 427,620 | 2,920,834 | ||||||||||
PPL Corp. | 35,021 | 890,234 | ||||||||||
Red Electrica Corp. SA | 29,704 | 522,846 | ||||||||||
Terna Rete Elettrica Nazionale SpA | 93,326 | 584,401 | ||||||||||
|
| |||||||||||
| 5,219,677 | ||||||||||||
|
| |||||||||||
Gas Utilities – 0.1% | ||||||||||||
Snam SpA | 116,903 | 524,414 | ||||||||||
|
| |||||||||||
Multi-Utilities – 0.4% | ||||||||||||
Atco Ltd./Canada – Class I | 12,827 | 360,219 | ||||||||||
Canadian Utilities Ltd. – Class A | 16,468 | 401,777 | ||||||||||
CenterPoint Energy, Inc. | 4,698 | 80,007 | ||||||||||
Consolidated Edison, Inc. | 11,817 | 931,179 | ||||||||||
Sempra Energy | 8,349 | 1,034,024 | ||||||||||
Suez | 38,697 | 437,711 | ||||||||||
Veolia Environnement SA | 20,801 | 443,445 | ||||||||||
|
| |||||||||||
| 3,688,362 | ||||||||||||
|
| |||||||||||
Water Utilities – 0.1% | ||||||||||||
Severn Trent PLC | 25,114 | 753,609 | ||||||||||
|
| |||||||||||
| 10,186,062 | ||||||||||||
|
| |||||||||||
Media & Entertainment – 1.1% | ||||||||||||
Interactive Home | ||||||||||||
Activision Blizzard, Inc. | 17,463 | 1,112,917 | ||||||||||
Electronic Arts, Inc.(b) | 9,590 | 1,095,753 | ||||||||||
Take-Two Interactive Software, Inc.(b) | 7,732 | 935,959 | ||||||||||
Ubisoft Entertainment SA(b) | 7,550 | 561,583 | ||||||||||
|
| |||||||||||
| 3,706,212 | ||||||||||||
|
| |||||||||||
Interactive Media & Services – 0.5% | ||||||||||||
Alphabet, Inc. – Class A(b) | 607 | 817,447 | ||||||||||
Alphabet, Inc. – Class C(b) | 460 | 620,384 | ||||||||||
Facebook, Inc. – Class A(b) | 12,757 | 2,611,485 | ||||||||||
Z Holdings Corp. | 137,400 | 530,271 | ||||||||||
|
| |||||||||||
| 4,579,587 | ||||||||||||
|
| |||||||||||
| 26 | AB ALL MARKET REAL RETURN PORTFOLIO | abfunds.com | |
CONSOLIDATED PORTFOLIO OF INVESTMENTS (continued)
| Company | Shares | U.S. $ Value | ||||||||||
| ||||||||||||
Movies & Entertainment – 0.2% | ||||||||||||
Netflix, Inc.(b) | 3,661 | $ | 1,537,071 | |||||||||
|
| |||||||||||
| 9,822,870 | ||||||||||||
|
| |||||||||||
Retailing – 0.9% | ||||||||||||
Apparel Retail – 0.0% | ||||||||||||
Hennes & Mauritz AB – Class B | 13,851 | 189,337 | ||||||||||
|
| |||||||||||
Automotive Retail – 0.1% | ||||||||||||
O’Reilly Automotive, Inc.(b) | 2,751 | 1,062,821 | ||||||||||
|
| |||||||||||
Computer & Electronics Retail – 0.0% | ||||||||||||
Hikari Tsushin, Inc. | 900 | 174,177 | ||||||||||
|
| |||||||||||
Department Stores – 0.1% | ||||||||||||
Next PLC | 9,668 | 575,619 | ||||||||||
|
| |||||||||||
General Merchandise Stores – 0.1% | ||||||||||||
Dollar General Corp. | 1,415 | 248,050 | ||||||||||
Pan Pacific International Holdings Corp. | 1,900 | 36,810 | ||||||||||
|
| |||||||||||
| 284,860 | ||||||||||||
|
| |||||||||||
Internet & Direct Marketing Retail – 0.6% | ||||||||||||
Amazon.com, Inc.(b) | 1,140 | 2,820,360 | ||||||||||
Booking Holdings, Inc.(b) | 691 | 1,023,074 | ||||||||||
eBay, Inc. | 29,024 | 1,156,026 | ||||||||||
Zalando SE(b)(c) | 11,926 | 584,537 | ||||||||||
|
| |||||||||||
| 5,583,997 | ||||||||||||
|
| |||||||||||
| 7,870,811 | ||||||||||||
|
| |||||||||||
Semiconductors & Semiconductor | ||||||||||||
Semiconductor Equipment – 0.4% | ||||||||||||
Advantest Corp.(a) | 10,100 | 490,067 | ||||||||||
Applied Materials, Inc. | 20,622 | 1,024,501 | ||||||||||
ASML Holding NV | 2,605 | 760,882 | ||||||||||
Lam Research Corp. | 4,035 | 1,030,055 | ||||||||||
Tokyo Electron Ltd. | 2,700 | 575,048 | ||||||||||
|
| |||||||||||
| 3,880,553 | ||||||||||||
|
| |||||||||||
Semiconductors – 0.4% | ||||||||||||
Intel Corp. | 30,530 | 1,831,189 | ||||||||||
QUALCOMM, Inc. | 15,538 | 1,222,375 | ||||||||||
STMicroelectronics NV | 25,293 | 651,331 | ||||||||||
|
| |||||||||||
| 3,704,895 | ||||||||||||
|
| |||||||||||
| 7,585,448 | ||||||||||||
|
| |||||||||||
| abfunds.com | AB ALL MARKET REAL RETURN PORTFOLIO | 27 | |
CONSOLIDATED PORTFOLIO OF INVESTMENTS (continued)
| Company | Shares | U.S. $ Value | ||||||||||
| ||||||||||||
Consumer Durables & Apparel – 0.8% | ||||||||||||
Apparel, Accessories & Luxury Goods – 0.2% | ||||||||||||
Burberry Group PLC | 33,923 | $ | 589,023 | |||||||||
Pandora A/S | 15,908 | 565,665 | ||||||||||
Ralph Lauren Corp. | 10,171 | 750,416 | ||||||||||
|
| |||||||||||
| 1,905,104 | ||||||||||||
|
| |||||||||||
Consumer Electronics – 0.1% | ||||||||||||
Garmin Ltd. | 7,503 | 608,944 | ||||||||||
Panasonic Corp. | 33,900 | 258,419 | ||||||||||
|
| |||||||||||
| 867,363 | ||||||||||||
|
| |||||||||||
Homebuilding – 0.5% | ||||||||||||
Construtora Tenda SA | 187,200 | 800,038 | ||||||||||
Corp. GEO SAB de CV Series B(b)(d)(e)(f) | 1,321 | – 0 | – | |||||||||
Desarrolladora Homex SAB de CV(b) | 1,590 | 3 | ||||||||||
MRV Engenharia e Participacoes SA | 203,700 | 567,509 | ||||||||||
Persimmon PLC | 42,440 | 1,175,852 | ||||||||||
PulteGroup, Inc. | 65,170 | 1,842,356 | ||||||||||
Urbi Desarrollos Urbanos SAB de CV(b) | 172 | 6 | ||||||||||
|
| |||||||||||
| 4,385,764 | ||||||||||||
|
| |||||||||||
| 7,158,231 | ||||||||||||
|
| |||||||||||
Diversified Financials – 0.7% | ||||||||||||
Asset Management & Custody Banks – 0.2% | ||||||||||||
Amundi SA(c) | 1,963 | 130,292 | ||||||||||
Franklin Resources, Inc. | 21,344 | 402,121 | ||||||||||
Magellan Financial Group Ltd. | 10,758 | 352,396 | ||||||||||
T. Rowe Price Group, Inc. | 9,346 | 1,080,678 | ||||||||||
|
| |||||||||||
| 1,965,487 | ||||||||||||
|
| |||||||||||
Financial Exchanges & Data – 0.2% | ||||||||||||
Moody’s Corp. | 4,714 | 1,149,745 | ||||||||||
S&P Global, Inc. | 3,316 | 971,190 | ||||||||||
Singapore Exchange Ltd. | 44,600 | 304,132 | ||||||||||
|
| |||||||||||
| 2,425,067 | ||||||||||||
|
| |||||||||||
Investment Banking & Brokerage – 0.2% | ||||||||||||
Goldman Sachs Group, Inc. (The) | 5,884 | 1,079,243 | ||||||||||
Morgan Stanley | 2,212 | 87,219 | ||||||||||
Nomura Holdings, Inc. | 131,200 | 544,430 | ||||||||||
|
| |||||||||||
| 1,710,892 | ||||||||||||
|
| |||||||||||
Multi-Sector Holdings – 0.1% | ||||||||||||
Kinnevik AB – Class B | 28,256 | 580,744 | ||||||||||
|
| |||||||||||
| 28 | AB ALL MARKET REAL RETURN PORTFOLIO | abfunds.com | |
CONSOLIDATED PORTFOLIO OF INVESTMENTS (continued)
| Company | Shares | U.S. $ Value | ||||||||||
| ||||||||||||
Other Diversified Financial Services – 0.0% | ||||||||||||
M&G PLC | 67,707 | $ | 112,246 | |||||||||
|
| |||||||||||
| 6,794,436 | ||||||||||||
|
| |||||||||||
Transportation – 0.6% | ||||||||||||
Airport Services – 0.0% | ||||||||||||
Aena SME SA(b)(c) | 1,630 | 206,334 | ||||||||||
|
| |||||||||||
Highways & Railtracks – 0.4% | ||||||||||||
Transurban Group(a) | 448,135 | 3,995,019 | ||||||||||
|
| |||||||||||
Railroads – 0.1% | ||||||||||||
Canadian Pacific Railway Ltd. | 2,254 | 512,285 | ||||||||||
Central Japan Railway Co. | 1,800 | 283,238 | ||||||||||
Tobu Railway Co., Ltd. | 6,000 | 203,520 | ||||||||||
West Japan Railway Co. | 4,400 | 271,910 | ||||||||||
|
| |||||||||||
| 1,270,953 | ||||||||||||
|
| |||||||||||
Trucking – 0.1% | ||||||||||||
Nippon Express Co., Ltd. | 9,700 | 473,769 | ||||||||||
|
| |||||||||||
| 5,946,075 | ||||||||||||
|
| |||||||||||
Health Care Equipment & Services – 0.6% | ||||||||||||
Health Care Distributors – 0.0% | ||||||||||||
AmerisourceBergen Corp. – Class A | 4,935 | 442,472 | ||||||||||
|
| |||||||||||
Health Care Equipment – 0.3% | ||||||||||||
Cochlear Ltd. | 3,680 | 437,542 | ||||||||||
Edwards Lifesciences Corp.(b) | 5,111 | 1,111,643 | ||||||||||
Insulet Corp.(b) | 1,616 | 322,748 | ||||||||||
Intuitive Surgical, Inc.(b) | 2,080 | 1,062,630 | ||||||||||
|
| |||||||||||
| 2,934,563 | ||||||||||||
|
| |||||||||||
Health Care Supplies – 0.1% | ||||||||||||
Coloplast A/S – Class B | 3,774 | 595,250 | ||||||||||
|
| |||||||||||
Health Care Technology – 0.1% | ||||||||||||
Cerner Corp. | 15,237 | 1,057,295 | ||||||||||
|
| |||||||||||
Managed Health Care – 0.1% | ||||||||||||
Humana, Inc. | 2,079 | 793,804 | ||||||||||
|
| |||||||||||
| 5,823,384 | ||||||||||||
|
| |||||||||||
Telecommunication Services – 0.4% | ||||||||||||
Integrated Telecommunication Services – 0.3% | ||||||||||||
Elisa Oyj | 9,522 | 578,635 | ||||||||||
Eutelsat Communications SA | 10,698 | 119,778 | ||||||||||
| abfunds.com | AB ALL MARKET REAL RETURN PORTFOLIO | 29 | |
CONSOLIDATED PORTFOLIO OF INVESTMENTS (continued)
| Company | Shares | U.S. $ Value | ||||||||||
| ||||||||||||
Telecom Italia SpA/Milano (Savings Shares) | 513,389 | $ | 204,755 | |||||||||
Telenor ASA | 29,625 | 454,419 | ||||||||||
Verizon Communications, Inc. | 27,065 | 1,554,884 | ||||||||||
|
| |||||||||||
| 2,912,471 | ||||||||||||
|
| |||||||||||
Wireless Telecommunication Services – 0.1% | ||||||||||||
T-Mobile US, Inc.(b) | 12,638 | 1,109,616 | ||||||||||
|
| |||||||||||
| 4,022,087 | ||||||||||||
|
| |||||||||||
Capital Goods – 0.4% | ||||||||||||
Aerospace & Defense – 0.0% | ||||||||||||
BAE Systems PLC | 20,872 | 133,130 | ||||||||||
|
| |||||||||||
Building Products – 0.0% | ||||||||||||
Cie de Saint-Gobain | 11,773 | 313,255 | ||||||||||
|
| |||||||||||
Construction & Farm Machinery & Heavy Trucks – 0.1% | ||||||||||||
Cummins, Inc. | 3,221 | 526,633 | ||||||||||
|
| |||||||||||
Electrical Components & | ||||||||||||
Acuity Brands, Inc. | 7,143 | 618,513 | ||||||||||
Legrand SA | 8,201 | 549,816 | ||||||||||
Prysmian SpA | 6,074 | 114,604 | ||||||||||
|
| |||||||||||
| 1,282,933 | ||||||||||||
|
| |||||||||||
Industrial Conglomerates – 0.0% | ||||||||||||
Toshiba Corp. | 3,700 | 91,752 | ||||||||||
|
| |||||||||||
Industrial Machinery – 0.1% | ||||||||||||
Atlas Copco AB – Class B SHS | 12,320 | 381,080 | ||||||||||
Spirax-Sarco Engineering PLC | 6,558 | 717,704 | ||||||||||
|
| |||||||||||
| 1,098,784 | ||||||||||||
|
| |||||||||||
Trading Companies & | ||||||||||||
AerCap Holdings NV(b) | 6,417 | 180,446 | ||||||||||
|
| |||||||||||
| 3,626,933 | ||||||||||||
|
| |||||||||||
Commercial & Professional | ||||||||||||
Diversified Support Services – 0.1% | ||||||||||||
Copart, Inc.(b) | 12,109 | 970,052 | ||||||||||
|
| |||||||||||
Human Resource & Employment Services – 0.0% | ||||||||||||
Adecco Group AG | 771 | 33,740 | ||||||||||
|
| |||||||||||
| 30 | AB ALL MARKET REAL RETURN PORTFOLIO | abfunds.com | |
CONSOLIDATED PORTFOLIO OF INVESTMENTS (continued)
| Company | Shares | U.S. $ Value | ||||||||||
| ||||||||||||
Research & Consulting | ||||||||||||
CoStar Group, Inc.(b) | 1,738 | $ | 1,126,676 | |||||||||
RELX PLC (London) | 37,308 | 841,735 | ||||||||||
Wolters Kluwer NV(a) | 8,321 | 612,038 | ||||||||||
|
| |||||||||||
| 2,580,449 | ||||||||||||
|
| |||||||||||
| 3,584,241 | ||||||||||||
|
| |||||||||||
Technology Hardware & | ||||||||||||
Electronic Equipment & | ||||||||||||
Hitachi Ltd. | 13,100 | 388,801 | ||||||||||
|
| |||||||||||
Technology Hardware, Storage & Peripherals – 0.3% | ||||||||||||
Apple, Inc. | 10,514 | 3,089,013 | ||||||||||
|
| |||||||||||
| 3,477,814 | ||||||||||||
|
| |||||||||||
Banks – 0.3% | ||||||||||||
Diversified Banks – 0.3% | ||||||||||||
Banco de Sabadell SA(b) | 678,313 | 281,226 | ||||||||||
BNP Paribas SA | 5,243 | 164,716 | ||||||||||
Citigroup, Inc. | 21,567 | 1,047,293 | ||||||||||
Japan Post Bank Co., Ltd. | 51,800 | 480,973 | ||||||||||
Mizuho Financial Group, Inc. | 298,300 | 347,346 | ||||||||||
National Bank of Canada | 3,626 | 146,243 | ||||||||||
Societe Generale SA | 20,719 | 325,061 | ||||||||||
|
| |||||||||||
| 2,792,858 | ||||||||||||
|
| |||||||||||
Regional Banks – 0.0% | ||||||||||||
Mebuki Financial Group, Inc. | 106,800 | 224,351 | ||||||||||
Zions Bancorp NA | 6,066 | 191,746 | ||||||||||
|
| |||||||||||
| 416,097 | ||||||||||||
|
| |||||||||||
| 3,208,955 | ||||||||||||
|
| |||||||||||
Insurance – 0.3% | ||||||||||||
Life & Health Insurance – 0.3% | ||||||||||||
Aegon NV | 162,112 | 419,326 | ||||||||||
AIA Group Ltd. | 10,000 | 91,778 | ||||||||||
iA Financial Corp., Inc. | 9,277 | 301,180 | ||||||||||
Japan Post Holdings Co., Ltd. | 22,100 | 176,776 | ||||||||||
Legal & General Group PLC | 53,589 | 137,777 | ||||||||||
MetLife, Inc. | 25,179 | 908,458 | ||||||||||
Sun Life Financial, Inc. | 11,728 | 401,985 | ||||||||||
|
| |||||||||||
| 2,437,280 | ||||||||||||
|
| |||||||||||
| abfunds.com | AB ALL MARKET REAL RETURN PORTFOLIO | 31 | |
CONSOLIDATED PORTFOLIO OF INVESTMENTS (continued)
| Company | Shares | U.S. $ Value | ||||||||||
| ||||||||||||
Food & Staples Retailing – 0.2% | ||||||||||||
Food Retail – 0.1% | ||||||||||||
Koninklijke Ahold Delhaize NV | 25,835 | $ | 627,282 | |||||||||
Woolworths Group Ltd. | 21,744 | 503,198 | ||||||||||
|
| |||||||||||
| 1,130,480 | ||||||||||||
|
| |||||||||||
Hypermarkets & Super | ||||||||||||
Coles Group Ltd. | 44,018 | 441,405 | ||||||||||
Walmart, Inc. | 3,959 | 481,216 | ||||||||||
|
| |||||||||||
| 922,621 | ||||||||||||
|
| |||||||||||
| 2,053,101 | ||||||||||||
|
| |||||||||||
Consumer Services – 0.2% | ||||||||||||
Casinos & Gaming – 0.1% | ||||||||||||
Aristocrat Leisure Ltd. | 22,198 | 364,043 | ||||||||||
Flutter Entertainment PLC | 61 | 7,507 | ||||||||||
Stars Group, Inc. (The)(a)(b) | 6,363 | 177,503 | ||||||||||
|
| |||||||||||
| 549,053 | ||||||||||||
|
| |||||||||||
Hotels, Resorts & Cruise | ||||||||||||
Whitbread PLC | 1,302 | 48,842 | ||||||||||
|
| |||||||||||
Leisure Facilities – 0.1% | ||||||||||||
Planet Fitness, Inc.(b) | 13,700 | 826,521 | ||||||||||
|
| |||||||||||
Restaurants – 0.0% | ||||||||||||
Domino’s Pizza, Inc. | 1,267 | 458,565 | ||||||||||
|
| |||||||||||
| 1,882,981 | ||||||||||||
|
| |||||||||||
Household & Personal | ||||||||||||
Household Products – 0.0% | ||||||||||||
Kimberly-Clark Corp. | 2,064 | 285,823 | ||||||||||
|
| |||||||||||
Personal Products – 0.1% | ||||||||||||
Unilever PLC | 15,639 | 805,286 | ||||||||||
|
| |||||||||||
| 1,091,109 | ||||||||||||
|
| |||||||||||
Automobiles & Components – 0.1% | ||||||||||||
Tires & Rubber – 0.1% | ||||||||||||
Sumitomo Rubber Industries Ltd. | 51,300 | 497,945 | ||||||||||
|
| |||||||||||
Total Common Stocks | 578,018,778 | |||||||||||
|
| |||||||||||
| 32 | AB ALL MARKET REAL RETURN PORTFOLIO | abfunds.com | |
CONSOLIDATED PORTFOLIO OF INVESTMENTS (continued)
| Company | Principal Amount (000) | U.S. $ Value | ||||||||||
| ||||||||||||
INFLATION-LINKED | ||||||||||||
Japan – 8.2% | ||||||||||||
Japanese Government CPI Linked Bond | JPY | 8,034,949 | $ | 74,797,693 | ||||||||
|
| |||||||||||
| Shares | ||||||||||||
INVESTMENT COMPANIES – 7.3% | ||||||||||||
Funds and Investment | ||||||||||||
iShares Global Energy ETF(a) | 1,021,097 | 20,054,345 | ||||||||||
iShares MSCI Global Metals & Mining Producers ETF | 559,596 | 11,919,395 | ||||||||||
VanEck Vectors Agribusiness ETF(a) | 101,869 | 5,652,711 | ||||||||||
VanEck Vectors Gold Miners ETF | 123,255 | 3,976,206 | ||||||||||
Vanguard Global ex-U.S. Real Estate ETF | 258,611 | 11,546,981 | ||||||||||
Vanguard Real Estate ETF | 174,600 | 13,288,806 | ||||||||||
|
| |||||||||||
Total Investment Companies | 66,438,444 | |||||||||||
|
| |||||||||||
| Notional Amount | ||||||||||||
OPTIONS PURCHASED – PUTS – 0.4% | ||||||||||||
Options on Forward Contracts – 0.4% | ||||||||||||
RUB vs. USD | 2,385,604,350 | 3,638,796 | ||||||||||
|
| |||||||||||
| Shares | ||||||||||||
SHORT-TERM INVESTMENTS – 14.9% |
| |||||||||||
Investment Companies – 14.9% | ||||||||||||
AB Fixed Income Shares, Inc. – Government Money Market Portfolio – Class AB, 0.35%(g)(h)(i) | 135,564,296 | 135,564,296 | ||||||||||
|
| |||||||||||
Total Investments Before Security Lending Collateral for Securities Loaned – 94.3% | 858,458,007 | |||||||||||
|
| |||||||||||
| abfunds.com | AB ALL MARKET REAL RETURN PORTFOLIO | 33 | |
CONSOLIDATED PORTFOLIO OF INVESTMENTS (continued)
| Company | Shares | U.S. $ Value | ||||||||||
| ||||||||||||
INVESTMENTS OF CASH COLLATERAL FOR SECURITIES LOANED – 0.9% | ||||||||||||
Investment Companies – 0.9% | ||||||||||||
AB Fixed Income Shares, Inc. – Government Money Market Portfolio – Class AB, 0.35%(g)(h)(i) | 7,958,536 | $ | 7,958,536 | |||||||||
|
| |||||||||||
Total Investments – 95.2% | 866,416,543 | |||||||||||
Other assets less liabilities – 4.8% | 43,482,185 | |||||||||||
|
| |||||||||||
Net Assets – 100.0% | $ | 909,898,728 | ||||||||||
|
| |||||||||||
FUTURES (see Note D)
| Description | Number of Contracts | Expiration Month | Current Notional | Value and Unrealized Appreciation/ (Depreciation) | ||||||||||||
Purchased Contracts |
| |||||||||||||||
Brent Crude Futures | 120 | October 2020 | $ | 3,954,000 | $ | (773,718 | ) | |||||||||
Brent Crude Futures | 166 | April 2021 | 6,039,080 | (341,915 | ) | |||||||||||
Cocoa Futures | 194 | July 2020 | 4,683,160 | 176,364 | ||||||||||||
Copper Futures | 61 | December 2020 | 3,602,813 | (23,243 | ) | |||||||||||
Cotton No.2 Futures | 164 | July 2020 | 4,701,060 | 150,871 | ||||||||||||
Gasoline RBOB Futures | 46 | August 2020 | 1,616,118 | (15,017 | ) | |||||||||||
Gasoline RBOB Futures | 128 | November 2020 | 4,202,419 | (1,434,978 | ) | |||||||||||
Gold 100 OZ Futures | 104 | June 2020 | 17,619,680 | 982,237 | ||||||||||||
KC HRW Wheat Futures | 27 | July 2020 | 658,800 | (22,018 | ) | |||||||||||
Lean Hogs Futures | 151 | June 2020 | 3,560,580 | (42,324 | ) | |||||||||||
Lean Hogs Futures | 65 | August 2020 | 1,632,800 | 10,685 | ||||||||||||
Live Cattle Futures | 94 | June 2020 | 3,231,720 | 90,596 | ||||||||||||
Live Cattle Futures | 43 | August 2020 | 1,584,120 | 37,989 | ||||||||||||
LME Nickel Futures | 72 | July 2020 | 5,263,056 | (208,891 | ) | |||||||||||
LME Nickel Futures | 37 | December 2020 | 2,727,492 | 11,766 | ||||||||||||
LME Primary Aluminum Futures | 72 | July 2020 | 2,681,550 | (99,654 | ) | |||||||||||
LME Zinc Futures | 93 | July 2020 | 4,507,012 | 50,318 | ||||||||||||
Low Sulphur Gasoil Futures | 145 | December 2020 | 4,415,250 | (1,227,458) | ||||||||||||
Mini MSCI EAFE Futures | 120 | June 2020 | 9,829,800 | 1,396,302 | ||||||||||||
Natural Gas Futures | 1,006 | November 2020 | 29,928,500 | 4,392,910 | ||||||||||||
NY HARB ULSD Futures | 84 | November 2020 | 3,684,290 | (971,488 | ) | |||||||||||
Platinum Futures | 17 | July 2020 | 691,050 | (16,996 | ) | |||||||||||
S&P 500 E-Mini Futures | 271 | June 2020 | 39,327,520 | 7,249,715 | ||||||||||||
S&P/TSX 60 Index Futures | 8 | June 2020 | 1,020,956 | 110,000 | ||||||||||||
Silver Futures | 12 | July 2020 | 898,380 | (86,722 | ) | |||||||||||
Soybean Futures | 30 | July 2020 | 1,282,875 | 24,286 | ||||||||||||
Soybean Meal Futures | 303 | July 2020 | 8,941,530 | (98,671 | ) | |||||||||||
Soybean Oil Futures | 443 | July 2020 | 7,070,280 | (936,477 | ) | |||||||||||
| 34 | AB ALL MARKET REAL RETURN PORTFOLIO | abfunds.com | |
CONSOLIDATED PORTFOLIO OF INVESTMENTS (continued)
| Description | Number of Contracts | Expiration Month | Current Notional | Value and Unrealized Appreciation/ (Depreciation) | ||||||||||||
Wheat Futures (CBT) | 24 | July 2020 | $ | 629,100 | $ | (26,471 | ) | |||||||||
WTI Crude Futures | 169 | May 2021 | 5,578,690 | (314,247 | ) | |||||||||||
Sold Contracts | ||||||||||||||||
10 Yr Japan Bond (OSE) Futures | 31 | June 2020 | 44,136,327 | 535,662 | ||||||||||||
Corn Futures | 75 | July 2020 | 1,200,000 | (13,145 | ) | |||||||||||
LME Nickel Futures | 72 | July 2020 | 5,263,056 | (75,038 | ) | |||||||||||
LME Nickel Futures | 37 | December 2020 | 2,727,492 | (193,665 | ) | |||||||||||
LME Primary Aluminum Futures | 169 | July 2020 | 6,294,194 | 856,404 | ||||||||||||
LME Zinc Futures | 75 | July 2020 | 3,634,687 | 131,518 | ||||||||||||
MSCI Emerging Markets Futures | 185 | June 2020 | 8,379,575 | (552,604 | ) | |||||||||||
NY Harbor ULSD Futures | 40 | August 2020 | 1,615,152 | 14,288 | ||||||||||||
Sugar 11 (World) Futures | 205 | June 2020 | 2,380,952 | (206,989 | ) | |||||||||||
|
| |||||||||||||||
| $ | 8,540,182 | |||||||||||||||
|
| |||||||||||||||
FORWARD CURRENCY EXCHANGE CONTRACTS (see Note D)
| Counterparty | Contracts to Deliver (000) | In Exchange For (000) | Settlement Date | Unrealized Appreciation/ (Depreciation) | ||||||||||||||||
Australia and New Zealand Banking Group Ltd. | USD | 1,124 | SGD | 1,571 | 06/15/2020 | $ | (9,822 | ) | ||||||||||||
Australia and New Zealand Banking Group Ltd. | USD | 998 | AUD | 1,733 | 06/15/2020 | 131,385 | ||||||||||||||
Australia and New Zealand Banking Group Ltd. | USD | 5,873 | CNY | 41,498 | 06/16/2020 | (10,523 | ) | |||||||||||||
Australia and New Zealand Banking Group Ltd. | USD | 6,872 | HKD | 53,824 | 05/26/2020 | 68,887 | ||||||||||||||
Bank of America, NA | RUB | 647,993 | USD | 9,913 | 07/09/2020 | 1,292,376 | ||||||||||||||
Bank of America, NA | RUB | 181,536 | USD | 2,486 | 05/20/2020 | 48,867 | ||||||||||||||
Bank of America, NA | JPY | 113,186 | USD | 1,051 | 06/15/2020 | (4,110 | ) | |||||||||||||
Bank of America, NA | CAD | 11,742 | USD | 8,179 | 05/22/2020 | (256,356 | ) | |||||||||||||
Bank of America, NA | CNY | 6,675 | USD | 945 | 06/15/2020 | 2,475 | ||||||||||||||
Bank of America, NA | EUR | 3,828 | USD | 4,130 | 06/10/2020 | (68,025 | ) | |||||||||||||
Bank of America, NA | AUD | 2,624 | USD | 1,664 | 06/15/2020 | (46,473 | ) | |||||||||||||
Bank of America, NA | EUR | 1,929 | USD | 2,113 | 05/29/2020 | (1,796 | ) | |||||||||||||
Bank of America, NA | EUR | 959 | USD | 1,076 | 06/15/2020 | 24,120 | ||||||||||||||
Bank of America, NA | EUR | 765 | USD | 830 | 06/15/2020 | (9,477 | ) | |||||||||||||
Bank of America, NA | USD | 1,344 | EUR | 1,241 | 06/15/2020 | 16,705 | ||||||||||||||
Bank of America, NA | USD | 1,046 | NZD | 1,734 | 05/20/2020 | 17,097 | ||||||||||||||
Bank of America, NA | EUR | 1,753 | CZK | 47,299 | 05/29/2020 | (8,536 | ) | |||||||||||||
Bank of America, NA | USD | 7,252 | CHF | 6,817 | 05/29/2020 | (184,767 | ) | |||||||||||||
Bank of America, NA | USD | 2,615 | CAD | 3,654 | 05/22/2020 | 10,084 | ||||||||||||||
Bank of America, NA | USD | 824 | NOK | 8,352 | 06/15/2020 | (8,823 | ) | |||||||||||||
Bank of America, NA | USD | 494 | JPY | 52,705 | 06/15/2020 | (2,162 | ) | |||||||||||||
Bank of America, NA | USD | 1,085 | JPY | 119,110 | 06/15/2020 | 25,394 | ||||||||||||||
Barclays Bank PLC | IDR | 21,143,393 | USD | 1,395 | 05/05/2020 | (26,446 | ) | |||||||||||||
Barclays Bank PLC | KRW | 5,008,967 | USD | 4,104 | 05/14/2020 | (20,785 | ) | |||||||||||||
Barclays Bank PLC | KRW | 4,996,328 | USD | 4,139 | 05/14/2020 | 25,055 | ||||||||||||||
Barclays Bank PLC | CLP | 6,053,874 | USD | 7,245 | 05/13/2020 | (8,416 | ) | |||||||||||||
Barclays Bank PLC | JPY | 620,249 | USD | 5,800 | 05/20/2020 | 19,055 | ||||||||||||||
| abfunds.com | AB ALL MARKET REAL RETURN PORTFOLIO | 35 | |
CONSOLIDATED PORTFOLIO OF INVESTMENTS (continued)
| Counterparty | Contracts to Deliver (000) | In Exchange For (000) | Settlement Date | Unrealized Appreciation/ (Depreciation) | ||||||||||||||||
Barclays Bank PLC | PHP | 291,304 | USD | 5,770 | 05/28/2020 | $ | 5,367 | |||||||||||||
Barclays Bank PLC | INR | 158,782 | USD | 2,040 | 07/23/2020 | (41,340 | ) | |||||||||||||
Barclays Bank PLC | TWD | 333,373 | USD | 11,138 | 05/21/2020 | (95,170 | ) | |||||||||||||
Barclays Bank PLC | JPY | 146,610 | USD | 1,375 | 06/15/2020 | 8,588 | ||||||||||||||
Barclays Bank PLC | PHP | 58,905 | USD | 1,159 | 05/28/2020 | (6,424 | ) | |||||||||||||
Barclays Bank PLC | CNY | 41,498 | USD | 5,851 | 06/16/2020 | (11,276 | ) | |||||||||||||
Barclays Bank PLC | NOK | 41,459 | USD | 4,028 | 05/20/2020 | (19,546 | ) | |||||||||||||
Barclays Bank PLC | CNY | 81,369 | USD | 11,647 | 05/21/2020 | 139,825 | ||||||||||||||
Barclays Bank PLC | MYR | 23,354 | USD | 5,259 | 08/13/2020 | (138,254 | ) | |||||||||||||
Barclays Bank PLC | SEK | 22,053 | USD | 2,200 | 05/14/2020 | (60,234 | ) | |||||||||||||
Barclays Bank PLC | MYR | 23,166 | USD | 5,433 | 08/13/2020 | 78,510 | ||||||||||||||
Barclays Bank PLC | EUR | 1,146 | USD | 1,258 | 05/20/2020 | 1,762 | ||||||||||||||
Barclays Bank PLC | USD | 2,215 | AUD | 3,716 | 06/15/2020 | 206,546 | ||||||||||||||
Barclays Bank PLC | USD | 1,628 | GBP | 1,245 | 06/15/2020 | (59,594 | ) | |||||||||||||
Barclays Bank PLC | USD | 4,261 | CAD | 5,962 | 05/22/2020 | 22,587 | ||||||||||||||
Barclays Bank PLC | USD | 1,679 | CHF | 1,612 | 05/20/2020 | (8,348 | ) | |||||||||||||
Barclays Bank PLC | USD | 8,243 | MYR | 34,278 | 08/13/2020 | (320,508 | ) | |||||||||||||
Barclays Bank PLC | USD | 4,868 | CHF | 4,703 | 05/20/2020 | 6,711 | ||||||||||||||
Barclays Bank PLC | USD | 2,854 | MYR | 12,448 | 08/13/2020 | 23,095 | ||||||||||||||
Barclays Bank PLC | USD | 4,622 | SGD | 6,688 | 05/21/2020 | 121,732 | ||||||||||||||
Barclays Bank PLC | USD | 957 | CNY | 6,849 | 06/15/2020 | 10,197 | ||||||||||||||
Barclays Bank PLC | USD | 11,585 | CNY | 81,270 | 05/21/2020 | (91,538 | ) | |||||||||||||
Barclays Bank PLC | USD | 2,775 | TRY | 19,129 | 05/28/2020 | (51,418 | ) | |||||||||||||
Barclays Bank PLC | USD | 1,679 | MXN | 41,322 | 06/19/2020 | 22,814 | ||||||||||||||
Barclays Bank PLC | USD | 2,065 | MXN | 49,411 | 06/19/2020 | (29,519 | ) | |||||||||||||
Barclays Bank PLC | USD | 8,173 | SEK | 81,456 | 05/20/2020 | 177,796 | ||||||||||||||
Barclays Bank PLC | USD | 4,054 | RUB | 260,152 | 07/09/2020 | (592,550 | ) | |||||||||||||
Barclays Bank PLC | USD | 6,290 | PHP | 323,838 | 05/28/2020 | 118,800 | ||||||||||||||
Barclays Bank PLC | USD | 2,546 | JPY | 272,384 | 06/15/2020 | (6,883 | ) | |||||||||||||
Barclays Bank PLC | USD | 19,141 | TWD | 574,805 | 05/21/2020 | 226,552 | ||||||||||||||
Barclays Bank PLC | USD | 2,089 | JPY | 228,086 | 06/15/2020 | 37,155 | ||||||||||||||
Barclays Bank PLC | USD | 9,312 | KRW | 11,006,827 | 05/14/2020 | (248,387 | ) | |||||||||||||
Barclays Bank PLC | USD | 1,464 | IDR | 21,143,393 | 05/05/2020 | (42,110 | ) | |||||||||||||
BNP Paribas SA | IDR | 17,593,677 | USD | 1,198 | 05/05/2020 | 15,303 | ||||||||||||||
BNP Paribas SA | CNY | 11,601 | USD | 1,635 | 06/15/2020 | (3,509 | ) | |||||||||||||
BNP Paribas SA | USD | 1,062 | ZAR | 19,213 | 05/15/2020 | (26,456 | ) | |||||||||||||
BNP Paribas SA | USD | 2,190 | MXN | 53,800 | 06/19/2020 | 26,589 | ||||||||||||||
BNP Paribas SA | USD | 1,161 | IDR | 17,593,677 | 05/05/2020 | 22,006 | ||||||||||||||
Citibank, NA | JPY | 9,481,529 | USD | 87,237 | 06/05/2020 | (1,148,817 | ) | |||||||||||||
Citibank, NA | COP | 8,629,941 | USD | 2,161 | 05/13/2020 | (17,496 | ) | |||||||||||||
Citibank, NA | CLP | 2,443,054 | USD | 2,902 | 05/13/2020 | (25,248 | ) | |||||||||||||
Citibank, NA | HUF | 852,195 | USD | 2,612 | 05/20/2020 | (36,761 | ) | |||||||||||||
Citibank, NA | RUB | 593,080 | USD | 8,160 | 05/20/2020 | 196,531 | ||||||||||||||
Citibank, NA | JPY | 152,919 | USD | 1,422 | 06/15/2020 | (3,794 | ) | |||||||||||||
Citibank, NA | NOK | 15,770 | USD | 1,542 | 06/15/2020 | 2,374 | ||||||||||||||
Citibank, NA | BRL | 8,205 | USD | 1,563 | 05/05/2020 | 54,316 | ||||||||||||||
Citibank, NA | EUR | 4,712 | USD | 5,099 | 06/10/2020 | (68,309 | ) | |||||||||||||
Citibank, NA | EUR | 6,778 | USD | 7,412 | 06/15/2020 | (22,134 | ) | |||||||||||||
Citibank, NA | ILS | 4,198 | USD | 1,160 | 06/15/2020 | (45,933 | ) | |||||||||||||
Citibank, NA | GBP | 2,893 | USD | 3,725 | 05/15/2020 | 80,839 | ||||||||||||||
Citibank, NA | CAD | 2,454 | USD | 1,774 | 06/15/2020 | 10,362 | ||||||||||||||
Citibank, NA | AUD | 1,689 | USD | 1,105 | 06/11/2020 | 4,252 | ||||||||||||||
| 36 | AB ALL MARKET REAL RETURN PORTFOLIO | abfunds.com | |
CONSOLIDATED PORTFOLIO OF INVESTMENTS (continued)
| Counterparty | Contracts to Deliver (000) | In Exchange For (000) | Settlement Date | Unrealized Appreciation/ (Depreciation) | ||||||||||||||||
Citibank, NA | CHF | 628 | USD | 643 | 06/15/2020 | $ | (7,924 | ) | ||||||||||||
Citibank, NA | USD | 506 | GBP | 417 | 06/15/2020 | 18,932 | ||||||||||||||
Citibank, NA | USD | 1,512 | BRL | 8,205 | 05/05/2020 | (3,030 | ) | |||||||||||||
Citibank, NA | EUR | 5,075 | CZK | 136,251 | 05/20/2020 | (51,664 | ) | |||||||||||||
Citibank, NA | USD | 4,316 | SGD | 6,069 | 06/15/2020 | (11,336 | ) | |||||||||||||
Citibank, NA | USD | 1,014 | TRY | 7,104 | 05/28/2020 | (2,534 | ) | |||||||||||||
Citibank, NA | USD | 6,472 | AUD | 10,896 | 06/11/2020 | 629,351 | ||||||||||||||
Citibank, NA | USD | 2,294 | BRL | 12,396 | 06/02/2020 | (19,595 | ) | |||||||||||||
Citibank, NA | USD | 1,686 | HKD | 13,082 | 06/16/2020 | 52 | ||||||||||||||
Citibank, NA | USD | 1,735 | INR | 135,566 | 07/23/2020 | 41,872 | ||||||||||||||
Citibank, NA | USD | 8,268 | RUB | 604,266 | 05/20/2020 | (154,680 | ) | |||||||||||||
Citibank, NA | USD | 1,575 | JPY | 165,411 | 06/15/2020 | (32,319 | ) | |||||||||||||
Citibank, NA | USD | 4,865 | CLP | 4,153,008 | 05/13/2020 | 110,945 | ||||||||||||||
Citibank, NA | USD | 831 | COP | 3,312,118 | 05/13/2020 | 5,259 | ||||||||||||||
Citibank, NA | USD | 4,676 | KRW | 5,671,573 | 05/14/2020 | (5,969 | ) | |||||||||||||
Credit Suisse International | HKD | 105,000 | USD | 13,380 | 05/26/2020 | (159,901 | ) | |||||||||||||
Credit Suisse International | AUD | 2,825 | USD | 1,645 | 06/15/2020 | (196,626 | ) | |||||||||||||
Credit Suisse International | USD | 2,639 | EUR | 2,435 | 06/15/2020 | 32,222 | ||||||||||||||
Credit Suisse International | USD | 3,172 | AUD | 4,954 | 06/11/2020 | 56,811 | ||||||||||||||
Credit Suisse International | USD | 6,528 | HKD | 51,177 | 05/26/2020 | 71,914 | ||||||||||||||
Credit Suisse International | USD | 3,257 | KRW | 3,872,101 | 05/14/2020 | (67,983 | ) | |||||||||||||
Deutsche Bank AG | JPY | 281,966 | USD | 2,592 | 06/05/2020 | (36,456 | ) | |||||||||||||
Deutsche Bank AG | JPY | 316,963 | USD | 2,919 | 05/20/2020 | (34,687 | ) | |||||||||||||
Deutsche Bank AG | PEN | 37,240 | USD | 10,679 | 05/13/2020 | (347,395 | ) | |||||||||||||
Deutsche Bank AG | NOK | 11,572 | USD | 1,096 | 05/20/2020 | (33,817 | ) | |||||||||||||
Deutsche Bank AG | CAD | 5,609 | USD | 4,015 | 05/20/2020 | (13,937 | ) | |||||||||||||
Deutsche Bank AG | AUD | 5,537 | USD | 3,488 | 05/20/2020 | (120,781 | ) | |||||||||||||
Deutsche Bank AG | BRL | 5,110 | USD | 988 | 05/05/2020 | 48,693 | ||||||||||||||
Deutsche Bank AG | GBP | 534 | USD | 662 | 05/20/2020 | (10,736 | ) | |||||||||||||
Deutsche Bank AG | USD | 2,190 | CAD | 3,076 | 05/22/2020 | 19,524 | ||||||||||||||
Deutsche Bank AG | USD | 9,463 | PEN | 33,055 | 05/13/2020 | 324,315 | ||||||||||||||
Deutsche Bank AG | CHF | 4,474 | EUR | 4,238 | 05/29/2020 | 8,310 | ||||||||||||||
Deutsche Bank AG | USD | 942 | BRL | 5,110 | 05/05/2020 | (1,887 | ) | |||||||||||||
Deutsche Bank AG | USD | 4,002 | CAD | 5,609 | 05/20/2020 | 27,529 | ||||||||||||||
Deutsche Bank AG | USD | 8,170 | NZD | 13,480 | 05/20/2020 | 97,540 | ||||||||||||||
Deutsche Bank AG | USD | 14,163 | RUB | 951,051 | 07/09/2020 | (1,510,272 | ) | |||||||||||||
Goldman Sachs Bank USA | JPY | 265,239 | USD | 2,409 | 06/15/2020 | (63,866 | ) | |||||||||||||
Goldman Sachs Bank USA | RUB | 200,703 | USD | 3,082 | 07/09/2020 | 412,246 | ||||||||||||||
Goldman Sachs Bank USA | AUD | 10,575 | USD | 6,893 | 05/20/2020 | 1,476 | ||||||||||||||
Goldman Sachs Bank USA | NZD | 9,277 | USD | 5,520 | 06/04/2020 | (170,126 | ) | |||||||||||||
Goldman Sachs Bank USA | ILS | 7,722 | USD | 2,215 | 06/18/2020 | (2,506 | ) | |||||||||||||
Goldman Sachs Bank USA | DKK | 6,640 | USD | 1,010 | 05/14/2020 | 34,919 | ||||||||||||||
Goldman Sachs Bank USA | SGD | 2,298 | USD | 1,585 | 06/15/2020 | (44,646 | ) | |||||||||||||
Goldman Sachs Bank USA | EUR | 2,245 | USD | 2,434 | 05/20/2020 | (27,285 | ) | |||||||||||||
Goldman Sachs Bank USA | CAD | 2,234 | USD | 1,674 | 06/15/2020 | 69,260 | ||||||||||||||
Goldman Sachs Bank USA | CAD | 1,739 | USD | 1,241 | 06/15/2020 | (8,495 | ) | |||||||||||||
Goldman Sachs Bank USA | CHF | 1,062 | USD | 1,091 | 05/29/2020 | (9,844 | ) | |||||||||||||
Goldman Sachs Bank USA | USD | 548 | CAD | 793 | 06/15/2020 | 21,873 | ||||||||||||||
Goldman Sachs Bank USA | USD | 755 | NZD | 1,298 | 06/04/2020 | 41,260 | ||||||||||||||
Goldman Sachs Bank USA | USD | 1,766 | CHF | 1,714 | 05/20/2020 | 10,871 | ||||||||||||||
Goldman Sachs Bank USA | USD | 1,892 | CHF | 1,798 | 06/15/2020 | (27,531 | ) | |||||||||||||
Goldman Sachs Bank USA | USD | 2,144 | CHF | 2,079 | 06/15/2020 | 12,041 | ||||||||||||||
| abfunds.com | AB ALL MARKET REAL RETURN PORTFOLIO | 37 | |
CONSOLIDATED PORTFOLIO OF INVESTMENTS (continued)
| Counterparty | Contracts to Deliver (000) | In Exchange For (000) | Settlement Date | Unrealized Appreciation/ (Depreciation) | ||||||||||||||||
Goldman Sachs Bank USA | USD | 2,107 | CAD | 2,942 | 05/22/2020 | $ | 6,441 | |||||||||||||
Goldman Sachs Bank USA | USD | 696 | NOK | 7,589 | 06/15/2020 | 44,607 | ||||||||||||||
Goldman Sachs Bank USA | USD | 1,176 | TRY | 8,240 | 05/28/2020 | (3,165 | ) | |||||||||||||
Goldman Sachs Bank USA | USD | 947 | ZAR | 17,646 | 05/15/2020 | 3,735 | ||||||||||||||
Goldman Sachs Bank USA | USD | 725 | MXN | 18,327 | 06/19/2020 | 30,116 | ||||||||||||||
Goldman Sachs Bank USA | USD | 1,442 | ZAR | 26,081 | 05/15/2020 | (36,113 | ) | |||||||||||||
Goldman Sachs Bank USA | USD | 2,008 | TWD | 60,126 | 05/21/2020 | 18,214 | ||||||||||||||
Goldman Sachs Bank USA | USD | 3,780 | RUB | 242,003 | 07/09/2020 | (560,549 | ) | |||||||||||||
Goldman Sachs Bank USA | USD | 1,258 | JPY | 128,225 | 06/15/2020 | (62,537 | ) | |||||||||||||
HSBC Bank USA | JPY | 228,830 | USD | 2,116 | 06/05/2020 | (17,412 | ) | |||||||||||||
HSBC Bank USA | HKD | 164,927 | USD | 21,185 | 07/27/2020 | (67,238 | ) | |||||||||||||
HSBC Bank USA | CNY | 104,828 | USD | 14,974 | 05/21/2020 | 149,023 | ||||||||||||||
HSBC Bank USA | THB | 67,640 | USD | 2,044 | 05/21/2020 | (46,236 | ) | |||||||||||||
HSBC Bank USA | BRL | 8,205 | USD | 1,512 | 05/05/2020 | 3,031 | ||||||||||||||
HSBC Bank USA | BRL | 4,126 | USD | 730 | 06/02/2020 | (27,224 | ) | |||||||||||||
HSBC Bank USA | CAD | 2,596 | USD | 1,834 | 05/22/2020 | (31,028 | ) | |||||||||||||
HSBC Bank USA | GBP | 1,433 | USD | 1,779 | 05/15/2020 | (25,913 | ) | |||||||||||||
HSBC Bank USA | USD | 679 | SGD | 965 | 06/15/2020 | 5,451 | ||||||||||||||
HSBC Bank USA | USD | 2,140 | NZD | 3,606 | 06/04/2020 | 71,540 | ||||||||||||||
HSBC Bank USA | USD | 1,444 | BRL | 8,205 | 05/05/2020 | 65,062 | ||||||||||||||
HSBC Bank USA | USD | 2,199 | INR | 167,044 | 07/23/2020 | (9,050 | ) | |||||||||||||
JPMorgan Chase Bank, NA | IDR | 57,272,509 | USD | 3,986 | 05/05/2020 | 135,308 | ||||||||||||||
JPMorgan Chase Bank, NA | KRW | 7,215,312 | USD | 6,118 | 05/14/2020 | 176,075 | ||||||||||||||
JPMorgan Chase Bank, NA | TWD | 142,968 | USD | 4,788 | 05/21/2020 | (28,797 | ) | |||||||||||||
JPMorgan Chase Bank, NA | NOK | 84,039 | USD | 8,155 | 05/20/2020 | (48,849 | ) | |||||||||||||
JPMorgan Chase Bank, NA | CZK | 34,420 | USD | 1,339 | 05/20/2020 | (53,581 | ) | |||||||||||||
JPMorgan Chase Bank, NA | SGD | 10,302 | USD | 7,207 | 05/21/2020 | (99,437 | ) | |||||||||||||
JPMorgan Chase Bank, NA | BRL | 6,108 | USD | 1,095 | 06/02/2020 | (25,833 | ) | |||||||||||||
JPMorgan Chase Bank, NA | CAD | 4,742 | USD | 3,397 | 05/22/2020 | (9,974 | ) | |||||||||||||
JPMorgan Chase Bank, NA | AUD | 4,673 | USD | 2,993 | 05/20/2020 | (52,439 | ) | |||||||||||||
JPMorgan Chase Bank, NA | GBP | 3,977 | USD | 4,954 | 05/20/2020 | (55,207 | ) | |||||||||||||
JPMorgan Chase Bank, NA | GBP | 663 | USD | 826 | 06/15/2020 | (9,086 | ) | |||||||||||||
JPMorgan Chase Bank, NA | USD | 1,448 | GBP | 1,126 | 05/15/2020 | (29,984 | ) | |||||||||||||
JPMorgan Chase Bank, NA | USD | 3,684 | NZD | 6,130 | 06/04/2020 | 74,944 | ||||||||||||||
JPMorgan Chase Bank, NA | USD | 4,977 | NZD | 8,168 | 05/20/2020 | 32,726 | ||||||||||||||
JPMorgan Chase Bank, NA | USD | 3,098 | TRY | 20,190 | 05/28/2020 | (223,422 | ) | |||||||||||||
JPMorgan Chase Bank, NA | USD | 4,353 | SEK | 42,678 | 05/20/2020 | 21,807 | ||||||||||||||
JPMorgan Chase Bank, NA | USD | 44 | KRW | 52,965 | 08/13/2020 | (193 | ) | |||||||||||||
JPMorgan Chase Bank, NA | USD | 14,943 | CNY | 104,828 | 05/21/2020 | (118,071 | ) | |||||||||||||
JPMorgan Chase Bank, NA | USD | 1,569 | HUF | 502,489 | 05/20/2020 | (6,839 | ) | |||||||||||||
JPMorgan Chase Bank, NA | USD | 877 | CLP | 747,430 | 05/13/2020 | 18,514 | ||||||||||||||
JPMorgan Chase Bank, NA | USD | 1,756 | KRW | 2,124,817 | 05/14/2020 | (6,581 | ) | |||||||||||||
JPMorgan Chase Bank, NA | USD | 1,885 | COP | 7,434,403 | 05/13/2020 | (9,004 | ) | |||||||||||||
JPMorgan Chase Bank, NA | USD | 3,779 | IDR | 57,272,509 | 05/05/2020 | 71,635 | ||||||||||||||
Morgan Stanley & Co., Inc. | IDR | 148,324,419 | USD | 9,691 | 05/05/2020 | (279,961 | ) | |||||||||||||
Morgan Stanley & Co., Inc. | BRL | 15,544 | USD | 3,102 | 05/05/2020 | 243,302 | ||||||||||||||
Morgan Stanley & Co., Inc. | PEN | 3,529 | USD | 1,043 | 05/13/2020 | (1,599 | ) | |||||||||||||
Morgan Stanley & Co., Inc. | CHF | 2,114 | USD | 2,175 | 05/29/2020 | (16,800 | ) | |||||||||||||
Morgan Stanley & Co., Inc. | CHF | 832 | USD | 849 | 06/15/2020 | (13,953 | ) | |||||||||||||
Morgan Stanley & Co., Inc. | USD | 1,089 | GBP | 873 | 05/15/2020 | 10,343 | ||||||||||||||
Morgan Stanley & Co., Inc. | USD | 2,520 | SGD | 3,614 | 05/21/2020 | 42,356 | ||||||||||||||
Morgan Stanley & Co., Inc. | USD | 2,864 | BRL | 15,544 | 05/05/2020 | (5,741 | ) | |||||||||||||
| 38 | AB ALL MARKET REAL RETURN PORTFOLIO | abfunds.com | |
CONSOLIDATED PORTFOLIO OF INVESTMENTS (continued)
| Counterparty | Contracts to Deliver (000) | In Exchange For (000) | Settlement Date | Unrealized Appreciation/ (Depreciation) | ||||||||||||||||
Morgan Stanley & Co., Inc. | USD | 12,798 | JPY | 1,385,154 | 06/05/2020 | $ | 114,017 | |||||||||||||
Morgan Stanley & Co., Inc. | USD | 5,273 | KRW | 6,249,082 | 05/14/2020 | (127,012 | ) | |||||||||||||
Morgan Stanley & Co., Inc. | USD | 7,237 | IDR | 101,023,606 | 05/05/2020 | (445,146 | ) | |||||||||||||
Morgan Stanley & Co., Inc. | USD | 2,956 | IDR | 47,300,813 | 07/23/2020 | 110,859 | ||||||||||||||
Morgan Stanley & Co., Inc. | USD | 3,121 | IDR | 47,300,813 | 05/05/2020 | 59,163 | ||||||||||||||
Natwest Markets PLC | JPY | 465,806 | USD | 4,377 | 06/15/2020 | 34,102 | ||||||||||||||
Natwest Markets PLC | JPY | 211,595 | USD | 1,918 | 06/15/2020 | (55,284 | ) | |||||||||||||
Natwest Markets PLC | MYR | 14,284 | USD | 3,431 | 08/13/2020 | 130,272 | ||||||||||||||
Natwest Markets PLC | TRY | 7,104 | USD | 1,045 | 05/28/2020 | 33,458 | ||||||||||||||
Natwest Markets PLC | CAD | 2,979 | USD | 2,108 | 05/22/2020 | (32,154 | ) | |||||||||||||
Natwest Markets PLC | AUD | 2,116 | USD | 1,272 | 06/15/2020 | (107,395 | ) | |||||||||||||
Natwest Markets PLC | GBP | 1,203 | USD | 1,435 | 06/15/2020 | (80,221 | ) | |||||||||||||
Natwest Markets PLC | USD | 2,074 | EUR | 1,914 | 05/20/2020 | 23,465 | ||||||||||||||
Natwest Markets PLC | USD | 3,875 | EUR | 3,410 | 06/15/2020 | (135,383 | ) | |||||||||||||
Natwest Markets PLC | USD | 4,334 | TWD | 127,440 | 11/10/2020 | 72,562 | ||||||||||||||
Natwest Markets PLC | USD | 3,946 | JPY | 426,820 | 06/15/2020 | 33,017 | ||||||||||||||
Standard Chartered Bank | KRW | 4,473,134 | USD | 3,636 | 05/14/2020 | (47,312 | ) | |||||||||||||
Standard Chartered Bank | INR | 196,805 | USD | 2,528 | 07/23/2020 | (51,727 | ) | |||||||||||||
Standard Chartered Bank | TWD | 158,736 | USD | 5,320 | 05/21/2020 | (28,902 | ) | |||||||||||||
Standard Chartered Bank | NOK | 22,420 | USD | 2,433 | �� | 06/15/2020 | 244,058 | |||||||||||||
Standard Chartered Bank | USD | 714 | CNY | 5,074 | 06/15/2020 | 2,555 | ||||||||||||||
Standard Chartered Bank | USD | 1,423 | CNY | 10,004 | 06/15/2020 | (9,982 | ) | |||||||||||||
Standard Chartered Bank | USD | 4,522 | PHP | 229,493 | 05/28/2020 | 19,688 | ||||||||||||||
Standard Chartered Bank | USD | 8,859 | INR | 679,565 | 07/23/2020 | 48,895 | ||||||||||||||
Standard Chartered Bank | USD | 1,857 | KRW | 2,298,127 | 05/14/2020 | 35,853 | ||||||||||||||
State Street Bank & Trust Co. | THB | 131,120 | USD | 4,066 | 05/21/2020 | 13,883 | ||||||||||||||
State Street Bank & Trust Co. | THB | 72,005 | USD | 2,202 | 05/21/2020 | (23,382 | ) | |||||||||||||
State Street Bank & Trust Co. | ZAR | 36,859 | USD | 1,960 | 05/15/2020 | (26,083 | ) | |||||||||||||
State Street Bank & Trust Co. | JPY | 32,183 | USD | 299 | 06/15/2020 | (1,059 | ) | |||||||||||||
State Street Bank & Trust Co. | JPY | 25,454 | USD | 234 | 06/05/2020 | (3,451 | ) | |||||||||||||
State Street Bank & Trust Co. | CNY | 14,231 | USD | 2,035 | 06/15/2020 | 24,460 | ||||||||||||||
State Street Bank & Trust Co. | CNY | 5,703 | USD | 801 | 06/15/2020 | (5,051 | ) | |||||||||||||
State Street Bank & Trust Co. | HKD | 5,701 | USD | 735 | 06/16/2020 | 57 | ||||||||||||||
State Street Bank & Trust Co. | NZD | 1,757 | USD | 1,046 | 06/04/2020 | (31,435 | ) | |||||||||||||
State Street Bank & Trust Co. | CHF | 748 | USD | 767 | 05/29/2020 | (8,442 | ) | |||||||||||||
State Street Bank & Trust Co. | USD | 12 | CAD | 16 | 05/20/2020 | 77 | ||||||||||||||
State Street Bank & Trust Co. | USD | 142 | CAD | 206 | 06/15/2020 | 6,121 | ||||||||||||||
State Street Bank & Trust Co. | USD | 375 | GBP | 287 | 06/15/2020 | (13,608 | ) | |||||||||||||
| abfunds.com | AB ALL MARKET REAL RETURN PORTFOLIO | 39 | |
CONSOLIDATED PORTFOLIO OF INVESTMENTS (continued)
| Counterparty | Contracts to Deliver (000) | In Exchange For (000) | Settlement Date | Unrealized Appreciation/ (Depreciation) | ||||||||||||||||
State Street Bank & Trust Co. | USD | 374 | GBP | 308 | 06/15/2020 | $ | 14,939 | |||||||||||||
State Street Bank & Trust Co. | USD | 445 | EUR | 411 | 06/15/2020 | 5,337 | ||||||||||||||
State Street Bank & Trust Co. | USD | 1,076 | AUD | 1,699 | 06/11/2020 | 31,626 | ||||||||||||||
State Street Bank & Trust Co. | USD | 1,929 | EUR | 1,716 | 06/15/2020 | (46,823 | ) | |||||||||||||
State Street Bank & Trust Co. | USD | 2,207 | SEK | 22,112 | 05/14/2020 | 60,021 | ||||||||||||||
State Street Bank & Trust Co. | USD | 864 | THB | 28,259 | 05/21/2020 | 9,784 | ||||||||||||||
State Street Bank & Trust Co. | USD | 1,831 | ZAR | 34,434 | 05/15/2020 | 24,368 | ||||||||||||||
State Street Bank & Trust Co. | USD | 1,393 | MXN | 34,896 | 06/19/2020 | 44,405 | ||||||||||||||
UBS AG | PHP | 553,331 | USD | 10,877 | 05/28/2020 | (73,489 | ) | |||||||||||||
UBS AG | JPY | 335,643 | USD | 3,118 | 06/05/2020 | (11,093 | ) | |||||||||||||
UBS AG | JPY | 151,813 | USD | 1,395 | 06/15/2020 | (20,072 | ) | |||||||||||||
UBS AG | TWD | 127,440 | USD | 4,340 | 11/10/2020 | (67,135 | ) | |||||||||||||
UBS AG | BRL | 20,654 | USD | 3,806 | 05/05/2020 | 7,628 | ||||||||||||||
UBS AG | BRL | 20,654 | USD | 3,660 | 06/02/2020 | (128,482 | ) | |||||||||||||
UBS AG | NOK | 8,799 | USD | 860 | 06/15/2020 | 788 | ||||||||||||||
UBS AG | EUR | 1,796 | USD | 1,943 | 06/10/2020 | (26,839 | ) | |||||||||||||
UBS AG | GBP | 937 | USD | 1,203 | 06/15/2020 | 22,803 | ||||||||||||||
UBS AG | USD | 3,879 | NZD | 6,334 | 05/20/2020 | 6,560 | ||||||||||||||
UBS AG | USD | 3,669 | BRL | 20,654 | 05/05/2020 | 129,595 | ||||||||||||||
UBS AG | USD | 1,324 | ZAR | 24,364 | 05/15/2020 | (11,587 | ) | |||||||||||||
UBS AG | USD | 4,746 | JPY | 510,822 | 06/05/2020 | 15,587 | ||||||||||||||
|
| |||||||||||||||||||
| $ | (2,662,709 | ) | ||||||||||||||||||
|
| |||||||||||||||||||
CURRENCY OPTIONS WRITTEN (see Note D)
| Description/ Counterparty | Exercise Price | Expiration Month | Contracts | Notional Amount (000) | Premiums Received | U.S. $ Value | ||||||||||||||||||||||
Put |
| |||||||||||||||||||||||||||
RUB vs. USD/ | RUB | 67.350 | 07/2020 | 2,385,604,350 | RUB | 2,385,604 | $ | 310,075 | $ | (3,638,796 | ) | |||||||||||||||||
| 40 | AB ALL MARKET REAL RETURN PORTFOLIO | abfunds.com | |
CONSOLIDATED PORTFOLIO OF INVESTMENTS (continued)
INFLATION (CPI) SWAPS (see Note D)
| Rate Type | ||||||||||||||||||||||||||||||||||||
Swap | Notional Amount (000) | Termination Date | Payments made by the Fund | Payments received by the Fund | Payment Frequency Paid/ Received | Market Value | Upfront Premiums Paid (Received) | Unrealized Appreciation/ (Depreciation) | ||||||||||||||||||||||||||||
Goldman Sachs International | USD | 246,010 | 04/26/2027 | 1.705 | % | CPI | # | Maturity | $ | (2,515,366 | ) | $ | — | $ | (2,515,366 | ) | ||||||||||||||||||||
Goldman Sachs International | USD | 69,760 | 04/26/2027 | 2.175 | % | CPI | # | Maturity | (2,451,848 | ) | — | (2,451,848 | ) | |||||||||||||||||||||||
Goldman Sachs International | USD | 110,190 | 04/25/2030 | 1.900 | % | CPI | # | Maturity | (401,373 | ) | — | (401,373 | ) | |||||||||||||||||||||||
JPMorgan Chase Bank, NA | USD | 69,760 | 04/26/2027 | 2.183 | % | CPI | # | Maturity | (2,479,852 | ) | — | (2,479,852 | ) | |||||||||||||||||||||||
|
|
|
|
|
| |||||||||||||||||||||||||||||||
| $ | (7,848,439 | ) | $ | — | $ | (7,848,439 | ) | |||||||||||||||||||||||||||||
|
|
|
|
|
| |||||||||||||||||||||||||||||||
| # | Variable interest rate based on the rate of inflation as determined by the Consumer Price Index (CPI). |
TOTAL RETURN SWAPS (see Note D)
Counterparty & | Rate Paid/ Received | Payment Frequency | Current Notional (000) | Maturity Date | Unrealized Appreciation/ (Depreciation) | |||||||||||||||||||
Receive Total Return on Reference Obligation |
| |||||||||||||||||||||||
JPMorgan Chase Bank, NA | ||||||||||||||||||||||||
Bloomberg Industrial Metals Subindex 3 Month Forward | 0.12 | % | Maturity | USD | 4,452 | 06/15/2020 | $ | 116,324 | ||||||||||||||||
Bloomberg Industrial Metals Subindex 3 Month Forward | 0.12 | % | Maturity | USD | 7,015 | 06/15/2020 | (244,950 | ) | ||||||||||||||||
Bloomberg Livestock Subindex 3 Month Forward | 0.30 | % | Maturity | USD | 1,592 | 06/15/2020 | 9,368 | |||||||||||||||||
Bloomberg Precious Metals Subindex | 0.08 | % | Maturity | USD | 47,388 | 06/15/2020 | 5,871,123 | |||||||||||||||||
Bloomberg Softs Subindex 3 Month Forward | 0.18 | % | Maturity | USD | 1,911 | 06/15/2020 | (45,133 | ) | ||||||||||||||||
JPMorgan JMABRF34 Index(1) | 0.60 | % | Maturity | USD | 22,880 | 06/15/2020 | 2,004,387 | |||||||||||||||||
JPMorgan JMABRF34 Index(2) | 0.60 | % | Maturity | USD | 8,363 | 06/15/2020 | (169,464 | ) | ||||||||||||||||
Merrill Lynch International | ||||||||||||||||||||||||
Bloomberg Grains Subindex 3 Month Forward | 0.07 | % | Quarterly | USD | 41,786 | 06/15/2020 | (439,395 | ) | ||||||||||||||||
Bloomberg Industrial Metals Subindex 3 Month Forward | 0.10 | % | Quarterly | USD | 36,689 | 06/15/2020 | (1,285,873) | |||||||||||||||||
Bloomberg Livestock Subindex 3 Month Forward | 0.07 | % | Quarterly | USD | 11,751 | 06/15/2020 | 68,135 | |||||||||||||||||
| abfunds.com | AB ALL MARKET REAL RETURN PORTFOLIO | 41 | |
CONSOLIDATED PORTFOLIO OF INVESTMENTS (continued)
Counterparty & | Rate Paid/ Received | Payment Frequency | Current Notional (000) | Maturity Date | Unrealized Appreciation/ (Depreciation) | |||||||||||||||||||
Bloomberg Softs Subindex 3 Month Forward | 0.10 | % | Quarterly | USD | 17,822 | 06/15/2020 | $ | (423,167 | ) | |||||||||||||||
Morgan Stanley Capital Services LLC | ||||||||||||||||||||||||
Bloomberg Grains Subindex 3 Month Forward | 0.15 | % | Maturity | USD | 4,422 | 06/15/2020 | (154,213 | ) | ||||||||||||||||
Bloomberg Grains Subindex 3 Month Forward | 0.15 | % | Maturity | USD | 4,108 | 06/15/2020 | (206,678 | ) | ||||||||||||||||
Pay Total Return on Reference Obligation |
| |||||||||||||||||||||||
UBS AG | ||||||||||||||||||||||||
FTSE EPRA/NAREIT Developed Real Estate Index | | 3 Month LIBOR Plus 1.992 | % | Quarterly | USD | 10,572 | 08/17/2020 | 3,835,653 | ||||||||||||||||
FTSE EPRA/NAREIT Developed Real Estate Index | | 3 Month LIBOR Plus 1.023 | % | Quarterly | USD | 27,275 | 12/15/2020 | (2,812,517 | ) | |||||||||||||||
FTSE EPRA/NAREIT Developed Real Estate Index | | 3 Month LIBOR Minus 1.014 | % | Quarterly | USD | 28,468 | 04/15/2021 | (930,864 | ) | |||||||||||||||
|
| |||||||||||||||||||||||
| $ | 5,192,736 | |||||||||||||||||||||||
|
| |||||||||||||||||||||||
VARIANCE SWAPS (see Note D)
| Swap Counterparty & Referenced Obligation | Volatility Strike Rate | Payment Frequency | Notional Amount (000) | Market Value | Upfront Premiums (Paid) Received | Unrealized Appreciation/ (Depreciation) | ||||||||||||||||||||||
Buy Contracts |
| |||||||||||||||||||||||||||
Barclays Bank PLC |
| |||||||||||||||||||||||||||
JPY/USD 05/27/2020* | 5.88 | % | Maturity | USD | 208 | $ | 783,661 | $ | — | $ | 783,661 | |||||||||||||||||
Sale Contracts |
| |||||||||||||||||||||||||||
JPMorgan Chase Bank, NA |
| |||||||||||||||||||||||||||
JPY/USD 05/07/2020* | 16.90 | % | Maturity | USD | 52 | 271,311 | — | 271,311 | ||||||||||||||||||||
|
|
|
|
|
| |||||||||||||||||||||||
| $ | 1,054,972 | $ | — | $ | 1,054,972 | |||||||||||||||||||||||
|
|
|
|
|
| |||||||||||||||||||||||
| * | Termination date |
| (a) | Represents entire or partial securities out on loan. See Note E for securities lending information. |
| (b) | Non-income producing security. |
| (c) | Security is exempt from registration under Rule 144A of the Securities Act of 1933. These securities are considered restricted, but liquid and may be resold in transactions exempt from registration, normally to qualified institutional buyers. At April 30, 2020, the aggregate market value of these securities amounted to $14,153,572 or 1.6% of net assets. |
| (d) | Security in which significant unobservable inputs (Level 3) were used in determining fair value. |
| (e) | Fair valued by the Adviser. |
| (f) | Illiquid security. |
| 42 | AB ALL MARKET REAL RETURN PORTFOLIO | abfunds.com | |
CONSOLIDATED PORTFOLIO OF INVESTMENTS (continued)
| (g) | To obtain a copy of the fund’s shareholder report, please go to the Securities and Exchange Commission’s website at www.sec.gov. Additionally, shareholder reports for AB funds can be obtained by calling AB at (800) 227-4618. |
| (h) | Affiliated investments. |
| (i) | The rate shown represents the 7-day yield as of period end. |
| (j) | One contract relates to 1 share. |
Currency Abbreviations:
AUD – Australian Dollar
BRL – Brazilian Real
CAD – Canadian Dollar
CHF – Swiss Franc
CLP – Chilean Peso
CNY – Chinese Yuan Renminbi
COP – Colombian Peso
CZK – Czech Koruna
DKK – Danish Krone
EUR – Euro
GBP – Great British Pound
HKD – Hong Kong Dollar
HUF – Hungarian Forint
IDR – Indonesian Rupiah
ILS – Israeli Shekel
INR – Indian Rupee
JPY – Japanese Yen
KRW – South Korean Won
MXN – Mexican Peso
MYR – Malaysian Ringgit
NOK – Norwegian Krone
NZD – New Zealand Dollar
PEN – Peruvian Sol
PHP – Philippine Peso
RUB – Russian Ruble
SEK – Swedish Krona
SGD – Singapore Dollar
THB – Thailand Baht
TRY – Turkish Lira
TWD – New Taiwan Dollar
USD – United States Dollar
ZAR – South African Rand
Glossary:
ADR – American Depositary Receipt
CBT – Chicago Board of Trade
CPI – Consumer Price Index
EAFE – Europe, Australia, and Far East
EPRA – European Public Real Estate Association
ETF – Exchange Traded Fund
FTSE – Financial Times Stock Exchange
GDR – Global Depositary Receipt
KC HRW – Kansas City Hard Red Winter
LIBOR – London Interbank Offered Rates
LME – London Metal Exchange
MSCI – Morgan Stanley Capital International
NAREIT – National Association of Real Estate Investment Trusts
OSE – Osaka Securities Exchange
PJSC – Public Joint Stock Company
RBOB – Reformulated Gasoline Blend-Stock for Oxygen Blending (Unleaded Gas)
REG – Registered Shares
REIT – Real Estate Investment Trust
TSX – Toronto Stock Exchange
ULSD – Ultra-Low Sulfur Diesel
WTI – West Texas Intermediate
| (1) | The following table represents the (long/(short)) basket holdings underlying the total return swap with JPMorgan JMABRF34 Index as of April 30, 2020. |
| Security Description | Current Notional | Percent of Basket’s Value | ||||||
Gasoline RBOB Futures 07/2020 | $ | (5,925,847 | ) | (25.1 | )% | |||
Natural Gas Futures 11/2020 | 5,583,513 | 23.7 | % | |||||
Lean Hogs Futures 06/2020 | (5,575,002 | ) | (23.6 | )% | ||||
Natural Gas Futures 07/2020 | (5,473,187 | ) | (23.2 | )% | ||||
Cotton No.2 Futures 12/2020 | 5,411,936 | 22.9 | % | |||||
Cotton No.2 Futures 07/2020 | (5,357,223 | ) | (22.7 | )% | ||||
Live Cattle Futures 10/2020 | 5,110,664 | 21.7 | % | |||||
LME Nickel Futures 11/2020 | 5,071,871 | 21.5 | % | |||||
LME Nickel Futures 07/2020 | (5,069,671 | ) | (21.5 | )% | ||||
Lean Hogs Futures 10/2020 | 5,053,985 | 21.4 | % | |||||
Copper Futures 12/2020 | 5,047,680 | 21.4 | % | |||||
Copper Futures 07/2020 | (5,033,798 | ) | (21.3 | )% | ||||
Gasoline RBOB Futures 11/2020 | 5,024,446 | 21.3 | % | |||||
Live Cattle Futures 06/2020 | (4,991,679 | ) | (21.2 | )% | ||||
| abfunds.com | AB ALL MARKET REAL RETURN PORTFOLIO | 43 | |
CONSOLIDATED PORTFOLIO OF INVESTMENTS (continued)
| Security Description | Current Notional | Percent of Basket’s Value | ||||||
LME Zinc Futures 07/2020 | $ | (4,859,730 | ) | (20.6 | )% | |||
LME Zinc Futures 11/2020 | 4,859,532 | 20.6 | % | |||||
Sugar #11 (World) Futures 10/2020 | 4,822,515 | 20.4 | % | |||||
Sugar #11 (World) Futures 07/2020 | (4,812,220 | ) | (20.4 | )% | ||||
KC HRW Wheat Futures 07/2020 | (4,755,227 | ) | (20.2 | )% | ||||
KC HRW Wheat Futures 12/2020 | 4,742,219 | 20.1 | % | |||||
Soybean Oil Futures 07/2020 | (4,731,164 | ) | (20.1 | )% | ||||
Soybean Oil Futures 12/2020 | 4,717,870 | 20.0 | % | |||||
Soybean Futures 11/2020 | 4,664,219 | 19.8 | % | |||||
LME PRI Aluminum Futures 11/2020 | 4,663,309 | 19.8 | % | |||||
LME PRI Aluminum Futures 07/2020 | (4,638,810 | ) | (19.7 | )% | ||||
Soybean Futures 07/2020 | (4,614,192 | ) | (19.6 | )% | ||||
Soybean Meal Futures 12/2020 | 4,547,416 | 19.3 | % | |||||
Corn Futures 12/2020 | 4,513,605 | 19.1 | % | |||||
Wheat Futures (CBT) 12/2020 | 4,508,248 | 19.1 | % | |||||
Wheat Futures (CBT) 07/2020 | (4,472,017 | ) | (19.0 | )% | ||||
Brent Crude Futures 07/2020 | (4,434,258 | ) | (18.8 | )% | ||||
Corn Futures 07/2020 | (4,415,675 | ) | (18.7 | )% | ||||
Brent Crude Futures 11/2020 | 4,329,941 | 18.4 | % | |||||
Soybean Meal Futures 07/2020 | (4,323,621 | ) | (18.3 | )% | ||||
Coffee ‘C’ Futures 12/2020 | 4,279,053 | 18.1 | % | |||||
Coffee ‘C’ Futures 07/2020 | (4,264,143 | ) | (18.1 | )% | ||||
WTI Crude Futures 11/2020 | 4,253,995 | 18.0 | % | |||||
NY Harbor ULSD Futures 11/2020 | 4,209,635 | 17.8 | % | |||||
NY Harbor ULSD Futures 07/2020 | (4,118,960 | ) | (17.5 | )% | ||||
WTI Crude Futures 07/2020 | (3,598,044 | ) | (15.3 | )% | ||||
| (2) | The following table represents the (long/(short)) basket holdings underlying the total return swap with JPMorgan JMABRF34 Index as of April 30, 2020. |
| Security Description | Current Notional | Percent of Basket’s Value | ||||||
Gasoline RBOB Futures 07/2020 | $ | (2,166,054 | ) | (25.1 | )% | |||
Natural Gas Futures 11/2020 | 2,040,922 | 23.7 | % | |||||
Lean Hogs Futures 06/2020 | (2,037,811 | ) | (23.6 | )% | ||||
Natural Gas Futures 07/2020 | (2,000,595 | ) | (23.2 | )% | ||||
Cotton No.2 Futures 12/2020 | 1,978,206 | 22.9 | % | |||||
Cotton No.2 Futures 07/2020 | (1,958,207 | ) | (22.7 | )% | ||||
Live Cattle Futures 10/2020 | 1,868,083 | 21.7 | % | |||||
LME Nickel Futures 11/2020 | 1,853,904 | 21.5 | % | |||||
LME Nickel Futures 07/2020 | (1,853,100 | ) | (21.5 | )% | ||||
Lean Hogs Futures 10/2020 | 1,847,366 | 21.4 | % | |||||
Copper Futures 12/2020 | 1,845,061 | 21.4 | % | |||||
Copper Futures 07/2020 | (1,839,987 | ) | (21.3 | )% | ||||
Gasoline RBOB Futures 11/2020 | 1,836,569 | 21.3 | % | |||||
Live Cattle Futures 06/2020 | (1,824,591 | ) | (21.2 | )% | ||||
LME Zinc Futures 07/2020 | (1,776,360 | ) | (20.6 | )% | ||||
LME Zinc Futures 11/2020 | 1,776,288 | 20.6 | % | |||||
Sugar #11 (World) Futures 10/2020 | 1,762,757 | 20.4 | % | |||||
Sugar #11 (World) Futures 07/2020 | (1,758,994 | ) | (20.4 | )% | ||||
KC HRW Wheat Futures 07/2020 | (1,738,162 | ) | (20.2 | )% | ||||
KC HRW Wheat Futures 12/2020 | 1,733,407 | 20.1 | % | |||||
Soybean Oil Futures 07/2020 | (1,729,366 | ) | (20.1 | )% | ||||
Soybean Oil Futures 12/2020 | 1,724,507 | 20.0 | % | |||||
| 44 | AB ALL MARKET REAL RETURN PORTFOLIO | abfunds.com | |
CONSOLIDATED PORTFOLIO OF INVESTMENTS (continued)
| Security Description | Current Notional | Percent of Basket’s Value | ||||||
Soybean Futures 11/2020 | $ | 1,704,896 | 19.8 | % | ||||
LME PRI Aluminum Futures 11/2020 | 1,704,563 | 19.8 | % | |||||
LME PRI Aluminum Futures 07/2020 | (1,695,608 | ) | (19.7 | )% | ||||
Soybean Futures 07/2020 | (1,686,610 | ) | (19.6 | )% | ||||
Soybean Meal Futures 12/2020 | 1,662,201 | 19.3 | % | |||||
Corn Futures 12/2020 | 1,649,842 | 19.1 | % | |||||
Wheat Futures (CBT) 12/2020 | 1,647,884 | 19.1 | % | |||||
Wheat Futures (CBT) 07/2020 | (1,634,641 | ) | (19.0 | )% | ||||
Brent Crude Futures 07/2020 | (1,620,839 | ) | (18.8 | )% | ||||
Corn Futures 07/2020 | (1,614,047 | ) | (18.7 | )% | ||||
Brent Crude Futures 11/2020 | 1,582,708 | 18.4 | % | |||||
Soybean Meal Futures 07/2020 | (1,580,398 | ) | (18.3 | )% | ||||
Coffee ‘C’ Futures 12/2020 | 1,564,107 | 18.1 | % | |||||
Coffee ‘C’ Futures 07/2020 | (1,558,657 | ) | (18.1 | )% | ||||
WTI Crude Futures 11/2020 | 1,554,948 | 18.0 | % | |||||
NY Harbor ULSD Futures 11/2020 | 1,538,733 | 17.8 | % | |||||
NY Harbor ULSD Futures 07/2020 | (1,505,589 | ) | (17.5 | )% | ||||
WTI Crude Futures 07/2020 | (1,315,181 | ) | (15.3 | )% | ||||
See notes to consolidated financial statements.
| abfunds.com | AB ALL MARKET REAL RETURN PORTFOLIO | 45 | |
CONSOLIDATED STATEMENT OF ASSETS & LIABILITIES
April 30, 2020 (unaudited)
| Assets | ||||
Investments in securities, at value | ||||
Unaffiliated issuers (cost $812,343,522) | $ | 722,893,711 | (a) | |
Affiliated issuers (cost $143,522,832—including investment of cash collateral for securities loaned of $7,958,536) | 143,522,832 | |||
Cash collateral due from broker | 54,763,559 | |||
Foreign currencies, at value (cost $4,072,035) | 4,110,965 | |||
Unrealized appreciation on total return swaps | 11,904,990 | |||
Unrealized appreciation on forward currency exchange contracts | 8,003,557 | |||
Receivable for variation margin on futures | 1,819,324 | |||
Unaffiliated dividends and interest receivable | 1,380,927 | |||
Unrealized appreciation on variance swaps | 1,054,972 | |||
Receivable for capital stock sold | 1,035,536 | |||
Affiliated dividends receivable | 37,799 | |||
|
| |||
Total assets | 950,528,172 | |||
|
| |||
| Liabilities | ||||
Options written, at value (premiums received $310,075) | 3,638,796 | |||
Unrealized depreciation on forward currency exchange contracts | 10,666,266 | |||
Payable for collateral received on securities loaned | 7,958,536 | |||
Unrealized depreciation on inflation swaps | 7,848,439 | |||
Unrealized depreciation on total return swaps | 6,712,254 | |||
Cash collateral due to broker | 2,117,000 | |||
Payable for capital stock redeemed | 936,488 | |||
Advisory fee payable | 528,505 | |||
Distribution fee payable | 96,470 | |||
Administrative fee payable | 25,785 | |||
Transfer Agent fee payable | 17,995 | |||
Directors’ fees payable | 465 | |||
Accrued expenses and other liabilities | 82,445 | |||
|
| |||
Total liabilities | 40,629,444 | |||
|
| |||
Net Assets | $ | 909,898,728 | ||
|
| |||
| Composition of Net Assets | ||||
Capital stock, at par | $ | 131,825 | ||
Additional paid-in capital | 1,172,788,726 | |||
Accumulated loss | (263,021,823 | ) | ||
|
| |||
| $ | 909,898,728 | |||
|
|
| (a) | Includes securities on loan with a value of $15,774,331 (see Note E). |
See notes to consolidated financial statements.
| 46 | AB ALL MARKET REAL RETURN PORTFOLIO | abfunds.com | |
CONSOLIDATED STATEMENT OF ASSETS & LIABILITIES (continued)
Net Asset Value Per Share—33 billion shares of capital stock authorized, $.001 par value
| Class | Net Assets | Shares Outstanding | Net Asset Value | |||||||||
| ||||||||||||
| A | $ | 6,783,867 | 967,928 | $ | 7.01 | * | ||||||
| ||||||||||||
| C | $ | 519,430 | 73,786 | $ | 7.04 | |||||||
| ||||||||||||
| Advisor | $ | 11,056,871 | 1,583,767 | $ | 6.98 | |||||||
| ||||||||||||
| R | $ | 218,530 | 31,607 | $ | 6.91 | |||||||
| ||||||||||||
| K | $ | 1,736,441 | 250,984 | $ | 6.92 | |||||||
| ||||||||||||
| I | $ | 20,021,335 | 2,890,990 | $ | 6.93 | |||||||
| ||||||||||||
| 1 | $ | 473,236,273 | 68,818,427 | $ | 6.88 | |||||||
| ||||||||||||
| 2 | $ | 7,034 | 1,000 | $ | 7.03 | |||||||
| ||||||||||||
| Z | $ | 396,318,947 | 57,206,458 | $ | 6.93 | |||||||
| ||||||||||||
| * | The maximum offering price per share for Class A shares was $7.32 which reflects a sales charge of 4.25%. |
See notes to consolidated financial statements.
| abfunds.com | AB ALL MARKET REAL RETURN PORTFOLIO | 47 | |
CONSOLIDATED STATEMENT OF OPERATIONS
Six Months Ended April 30, 2020 (unaudited)
| Investment Income | ||||||||
Dividends | ||||||||
Unaffiliated issuers (net of foreign taxes withheld of $473,451) | $ | 13,229,506 | ||||||
Affiliated issuers | 666,109 | |||||||
Interest (net of foreign taxes withheld of $4,539) | 68,326 | |||||||
Securities lending income | 93,722 | $ | 14,057,663 | |||||
|
| |||||||
| Expenses | ||||||||
Advisory fee (see Note B) | 3,987,104 | |||||||
Distribution fee—Class A | 10,656 | |||||||
Distribution fee—Class C | 3,255 | |||||||
Distribution fee—Class R | 642 | |||||||
Distribution fee—Class K | 2,443 | |||||||
Distribution fee—Class 1 | 697,975 | |||||||
Transfer agency—Class A | 10,585 | |||||||
Transfer agency—Class C | 835 | |||||||
Transfer agency—Advisor Class | 20,106 | |||||||
Transfer agency—Class R | 335 | |||||||
Transfer agency—Class K | 1,966 | |||||||
Transfer agency—Class I | 4,734 | |||||||
Transfer agency—Class 1 | 62,051 | |||||||
Transfer agency—Class Z | 48,044 | |||||||
Custodian | 192,805 | |||||||
Audit and tax | 56,571 | |||||||
Registration fees | 48,965 | |||||||
Administrative | 41,197 | |||||||
Printing | 24,991 | |||||||
Legal | 21,242 | |||||||
Directors’ fees | 11,719 | |||||||
Miscellaneous | 45,804 | |||||||
|
| |||||||
Total expenses | 5,294,025 | |||||||
Less: expenses waived and reimbursed by the Adviser (see Notes B & E) | (59,261 | ) | ||||||
|
| |||||||
Net expenses | 5,234,764 | |||||||
|
| |||||||
Net investment income | 8,822,899 | |||||||
|
|
See notes to consolidated financial statements.
| 48 | AB ALL MARKET REAL RETURN PORTFOLIO | abfunds.com | |
CONSOLIDATED STATEMENT OF OPERATIONS (continued)
| Realized and Unrealized Gain (Loss) on Investment and Foreign Currency Transactions | ||||||||
Net realized gain (loss) on: | ||||||||
Investment transactions | $ | (18,606,962 | ) | |||||
Forward currency exchange contracts | 7,250,897 | |||||||
Futures | (26,449,177 | ) | ||||||
Options written | (10,165,709 | ) | ||||||
Swaps | (39,254,345 | ) | ||||||
Foreign currency transactions | (945,807 | ) | ||||||
Net change in unrealized appreciation/depreciation of: | ||||||||
Investments | (133,816,375 | ) | ||||||
Forward currency exchange contracts | (2,881,061 | ) | ||||||
Futures | 7,385,765 | |||||||
Options written | (3,866,312 | ) | ||||||
Swaps | 11,751,636 | |||||||
Foreign currency denominated assets and liabilities | 4,150 | |||||||
|
| |||||||
Net loss on investment and foreign currency transactions | (209,593,300 | ) | ||||||
|
| |||||||
Net Decrease in Net Assets from Operations | $ | (200,770,401 | ) | |||||
|
|
See notes to consolidated financial statements.
| abfunds.com | AB ALL MARKET REAL RETURN PORTFOLIO | 49 | |
CONSOLIDATED STATEMENT OF CHANGES IN NET ASSETS
| Six Months Ended April 30, 2020 (unaudited) | Year Ended October 31, 2019 | |||||||
| Increase (Decrease) in Net Assets from Operations | ||||||||
Net investment income | $ | 8,822,899 | $ | 22,137,750 | ||||
Net realized loss on investment and foreign currency transactions | (88,171,103 | ) | (59,892,278 | ) | ||||
Net change in unrealized appreciation/depreciation of investments and foreign currency denominated assets and liabilities | (121,422,197 | ) | 74,481,928 | |||||
|
|
|
| |||||
Net increase (decrease) in net assets from operations | (200,770,401 | ) | 36,727,400 | |||||
| Distributions to Shareholders | ||||||||
Class A | (167,388 | ) | (155,536 | ) | ||||
Class C | (4,157 | ) | (4,520 | ) | ||||
Advisor Class | (343,095 | ) | (407,794 | ) | ||||
Class R | (3,960 | ) | (2,749 | ) | ||||
Class K | (34,127 | ) | (33,957 | ) | ||||
Class I | (500,083 | ) | (296,068 | ) | ||||
Class 1 | (11,399,122 | ) | (10,161,406 | ) | ||||
Class 2 | (184 | ) | (157 | ) | ||||
Class Z | (10,352,467 | ) | (13,581,524 | ) | ||||
| Capital Stock Transactions | ||||||||
Net decrease | (18,226,130 | ) | (569,837,468 | ) | ||||
|
|
|
| |||||
Total decrease | (241,801,114 | ) | (557,753,779 | ) | ||||
| Net Assets | ||||||||
Beginning of period | 1,151,699,842 | 1,709,453,621 | ||||||
|
|
|
| |||||
End of period | $ | 909,898,728 | $ | 1,151,699,842 | ||||
|
|
|
| |||||
See notes to consolidated financial statements.
| 50 | AB ALL MARKET REAL RETURN PORTFOLIO | abfunds.com | |
NOTES TO CONSOLIDATED FINANCIAL STATEMENTS
April 30, 2020 (unaudited)
NOTE A
Significant Accounting Policies
AB Bond Fund, Inc. (the “Company”) is registered under the Investment Company Act of 1940 as an open-end management investment company. The Company, which is a Maryland corporation, operates as a series company comprised of ten portfolios currently in operation. Each portfolio is considered to be a separate entity for financial reporting and tax purposes. This report relates only to the AB All Market Real Return Portfolio (the “Fund”), a non-diversified portfolio. As part of the Fund’s investment strategy, the Fund seeks to gain exposure to commodities and commodities-related instruments and derivatives primarily through investments in AllianceBernstein Cayman Inflation Strategy, Ltd., a wholly-owned subsidiary of the Fund organized under the laws of the Cayman Islands (the “Subsidiary”). The Fund is the sole shareholder of the Subsidiary and it is intended that the Fund will remain the sole shareholder and will continue to control the Subsidiary. Under the Articles of Association of the Subsidiary, shares issued by the Subsidiary confer upon a shareholder the right to receive notice of, to attend and to vote at general meetings of the Subsidiary and shall confer upon the shareholder rights in a winding-up or repayment of capital and the right to participate in the profits or assets of the Subsidiary. As of April 30, 2020, consolidated net assets of the Fund were $909,898,728, of which $149,651,307, or 16%, represented the Fund’s ownership of all issued shares and voting rights of the Subsidiary. This report presents the consolidated financial statements of the Fund and the Subsidiary. All intercompany transactions and balances have been eliminated in consolidation. The Fund has authorized the issuance of Class A, Class B, Class C, Advisor Class, Class R, Class K, Class I, Class 1, Class 2, Class Z, and Class T shares. Class B and Class T shares have not been issued. Class 1 shares are sold only to the private clients of Sanford C. Bernstein & Co. LLC by its registered representatives. As of April 30, 2020, AllianceBernstein L.P. (the “Adviser”), was the sole shareholder of Class 2 shares. Class A shares are sold with a front-end sales charge of up to 4.25% for purchases not exceeding $1,000,000. With respect to purchases of $1,000,000 or more, Class A shares redeemed within one year of purchase may be subject to a contingent deferred sales charge of 1%. Class C shares are subject to a contingent deferred sales charge of 1% on redemptions made within the first year after purchase, and 0% after the first year of purchase. Class C shares will automatically convert to Class A shares ten years after the end of the calendar month of purchase. Class R, Class K, Class 1, and Class Z shares are sold without an initial or contingent deferred sales charge. Advisor Class, Class I, and Class 2 shares are sold without an initial or contingent deferred sales charge and are not subject to ongoing distribution expenses. All eleven classes of shares have identical voting, dividend, liquidation and other
| abfunds.com | AB ALL MARKET REAL RETURN PORTFOLIO | 51 | |
NOTES TO CONSOLIDATED FINANCIAL STATEMENTS (continued)
rights, except that the classes bear different distribution and transfer agency expenses. Each class has exclusive voting rights with respect to its distribution plan. The consolidated financial statements have been prepared in conformity with U.S. generally accepted accounting principles (“U.S. GAAP”) which require management to make certain estimates and assumptions that affect the reported amounts of assets and liabilities in the consolidated financial statements and amounts of income and expenses during the reporting period. Actual results could differ from those estimates. The Fund is an investment company under U.S. GAAP and follows the accounting and reporting guidance applicable to investment companies. The following is a summary of significant accounting policies followed by the Fund.
1. Security Valuation
Portfolio securities are valued at their current market value determined on the basis of market quotations or, if market quotations are not readily available or are deemed unreliable, at “fair value” as determined in accordance with procedures established by and under the general supervision of the Company’s Board of Directors (the “Board”).
In general, the market values of securities which are readily available and deemed reliable are determined as follows: securities listed on a national securities exchange (other than securities listed on the NASDAQ Stock Market, Inc. (“NASDAQ”)) or on a foreign securities exchange are valued at the last sale price at the close of the exchange or foreign securities exchange. If there has been no sale on such day, the securities are valued at the last traded price from the previous day. Securities listed on more than one exchange are valued by reference to the principal exchange on which the securities are traded; securities listed only on NASDAQ are valued in accordance with the NASDAQ Official Closing Price; listed or over the counter (“OTC”) market put or call options are valued at the mid level between the current bid and ask prices. If either a current bid or current ask price is unavailable, the Adviser will have discretion to determine the best valuation (e.g., last trade price in the case of listed options); open futures are valued using the closing settlement price or, in the absence of such a price, the most recent quoted bid price. If there are no quotations available for the day of valuation, the last available closing settlement price is used; U.S. Government securities and any other debt instruments having 60 days or less remaining until maturity are generally valued at market by an independent pricing vendor, if a market price is available. If a market price is not available, the securities are valued at amortized cost. This methodology is commonly used for short term securities that have an original maturity of 60 days or less, as well as short term securities that had an original term to maturity that exceeded 60 days. In instances when amortized cost is utilized, the Valuation Committee (the “Committee”) must
| 52 | AB ALL MARKET REAL RETURN PORTFOLIO | abfunds.com | |
NOTES TO CONSOLIDATED FINANCIAL STATEMENTS (continued)
reasonably conclude that the utilization of amortized cost is approximately the same as the fair value of the security. Such factors the Committee will consider include, but are not limited to, an impairment of the creditworthiness of the issuer or material changes in interest rates. Fixed-income securities, including mortgage-backed and asset-backed securities, may be valued on the basis of prices provided by a pricing service or at a price obtained from one or more of the major broker-dealers. In cases where broker-dealer quotes are obtained, the Adviser may establish procedures whereby changes in market yields or spreads are used to adjust, on a daily basis, a recently obtained quoted price on a security. Swaps and other derivatives are valued daily, primarily using independent pricing services, independent pricing models using market inputs, as well as third party broker-dealers or counterparties. Open end mutual funds are valued at the closing net asset value per share, while exchange traded funds are valued at the closing market price per share.
Securities for which market quotations are not readily available (including restricted securities) or are deemed unreliable are valued at fair value as deemed appropriate by the Adviser. Factors considered in making this determination may include, but are not limited to, information obtained by contacting the issuer, analysts, analysis of the issuer’s financial statements or other available documents. In addition, the Fund may use fair value pricing for securities primarily traded in non-U.S. markets because most foreign markets close well before the Fund values its securities at 4:00 p.m., Eastern Time. The earlier close of these foreign markets gives rise to the possibility that significant events, including broad market moves, may have occurred in the interim and may materially affect the value of those securities. To account for this, the Fund generally values many of its foreign equity securities using fair value prices based on third party vendor modeling tools to the extent available.
2. Fair Value Measurements
In accordance with U.S. GAAP regarding fair value measurements, fair value is defined as the price that the Fund would receive to sell an asset or pay to transfer a liability in an orderly transaction between market participants at the measurement date. U.S. GAAP establishes a framework for measuring fair value, and a three-level hierarchy for fair value measurements based upon the transparency of inputs to the valuation of an asset or liability (including those valued based on their market values as described in Note A.1 above). Inputs may be observable or unobservable and refer broadly to the assumptions that market participants would use in pricing the asset or liability. Observable inputs reflect the assumptions market participants would use in pricing the asset or liability based on market data obtained from sources independent of the Fund. Unobservable inputs reflect the Fund’s own assumptions about the
| abfunds.com | AB ALL MARKET REAL RETURN PORTFOLIO | 53 | |
NOTES TO CONSOLIDATED FINANCIAL STATEMENTS (continued)
assumptions that market participants would use in pricing the asset or liability based on the best information available in the circumstances. Each investment is assigned a level based upon the observability of the inputs which are significant to the overall valuation. The three-tier hierarchy of inputs is summarized below.
| • | Level 1—quoted prices in active markets for identical investments |
| • | Level 2—other significant observable inputs (including quoted prices for similar investments, interest rates, prepayment speeds, credit risk, etc.) |
| • | Level 3—significant unobservable inputs (including the Fund’s own assumptions in determining the fair value of investments) |
The fair value of debt instruments, such as bonds, and over-the-counter derivatives is generally based on market price quotations, recently executed market transactions (where observable) or industry recognized modeling techniques and are generally classified as Level 2. Pricing vendor inputs to Level 2 valuations may include quoted prices for similar investments in active markets, interest rate curves, coupon rates, currency rates, yield curves, option adjusted spreads, default rates, credit spreads and other unique security features in order to estimate the relevant cash flows which are then discounted to calculate fair values. If these inputs are unobservable and significant to the fair value, these investments will be classified as Level 3.
Where readily available market prices or relevant bid prices are not available for certain equity investments, such investments may be valued based on similar publicly traded investments, movements in relevant indices since last available prices or based upon underlying company fundamentals and comparable company data (such as multiples to earnings or other multiples to equity). Where an investment is valued using an observable input, such as another publicly traded security, the investment will be classified as Level 2. If management determines that an adjustment is appropriate based on restrictions on resale, illiquidity or uncertainty, and such adjustment is a significant component of the valuation, the investment will be classified as Level 3. An investment will also be classified as Level 3 where management uses company fundamentals and other significant inputs to determine the valuation.
Options are valued using market-based inputs to models, broker or dealer quotations, or alternative pricing sources with reasonable levels of price transparency, where such inputs and models are available. Alternatively, the values may be obtained through unobservable management determined inputs and/or management’s proprietary models. Where models are used, the selection of a particular model to value an option
| 54 | AB ALL MARKET REAL RETURN PORTFOLIO | abfunds.com | |
NOTES TO CONSOLIDATED FINANCIAL STATEMENTS (continued)
depends upon the contractual terms of, and specific risks inherent in, the option as well as the availability of pricing information in the market. Valuation models require a variety of inputs, including contractual terms, market prices, measures of volatility and correlations of such inputs. Exchange traded options generally will be classified as Level 2. For options that do not trade on exchange but trade in liquid markets, inputs can generally be verified and model selection does not involve significant management judgment. Options are classified within Level 2 on the fair value hierarchy when all of the significant inputs can be corroborated to market evidence. Otherwise such instruments are classified as Level 3.
Other fixed income investments, including non-U.S. government and corporate debt, are generally valued using quoted market prices, if available, which are typically impacted by current interest rates, maturity dates and any perceived credit risk of the issuer. Additionally, in the absence of quoted market prices, these inputs are used by pricing vendors to derive a valuation based upon industry or proprietary models which incorporate issuer specific data with relevant yield/spread comparisons with more widely quoted bonds with similar key characteristics. Those investments for which there are observable inputs are classified as Level 2. Where the inputs are not observable, the investments are classified as Level 3.
The following table summarizes the valuation of the Fund’s investments by the above fair value hierarchy levels as of April 30, 2020:
Investments in Securities: | Level 1 | Level 2 | Level 3 | Total | ||||||||||||
Assets: | ||||||||||||||||
Common Stocks: | ||||||||||||||||
Real Estate | $ | 166,904,066 | $ | 147,790,312 | $ | – 0 | – | $ | 314,694,378 | |||||||
Energy | 29,191,843 | 49,067,758 | – 0 | – | 78,259,601 | |||||||||||
Materials | 19,714,076 | 32,659,716 | – 0 | – | 52,373,792 | |||||||||||
Software & Services | 17,128,756 | 664,599 | – 0 | – | 17,793,355 | |||||||||||
Pharmaceuticals & Biotechnology | 10,619,302 | 4,782,371 | – 0 | – | 15,401,673 | |||||||||||
Food Beverage & Tobacco | 7,932,223 | 4,493,993 | – 0 | – | 12,426,216 | |||||||||||
Utilities | 3,697,440 | 6,488,622 | – 0 | – | 10,186,062 | |||||||||||
Media & Entertainment | 8,731,016 | 1,091,854 | – 0 | – | 9,822,870 | |||||||||||
Retailing | 6,310,331 | 1,560,480 | – 0 | – | 7,870,811 | |||||||||||
Semiconductors & Semiconductor Equipment | 5,108,120 | 2,477,328 | – 0 | – | 7,585,448 | |||||||||||
Consumer Durables & Apparel | 4,569,272 | 2,588,959 | 0 | (a) | 7,158,231 | |||||||||||
Diversified Financials | 4,770,196 | 2,024,240 | – 0 | – | 6,794,436 | |||||||||||
Transportation | 512,285 | 5,433,790 | – 0 | – | 5,946,075 | |||||||||||
Health Care Equipment & Services | 4,790,592 | 1,032,792 | – 0 | – | 5,823,384 | |||||||||||
Telecommunication Services | 2,664,500 | 1,357,587 | – 0 | – | 4,022,087 | |||||||||||
Capital Goods | 1,325,592 | 2,301,341 | – 0 | – | 3,626,933 | |||||||||||
Commercial & Professional Services | 2,708,766 | 875,475 | – 0 | – | 3,584,241 | |||||||||||
| abfunds.com | AB ALL MARKET REAL RETURN PORTFOLIO | 55 | |
NOTES TO CONSOLIDATED FINANCIAL STATEMENTS (continued)
Investments in Securities: | Level 1 | Level 2 | Level 3 | Total | ||||||||||||
Technology Hardware & Equipment | $ | 3,089,013 | $ | 388,801 | $ | – 0 | – | $ | 3,477,814 | |||||||
Banks | 1,385,282 | 1,823,673 | – 0 | – | 3,208,955 | |||||||||||
Insurance | 1,611,623 | 825,657 | – 0 | – | 2,437,280 | |||||||||||
Food & Staples Retailing | 481,216 | 1,571,885 | – 0 | – | 2,053,101 | |||||||||||
Consumer Services | 1,462,589 | 420,392 | – 0 | – | 1,882,981 | |||||||||||
Household & Personal Products | 285,823 | 805,286 | – 0 | – | 1,091,109 | |||||||||||
Automobiles & Components | – 0 | – | 497,945 | – 0 | – | 497,945 | ||||||||||
Inflation-Linked Securities | – 0 | – | 74,797,693 | – 0 | – | 74,797,693 | ||||||||||
Investment Companies | 66,438,444 | – 0 | – | – 0 | – | 66,438,444 | ||||||||||
Options Purchased—Puts | – 0 | – | 3,638,796 | – 0 | – | 3,638,796 | ||||||||||
Short-Term Investments | 135,564,296 | – 0 | – | – 0 | – | 135,564,296 | ||||||||||
Investments of Cash Collateral for Securities Loaned in Affiliated Money Market Fund | 7,958,536 | – 0 | – | – 0 | – | 7,958,536 | ||||||||||
|
|
|
|
|
|
|
| |||||||||
Total Investments in Securities | 514,955,198 | 351,461,345 | (b) | 0 | 866,416,543 | |||||||||||
Other Financial Instruments(c) : | ||||||||||||||||
Assets: | ||||||||||||||||
Futures | 16,221,911 | – 0 | – | – 0 | – | 16,221,911 | (d) | |||||||||
Forward Currency Exchange Contracts | – 0 | – | 8,003,557 | – 0 | – | 8,003,557 | ||||||||||
Total Return Swaps | – 0 | – | 11,904,990 | – 0 | – | 11,904,990 | ||||||||||
Variance Swaps | – 0 | – | 1,054,972 | – 0 | – | 1,054,972 | ||||||||||
Liabilities: | ||||||||||||||||
Futures | (7,681,729 | ) | – 0 | – | – 0 | – | (7,681,729 | )(d) | ||||||||
Forward Currency Exchange Contracts | – 0 | – | (10,666,266 | ) | – 0 | – | (10,666,266 | ) | ||||||||
Currency Options Written | – 0 | – | (3,638,796 | ) | – 0 | – | (3,638,796 | ) | ||||||||
Inflation (CPI) Swaps | – 0 | – | (7,848,439 | ) | – 0 | – | (7,848,439 | ) | ||||||||
Total Return Swaps | – 0 | – | (6,712,254 | ) | – 0 | – | (6,712,254 | ) | ||||||||
|
|
|
|
|
|
|
| |||||||||
Total | $ | 523,495,380 | $ | 343,559,109 | $ | – 0 | – | $ | 867,054,489 | |||||||
|
|
|
|
|
|
|
| |||||||||
| (a) | The Fund held securities with zero market value at period end. |
| (b) | A significant portion of the Fund’s foreign equity investments are categorized as Level 2 investments since they are valued using fair value prices based on third party vendor modeling tools to the extent available, see Note A.1. |
| (c) | Other financial instruments are derivative instruments, such as futures, forwards and swaps, which are valued at the unrealized appreciation/(depreciation) on the instrument. Other financial instruments may also include swaps with upfront premiums, options written and swaptions written which are valued at market value. |
| (d) | Only variation margin receivable/(payable) at period end is reported within the statement of assets and liabilities. This amount reflects cumulative unrealized appreciation/(depreciation) on futures and centrally cleared swaps as reported in the portfolio of investments. Where applicable, centrally cleared swaps with upfront premiums are presented here at market value. |
3. Currency Translation
Assets and liabilities denominated in foreign currencies and commitments under forward currency exchange contracts are translated into U.S. dollars at the mean of the quoted bid and ask prices of such currencies against the U.S. dollar. Purchases and sales of portfolio securities are translated into U.S. dollars at the rates of exchange prevailing when such securities
| 56 | AB ALL MARKET REAL RETURN PORTFOLIO | abfunds.com | |
NOTES TO CONSOLIDATED FINANCIAL STATEMENTS (continued)
were acquired or sold. Income and expenses are translated into U.S. dollars at rates of exchange prevailing when accrued.
Net realized gain or loss on foreign currency transactions represents foreign exchange gains and losses from sales and maturities of foreign fixed income investments, holding of foreign currencies, currency gains or losses realized between the trade and settlement dates on foreign investment transactions, and the difference between the amounts of dividends, interest and foreign withholding taxes recorded on the Fund’s books and the U.S. dollar equivalent amounts actually received or paid. Net unrealized currency gains and losses from valuing foreign currency denominated assets and liabilities at period end exchange rates are reflected as a component of net unrealized appreciation or depreciation of foreign currency denominated assets and liabilities.
4. Taxes
It is the Fund’s policy to meet the requirements of the Internal Revenue Code applicable to regulated investment companies and to distribute all of its investment company taxable income and net realized gains, if any, to shareholders. Therefore, no provisions for federal income or excise taxes are required. The Fund may be subject to taxes imposed by countries in which it invests. Such taxes are generally based on income and/or capital gains earned or repatriated. Taxes are accrued and applied to net investment income, net realized gains and net unrealized appreciation/depreciation as such income and/or gains are earned.
If, during a taxable year, the Subsidiary’s taxable losses (and other deductible items) exceed its income and gains, the net loss will not pass through to the Fund as a deductible amount for Federal income tax purposes. Note that the loss from the Subsidiary’s contemplated activities also cannot be carried forward to reduce future Subsidiary’s income in subsequent years. However, if the Subsidiary’s taxable gains exceed its losses and other deductible items during a taxable year, the net gain will pass through to the Fund as income for Federal income tax purposes.
In accordance with U.S. GAAP requirements regarding accounting for uncertainties in income taxes, management has analyzed the Fund’s tax positions taken or expected to be taken on federal and state income tax returns for all open tax years (the current and the prior three tax years) and has concluded that no provision for income tax is required in the Fund’s consolidated financial statements.
5. Investment Income and Investment Transactions
Dividend income is recorded on the ex-dividend date or as soon as the Fund is informed of the dividend. Interest income is accrued daily.
| abfunds.com | AB ALL MARKET REAL RETURN PORTFOLIO | 57 | |
NOTES TO CONSOLIDATED FINANCIAL STATEMENTS (continued)
Investment transactions are accounted for on the date the securities are purchased or sold. Investment gains or losses are determined on the identified cost basis. The Fund amortizes premiums and accretes discounts as adjustments to interest income.
6. Class Allocations
All income earned and expenses incurred by the Fund are borne on a pro-rata basis by each outstanding class of shares, based on the proportionate interest in the Fund represented by the net assets of such class, except for class specific expenses which are allocated to the respective class. Expenses of the Company are charged proportionately to each fund or based on other appropriate methods. Realized and unrealized gains and losses are allocated among the various share classes based on respective net assets.
7. Dividends and Distributions
Dividends and distributions to shareholders, if any, are recorded on the ex-dividend date. Income dividends and capital gains distributions are determined in accordance with federal tax regulations and may differ from those determined in accordance with U.S. GAAP. To the extent these differences are permanent, such amounts are reclassified within the capital accounts based on their federal tax basis treatment; temporary differences do not require such reclassification.
NOTE B
Advisory Fee and Other Transactions with Affiliates
Under the terms of the investment advisory agreement, the Fund pays the Adviser an advisory fee at an annual rate of .75% of the Fund’s average daily net assets. The Adviser agreed to waive its fees and bear certain expenses to the extent necessary to limit total operating expenses on an annual basis (the “Expense Caps”) to 1.30%, 2.05%, 1.05%, 1.55%, 1.30%, 1.05%, 1.30%, 1.05% and 1.05% of daily average net assets for Class A, Class C, Advisor Class, Class R, Class K, Class I, Class 1, Class 2 and Class Z shares, respectively. This fee waiver and/or expense reimbursement agreement will remain in effect until January 31, 2021. For the six months ended April 30, 2020, such reimbursement amounted to $3,251.
The Subsidiary has entered into a separate agreement with the Adviser for the management of the Subsidiary’s portfolio. The Adviser receives no compensation from the Subsidiary for its services under the agreement.
Pursuant to the investment advisory agreement, the Fund may reimburse the Adviser for certain legal and accounting services provided to the Fund by the Adviser. For the six months ended April 30, 2020, the reimbursement for such services amounted to $41,197.
| 58 | AB ALL MARKET REAL RETURN PORTFOLIO | abfunds.com | |
NOTES TO CONSOLIDATED FINANCIAL STATEMENTS (continued)
The Fund compensates AllianceBernstein Investor Services, Inc. (“ABIS”), a wholly-owned subsidiary of the Adviser, under a Transfer Agency Agreement for providing personnel and facilities to perform transfer agency services for the Fund. ABIS may make payments to intermediaries that provide omnibus account services, sub-accounting services and/or networking services. Such compensation retained by ABIS amounted to $113,653 for the six months ended April 30, 2020.
AllianceBernstein Investments, Inc. (the “Distributor”), a wholly-owned subsidiary of the Adviser, serves as the distributor of the Fund’s shares. The Distributor has advised the Fund that it has retained front-end sales charges of $128 from the sale of Class A shares and received $1 and $0 in contingent deferred sales charges imposed upon redemptions by shareholders of Class A and Class C shares, respectively, for the six months ended April 30, 2020.
The Fund may invest in AB Government Money Market Portfolio (the “Government Money Market Portfolio”) which has a contractual annual advisory fee rate of .20% of the portfolio’s average daily net assets and bears its own expenses. The Adviser has contractually agreed to waive .10% of the advisory fee of Government Money Market Portfolio (resulting in a net advisory fee of .10%) until August 31, 2020. In connection with the investment by the Fund in Government Money Market Portfolio, the Adviser has contractually agreed to waive its advisory fee from the Fund in an amount equal to the Fund’s pro rata share of the effective advisory fee of Government Money Market Portfolio, as borne indirectly by the Fund as an acquired fund fee and expense. For the six months ended April 30, 2020, such waiver amounted to $54,950.
A summary of the Fund’s transactions in AB mutual funds for the six months ended April 30, 2020 is as follows:
Fund | Market Value 10/31/19 (000) | Purchases at Cost (000) | Sales Proceeds (000) | Market Value 4/30/20 (000) | Dividend Income (000) | |||||||||||||||
Government Money Market Portfolio | $ | 22,320 | $ | 887,878 | $ | 774,634 | $ | 135,564 | $ | 643 | ||||||||||
Government Money Market Portfolio* | 9,974 | 134,643 | 136,658 | 7,959 | 23 | |||||||||||||||
|
|
|
| |||||||||||||||||
Total | $ | 143,523 | $ | 666 | ||||||||||||||||
|
|
|
| |||||||||||||||||
| * | Investments of cash collateral for securities lending transactions (see Note E). |
During the second quarter of 2018, AXA S.A. (“AXA”), a French holding company for the AXA Group, completed the sale of a minority stake in its
| abfunds.com | AB ALL MARKET REAL RETURN PORTFOLIO | 59 | |
NOTES TO CONSOLIDATED FINANCIAL STATEMENTS (continued)
subsidiary, AXA Equitable Holdings, Inc. (now named Equitable Holdings, Inc.)(“Equitable”), through an initial public offering. Equitable is the holding company for a diverse group of financial services companies, including an approximately 64.9% economic interest in the Adviser and a 100% interest in AllianceBernstein Corporation, the general partner of the Adviser. Since the initial sale, AXA has completed additional offerings, most recently during the fourth quarter of 2019. As a result, AXA currently owns less than 10% of the outstanding shares of common stock of Equitable, and no longer owns a controlling interest in Equitable. AXA previously announced its intention to sell its entire interest in Equitable over time, subject to market conditions and other factors (the “Plan”). Most of AXA’s remaining Equitable shares are to be delivered on redemption of AXA bonds mandatorily exchangeable into Equitable shares and maturing in May 2021. AXA retains sole discretion to determine the timing of any future sales of its remaining shares of Equitable common stock.
Sales under the Plan that were completed on November 13, 2019 resulted in the indirect transfer of a “controlling block” of voting securities of the Adviser (a “Change of Control Event”) and may have been deemed to have been an “assignment” causing a termination of the Fund’s investment advisory and administration agreements. In order to ensure that investment advisory and administration services could continue uninterrupted in the event of a Change of Control Event, the Board previously approved new investment advisory and administration agreements with the Adviser, and shareholders of the Fund subsequently approved the new investment advisory agreement. These agreements became effective on November 13, 2019.
NOTE C
Distribution Services Agreement
The Fund has adopted a Distribution Services Agreement (the “Agreement”) pursuant to Rule 12b-1 under the Investment Company Act of 1940. Under the Agreement, the Fund pays distribution and servicing fees to AllianceBernstein Investments, Inc. (the “Distributor”) at an annual rate of up to .30% of the Fund’s average daily net assets attributable to Class A shares, 1% of the Fund’s average daily net assets attributable to Class C shares, .50% of the Fund’s average daily net assets attributable to Class R shares, .25% of the Fund’s average daily net assets attributable to Class K shares and .25% of the Fund’s average daily net assets attributable to Class 1 shares. There are no distribution and servicing fees on the Advisor Class, Class I, Class 2 and Class Z shares. Payments under the Plan in respect of Class A shares are currently limited to an annual rate of .25% of Class A shares’ average daily net assets. The fees are accrued daily and paid monthly. The Agreement provides that the Distributor will use such payments in their entirety for distribution assistance and promotional activities. Since the commencement of the Fund’s operations, the
| 60 | AB ALL MARKET REAL RETURN PORTFOLIO | abfunds.com | |
NOTES TO CONSOLIDATED FINANCIAL STATEMENTS (continued)
Distributor has incurred expenses in excess of the distribution costs reimbursed by the Fund in the amounts of $159,196, $16,502, $19,773 and $1,950,278 for Class C, Class R, Class K and Class 1 shares, respectively. While such costs may be recovered from the Fund in future periods so long as the Agreement is in effect, the rate of the distribution and servicing fees payable under the Agreement may not be increased without a shareholder vote. In accordance with the Agreement, there is no provision for recovery of unreimbursed distribution costs incurred by the Distributor beyond the current fiscal year for Class A shares. The Agreement also provides that the Adviser may use its own resources to finance the distribution of the Fund’s shares.
NOTE D
Investment Transactions
Purchases and sales of investment securities (excluding short-term investments) for the six months ended April 30, 2020 were as follows:
| Purchases | Sales | |||||||
Investment securities (excluding | $ | 423,199,394 | $ | 520,567,604 | ||||
U.S. government securities | – 0 | – | – 0 | – | ||||
The cost of investments for federal income tax purposes was substantially the same as the cost for financial reporting purposes. Accordingly, gross unrealized appreciation and unrealized depreciation are as follows:
Gross unrealized appreciation | $ | 83,638,031 | ||
Gross unrealized depreciation | (172,139,821 | ) | ||
|
| |||
Net unrealized depreciation | $ | (88,501,790 | ) | |
|
|
1. Derivative Financial Instruments
The Fund may use derivatives in an effort to earn income and enhance returns, to replace more traditional direct investments, to obtain exposure to otherwise inaccessible markets (collectively, “investment purposes”), or to hedge or adjust the risk profile of its portfolio.
The principal types of derivatives utilized by the Fund, as well as the methods in which they may be used are:
| • | Futures |
The Fund may buy or sell futures for investment purposes or for the purpose of hedging its portfolio against adverse effects of potential movements in the market. The Fund bears the market risk that arises from changes in the value of these instruments and the imperfect correlation between movements in the price of the futures and
| abfunds.com | AB ALL MARKET REAL RETURN PORTFOLIO | 61 | |
NOTES TO CONSOLIDATED FINANCIAL STATEMENTS (continued)
movements in the price of the assets, reference rates or indices which they are designed to track. Among other things, the Fund may purchase or sell futures for foreign currencies or options thereon for non-hedging purposes as a means of making direct investment in foreign currencies, as described below under “Currency Transactions”.
At the time the Fund enters into futures, the Fund deposits and maintains as collateral an initial margin with the broker, as required by the exchange on which the transaction is effected. Such amount is shown as cash collateral due from broker on the consolidated statement of assets and liabilities. Pursuant to the contract, the Fund agrees to receive from or pay to the broker an amount of cash equal to the daily fluctuation in the value of the contract. Such receipts or payments are known as variation margin and are recorded by the Fund as unrealized gains or losses. Risks may arise from the potential inability of a counterparty to meet the terms of the contract. The credit/counterparty risk for exchange-traded futures is generally less than privately negotiated futures, since the clearinghouse, which is the issuer or counterparty to each exchange-traded future, has robust risk mitigation standards, including the requirement to provide initial and variation margin. When the contract is closed, the Fund records a realized gain or loss equal to the difference between the value of the contract at the time it was opened and the time it was closed.
Use of long futures subjects the Fund to risk of loss in excess of the amounts shown on the consolidated statement of assets and liabilities, up to the notional value of the futures. Use of short futures subjects the Fund to unlimited risk of loss. Under some circumstances, futures exchanges may establish daily limits on the amount that the price of futures can vary from the previous day’s settlement price, which could effectively prevent liquidation of unfavorable positions.
During the six months ended April 30, 2020, the Fund held futures for hedging and non-hedging purposes.
| • | Forward Currency Exchange Contracts |
The Fund may enter into forward currency exchange contracts in order to hedge its exposure to changes in foreign currency exchange rates on its foreign portfolio holdings, to hedge certain firm purchase and sale commitments denominated in foreign currencies and for non-hedging purposes as a means of making direct investments in foreign currencies, as described below under “Currency Transactions”.
A forward currency exchange contract is a commitment to purchase or sell a foreign currency at a future date at a negotiated forward rate. The gain or loss arising from the difference between the original contract and the closing of such contract would be included in net
| 62 | AB ALL MARKET REAL RETURN PORTFOLIO | abfunds.com | |
NOTES TO CONSOLIDATED FINANCIAL STATEMENTS (continued)
realized gain or loss on forward currency exchange contracts. Fluctuations in the value of open forward currency exchange contracts are recorded for financial reporting purposes as unrealized appreciation and/or depreciation by the Fund. Risks may arise from the potential inability of a counterparty to meet the terms of a contract and from unanticipated movements in the value of a foreign currency relative to the U.S. dollar.
During the six months ended April 30, 2020, the Fund held forward currency exchange contracts for hedging and non-hedging purposes.
| • | Option Transactions |
For hedging and investment purposes, the Fund may purchase and write (sell) put and call options on U.S. and foreign securities, including government securities, and foreign currencies that are traded on U.S. and foreign securities exchanges and over-the-counter markets. Among other things, the Fund may use options transactions for non-hedging purposes as a means of making direct investments in foreign currencies, as described below under “Currency Transactions” and may use options strategies involving the purchase and/or writing of various combinations of call and/or put options, for hedging and investment purposes.
The risk associated with purchasing an option is that the Fund pays a premium whether or not the option is exercised. Additionally, the Fund bears the risk of loss of the premium and change in market value should the counterparty not perform under the contract. If a put or call option purchased by the Fund were permitted to expire without being sold or exercised, its premium would represent a loss to the Fund. Put and call options purchased are accounted for in the same manner as portfolio securities. The cost of securities acquired through the exercise of call options is increased by premiums paid. The proceeds from securities sold through the exercise of put options are decreased by the premiums paid.
When the Fund writes an option, the premium received by the Fund is recorded as a liability and is subsequently adjusted to the current market value of the option written. The Fund’s maximum payment for written put options equates to the number of shares multiplied by the strike price. In certain circumstances maximum payout amounts may be partially offset by recovery values of the respective referenced assets and upfront premium received upon entering into the contract. Premiums received from written options which expire unexercised are recorded by the Fund on the expiration date as realized gains from options written. The difference between the premium received and the amount paid on effecting a closing purchase transaction, including brokerage commissions, is also treated as a realized gain, or if the
| abfunds.com | AB ALL MARKET REAL RETURN PORTFOLIO | 63 | |
NOTES TO CONSOLIDATED FINANCIAL STATEMENTS (continued)
premium received is less than the amount paid for the closing purchase transaction, as a realized loss. If a call option is exercised, the premium received is added to the proceeds from the sale of the underlying security or currency in determining whether the Fund has realized a gain or loss. If a put option is exercised, the premium received reduces the cost basis of the security or currency purchased by the Fund. In writing an option, the Fund bears the market risk of an unfavorable change in the price of the security or currency underlying the written option. Exercise of an option written by the Fund could result in the Fund selling or buying a security or currency at a price different from the current market value.
During the six months ended April 30, 2020, the Fund held purchased options for hedging and non-hedging purposes. During the six months ended April 30, 2020, the Fund held written options for hedging and non-hedging purposes.
| • | Swaps |
The Fund may enter into swaps to hedge its exposure to interest rates, credit risk, equity markets or currencies. The Fund may also enter into swaps for non-hedging purposes as a means of gaining market exposures, making direct investments in foreign currencies, as described below under “Currency Transactions” or in order to take a “long” or “short” position with respect to an underlying referenced asset described below under “Total Return Swaps”. A swap is an agreement that obligates two parties to exchange a series of cash flows at specified intervals based upon or calculated by reference to changes in specified prices or rates for a specified amount of an underlying asset. The payment flows are usually netted against each other, with the difference being paid by one party to the other. In addition, collateral may be pledged or received by the Fund in accordance with the terms of the respective swaps to provide value and recourse to the Fund or its counterparties in the event of default, bankruptcy or insolvency by one of the parties to the swap.
Risks may arise as a result of the failure of the counterparty to the swap to comply with the terms of the swap. The loss incurred by the failure of a counterparty is generally limited to the net interim payment to be received by the Fund, and/or the termination value at the end of the contract. Therefore, the Fund considers the creditworthiness of each counterparty to a swap in evaluating potential counterparty risk. This risk is mitigated by having a netting arrangement between the Fund and the counterparty and by the posting of collateral by the counterparty to the Fund to cover the Fund’s exposure to the counterparty. Additionally, risks may arise from unanticipated movements in interest rates or in the value of the underlying securities. The Fund accrues for the interim
| 64 | AB ALL MARKET REAL RETURN PORTFOLIO | abfunds.com | |
NOTES TO CONSOLIDATED FINANCIAL STATEMENTS (continued)
payments on swaps on a daily basis, with the net amount recorded within unrealized appreciation/depreciation of swaps on the consolidated statement of assets and liabilities, where applicable. Once the interim payments are settled in cash, the net amount is recorded as realized gain/(loss) on swaps on the consolidated statement of operations, in addition to any realized gain/(loss) recorded upon the termination of swaps. Upfront premiums paid or received for OTC swaps are recognized as cost or proceeds on the consolidated statement of assets and liabilities and are amortized on a straight line basis over the life of the contract. Amortized upfront premiums are included in net realized gain/(loss) from swaps on the consolidated statement of operations. Fluctuations in the value of swaps are recorded as a component of net change in unrealized appreciation/depreciation of swaps on the consolidated statement of operations.
Certain standardized swaps, including certain interest rate swaps and credit default swaps, are (or soon will be) subject to mandatory central clearing. Cleared swaps are transacted through futures commission merchants (“FCMs”) that are members of central clearinghouses, with the clearinghouse serving as central counterparty, similar to transactions in futures contracts. Centralized clearing will be required for additional categories of swaps on a phased-in basis based on requirements published by the Securities and Exchange Commission and Commodity Futures Trading Commission.
At the time the Fund enters into a centrally cleared swap, the Fund deposits and maintains as collateral an initial margin with the broker, as required by the clearinghouse on which the transaction is effected. Such amount is shown as cash collateral due from broker on the consolidated statement of assets and liabilities. Pursuant to the contract, the Fund agrees to receive from or pay to the broker an amount of cash equal to the daily fluctuation in the value of the contract. Such receipts or payments are known as variation margin and are recorded by the Fund as unrealized gains or losses. Risks may arise from the potential inability of a counterparty to meet the terms of the contract. The credit/counterparty risk for centrally cleared swaps is generally less than non-centrally cleared swaps, since the clearinghouse, which is the issuer or counterparty to each centrally cleared swap, has robust risk mitigation standards, including the requirement to provide initial and variation margin. When the contract is closed, the Fund records a realized gain or loss equal to the difference between the value of the contract at the time it was opened and the time it was closed.
| abfunds.com | AB ALL MARKET REAL RETURN PORTFOLIO | 65 | |
NOTES TO CONSOLIDATED FINANCIAL STATEMENTS (continued)
Inflation (CPI) Swaps:
Inflation swap agreements are contracts in which one party agrees to pay the cumulative percentage increase in a price index (the Consumer Price Index with respect to CPI swaps) over the term of the swap (with some lag on the inflation index), and the other pays a compounded fixed rate. Inflation swaps may be used to protect the net asset value, or NAV, of a Fund against an unexpected change in the rate of inflation measured by an inflation index since the value of these agreements is expected to increase if there are unexpected inflation increases.
During the six months ended April 30, 2020, the Fund held inflation (CPI) swaps for hedging and non-hedging purposes.
Total Return Swaps:
The Fund may enter into total return swaps in order to take a “long” or “short” position with respect to an underlying referenced asset. The Fund is subject to market price volatility of the underlying referenced asset. A total return swap involves commitments to pay interest in exchange for a market linked return based on a notional amount. To the extent that the total return of the security, group of securities or index underlying the transaction exceeds or falls short of the offsetting interest obligation, the Fund will receive a payment from or make a payment to the counterparty.
During the six months ended April 30, 2020, the Fund held total return swaps for hedging and non-hedging purposes.
Variance Swaps:
The Fund may enter into variance swaps to hedge equity market risk or adjust exposure to the equity markets. Variance swaps are contracts in which two parties agree to exchange cash payments based on the difference between the stated level of variance and the actual variance realized on underlying asset(s) or index(es). Actual “variance” as used here is defined as the sum of the square of the returns on the reference asset(s) or index(es) (which in effect is a measure of its “volatility”) over the length of the contract term. So the parties to a variance swap can be said to exchange actual volatility for a contractually stated rate of volatility.
During the six months ended April 30, 2020, the Fund held variance swaps for hedging and non-hedging purposes.
The Fund typically enters into International Swaps and Derivatives Association, Inc. Master Agreements (“ISDA Master Agreement”) with its OTC derivative contract counterparties in order to, among other things, reduce its credit risk to OTC counterparties. ISDA Master Agreements include
| 66 | AB ALL MARKET REAL RETURN PORTFOLIO | abfunds.com | |
NOTES TO CONSOLIDATED FINANCIAL STATEMENTS (continued)
provisions for general obligations, representations, collateral and events of default or termination. Under an ISDA Master Agreement, the Fund typically may offset with the OTC counterparty certain derivative financial instruments’ payables and/or receivables with collateral held and/or posted and create one single net payment (close-out netting) in the event of default or termination. In the event of a default by an OTC counterparty, the return of collateral with market value in excess of the Fund’s net liability, held by the defaulting party, may be delayed or denied.
The Fund’s ISDA Master Agreements may contain provisions for early termination of OTC derivative transactions in the event the net assets of the Fund decline below specific levels (“net asset contingent features”). If these levels are triggered, the Fund’s OTC counterparty has the right to terminate such transaction and require the Fund to pay or receive a settlement amount in connection with the terminated transaction. If OTC derivatives were held at period end, please refer to netting arrangements by the OTC counterparty table below for additional details.
During the six months ended April 30, 2020, the Fund had entered into the following derivatives:
Asset Derivatives | Liability Derivatives | |||||||||||
Derivative Type | Consolidated | Fair Value | Consolidated | Fair Value | ||||||||
Interest rate | Receivable/Payable for variation margin on futures | $ | 535,662 | * | ||||||||
Equity | Receivable/Payable for variation margin on futures | 8,756,017 | * | Receivable/Payable for variation margin on futures | $ | 552,604 | * | |||||
Commodity | Receivable/Payable for variation margin on futures | | 6,930,232 | * | Receivable/Payable for variation margin on futures | | 7,129,125 | * | ||||
Foreign currency | Unrealized appreciation on forward currency exchange contracts | | 8,003,557 | Unrealized depreciation on forward currency exchange contracts | | 10,666,266 | ||||||
| abfunds.com | AB ALL MARKET REAL RETURN PORTFOLIO | 67 | |
NOTES TO CONSOLIDATED FINANCIAL STATEMENTS (continued)
Asset Derivatives | Liability Derivatives | |||||||||||
Derivative Type | Consolidated | Fair Value | Consolidated | Fair Value | ||||||||
Foreign exchange contracts | Investments in securities, at value | $ | 3,638,796 | |||||||||
Foreign exchange contracts | Options written, at value | $ | 3,638,796 | |||||||||
Interest rate contracts | Unrealized depreciation on inflation swaps | | 7,848,439 | |||||||||
Commodity contracts | Unrealized appreciation on total return swaps | | 8,069,337 | Unrealized depreciation on total return swaps | | 2,799,409 | ||||||
Equity contracts | Unrealized appreciation on total return swaps | 3,835,653 | Unrealized depreciation on total return swaps | 3,912,845 | ||||||||
Foreign currency contracts | Unrealized appreciation on variance swaps | | 1,054,972 | |||||||||
|
|
|
| |||||||||
Total | $ | 40,824,226 | $ | 36,547,484 | ||||||||
|
|
|
| |||||||||
| * | Only variation margin receivable/payable at period end is reported within the consolidated statement of assets and liabilities. |
This amount reflects cumulative unrealized appreciation/(depreciation) on futures and centrally cleared swaps as reported in the consolidated portfolio of investments. |
Derivative Type | Location of | Realized Gain or (Loss) on Derivatives | Change in Unrealized Appreciation or (Depreciation) | |||||||
Interest rate contracts | Net realized gain (loss) on futures; Net change in unrealized appreciation/depreciation of futures | $ | 246,479 | $ | 139,659 | |||||
Equity contracts | Net realized gain (loss) on futures; Net change in unrealized appreciation/depreciation of futures | (15,935,293 | ) | 8,448,966 | ||||||
| 68 | AB ALL MARKET REAL RETURN PORTFOLIO | abfunds.com | |
NOTES TO CONSOLIDATED FINANCIAL STATEMENTS (continued)
Derivative Type | Location of | Realized Gain or (Loss) on Derivatives | Change in Unrealized Appreciation or (Depreciation) | |||||||
Commodity contracts | Net realized gain (loss) on futures; Net change in unrealized appreciation/depreciation of futures | $ | (10,760,363 | ) | $ | (1,202,860 | ) | |||
Foreign currency contracts | Net realized gain (loss) on forward currency exchange contracts; Net change in unrealized appreciation/depreciation of forward currency exchange contracts | 7,250,897 | (2,881,061 | ) | ||||||
Foreign exchange contracts | Net realized gain (loss) on investment transactions; Net change in unrealized appreciation/depreciation of investments | – 0 | – | 2,634,575 | ||||||
Equity contracts | Net realized gain (loss) on investment transactions; Net change in unrealized appreciation/depreciation of investments | 12,953,491 | – 0 | – | ||||||
Foreign exchange contracts | Net realized gain (loss) on options written; Net change in unrealized appreciation/depreciation of options written | 742,330 | (3,866,312 | ) | ||||||
Equity contracts | Net realized gain (loss) on options written; Net change in unrealized appreciation/depreciation of options written | (10,908,039 | ) | – 0 | – | |||||
Interest rate contracts | Net realized gain (loss) on swaps; Net change in unrealized appreciation/depreciation of swaps | (5,457,553 | ) | (2,147,147 | ) | |||||
| abfunds.com | AB ALL MARKET REAL RETURN PORTFOLIO | 69 | |
NOTES TO CONSOLIDATED FINANCIAL STATEMENTS (continued)
Derivative Type | Location of | Realized Gain or (Loss) on Derivatives | Change in Unrealized Appreciation or (Depreciation) | |||||||
Commodity contracts | Net realized gain (loss) on swaps; Net change in unrealized appreciation/depreciation of swaps | $ | (50,881,540 | ) | $ | 10,297,658 | ||||
Foreign exchange contracts | Net realized gain (loss) on swaps; Net change in unrealized appreciation/depreciation of swaps | – 0 | – | 1,054,972 | ||||||
Equity contracts | Net realized gain (loss) on swaps; Net change in unrealized appreciation/depreciation of swaps | 17,084,748 | 2,546,153 | |||||||
|
|
|
| |||||||
Total | $ | (55,664,843 | ) | $ | 15,024,603 | |||||
|
|
|
| |||||||
The following table represents the average monthly volume of the Fund’s derivative transactions during the six months ended April 30, 2020:
Futures: | ||||
Average notional amount of buy contracts | $ | 188,493,484 | ||
Average notional amount of sale contracts | $ | 90,715,457 | ||
Forward Currency Exchange Contracts: | ||||
Average principal amount of buy contracts | $ | 820,941,031 | ||
Average principal amount of sale contracts | $ | 974,815,510 | ||
Purchased Options: | ||||
Average notional amount | $ | 53,346,002 | (a) | |
Options Written: | ||||
Average notional amount | $ | 138,420,692 | ||
Inflation Swaps: | ||||
Average notional amount | $ | 499,149,714 | ||
Total Return Swaps: | ||||
Average notional amount | $ | 392,973,618 | ||
Variance Swaps: | ||||
Average notional amount | $ | 1,515,690 |
| (a) | Positions were open for four months during the period. |
For financial reporting purposes, the Fund does not offset derivative assets and derivative liabilities that are subject to netting arrangements in the consolidated statement of assets and liabilities.
All OTC derivatives held at period end were subject to netting arrangements. The following table presents the Fund’s derivative assets and
| 70 | AB ALL MARKET REAL RETURN PORTFOLIO | abfunds.com | |
NOTES TO CONSOLIDATED FINANCIAL STATEMENTS (continued)
liabilities by OTC counterparty net of amounts available for offset under ISDA Master Agreements (“MA”) and net of the related collateral received/pledged by the Fund as of April 30, 2020. Exchange-traded derivatives and centrally cleared swaps are not subject to netting arrangements and as such are excluded from the table.
AB All Market Real Return Portfolio
Counterparty | Derivative Assets Subject to a MA | Derivatives Available for Offset | Cash Collateral Received* | Security Collateral Received* | Net Amount of Derivative Assets | |||||||||||||||
Australia and New Zealand Banking Group Ltd. | $ | 200,272 | $ | (20,345 | ) | $ | – 0 | – | $ | – 0 | – | $ | 179,927 | |||||||
Bank of America, NA | 1,437,118 | (1,437,118 | ) | – 0 | – | – 0 | – | – 0 | – | |||||||||||
Barclays Bank PLC | 2,035,808 | (1,878,746 | ) | – 0 | – | – 0 | – | 157,062 | ||||||||||||
BNP Paribas SA | 63,898 | (29,965 | ) | – 0 | – | – 0 | – | 33,933 | ||||||||||||
Citibank, NA | 1,155,085 | (1,155,085 | ) | – 0 | – | – 0 | – | – 0 | – | |||||||||||
Credit Suisse International | 160,947 | (160,947 | ) | – 0 | – | – 0 | – | – 0 | – | |||||||||||
Deutsche Bank AG | 525,911 | (525,911 | ) | – 0 | – | – 0 | – | – 0 | – | |||||||||||
Goldman Sachs Bank USA/Goldman Sachs International | 707,059 | (707,059 | ) | – 0 | – | – 0 | – | – 0 | – | |||||||||||
HSBC Bank USA | 294,107 | (224,101 | ) | (70,006 | ) | – 0 | – | – 0 | – | |||||||||||
JPMorgan Chase Bank, NA | 802,320 | (802,320 | ) | – 0 | – | – 0 | – | – 0 | – | |||||||||||
Morgan Stanley & Co., Inc. | 580,040 | (580,040 | ) | – 0 | – | – 0 | – | – 0 | – | |||||||||||
Natwest Markets PLC | 326,876 | (326,876 | ) | – 0 | – | – 0 | – | – 0 | – | |||||||||||
Standard Chartered Bank | 351,049 | (137,923 | ) | – 0 | – | – 0 | – | 213,126 | ||||||||||||
State Street Bank & Trust Co. | 235,078 | (159,334 | ) | – 0 | – | – 0 | – | 75,744 | ||||||||||||
UBS AG | 4,018,614 | (4,018,614 | ) | – 0 | – | – 0 | – | – 0 | – | |||||||||||
|
|
|
|
|
|
|
|
|
| |||||||||||
Total | $ | 12,894,182 | $ | (12,164,384 | ) | $ | (70,006 | ) | $ | 0 | $ | 659,792 | ^ | |||||||
|
|
|
|
|
|
|
|
|
| |||||||||||
Counterparty | Derivative Liabilities Subject to a MA | Derivatives Available for Offset | Cash Collateral Pledged* | Security Collateral Pledged* | Net Amount of Derivative Liabilities | |||||||||||||||
Australia and New Zealand Banking Group Ltd. | $ | 20,345 | $ | (20,345 | ) | $ | – 0 | – | $ | – 0 | – | $ | – 0 | – | ||||||
Bank of America, NA | 4,229,321 | (1,437,118 | ) | (2,160,000 | ) | – 0 | – | 632,203 | ||||||||||||
Barclays Bank PLC | 1,878,746 | (1,878,746 | ) | – 0 | – | – 0 | – | – 0 | – | |||||||||||
BNP Paribas SA | 29,965 | (29,965 | ) | – 0 | – | – 0 | – | – 0 | – | |||||||||||
Citibank, NA | 1,657,543 | (1,155,085 | ) | – 0 | – | – 0 | – | 502,458 | ||||||||||||
Credit Suisse International | 424,510 | (160,947 | ) | (120,000 | ) | – 0 | – | 143,563 | ||||||||||||
Deutsche Bank AG | 2,109,968 | (525,911 | ) | – 0 | – | – 0 | – | 1,584,057 | ||||||||||||
| abfunds.com | AB ALL MARKET REAL RETURN PORTFOLIO | 71 | |
NOTES TO CONSOLIDATED FINANCIAL STATEMENTS (continued)
Counterparty | Derivative Liabilities Subject to a MA | Derivatives Available for Offset | Cash Collateral Pledged* | Security Collateral Pledged* | Net Amount of Derivative Liabilities | |||||||||||||||
Goldman Sachs Bank USA/Goldman Sachs International | $ | 6,385,250 | $ | (707,059 | ) | $ | (5,480,000 | ) | $ | – 0 | – | $ | 198,191 | |||||||
HSBC Bank USA | 224,101 | (224,101 | ) | – 0 | – | – 0 | – | – 0 | – | |||||||||||
JPMorgan Chase Bank, NA | 3,257,149 | (802,320 | ) | (1,830,000 | ) | – 0 | – | 624,829 | ||||||||||||
Morgan Stanley & Co., Inc. | 890,212 | (580,040 | ) | – 0 | – | – 0 | – | 310,172 | ||||||||||||
Natwest Markets PLC | 410,437 | (326,876 | ) | – 0 | – | – 0 | – | 83,561 | ||||||||||||
Standard Chartered Bank | 137,923 | (137,923 | ) | – 0 | – | – 0 | – | – 0 | – | |||||||||||
State Street Bank & Trust Co. | 159,334 | (159,334 | ) | – 0 | – | – 0 | – | – 0 | – | |||||||||||
UBS AG | 4,082,078 | (4,018,614 | ) | (63,464 | ) | – 0 | – | – 0 | – | |||||||||||
|
|
|
|
|
|
|
|
|
| |||||||||||
Total | $ | 25,896,882 | $ | (12,164,384 | ) | $ | (9,653,464 | ) | $ | – 0 | – | $ | 4,079,034 | ^ | ||||||
|
|
|
|
|
|
|
|
|
| |||||||||||
| * | The actual collateral received/pledged may be more than the amount reported due to over-collateralization. |
| ^ | Net amount represents the net receivable/payable that would be due from/to the counterparty in the event of default or termination. The net amount from OTC financial derivative instruments can only be netted across transactions governed under the same master agreement with the same counterparty. |
AllianceBernstein Cayman Inflation Strategy, Ltd.
Counterparty | Derivative Assets Subject to a MA | Derivatives Available for Offset | Cash Collateral Received* | Security Collateral Received* | Net Amount of Derivative Assets | |||||||||||||||
JPMorgan Chase Bank, NA | $ | 8,001,202 | $ | (459,547 | ) | $ | – 0 | – | $ | (1,042,097 | ) | $ | 6,499,558 | |||||||
Merrill Lynch International | 68,135 | (68,135 | ) | – 0 | – | – 0 | – | – 0 | – | |||||||||||
|
|
|
|
|
|
|
|
|
| |||||||||||
Total | $ | 8,069,337 | $ | (527,682 | ) | $ | – 0 | – | $ | (1,042,097 | ) | $ | 6,499,558 | ^ | ||||||
|
|
|
|
|
|
|
|
|
| |||||||||||
Counterparty | Derivative Liabilities Subject to a MA | Derivatives Available for Offset | Cash Collateral Pledged* | Security Collateral Pledged* | Net Amount of Derivative Liabilities | |||||||||||||||
JPMorgan Chase Bank, NA | $ | 459,547 | $ | (459,547 | ) | $ | – 0 | – | $ | – 0 | – | $ | – 0 | – | ||||||
Merrill Lynch International | 2,148,435 | (68,135 | ) | (2,080,300 | ) | – 0 | – | – 0 | – | |||||||||||
Morgan Stanley Capital Services LLC | 360,891 | – 0 | – | (360,891 | ) | | – 0 | – | – 0 | – | ||||||||||
|
|
|
|
|
|
|
|
|
| |||||||||||
Total | $ | 2,968,873 | $ | (527,682 | ) | $ | (2,441,191 | ) | $ | – 0 | – | $ | – 0 | –^ | ||||||
|
|
|
|
|
|
|
|
|
| |||||||||||
| * | The actual collateral received/pledged may be more than the amount reported due to over-collateralization. |
| ^ | Net amount represents the net receivable/payable that would be due from/to the counterparty in the event of default or termination. The net amount from OTC financial derivative instruments can only be netted across transactions governed under the same master agreement with the same counterparty. |
| 72 | AB ALL MARKET REAL RETURN PORTFOLIO | abfunds.com | |
NOTES TO CONSOLIDATED FINANCIAL STATEMENTS (continued)
2. Currency Transactions
The Fund may invest in non-U.S. Dollar-denominated securities on a currency hedged or unhedged basis. The Fund may seek investment opportunities by taking long or short positions in currencies through the use of currency-related derivatives, including forward currency exchange contracts, futures and options on futures, swaps, and other options. The Fund may enter into transactions for investment opportunities when it anticipates that a foreign currency will appreciate or depreciate in value but securities denominated in that currency are not held by the Fund and do not present attractive investment opportunities. Such transactions may also be used when the Adviser believes that it may be more efficient than a direct investment in a foreign currency-denominated security. The Fund may also conduct currency exchange contracts on a spot basis (i.e., for cash at the spot rate prevailing in the currency exchange market for buying or selling currencies).
NOTE E
Securities Lending
The Fund may enter into securities lending transactions. Under the Fund’s securities lending program, all loans of securities will be collateralized continually by cash collateral and/or non-cash collateral. Non-cash collateral will include only securities issued or guaranteed by the U.S. government or its agencies or instrumentalities. The Fund cannot sell or repledge any non-cash collateral, such collateral will not be reflected in the portfolio of investments. If a loan is collateralized by cash, the Fund will be compensated for the loan from a portion of the net return from the income earned on cash collateral after a rebate is paid to the borrower (in some cases, this rebate may be a “negative rebate” or fee paid by the borrower to the Fund in connection with the loan), and payments are made for fees of the securities lending agent and for certain other administrative expenses. If the Fund receives non-cash collateral, the Fund will receive a fee from the borrower generally equal to a negotiated percentage of the market value of the loaned securities. The Fund will have the right to call a loan and obtain the securities loaned at any time on notice to the borrower within the normal and customary settlement time for the securities. While the securities are on loan, the borrower is obligated to pay the Fund amounts equal to any income or other distributions from the securities. The Fund will not be able to exercise voting rights with respect to any securities during the existence of a loan, but will have the right to regain ownership of loaned securities in order to exercise voting or other ownership rights. Collateral received and securities loaned are marked to market daily to ensure that the securities loaned are secured by collateral. The lending agent currently invests the cash collateral received in Government Money Market Portfolio, an eligible money market vehicle, in accordance with the investment restrictions of the Fund, and as approved by the Board. The collateral
| abfunds.com | AB ALL MARKET REAL RETURN PORTFOLIO | 73 | |
NOTES TO CONSOLIDATED FINANCIAL STATEMENTS (continued)
received on securities loaned is recorded as an asset as well as a corresponding liability in the consolidated statement of assets and liabilities. The collateral will be adjusted the next business day to maintain the required collateral amount. The amounts of securities lending income from the borrowers and Government Money Market Portfolio are reflected in the consolidated statement of operations. When the Fund earns net securities lending income from Government Money Market Portfolio, the income is inclusive of a rebate expense paid to the borrower. In connection with the cash collateral investment by the Fund in Government Money Market Portfolio, the Adviser has agreed to waive a portion of the Fund’s share of the advisory fees of Government Money Market Portfolio, as borne indirectly by the Fund as an acquired fund fee and expense. When the Fund lends securities, its investment performance will continue to reflect changes in the value of the securities loaned. A principal risk of lending portfolio securities is that the borrower may fail to return the loaned securities upon termination of the loan and that the collateral will not be sufficient to replace the loaned securities. The lending agent has agreed to indemnify the Fund in the case of default of any securities borrower.
A summary of the Fund’s transactions surrounding securities lending for the six months ended April 30, 2020 is as follows:
| Government Money Market Portfolio | ||||||||||||||||||||||
Market Value on Loan* | Cash Collateral* | Market Value of Non-Cash Collateral* | Income from Borrowers | Income Earned | Advisory Fee Waived | |||||||||||||||||
| $ 15,774,331 | $ 7,958,536 | $ 8,832,854 | $ 93,722 | $ 23,247 | $ 1,060 | |||||||||||||||||
| * | As of April 30, 2020. |
NOTE F
Capital Stock
Each class consists of 3,000,000,000 authorized shares. Transactions in capital shares for each class were as follows:
| Shares | Amount | |||||||||||||||||||||||
| Six Months Ended April 30, 2020 (unaudited) | Year Ended October 31, 2019 | Six Months Ended April 30, 2020 (unaudited) | Year Ended October 31, 2019 | |||||||||||||||||||||
|
| |||||||||||||||||||||||
| Class A | ||||||||||||||||||||||||
Shares sold | 83,863 | 88,868 | $ | 697,703 | $ | 747,515 | ||||||||||||||||||
| ||||||||||||||||||||||||
Shares issued in reinvestment of dividends | 18,577 | 18,167 | 159,388 | 148,059 | ||||||||||||||||||||
| ||||||||||||||||||||||||
Shares converted from Class C | 1,598 | 11,207 | 13,148 | 93,211 | ||||||||||||||||||||
| ||||||||||||||||||||||||
Shares redeemed | (364,658 | ) | (235,310 | ) | (3,114,349 | ) | (1,954,142 | ) | ||||||||||||||||
| ||||||||||||||||||||||||
Net decrease | (260,620 | ) | (117,068 | ) | $ | (2,244,110 | ) | $ | (965,357 | ) | ||||||||||||||
| ||||||||||||||||||||||||
| 74 | AB ALL MARKET REAL RETURN PORTFOLIO | abfunds.com | |
NOTES TO CONSOLIDATED FINANCIAL STATEMENTS (continued)
| Shares | Amount | |||||||||||||||||||||||
| Six Months Ended April 30, 2020 (unaudited) | Year Ended October 31, 2019 | Six Months Ended April 30, 2020 (unaudited) | Year Ended October 31, 2019 | |||||||||||||||||||||
| Class C | ||||||||||||||||||||||||
Shares sold | 208 | 167 | $ | 1,498 | $ | 1,393 | ||||||||||||||||||
| ||||||||||||||||||||||||
Shares issued in reinvestment of dividends | 428 | 478 | 3,697 | 3,914 | ||||||||||||||||||||
| ||||||||||||||||||||||||
Shares converted to Class A | (1,594 | ) | (11,204 | ) | (13,148 | ) | (93,211 | ) | ||||||||||||||||
| ||||||||||||||||||||||||
Shares redeemed | (12,540 | ) | (46,500 | ) | (104,029 | ) | (390,586 | ) | ||||||||||||||||
| ||||||||||||||||||||||||
Net decrease | (13,498 | ) | (57,059 | ) | $ | (111,982 | ) | $ | (478,490 | ) | ||||||||||||||
| ||||||||||||||||||||||||
| Advisor Class | ||||||||||||||||||||||||
Shares sold | 120,516 | 440,752 | $ | 954,785 | $ | 3,703,318 | ||||||||||||||||||
| ||||||||||||||||||||||||
Shares issued in reinvestment of dividends | 30,646 | 41,667 | 261,410 | 337,917 | ||||||||||||||||||||
| ||||||||||||||||||||||||
Shares redeemed | (723,252 | ) | (1,385,151 | ) | (4,779,830 | ) | (11,502,566 | ) | ||||||||||||||||
| ||||||||||||||||||||||||
Net decrease | (572,090 | ) | (902,732 | ) | $ | (3,563,635 | ) | $ | (7,461,331 | ) | ||||||||||||||
| ||||||||||||||||||||||||
| Class R | ||||||||||||||||||||||||
Shares sold | 3,464 | 6,000 | $ | 27,444 | $ | 49,723 | ||||||||||||||||||
| ||||||||||||||||||||||||
Shares issued in reinvestment of dividends | 467 | 341 | 3,960 | 2,749 | ||||||||||||||||||||
| ||||||||||||||||||||||||
Shares redeemed | (4,093 | ) | (6,884 | ) | (29,261 | ) | (57,094 | ) | ||||||||||||||||
| ||||||||||||||||||||||||
Net increase (decrease) | (162 | ) | (543 | ) | $ | 2,143 | $ | (4,622 | ) | |||||||||||||||
| ||||||||||||||||||||||||
| Class K | ||||||||||||||||||||||||
Shares sold | 54,139 | 42,717 | $ | 372,977 | $ | 354,929 | ||||||||||||||||||
| ||||||||||||||||||||||||
Shares issued in reinvestment of dividends | 4,034 | 4,218 | 34,127 | 33,957 | ||||||||||||||||||||
| ||||||||||||||||||||||||
Shares redeemed | (49,318 | ) | (113,920 | ) | (336,164 | ) | (944,442 | ) | ||||||||||||||||
| ||||||||||||||||||||||||
Net increase (decrease) | 8,855 | (66,985 | ) | $ | 70,940 | $ | (555,556 | ) | ||||||||||||||||
| ||||||||||||||||||||||||
| Class I | ||||||||||||||||||||||||
Shares sold | 245,410 | 1,387,415 | $ | 1,655,774 | $ | 11,593,309 | ||||||||||||||||||
| ||||||||||||||||||||||||
Shares issued in reinvestment of dividends | 59,111 | 36,824 | 500,083 | 296,068 | ||||||||||||||||||||
| ||||||||||||||||||||||||
Shares redeemed | (157,643 | ) | (124,079 | ) | (1,211,909 | ) | (1,046,283 | ) | ||||||||||||||||
| ||||||||||||||||||||||||
Net increase | 146,878 | 1,300,160 | $ | 943,948 | $ | 10,843,094 | ||||||||||||||||||
| ||||||||||||||||||||||||
| abfunds.com | AB ALL MARKET REAL RETURN PORTFOLIO | 75 | |
NOTES TO CONSOLIDATED FINANCIAL STATEMENTS (continued)
| Shares | Amount | |||||||||||||||||||||||
| Six Months Ended April 30, 2020 (unaudited) | Year Ended October 31, 2019 | Six Months Ended April 30, 2020 (unaudited) | Year Ended October 31, 2019 | |||||||||||||||||||||
| Class 1 | ||||||||||||||||||||||||
Shares sold | 4,536,096 | 8,874,111 | $ | 36,176,456 | $ | 73,005,826 | ||||||||||||||||||
| ||||||||||||||||||||||||
Shares issued in reinvestment of dividends | 1,079,630 | 1,016,698 | 9,079,689 | 8,123,413 | ||||||||||||||||||||
| ||||||||||||||||||||||||
Shares redeemed | (8,319,665 | ) | (14,897,881 | ) | (62,624,738 | ) | (122,185,527 | ) | ||||||||||||||||
| ||||||||||||||||||||||||
Net decrease | (2,703,939 | ) | (5,007,072 | ) | $ | (17,368,593 | ) | $ | (41,056,288 | ) | ||||||||||||||
| ||||||||||||||||||||||||
| Class Z | ||||||||||||||||||||||||
Shares sold | 416,075 | 315,577 | $ | 2,794,971 | $ | 2,604,947 | ||||||||||||||||||
| ||||||||||||||||||||||||
Shares issued in reinvestment of dividends | 1,223,696 | 1,687,146 | 10,352,467 | 13,581,524 | ||||||||||||||||||||
| ||||||||||||||||||||||||
Shares redeemed | (1,230,417 | ) | (65,030,200 | ) | (9,102,279 | ) | (546,345,389 | ) | ||||||||||||||||
| ||||||||||||||||||||||||
Net increase (decrease) | 409,354 | (63,027,477 | ) | $ | 4,045,159 | $ | (530,158,918 | ) | ||||||||||||||||
| ||||||||||||||||||||||||
There were no transactions in capital shares for Class 2 for the six months ended April 30, 2020 and the year ended October 31, 2019.
At April 30, 2020, certain AB mutual funds owned approximately 37% of the Fund’s outstanding shares. Significant transactions by such shareholder, if any, may impact the Fund’s performance.
NOTE G
Risks Involved in Investing in the Fund
Market Risk—The market value of a security may move up or down, sometimes rapidly and unpredictably. These fluctuations may cause a security to be worth less than the price originally paid for it, or less than it was worth at an earlier time. Market risk may affect a single issuer, industry, sector of the economy or the market as a whole. Global economies and financial markets are increasingly interconnected, which increases the probabilities that conditions in one country or region might adversely impact issuers in a different country or region. Conditions affecting the general economy, including political, social, or economic instability at the local, regional, or global level may also affect the market value of a security. Health crises, such as pandemic and epidemic diseases, as well as other incidents that interrupt the expected course of events, such as natural disasters, war or civil disturbance, acts of terrorism, power outages and other unforeseeable and external events, and the public response to or fear of such diseases or events, have and may in the future have an adverse effect on the Fund’s investments and net asset value and can lead to increased market volatility. For example, any preventative or protective actions that governments may take in respect of such diseases or events
| 76 | AB ALL MARKET REAL RETURN PORTFOLIO | abfunds.com | |
NOTES TO CONSOLIDATED FINANCIAL STATEMENTS (continued)
may result in periods of business disruption, inability to obtain raw materials, supplies and component parts, and reduced or disrupted operations for the Fund’s portfolio companies. The occurrence and pendency of such diseases or events could adversely affect the economies and financial markets either in specific countries or worldwide.
Credit Risk—An issuer or guarantor of a fixed-income security, or the counterparty to a derivatives or other contract, may be unable or unwilling to make timely payments of interest or principal, or to otherwise honor its obligations. The issuer or guarantor may default, causing a loss of the full principal amount of a security and any accrued interest. The degree of risk for a particular security may be reflected in its credit rating. There is the possibility that the credit rating of a fixed-income security may be downgraded after purchase, which may adversely affect the value of the security. Investments in fixed-income securities with lower ratings tend to have a higher probability that an issuer will default or fail to meet its payment obligations.
Interest Rate Risk—Changes in interest rates will affect the value of investments in fixed-income securities. When interest rates rise, the value of existing investments in fixed-income securities tends to fall and this decrease in value may not be offset by higher income from new investments. Interest rate risk is generally greater for fixed-income securities with longer maturities or durations.
Commodity Risk—Investing in commodities and commodity-linked derivative instruments, either directly or through the Subsidiary, may subject the Fund to greater volatility than investments in traditional securities. The value of commodity-linked derivative instruments may be affected by changes in overall market movements, commodity index volatility, changes in interest rates, or factors affecting a particular industry or commodity, such as drought, floods, weather, livestock disease, embargoes, tariffs and international economic, political and regulatory developments.
Derivatives Risk—The Fund may enter into derivative transactions such as forwards, options, futures and swaps. Derivatives may be illiquid, difficult to price, and leveraged so that small changes may produce disproportionate losses for the Fund, and subject to counterparty risk to a greater degree than more traditional investments. Derivatives may result in significant losses, including losses that are far greater than the value of the derivatives reflected on the consolidated statement of assets and liabilities.
Leverage Risk—When the Fund borrows money or otherwise leverages its investments, its performance may be volatile because leverage tends to exaggerate the effect of any increase or decrease in the value of the
| abfunds.com | AB ALL MARKET REAL RETURN PORTFOLIO | 77 | |
NOTES TO CONSOLIDATED FINANCIAL STATEMENTS (continued)
Fund’s investments. The Fund may create leverage through the use of reverse repurchase arrangements, forward currency exchange contracts, forward commitments, dollar rolls or futures or by borrowing money. The use of other types of derivative instruments by the Fund, such as options and swaps, may also result in a form of leverage. Leverage may result in higher returns to the Fund than if the Fund were not leveraged, but may also adversely affect returns, particularly if the market is declining.
Illiquid Investments Risk—Illiquid investments risk exists when certain investments are or become difficult to purchase or sell. Difficulty in selling such investments may result in sales at disadvantageous prices affecting the value of your investment in the Fund. Causes of illiquid investments risk may include low trading volumes, large positions and heavy redemptions of Fund shares. Illiquid investments risk may be higher in a rising interest rate environment, when the value and liquidity of fixed-income securities generally decline.
Foreign (Non-U.S.) Risk—Investments in securities of non-U.S. issuers may involve more risk than those of U.S. issuers. These securities may fluctuate more widely in price and may be more difficult to trade due to adverse market, economic, political, regulatory or other factors.
Currency Risk—Fluctuations in currency exchange rates may negatively affect the value of the Fund’s investments or reduce its returns.
Subsidiary Risk—By investing in the Subsidiary, the Fund is indirectly exposed to the risks associated with the Subsidiary’s investments. The derivatives and other investments held by the Subsidiary are generally similar to those that are permitted to be held by the Fund and are subject to the same risks that apply to similar investments if held directly by the Fund. The Subsidiary is not registered under the Investment Company Act of 1940, as amended (the “1940 Act”), and, unless otherwise noted in the Fund’s Prospectus, is not subject to all of the investor protections of the 1940 Act. However, the Fund wholly owns and controls the Subsidiary, and the Fund and the Subsidiary are managed by the Adviser, making it unlikely the Subsidiary will take actions contrary to the interests of the Fund or its shareholders.
Real Estate Risk—The Fund’s investments in the real estate securities have many of the same risks as direct ownership of real estate, including the risk that the value of real estate could decline due to a variety of factors that affect the real estate market generally. Investments in real estate investment trusts, or “REITs”, may have additional risks. REITs are dependent on the capability of their managers, may have limited diversification, and could be significantly affected by changes in taxes.
| 78 | AB ALL MARKET REAL RETURN PORTFOLIO | abfunds.com | |
NOTES TO CONSOLIDATED FINANCIAL STATEMENTS (continued)
Non-Diversification Risk—The Fund may have more risk because it is “non-diversified”, meaning that it can invest more of its assets in a smaller number of issuers. Accordingly, changes in the value of a single security may have a more significant effect, either negative or positive, on the Fund’s net asset value, or NAV.
Active Trading Risk—The Fund expects to engage in active and frequent trading of its portfolio securities and its portfolio turnover rate may greatly exceed 100%. A higher rate of portfolio turnover increases transaction costs, which may negatively affect the Fund’s return. In addition, a high rate of portfolio turnover may result in substantial short-term gains, which may have adverse tax consequences for Fund shareholders.
LIBOR Risk—The Fund may invest in certain debt securities, derivatives or other financial instruments that utilize the London Interbank Offered Rate, or “LIBOR,” as a “benchmark” or “reference rate” for various interest rate calculations. In July 2017, the United Kingdom Financial Conduct Authority, which regulates LIBOR, announced a desire to phase out the use of LIBOR by the end of 2021. Although financial regulators and industry working groups have suggested alternative reference rates, such as European Interbank Offer Rate (“EURIBOR”), Sterling Overnight Interbank Average Rate (“SONIA”) and Secured Overnight Financing Rate (“SOFR”), global consensus on alternative rates is lacking and the process for amending existing contracts or instruments to transition away from LIBOR remains unclear. The elimination of LIBOR or changes to other reference rates or any other changes or reforms to the determination or supervision of reference rates could have an adverse impact on the market for, or value of, any securities or payments linked to those reference rates, which may adversely affect the Fund’s performance and/or net asset value. Uncertainty and risk also remain regarding the willingness and ability of issuers and lenders to include revised provisions in new and existing contracts or instruments. Consequently, the transition away from LIBOR to other reference rates may lead to increased volatility and illiquidity in markets that are tied to LIBOR, fluctuations in values of LIBOR-related investments or investments in issuers that utilize LIBOR, increased difficulty in borrowing or refinancing and diminished effectiveness of hedging strategies, adversely affecting the Fund’s performance. Furthermore, the risks associated with the expected discontinuation of LIBOR and transition may be exacerbated if the work necessary to effect an orderly transition to an alternative reference rate is not completed in a timely manner. Because the usefulness of LIBOR as a benchmark could deteriorate during the transition period, these effects could occur prior to the end of 2021.
Indemnification Risk—In the ordinary course of business, the Fund enters into contracts that contain a variety of indemnifications. The Fund’s maximum exposure under these arrangements is unknown. However, the
| abfunds.com | AB ALL MARKET REAL RETURN PORTFOLIO | 79 | |
NOTES TO CONSOLIDATED FINANCIAL STATEMENTS (continued)
Fund has not had prior claims or losses pursuant to these indemnification provisions and expects the risk of loss thereunder to be remote. Therefore, the Fund has not accrued any liability in connection with these indemnification provisions.
Management Risk—The Fund is subject to management risk because it is an actively-managed investment fund. The Adviser will apply its investment techniques and risk analyses in making investment decisions, but there is no guarantee that its techniques will produce the intended results.
NOTE H
Joint Credit Facility
A number of open-end mutual funds managed by the Adviser, including the Fund, participate in a $325 million revolving credit facility (the “Facility”) intended to provide short-term financing, if necessary, subject to certain restrictions in connection with abnormal redemption activity. Commitment fees related to the Facility are paid by the participating funds and are included in miscellaneous expenses in the consolidated statement of operations. The Fund did not utilize the Facility during the six months ended April 30, 2020.
NOTE I
Distributions to Shareholders
The tax character of distributions to be paid for the year ending October 31, 2020 will be determined at the end of the current fiscal year. The tax character of distributions paid during the fiscal years ended October 31, 2019 and October 31, 2018 were as follows:
| 2019 | 2018 | |||||||
Distributions paid from: | ||||||||
Ordinary income | $ | 24,643,711 | $ | 42,039,170 | ||||
|
|
|
| |||||
Total distributions paid | $ | 24,643,711 | $ | 42,039,170 | ||||
|
|
|
| |||||
As of October 31, 2019, the components of accumulated earnings/(deficit) on a tax basis were as follows:
Undistributed ordinary income | $ | 17,521,607 | ||
Accumulated capital and other losses | (73,587,186 | )(a) | ||
Unrealized appreciation/(depreciation) | (160,719,700 | )(b) | ||
|
| |||
Total accumulated earnings/(deficit) | $ | (216,785,279 | )(c) | |
|
|
| (a) | As of October 31, 2019, the Fund had a net capital loss carryforward of $73,587,186. |
| (b) | The differences between book-basis and tax-basis unrealized appreciation/(depreciation) are attributable primarily to the recognition for tax purposes of unrealized gains/losses on certain derivative instruments, the tax treatment of passive foreign investment companies (PFICs), the tax treatment of earnings from the Subsidiary, the tax treatment of swaps, the tax deferral of losses on wash sales, and the tax treatment of partnership investments. |
| (c) | The differences between book-basis and tax-basis components of accumulated earnings/(deficit) is attributable primarily to the accrual of foreign capital gains tax. |
| 80 | AB ALL MARKET REAL RETURN PORTFOLIO | abfunds.com | |
NOTES TO CONSOLIDATED FINANCIAL STATEMENTS (continued)
For tax purposes, net realized capital losses may be carried over to offset future capital gains, if any. Funds are permitted to carry forward capital losses for an indefinite period, and such losses will retain their character as either short-term or long-term capital losses. As of October 31, 2019, the Fund had a net short-term capital loss carryforward of $72,547,171 and a net long-term capital loss carryforward of $1,040,015, which may be carried forward for an indefinite period.
NOTE J
Recent Accounting Pronouncements
In March 2017, the Financial Accounting Standards Board issued an Accounting Standards Update, ASU 2017-08, Receivables—Nonrefundable Fees and Other Costs (Subtopic 310-20), Premium Amortization on Purchased Callable Debt Securities which amends the amortization period for certain purchased callable debt securities held at a premium, shortening such period to the earliest call date. ASU 2017-08 does not require any accounting change for debt securities held at a discount; the discount continues to be amortized to maturity. ASU 2017-08 is effective for fiscal years, and interim periods within those fiscal years, beginning after December 15, 2018. The Fund has adopted ASU 2017-08, which did not have a material impact on the Fund’s financial position or the results of its operations, and had no impact on the Fund’s consolidated net assets.
NOTE K
Subsequent Events
Management has evaluated subsequent events for possible recognition or disclosure in the consolidated financial statements through the date the consolidated financial statements are issued. Management has determined that there are no material events that would require disclosure in the Fund’s consolidated financial statements through this date.
| abfunds.com | AB ALL MARKET REAL RETURN PORTFOLIO | 81 | |
CONSOLIDATED FINANCIAL HIGHLIGHTS
Selected Data For A Share Of Capital Stock Outstanding Throughout Each Period
| Class A | ||||||||||||||||||||||||
Six Months Ended April 30, (unaudited) | Year Ended October 31, | |||||||||||||||||||||||
| 2019 | 2018 | 2017 | 2016 | 2015 | ||||||||||||||||||||
|
| |||||||||||||||||||||||
Net asset value, beginning of period | $ 8.66 | $ 8.53 | $ 8.90 | $ 8.24 | $ 8.13 | $ 10.52 | ||||||||||||||||||
|
| |||||||||||||||||||||||
Income From Investment Operations | ||||||||||||||||||||||||
Net investment income(a)(b) | .06 | .12 | .14 | .09 | .10 | .06 | ||||||||||||||||||
Net realized and unrealized gain (loss) on investment and foreign currency transactions | (1.57 | ) | .13 | (.23 | ) | .76 | .11 | (2.26 | ) | |||||||||||||||
Contributions from Affiliates | – 0 | – | – 0 | – | – 0 | – | .00 | (c) | .00 | (c) | .00 | (c) | ||||||||||||
|
| |||||||||||||||||||||||
Net increase (decrease) in net asset value from operations | (1.51 | ) | .25 | (.09 | ) | .85 | .21 | (2.20 | ) | |||||||||||||||
|
| |||||||||||||||||||||||
Less: Dividends | ||||||||||||||||||||||||
Dividends from net investment income | (.14 | ) | (.12 | ) | (.28 | ) | (.19 | ) | (.10 | ) | (.19 | ) | ||||||||||||
|
| |||||||||||||||||||||||
Net asset value, end of period | $ 7.01 | $ 8.66 | $ 8.53 | $ 8.90 | $ 8.24 | $ 8.13 | ||||||||||||||||||
|
| |||||||||||||||||||||||
Total Return | ||||||||||||||||||||||||
Total investment return based on net asset value(d)* | (17.73 | )% | 2.97 | % | (1.11 | )% | 10.45 | % | 2.75 | % | (21.16 | )% | ||||||||||||
Ratios/Supplemental Data | ||||||||||||||||||||||||
Net assets, end of period (000’s omitted) | $6,785 | $10,634 | $11,478 | $11,819 | $13,682 | $16,611 | ||||||||||||||||||
Ratio to average net assets of: | ||||||||||||||||||||||||
Expenses, net of waivers/reimbursements(e)(f)‡ | 1.29 | %^ | 1.30 | % | 1.26 | % | 1.27 | % | 1.30 | % | 1.30 | % | ||||||||||||
Expenses, before waivers/reimbursements(e)(f)‡ | 1.33 | %^ | 1.32 | % | 1.27 | % | 1.28 | % | 1.36 | % | 1.47 | % | ||||||||||||
Net investment income(b) | 1.39 | %^ | 1.42 | % | 1.52 | % | 1.05 | % | 1.23 | % | .62 | % | ||||||||||||
Portfolio turnover rate | 50 | % | 100 | % | 141 | % | 123 | % | 119 | % | 53 | % | ||||||||||||
‡ Expense ratios exclude the estimated acquired fund fees of the affiliated/unaffiliated underlying |
| |||||||||||||||||||||||
portfolios | .03 | %^ | .02 | % | .03 | % | .04 | % | .02 | % | .00 | % | ||||||||||||
See footnote summary on page 91.
| 82 | AB ALL MARKET REAL RETURN PORTFOLIO | abfunds.com | |
CONSOLIDATED FINANCIAL HIGHLIGHTS (continued)
Selected Data For A Share Of Capital Stock Outstanding Throughout Each Period
| Class C | ||||||||||||||||||||||||
Six Months Ended April 30, 2020 (unaudited) | Year Ended October 31, | |||||||||||||||||||||||
| 2019 | 2018 | 2017 | 2016 | 2015 | ||||||||||||||||||||
|
| |||||||||||||||||||||||
Net asset value, beginning of period | $ 8.63 | $ 8.49 | $ 8.83 | $ 8.17 | $ 8.03 | $ 10.40 | ||||||||||||||||||
|
| |||||||||||||||||||||||
Income From Investment Operations | ||||||||||||||||||||||||
Net investment income (loss)(a)(b) | .03 | .06 | .07 | .02 | .04 | (.01 | ) | |||||||||||||||||
Net realized and unrealized gain (loss) on investment and foreign currency transactions | (1.57 | ) | .11 | (.23 | ) | .76 | .12 | (2.23 | ) | |||||||||||||||
Contributions from Affiliates | – 0 | – | – 0 | – | – 0 | – | .00 | (c) | .00 | (c) | .00 | (c) | ||||||||||||
|
| |||||||||||||||||||||||
Net increase (decrease) in net asset value from operations | (1.54 | ) | .17 | (.16 | ) | .78 | .16 | (2.24 | ) | |||||||||||||||
|
| |||||||||||||||||||||||
Less: Dividends | ||||||||||||||||||||||||
Dividends from net investment income | (.05 | ) | (.03 | ) | (.18 | ) | (.12 | ) | (.02 | ) | (.13 | ) | ||||||||||||
|
| |||||||||||||||||||||||
Net asset value, end of period | $ 7.04 | $ 8.63 | $ 8.49 | $ 8.83 | $ 8.17 | $ 8.03 | ||||||||||||||||||
|
| |||||||||||||||||||||||
Total Return | ||||||||||||||||||||||||
Total investment return based on net asset value(d)* | (18.06 | )% | 2.05 | %(g) | (1.82 | )% | 9.73 | % | 2.07 | %(g) | (21.75 | )% | ||||||||||||
Ratios/Supplemental Data | ||||||||||||||||||||||||
Net assets, end of period (000’s omitted) | $519 | $754 | $1,225 | $1,801 | $2,814 | $4,202 | ||||||||||||||||||
Ratio to average net assets of: | ||||||||||||||||||||||||
Expenses, net of waivers/reimbursements(e)(f)‡ | 2.04 | %^ | 2.05 | % | 2.01 | % | 2.02 | % | 2.03 | % | 2.00 | % | ||||||||||||
Expenses, before waivers/reimbursements(e)(f)‡ | 2.09 | %^ | 2.07 | % | 2.02 | % | 2.03 | % | 2.11 | % | 2.16 | % | ||||||||||||
Net investment income (loss)(b) | .62 | %^ | .66 | % | .78 | % | .27 | % | .51 | % | (.07 | )% | ||||||||||||
Portfolio turnover rate | 50 | % | 100 | % | 141 | % | 123 | % | 119 | % | 53 | % | ||||||||||||
‡ Expense ratios exclude the estimated acquired fund fees of the affiliated/unaffiliated underlying |
| |||||||||||||||||||||||
portfolios | .03 | %^ | .02 | % | .03 | % | .04 | % | .02 | % | .00 | % | ||||||||||||
See footnote summary on page 91.
| abfunds.com | AB ALL MARKET REAL RETURN PORTFOLIO | 83 | |
CONSOLIDATED FINANCIAL HIGHLIGHTS (continued)
Selected Data For A Share Of Capital Stock Outstanding Throughout Each Period
| Advisor Class | ||||||||||||||||||||||||
Six Months Ended April 30, 2020 (unaudited) | Year Ended October 31, | |||||||||||||||||||||||
| 2019 | 2018 | 2017 | 2016 | 2015 | ||||||||||||||||||||
|
| |||||||||||||||||||||||
Net asset value, beginning of period | $ 8.63 | $ 8.51 | $ 8.89 | $ 8.22 | $ 8.13 | $ 10.56 | ||||||||||||||||||
|
| |||||||||||||||||||||||
Income From Investment Operations | ||||||||||||||||||||||||
Net investment income(a)(b) | .06 | .14 | .16 | .11 | .12 | .09 | ||||||||||||||||||
Net realized and unrealized gain (loss) on investment and foreign currency transactions | (1.55 | ) | .12 | (.24 | ) | .77 | .11 | (2.27 | ) | |||||||||||||||
Contributions from Affiliates | – 0 | – | – 0 | – | – 0 | – | .00 | (c) | .00 | (c) | .00 | (c) | ||||||||||||
|
| |||||||||||||||||||||||
Net increase (decrease) in net asset value from operations | (1.49 | ) | .26 | (.08 | ) | .88 | .23 | (2.18 | ) | |||||||||||||||
|
| |||||||||||||||||||||||
Less: Dividends | ||||||||||||||||||||||||
Dividends from net investment income | (.16 | ) | (.14 | ) | (.30 | ) | (.21 | ) | (.14 | ) | (.25 | ) | ||||||||||||
|
| |||||||||||||||||||||||
Net asset value, end of period | $ 6.98 | $ 8.63 | $ 8.51 | $ 8.89 | $ 8.22 | $ 8.13 | ||||||||||||||||||
|
| |||||||||||||||||||||||
Total Return | ||||||||||||||||||||||||
Total investment return based on net asset value(d)* | (17.58 | )% | 3.15 | % | (.96 | )% | 10.87 | % | 3.00 | % | (20.95 | )% | ||||||||||||
Ratios/Supplemental Data | ||||||||||||||||||||||||
Net assets, end of period (000’s omitted) | $11,057 | $18,611 | $26,030 | $27,670 | $25,307 | $30,541 | ||||||||||||||||||
Ratio to average net assets of: | ||||||||||||||||||||||||
Expenses, net of waivers/reimbursements(e)(f)‡ | 1.04 | %^ | 1.05 | % | 1.01 | % | 1.02 | % | 1.04 | % | 1.00 | % | ||||||||||||
Expenses, before waivers/reimbursements(e)(f)‡ | 1.08 | %^ | 1.07 | % | 1.02 | % | 1.02 | % | 1.10 | % | 1.17 | % | ||||||||||||
Net investment income(b) | 1.60 | %^ | 1.66 | % | 1.77 | % | 1.31 | % | 1.51 | % | .95 | % | ||||||||||||
Portfolio turnover rate | 50 | % | 100 | % | 141 | % | 123 | % | 119 | % | 53 | % | ||||||||||||
‡ Expense ratios exclude the estimated acquired fund fees of the affiliated/unaffiliated underlying |
| |||||||||||||||||||||||
portfolios | .03 | %^ | .02 | % | .03 | % | .04 | % | .02 | % | .00 | % | ||||||||||||
See footnote summary on page 91.
| 84 | AB ALL MARKET REAL RETURN PORTFOLIO | abfunds.com | |
CONSOLIDATED FINANCIAL HIGHLIGHTS (continued)
Selected Data For A Share Of Capital Stock Outstanding Throughout Each Period
| Class R | ||||||||||||||||||||||||
Six Months Ended April 30, 2020 (unaudited) | Year Ended October 31, | |||||||||||||||||||||||
| 2019 | 2018 | 2017 | 2016 | 2015 | ||||||||||||||||||||
|
| |||||||||||||||||||||||
Net asset value, beginning of period | $ 8.53 | $ 8.40 | $ 8.79 | $ 8.14 | $ 8.06 | $ 10.51 | ||||||||||||||||||
|
| |||||||||||||||||||||||
Income From Investment Operations | ||||||||||||||||||||||||
Net investment income(a)(b) | .04 | .10 | .11 | .07 | .07 | .04 | ||||||||||||||||||
Net realized and unrealized gain (loss) on investment and foreign currency transactions | (1.54 | ) | .11 | (.23 | ) | .76 | .11 | (2.24 | ) | |||||||||||||||
Contributions from Affiliates | – 0 | – | – 0 | – | – 0 | – | .00 | (c) | .00 | (c) | .00 | (c) | ||||||||||||
|
| |||||||||||||||||||||||
Net increase (decrease) in net asset value from operations | (1.50 | ) | .21 | (.12 | ) | .83 | .18 | (2.20 | ) | |||||||||||||||
|
| |||||||||||||||||||||||
Less: Dividends | ||||||||||||||||||||||||
Dividends from net investment income | (.12 | ) | (.08 | ) | (.27 | ) | (.18 | ) | (.10 | ) | (.25 | ) | ||||||||||||
|
| |||||||||||||||||||||||
Net asset value, end of period | $ 6.91 | $ 8.53 | $ 8.40 | $ 8.79 | $ 8.14 | $ 8.06 | ||||||||||||||||||
|
| |||||||||||||||||||||||
Total Return | ||||||||||||||||||||||||
Total investment return based on net asset value(d)* | (17.70 | )% | 2.62 | % | (1.47 | )% | 10.29 | % | 2.41 | %(g) | (21.37 | )% | ||||||||||||
Ratios/Supplemental Data | ||||||||||||||||||||||||
Net assets, end of period (000’s omitted) | $219 | $271 | $271 | $239 | $201 | $162 | ||||||||||||||||||
Ratio to average net assets of: | ||||||||||||||||||||||||
Expenses, net of waivers/reimbursements(e)(f)‡ | 1.54 | %^ | 1.55 | % | 1.55 | % | 1.54 | % | 1.54 | % | 1.50 | % | ||||||||||||
Expenses, before waivers/reimbursements(e)(f)‡ | 1.59 | %^ | 1.57 | % | 1.58 | % | 1.60 | % | 1.66 | % | 1.64 | % | ||||||||||||
Net investment income(b) | 1.11 | %^ | 1.16 | % | 1.24 | % | .81 | % | .91 | % | .42 | % | ||||||||||||
Portfolio turnover rate | 50 | % | 100 | % | 141 | % | 123 | % | 119 | % | 53 | % | ||||||||||||
‡ Expense ratios exclude the estimated acquired fund fees of the affiliated/unaffiliated underlying |
| |||||||||||||||||||||||
portfolios | .03 | %^ | .02 | % | .03 | % | .04 | % | .02 | % | .00 | % | ||||||||||||
See footnote summary on page 91.
| abfunds.com | AB ALL MARKET REAL RETURN PORTFOLIO | 85 | |
CONSOLIDATED FINANCIAL HIGHLIGHTS (continued)
Selected Data For A Share Of Capital Stock Outstanding Throughout Each Period
| Class K | ||||||||||||||||||||||||
Six Months Ended April 30, 2020 (unaudited) | Year Ended October 31, | |||||||||||||||||||||||
| 2019 | 2018 | 2017 | 2016 | 2015 | ||||||||||||||||||||
|
| |||||||||||||||||||||||
Net asset value, beginning of period | $ 8.55 | $ 8.42 | $ 8.80 | $ 8.15 | $ 8.07 | $ 10.50 | ||||||||||||||||||
|
| |||||||||||||||||||||||
Income From Investment Operations | ||||||||||||||||||||||||
Net investment income(a)(b) | .05 | .12 | .13 | .09 | .10 | .06 | ||||||||||||||||||
Net realized and unrealized gain (loss) on investment and foreign currency transactions | (1.54 | ) | .13 | (.23 | ) | .75 | .11 | (2.25 | ) | |||||||||||||||
Contributions from Affiliates | – 0 | – | – 0 | – | – 0 | – | .00 | (c) | .00 | (c) | .00 | (c) | ||||||||||||
|
| |||||||||||||||||||||||
Net increase (decrease) in net asset value from operations | (1.49 | ) | .25 | (.10 | ) | .84 | .21 | (2.19 | ) | |||||||||||||||
|
| |||||||||||||||||||||||
Less: Dividends | ||||||||||||||||||||||||
Dividends from net investment income | (.14 | ) | (.12 | ) | (.28 | ) | (.19 | ) | (.13 | ) | (.24 | ) | ||||||||||||
|
| |||||||||||||||||||||||
Net asset value, end of period | $ 6.92 | $ 8.55 | $ 8.42 | $ 8.80 | $ 8.15 | $ 8.07 | ||||||||||||||||||
|
| |||||||||||||||||||||||
Total Return | ||||||||||||||||||||||||
Total investment return based on net asset value(d)* | (17.71 | )% | 3.03 | % | (1.20 | )% | 10.48 | % | 2.81 | % | (21.19 | )% | ||||||||||||
Ratios/Supplemental Data | ||||||||||||||||||||||||
Net assets, end of period (000’s omitted) | $1,736 | $2,069 | $2,604 | $2,265 | $1,888 | $1,668 | ||||||||||||||||||
Ratio to average net assets of: | ||||||||||||||||||||||||
Expenses, net of waivers/reimbursements(e)(f)‡ | 1.27 | %^ | 1.27 | % | 1.26 | % | 1.28 | % | 1.29 | % | 1.25 | % | ||||||||||||
Expenses, before waivers/reimbursements(e)(f)‡ | 1.28 | %^ | 1.28 | % | 1.27 | % | 1.29 | % | 1.35 | % | 1.34 | % | ||||||||||||
Net investment income(b) | 1.37 | %^ | 1.44 | % | 1.52 | % | 1.05 | % | 1.23 | % | .67 | % | ||||||||||||
Portfolio turnover rate | 50 | % | 100 | % | 141 | % | 123 | % | 119 | % | 53 | % | ||||||||||||
‡ Expense ratios exclude the estimated acquired fund fees of the affiliated/unaffiliated underlying |
| |||||||||||||||||||||||
portfolios | .03 | %^ | .02 | % | .03 | % | .04 | % | .02 | % | .00 | % | ||||||||||||
See footnote summary on page 91.
| 86 | AB ALL MARKET REAL RETURN PORTFOLIO | abfunds.com | |
CONSOLIDATED FINANCIAL HIGHLIGHTS (continued)
Selected Data For A Share Of Capital Stock Outstanding Throughout Each Period
| Class I | ||||||||||||||||||||||||
Six Months Ended April 30, 2020 (unaudited) | Year Ended October 31, | |||||||||||||||||||||||
| 2019 | 2018 | 2017 | 2016 | 2015 | ||||||||||||||||||||
|
| |||||||||||||||||||||||
Net asset value, beginning of period | $ 8.58 | $ 8.46 | $ 8.83 | $ 8.17 | $ 8.11 | $ 10.54 | ||||||||||||||||||
|
| |||||||||||||||||||||||
Income From Investment Operations | ||||||||||||||||||||||||
Net investment income(a) | .07 | (b) | .15 | (b) | .17 | (b) | .12 | (b) | .12 | (b) | .09 | |||||||||||||
Net realized and unrealized gain (loss) on investment and foreign currency transactions | (1.54 | ) | .13 | (.22 | ) | .77 | .11 | (2.25 | ) | |||||||||||||||
Contributions from Affiliates | – 0 | – | – 0 | – | – 0 | – | .00 | (c) | .00 | (c) | .00 | (c) | ||||||||||||
|
| |||||||||||||||||||||||
Net increase (decrease) in net asset value from operations | (1.47 | ) | .28 | (.05 | ) | .89 | .23 | (2.16 | ) | |||||||||||||||
|
| |||||||||||||||||||||||
Less: Dividends | ||||||||||||||||||||||||
Dividends from net investment income | (.18 | ) | (.16 | ) | (.32 | ) | (.23 | ) | (.17 | ) | (.27 | ) | ||||||||||||
|
| |||||||||||||||||||||||
Net asset value, end of period | $ 6.93 | $ 8.58 | $ 8.46 | $ 8.83 | $ 8.17 | $ 8.11 | ||||||||||||||||||
|
| |||||||||||||||||||||||
Total Return | ||||||||||||||||||||||||
Total investment return based on net asset value(d)* | (17.49 | )% | 3.39 | % | (.69 | )% | 10.98 | % | 3.03 | %(g) | (20.97 | )% | ||||||||||||
Ratios/Supplemental Data | ||||||||||||||||||||||||
Net assets, end of period (000’s omitted) | $20,021 | $23,541 | $12,213 | $16,753 | $15,646 | $14,508 | ||||||||||||||||||
Ratio to average net assets of: | ||||||||||||||||||||||||
Expenses, net of waivers/reimbursements(e)(f)‡ | .87 | %^ | .85 | % | .83 | % | .85 | % | .91 | % | .96 | % | ||||||||||||
Expenses, before waivers/reimbursements(e)(f)‡ | .88 | %^ | .86 | % | .84 | % | .86 | % | .92 | % | .96 | % | ||||||||||||
Net investment income | 1.78 | %(b)^ | 1.79 | %(b) | 1.96 | %(b) | 1.48 | %(b) | 1.61 | %(b) | .99 | % | ||||||||||||
Portfolio turnover rate | 50 | % | 100 | % | 141 | % | 123 | % | 119 | % | 53 | % | ||||||||||||
‡ Expense ratios exclude the estimated acquired fund fees of the affiliated/unaffiliated underlying |
| |||||||||||||||||||||||
portfolios | .03 | %^ | .02 | % | .03 | % | .04 | % | .02 | % | .00 | % | ||||||||||||
See footnote summary on page 91.
| abfunds.com | AB ALL MARKET REAL RETURN PORTFOLIO | 87 | |
CONSOLIDATED FINANCIAL HIGHLIGHTS (continued)
Selected Data For A Share Of Capital Stock Outstanding Throughout Each Period
| Class 1 | ||||||||||||||||||||||||
Six Months Ended April 30, 2020 (unaudited) | Year Ended October 31, | |||||||||||||||||||||||
| 2019 | 2018 | 2017 | 2016 | 2015 | ||||||||||||||||||||
|
| |||||||||||||||||||||||
Net asset value, beginning of period | $ 8.51 | $ 8.39 | $ 8.76 | $ 8.11 | $ 8.05 | $ 10.46 | ||||||||||||||||||
|
| |||||||||||||||||||||||
Income From Investment Operations | ||||||||||||||||||||||||
Net investment income(a) | .06 | (b) | .13 | (b) | .15 | (b) | .10 | (b) | .11 | (b) | .07 | |||||||||||||
Net realized and unrealized gain (loss) on investment and foreign currency transactions | (1.53 | ) | .12 | (.22 | ) | .76 | .10 | (2.24 | ) | |||||||||||||||
Contributions from Affiliates | – 0 | – | – 0 | – | – 0 | – | .00 | (c) | .00 | (c) | .00 | (c) | ||||||||||||
|
| |||||||||||||||||||||||
Net increase (decrease) in net asset value from operations | (1.47 | ) | .25 | (.07 | ) | .86 | .21 | (2.17 | ) | |||||||||||||||
|
| |||||||||||||||||||||||
Less: Dividends | ||||||||||||||||||||||||
Dividends from net investment income | (.16 | ) | (.13 | ) | (.30 | ) | (.21 | ) | (.15 | ) | (.24 | ) | ||||||||||||
|
| |||||||||||||||||||||||
Net asset value, end of period | $ 6.88 | $ 8.51 | $ 8.39 | $ 8.76 | $ 8.11 | $ 8.05 | ||||||||||||||||||
|
| |||||||||||||||||||||||
Total Return | ||||||||||||||||||||||||
Total investment return based on net asset value(d)* | (17.61 | )% | 3.14 | % | (.92 | )% | 10.69 | % | 2.82 | %(g) | (21.12 | )% | ||||||||||||
Ratios/Supplemental Data | ||||||||||||||||||||||||
Net assets, end of period (000’s omitted) | $473,236 | $608,485 | $641,891 | $649,421 | $505,143 | $474,631 | ||||||||||||||||||
Ratio to average net assets of: | ||||||||||||||||||||||||
Expenses, net of waivers/reimbursements(e)(f)‡ | 1.10 | %^ | 1.09 | % | 1.08 | % | 1.09 | % | 1.15 | % | 1.16 | % | ||||||||||||
Expenses, before waivers/reimbursements(e)(f)‡ | 1.11 | %^ | 1.10 | % | 1.08 | % | 1.10 | % | 1.16 | % | 1.16 | % | ||||||||||||
Net investment income | 1.55 | %(b)^ | 1.62 | %(b) | 1.71 | %(b) | 1.24 | %(b) | 1.38 | %(b) | .79 | % | ||||||||||||
Portfolio turnover rate | 50 | % | 100 | % | 141 | % | 123 | % | 119 | % | 53 | % | ||||||||||||
‡ Expense ratios exclude the estimated acquired fund fees of the affiliated/unaffiliated underlying |
| |||||||||||||||||||||||
portfolios | .03 | %^ | .02 | % | .03 | % | .04 | % | .02 | % | .00 | % | ||||||||||||
See footnote summary on page 91.
| 88 | AB ALL MARKET REAL RETURN PORTFOLIO | abfunds.com | |
CONSOLIDATED FINANCIAL HIGHLIGHTS (continued)
Selected Data For A Share Of Capital Stock Outstanding Throughout Each Period
| Class 2 | ||||||||||||||||||||||||
Six Months Ended April 30, 2020 (unaudited) | Year Ended October 31, | |||||||||||||||||||||||
| 2019 | 2018 | 2017 | 2016 | 2015 | ||||||||||||||||||||
|
| |||||||||||||||||||||||
Net asset value, beginning of period | $ 8.71 | $ 8.58 | $ 8.96 | $ 8.29 | $ 8.22 | $ 10.68 | ||||||||||||||||||
|
| |||||||||||||||||||||||
Income From Investment Operations | ||||||||||||||||||||||||
Net investment income(a) | .07 | (b) | .16 | (b) | .18 | (b) | .13 | (b) | .13 | (b) | .09 | |||||||||||||
Net realized and unrealized gain (loss) on investment and foreign currency transactions | (1.57 | ) | .13 | (.24 | ) | .77 | .11 | (2.28 | ) | |||||||||||||||
Contributions from Affiliates | – 0 | – | – 0 | – | – 0 | – | .00 | (c) | .00 | (c) | .00 | (c) | ||||||||||||
|
| |||||||||||||||||||||||
Net increase (decrease) in net asset value from operations | (1.50 | ) | .29 | (.06 | ) | .90 | .24 | (2.19 | ) | |||||||||||||||
|
| |||||||||||||||||||||||
Less: Dividends | ||||||||||||||||||||||||
Dividends from net investment income | (.18 | ) | (.16 | ) | (.32 | ) | (.23 | ) | (.17 | ) | (.27 | ) | ||||||||||||
|
| |||||||||||||||||||||||
Net asset value, end of period | $ 7.03 | $ 8.71 | $ 8.58 | $ 8.96 | $ 8.29 | $ 8.22 | ||||||||||||||||||
|
| |||||||||||||||||||||||
Total Return | ||||||||||||||||||||||||
Total investment return based on net asset value(d)* | (17.44 | )% | 3.46 | % | (.77 | )% | 10.96 | % | 3.17 | % | (20.85 | )% | ||||||||||||
Ratios/Supplemental Data | ||||||||||||||||||||||||
Net assets, end of period (000’s omitted) | $7 | $ | 9 | $9 | $9 | $8 | $8 | |||||||||||||||||
Ratio to average net assets of: | ||||||||||||||||||||||||
Expenses, net of waivers/reimbursements(e)(f)‡ | .82 | %^ | .81 | % | .82 | % | .82 | % | .90 | % | .92 | % | ||||||||||||
Expenses, before waivers/reimbursements(e)(f)‡ | .83 | %^ | .81 | % | .82 | % | .83 | % | .90 | % | .92 | % | ||||||||||||
Net investment income | 1.79 | %(b)^ | 1.90 | %(b) | 1.95 | %(b) | 1.50 | %(b) | 1.60 | %(b) | .92 | % | ||||||||||||
Portfolio turnover rate | 50 | % | 100 | % | 141 | % | 123 | % | 119 | % | 53 | % | ||||||||||||
‡ Expense ratios exclude the estimated acquired fund fees of the affiliated/unaffiliated underlying |
| |||||||||||||||||||||||
portfolios | .03 | %^ | .02 | % | .03 | % | .04 | % | .02 | % | .00 | % | ||||||||||||
See footnote summary on page 91.
| abfunds.com | AB ALL MARKET REAL RETURN PORTFOLIO | 89 | |
CONSOLIDATED FINANCIAL HIGHLIGHTS (continued)
Selected Data For A Share Of Capital Stock Outstanding Throughout Each Period
| Class Z | ||||||||||||||||||||||||
Six Months Ended April 30, 2020 (unaudited) | Year Ended October 31, | |||||||||||||||||||||||
| 2019 | 2018 | 2017 | 2016 | 2015 | ||||||||||||||||||||
|
| |||||||||||||||||||||||
Net asset value, beginning of period | $ 8.58 | $ 8.46 | $ 8.83 | $ 8.17 | $ 8.11 | $ 10.55 | ||||||||||||||||||
|
| |||||||||||||||||||||||
Income From Investment Operations | ||||||||||||||||||||||||
Net investment income(a) | .07 | (b) | .16 | (b) | .17 | (b) | .13 | (b) | .12 | (b) | .07 | |||||||||||||
Net realized and unrealized gain (loss) on investment and foreign currency transactions | (1.54 | ) | .12 | (.22 | ) | .76 | .11 | (2.24 | ) | |||||||||||||||
Contributions from Affiliates | – 0 | – | – 0 | – | – 0 | – | .00 | (c) | .00 | (c) | .00 | (c) | ||||||||||||
|
| |||||||||||||||||||||||
Net increase (decrease) in net asset value from operations | (1.47 | ) | .28 | (.05 | ) | .89 | .23 | (2.17 | ) | |||||||||||||||
|
| |||||||||||||||||||||||
Less: Dividends | ||||||||||||||||||||||||
Dividends from net investment income | (.18 | ) | (.16 | ) | (.32 | ) | (.23 | ) | (.17 | ) | (.27 | ) | ||||||||||||
|
| |||||||||||||||||||||||
Net asset value, end of period | $ 6.93 | $ 8.58 | $ 8.46 | $ 8.83 | $ 8.17 | $ 8.11 | ||||||||||||||||||
|
| |||||||||||||||||||||||
Total Return | ||||||||||||||||||||||||
Total investment return based on net asset value(d)* | (17.49 | )% | 3.37 | % | (.68 | )% | 10.98 | % | 3.09 | % | (20.94 | )% | ||||||||||||
Ratios/Supplemental Data | ||||||||||||||||||||||||
Net assets, end of period (000’s omitted) | $396,319 | $487,326 | $1,013,733 | $692,895 | $8,634 | $3,166 | ||||||||||||||||||
Ratio to average net assets of: | ||||||||||||||||||||||||
Expenses, net of waivers/reimbursements(e)(f)‡ | .84 | %^ | .84 | % | .83 | % | .82 | % | .92 | % | .96 | % | ||||||||||||
Expenses, before waivers/reimbursements(e)(f)‡ | .85 | %^ | .85 | % | .84 | % | .83 | % | .92 | % | .96 | % | ||||||||||||
Net investment income | 1.80 | %(b)^ | 1.89 | %(b) | 1.86 | %(b) | 1.60 | %(b) | 1.56 | %(b) | .92 | % | ||||||||||||
Portfolio turnover rate | 50 | % | 100 | % | 141 | % | 123 | % | 119 | % | 53 | % | ||||||||||||
‡ Expense ratios exclude the estimated acquired fund fees of the affiliated/unaffiliated underlying |
| |||||||||||||||||||||||
portfolios | .03 | %^ | .02 | % | .03 | % | .04 | % | .02 | % | .00 | %^ | ||||||||||||
See footnote summary on page 91.
| 90 | AB ALL MARKET REAL RETURN PORTFOLIO | abfunds.com | |
CONSOLIDATED FINANCIAL HIGHLIGHTS (continued)
Selected Data For A Share Of Capital Stock Outstanding Throughout Each Period
| (a) | Based on average shares outstanding. |
| (b) | Net of expenses waived/reimbursed by the Adviser. |
| (c) | Amount is less than $.005. |
| (d) | Total investment return is calculated assuming an initial investment made at the net asset value at the beginning of the period, reinvestment of all dividends and distributions at net asset value during the period, and redemption on the last day of the period. Initial sales charges or contingent deferred sales charges are not reflected in the calculation of total investment return. Total return does not reflect the deduction of taxes that a shareholder would pay on fund distributions or the redemption of fund shares. Total investment return calculated for a period of less than one year is not annualized. |
| (e) | In connection with the Fund’s investments in affiliated underlying portfolios, the Fund incurs no direct expenses, but bears proportionate shares of the fees and expenses (i.e., operating, administrative and investment advisory fees) of the affiliated underlying portfolios. The Adviser has contractually agreed to waive its fees from the Fund in an amount equal to the Fund’s pro rata share of certain acquired fund fees and expenses, and for the six months ended April 30, 2020 and the years ended October 31, 2019, October 31, 2018 and October 31, 2017, such waiver amounted to .01% (annualized), .01%, .01% and ..01%, respectively. |
| (f) | The expense ratios presented below exclude interest/bank overdraft expense: |
Six Months Ended April 30, 2020 (unaudited) | Year Ended October 31, | |||||||||||||||||||||||
| 2019 | 2018 | 2017 | 2016 | 2015 | ||||||||||||||||||||
|
| |||||||||||||||||||||||
Class A | ||||||||||||||||||||||||
Net of waivers/reimbursements | N/A | 1.29 | % | N/A | N/A | N/A | N/A | |||||||||||||||||
Before waivers/reimbursements | N/A | 1.32 | % | N/A | N/A | N/A | N/A | |||||||||||||||||
Class C | ||||||||||||||||||||||||
Net of waivers/reimbursements | N/A | 2.04 | % | N/A | N/A | N/A | N/A | |||||||||||||||||
Before waivers/reimbursements | N/A | 2.07 | % | N/A | N/A | N/A | N/A | |||||||||||||||||
Advisor Class | ||||||||||||||||||||||||
Net of waivers/reimbursements | N/A | 1.04 | % | N/A | N/A | N/A | N/A | |||||||||||||||||
Before waivers/reimbursements | N/A | 1.06 | % | N/A | N/A | N/A | N/A | |||||||||||||||||
Class R | ||||||||||||||||||||||||
Net of waivers/reimbursements | N/A | 1.54 | % | N/A | N/A | N/A | N/A | |||||||||||||||||
Before waivers/reimbursements | N/A | 1.57 | % | N/A | N/A | N/A | N/A | |||||||||||||||||
Class K | ||||||||||||||||||||||||
Net of waivers/reimbursements | N/A | 1.27 | % | N/A | N/A | N/A | N/A | |||||||||||||||||
Before waivers/reimbursements | N/A | 1.28 | % | N/A | N/A | N/A | N/A | |||||||||||||||||
Class I | ||||||||||||||||||||||||
Net of waivers/reimbursements | N/A | .84 | % | N/A | N/A | N/A | N/A | |||||||||||||||||
Before waivers/reimbursements | N/A | .85 | % | N/A | N/A | N/A | N/A | |||||||||||||||||
Class 1 | ||||||||||||||||||||||||
Net of waivers/reimbursements | N/A | 1.09 | % | N/A | N/A | N/A | N/A | |||||||||||||||||
Before waivers/reimbursements | N/A | 1.09 | % | N/A | N/A | N/A | N/A | |||||||||||||||||
Class 2 | ||||||||||||||||||||||||
Net of waivers/reimbursements | N/A | .81 | % | N/A | N/A | N/A | N/A | |||||||||||||||||
Before waivers/reimbursements | N/A | .81 | % | N/A | N/A | N/A | N/A | |||||||||||||||||
Class Z | ||||||||||||||||||||||||
Net of waivers/reimbursements | N/A | .83 | % | N/A | N/A | N/A | N/A | |||||||||||||||||
Before waivers/reimbursements | N/A | .84 | % | N/A | N/A | N/A | N/A | |||||||||||||||||
| (g) | The net asset value and total return include adjustments in accordance with accounting principles generally accepted in the United States of America for financial reporting purposes. As such, the net asset value and total return for shareholder transactions may differ from financial statements. |
| * | Includes the impact of proceeds received and credited to the Fund resulting from class action settlements, which enhanced the Fund’s performance for the six months ended April 30, 2020 and year ended October 31, 2019 by .02% and .07%, respectively. |
| ^ | Annualized. |
See notes to consolidated financial statements.
| abfunds.com | AB ALL MARKET REAL RETURN PORTFOLIO | 91 | |
BOARD OF DIRECTORS
Marshall C. Turner, Jr.(1), Chairman Jorge A. Bermudez(1) Michael J. Downey(1) Nancy P. Jacklin(1) | Robert M. Keith, President and Chief Executive Officer Jeanette Loeb(1) Carol C. McMullen(1) Garry L. Moody(1) Earl D. Weiner(1) |
OFFICERS
Vinod Chathlani(2), Vice President Daniel J. Loewy(2), Vice President Leon Zhu(2), Vice President Emilie D. Wrapp, Secretary Michael B. Reyes, Senior Analyst | Joseph J. Mantineo, Treasurer and Chief Financial Officer Phyllis J. Clarke, Controller Vincent S. Noto, Chief Compliance Officer |
Custodian and Accounting Agent State Street Bank and Trust Company State Street Corporation CCB/5 1 Iron Street Boston, MA 02210
Principal Underwriter AllianceBernstein Investments, Inc. 1345 Avenue of the Americas New York, NY 10105
Transfer Agent AllianceBernstein Investor Services, Inc. P.O. Box 786003 San Antonio, TX 78278-6003 Toll-Free (800) 221-5672 | Independent Registered Public Ernst & Young LLP 5 Times Square New York, NY 10036
Legal Counsel Seward & Kissel LLP One Battery Park Plaza New York, NY 10004 |
| 1 | Member of the Audit Committee, the Governance and Nominating Committee, and the Independent Directors Committee. |
| 2 | The day-to-day management of, and investment decisions for, the Fund’s portfolio are made by the Adviser’s All Market Real Return Portfolio Team. Messrs. Chathlani, Loewy and Zhu are the investment professionals with the most significant responsibility for the day-to-day management of the Fund’s portfolio. |
| 92 | AB ALL MARKET REAL RETURN PORTFOLIO | abfunds.com | |
Operation and Effectiveness of the Fund’s Liquidity Risk Management Program:
In October 2016, the Securities and Exchange Commission (“SEC”) adopted the open-end fund liquidity rule (the “Liquidity Rule”). In June 2018 the SEC adopted a requirement that funds disclose information about the operation and effectiveness of their Liquidity Risk Management Program (“LRMP”) in their reports to shareholders.
One of the requirements of the Liquidity Rule is for the Fund to designate an Administrator of the Fund’s Liquidity Risk Management Program. The Administrator of the Fund’s LRMP is AllianceBernstein L.P., the Fund’s investment adviser (the “Adviser”). The Adviser has delegated the responsibility to its Liquidity Risk Management Committee (the “Committee”). Another requirement of the Liquidity Rule is for the Fund’s Board of Directors (the “Fund Board”) to receive an annual written report from the Administrator of the LRMP, which addresses the operation of the Fund’s LRMP and assesses its adequacy and effectiveness. The Adviser provided the Fund’s Board with such annual report during the first quarter of 2020, which covered the period December 1, 2018 through December 31, 2019 (the “Program Reporting Period”).
The LRMP’s principal objectives include supporting the Fund’s compliance with limits on investments in illiquid assets and mitigating the risk that the Fund will be unable to meet its redemption obligations in a timely manner. Pursuant to the LRMP, the Fund classifies the liquidity of its portfolio investments into one of the four categories defined by the SEC: Highly Liquid, Moderately Liquid, Less Liquid, and Illiquid. These classifications are reported to the SEC on Form N-PORT.
During the Program Reporting Period, the Committee reviewed whether the Fund’s strategy is appropriate for an open-end structure, taking into account any holdings of less liquid and illiquid assets. The Committee also performed an analysis to determine whether the Fund is required to maintain a Highly Liquid Investment Minimum (“HLIM”). If the Fund participated in derivative transactions, the exposure from such transactions were considered in the LRMP. The Committee also incorporated the following information when determining the Fund’s reasonably anticipated trading size for purposes of liquidity monitoring: historical net redemption activity, a Fund’s concentration in an issuer, shareholder concentration, investment performance, total net assets, and distribution channels.
The Adviser informed the Fund Board that the Committee believes the Fund’s LRMP is adequately designed, has been implemented as intended, and has operated effectively since its inception. No material exceptions have been noted since the implementation of the LRMP, and there were no liquidity events that impacted the Fund or its ability to timely meet redemptions during the Program Reporting Period.
| abfunds.com | AB ALL MARKET REAL RETURN PORTFOLIO | 93 | |
Information Regarding the Review and Approval of the Fund’s Advisory Agreement
The disinterested directors (the “directors”) of AB Bond Fund, Inc. (the “Company”) unanimously approved the continuance of the Company’s Advisory Agreement with the Adviser in respect of AB All Market Real Return Portfolio (the “Fund”) at a meeting held on July 30-31, 2019 (the “Meeting”.)*
Prior to approval of the continuance of the Advisory Agreement, the directors had requested from the Adviser, and received and evaluated, extensive materials. They reviewed the proposed continuance of the Advisory Agreement with the Adviser and with experienced counsel who are independent of the Adviser, who advised on the relevant legal standards. The directors also reviewed additional materials, including comparative analytical data prepared by the Senior Analyst for the Fund. The directors also discussed the proposed continuance in private sessions with counsel.
The directors considered their knowledge of the nature and quality of the services provided by the Adviser to the Fund gained from their experience as directors or trustees of most of the registered investment companies advised by the Adviser, their overall confidence in the Adviser’s integrity and competence they have gained from that experience, the Adviser’s initiative in identifying and raising potential issues with the directors and its responsiveness, frankness and attention to concerns raised by the directors in the past, including the Adviser’s willingness to consider and implement organizational and operational changes designed to improve investment results and the services provided to the AB Funds. The directors noted that they have four regular meetings each year, at each of which they review extensive materials and information from the Adviser, including information on the investment performance of the Fund and the underlying fund advised by the Adviser in which the Fund invests.
The directors also considered all factors they believed relevant, including the specific matters discussed below. During the course of their deliberations, the directors evaluated, among other things, the reasonableness of the advisory fee. The directors did not identify any particular information that was all-important or controlling, and different directors may have attributed different weights to the various factors. The directors determined that the selection of the Adviser to manage the Fund and the overall arrangements between the Fund and the Adviser, as provided in the Advisory Agreement, including the advisory fee, were fair and reasonable in light of the services performed, expenses incurred and such other matters as the directors
| * | Following transactions completed on November 13, 2019 that may have been deemed to have been an “assignment” causing termination of the Fund’s investment advisory agreement, a new investment advisory agreement, having the same terms as the prior one, was entered into by the Fund and the Adviser. |
| 94 | AB ALL MARKET REAL RETURN PORTFOLIO | abfunds.com | |
considered relevant in the exercise of their business judgment. The material factors and conclusions that formed the basis for the directors’ determinations included the following:
Nature, Extent and Quality of Services Provided
The directors considered the scope and quality of services provided by the Adviser under the Advisory Agreement, including the quality of the investment research capabilities of the Adviser and the other resources it has dedicated to performing services for the Fund. The directors noted that the Adviser from time to time reviews the Fund’s investment strategies and from time to time proposes changes intended to improve the Fund’s relative or absolute performance for the directors’ consideration. They also noted the professional experience and qualifications of the Fund’s portfolio management team and other senior personnel of the Adviser. The directors also considered that the Advisory Agreement provides that the Fund will reimburse the Adviser for the cost to it of providing certain clerical, accounting, administrative and other services to the Fund by employees of the Adviser or its affiliates. Requests for these reimbursements are made on a quarterly basis and subject to approval by the directors. Reimbursements, to the extent requested and paid, result in a higher rate of total compensation from the Fund to the Adviser than the fee rate stated in the Advisory Agreement. The directors noted that the methodology used to determine the reimbursement amounts had been reviewed by an independent consultant retained by the Fund’s former Senior Officer/Independent Compliance Officer. The quality of administrative and other services, including the Adviser’s role in coordinating the activities of the Fund’s other service providers, also was considered. The directors concluded that, overall, they were satisfied with the nature, extent and quality of services provided to the Fund under the Advisory Agreement.
Costs of Services Provided and Profitability
The directors reviewed a schedule of the revenues and expenses and related notes indicating the profitability of the Fund to the Adviser for calendar years 2017 and 2018 that had been prepared with an expense allocation methodology arrived at in consultation with an independent consultant retained by the Fund’s former Senior Officer/Independent Compliance Officer. The directors noted the assumptions and methods of allocation used by the Adviser in preparing fund-specific profitability data and understood that there are a number of potentially acceptable allocation methodologies for information of this type. The directors noted that the profitability information reflected all revenues and expenses of the Adviser’s relationship with the Fund, including those relating to its subsidiaries that provide transfer agency, distribution and brokerage services to the Fund. The directors recognized that it is difficult to make comparisons of the profitability of the Advisory Agreement with the profitability of fund advisory contracts for unaffiliated funds because comparative information is not generally publicly available and is affected by numerous factors. The directors focused on the profitability of the Adviser’s relationship with the Fund
| abfunds.com | AB ALL MARKET REAL RETURN PORTFOLIO | 95 | |
before taxes and distribution expenses. The directors concluded that the Adviser’s level of profitability from its relationship with the Fund was not unreasonable.
Fall-Out Benefits
The directors considered the other benefits to the Adviser and its affiliates from their relationships with the Fund and the underlying fund advised by the Adviser in which the Fund invests, including, but not limited to, benefits relating to soft dollar arrangements (whereby investment advisers receive brokerage and research services from brokers that execute transactions for their clients); 12b-1 fees and sales charges received by the Fund’s principal underwriter (which is a wholly owned subsidiary of the Adviser) in respect of certain classes of the Fund’s shares; brokerage commissions paid by the Fund to brokers affiliated with the Adviser; and transfer agency fees paid by the Fund to a wholly owned subsidiary of the Adviser. The directors recognized that the Adviser’s profitability would be somewhat lower without these benefits. The directors understood that the Adviser also might derive reputational and other benefits from its association with the Fund.
Investment Results
In addition to the information reviewed by the directors in connection with the Meeting, the directors receive detailed performance information for the Fund at each regular Board meeting during the year.
At the Meeting, the directors reviewed performance information prepared by an independent service provider (the “15(c) service provider”), showing the performance of the Class A Shares of the Fund against a group of similar funds (“peer group”) and a larger group of similar funds (“peer universe”), each selected by the 15(c) service provider, and information prepared by the Adviser showing performance of the Class A Shares against a broad-based securities market index, in each case for the 1-, 3- and 5-year periods ended May 31, 2019 and (in the case of comparisons with the broad-based securities market index) for the period from inception. Based on their review, and their discussion with the Adviser of the reasons for the Fund’s underperformance in the periods reviewed, the directors concluded that the Fund’s investment performance was acceptable.
Advisory Fees and Other Expenses
The directors considered the advisory fee rate payable by the Fund to the Adviser and information prepared by the 15(c) service provider concerning advisory fee rates payable by other funds in the same category as the Fund. The directors recognized that it is difficult to make comparisons of advisory fees because there are variations in the services that are included in the fees payable by other funds. The directors compared the Fund’s contractual advisory fee rate with a peer group median and took into account the impact on the advisory fee rate of the administrative expense reimbursement paid to the Adviser in the latest fiscal year.
| 96 | AB ALL MARKET REAL RETURN PORTFOLIO | abfunds.com | |
The directors also considered the Adviser’s fee schedule for other clients utilizing investment strategies similar to the Fund’s. For this purpose, they reviewed the relevant advisory fee information from the Adviser’s Form ADV and in a report from the Fund’s Senior Analyst and noted the differences between the Fund’s fee schedule, on the one hand, and the Adviser’s institutional fee schedule, on the other. The directors noted that the Adviser may, in some cases, agree to fee rates with large institutional clients that are lower than those reviewed by the directors and that they had previously discussed with the Adviser its policies in respect of such arrangements. The directors previously discussed these matters with an independent fee consultant.
The Adviser reviewed with the directors the significantly greater scope of the services it provides to the Fund relative to institutional clients. In this regard, the Adviser noted, among other things, that, compared to institutional accounts, the Fund (i) demands considerably more portfolio management, research and trading resources due to significantly higher daily cash flows; (ii) has more tax and regulatory restrictions and compliance obligations; (iii) must prepare and file or distribute regulatory and other communications about fund operations; and (iv) must provide shareholder servicing to retail investors. The Adviser also reviewed the greater legal risks presented by the large and changing population of Fund shareholders who may assert claims against the Adviser in individual or class actions, and the greater entrepreneurial risk in offering new fund products, which require substantial investment to launch, may not succeed, and generally must be priced to compete with larger, more established funds resulting in lack of profitability to the Adviser until a new fund achieves scale. In light of the substantial differences in services rendered by the Adviser to institutional clients as compared to the Fund, and the different risk profile, the directors considered these fee comparisons inapt and did not place significant weight on them in their deliberations.
The directors noted that the Fund invests in shares of exchange-traded funds (“ETFs”), subject to the restrictions and limitations of the Investment Company Act of 1940 as these may be varied as a result of exemptive orders issued by the SEC. The directors also noted that ETFs pay advisory fees pursuant to their advisory contracts, and that the Adviser had provided, and they had reviewed, information about the expense ratios of the relevant ETFs. The directors concluded, based on the Adviser’s explanation of how it uses ETFs when they are the most cost-effective way to obtain desired exposures, in some cases pending purchases of underlying securities, that the advisory fee for the Fund is for services that are in addition to, rather than duplicative of, the services provided under the advisory contracts of the ETFs.
In connection with their review of the Fund’s advisory fee, the directors also considered the total expense ratio of the Class A shares of the Fund in comparison to a peer group and a peer universe selected by the 15(c) service
| abfunds.com | AB ALL MARKET REAL RETURN PORTFOLIO | 97 | |
provider. The Class A expense ratio of the Fund was based on the Fund’s latest fiscal year and the directors considered the Adviser’s expense cap for the Fund. The directors noted that it was likely that the expense ratios of some of the other funds in the Fund’s category were lowered by waivers or reimbursements by those funds’ investment advisers, which in some cases might be voluntary or temporary. The directors view expense ratio information as relevant to their evaluation of the Adviser’s services because the Adviser is responsible for coordinating services provided to the Fund by others. The directors noted that the Fund’s expense ratio was above the medians. After reviewing and discussing the Adviser’s explanations of the reasons for this, the directors concluded that the Fund’s expense ratio was acceptable.
Economies of Scale
The directors noted that the advisory fee schedule for the Fund does not contain breakpoints and that they had discussed their strong preference for breakpoints in advisory contracts with the Adviser. The directors took into consideration prior presentations by an independent consultant on economies of scale in the mutual fund industry and for the AB Funds, and presentations from time to time by the Adviser concerning certain of its views on economies of scale. The directors also previously discussed economies of scale with an independent fee consultant. The directors also had requested and received from the Adviser certain updates on economies of scale in advance of the Meeting. The directors believe that economies of scale may be realized (if at all) by the Adviser across a variety of products and services, and not only in respect of a single fund. The directors noted that there is no established methodology for setting breakpoints that give effect to the fund-specific services provided by a fund’s adviser and to the economies of scale that an adviser may realize in its overall mutual fund business or those components of it which directly or indirectly affect a fund’s operations. The directors observed that in the mutual fund industry as a whole, as well as among funds similar to the Fund, there is no uniformity or pattern in the fees and asset levels at which breakpoints (if any) apply. The directors also noted that the advisory agreements for many funds do not have breakpoints at all. The directors informed the Adviser that they would monitor the Fund’s asset level (which was well below the level at which they would anticipate adding an initial breakpoint) and its profitability to the Adviser and anticipated revisiting the question of breakpoints in the future if circumstances warranted doing so.
| 98 | AB ALL MARKET REAL RETURN PORTFOLIO | abfunds.com | |
This page is not part of the Shareholder Report or the Financial Statements.
AB FAMILY OF FUNDS
US EQUITY
CORE
Core Opportunities Fund
FlexFee™ US Thematic Portfolio
Select US Equity Portfolio
GROWTH
Concentrated Growth Fund
Discovery Growth Fund
FlexFee™ Large Cap Growth Portfolio
Growth Fund
Large Cap Growth Fund
Small Cap Growth Portfolio
VALUE
Discovery Value Fund
Equity Income Fund
Relative Value Fund
Small Cap Value Portfolio
Value Fund
INTERNATIONAL/ GLOBAL EQUITY
CORE
FlexFee™ International Strategic Core Portfolio
Global Core Equity Portfolio
International Portfolio
International Strategic Core Portfolio
Sustainable Global Thematic Fund
Tax-Managed International Portfolio
Tax-Managed Wealth Appreciation Strategy
Wealth Appreciation Strategy
INTERNATIONAL/ GLOBAL EQUITY (continued)
GROWTH
Concentrated International Growth Portfolio
FlexFee™ Emerging Markets Growth Portfolio
Sustainable International Thematic Fund
VALUE
All China Equity Portfolio
International Value Fund
FIXED INCOME
MUNICIPAL
High Income Municipal Portfolio
Intermediate California Municipal Portfolio
Intermediate Diversified Municipal Portfolio
Intermediate New York Municipal Portfolio
Municipal Bond Inflation Strategy
Tax-Aware Fixed Income Opportunities Portfolio1
National Portfolio
Arizona Portfolio
California Portfolio
Massachusetts Portfolio
Minnesota Portfolio
New Jersey Portfolio
New York Portfolio
Ohio Portfolio
Pennsylvania Portfolio
Virginia Portfolio
FIXED INCOME (continued)
TAXABLE
Bond Inflation Strategy
FlexFee™ High Yield Portfolio
FlexFee™ International Bond Portfolio
Global Bond Fund
High Income Fund
Income Fund
Intermediate Duration Portfolio
Limited Duration High Income Portfolio
Short Duration Income Portfolio
Short Duration Portfolio
Total Return Bond Portfolio1
ALTERNATIVES
All Market Real Return Portfolio
Global Real Estate Investment Fund
Select US Long/Short Portfolio
Unconstrained Bond Fund
MULTI-ASSET
All Market Income Portfolio
All Market Total Return Portfolio
Conservative Wealth Strategy
Emerging Markets Multi-Asset Portfolio
Global Risk Allocation Fund
Tax-Managed All Market Income Portfolio
CLOSED-END FUNDS
AllianceBernstein Global High Income Fund
AllianceBernstein National Municipal Income Fund
We also offer Government Money Market Portfolio, which serves as the money market fund exchange vehicle for the AB mutual funds. You could lose money by investing in the Fund. Although the Fund seeks to preserve the value of your investment at $1.00 per share, it cannot guarantee it will do so. The Fund may impose a fee upon sale of your shares or may temporarily suspend your ability to sell shares if the Fund’s liquidity falls below required minimums because of market conditions or other factors. An investment in the Fund is not insured or guaranteed by the Federal Deposit Insurance Corporation or any other government agency. The Fund’s sponsor has no legal obligation to provide financial support to the Fund, and you should not expect that the sponsor will provide financial support to the Fund at any time.
Investors should consider the investment objectives, risks, charges and expenses of the Fund carefully before investing. For copies of our prospectus or summary prospectus, which contain this and other information, visit us online at www.abfunds.com or contact your AB representative. Please read the prospectus and/or summary prospectus carefully before investing.
| 1 | Prior to July 12, 2019, Total Return Bond Portfolio was named Intermediate Bond Portfolio; prior to February 5, 2020, Tax-Aware Fixed Income Opportunities Portfolio was named Tax-Aware Fixed Income Portfolio. |
| abfunds.com | AB ALL MARKET REAL RETURN PORTFOLIO | 99 | |
NOTES
| 100 | AB ALL MARKET REAL RETURN PORTFOLIO | abfunds.com | |
AB ALL MARKET REAL RETURN PORTFOLIO
1345 Avenue of the Americas
New York, NY 10105
800 221 5672
AMRR-0152-0420 
APR 04.30.20

SEMI-ANNUAL REPORT
AB BOND INFLATION STRATEGY

Beginning January 1, 2021, as permitted by new regulations adopted by the Securities and Exchange Commission, the Fund’s annual and semi-annual shareholder reports will no longer be sent by mail, unless you specifically request paper copies of the reports. Instead, the reports will be made available on a website, and you will be notified by mail each time a report is posted and provided with a website address to access the report.
If you already elected to receive shareholder reports electronically, you will not be affected by this change and you need not take any action. You may elect to receive shareholder reports and other communications from the Fund electronically at any time by contacting your financial intermediary (such as a broker-dealer or bank) or, if you are a direct investor, by calling the Fund at (800) 221 5672.
You may elect to receive all future reports in paper form free of charge. If you invest through a financial intermediary, you can contact your financial intermediary to request that you continue to receive paper copies of your shareholder reports; if you invest directly with the Fund, you can call the Fund at (800) 221 5672. Your election to receive reports in paper form will apply to all funds held in your account with your financial intermediary or, if you invest directly, to all AB Mutual Funds you hold.
| Investment Products Offered | • Are Not FDIC Insured • May Lose Value • Are Not Bank Guaranteed | |
Investors should consider the investment objectives, risks, charges and expenses of the Fund carefully before investing. For copies of our prospectus or summary prospectus, which contain this and other information, visit us online at www.abfunds.com or contact your AB representative. Please read the prospectus and/or summary prospectus carefully before investing.
This shareholder report must be preceded or accompanied by the Fund’s prospectus for individuals who are not current shareholders of the Fund.
You may obtain a description of the Fund’s proxy voting policies and procedures, and information regarding how the Fund voted proxies relating to portfolio securities during the most recent 12-month period ended June 30, without charge. Simply visit AB’s website at www.abfunds.com, or go to the Securities and Exchange Commission’s (the “Commission”) website at www.sec.gov, or call AB at (800) 227 4618.
The Fund files its complete schedule of portfolio holdings with the Commission for the first and third quarters of each fiscal year as an exhibit to its reports on Form N-PORT. The Fund’s Form N-PORT reports are available on the Commission’s website at www.sec.gov. The Fund’s Forms N-PORT may also be reviewed and copied at the Commission’s Public Reference Room in Washington, DC; information on the operation of the Public Reference Room may be obtained by calling (800) SEC 0330. AB publishes full portfolio holdings for the Fund monthly at www.abfunds.com.
AllianceBernstein Investments, Inc. (ABI) is the distributor of the AB family of mutual funds. ABI is a member of FINRA and is an affiliate of AllianceBernstein L.P., the Adviser of the funds.
The [A/B] logo is a registered service mark of AllianceBernstein and AllianceBernstein® is a registered service mark used by permission of the owner, AllianceBernstein L.P.
| FROM THE PRESIDENT |  |
Dear Shareholder,
We are pleased to provide this report for AB Bond Inflation Strategy (the “Fund”). Please review the discussion of Fund performance, the market conditions during the reporting period and the Fund’s investment strategy.
As always, AB strives to keep clients ahead of what’s next by:
| + | Transforming uncommon insights into uncommon knowledge with a global research scope |
| + | Navigating markets with seasoned investment experience and sophisticated solutions |
| + | Providing thoughtful investment insights and actionable ideas |
Whether you’re an individual investor or a multi-billion-dollar institution, we put knowledge and experience to work for you.
AB’s global research organization connects and collaborates across platforms and teams to deliver impactful insights and innovative products. Better insights lead to better opportunities—anywhere in the world.
For additional information about AB’s range of products and shareholder resources, please log on to www.abfunds.com.
Thank you for your investment in the AB Mutual Funds.
Sincerely,

Robert M. Keith
President and Chief Executive Officer, AB Mutual Funds
| abfunds.com | AB BOND INFLATION STRATEGY | 1 | |
SEMI-ANNUAL REPORT
June 9, 2020
This report provides management’s discussion of fund performance for AB Bond Inflation Strategy for the semi-annual reporting period ended April 30, 2020.
The Fund’s investment objective is to maximize real return without assuming what the Adviser considers to be undue risk.
NAV RETURNS AS OF APRIL 30, 2020 (unaudited)
| 6 Months | 12 Months | |||||||
| AB BOND INFLATION STRATEGY | ||||||||
| Class 1 Shares1 | -0.80% | 2.03% | ||||||
| Class 2 Shares1 | -0.75% | 2.14% | ||||||
| Class A Shares | -0.94% | 1.86% | ||||||
| Class C Shares | -1.24% | 1.10% | ||||||
| Advisor Class Shares2 | -0.81% | 2.04% | ||||||
| Class R Shares2 | -1.02% | 1.58% | ||||||
| Class K Shares2 | -0.85% | 1.83% | ||||||
| Class I Shares2 | -0.79% | 2.12% | ||||||
| Class Z Shares2 | -0.85% | 2.03% | ||||||
| Bloomberg Barclays 1-10 Year TIPS Index | 3.08% | 6.16% | ||||||
| 1 | Class 1 shares are only available to Bernstein Global Wealth Management private client accounts. Class 2 shares are only available to large Bernstein Global Wealth Management private client accounts and the Adviser’s institutional clients or through other limited arrangements. |
| 2 | Please note that these share classes are for investors purchasing shares through accounts established under certain fee-based programs sponsored and maintained by certain broker-dealers and financial intermediaries, institutional pension plans and/or investment advisory clients of, and certain other persons associated with, the Adviser and its affiliates or the Fund. |
INVESTMENT RESULTS
The table above shows the Fund’s performance compared to its benchmark, the Bloomberg Barclays 1-10 Year Treasury Inflation-Protected Securities (“TIPS”) Index, for the six- and 12-month periods ended April 30, 2020.
During both periods, all share classes underperformed the benchmark, before sales charges. The Fund’s long exposure to inflation breakevens detracted, relative to the benchmark. Sector exposure to investment-grade and high-yield corporate bonds also detracted. Currency exposures did not have a meaningful impact on results during either period.
| 2 | AB BOND INFLATION STRATEGY | abfunds.com | |
During both periods, the Fund utilized currency forwards to hedge currency risk and actively manage currency positions. Credit default swaps were utilized in the corporate and commercial mortgage-backed securities sectors for hedging and investment purposes. Treasury futures and interest rate swaps were utilized to manage duration, country exposure and yield-curve positioning. Consumer Price Index (“CPI”) swaps were used to hedge inflation and for investment purposes, which had no material impact on returns. Purchased and written swaptions were used for duration management.
MARKET REVIEW AND INVESTMENT STRATEGY
Global fixed-income market returns were mixed over the six-month period ended April 30, 2020. The UK’s exit from the European Union and a US-China trade truce in January led markets higher until investor sentiment turned decidedly negative in March due to the spread of COVID-19. The US Federal Reserve (the “Fed”) initiated several measures during the period to provide liquidity in short-term repurchase agreements and US Treasuries. Investor uncertainty led to an unprecedented flight to quality as credit spreads on risk assets quickly widened to levels not seen since the 2008–2009 global financial crisis. Markets began to recover in April as governments and central banks initiated over $9 trillion of monetary and fiscal stimulus measures to combat the economic fallout from the virus and governments began to relax social distancing and stay-at-home guidelines.
The Fed lowered interest rates 150 basis points to zero, and most other major central banks followed suit with substantial rate cuts. Longer maturity and higher quality developed-market treasury returns were the best performers, along with investment-grade US corporate bonds that rallied in April on the back of record new issuance. High-yield corporate bond returns were negative as investors retreated from risk assets. Securitized asset results were mixed. Emerging-market returns fell as sharply lower oil prices impacted emerging-market commodity exporters. The US dollar advanced against most developed- and emerging-market currencies. The Swiss franc and the yen, which are also considered safe haven currencies, advanced against the US dollar.
INVESTMENT POLICIES
The Fund seeks real return. Real return is the rate of return after adjusting for inflation. The Fund pursues its objective by investing principally in inflation-indexed securities (such as TIPS or inflation-indexed securities from issuers other than the US Treasury) or by gaining inflation protection through derivatives transactions, such as inflation (CPI) swaps or total return swaps linked to TIPS. In deciding whether to purchase inflation-indexed securities or use inflation-linked derivatives transactions, the Adviser considers the relative costs and efficiency of each method. In addition, in seeking to maximize real return, the Fund
(continued on next page)
| abfunds.com | AB BOND INFLATION STRATEGY | 3 | |
may also invest in other fixed-income investments, such as US and non-US government securities, corporate fixed-income securities and mortgage-related securities, as well as derivatives linked to such securities.
Under normal circumstances, the Fund invests at least 80% of its net assets in fixed-income securities. While the Fund expects to invest principally in investment-grade securities, it may invest up to 15% of its total assets in fixed-income securities rated BB or B or the equivalent by at least one national rating agency (or deemed by the Adviser to be of comparable credit quality), which are not investment-grade (“junk bonds”).
Inflation-indexed securities are fixed-income securities structured to provide protection against inflation. Their principal value and/or the interest paid on them are adjusted to reflect official inflation measures. The inflation measure for TIPS is the CPI for Urban Consumers. The Fund may also invest in other inflation-indexed securities, issued by both US and non-US issuers, and in derivative instruments linked to these securities.
The Fund may invest in derivatives, such as options, futures contracts, forwards or swaps. The Fund intends to use leverage for investment purposes. To do this, the Fund expects to enter into (i) reverse repurchase agreement transactions and use the cash made available from these transactions to make additional investments in fixed-income securities in accordance with the Fund’s investment policies and (ii) total return swaps. In determining when and to what extent to employ leverage or enter into derivatives transactions, the Adviser considers factors such as the relative risks and returns expected of potential investments and the costs of such transactions. The Adviser considers the impact of reverse repurchase agreements, swaps and other derivatives in making its assessments of the Fund’s risks. The resulting exposures to markets, sectors, issuers or specific securities will be continuously monitored by the Adviser.
The Adviser selects securities for purchase or sale based on its assessment of the securities’ risk and return characteristics as well as the securities’ impact on the overall risk and return characteristics of the Fund. In making this assessment, the Adviser takes into account various factors, including the credit quality and sensitivity to interest rates of the securities under consideration and of the Fund’s other holdings.
The Fund may also invest in loan participations and assignments, structured securities, asset-backed securities, variable, floating, and
(continued on next page)
| 4 | AB BOND INFLATION STRATEGY | abfunds.com | |
inverse floating-rate instruments, and preferred stock, and may use other investment techniques. The Fund may invest in fixed-income securities of any maturity and duration. If the rating of a fixed-income security falls below investment-grade, the Fund will not be obligated to sell the security and may continue to hold it if, in the Adviser’s opinion, the investment is appropriate under the circumstances.
| abfunds.com | AB BOND INFLATION STRATEGY | 5 | |
DISCLOSURES AND RISKS
Benchmark Disclosure
The Bloomberg Barclays 1-10 Year TIPS Index is unmanaged and does not reflect fees and expenses associated with the active management of a mutual fund portfolio. The Bloomberg Barclays 1-10 Year TIPS Index represents the performance of inflation-protected securities issued by the US Treasury. An investor cannot invest directly in an index, and its results are not indicative of the performance for any specific investment, including the Fund.
A Word About Risk
Market Risk: The market value of a security may move up or down, sometimes rapidly and unpredictably. These fluctuations may cause a security to be worth less than the price originally paid for it, or less than it was worth at an earlier time. Market risk may affect a single issuer, industry, sector of the economy or the market as a whole. Global economies and financial markets are increasingly interconnected, which increases the probabilities that conditions in one country or region might adversely impact issuers in a different country or region. Conditions affecting the general economy, including political, social, or economic instability at the local, regional, or global level may also affect the market value of a security. Health crises, such as pandemic and epidemic diseases, as well as other incidents that interrupt the expected course of events, such as natural disasters, war or civil disturbance, acts of terrorism, power outages and other unforeseeable and external events, and the public response to or fear of such diseases or events, have and may in the future have an adverse effect on the Fund’s investments and net asset value and can lead to increased market volatility. For example, any preventative or protective actions that governments may take in respect of such diseases or events may result in periods of business disruption, inability to obtain raw materials, supplies and component parts, and reduced or disrupted operations for the Fund’s portfolio companies. The occurrence and pendency of such diseases or events could adversely affect the economies and financial markets either in specific countries or worldwide.
Credit Risk: An issuer or guarantor of a fixed-income security, or the counterparty to a derivatives or other contract, may be unable or unwilling to make timely payments of interest or principal, or to otherwise honor its obligations. The issuer or guarantor may default, causing a loss of the full principal amount of a security and accrued interest. The degree of risk for a particular security may be reflected in its credit rating. There is the possibility that the credit rating of a fixed-income security may be downgraded after purchase, which may adversely affect the value of the security. Investments in fixed-income securities with lower ratings tend to have a higher probability that an issuer will default or fail to meet its payment obligations.
| 6 | AB BOND INFLATION STRATEGY | abfunds.com | |
DISCLOSURES AND RISKS (continued)
Interest-Rate Risk: Changes in interest rates will affect the value of investments in fixed-income securities. When interest rates rise, the value of existing investments in fixed-income securities tends to fall and this decrease in value may not be offset by higher income from new investments. Interest-rate risk is generally greater for fixed-income securities with longer maturities or durations.
Duration Risk: Duration is a measure that relates the expected price volatility of a fixed-income security to changes in interest rates. The duration of a fixed-income security may be shorter than or equal to full maturity of a fixed-income security. Fixed-income securities with longer durations have more risk and will decrease in price as interest rates rise.
Inflation Risk: This is the risk that the value of assets or income from investments will be less in the future as inflation decreases the value of money. As inflation increases, the value of the Fund’s assets can decline as can the value of the Fund’s distributions. This risk is significantly greater for fixed-income securities with longer maturities. Although the Fund invests principally in inflation-indexed securities, the value of its securities may be vulnerable to changes in expectations of inflation or interest rates.
Derivatives Risk: Derivatives may be difficult to price or unwind and leveraged so that small changes may produce disproportionate losses for the Fund. Derivatives, especially over-the-counter derivatives, are also subject to counterparty risk.
Foreign (Non-US) Risk: Investments in securities of non-US issuers may involve more risk than those of US issuers. These securities may fluctuate more widely in price and may be more difficult to trade due to adverse market, economic, political, regulatory or other factors.
Currency Risk: Fluctuations in currency exchange rates may negatively affect the value of the Fund’s investments or reduce its returns.
Mortgage-Related and/or Other Asset-Backed Securities Risk: Investments in mortgage-related and other asset-backed securities are subject to certain additional risks. The value of these securities may be particularly sensitive to changes in interest rates. These risks include “extension risk”, which is the risk that, in periods of rising interest rates, issuers may delay the payment of principal, and “prepayment risk”, which is the risk that in periods of falling interest rates, issuers may pay principal sooner than expected, exposing the Fund to a lower rate of return upon reinvestment of principal. Mortgage-backed securities offered by non-governmental issuers and other asset-backed securities may be subject to other risks, such as higher rates of default in the mortgages or assets backing the securities or risks associated with the nature and servicing of mortgages or assets backing the securities.
| abfunds.com | AB BOND INFLATION STRATEGY | 7 | |
DISCLOSURES AND RISKS (continued)
Leverage Risk: To the extent the Fund uses leveraging techniques, its net asset value (“NAV”) may be more volatile because leverage tends to exaggerate the effect of changes in interest rates and any increase or decrease in the value of the Fund’s investments.
Illiquid Investments Risk: Illiquid investments risk exists when certain investments are or become difficult to purchase or sell. Difficulty in selling such investments may result in sales at disadvantageous prices affecting the value of your investment in the Fund. Causes of illiquid investments risk may include low trading volumes, large positions and heavy redemptions of Fund shares. Illiquid investments risk may be higher in a rising interest-rate environment, when the value and liquidity of fixed-income securities generally go down.
Management Risk: The Fund is subject to management risk because it is an actively managed investment fund. The Adviser will apply its investment techniques and risk analyses in making investment decisions, but there is no guarantee that its techniques will produce the intended results. Some of these techniques may incorporate, or rely upon, quantitative models, but there is no guarantee that these models will generate accurate forecasts, reduce risk or otherwise perform as expected.
These risks are fully discussed in the Fund’s prospectus. As with all investments, you may lose money by investing in the Fund.
An Important Note About Historical Performance
The investment return and principal value of an investment in the Fund will fluctuate, so that shares, when redeemed, may be worth more or less than their original cost. Performance shown in this report represents past performance and does not guarantee future results. Current performance may be lower or higher than the performance information shown. You may obtain performance information current to the most recent month-end by visiting www.abfunds.com. For Class 1 shares, go to www.bernstein.com and click on “Investments”, then “Mutual Fund and Money Market Information—Mutual Fund Performance at a Glance”.
All fees and expenses related to the operation of the Fund have been deducted. NAV returns do not reflect sales charges; if sales charges were reflected, the Fund’s quoted performance would be lower. SEC returns reflect the applicable sales charges for each share class: a 4.25% maximum front-end sales charge for Class A shares and a 1% 1-year contingent deferred sales charge for Class C shares. Class 1 and Class 2 shares do not carry sales charges. Returns for the different share classes will vary due to different expenses associated with each class. Performance assumes reinvestment of distributions and does not account for taxes.
| 8 | AB BOND INFLATION STRATEGY | abfunds.com | |
HISTORICAL PERFORMANCE
AVERAGE ANNUAL RETURNS AS OF APRIL 30, 2020 (unaudited)
| NAV Returns | SEC Returns (reflects applicable sales charges) | SEC Yields1 | ||||||||||
| CLASS 1 SHARES2 | 0.93% | |||||||||||
| 1 Year | 2.03% | 2.03% | ||||||||||
| 5 Years | 2.10% | 2.10% | ||||||||||
| 10 Years | 2.52% | 2.52% | ||||||||||
| CLASS 2 SHARES2 | 1.03% | |||||||||||
| 1 Year | 2.14% | 2.14% | ||||||||||
| 5 Years | 2.19% | 2.19% | ||||||||||
| 10 Years | 2.61% | 2.61% | ||||||||||
| CLASS A SHARES | 0.60% | |||||||||||
| 1 Year | 1.86% | -2.46% | ||||||||||
| 5 Years | 1.92% | 1.04% | ||||||||||
| 10 Years | 2.33% | 1.89% | ||||||||||
| CLASS C SHARES | -0.09% | |||||||||||
| 1 Year | 1.10% | 0.10% | ||||||||||
| 5 Years | 1.17% | 1.17% | ||||||||||
| 10 Years | 1.59% | 1.59% | ||||||||||
| ADVISOR CLASS SHARES3 | 0.89% | |||||||||||
| 1 Year | 2.04% | 2.04% | ||||||||||
| 5 Years | 2.18% | 2.18% | ||||||||||
| 10 Years | 2.60% | 2.60% | ||||||||||
| CLASS R SHARES3 | 0.30% | |||||||||||
| 1 Year | 1.58% | 1.58% | ||||||||||
| 5 Years | 1.70% | 1.70% | ||||||||||
| 10 Years | 2.11% | 2.11% | ||||||||||
| CLASS K SHARES3 | 0.60% | |||||||||||
| 1 Year | 1.83% | 1.83% | ||||||||||
| 5 Years | 1.94% | 1.94% | ||||||||||
| 10 Years | 2.35% | 2.35% | ||||||||||
| CLASS I SHARES3 | 0.92% | |||||||||||
| 1 Year | 2.12% | 2.12% | ||||||||||
| 5 Years | 2.19% | 2.19% | ||||||||||
| 10 Years | 2.62% | 2.62% | ||||||||||
| CLASS Z SHARES3 | 1.02% | |||||||||||
| 1 Year | 2.03% | 2.03% | ||||||||||
| 5 Years | 2.20% | 2.20% | ||||||||||
| Since Inception4 | 2.32% | 2.32% | ||||||||||
(footnotes continued on next page)
| abfunds.com | AB BOND INFLATION STRATEGY | 9 | |
HISTORICAL PERFORMANCE (continued)
The Fund’s prospectus fee table shows the Fund’s total annual operating expense ratios as 1.20%, 1.09%, 1.51%, 2.26%, 1.24%, 1.83%, 1.57%, 1.18% and 1.10% for Class 1, Class 2, Class A, Class C, Advisor Class, Class R, Class K, Class I and Class Z shares, respectively, gross of any fee waivers or expense reimbursements. Contractual fee waivers and/or expense reimbursements limit the Fund’s annual operating expenses (exclusive of extraordinary expenses, interest expense and acquired fund fees and expenses other than the advisory fees of any AB mutual funds in which the Fund may invest) to 0.60%, 0.50%, 0.75%, 1.50%, 0.50%, 1.00%, 0.75%, 0.50% and 0.50% for Class 1, Class 2, Class A, Class C, Advisor Class, Class R, Class K, Class I and Class Z shares, respectively. These waivers/reimbursements may not be terminated before January 31, 2021 and may be extended by the Adviser for additional one-year terms. Absent reimbursements or waivers, performance would have been lower. The Financial Highlights section of this report sets forth expense ratio data for the current reporting period; the expense ratios shown above may differ from the expense ratios in the Financial Highlights section since they are based on different time periods.
| 1 | SEC yields are calculated based on SEC guidelines for the 30-day period ended April 30, 2020. |
| 2 | Class 1 shares are only available to Bernstein Global Wealth Management private client accounts. Class 2 shares are only available to large Bernstein Global Wealth Management private client accounts and the Adviser’s institutional clients or through other limited arrangements. These share classes do not carry front-end sales charges; therefore their respective NAV and SEC returns are the same. |
| 3 | These share classes are offered at NAV to eligible investors and their SEC returns are the same as their NAV returns. Please note that these share classes are for investors purchasing shares through accounts established under certain fee-based programs sponsored and maintained by certain broker-dealers and financial intermediaries, institutional pension plans and/or investment advisory clients of, and certain other persons associated with, the Adviser and its affiliates or the Fund. |
| 4 | Inception date: 12/11/2014. |
| 10 | AB BOND INFLATION STRATEGY | abfunds.com | |
HISTORICAL PERFORMANCE (continued)
SEC AVERAGE ANNUAL RETURNS
AS OF THE MOST RECENT CALENDAR QUARTER-END
MARCH 31, 2020 (unaudited)
| SEC Returns (reflects applicable sales charges) | ||||
| CLASS 1 SHARES1 | ||||
| 1 Year | -0.45% | |||
| 5 Years | 1.61% | |||
| 10 Years | 2.37% | |||
| CLASS 2 SHARES1 | ||||
| 1 Year | -0.32% | |||
| 5 Years | 1.70% | |||
| 10 Years | 2.46% | |||
| CLASS A SHARES | ||||
| 1 Year | -4.82% | |||
| 5 Years | 0.60% | |||
| 10 Years | 1.74% | |||
| CLASS C SHARES | ||||
| 1 Year | -2.29% | |||
| 5 Years | 0.68% | |||
| 10 Years | 1.44% | |||
| ADVISOR CLASS SHARES2 | ||||
| 1 Year | -0.31% | |||
| 5 Years | 1.72% | |||
| 10 Years | 2.46% | |||
| CLASS R SHARES2 | ||||
| 1 Year | -0.82% | |||
| 5 Years | 1.24% | |||
| 10 Years | 1.97% | |||
| CLASS K SHARES2 | ||||
| 1 Year | -0.68% | |||
| 5 Years | 1.45% | |||
| 10 Years | 2.20% | |||
| CLASS I SHARES2 | ||||
| 1 Year | -0.36% | |||
| 5 Years | 1.72% | |||
| 10 Years | 2.47% | |||
| CLASS Z SHARES2 | ||||
| 1 Year | -0.33% | |||
| 5 Years | 1.73% | |||
| Since Inception3 | 1.77% | |||
(footnotes continued on next page)
| abfunds.com | AB BOND INFLATION STRATEGY | 11 | |
HISTORICAL PERFORMANCE (continued)
| 1 | Class 1 shares are only available to Bernstein Global Wealth Management private client accounts. Class 2 shares are only available to large Bernstein Global Wealth Management private client accounts and the Adviser’s institutional clients or through other limited arrangements. |
| 2 | Please note that these share classes are for investors purchasing shares through accounts established under certain fee-based programs sponsored and maintained by certain broker-dealers and financial intermediaries, institutional pension plans and/or investment advisory clients of, and certain other persons associated with, the Adviser and its affiliates or the Fund. |
| 3 | Inception date: 12/11/2014. |
| 12 | AB BOND INFLATION STRATEGY | abfunds.com | |
EXPENSE EXAMPLE
(unaudited)
As a shareholder of a mutual fund, you may incur two types of costs: (1) transaction costs, including sales charges (loads) on purchase payments, contingent deferred sales charges on redemptions and (2) ongoing costs, including management fees; distribution (12b-1) fees; and other fund expenses. This example is intended to help you understand your ongoing costs (in dollars) of investing in the Fund and to compare these costs with the ongoing costs of investing in other mutual funds.
The Example is based on an investment of $1,000 invested at the beginning of the period and held for the entire period as indicated below.
Actual Expenses
The table below provides information about actual account values and actual expenses. You may use the information in this line, together with the amount you invested, to estimate the expenses that you paid over the period. Simply divide your account value by $1,000 (for example, an $8,600 account value divided by $1,000 = 8.6), then multiply the result by the number in the first line under the heading entitled “Expenses Paid During Period” to estimate the expenses you paid on your account during this period.
Hypothetical Example for Comparison Purposes
The table below provides information about hypothetical account values and hypothetical expenses based on the Fund’s actual expense ratio and an assumed annual rate of return of 5% before expenses, which is not the Fund’s actual return. The hypothetical account values and expenses may not be used to estimate the actual ending account balance or expenses you paid for the period. You may use this information to compare the ongoing costs of investing in the Fund and other funds by comparing this 5% hypothetical example with the 5% hypothetical examples that appear in the shareholder reports of other funds.
Please note that the expenses shown in the table are meant to highlight your ongoing costs only and do not reflect any transactional costs, such as sales charges (loads), or contingent deferred sales charges on redemptions. Therefore, the hypothetical example is useful in comparing ongoing costs only, and will not help you determine the relative total costs of owning different funds. In addition, if these transactional costs were included, your costs would have been higher.
| abfunds.com | AB BOND INFLATION STRATEGY | 13 | |
EXPENSE EXAMPLE (continued)
| Beginning Account Value November 1, 2019 | Ending Account Value April 30, 2020 | Expenses Paid During Period* | Annualized Expense Ratio* | |||||||||||||
| Class A | ||||||||||||||||
Actual | $ | 1,000 | $ | 990.60 | $ | 4.90 | 0.99 | % | ||||||||
Hypothetical** | $ | 1,000 | $ | 1,019.94 | $ | 4.97 | 0.99 | % | ||||||||
| Class C | ||||||||||||||||
Actual | $ | 1,000 | $ | 987.60 | $ | 8.55 | 1.73 | % | ||||||||
Hypothetical** | $ | 1,000 | $ | 1,016.26 | $ | 8.67 | 1.73 | % | ||||||||
| Advisor Class | ||||||||||||||||
Actual | $ | 1,000 | $ | 991.90 | $ | 3.66 | 0.74 | % | ||||||||
Hypothetical** | $ | 1,000 | $ | 1,021.18 | $ | 3.72 | 0.74 | % | ||||||||
| Class R | ||||||||||||||||
Actual | $ | 1,000 | $ | 989.80 | $ | 6.53 | 1.32 | % | ||||||||
Hypothetical** | $ | 1,000 | $ | 1,018.30 | $ | 6.62 | 1.32 | % | ||||||||
| Class K | ||||||||||||||||
Actual | $ | 1,000 | $ | 991.50 | $ | 4.80 | 0.97 | % | ||||||||
Hypothetical** | $ | 1,000 | $ | 1,020.04 | $ | 4.87 | 0.97 | % | ||||||||
| Class I | ||||||||||||||||
Actual | $ | 1,000 | $ | 992.10 | $ | 3.62 | 0.73 | % | ||||||||
Hypothetical** | $ | 1,000 | $ | 1,021.23 | $ | 3.67 | 0.73 | % | ||||||||
| Class 1 | ||||||||||||||||
Actual | $ | 1,000 | $ | 992.00 | $ | 4.11 | 0.83 | % | ||||||||
Hypothetical** | $ | 1,000 | $ | 1,020.74 | $ | 4.17 | 0.83 | % | ||||||||
| Class 2 | ||||||||||||||||
Actual | $ | 1,000 | $ | 992.50 | $ | 3.67 | 0.74 | % | ||||||||
Hypothetical** | $ | 1,000 | $ | 1,021.18 | $ | 3.72 | 0.74 | % | ||||||||
| Class Z | ||||||||||||||||
Actual | $ | 1,000 | $ | 991.50 | $ | 3.66 | 0.74 | % | ||||||||
Hypothetical** | $ | 1,000 | $ | 1,021.18 | $ | 3.72 | 0.74 | % | ||||||||
| * | Expenses are equal to each classes’ annualized expense ratios, multiplied by the average account value over the period, multiplied by 182/366 (to reflect the one-half year period). |
| ** | Assumes 5% annual return before expenses. |
| 14 | AB BOND INFLATION STRATEGY | abfunds.com | |
PORTFOLIO SUMMARY
April 30, 2020 (unaudited)
PORTFOLIO STATISTICS
Net Assets ($mil): $581.0 Total Investments ($mil): $795.6
INFLATION PROTECTION BREAKDOWN1
| U.S. Inflation-Protected Exposure | 90.8 | % | ||
| Non-U.S. Inflation-Protected Exposure | 0.8 | |||
| Non-Inflation Exposure | 8.4 | |||
| 100.0 | % | |||
SECTOR BREAKDOWN OF NET PORTFOLIO ASSETS, EXCLUDING TREASURY SECURITIES, TIPS, INTEREST RATE DERIVATIVES AND NET CASH EQUIVALENTS1
| Corporates–Investment Grade | 19.8% | |||
| Commercial Mortgage-Backed Securities | 11.4% | |||
| Collateralized Mortgage Obligations | 6.1% | |||
| Asset-Backed Securities | 3.5% | |||
| Corporates–Non-Investment Grade | 1.6% | |||
| Governments–Sovereign Bonds | 0.9% | |||
| Collateralized Loan Obligations | 0.7% | |||
| Quasi-Sovereigns | 0.5% | |||
| Emerging Markets–Corporate Bonds | 0.3% | |||
| Options Purchased–Puts | 0.1% | |||
SECTOR BREAKDOWN OF TOTAL PORTFOLIO INVESTMENTS, EXCLUDING DERIVATIVES2
| Inflation-Linked Securities | 67.4% | |||
| Corporates–Investment Grade | 14.5% | |||
| Commercial Mortgage-Backed Securities | 6.4% | |||
| Collateralized Mortgage Obligations | 4.5% | |||
| Asset-Backed Securities | 2.5% | |||
| Governments–Treasuries | 1.5% | |||
| Corporates–Non-Investment Grade | 1.2% | |||
| Governments–Sovereign Bonds | 0.6% | |||
| Collateralized Loan Obligations | 0.5% | |||
| Quasi-Sovereigns | 0.4% | |||
| Emerging Markets–Corporate Bonds | 0.2% | |||
| Emerging Markets–Treasuries | 0.2% | |||
| Options Purchased–Puts | 0.1% | |||
| 1 | All data are as of April 30, 2020. The Fund’s sector and inflation protection exposure breakdowns are expressed as an approximate percentage of the Fund’s total net assets (and may vary over time) inclusive of derivative exposure except as noted, based on the Adviser’s internal classification. |
| 2 | The Fund’s sector breakdown is expressed, based on the Adviser’s internal classification, as a percentage of total investments and may vary over time. The Fund also enters into derivative transactions (not reflected in the table), which may be used for hedging or investment purposes or to adjust the risk profile or exposures of the Fund (see “Portfolio of Investments” section of the report for additional details). Derivative transactions may result in a form of leverage for the Fund. The Fund uses leverage for investment purposes by entering into reverse repurchase agreements. As a result, the Fund’s total investments will generally exceed its net assets. |
| abfunds.com | AB BOND INFLATION STRATEGY | 15 | |
PORTFOLIO OF INVESTMENTS
April 30, 2020 (unaudited)
| Principal Amount (000) | U.S. $ Value | |||||||||||
| ||||||||||||
INFLATION-LINKED SECURITIES – 92.4% | ||||||||||||
Japan – 0.8% | ||||||||||||
Japanese Government CPI Linked Bond | JPY | 489,236 | $ | 4,545,203 | ||||||||
|
| |||||||||||
United States – 91.6% | ||||||||||||
U.S. Treasury Inflation Index | U.S.$ | 89,731 | 91,572,312 | |||||||||
0.125%, 01/15/2022-01/15/2023 (TIPS) | 24,318 | 24,400,150 | ||||||||||
0.125%, 07/15/2022 (TIPS)(b) | 14,489 | 14,475,254 | ||||||||||
0.25%, 07/15/2029 (TIPS) | 19,915 | 21,231,460 | ||||||||||
0.375%, 07/15/2023 (TIPS)(b) | 24,619 | 24,987,897 | ||||||||||
0.375%, 07/15/2025 (TIPS) | 29,594 | 30,759,507 | ||||||||||
0.375%, 07/15/2027 (TIPS)(a) | 63,467 | 67,195,589 | ||||||||||
0.50%, 01/15/2028 (TIPS)(a) | 26,996 | 28,797,360 | ||||||||||
0.625%, 07/15/2021-01/15/2026 (TIPS) | 89,128 | 91,070,852 | ||||||||||
0.625%, 01/15/2024 (TIPS)(a) | 24,236 | 24,868,194 | ||||||||||
0.75%, 07/15/2028 (TIPS)(a) | 42,691 | 46,819,707 | ||||||||||
1.75%, 01/15/2028 (TIPS) | 13,352 | 15,539,900 | ||||||||||
2.00%, 01/15/2026 (TIPS) | 14,689 | 16,630,891 | ||||||||||
2.375%, 01/15/2025-01/15/2027 (TIPS) | 10,855 | 12,510,568 | ||||||||||
2.50%, 01/15/2029 (TIPS) | 11,126 | 13,929,701 | ||||||||||
3.875%, 04/15/2029 (TIPS) | 5,208 | 7,160,891 | ||||||||||
|
| |||||||||||
| 531,950,233 | ||||||||||||
|
| |||||||||||
Total Inflation-Linked Securities | 536,495,436 | |||||||||||
|
| |||||||||||
CORPORATES – INVESTMENT GRADE – 19.8% | ||||||||||||
Industrial – 11.0% | ||||||||||||
Basic – 1.1% | ||||||||||||
Alpek SAB de CV | 232 | 200,680 | ||||||||||
Braskem Netherlands Finance BV | 1,600 | 1,285,000 | ||||||||||
Celulosa Arauco y Constitucion SA | 489 | 472,481 | ||||||||||
DuPont de Nemours, Inc. | ||||||||||||
4.205%, 11/15/2023 | 915 | 990,524 | ||||||||||
4.493%, 11/15/2025 | 915 | 1,006,207 | ||||||||||
| 16 | AB BOND INFLATION STRATEGY | abfunds.com | |
PORTFOLIO OF INVESTMENTS (continued)
| Principal Amount (000) | U.S. $ Value | |||||||||||
| ||||||||||||
Eastman Chemical Co. | U.S.$ | 227 | $ | 237,635 | ||||||||
GUSAP III LP | 1,000 | 910,000 | ||||||||||
Inversiones CMPC SA | 845 | 857,675 | ||||||||||
Inversiones CMPC SA/Cayman Islands Branch | 270 | 275,991 | ||||||||||
|
| |||||||||||
| 6,236,193 | ||||||||||||
|
| |||||||||||
Capital Goods – 0.5% | ||||||||||||
Embraer Netherlands Finance BV | 590 | 495,600 | ||||||||||
General Electric Co. | EUR | 1,165 | 1,218,296 | |||||||||
3.45%, 05/01/2027 | U.S.$ | 894 | 910,181 | |||||||||
|
| |||||||||||
| 2,624,077 | ||||||||||||
|
| |||||||||||
Communications - Media – 0.3% | ||||||||||||
Cox Communications, Inc. | 163 | 169,422 | ||||||||||
Fox Corp. | 66 | 70,018 | ||||||||||
Time Warner Cable LLC | 235 | 249,880 | ||||||||||
ViacomCBS, Inc. | 300 | 302,586 | ||||||||||
4.75%, 05/15/2025 | 854 | 913,746 | ||||||||||
|
| |||||||||||
| 1,705,652 | ||||||||||||
|
| |||||||||||
Communications - Telecommunications – 1.2% | ||||||||||||
AT&T, Inc. | 1,382 | 1,467,905 | ||||||||||
4.125%, 02/17/2026 | 431 | 473,587 | ||||||||||
4.55%, 03/09/2049 | 715 | 820,620 | ||||||||||
Sprint Spectrum Co. LLC/Sprint Spectrum Co. II LLC/Sprint Spectrum Co. III LLC | 1,150 | 1,218,724 | ||||||||||
Verizon Communications, Inc. | ||||||||||||
3.00%, 03/22/2027 | 309 | 334,298 | ||||||||||
4.862%, 08/21/2046 | 574 | 777,695 | ||||||||||
Vodafone Group PLC | 2,003 | 2,160,857 | ||||||||||
|
| |||||||||||
| 7,253,686 | ||||||||||||
|
| |||||||||||
| abfunds.com | AB BOND INFLATION STRATEGY | 17 | |
PORTFOLIO OF INVESTMENTS (continued)
| Principal Amount (000) | U.S. $ Value | |||||||||||
| ||||||||||||
Consumer Cyclical - Automotive – 0.3% | ||||||||||||
BMW US Capital LLC | U.S.$ | 754 | $ | 799,790 | ||||||||
General Motors Financial Co., Inc. | 1,166 | 1,149,583 | ||||||||||
|
| |||||||||||
| 1,949,373 | ||||||||||||
|
| |||||||||||
Consumer Cyclical - Other – 0.0% | ||||||||||||
Marriott International, Inc./MD | 92 | 96,182 | ||||||||||
|
| |||||||||||
Consumer Cyclical - Restaurants – 0.2% | ||||||||||||
McDonald’s Corp. | 402 | 438,417 | ||||||||||
Starbucks Corp. | 437 | 516,980 | ||||||||||
|
| |||||||||||
| 955,397 | ||||||||||||
|
| |||||||||||
Consumer Cyclical - Retailers – 0.1% | ||||||||||||
Ross Stores, Inc. | 430 | 469,620 | ||||||||||
TJX Cos., Inc. (The) | 212 | 228,670 | ||||||||||
|
| |||||||||||
| 698,290 | ||||||||||||
|
| |||||||||||
Consumer Non-Cyclical – 2.4% | ||||||||||||
AbbVie, Inc. | 337 | 421,193 | ||||||||||
Anheuser-Busch InBev Worldwide, Inc. | 607 | 669,114 | ||||||||||
5.55%, 01/23/2049 | 1,080 | 1,350,551 | ||||||||||
BAT Capital Corp. | 1,308 | 1,346,233 | ||||||||||
Baxalta, Inc. | 209 | 214,388 | ||||||||||
Cigna Corp. | 212 | 226,859 | ||||||||||
4.125%, 11/15/2025 | 374 | 418,832 | ||||||||||
4.375%, 10/15/2028 | 501 | 574,136 | ||||||||||
Coca-Cola Co. (The) | 831 | 902,981 | ||||||||||
Coca-Cola Femsa SAB de CV | 458 | 457,880 | ||||||||||
CVS Health Corp. | 194 | 212,094 | ||||||||||
4.10%, 03/25/2025 | 1,729 | 1,906,983 | ||||||||||
| 18 | AB BOND INFLATION STRATEGY | abfunds.com | |
PORTFOLIO OF INVESTMENTS (continued)
| Principal Amount (000) | U.S. $ Value | |||||||||||
| ||||||||||||
Gilead Sciences, Inc. | U.S.$ | 1,360 | $ | 1,367,426 | ||||||||
Mylan NV | 623 | 660,037 | ||||||||||
Reynolds American, Inc. | 570 | 570,000 | ||||||||||
Sigma Alimentos SA de CV | 209 | 210,986 | ||||||||||
Takeda Pharmaceutical Co., Ltd. | 1,151 | 1,261,254 | ||||||||||
Tyson Foods, Inc. | 650 | 713,791 | ||||||||||
Zimmer Biomet Holdings, Inc. | 198 | 198,677 | ||||||||||
Zoetis, Inc. | 509 | 508,934 | ||||||||||
|
| |||||||||||
| 14,192,349 | ||||||||||||
|
| |||||||||||
Energy – 3.0% | ||||||||||||
Baker Hughes a GE Co. LLC/Baker Hughes Co-Obligor, Inc. | 728 | 697,773 | ||||||||||
4.08%, 12/15/2047 | 85 | 72,828 | ||||||||||
BP Capital Markets America, Inc. | 761 | 799,050 | ||||||||||
Cenovus Energy, Inc. | 33 | 25,950 | ||||||||||
Energy Transfer Operating LP | 1,295 | 1,180,392 | ||||||||||
4.50%, 04/15/2024 | 336 | 333,517 | ||||||||||
5.20%, 02/01/2022 | 510 | 513,351 | ||||||||||
Energy Transfer Partners LP/Regency Energy Finance Corp. | 115 | 115,031 | ||||||||||
Eni SpA | 954 | 974,473 | ||||||||||
Enterprise Products Operating LLC | 335 | 338,317 | ||||||||||
EOG Resources, Inc. | 944 | 1,051,050 | ||||||||||
Equinor ASA | 1,151 | 1,205,960 | ||||||||||
Exxon Mobil Corp. | 1,180 | 1,194,089 | ||||||||||
2.992%, 03/19/2025 | 835 | 891,696 | ||||||||||
Husky Energy, Inc. | 1,486 | 1,207,137 | ||||||||||
| abfunds.com | AB BOND INFLATION STRATEGY | 19 | |
PORTFOLIO OF INVESTMENTS (continued)
| Principal Amount (000) | U.S. $ Value | |||||||||||
| ||||||||||||
Kinder Morgan Energy Partners LP | U.S.$ | 104 | $ | 106,679 | ||||||||
5.00%, 10/01/2021 | 1,200 | 1,222,968 | ||||||||||
Marathon Petroleum Corp. | 944 | 945,699 | ||||||||||
5.125%, 03/01/2021 | 280 | 282,288 | ||||||||||
Sabine Pass Liquefaction LLC | 418 | 428,534 | ||||||||||
Shell International Finance BV | 414 | 427,144 | ||||||||||
TransCanada PipeLines Ltd. | 930 | 977,802 | ||||||||||
Valero Energy Corp. | 672 | 672,672 | ||||||||||
Williams Cos., Inc. (The) | 1,250 | 1,269,325 | ||||||||||
4.125%, 11/15/2020 | 300 | 300,891 | ||||||||||
|
| |||||||||||
| 17,234,616 | ||||||||||||
|
| |||||||||||
Other Industrial – 0.1% | ||||||||||||
Alfa SAB de CV | 600 | 596,595 | ||||||||||
|
| |||||||||||
Services – 0.5% | ||||||||||||
Booking Holdings, Inc. | 217 | 230,066 | ||||||||||
Expedia Group, Inc. | 886 | 766,629 | ||||||||||
6.25%, 05/01/2025(c) | 183 | 187,026 | ||||||||||
7.00%, 05/01/2025(c) | 274 | 279,929 | ||||||||||
Global Payments, Inc. | 496 | 527,447 | ||||||||||
S&P Global, Inc. | 611 | 705,326 | ||||||||||
|
| |||||||||||
| 2,696,423 | ||||||||||||
|
| |||||||||||
Technology – 1.0% | ||||||||||||
Analog Devices, Inc. | 96 | 100,305 | ||||||||||
Baidu, Inc. | 201 | 210,580 | ||||||||||
Broadcom Corp./Broadcom Cayman Finance Ltd. | 153 | 159,926 | ||||||||||
3.875%, 01/15/2027 | 407 | 424,672 | ||||||||||
Broadcom, Inc. | 500 | 526,790 | ||||||||||
4.25%, 04/15/2026(c) | 560 | 601,608 | ||||||||||
4.70%, 04/15/2025(c) | 334 | 368,128 | ||||||||||
| 20 | AB BOND INFLATION STRATEGY | abfunds.com | |
PORTFOLIO OF INVESTMENTS (continued)
| Principal Amount (000) | U.S. $ Value | |||||||||||
| ||||||||||||
Dell International LLC/EMC Corp. | U.S.$ | 111 | $ | 117,425 | ||||||||
6.02%, 06/15/2026(c) | 974 | 1,055,884 | ||||||||||
KLA Corp. | 639 | 711,034 | ||||||||||
Lam Research Corp. | 250 | 254,760 | ||||||||||
NXP BV/NXP Funding LLC/NXP USA, Inc. | 143 | 144,559 | ||||||||||
Oracle Corp. | 1,140 | 1,202,597 | ||||||||||
Seagate HDD Cayman | 195 | 201,533 | ||||||||||
|
| |||||||||||
| 6,079,801 | ||||||||||||
|
| |||||||||||
Transportation - Airlines – 0.1% | ||||||||||||
Southwest Airlines Co. | 560 | 555,979 | ||||||||||
|
| |||||||||||
Transportation - Railroads – 0.1% | ||||||||||||
Lima Metro Line 2 Finance Ltd. | 241 | 245,217 | ||||||||||
5.875%, 07/05/2034(c) | 323 | 361,747 | ||||||||||
|
| |||||||||||
| 606,964 | ||||||||||||
|
| |||||||||||
Transportation - Services – 0.1% | ||||||||||||
Adani Ports & Special Economic Zone Ltd. | 565 | 543,989 | ||||||||||
FedEx Corp. | 228 | 244,446 | ||||||||||
|
| |||||||||||
| 788,435 | ||||||||||||
|
| |||||||||||
| 64,270,012 | ||||||||||||
|
| |||||||||||
Financial Institutions – 8.1% | ||||||||||||
Banking – 7.1% | ||||||||||||
ABN AMRO Bank NV | 200 | 214,782 | ||||||||||
AIB Group PLC | 825 | 838,002 | ||||||||||
4.75%, 10/12/2023(c) | 425 | 439,794 | ||||||||||
American Express Co. | 485 | 415,141 | ||||||||||
Australia & New Zealand Banking Group Ltd. | 600 | 639,408 | ||||||||||
| abfunds.com | AB BOND INFLATION STRATEGY | 21 | |
PORTFOLIO OF INVESTMENTS (continued)
| Principal Amount (000) | U.S. $ Value | |||||||||||
| ||||||||||||
Banco Santander Mexico SA Institucion de Banca Multiple Grupo Financiero Santand | U.S.$ | 487 | $ | 499,784 | ||||||||
Banco Santander SA | 1,000 | 1,084,770 | ||||||||||
Bank of America Corp. | 1,750 | 1,936,690 | ||||||||||
Series DD | 295 | 319,066 | ||||||||||
Series L | 2,182 | 2,349,578 | ||||||||||
Series Z | 458 | 494,274 | ||||||||||
Bank of New York Mellon Corp. (The) | 463 | 469,792 | ||||||||||
Bank of Nova Scotia (The) | 344 | 348,001 | ||||||||||
Banque Federative du Credit Mutuel SA | 555 | 557,492 | ||||||||||
Barclays Bank PLC | 137 | 164,400 | ||||||||||
Barclays PLC | 700 | 715,799 | ||||||||||
BNP Paribas SA | 534 | 534,283 | ||||||||||
4.375%, 05/12/2026(c) | 600 | 641,454 | ||||||||||
BPCE SA | 213 | 230,613 | ||||||||||
CIT Group, Inc. | 579 | 576,782 | ||||||||||
Citigroup, Inc. | 863 | 903,639 | ||||||||||
3.875%, 03/26/2025 | 1,293 | 1,379,502 | ||||||||||
5.95%, 01/30/2023(d) | 257 | 255,391 | ||||||||||
Series Q | 409 | 379,515 | ||||||||||
Commonwealth Bank of Australia | 404 | 433,270 | ||||||||||
Cooperatieve Rabobank UA | 396 | 426,642 | ||||||||||
Credit Agricole SA/London | 565 | 565,898 | ||||||||||
Credit Suisse Group Funding Guernsey Ltd. | 891 | 989,714 | ||||||||||
Danske Bank A/S | 663 | 662,165 | ||||||||||
| 22 | AB BOND INFLATION STRATEGY | abfunds.com | |
PORTFOLIO OF INVESTMENTS (continued)
| Principal Amount (000) | U.S. $ Value | |||||||||||
| ||||||||||||
Discover Bank | U.S.$ | 327 | $ | 333,981 | ||||||||
Goldman Sachs Group, Inc. (The) | 382 | 383,910 | ||||||||||
2.905%, 07/24/2023 | 922 | 943,953 | ||||||||||
3.213% (LIBOR 3 Month + 1.60%), 11/29/2023(e) | 406 | 404,904 | ||||||||||
3.50%, 04/01/2025 | 591 | 630,189 | ||||||||||
Series P | 254 | 229,365 | ||||||||||
HSBC Bank USA NA | 535 | 541,259 | ||||||||||
HSBC Holdings PLC | 787 | 853,376 | ||||||||||
4.25%, 03/14/2024 | 266 | 282,080 | ||||||||||
4.292%, 09/12/2026 | 377 | 414,119 | ||||||||||
JPMorgan Chase & Co. | 834 | 845,709 | ||||||||||
2.295%, 08/15/2021 | 322 | 322,953 | ||||||||||
3.22%, 03/01/2025 | 1,180 | 1,243,071 | ||||||||||
4.25%, 10/15/2020 | 55 | 55,789 | ||||||||||
Series FF | 122 | 114,265 | ||||||||||
Lloyds Banking Group PLC | 1,161 | 1,221,267 | ||||||||||
Mastercard, Inc. | 449 | 500,783 | ||||||||||
Morgan Stanley | 486 | 491,715 | ||||||||||
3.737%, 04/24/2024 | 1,196 | 1,266,074 | ||||||||||
5.00%, 11/24/2025 | 187 | 211,918 | ||||||||||
Series G | 929 | 1,021,668 | ||||||||||
5.50%, 07/28/2021 | 456 | 478,235 | ||||||||||
Series J | 195 | 179,367 | ||||||||||
National Australia Bank Ltd./New York | 400 | 401,356 | ||||||||||
Nationwide Building Society | 820 | 846,847 | ||||||||||
PNC Bank NA | 250 | 250,385 | ||||||||||
3.80%, 07/25/2023 | 940 | 1,008,112 | ||||||||||
Royal Bank of Scotland Group PLC | 480 | 491,803 | ||||||||||
Series U | 600 | 522,156 | ||||||||||
| abfunds.com | AB BOND INFLATION STRATEGY | 23 | |
PORTFOLIO OF INVESTMENTS (continued)
| Principal Amount (000) | U.S. $ Value | |||||||||||
| ||||||||||||
Santander Holdings USA, Inc. | U.S.$ | 297 | $ | 286,029 | ||||||||
4.40%, 07/13/2027 | 808 | 819,062 | ||||||||||
Standard Chartered PLC | 400 | 311,516 | ||||||||||
7.50%, 04/02/2022(c)(d) | 380 | 381,338 | ||||||||||
State Street Corp. | 85 | 90,308 | ||||||||||
Truist Financial Corp. | 480 | 480,499 | ||||||||||
UBS AG/London | 387 | 388,656 | ||||||||||
UBS AG/Stamford CT | 465 | 503,837 | ||||||||||
UBS Group AG | 767 | 843,010 | ||||||||||
US Bancorp | 427 | 436,176 | ||||||||||
Wells Fargo & Co. | 837 | 842,432 | ||||||||||
|
| |||||||||||
| 41,339,113 | ||||||||||||
|
| |||||||||||
Brokerage – 0.2% | ||||||||||||
Charles Schwab Corp. (The) | 764 | 860,761 | ||||||||||
Series G | 326 | 336,181 | ||||||||||
|
| |||||||||||
| 1,196,942 | ||||||||||||
|
| |||||||||||
Finance – 0.3% | ||||||||||||
Synchrony Financial | 1,875 | 1,834,837 | ||||||||||
|
| |||||||||||
Insurance – 0.3% | ||||||||||||
Centene Corp. | 208 | 217,593 | ||||||||||
4.625%, 12/15/2029(c) | 237 | 259,408 | ||||||||||
Guardian Life Insurance Co. of America (The) | 183 | 235,517 | ||||||||||
MetLife, Inc. | 90 | 121,388 | ||||||||||
Nationwide Financial Services, Inc. | 360 | 370,077 | ||||||||||
Nationwide Mutual Insurance Co. | 125 | 207,619 | ||||||||||
| 24 | AB BOND INFLATION STRATEGY | abfunds.com | |
PORTFOLIO OF INVESTMENTS (continued)
| Principal Amount (000) | U.S. $ Value | |||||||||||
| ||||||||||||
Voya Financial, Inc. | U.S.$ | 335 | $ | 330,732 | ||||||||
|
| |||||||||||
| 1,742,334 | ||||||||||||
|
| |||||||||||
REITS – 0.2% | ||||||||||||
Welltower, Inc. | 708 | 728,405 | ||||||||||
|
| |||||||||||
| 46,841,631 | ||||||||||||
|
| |||||||||||
Utility – 0.7% | ||||||||||||
Electric – 0.7% | ||||||||||||
AES Corp. (The) | 562 | 561,989 | ||||||||||
Berkshire Hathaway Energy Co. | 262 | 335,266 | ||||||||||
CMS Energy Corp. | 144 | 152,467 | ||||||||||
Colbun SA | 400 | 381,150 | ||||||||||
Consolidated Edison Co. of New York, Inc. Series 20B | 235 | 282,383 | ||||||||||
Enel Chile SA | 821 | 874,365 | ||||||||||
Florida Power & Light Co. | 209 | 226,658 | ||||||||||
Israel Electric Corp., Ltd. | 620 | 671,925 | ||||||||||
NextEra Energy Capital Holdings, Inc. | 231 | 245,969 | ||||||||||
PacifiCorp | 286 | 310,441 | ||||||||||
|
| |||||||||||
| 4,042,613 | ||||||||||||
|
| |||||||||||
Total Corporates – Investment Grade | 115,154,256 | |||||||||||
|
| |||||||||||
COMMERCIAL MORTGAGE-BACKED SECURITIES – 8.8% | ||||||||||||
Non-Agency Fixed Rate CMBS – 6.4% | ||||||||||||
BAMLL Commercial Mortgage Securities Trust | 520 | 448,667 | ||||||||||
CCUBS Commercial Mortgage Trust | 1,210 | 1,304,156 | ||||||||||
| abfunds.com | AB BOND INFLATION STRATEGY | 25 | |
PORTFOLIO OF INVESTMENTS (continued)
| Principal Amount (000) | U.S. $ Value | |||||||||||
| ||||||||||||
CFCRE Commercial Mortgage Trust | U.S.$ | 730 | $ | 756,861 | ||||||||
CGRBS Commercial Mortgage Trust | 885 | 926,680 | ||||||||||
Citigroup Commercial Mortgage Trust | 915 | 897,992 | ||||||||||
Series 2013-GC11, Class D | 191 | 166,047 | ||||||||||
Series 2015-GC27, Class A5 | 1,382 | 1,440,959 | ||||||||||
Series 2015-GC35, Class A4 | 450 | 484,470 | ||||||||||
Series 2016-C1, Class A4 | 775 | 816,120 | ||||||||||
Series 2016-GC36, Class A5 | 565 | 606,186 | ||||||||||
Commercial Mortgage Trust | 155 | 152,376 | ||||||||||
Series 2015-3BP, Class A | 250 | 259,071 | ||||||||||
Series 2015-CR24, Class A5 | 590 | 634,231 | ||||||||||
Series 2015-CR25, Class A4 | 1,155 | 1,230,761 | ||||||||||
Series 2015-DC1, Class A5 | 1,220 | 1,255,443 | ||||||||||
Series 2015-PC1, Class A5 | 745 | 787,603 | ||||||||||
CSAIL Commercial Mortgage Trust | 475 | 488,015 | ||||||||||
Series 2015-C3, Class A4 | 395 | 421,151 | ||||||||||
Series 2015-C4, Class A4 | 1,853 | 1,951,733 | ||||||||||
GS Mortgage Securities Trust | 110 | 77,843 | ||||||||||
Series 2013-G1, Class A1 | 255 | 254,494 | ||||||||||
Series 2014-GC18, Class D | 393 | 310,826 | ||||||||||
Series 2014-GC22, Class A5 | 1,072 | 1,139,640 | ||||||||||
| 26 | AB BOND INFLATION STRATEGY | abfunds.com | |
PORTFOLIO OF INVESTMENTS (continued)
| Principal Amount (000) | U.S. $ Value | |||||||||||
| ||||||||||||
Series 2015-GC28, Class A5 | U.S.$ | 1,300 | $ | 1,355,033 | ||||||||
Series 2018-GS9, Class A4 | 1,150 | 1,279,300 | ||||||||||
JP Morgan Chase Commercial Mortgage Securities Trust | 129 | 115,934 | ||||||||||
JPMBB Commercial Mortgage Securities Trust | 1,220 | 1,288,649 | ||||||||||
Series 2014-C21, Class B | 314 | 300,655 | ||||||||||
Series 2014-C22, Class XA | 20,155 | 590,830 | ||||||||||
Series 2015-C30, Class A5 | 585 | 633,504 | ||||||||||
Series 2015-C31, Class A3 | 990 | 1,071,994 | ||||||||||
Series 2015-C33, Class A4 | 1,150 | 1,247,061 | ||||||||||
JPMCC Commercial Mortgage Securities Trust | 8,926 | 472,584 | ||||||||||
LB-UBS Commercial Mortgage Trust | 136 | 79,702 | ||||||||||
Morgan Stanley Bank of America Merrill Lynch Trust | 10,872 | 452,102 | ||||||||||
Morgan Stanley Capital I Trust | 100 | 99,923 | ||||||||||
Series 2016-UB12, Class A4 | 870 | 919,760 | ||||||||||
UBS Commercial Mortgage Trust | 1,200 | 1,356,702 | ||||||||||
Series 2018-C8, Class A4 | 990 | 1,075,110 | ||||||||||
Series 2018-C9, Class A4 | 1,800 | 2,020,975 | ||||||||||
UBS-Barclays Commercial Mortgage Trust | 2,309 | 2,342,666 | ||||||||||
| abfunds.com | AB BOND INFLATION STRATEGY | 27 | |
PORTFOLIO OF INVESTMENTS (continued)
| Principal Amount (000) | U.S. $ Value | |||||||||||
| ||||||||||||
Wells Fargo Commercial Mortgage Trust | U.S.$ | 1,160 | $ | 1,206,710 | ||||||||
Series 2015-SG1, Class C | 537 | 462,353 | ||||||||||
Series 2016-LC25, Class C | 330 | 273,081 | ||||||||||
Series 2016-NXS6, Class A4 | 900 | 915,248 | ||||||||||
Series 2016-NXS6, Class C | 525 | 436,517 | ||||||||||
Series 2018-C48, Class A5 | 145 | 167,543 | ||||||||||
|
| |||||||||||
| 36,975,261 | ||||||||||||
|
| |||||||||||
Non-Agency Floating Rate CMBS – 2.4% | ||||||||||||
Ashford Hospitality Trust | 891 | 799,496 | ||||||||||
Series 2018-KEYS, Class A | 1,250 | 1,084,012 | ||||||||||
BAMLL Commercial Mortgage Securities Trust | 1,755 | 1,693,679 | ||||||||||
BFLD | 468 | 394,721 | ||||||||||
BHMS | 1,001 | 929,334 | ||||||||||
Braemar Hotels & Resorts Trust | 1,000 | 903,457 | ||||||||||
BX Commercial Mortgage Trust | 766 | 696,262 | ||||||||||
BX Trust | 1,130 | 928,954 | ||||||||||
| 28 | AB BOND INFLATION STRATEGY | abfunds.com | |
PORTFOLIO OF INVESTMENTS (continued)
| Principal Amount (000) | U.S. $ Value | |||||||||||
| ||||||||||||
CLNY Trust | U.S.$ | 1,000 | $ | 731,687 | ||||||||
DBWF Mortgage Trust | 1,042 | 965,043 | ||||||||||
GS Mortgage Securities Corp. Trust | 1,368 | 1,261,371 | ||||||||||
Series 2019-SMP, Class A | 1,125 | 961,904 | ||||||||||
JP Morgan Chase Commercial Mortgage Securities Trust | 149 | 134,619 | ||||||||||
Morgan Stanley Capital I Trust | 182 | 165,596 | ||||||||||
Natixis Commercial Mortgage Securities Trust | 1,200 | 1,153,822 | ||||||||||
Series 2019-MILE, Class A | 461 | 433,594 | ||||||||||
Starwood Retail Property Trust | 961 | 897,763 | ||||||||||
|
| |||||||||||
| 14,135,314 | ||||||||||||
|
| |||||||||||
Total Commercial Mortgage-Backed Securities | 51,110,575 | |||||||||||
|
| |||||||||||
COLLATERALIZED MORTGAGE OBLIGATIONS – 6.1% | ||||||||||||
Risk Share Floating Rate – 4.9% | ||||||||||||
Bellemeade Re Ltd. | 272 | 260,328 | ||||||||||
| abfunds.com | AB BOND INFLATION STRATEGY | 29 | |
PORTFOLIO OF INVESTMENTS (continued)
| Principal Amount (000) | U.S. $ Value | |||||||||
| ||||||||||
Series 2018-3A, Class M1B | U.S.$ | 621 | $ | 584,574 | ||||||
Series 2019-1A, Class M1B | ||||||||||
2.237% (LIBOR 1 Month + 1.75%), 03/25/2029(c)(e) | 945 | 818,474 | ||||||||
Series 2019-2A, Class M1C | 707 | 642,308 | ||||||||
Series 2019-3A, Class M1B | 660 | 573,884 | ||||||||
Series 2019-3A, Class M1C | 480 | 363,320 | ||||||||
Series 2019-4A, Class M1B | 965 | 880,127 | ||||||||
Connecticut Avenue Securities Trust | 555 | 517,950 | ||||||||
Series 2019-R02, Class 1M2 | 394 | 359,064 | ||||||||
Series 2019-R03, Class 1M2 | 203 | 184,450 | ||||||||
Series 2019-R04, Class 2M2 | 682 | 607,262 | ||||||||
Series 2019-R05, Class 1M2 | 444 | 404,494 | ||||||||
Series 2019-R06, Class 2M2 | 702 | 593,303 | ||||||||
Series 2019-R07, Class 1M2 | 1,280 | 1,106,580 | ||||||||
Series 2020-R01, Class 1M2 | 1,270 | 957,928 | ||||||||
Eagle RE Ltd. | 148 | 140,962 | ||||||||
| 30 | AB BOND INFLATION STRATEGY | abfunds.com | |
PORTFOLIO OF INVESTMENTS (continued)
| Principal Amount (000) | U.S. $ Value | |||||||||
| ||||||||||
Series 2020-1, Class M1A | U.S.$ | 1,100 | $ | 997,889 | ||||||
Federal Home Loan Mortgage Corp. | 628 | 469,562 | ||||||||
Series 2019-DNA3, Class M2 | 98 | 83,828 | ||||||||
Series 2019-DNA4, Class M2 | 955 | 811,172 | ||||||||
Series 2019-FTR2, Class M2 | 515 | 409,567 | ||||||||
Series 2019-HQA3, Class M2 | 640 | 543,534 | ||||||||
Series 2019-HQA4, Class M1 | 456 | 443,985 | ||||||||
Series 2020-DNA1, Class M2 | 950 | 723,035 | ||||||||
Series 2020-HQA2, Class M1 | 955 | 913,626 | ||||||||
Federal Home Loan Mortgage Corp. Structured Agency Credit Risk Debt Notes | 768 | 761,264 | ||||||||
Series 2015-HQA2, Class M3 | 276 | 273,905 | ||||||||
Series 2016-DNA1, Class M3 | 324 | 325,318 | ||||||||
Series 2016-DNA2, Class M3 | 210 | 207,272 | ||||||||
Series 2017-DNA1, Class M2 | 1,300 | 1,238,801 | ||||||||
| abfunds.com | AB BOND INFLATION STRATEGY | 31 | |
PORTFOLIO OF INVESTMENTS (continued)
| Principal Amount (000) | U.S. $ Value | |||||||||
| ||||||||||
Series 2017-DNA3, Class M2 | U.S.$ | 900 | $ | 846,340 | ||||||
Federal National Mortgage Association Connecticut Avenue Securities | 332 | 260,350 | ||||||||
Series 2015-C01, Class 1M2 | 773 | 612,929 | ||||||||
Series 2015-C01, Class 2M2 | 139 | 120,718 | ||||||||
Series 2015-C02, Class 1M2 | 283 | 229,112 | ||||||||
Series 2015-C02, Class 2M2 | ||||||||||
4.487% (LIBOR 1 Month + 4.00%), | 172 | 146,913 | ||||||||
Series 2015-C03, Class 1M2 | 375 | 275,855 | ||||||||
Series 2015-C03, Class 2M2 | 302 | 229,953 | ||||||||
Series 2015-C04, Class 1M2 | 715 | 722,072 | ||||||||
Series 2015-C04, Class 2M2 | 303 | 306,429 | ||||||||
Series 2016-C05, Class 2M2 | 861 | 845,435 | ||||||||
Series 2016-C06, Class 1M2 | 345 | 337,226 | ||||||||
Series 2016-C07, Class 2M2 | 1,139 | 1,116,469 | ||||||||
Series 2017-C03, Class 1M2 | 580 | 548,729 | ||||||||
Home Re Ltd. | 231 | 218,817 | ||||||||
| 32 | AB BOND INFLATION STRATEGY | abfunds.com | |
PORTFOLIO OF INVESTMENTS (continued)
| Principal Amount (000) | U.S. $ Value | |||||||||||
| ||||||||||||
Mortgage Insurance-Linked Notes | U.S.$ | 805 | $ | 771,907 | ||||||||
Series 2020-1, Class M1A | 391 | 375,608 | ||||||||||
Oaktown Re III Ltd. | 452 | 414,139 | ||||||||||
PMT Credit Risk Transfer Trust | 365 | 285,470 | ||||||||||
Series 2019-2R, Class A | 691 | 512,247 | ||||||||||
Series 2019-3R, Class A | 251 | 191,062 | ||||||||||
Series 2020-1R, Class A | 893 | 669,295 | ||||||||||
Radnor Re Ltd. | 744 | 689,665 | ||||||||||
Series 2019-2, Class M1B | 723 | 632,561 | ||||||||||
|
| |||||||||||
| 28,557,067 | ||||||||||||
|
| |||||||||||
Agency Floating Rate – 1.1% | ||||||||||||
Federal Home Loan Mortgage Corp. REMICs | 3,835 | 693,814 | ||||||||||
Series 4693, Class SL | 2,203 | 473,583 | ||||||||||
Series 4727, Class SA | 2,519 | 483,966 | ||||||||||
Series 4954, Class SL | 3,369 | 611,084 | ||||||||||
| abfunds.com | AB BOND INFLATION STRATEGY | 33 | |
PORTFOLIO OF INVESTMENTS (continued)
| Principal Amount (000) | U.S. $ Value | |||||||||||
| ||||||||||||
Federal National Mortgage Association REMICs | U.S.$ | 1,110 | $ | 238,397 | ||||||||
Series 2014-17, Class SA | 2,706 | 629,483 | ||||||||||
Series 2014-78, Class SE | 1,874 | 361,471 | ||||||||||
Series 2014-92, Class SX | 2,394 | 530,809 | ||||||||||
Series 2016-77, Class DS | 2,094 | 402,994 | ||||||||||
Series 2017-62, Class AS | 2,225 | 417,178 | ||||||||||
Series 2017-81, Class SA | 2,384 | 504,563 | ||||||||||
Series 2017-97, Class LS | 2,437 | 574,945 | ||||||||||
Government National Mortgage Association | 1,646 | 320,031 | ||||||||||
Series 2017-134, Class MS | ||||||||||||
5.482% (6.20% - LIBOR 1 Month), 09/20/2047(e)(h) | 1,612 | 343,408 | ||||||||||
|
| |||||||||||
| 6,585,726 | ||||||||||||
|
| |||||||||||
Non-Agency Floating Rate – 0.1% | ||||||||||||
Chase Mortgage Reference Notes | 307 | 264,813 | ||||||||||
|
| |||||||||||
Total Collateralized Mortgage Obligations | 35,407,606 | |||||||||||
|
| |||||||||||
| 34 | AB BOND INFLATION STRATEGY | abfunds.com | |
PORTFOLIO OF INVESTMENTS (continued)
| Principal Amount (000) | U.S. $ Value | |||||||||||
| ||||||||||||
ASSET-BACKED SECURITIES – 3.5% | ||||||||||||
Autos - Fixed Rate – 2.0% | ||||||||||||
Avis Budget Rental Car Funding AESOP LLC | U.S.$ | 1,760 | $ | 1,676,042 | ||||||||
Series 2018-2A, Class A | 1,425 | 1,341,558 | ||||||||||
Exeter Automobile Receivables Trust | 231 | 235,101 | ||||||||||
First Investors Auto Owner Trust | 1,200 | 1,180,563 | ||||||||||
Series 2020-1A, Class A | 854 | 859,896 | ||||||||||
Flagship Credit Auto Trust | 325 | 338,792 | ||||||||||
Series 2016-4, Class D | 330 | 332,071 | ||||||||||
Series 2017-4, Class A | 18 | 18,252 | ||||||||||
Series 2018-3, Class B | 1,200 | 1,208,026 | ||||||||||
Hertz Vehicle Financing II LP | 1,000 | 955,644 | ||||||||||
Series 2017-1A, Class A | 1,510 | 1,411,891 | ||||||||||
Series 2019-1A, Class A | 1,190 | 1,148,459 | ||||||||||
Series 2019-2A, Class A | 1,000 | 909,795 | ||||||||||
|
| |||||||||||
| 11,616,090 | ||||||||||||
|
| |||||||||||
Credit Cards - Fixed Rate – 0.8% | ||||||||||||
World Financial Network Credit Card Master Trust | 1,675 | 1,686,293 | ||||||||||
Series 2018-B, Class A | 850 | 851,930 | ||||||||||
Series 2018-B, Class M | 935 | 931,890 | ||||||||||
Series 2019-B, Class M | 1,070 | 1,028,418 | ||||||||||
|
| |||||||||||
| 4,498,531 | ||||||||||||
|
| |||||||||||
| abfunds.com | AB BOND INFLATION STRATEGY | 35 | |
PORTFOLIO OF INVESTMENTS (continued)
| Principal Amount (000) | U.S. $ Value | |||||||||||
| ||||||||||||
Other ABS - Fixed Rate – 0.7% | ||||||||||||
Consumer Loan Underlying Bond Credit Trust | U.S.$ | 85 | $ | 84,057 | ||||||||
Marlette Funding Trust | 117 | 117,009 | ||||||||||
Series 2018-4A, Class A | 375 | 371,153 | ||||||||||
Prosper Marketplace Issuance Trust | 286 | 280,638 | ||||||||||
SBA Tower Trust | 851 | 851,902 | ||||||||||
SoFi Consumer Loan Program LLC | 14 | 14,211 | ||||||||||
Series 2016-3, Class A | 39 | 38,827 | ||||||||||
Series 2017-2, Class A | 181 | 180,818 | ||||||||||
Series 2017-5, Class A2 | 474 | 458,253 | ||||||||||
Series 2017-6, Class A2 | 502 | 498,028 | ||||||||||
SoFi Consumer Loan Program Trust | 1,063 | 1,048,415 | ||||||||||
|
| |||||||||||
| 3,943,311 | ||||||||||||
|
| |||||||||||
Total Asset-Backed Securities | 20,057,932 | |||||||||||
|
| |||||||||||
GOVERNMENTS – TREASURIES – 2.0% |
| |||||||||||
Malaysia – 0.3% | ||||||||||||
Malaysia Government Bond | MYR | 6,633 | 1,582,267 | |||||||||
|
| |||||||||||
United States – 1.7% | ||||||||||||
U.S. Treasury Bonds | U.S.$ | 7,205 | 10,207,458 | |||||||||
|
| |||||||||||
Total Governments - Treasuries | 11,789,725 | |||||||||||
|
| |||||||||||
| 36 | AB BOND INFLATION STRATEGY | abfunds.com | |
PORTFOLIO OF INVESTMENTS (continued)
| Principal Amount (000) | U.S. $ Value | |||||||||||
| ||||||||||||
CORPORATES – NON-INVESTMENT GRADE – 1.6% | ||||||||||||
Industrial – 1.2% | ||||||||||||
Capital Goods – 0.1% | ||||||||||||
TransDigm, Inc. | U.S.$ | 512 | $ | 503,199 | ||||||||
|
| |||||||||||
Communications - Media – 0.3% | ||||||||||||
CCO Holdings LLC/CCO Holdings Capital Corp. | 656 | 664,508 | ||||||||||
5.00%, 02/01/2028(c) | 702 | 721,544 | ||||||||||
CSC Holdings LLC | 145 | 151,201 | ||||||||||
Diamond Sports Group LLC/Diamond Sports Finance Co. | 407 | 309,422 | ||||||||||
|
| |||||||||||
| 1,846,675 | ||||||||||||
|
| |||||||||||
Consumer Cyclical - Automotive – 0.0% |
| |||||||||||
Panther BF Aggregator 2 LP/Panther Finance Co., Inc. | EUR | 191 | 193,710 | |||||||||
|
| |||||||||||
Consumer Cyclical - Other – 0.2% | ||||||||||||
International Game Technology PLC | U.S.$ | 360 | 351,752 | |||||||||
6.50%, 02/15/2025(c) | 460 | 451,306 | ||||||||||
|
| |||||||||||
| 803,058 | ||||||||||||
|
| |||||||||||
Consumer Non-Cyclical – 0.2% | ||||||||||||
Albertsons Cos., Inc./Safeway, Inc./New Albertsons LP/Albertsons LLC | 1,160 | 1,148,203 | ||||||||||
|
| |||||||||||
Energy – 0.4% | ||||||||||||
Occidental Petroleum Corp. | 1,074 | 745,904 | ||||||||||
Sunoco LP/Sunoco Finance Corp. | 618 | 604,935 | ||||||||||
5.875%, 03/15/2028 | 640 | 609,318 | ||||||||||
Transocean Poseidon Ltd. | 388 | 301,806 | ||||||||||
|
| |||||||||||
| 2,261,963 | ||||||||||||
|
| |||||||||||
Technology – 0.0% | ||||||||||||
CommScope, Inc. | 138 | 138,290 | ||||||||||
|
| |||||||||||
| 6,895,098 | ||||||||||||
|
| |||||||||||
| abfunds.com | AB BOND INFLATION STRATEGY | 37 | |
PORTFOLIO OF INVESTMENTS (continued)
| Principal Amount (000) | U.S. $ Value | |||||||||||
| ||||||||||||
Financial Institutions – 0.4% | ||||||||||||
Banking – 0.2% | ||||||||||||
Credit Suisse Group AG | U.S.$ | 320 | $ | 315,338 | ||||||||
7.50%, 07/17/2023(c)(d) | 1,099 | 1,098,901 | ||||||||||
|
| |||||||||||
| 1,414,239 | ||||||||||||
|
| |||||||||||
Finance – 0.2% | ||||||||||||
Navient Corp. | 722 | 667,929 | ||||||||||
6.625%, 07/26/2021 | 415 | 412,693 | ||||||||||
7.25%, 01/25/2022 | 54 | 52,986 | ||||||||||
|
| |||||||||||
| 1,133,608 | ||||||||||||
|
| |||||||||||
| 2,547,847 | ||||||||||||
|
| |||||||||||
Total Corporates – Non-Investment Grade | 9,442,945 | |||||||||||
|
| |||||||||||
GOVERNMENTS – SOVEREIGN BONDS – 0.9% | ||||||||||||
Israel – 0.1% | ||||||||||||
Israel Government International Bond | 656 | 725,495 | ||||||||||
|
| |||||||||||
Mexico – 0.1% | ||||||||||||
Mexico Government International Bond | 723 | 729,868 | ||||||||||
|
| |||||||||||
Peru – 0.1% | ||||||||||||
Peruvian Government International Bond | 349 | 354,235 | ||||||||||
|
| |||||||||||
Qatar – 0.2% | ||||||||||||
Qatar Government International Bond | 741 | 788,470 | ||||||||||
|
| |||||||||||
Saudi Arabia – 0.2% | ||||||||||||
Saudi Government International Bond | 1,112 | 1,126,452 | ||||||||||
|
| |||||||||||
United Arab Emirates – 0.2% | ||||||||||||
Abu Dhabi Government International Bond | 643 | 660,681 | ||||||||||
3.875%, 04/16/2050(c) | 550 | 584,370 | ||||||||||
|
| |||||||||||
| 1,245,051 | ||||||||||||
|
| |||||||||||
Total Governments – Sovereign Bonds | 4,969,571 | |||||||||||
|
| |||||||||||
| 38 | AB BOND INFLATION STRATEGY | abfunds.com | |
PORTFOLIO OF INVESTMENTS (continued)
| Principal Amount (000) | U.S. $ Value | |||||||||||
| ||||||||||||
COLLATERALIZED LOAN OBLIGATIONS – 0.7% | ||||||||||||
CLO - Floating Rate – 0.7% | ||||||||||||
Dryden CLO Ltd. | U.S.$ | 700 | $ | 700,000 | ||||||||
Series 2020-78A, Class C | 880 | 776,607 | ||||||||||
Series 2020-78A, Class D | 460 | 364,473 | ||||||||||
Elevation CLO Ltd. | 780 | 632,235 | ||||||||||
Goldentree Loan Management US CLO 7 Ltd. | 1,024 | 1,024,255 | ||||||||||
Kayne CLO Ltd. | 400 | 348,858 | ||||||||||
Voya CLO Ltd. | 340 | 266,838 | ||||||||||
|
| |||||||||||
Total Collateralized Loan Obligations | 4,113,266 | |||||||||||
|
| |||||||||||
QUASI-SOVEREIGNS – 0.5% | ||||||||||||
Quasi-Sovereign Bonds – 0.5% | ||||||||||||
Chile – 0.1% | ||||||||||||
Corp. Nacional del Cobre de Chile | 655 | 632,894 | ||||||||||
3.75%, 01/15/2031(c) | 202 | 205,290 | ||||||||||
|
| |||||||||||
| 838,184 | ||||||||||||
|
| |||||||||||
Indonesia – 0.2% | ||||||||||||
Pertamina Persero PT | 575 | 636,453 | ||||||||||
Perusahaan Listrik Negara PT | 305 | 331,307 | ||||||||||
|
| |||||||||||
| 967,760 | ||||||||||||
|
| |||||||||||
| abfunds.com | AB BOND INFLATION STRATEGY | 39 | |
PORTFOLIO OF INVESTMENTS (continued)
| Principal Amount (000) | U.S. $ Value | |||||||||||
| ||||||||||||
Malaysia – 0.1% | ||||||||||||
Petronas Capital Ltd. | U.S.$ | 705 | $ | 774,090 | ||||||||
|
| |||||||||||
Mexico – 0.1% | ||||||||||||
Petroleos Mexicanos | 529 | 365,142 | ||||||||||
6.84%, 01/23/2030(c) | 258 | 202,127 | ||||||||||
|
| |||||||||||
| 567,269 | ||||||||||||
|
| |||||||||||
Total Quasi-Sovereigns | 3,147,303 | |||||||||||
|
| |||||||||||
EMERGING MARKETS – CORPORATE BONDS – 0.3% | ||||||||||||
Industrial – 0.3% | ||||||||||||
Capital Goods – 0.0% | ||||||||||||
Odebrecht Finance Ltd. | 426 | 17,083 | ||||||||||
|
| |||||||||||
Communications - Media – 0.1% | ||||||||||||
Globo Comunicacao e Participacoes SA | 427 | 380,030 | ||||||||||
|
| |||||||||||
Consumer Non - Cyclical – 0.1% | ||||||||||||
BRF GmbH | 328 | 283,611 | ||||||||||
BRF SA | 312 | 293,475 | ||||||||||
Virgolino de Oliveira Finance SA | 655 | 5,633 | ||||||||||
|
| |||||||||||
| 582,719 | ||||||||||||
|
| |||||||||||
Transportation - Services – 0.1% | ||||||||||||
Rumo Luxembourg SARL | 458 | 451,702 | ||||||||||
|
| |||||||||||
| 1,431,534 | ||||||||||||
|
| |||||||||||
Utility – 0.0% | ||||||||||||
Electric – 0.0% | ||||||||||||
Terraform Global Operating LLC | 203 | 201,652 | ||||||||||
|
| |||||||||||
Total Emerging Markets – Corporate Bonds | 1,633,186 | |||||||||||
|
| |||||||||||
| 40 | AB BOND INFLATION STRATEGY | abfunds.com | |
PORTFOLIO OF INVESTMENTS (continued)
| Principal Amount (000) | U.S. $ Value | |||||||||||
| ||||||||||||
EMERGING MARKETS - TREASURIES – 0.2% | ||||||||||||
South Africa – 0.2% | ||||||||||||
Republic of South Africa Government Bond | ZAR | 23,482 | $ | 1,089,138 | ||||||||
|
| |||||||||||
| Notional Amount | ||||||||||||
OPTIONS PURCHASED – PUTS – 0.1% | ||||||||||||
Swaptions – 0.1% | ||||||||||||
IRS Swaption | USD | 11,650,000 | 405,652 | |||||||||
IRS Swaption | 10,010,000 | 180,787 | ||||||||||
|
| |||||||||||
Total Options Purchased – Puts | 586,439 | |||||||||||
|
| |||||||||||
| Shares | ||||||||||||
COMMON STOCKS – 0.1% | ||||||||||||
Financials – 0.1% | ||||||||||||
Insurance – 0.1% | ||||||||||||
Mt Logan Re Ltd. (Preference Shares)(i)(l)(m)(n) | 260 | 254,834 | ||||||||||
|
| |||||||||||
| Principal Amount (000) | ||||||||||||
EMERGING MARKETS – | ||||||||||||
Egypt – 0.0% | ||||||||||||
Egypt Government International Bond | U.S.$ | 255 | 254,123 | |||||||||
|
| |||||||||||
| abfunds.com | AB BOND INFLATION STRATEGY | 41 | |
PORTFOLIO OF INVESTMENTS (continued)
| Notional Amount | U.S. $ Value | |||||||||||
| ||||||||||||
OPTIONS PURCHASED – | ||||||||||||
Swaptions – 0.0% | ||||||||||||
IRS Swaption | USD | 13,670,000 | $ | 111,421 | ||||||||
|
| |||||||||||
Total Investments – 137.0% | 795,617,756 | |||||||||||
Other assets less liabilities – (37.0)% | (214,663,237 | ) | ||||||||||
|
| |||||||||||
Net Assets – 100.0% | $ | 580,954,519 | ||||||||||
|
| |||||||||||
FUTURES (see Note D)
| Description | Number of Contracts | Expiration Month | Current Notional | Value and Unrealized Appreciation/ (Depreciation) | ||||||||||||
Purchased Contracts | ||||||||||||||||
U.S. 10 Yr Ultra Futures | 33 | June 2020 | $ | 5,182,030 | $ | 223,346 | ||||||||||
Sold Contracts | ||||||||||||||||
10 Yr Japan Bond (OSE) Futures | 4 | June 2020 | 5,695,010 | 69,119 | ||||||||||||
U.S. T-Note 2 Yr (CBT) Futures | 47 | June 2020 | 10,360,194 | (994 | ) | |||||||||||
U.S. T-Note 5 Yr (CBT) Futures | 219 | June 2020 | 27,481,078 | 8,283 | ||||||||||||
U.S. T-Note 10 Yr (CBT) Futures | 365 | June 2020 | 50,757,812 | (2,398,645 | ) | |||||||||||
U.S. Ultra Bond(CBT) Futures | 111 | June 2020 | 24,950,719 | (1,570,035 | ) | |||||||||||
|
| |||||||||||||||
| $ | (3,668,926 | ) | ||||||||||||||
|
| |||||||||||||||
FORWARD CURRENCY EXCHANGE CONTRACTS (see Note D)
| Counterparty | Contracts to Deliver (000) | In Exchange For (000) | Settlement Date | Unrealized Appreciation/ (Depreciation) | ||||||||||||||||||||
Bank of America, NA | CAD | 2,862 | USD | 1,994 | 05/22/2020 | $ | (62,487 | ) | ||||||||||||||||
Bank of America, NA | CAD | 1,153 | USD | 831 | 05/22/2020 | 3,243 | ||||||||||||||||||
BNP Paribas SA | CAD | 1,268 | USD | 898 | 05/22/2020 | (12,495 | ) | |||||||||||||||||
BNP Paribas SA | EUR | 655 | USD | 715 | 06/10/2020 | (3,697 | ) | |||||||||||||||||
Citibank, NA | JPY | 502,358 | USD | 4,616 | 06/05/2020 | (66,707 | ) | |||||||||||||||||
Goldman Sachs Bank USA | MYR | 6,876 | USD | 1,675 | 08/13/2020 | 85,448 | ||||||||||||||||||
Standard Chartered Bank | EUR | 392 | USD | 427 | 06/10/2020 | (3,321 | ) | |||||||||||||||||
Standard Chartered Bank | GBP | 17 | USD | 22 | 05/15/2020 | 632 | ||||||||||||||||||
|
| |||||||||||||||||||||||
| $ | (59,384 | ) | ||||||||||||||||||||||
|
| |||||||||||||||||||||||
| 42 | AB BOND INFLATION STRATEGY | abfunds.com | |
PORTFOLIO OF INVESTMENTS (continued)
INTEREST RATE SWAPTIONS WRITTEN (see Note D)
| Description | Index | Counter- Party | Strike Rate | Expiration Date | Notional Amount (000) | Premiums Received | Market Value | |||||||||||||||||||||||||
Call | ||||||||||||||||||||||||||||||||
OTC – 1 Year Interest Rate Swap | | 3 Month LIBOR | | | Bank of America, NA | | 0.52 | % | 10/28/2020 | USD | 11,650 | $ | 377,387 | $ | (302,154 | ) | ||||||||||||||||
OTC – 1 Year Interest Rate Swap | | 6 Month EURIBOR | | | Citibank, NA | | 0.16 | 06/30/2020 | USD | 11,337 | 340,164 | (279,934 | ) | |||||||||||||||||||
OTC – 1 Year Interest Rate Swap | | 3 Month LIBOR | | | JPMorgan Chase Bank, NA | | 0.23 | 09/23/2020 | USD | 10,010 | 430,430 | (100,237 | ) | |||||||||||||||||||
|
|
|
| |||||||||||||||||||||||||||||
| $ | 1,147,981 | $ | (682,325 | ) | ||||||||||||||||||||||||||||
|
|
|
| |||||||||||||||||||||||||||||
CENTRALLY CLEARED CREDIT DEFAULT SWAPS (see Note D)
| Description | Fixed Rate (Pay) Receive | Payment Freq- uency | Implied Credit Spread at April 30, 2020 | Notional Amount (000) | Market Value | Upfront Premiums Paid/ (Received) | Unrealized Appreciation/ (Depreciation) | |||||||||||||||||||||
Buy Contracts |
| |||||||||||||||||||||||||||
CDX-NAIG Series 34, 5 Year Index, 06/20/2025* | (1.00 | )% | Quarterly | 0.88 | % | USD | 156,560 | $ | (1,117,155 | ) | $ | 998,879 | $ | (2,116,034 | ) | |||||||||||||
| * | Termination date. |
CENTRALLY CLEARED INFLATION (CPI) SWAPS (see Note D)
Rate Type | ||||||||||||||||||||||||||
Notional Amount | Termination Date | Payments made by the Fund | Payments received by the Fund | Payment Frequency Paid/ Received | Market Value | Upfront Premiums Paid/ (Received) | Unrealized Appreciation/ (Depreciation) | |||||||||||||||||||
| USD | 6,000 | 7/15/20 | 1.613% | CPI# | Maturity | $ | (15,834 | ) | $ | — | $ | (15,834 | ) | |||||||||||||
| USD | 6,000 | 7/15/20 | CPI# | 1.613% | Maturity | 79,500 | 79,500 | 0 | ||||||||||||||||||
| USD | 64,600 | 2/26/22 | CPI# | 1.440% | Maturity | 1,762,189 | — | 1,762,189 | ||||||||||||||||||
| USD | 38,550 | 2/28/22 | CPI# | 1.352% | Maturity | 980,431 | — | 980,431 | ||||||||||||||||||
| USD | 4,500 | 7/15/22 | 1.484% | CPI# | Maturity | (117,219 | ) | — | (117,219 | ) | ||||||||||||||||
| USD | 11,250 | 7/15/22 | 1.575% | CPI# | Maturity | (324,669 | ) | — | (324,669 | ) | ||||||||||||||||
| USD | 9,450 | 7/15/22 | 1.758% | CPI# | Maturity | (317,863 | ) | — | (317,863 | ) | ||||||||||||||||
| USD | 12,000 | 7/15/22 | 1.850% | CPI# | Maturity | (450,427 | ) | — | (450,427 | ) | ||||||||||||||||
| USD | 21,500 | 7/15/22 | 1.851% | CPI# | Maturity | (808,149 | ) | — | (808,149 | ) | ||||||||||||||||
| USD | 9,000 | 7/15/23 | 1.902% | CPI# | Maturity | (417,320 | ) | — | (417,320 | ) | ||||||||||||||||
| USD | 3,000 | 1/15/24 | 1.599% | CPI# | Maturity | (99,670 | ) | — | (99,670 | ) | ||||||||||||||||
| USD | 64,600 | 2/26/25 | 1.589% | CPI# | Maturity | (2,535,933 | ) | — | (2,535,933 | ) | ||||||||||||||||
| USD | 38,550 | 2/28/25 | 1.527% | CPI# | Maturity | (1,390,007 | ) | — | (1,390,007 | ) | ||||||||||||||||
|
|
|
|
|
| |||||||||||||||||||||
| $ | (3,654,971 | ) | $ | 79,500 | $ | (3,734,471 | ) | |||||||||||||||||||
|
|
|
|
|
| |||||||||||||||||||||
| # | Variable interest rate based on the rate of inflation as determined by the Consumer Price Index (CPI). |
| abfunds.com | AB BOND INFLATION STRATEGY | 43 | |
PORTFOLIO OF INVESTMENTS (continued)
CENTRALLY CLEARED INTEREST RATE SWAPS (see Note D)
| Rate Type | ||||||||||||||||||||||||||||
Notional (000) | Termination Date | Payments made by the Fund | Payments received by the Fund | Payment Frequency Paid/ Received | Market Value | Upfront Premiums Paid/ (Received) | Unrealized Appreciation/ (Depreciation) | |||||||||||||||||||||
CAD | 49,600 | 08/27/2021 | | 3 Month CDOR | | 1.623% | Semi-Annual/ Semi-Annual | $ | 437,205 | $ | 224 | $ | 436,981 | |||||||||||||||
SEK | 217,650 | 08/30/2024 | | 3 Month STIBOR | | (0.165)% | Quarterly/ Annual | (320,169 | ) | 143 | (320,312 | ) | ||||||||||||||||
CAD | 47,597 | 01/14/2025 | | 3 Month CDOR | | 1.950% | Semi-Annual/ Semi-Annual | 1,919,451 | 99 | 1,919,352 | ||||||||||||||||||
CAD | 34,424 | 03/24/2025 | | 3 Month CDOR | | 0.938% | Semi-Annual/ Semi-Annual | 159,701 | 398 | 159,303 | ||||||||||||||||||
CAD | 34,186 | 03/24/2025 | | 3 Month CDOR | | 0.958% | Semi-Annual/ Semi-Annual | 182,934 | 383 | 182,551 | ||||||||||||||||||
USD | 1,160 | 06/09/2025 | 2.488% | 3 Month LIBOR | Semi-Annual/Quarterly | (132,110 | ) | — | (132,110 | ) | ||||||||||||||||||
USD | 2,106 | 08/04/2025 | 2.293% | 3 Month LIBOR | Semi-Annual/Quarterly | (210,311 | ) | — | (210,311 | ) | ||||||||||||||||||
USD | 5,400 | 10/04/2026 | 1.487% | 3 Month LIBOR | Semi-Annual/Quarterly | (340,402 | ) | — | (340,402 | ) | ||||||||||||||||||
USD | 1,080 | 11/08/2026 | 1.657% | 3 Month LIBOR | Semi-Annual/Quarterly | (86,208 | ) | — | (86,208 | ) | ||||||||||||||||||
USD | 1,080 | 11/09/2026 | 1.672% | 3 Month LIBOR | Semi-Annual/Quarterly | (87,294 | ) | — | (87,294 | ) | ||||||||||||||||||
USD | 7,030 | 04/04/2027 | 2.436% | 3 Month LIBOR | Semi-Annual/Quarterly | (929,988 | ) | — | (929,988 | ) | ||||||||||||||||||
USD | 715 | 07/12/2027 | 2.355% | 3 Month LIBOR | Semi-Annual/Quarterly | (97,463 | ) | — | (97,463 | ) | ||||||||||||||||||
USD | 5,395 | 06/04/2029 | 2.150% | 3 Month LIBOR | Semi-Annual/Quarterly | (783,547 | ) | — | (783,547 | ) | ||||||||||||||||||
USD | 3,170 | 09/27/2029 | 1.593% | 3 Month LIBOR | Semi-Annual/Quarterly | (285,883 | ) | — | (285,883 | ) | ||||||||||||||||||
JPY | 2,034,920 | 12/13/2029 | | 6 Month LIBOR | | 0.080% | Semi-Annual/ Semi-Annual | 211,592 | — | 211,592 | ||||||||||||||||||
USD | 3,530 | 12/13/2029 | 1.764 | % | 3 Month LIBOR | Semi-Annual/Quarterly | (402,255 | ) | — | (402,255 | ) | |||||||||||||||||
USD | 1,490 | 11/10/2035 | 2.631 | % | 3 Month LIBOR | Semi-Annual/Quarterly | (435,132 | ) | — | (435,132 | ) | |||||||||||||||||
CAD | 10,080 | 01/14/2050 | 2.210 | % | 3 Month CDOR | Semi-Annual/Semi-Annual | (1,457,919 | ) | 32 | (1,457,951 | ) | |||||||||||||||||
USD | 7,850 | 03/20/2050 | 1.093 | % | 3 Month LIBOR | Semi-Annual/Quarterly | (597,858 | ) | — | (597,858 | ) | |||||||||||||||||
|
|
|
|
|
| |||||||||||||||||||||||
| $ | (3,255,656 | ) | $ | 1,279 | $ | (3,256,935 | ) | |||||||||||||||||||||
|
|
|
|
|
| |||||||||||||||||||||||
| 44 | AB BOND INFLATION STRATEGY | abfunds.com | |
PORTFOLIO OF INVESTMENTS (continued)
CREDIT DEFAULT SWAPS (see Note D)
| Swap Counterparty & Referenced Obligation | Fixed Rate (Pay)/ Receive | Payment Frequency | Implied Credit Spread at April 30, 2020 | Notional | Market Value | Upfront Premiums Paid/ (Received) | Unrealized Appreciation/ (Depreciation) | |||||||||||||||||||||||||
Buy Contracts |
| |||||||||||||||||||||||||||||||
Citigroup Global Markets, Inc. |
| |||||||||||||||||||||||||||||||
CDX-CMBX.NA.BBB-. Series 9, 09/17/2058* | (3.00 | )% | Monthly | 8.90 | % | USD | 1,683 | $ | 461,114 | $ | 117,093 | $ | 344,021 | |||||||||||||||||||
CDX-CMBX.NA.BBB-. Series 9, 09/17/2058* | (3.00 | ) | Monthly | 8.90 | USD | 1,367 | 374,535 | 98,430 | 276,105 | |||||||||||||||||||||||
CDX-CMBX.NA.BBB-. Series 9, 09/17/2058* | (3.00 | ) | Monthly | 8.90 | USD |
| 1,367 |
| 374,535 | 101,900 | 272,635 | |||||||||||||||||||||
CDX-CMBX.NA.BBB-. Series 9, 09/17/2058* | (3.00 | ) | Monthly | 8.90 | USD | 683 | 187,131 | 54,074 | 133,057 | |||||||||||||||||||||||
CDX-CMBX.NA.BBB-. Series 9, 09/17/2058* | (3.00 | ) | Monthly | 8.90 | USD | 346 | 94,799 | 23,423 | 71,376 | |||||||||||||||||||||||
CDX-CMBX.NA.BBB-. Series 9, 09/17/2058* | (3.00 | ) | Monthly | 8.90 | USD | 346 | 94,799 | 23,423 | 71,376 | |||||||||||||||||||||||
CDX-CMBX.NA.BBB-. Series 9, 09/17/2058* | (3.00 | ) | Monthly | 8.90 | USD | 328 | 89,867 | 22,702 | 67,165 | |||||||||||||||||||||||
Sale Contracts |
| |||||||||||||||||||||||||||||||
Citibank, NA | ||||||||||||||||||||||||||||||||
CDX-CMBX.NA.BBB- Series 6, 05/11/2063* | 3.00 | Monthly | 13.94 | USD | 69 | (22,431 | ) | (8,814 | ) | (13,617 | ) | |||||||||||||||||||||
CDX-CMBX.NA.BBB- Series 6, 05/11/2063* | 3.00 | Monthly | 13.94 | USD | 292 | (94,925 | ) | (36,746 | ) | (58,179 | ) | |||||||||||||||||||||
Citigroup Global Markets, Inc. |
| |||||||||||||||||||||||||||||||
CDX-CMBX.NA.BB Series 6, 05/11/2063* | 5.00 | Monthly | 25.00 | USD | 1,200 | (618,079 | ) | (170,593 | ) | (447,486 | ) | |||||||||||||||||||||
CDX-CMBX.NA.BB Series 6, 05/11/2063* | 5.00 | Monthly | 25.00 | USD | 1,668 | (859,131 | ) | (266,748 | ) | (592,383 | ) | |||||||||||||||||||||
CDX-CMBX.NA.BB Series 6, 05/11/2063* | 5.00 | Monthly | 25.00 | USD | 188 | (96,832 | ) | (30,261 | ) | (66,571 | ) | |||||||||||||||||||||
CDX-CMBX.NA.BB Series 6, 05/11/2063* | 5.00 | Monthly | 25.00 | USD | 21 | (10,817 | ) | (3,346 | ) | (7,471 | ) | |||||||||||||||||||||
CDX-CMBX.NA.BB Series 6, 05/11/2063* | 5.00 | Monthly | 25.00 | USD | 33 | (17,002 | ) | (5,238 | ) | (11,764 | ) | |||||||||||||||||||||
CDX-CMBX.NA.BB Series 6, 05/11/2063* | 5.00 | Monthly | 25.00 | USD | 362 | (186,455 | ) | (56,132 | ) | (130,323 | ) | |||||||||||||||||||||
| abfunds.com | AB BOND INFLATION STRATEGY | 45 | |
PORTFOLIO OF INVESTMENTS (continued)
| Swap Counterparty & Referenced Obligation | Fixed Rate (Pay)/ Receive | Payment Frequency | Implied Credit Spread at April 30, 2020 | Notional | Market Value | Upfront Premiums Paid/ (Received) | Unrealized Appreciation/ (Depreciation) | |||||||||||||||||||||||||
CDX-CMBX.NA.BB Series 6, 05/11/2063* | 5.00 | % | Monthly | 25.00 | % | USD | 181 | $ | (93,227 | ) | $ | (27,739 | ) | $ | (65,488 | ) | ||||||||||||||||
CDX-CMBX.NA.BBB- Series 6, 05/11/2063* | 3.00 | Monthly | 13.94 | USD | 723 | (234,975 | ) | (88,747 | ) | (146,228 | ) | |||||||||||||||||||||
CDX-CMBX.NA.BBB- Series 6, 05/11/2063* | 3.00 | Monthly | 13.94 | USD | 210 | (68,250 | ) | (28,280 | ) | (39,970 | ) | |||||||||||||||||||||
CDX-CMBX.NA.BBB- Series 6, 05/11/2063* | 3.00 | Monthly | 13.94 | USD | 248 | (80,600 | ) | (32,622 | ) | (47,978 | ) | |||||||||||||||||||||
CDX-CMBX.NA.BBB- Series 6, 05/11/2063* | 3.00 | Monthly | 13.94 | USD | 547 | (177,775 | ) | (83,288 | ) | (94,487 | ) | |||||||||||||||||||||
CDX-CMBX.NA.BBB- Series 6, 05/11/2063* | 3.00 | Monthly | 13.94 | USD | 376 | (122,231 | ) | (40,127 | ) | (82,104 | ) | |||||||||||||||||||||
CDX-CMBX.NA.BBB- Series 6, 05/11/2063* | 3.00 | Monthly | 13.94 | USD | 1,016 | (330,285 | ) | (108,567 | ) | (221,718 | ) | |||||||||||||||||||||
CDX-CMBX.NA.BBB- Series 6, 05/11/2063* | 3.00 | Monthly | 13.94 | USD | 1,620 | (526,635 | ) | (172,230 | ) | (354,405 | ) | |||||||||||||||||||||
CDX-CMBX.NA.BBB- Series 6, 05/11/2063* | 3.00 | Monthly | 13.94 | USD | 953 | (309,805 | ) | (103,744 | ) | (206,061 | ) | |||||||||||||||||||||
CDX-CMBX.NA.BBB- Series 6, 05/11/2063* | 3.00 | Monthly | 13.94 | USD | 1,367 | (444,388 | ) | (151,792 | ) | (292,596 | ) | |||||||||||||||||||||
CDX-CMBX.NA.BBB- Series 6, 05/11/2063* | 3.00 | Monthly | 13.94 | USD | 950 | (308,830 | ) | (105,489 | ) | (203,341 | ) | |||||||||||||||||||||
CDX-CMBX.NA.BBB- Series 6, 05/11/2063* | 3.00 | Monthly | 13.94 | USD | 683 | (222,032 | ) | (77,554 | ) | (144,478 | ) | |||||||||||||||||||||
CDX-CMBX.NA.BBB- Series 6, 05/11/2063* | 3.00 | Monthly | 13.94 | USD | 475 | (154,415 | ) | (53,936 | ) | (100,479 | ) | |||||||||||||||||||||
CDX-CMBX.NA.BBB- Series 6, 05/11/2063* | 3.00 | Monthly | 13.94 | USD | 335 | (108,903 | ) | (43,545 | ) | (65,358 | ) | |||||||||||||||||||||
CDX-CMBX.NA.BBB- Series 6, 05/11/2063* | 3.00 | Monthly | 13.94 | USD | 209 | (67,925 | ) | (30,893 | ) | (37,032 | ) | |||||||||||||||||||||
CDX-CMBX.NA.BBB- Series 6, 05/11/2063* | 3.00 | Monthly | 13.94 | USD | 67 | (21,775 | ) | (10,704 | ) | (11,071 | ) | |||||||||||||||||||||
CDX-CMBX.NA.BBB- Series 6, 05/11/2063* | 3.00 | Monthly | 13.94 | USD | 340 | (110,528 | ) | (42,786 | ) | (67,742 | ) | |||||||||||||||||||||
| 46 | AB BOND INFLATION STRATEGY | abfunds.com | |
PORTFOLIO OF INVESTMENTS (continued)
| Swap Counterparty & Referenced Obligation | Fixed Rate (Pay)/ Receive | Payment Frequency | Implied Credit Spread at April 30, 2020 | Notional | Market Value | Upfront Premiums Paid/ (Received) | Unrealized Appreciation/ (Depreciation) | |||||||||||||||||||||||||
CDX-CMBX.NA.BBB- Series 6, 05/11/2063* | 3.00 | % | Monthly | 13.94 | % | USD | 475 | $ | (154,415 | ) | $ | (59,775 | ) | $ | (94,640 | ) | ||||||||||||||||
CDX-CMBX.NA.BBB- Series 6, 05/11/2063* | 3.00 | Monthly | 13.94 | USD | 653 | (212,334 | ) | (78,102 | ) | (134,232 | ) | |||||||||||||||||||||
CDX-CMBX.NA.BBB- Series 6, 05/11/2063* | 3.00 | Monthly | 13.94 | USD | 195 | (63,408 | ) | (23,323 | ) | (40,085 | ) | |||||||||||||||||||||
CDX-CMBX.NA.BBB- Series 6, 05/11/2063* | 3.00 | Monthly | 13.94 | USD | 100 | (32,500 | ) | (10,088 | ) | (22,412 | ) | |||||||||||||||||||||
Credit Suisse International |
| |||||||||||||||||||||||||||||||
CDX-CMBX.NA.A Series 6, 05/11/63* | 2.00 | Monthly | 6.85 | USD | 1,145 | (161,636 | ) | (25,257 | ) | (136,379 | ) | |||||||||||||||||||||
CDX-CMBX.NA.BBB- Series 6, 05/11/2063* | 3.00 | Monthly | 13.94 | USD | 122 | (39,650 | ) | (14,749 | ) | (24,901 | ) | |||||||||||||||||||||
CDX-CMBX.NA.BBB- Series 6, 05/11/2063* | 3.00 | Monthly | 13.94 | USD | 169 | (54,925 | ) | (13,882 | ) | (41,043 | ) | |||||||||||||||||||||
CDX-CMBX.NA.BBB- Series 6, 05/11/2063* | 3.00 | Monthly | 13.94 | USD | 130 | (42,250 | ) | (10,456 | ) | (31,794 | ) | |||||||||||||||||||||
CDX-CMBX.NA.BBB- Series 6, 05/11/2063* | 3.00 | Monthly | 13.94 | USD | 326 | (105,950 | ) | (30,850 | ) | (75,100 | ) | |||||||||||||||||||||
CDX-CMBX.NA.BBB- Series 6, 05/11/2063* | 3.00 | Monthly | 13.94 | USD | 138 | (44,850 | ) | (9,463 | ) | (35,387 | ) | |||||||||||||||||||||
CDX-CMBX.NA.BBB- Series 6, 05/11/2063* | 3.00 | Monthly | 13.94 | USD | 471 | (153,075 | ) | (30,221 | ) | (122,854 | ) | |||||||||||||||||||||
CDX-CMBX.NA.BBB- Series 6, 05/11/2063* | 3.00 | Monthly | 13.94 | USD | 226 | (73,450 | ) | (33,254 | ) | (40,196 | ) | |||||||||||||||||||||
CDX-CMBX.NA.BBB- Series 6, 05/11/2063* | 3.00 | Monthly | 13.94 | USD | 139 | (45,186 | ) | (17,104 | ) | (28,082 | ) | |||||||||||||||||||||
CDX-CMBX.NA.BBB- Series 6, 05/11/2063* | 3.00 | Monthly | 13.94 | USD | 5 | (1,625 | ) | (619 | ) | (1,006 | ) | |||||||||||||||||||||
Deutsche Bank AG |
| |||||||||||||||||||||||||||||||
CDX-CMBX.NA.BBB- Series 6, 05/11/2063* | 3.00 | Monthly | 13.94 | USD | 130 | (42,250 | ) | (16,248 | ) | (26,002 | ) | |||||||||||||||||||||
CDX-CMBX.NA.BBB- Series 6, 05/11/2063* | 3.00 | Monthly | 13.94 | USD | 436 | (141,700 | ) | (31,024 | ) | (110,676 | ) | |||||||||||||||||||||
| abfunds.com | AB BOND INFLATION STRATEGY | 47 | |
PORTFOLIO OF INVESTMENTS (continued)
| Swap Counterparty & Referenced Obligation | Fixed Rate (Pay)/ Receive | Payment Frequency | Implied Credit Spread at April 30, 2020 | Notional | Market Value | Upfront Premiums Paid/ (Received) | Unrealized Appreciation/ (Depreciation) | |||||||||||||||||||||||||
CDX-CMBX.NA.BBB- Series 6, 05/11/2063* | 3.00 | % | Monthly | 13.94 | % | USD | 247 | $ | (80,275 | ) | $ | (26,392 | ) | $ | (53,883 | ) | ||||||||||||||||
CDX-CMBX.NA.BBB- Series 6, 05/11/2063* | 3.00 | Monthly | 13.94 | USD | 218 | (70,850 | ) | (24,723 | ) | (46,127 | ) | |||||||||||||||||||||
CDX-CMBX.NA.BBB- Series 6, 05/11/2063* | 3.00 | Monthly | 13.94 | USD | 217 | (70,525 | ) | (24,619 | ) | (45,906 | ) | |||||||||||||||||||||
CDX-CMBX.NA.BBB- Series 6, 05/11/2063* | 3.00 | Monthly | 13.94 | USD | 150 | (48,750 | ) | (18,747 | ) | (30,003 | ) | |||||||||||||||||||||
CDX-CMBX.NA.BBB- Series 6, 05/11/2063* | 3.00 | Monthly | 13.94 | USD | 30 | (9,750 | ) | (3,488 | ) | (6,262 | ) | |||||||||||||||||||||
CDX-CMBX.NA.BBB- Series 6, 05/11/2063* | 3.00 | Monthly | 13.94 | USD | 714 | (232,050 | ) | (40,649 | ) | (191,401 | ) | |||||||||||||||||||||
CDX-CMBX.NA.BBB- Series 6, 05/11/2063* | 3.00 | Monthly | 13.94 | USD | 662 | (215,150 | ) | (46,018 | ) | (169,132 | ) | |||||||||||||||||||||
CDX-CMBX.NA.BBB- Series 6, 05/11/2063* | 3.00 | Monthly | 13.94 | USD | 464 | (150,800 | ) | (37,854 | ) | (112,946 | ) | |||||||||||||||||||||
Goldman Sachs International |
| |||||||||||||||||||||||||||||||
CDX-CMBX.NA.BBB- Series 6, 05/11/2063* | 3.00 | Monthly | 13.94 | USD | 1,300 | (422,500 | ) | (152,300 | ) | (270,200 | ) | |||||||||||||||||||||
CDX-CMBX.NA.BBB- Series 6, 05/11/2063* | 3.00 | Monthly | 13.94 | USD | 710 | (230,750 | ) | (81,085 | ) | (149,665 | ) | |||||||||||||||||||||
CDX-CMBX.NA.BBB- Series 6, 05/11/2063* | 3.00 | Monthly | 13.94 | USD | 1,000 | (325,084 | ) | (131,311 | ) | (193,773 | ) | |||||||||||||||||||||
CDX-CMBX.NA.BBB- Series 6, 05/11/2063* | 3.00 | Monthly | 13.94 | USD | 166 | (53,950 | ) | (17,541 | ) | (36,409 | ) | |||||||||||||||||||||
CDX-CMBX.NA.BBB- Series 6, 05/11/2063* | 3.00 | Monthly | 13.94 | USD | 322 | (104,650 | ) | (43,465 | ) | (61,185 | ) | |||||||||||||||||||||
CDX-CMBX.NA.BBB- Series 6, 05/11/2063* | 3.00 | Monthly | 13.94 | USD | 59 | (19,175 | ) | (6,317 | ) | (12,858 | ) | |||||||||||||||||||||
CDX-CMBX.NA.BBB- Series 6, 05/11/2063* | 3.00 | Monthly | 13.94 | USD | 30 | (9,750 | ) | (2,939 | ) | (6,811 | ) | |||||||||||||||||||||
CDX-CMBX.NA.BBB- Series 6, 05/11/2063* | 3.00 | Monthly | 13.94 | USD | 30 | (9,750 | ) | (2,716 | ) | (7,034 | ) | |||||||||||||||||||||
CDX-CMBX.NA.BBB- Series 6, 05/11/2063* | 3.00 | Monthly | 13.94 | USD | 15 | (4,875 | ) | (1,333 | ) | (3,542 | ) | |||||||||||||||||||||
| 48 | AB BOND INFLATION STRATEGY | abfunds.com | |
PORTFOLIO OF INVESTMENTS (continued)
| Swap Counterparty & Referenced Obligation | Fixed Rate (Pay)/ Receive | Payment Frequency | Implied Credit Spread at April 30, 2020 | Notional | Market Value | Upfront Premiums Paid/ (Received) | Unrealized Appreciation/ (Depreciation) | |||||||||||||||||||||
CDX-CMBX.NA.BBB- Series 6, 05/11/2063* | 3.00 | % | Monthly | 13.94 | % | USD | 178 | $ | (57,850 | ) | $ | (15,256 | ) | $ | (42,594 | ) | ||||||||||||
CDX-CMBX.NA.BBB- Series 6, 05/11/2063* | 3.00 | Monthly | 13.94 | USD | 598 | (194,350 | ) | (91,175 | ) | (103,175 | ) | |||||||||||||||||
CDX-CMBX.NA.BBB- Series 6, 05/11/2063* | 3.00 | Monthly | 13.94 | USD | 15 | (4,875 | ) | (2,260 | ) | (2,615 | ) | |||||||||||||||||
CDX-CMBX.NA.BBB- Series 6, 05/11/2063* | 3.00 | Monthly | 13.94 | USD | 517 | (168,025 | ) | (85,017 | ) | (83,008 | ) | |||||||||||||||||
CDX-CMBX.NA.BBB- Series 6, 05/11/2063* | 3.00 | Monthly | 13.94 | USD | 371 | (120,575 | ) | (60,143 | ) | (60,432 | ) | |||||||||||||||||
CDX-CMBX.NA.BBB- Series 6, 05/11/2063* | 3.00 | Monthly | 13.94 | USD | 27 | (8,777 | ) | (3,434 | ) | (5,343 | ) | |||||||||||||||||
JPMorgan Securities, LLC |
| |||||||||||||||||||||||||||
CDX-CMBX.NA.BBB- Series 6, 05/11/2063* | 3.00 | Monthly | 13.94 | % | USD | 122 | (39,650 | ) | (11,773 | ) | (27,877 | ) | ||||||||||||||||
CDX-CMBX.NA.BBB- Series 6, 05/11/2063* | 3.00 | Monthly | 13.94 | USD | 28 | (9,100 | ) | (2,709 | ) | (6,391 | ) | |||||||||||||||||
CDX-CMBX.NA.BBB- Series 6, 05/11/2063* | 3.00 | Monthly | 13.94 | USD | 30 | (9,750 | ) | (2,904 | ) | (6,846 | ) | |||||||||||||||||
CDX-CMBX.NA.BBB- Series 6, 05/11/2063* | 3.00 | Monthly | 13.94 | USD | 691 | (224,575 | ) | (84,051 | ) | (140,524 | ) | |||||||||||||||||
CDX-CMBX.NA.BBB- Series 6, 05/11/2063* | 3.00 | Monthly | 13.94 | USD | 241 | (78,325 | ) | (29,573 | ) | (48,752 | ) | |||||||||||||||||
CDX-CMBX.NA.BBB- Series 6, 05/11/2063* | 3.00 | Monthly | 13.94 | USD | 118 | (38,350 | ) | (14,935 | ) | (23,415 | ) | |||||||||||||||||
Morgan Stanley & Co. International PLC |
| |||||||||||||||||||||||||||
CDX-CMBX.NA.BBB- Series 6, 05/11/2063* | 3.00 | Monthly | 13.94 | USD | 1,100 | (357,500 | ) | (161,240 | ) | (196,260 | ) | |||||||||||||||||
Morgan Stanley Capital Services LLC |
| |||||||||||||||||||||||||||
CDX-CMBX.NA.BBB- Series 6, 05/11/2063* | 3.00 | Monthly | 13.94 | USD | 191 | (62,075 | ) | (13,359 | ) | (48,716 | ) | |||||||||||||||||
|
|
|
|
|
| |||||||||||||||||||||||
| $ | (8,413,086 | ) | $ | (2,982,617 | ) | $ | (5,430,469 | ) | ||||||||||||||||||||
|
|
|
|
|
| |||||||||||||||||||||||
| * | Termination date |
| abfunds.com | AB BOND INFLATION STRATEGY | 49 | |
PORTFOLIO OF INVESTMENTS (continued)
INFLATION (CPI) SWAPS (see Note D)
| Rate Type | ||||||||||||||||||||||||||||||||||||
| Swap Counterparty | Notional Amount (000) | Termina- tion | Pay- ments | Payments received by the Fund | Payment Frequency Paid Received | Market Value | Up ums ved) | Unrealized ciation/ ciation) | ||||||||||||||||||||||||||||
JPMorgan Chase Bank, NA | USD | 23,800 | 07/15/2023 | 1.848 | % | CPI | # | Maturity | $ | (1,034,511 | ) | $ | — | $ | (1,034,511 | ) | ||||||||||||||||||||
Morgan Stanley Capital Services LLC | USD | 595 | 03/06/2042 | 2.804 | % | | 3 Month LIBOR | | | Semi- Annual/ Quarterly |
| (249,113 | ) | — | (249,113 | ) | ||||||||||||||||||||
|
|
|
|
|
| |||||||||||||||||||||||||||||||
| $ | (1,283,624 | ) | $ | — | $ | (1,283,624 | ) | |||||||||||||||||||||||||||||
|
|
|
|
|
| |||||||||||||||||||||||||||||||
| # | Variable interest rate based on the rate of inflation as determined by the Consumer Price Index (CPI). |
REVERSE REPURCHASE AGREEMENTS (see Note D)
| Broker | Interest Rate | Maturity | U.S. $ Value at April 30, 2020 | |||||||||
HSBC Bank USA† | 0.13 | % | — | $ | 23,927,387 | |||||||
HSBC Bank USA† | 0.13 | % | — | 35,742,864 | ||||||||
HSBC Bank USA† | 0.13 | % | — | 29,936,358 | ||||||||
HSBC Bank USA† | 0.13 | % | — | 7,510,202 | ||||||||
JPMorgan Chase Bank† | 0.11 | % | — | 41,352,048 | ||||||||
JPMorgan Chase Bank† | 0.11 | % | — | 26,514,201 | ||||||||
JPMorgan Chase Bank† | 0.11 | % | — | 66,121,579 | ||||||||
|
| |||||||||||
| $ | 231,104,639 | |||||||||||
|
| |||||||||||
| † | The reverse repurchase agreement matures on demand. Interest rate resets daily and the rate shown is the rate in effect on April 30, 2020. |
The type of underlying collateral and the remaining maturity of open reverse repurchase agreements on the statements of assets and liabilities is as follows:
| Overnight and Continuous | Up to 30 Days | 31-90 Days | Greater than 90 Days | Total | ||||||||||||||||
Inflation-Linked Securities | $ | 231,104,639 | $ | – 0 | – | $ | – 0 | – | $ | – 0 | – | $ | 231,104,639 | |||||||
| (a) | Position, or a portion thereof, has been segregated to collateralize reverse repurchase agreements. |
| (b) | Position, or a portion thereof, has been segregated to collateralize OTC derivatives outstanding. |
| (c) | Security is exempt from registration under Rule 144A of the Securities Act of 1933. These securities are considered restricted, but liquid and may be resold in transactions exempt from registration, normally to qualified institutional buyers. At April 30, 2020, the aggregate market value of these securities amounted to $87,785,414 or 15.1% of net assets. |
| (d) | Securities are perpetual and, thus, do not have a predetermined maturity date. The date shown, if applicable, reflects the next call date. |
| (e) | Floating Rate Security. Stated interest/floor/ceiling rate was in effect at April 30, 2020. |
| (f) | IO - Interest Only. |
| 50 | AB BOND INFLATION STRATEGY | abfunds.com | |
PORTFOLIO OF INVESTMENTS (continued)
| (g) | Security is exempt from registration under Rule 144A of the Securities Act of 1933. These securities, which represent 0.97% of net assets as of April 30, 2020, are considered illiquid and restricted. Additional information regarding such securities follows: |
| 144A/Restricted & Illiquid Securities | Acquisition Date | Cost | Market Value | Percentage of Net Assets | ||||||||||||
BAMLL Commercial Mortgage Securities Trust | 12/04/2017 | $ | 1,755,000 | $ | 1,693,679 | 0.29 | % | |||||||||
BHMS | 07/13/2018 | 1,000,967 | 929,334 | 0.16 | % | |||||||||||
JP Morgan Chase Commercial Mortgage Securities Trust | 02/11/2000 | 149,000 | 134,619 | 0.02 | % | |||||||||||
Morgan Stanley Capital I Trust | 11/16/2015 | 181,901 | 165,596 | 0.03 | % | |||||||||||
PMT Credit Risk Transfer Trust | 03/21/2019 | 364,794 | 285,470 | 0.05 | % | |||||||||||
PMT Credit Risk Transfer Trust | 06/07/2019 | 690,501 | 512,247 | 0.09 | % | |||||||||||
PMT Credit Risk Transfer Trust | 10/11/2019 | 250,934 | 191,062 | 0.03 | % | |||||||||||
PMT Credit Risk Transfer Trust | 02/11/2000 | 893,405 | 669,295 | 0.12 | % | |||||||||||
SBA Tower Trust | 10/06/2015 | 851,000 | 851,902 | 0.15 | % | |||||||||||
Terraform Global Operating LLC | 02/08/2018 | 203,000 | 201,652 | 0.03 | % | |||||||||||
Virgolino de Oliveira Finance SA | 01/24/2014 | 363,153 | 5,633 | 0.00 | % | |||||||||||
| (h) | Inverse interest only security. |
| (i) | Non-income producing security. |
| (j) | Defaulted. |
| (k) | Defaulted matured security. |
| (l) | Fair valued by the Adviser. |
| (m) | Security in which significant unobservable inputs (Level 3) were used in determining fair value. |
| (n) | Restricted and illiquid security. |
| Restricted & Illiquid Securities | Acquisition Date | Cost | Market Value | Percentage of Net Assets | ||||||||||||
Mt Logan Re Ltd.(Preference Shares) | 12/30/2014 | $ | 260,000 | $ | 254,834 | 0.04 | % | |||||||||
| abfunds.com | AB BOND INFLATION STRATEGY | 51 | |
PORTFOLIO OF INVESTMENTS (continued)
Currency Abbreviations:
CAD – Canadian Dollar EUR – Euro GBP – Great British Pound JPY – Japanese Yen MYR – Malaysian Ringgit SEK – Swedish Krona USD – United States Dollar ZAR – South African Rand | Glossary:
ABS – Asset-Backed Securities CBT – Chicago Board of Trade CDOR – Canadian Dealer Offered Rate CDX-CMBX.NA – North American Commercial Mortgage-Backed Index CDX-NAIG – North American Investment Grade Credit Default Swap Index CLO – Collateralized Loan Obligations CMBS – Commercial Mortgage-Backed Securities CPI – Consumer Price Index EURIBOR – Euro Interbank Offered Rate IRS – Interest Rate Swaption LIBOR – London Interbank Offered Rates OSE – Osaka Securities Exchange REIT – Real Estate Investment Trust REMICs – Real Estate Mortgage Investment Conduits STIBOR – Stockholm Interbank Offered Rate TIPS – Treasury Inflation Protected Security |
See notes to financial statements.
| 52 | AB BOND INFLATION STRATEGY | abfunds.com | |
STATEMENT OF ASSETS & LIABILITIES
April 30, 2020 (unaudited)
| Assets | ||||
Investments in securities, at value (cost $777,676,232) | $ | 795,617,756 | ||
Cash | 1,951,591 | |||
Cash collateral due from broker | 15,111,248 | |||
Foreign currencies, at value (cost $61,908) | 59,452 | |||
Receivable for investment securities sold | 28,220,504 | |||
Interest receivable | 2,363,559 | |||
Market value on credit default swaps (net premiums paid $441,045) | 1,676,780 | |||
Receivable for capital stock sold | 1,193,097 | |||
Unrealized appreciation on forward currency exchange contracts | 89,323 | |||
Receivable for variation margin on futures | 44,893 | |||
Receivable for variation margin on centrally cleared swaps | 12,287 | |||
Affiliated dividends receivable | 1,174 | |||
|
| |||
Total assets | 846,341,664 | |||
|
| |||
| Liabilities | ||||
Swaptions written, at value (premiums received $1,147,981) | 682,325 | |||
Payable for reverse repurchase agreements | 231,104,639 | |||
Payable for investment securities purchased | 17,085,479 | |||
Market value on credit default swaps (net premiums received $3,423,662) | 10,089,866 | |||
Cash collateral due to broker | 3,603,000 | |||
Unrealized depreciation on inflation swaps | 1,283,624 | |||
Payable for capital stock redeemed | 965,082 | |||
Advisory fee payable | 151,690 | |||
Unrealized depreciation on forward currency exchange contracts | 148,707 | |||
Distribution fee payable | 36,076 | |||
Administrative fee payable | 22,276 | |||
Transfer Agent fee payable | 13,863 | |||
Directors’ fees payable | 2,050 | |||
Payable for newly entered centrally cleared interest rate swaps | 79,500 | |||
Accrued expenses and other liabilities | 118,968 | |||
|
| |||
Total liabilities | 265,387,145 | |||
|
| |||
Net Assets | $ | 580,954,519 | ||
|
| |||
| Composition of Net Assets | ||||
Capital stock, at par | $ | 54,593 | ||
Additional paid-in capital | 594,919,912 | |||
Accumulated loss | (14,019,986 | ) | ||
|
| |||
| $ | 580,954,519 | |||
|
|
See notes to financial statements.
| abfunds.com | AB BOND INFLATION STRATEGY | 53 | |
STATEMENT OF ASSETS & LIABILITIES (continued)
Net Asset Value Per Share—33 billion shares of capital stock authorized, $.001 par value
| Class | Net Assets | Shares Outstanding | Net Asset Value | |||||||||
| ||||||||||||
| A | $ | 28,273,485 | 2,626,077 | $ | 10.77 | * | ||||||
| ||||||||||||
| C | $ | 3,129,962 | 298,564 | $ | 10.48 | |||||||
| ||||||||||||
| Advisor | $ | 143,567,686 | 13,322,362 | $ | 10.78 | |||||||
| ||||||||||||
| R | $ | 2,958,876 | 274,988 | $ | 10.76 | |||||||
| ||||||||||||
| K | $ | 5,813,460 | 541,259 | $ | 10.74 | |||||||
| ||||||||||||
| I | $ | 10,343,819 | 970,794 | $ | 10.66 | |||||||
| ||||||||||||
| 1 | $ | 300,238,857 | 28,376,916 | $ | 10.58 | |||||||
| ||||||||||||
| 2 | $ | 54,544,366 | 5,158,117 | $ | 10.57 | |||||||
| ||||||||||||
| Z | $ | 32,084,008 | 3,024,144 | $ | 10.61 | |||||||
| ||||||||||||
| * | The maximum offering price per share for Class A shares was $11.25 which reflects a sales charge of 4.25%. |
See notes to financial statements.
| 54 | AB BOND INFLATION STRATEGY | abfunds.com | |
STATEMENT OF OPERATIONS
Six Months Ended April 30, 2020 (unaudited)
| Investment Income | ||||||||
Interest | $ | 10,182,550 | ||||||
Dividends—Affiliated issuers | 25,513 | |||||||
Other income | 885 | $ | 10,208,948 | |||||
|
| |||||||
| Expenses | ||||||||
Advisory fee (see Note B) | 1,559,008 | |||||||
Distribution fee—Class A | 47,358 | |||||||
Distribution fee—Class C | 13,781 | |||||||
Distribution fee—Class R | 10,067 | |||||||
Distribution fee—Class K | 6,737 | |||||||
Distribution fee—Class 1 | 155,485 | |||||||
Transfer agency—Class A | 27,847 | |||||||
Transfer agency—Class C | 2,089 | |||||||
Transfer agency—Advisor Class | 118,354 | |||||||
Transfer agency—Class R | 5,208 | |||||||
Transfer agency—Class K | 5,389 | |||||||
Transfer agency—Class I | 5,120 | |||||||
Transfer agency—Class 1 | 19,255 | |||||||
Transfer agency—Class 2 | 3,664 | |||||||
Transfer agency—Class Z | 3,255 | |||||||
Custodian | 92,781 | |||||||
Registration fees | 70,220 | |||||||
Audit and tax | 56,251 | |||||||
Printing | 46,558 | |||||||
Administrative | 44,430 | |||||||
Legal | 19,620 | |||||||
Directors’ fees | 11,560 | |||||||
Miscellaneous | 9,873 | |||||||
|
| |||||||
Total expenses before interest expense | 2,333,910 | |||||||
Interest expense | 736,508 | |||||||
|
| |||||||
Total expenses | 3,070,418 | |||||||
Less: expenses waived and reimbursed by the Adviser (see Note B) | (543,560 | ) | ||||||
|
| |||||||
Net expenses | 2,526,858 | |||||||
|
| |||||||
Net investment income | 7,682,090 | |||||||
|
|
See notes to financial statements.
| abfunds.com | AB BOND INFLATION STRATEGY | 55 | |
STATEMENT OF OPERATIONS (continued)
Six Months Ended April 30, 2020 (unaudited)
| Realized and Unrealized Gain (Loss) on Investment and Foreign Currency Transactions | ||||||||
Net realized gain (loss) on: | ||||||||
Investment transactions | $ | 3,002,692 | ||||||
Forward currency exchange contracts | 2,468,828 | |||||||
Futures | (2,045,317 | ) | ||||||
Swaps | 2,776,369 | |||||||
Foreign currency transactions | (2,453,431 | ) | ||||||
Net change in unrealized appreciation/depreciation of: | ||||||||
Investments(a) | (833,380 | ) | ||||||
Forward currency exchange contracts | (11,110 | ) | ||||||
Futures | (4,113,927 | ) | ||||||
Swaps | (13,218,782 | ) | ||||||
Swaptions written | 465,656 | |||||||
Foreign currency denominated assets and liabilities | 54,158 | |||||||
|
| |||||||
Net loss on investment and foreign currency transactions | (13,908,244 | ) | ||||||
|
| |||||||
Net Decrease in Net Assets from Operations | $ | (6,226,154 | ) | |||||
|
|
| (a) | Net of decrease in accrued foreign capital gains taxes of $19,807. |
See notes to financial statements.
| 56 | AB BOND INFLATION STRATEGY | abfunds.com | |
STATEMENT OF CHANGES IN NET ASSETS
| Six Months Ended | Year Ended | |||||||
| April 30, 2020 (unaudited) | October 31, 2019 | |||||||
| Increase (Decrease) in Net Assets from Operations | ||||||||
Net investment income | $ | 7,682,090 | $ | 14,513,091 | ||||
Net realized gain (loss) on investment and foreign currency transactions | 3,749,141 | (6,508,444 | ) | |||||
Net change in unrealized appreciation/depreciation of investments and foreign currency denominated assets and liabilities | (17,657,385 | ) | 34,328,281 | |||||
Contributions from Affiliates (see Note B) | – 0 | – | 5,918 | |||||
|
|
|
| |||||
Net increase (decrease) in net assets from operations | (6,226,154 | ) | 42,338,846 | |||||
Distributions to Shareholders | ||||||||
Class A | (265,843 | ) | (872,187 | ) | ||||
Class C | (12,475 | ) | (51,492 | ) | ||||
Advisor Class | (1,360,491 | ) | (4,083,274 | ) | ||||
Class R | (29,227 | ) | (132,330 | ) | ||||
Class K | (40,366 | ) | (152,387 | ) | ||||
Class I | (87,857 | ) | (225,817 | ) | ||||
Class 1 | (2,739,030 | ) | (8,206,740 | ) | ||||
Class 2 | (528,045 | ) | (1,472,842 | ) | ||||
Class Z | (296,931 | ) | (817,986 | ) | ||||
Return of capital | ||||||||
Class A | – 0 | – | (20,252 | ) | ||||
Class C | – 0 | – | (1,196 | ) | ||||
Advisor Class | – 0 | – | (94,813 | ) | ||||
Class R | – 0 | – | (3,073 | ) | ||||
Class K | – 0 | – | (3,538 | ) | ||||
Class I | – 0 | – | (5,243 | ) | ||||
Class 1 | – 0 | – | (190,560 | ) | ||||
Class 2 | – 0 | – | (34,199 | ) | ||||
Class Z | – 0 | – | (18,994 | ) | ||||
| Capital Stock Transactions | ||||||||
Net increase (decrease) | (49,580,752 | ) | 3,088,080 | |||||
|
|
|
| |||||
Total increase (decrease) | (61,167,171 | ) | 29,040,003 | |||||
| Net Assets | ||||||||
Beginning of period | 642,121,690 | 613,081,687 | ||||||
|
|
|
| |||||
End of period | $ | 580,954,519 | $ | 642,121,690 | ||||
|
|
|
| |||||
See notes to financial statements.
| abfunds.com | AB BOND INFLATION STRATEGY | 57 | |
STATEMENT OF CASH FLOWS
For the six months ended April 30, 2020 (unaudited)
| Cash flows from operating activities | ||||||||
Net decrease in net assets from operations | $ | (6,226,154 | ) | |||||
| Reconciliation of net decrease in net assets from operations to net decrease in cash from operating activities | ||||||||
Purchases of long-term investments | $ | (264,834,580 | ) | |||||
Purchases of short-term investments | (213,615,875 | ) | ||||||
Proceeds from disposition of long-term investments | 211,717,201 | |||||||
Proceeds from disposition of short-term investments | 213,174,056 | |||||||
Net realized gain on investment transactions and foreign currency transactions | (3,749,141 | ) | ||||||
Net realized gain on forward currency exchange contracts | 2,468,828 | |||||||
Net change in unrealized appreciation/depreciation of investments and foreign currency denominated assets and liabilities | 17,657,385 | |||||||
Net accretion of bond discount and amortization of bond premium | 1,186,335 | |||||||
Inflation index adjustment | (3,951,789 | ) | ||||||
Increase in receivable for investments sold | (28,102,017 | ) | ||||||
Decrease in interest receivable | 146,531 | |||||||
Decrease in affiliated dividends receivable | 4,483 | |||||||
Increase in cash collateral due from broker | (10,183,253 | ) | ||||||
Increase in payable for investments purchased | 13,764,376 | |||||||
Increase in cash collateral due to broker | 3,518,000 | |||||||
Increase in advisory fee payable | 9,723 | |||||||
Decrease in administrative fee payable | (2,307 | ) | ||||||
Decrease in Transfer Agent fee payable | (541 | ) | ||||||
Decrease in distribution fee payable | (5,516 | ) | ||||||
Increase in Directors’ fee payable | 114 | |||||||
Decrease in accrued expenses | (150,900 | ) | ||||||
Proceeds from swaptions written, net | 1,147,981 | |||||||
Payments on swaps, net | (259,698 | ) | ||||||
Payments for exchange-traded derivatives settlements, net | (10,035,106 | ) | ||||||
|
| |||||||
Total adjustments | (70,095,710 | ) | ||||||
|
| |||||||
Net cash provided by (used in) operating activities | (76,321,864 | ) | ||||||
| Cash flows from financing activities | ||||||||
Redemptions of capital stock, net | (52,756,138 | ) | ||||||
Cash dividends paid (net of dividend reinvestments)† | (1,116,740 | ) | ||||||
Increase in reverse repurchase agreements | 134,564,467 | |||||||
|
| |||||||
Net cash provided by (used in) financing activities | 80,691,589 | |||||||
Effect of exchange rate on cash | (2,399,273 | ) | ||||||
|
| |||||||
Net increase in cash | 1,970,452 | |||||||
Cash at beginning of period | 40,591 | |||||||
|
| |||||||
Cash at end of period | $ | 2,011,043 | ||||||
|
| |||||||
| Supplemental disclosure of cash flow information | ||||||||
† Reinvestment of dividends | $ | 4,243,525 | ||||||
Interest expense paid during the period | $ | 994,663 |
In accordance with U.S. GAAP, the Fund has included a Statement of Cash Flows as a result of its significant investments in reverse repurchase agreements throughout the period.
See notes to financial statements.
| 58 | AB BOND INFLATION STRATEGY | abfunds.com | |
NOTES TO FINANCIAL STATEMENTS
April 30, 2020 (unaudited)
NOTE A
Significant Accounting Policies
AB Bond Fund, Inc. (the “Company”) is registered under the Investment Company Act of 1940 as an open-end management investment company. The Company, which is a Maryland corporation, operates as a series company comprised of ten portfolios currently in operation. Each portfolio is considered to be a separate entity for financial reporting and tax purposes. This report relates only to the AB Bond Inflation Strategy Portfolio (the “Fund”), a diversified portfolio. The Fund has authorized the issuance of Class A, Class B, Class C, Advisor Class, Class R, Class K, Class I, Class Z, Class T, Class 1 and Class 2. Class B and Class T shares have not been issued. Class 1 shares are sold only to the private clients of Sanford C. Bernstein & Co. LLC by its registered representatives. Class A shares are sold with a front-end sales charge of up to 4.25% for purchases not exceeding $1,000,000. With respect to purchases of $1,000,000 or more, Class A shares redeemed within one year of purchase may be subject to a contingent deferred sales charge of 1%. Class C shares are subject to a contingent deferred sales charge of 1% on redemptions made within the first year after purchase, and 0% after the first year of purchase. Class C shares will automatically convert to Class A shares ten years after the end of the calendar month of purchase. Class R, Class K, and Class 1 shares are sold without an initial or contingent deferred sales charge. Advisor Class, Class I, Class 2 and Class Z shares are sold without an initial or contingent deferred sales charge and are not subject to ongoing distribution expenses. All eleven classes of shares have identical voting, dividend, liquidation and other rights, except that the classes bear different distribution and transfer agency expenses. Each class has exclusive voting rights with respect to its distribution plan. The financial statements have been prepared in conformity with U.S. generally accepted accounting principles (“U.S. GAAP”) which require management to make certain estimates and assumptions that affect the reported amounts of assets and liabilities in the financial statements and amounts of income and expenses during the reporting period. Actual results could differ from those estimates. The Fund is an investment company under U.S. GAAP and follows the accounting and reporting guidance applicable to investment companies. The following is a summary of significant accounting policies followed by the Fund.
1. Security Valuation
Portfolio securities are valued at their current market value determined on the basis of market quotations or, if market quotations are not readily available or are deemed unreliable, at “fair value” as determined in accordance with procedures established by and under the general supervision of the Company’s Board of Directors (the “Board”).
| abfunds.com | AB BOND INFLATION STRATEGY | 59 | |
NOTES TO FINANCIAL STATEMENTS (continued)
In general, the market values of securities which are readily available and deemed reliable are determined as follows: securities listed on a national securities exchange (other than securities listed on the NASDAQ Stock Market, Inc. (“NASDAQ”)) or on a foreign securities exchange are valued at the last sale price at the close of the exchange or foreign securities exchange. If there has been no sale on such day, the securities are valued at the last traded price from the previous day. Securities listed on more than one exchange are valued by reference to the principal exchange on which the securities are traded; securities listed only on NASDAQ are valued in accordance with the NASDAQ Official Closing Price; listed or over the counter (“OTC”) market put or call options are valued at the mid level between the current bid and ask prices. If either a current bid or current ask price is unavailable, AllianceBernstein L.P. (the “Adviser”) will have discretion to determine the best valuation (e.g., last trade price in the case of listed options); open futures are valued using the closing settlement price or, in the absence of such a price, the most recent quoted bid price. If there are no quotations available for the day of valuation, the last available closing settlement price is used; U.S. Government securities and any other debt instruments having 60 days or less remaining until maturity are generally valued at market by an independent pricing vendor, if a market price is available. If a market price is not available, the securities are valued at amortized cost. This methodology is commonly used for short term securities that have an original maturity of 60 days or less, as well as short term securities that had an original term to maturity that exceeded 60 days. In instances when amortized cost is utilized, the Valuation Committee (the “Committee”) must reasonably conclude that the utilization of amortized cost is approximately the same as the fair value of the security. Such factors the Committee will consider include, but are not limited to, an impairment of the creditworthiness of the issuer or material changes in interest rates. Fixed-income securities, including mortgage-backed and asset-backed securities, may be valued on the basis of prices provided by a pricing service or at a price obtained from one or more of the major broker-dealers. In cases where broker-dealer quotes are obtained, the Adviser may establish procedures whereby changes in market yields or spreads are used to adjust, on a daily basis, a recently obtained quoted price on a security. Swaps and other derivatives are valued daily, primarily using independent pricing services, independent pricing models using market inputs, as well as third party broker-dealers or counterparties. Open end mutual funds are valued at the closing net asset value per share, while exchange traded funds are valued at the closing market price per share.
Securities for which market quotations are not readily available (including restricted securities) or are deemed unreliable are valued at fair value as deemed appropriate by the Adviser. Factors considered in making this
| 60 | AB BOND INFLATION STRATEGY | abfunds.com | |
NOTES TO FINANCIAL STATEMENTS (continued)
determination may include, but are not limited to, information obtained by contacting the issuer, analysts, analysis of the issuer’s financial statements or other available documents. In addition, the Fund may use fair value pricing for securities primarily traded in non-U.S. markets because most foreign markets close well before the Fund values its securities at 4:00 p.m., Eastern Time. The earlier close of these foreign markets gives rise to the possibility that significant events, including broad market moves, may have occurred in the interim and may materially affect the value of those securities. To account for this, the Fund generally values many of its foreign equity securities using fair value prices based on third party vendor modeling tools to the extent available.
2. Fair Value Measurements
In accordance with U.S. GAAP regarding fair value measurements, fair value is defined as the price that the Fund would receive to sell an asset or pay to transfer a liability in an orderly transaction between market participants at the measurement date. U.S. GAAP establishes a framework for measuring fair value, and a three-level hierarchy for fair value measurements based upon the transparency of inputs to the valuation of an asset or liability (including those valued based on their market values as described in Note A.1 above). Inputs may be observable or unobservable and refer broadly to the assumptions that market participants would use in pricing the asset or liability. Observable inputs reflect the assumptions market participants would use in pricing the asset or liability based on market data obtained from sources independent of the Fund. Unobservable inputs reflect the Fund’s own assumptions about the assumptions that market participants would use in pricing the asset or liability based on the best information available in the circumstances. Each investment is assigned a level based upon the observability of the inputs which are significant to the overall valuation. The three-tier hierarchy of inputs is summarized below.
| • | Level 1—quoted prices in active markets for identical investments |
| • | Level 2—other significant observable inputs (including quoted prices for similar investments, interest rates, prepayment speeds, credit risk, etc.) |
| • | Level 3—significant unobservable inputs (including the Fund’s own assumptions in determining the fair value of investments) |
The fair value of debt instruments, such as bonds, and over-the-counter derivatives is generally based on market price quotations, recently executed market transactions (where observable) or industry recognized modeling techniques and are generally classified as Level 2. Pricing vendor inputs to Level 2 valuations may include quoted prices for similar investments in active markets, interest rate curves, coupon rates, currency rates, yield curves, option adjusted spreads, default rates, credit spreads and
| abfunds.com | AB BOND INFLATION STRATEGY | 61 | |
NOTES TO FINANCIAL STATEMENTS (continued)
other unique security features in order to estimate the relevant cash flows which are then discounted to calculate fair values. If these inputs are unobservable and significant to the fair value, these investments will be classified as Level 3.
Where readily available market prices or relevant bid prices are not available for certain equity investments, such investments may be valued based on similar publicly traded investments, movements in relevant indices since last available prices or based upon underlying company fundamentals and comparable company data (such as multiples to earnings or other multiples to equity). Where an investment is valued using an observable input, such as another publicly traded security, the investment will be classified as Level 2. If management determines that an adjustment is appropriate based on restrictions on resale, illiquidity or uncertainty, and such adjustment is a significant component of the valuation, the investment will be classified as Level 3. An investment will also be classified as Level 3 where management uses company fundamentals and other significant inputs to determine the valuation.
Valuations of mortgage-backed or other asset-backed securities, by pricing vendors, are based on both proprietary and industry recognized models and discounted cash flow techniques. Significant inputs to the valuation of these instruments are value of the collateral, the rates and timing of delinquencies, the rates and timing of prepayments, and default and loss expectations, which are driven in part by housing prices for residential mortgages. Significant inputs are determined based on relative value analyses, which incorporate comparisons to instruments with similar collateral and risk profiles, including relevant indices. Mortgage and asset-backed securities for which management has collected current observable data through pricing services are generally categorized within Level 2. Those investments for which current observable data has not been provided are classified as Level 3.
Other fixed income investments, including non-U.S. government and corporate debt, are generally valued using quoted market prices, if available, which are typically impacted by current interest rates, maturity dates and any perceived credit risk of the issuer. Additionally, in the absence of quoted market prices, these inputs are used by pricing vendors to derive a valuation based upon industry or proprietary models which incorporate issuer specific data with relevant yield/spread comparisons with more widely quoted bonds with similar key characteristics. Those investments for which there are observable inputs are classified as Level 2. Where the inputs are not observable, the investments are classified as Level 3.
| 62 | AB BOND INFLATION STRATEGY | abfunds.com | |
NOTES TO FINANCIAL STATEMENTS (continued)
The following table summarizes the valuation of the Fund’s investments by the above fair value hierarchy levels as of April 30, 2020:
Investments in | Level 1 | Level 2 | Level 3 | Total | ||||||||||||
Assets: | ||||||||||||||||
Inflation-Linked Securities | $ | – 0 | – | $ | 536,495,436 | $ | – 0 | – | $ | 536,495,436 | ||||||
Corporates – Investment Grade | – 0 | – | 115,154,256 | – 0 | – | 115,154,256 | ||||||||||
Commercial Mortgage-Backed Securities | – 0 | – | 51,110,575 | – 0 | – | 51,110,575 | ||||||||||
Collateralized Mortgage Obligations | – 0 | – | 35,407,606 | – 0 | – | 35,407,606 | ||||||||||
Asset-Backed Securities | – 0 | – | 20,057,932 | – 0 | – | 20,057,932 | ||||||||||
Governments – Treasuries | – 0 | – | 11,789,725 | – 0 | – | 11,789,725 | ||||||||||
Corporates – Non-Investment Grade | – 0 | – | 9,442,945 | – 0 | – | 9,442,945 | ||||||||||
Governments – Sovereign Bonds | – 0 | – | 4,969,571 | – 0 | – | 4,969,571 | ||||||||||
Collateralized Loan Obligations | – 0 | – | 4,113,266 | – 0 | – | 4,113,266 | ||||||||||
Quasi-Sovereigns | – 0 | – | 3,147,303 | – 0 | – | 3,147,303 | ||||||||||
Emerging Markets – Corporate Bonds | – 0 | – | 1,633,186 | – 0 | – | 1,633,186 | ||||||||||
Emerging Markets – Treasuries | – 0 | – | 1,089,138 | – 0 | – | 1,089,138 | ||||||||||
Options Purchased – Puts | – 0 | – | 586,439 | – 0 | – | 586,439 | ||||||||||
Common Stocks | – 0 | – | – 0 | – | 254,834 | 254,834 | ||||||||||
Emerging Markets – Sovereigns | – 0 | – | 254,123 | – 0 | – | 254,123 | ||||||||||
Options Purchased – Calls | �� | – 0 | – | 111,421 | – 0 | – | 111,421 | |||||||||
|
|
|
|
|
|
|
| |||||||||
Total Investments in Securities | – 0 | – | 795,362,922 | 254,834 | 795,617,756 | |||||||||||
Other Financial Instruments(a): | ||||||||||||||||
Assets: | ||||||||||||||||
Futures | 300,748 | – 0 | – | – 0 | – | 300,748 | (b) | |||||||||
Forward Currency Exchange Contracts | – 0 | – | 89,323 | – 0 | – | 89,323 | ||||||||||
Centrally Cleared Inflation (CPI) Swaps | – 0 | – | 2,822,120 | – 0 | – | 2,822,120 | (b) | |||||||||
Centrally Cleared Interest Rate Swaps | – 0 | – | 2,910,883 | – 0 | – | 2,910,883 | (b) | |||||||||
Credit Default Swaps | – 0 | – | 1,676,780 | – 0 | – | 1,676,780 | ||||||||||
Liabilities: | ||||||||||||||||
Futures | (3,969,674 | ) | – 0 | – | – 0 | – | (3,969,674 | )(b) | ||||||||
Forward Currency Exchange Contracts | – 0 | – | (148,707 | ) | – 0 | – | (148,707 | ) | ||||||||
Interest Rate Swaptions | – 0 | – | (682,325 | ) | – 0 | – | (682,325 | ) | ||||||||
Centrally Cleared Credit Default Swaps | – 0 | – | (1,117,155 | ) | – 0 | – | (1,117,155 | )(b) | ||||||||
Centrally Cleared Inflation (CPI) Swaps | – 0 | – | (6,477,091 | ) | – 0 | – | (6,477,091 | )(b) | ||||||||
Centrally Cleared Interest Rate Swaps | – 0 | – | (6,166,539 | ) | – 0 | – | (6,166,539 | )(b) | ||||||||
Credit Default Swaps | – 0 | – | (10,089,866 | ) | – 0 | – | (10,089,866 | ) | ||||||||
Inflation (CPI) Swaps | – 0 | – | (1,283,624 | ) | – 0 | – | (1,283,624 | ) | ||||||||
Reverse Repurchase Agreements | (231,104,639 | ) | – 0 | – | – 0 | – | (231,104,639 | ) | ||||||||
|
|
|
|
|
|
|
| |||||||||
Total | $ | (234,773,565 | ) | $ | 776,896,721 | $ | 254,834 | $ | 542,377,990 | (c) | ||||||
|
|
|
|
|
|
|
| |||||||||
| abfunds.com | AB BOND INFLATION STRATEGY | 63 | |
NOTES TO FINANCIAL STATEMENTS (continued)
| (a) | Other financial instruments are derivative instruments, such as futures, forwards and swaps, which are valued at the unrealized appreciation/(depreciation) on the instrument. Other financial instruments may also include swaps with upfront premiums, options written and swaptions written which are valued at market value. |
| (b) | Only variation margin receivable/(payable) at period end is reported within the statement of assets and liabilities. This amount reflects cumulative unrealized appreciation/(depreciation) on futures and centrally cleared swaps as reported in the portfolio of investments. Where applicable, centrally cleared swaps with upfront premiums are presented here at market value. |
| (c) | The amount of $5,978,732 for Asset-Backed Securities was transferred out of Level 3 into Level 2 as improved transparency of price inputs received from pricing vendors has increased the observability during the reporting period. |
3. Currency Translation
Assets and liabilities denominated in foreign currencies and commitments under forward currency exchange contracts are translated into U.S. dollars at the mean of the quoted bid and ask prices of such currencies against the U.S. dollar. Purchases and sales of portfolio securities are translated into U.S. dollars at the rates of exchange prevailing when such securities were acquired or sold. Income and expenses are translated into U.S. dollars at rates of exchange prevailing when accrued.
Net realized gain or loss on foreign currency transactions represents foreign exchange gains and losses from sales and maturities of foreign fixed income investments, holding of foreign currencies, currency gains or losses realized between the trade and settlement dates on foreign investment transactions, and the difference between the amounts of dividends, interest and foreign withholding taxes recorded on the Fund’s books and the U.S. dollar equivalent amounts actually received or paid. Net unrealized currency gains and losses from valuing foreign currency denominated assets and liabilities at period end exchange rates are reflected as a component of net unrealized appreciation or depreciation of foreign currency denominated assets and liabilities.
4. Taxes
It is the Fund’s policy to meet the requirements of the Internal Revenue Code applicable to regulated investment companies and to distribute all of its investment company taxable income and net realized gains, if any, to shareholders. Therefore, no provisions for federal income or excise taxes are required. The Fund may be subject to taxes imposed by countries in which it invests. Such taxes are generally based on income and/or capital gains earned or repatriated. Taxes are accrued and applied to net investment income, net realized gains and net unrealized appreciation/depreciation as such income and/or gains are earned.
In accordance with U.S. GAAP requirements regarding accounting for uncertainties in income taxes, management has analyzed the Fund’s tax positions taken or expected to be taken on federal and state income tax
| 64 | AB BOND INFLATION STRATEGY | abfunds.com | |
NOTES TO FINANCIAL STATEMENTS (continued)
returns for all open tax years (the current and the prior three tax years) and has concluded that no provision for income tax is required in the Fund’s financial statements.
5. Investment Income and Investment Transactions
Dividend income is recorded on the ex-dividend date or as soon as the Fund is informed of the dividend. Interest income is accrued daily. Investment transactions are accounted for on the date the securities are purchased or sold. Investment gains or losses are determined on the identified cost basis. The Fund amortizes premiums and accretes discounts as adjustments to interest income.
6. Class Allocations
All income earned and expenses incurred by the Fund are borne on a pro-rata basis by each outstanding class of shares, based on the proportionate interest in the Fund represented by the net assets of such class, except for class specific expenses which are allocated to the respective class. Expenses of the Company are charged proportionately to each fund or based on other appropriate methods. Realized and unrealized gains and losses are allocated among the various share classes based on respective net assets.
7. Dividends and Distributions
Dividends and distributions to shareholders, if any, are recorded on the ex-dividend date. Income dividends and capital gains distributions are determined in accordance with federal tax regulations and may differ from those determined in accordance with U.S. GAAP. To the extent these differences are permanent, such amounts are reclassified within the capital accounts based on their federal tax basis treatment; temporary differences do not require such reclassification.
NOTE B
Advisory Fee and Other Transactions with Affiliates
Under the terms of the investment advisory agreement, the Fund pays the Adviser an advisory fee at an annual rate of .50% of the first $2.5 billion, .45% of the next $2.5 billion and .40% in excess of $5 billion, of the Fund’s average daily net assets. The Adviser has agreed to waive its fees and bear certain expenses to the extent necessary to limit total operating expenses (excluding extraordinary expenses, interest expense, and acquired fund fees and expenses other than the advisory fees of any AB mutual funds in which the Fund may invest), on an annual basis (“Expense Caps”) to .75%, 1.50%, .50%, 1.00%, .75%, .50%, .60%, .50% and .50% of the daily average net assets for the Class A, Class C, Advisor Class, Class R, Class K, Class I, Class 1, Class 2, and Class Z shares, respectively. This fee waiver and/or expense reimbursement agreement will
| abfunds.com | AB BOND INFLATION STRATEGY | 65 | |
NOTES TO FINANCIAL STATEMENTS (continued)
remain in effect until January 31, 2021 and then may be extended for additional one-year terms. For the six months ended April 30, 2020, such reimbursement amounted to $541,474.
Pursuant to the investment advisory agreement, the Fund may reimburse the Adviser for certain legal and accounting services provided to the Fund by the Adviser. For the six months ended April 30, 2020, the reimbursement for such services amounted to $44,430.
The Fund compensates AllianceBernstein Investor Services, Inc. (“ABIS”), a wholly-owned subsidiary of the Adviser, under a Transfer Agency Agreement for providing personnel and facilities to perform transfer agency services for the Fund. ABIS may make payments to intermediaries that provide omnibus account services, sub-accounting services and/or networking services. Such compensation retained by ABIS amounted to $79,265 for the six months ended April 30, 2020.
AllianceBernstein Investments, Inc. (the “Distributor”), a wholly-owned subsidiary of the Adviser, serves as the distributor of the Fund’s shares. The Distributor has advised the Fund that it has retained front-end sales charges of $1,578 from the sale of Class A shares and received $0 and $261 in contingent deferred sales charges imposed upon redemptions by shareholders of Class A and Class C shares, respectively, for the six months ended April 30, 2020.
The Fund may invest in AB Government Money Market Portfolio (the “Government Money Market Portfolio”) which has a contractual annual advisory fee rate of ..20% of the portfolio’s average daily net assets and bears its own expenses. The Adviser has contractually agreed to waive .10% of the advisory fee of Government Money Market Portfolio (resulting in a net advisory fee of .10%) until August 31, 2020. In connection with the investment by the Fund in Government Money Market Portfolio, the Adviser has contractually agreed to waive its advisory fee from the Fund in an amount equal to the Fund’s pro rata share of the effective advisory fee of Government Money Market Portfolio, as borne indirectly by the Fund as an acquired fund fee and expense. For the six months ended April 30, 2020, such waiver amounted to $2,086.
A summary of the Fund’s transactions in AB mutual funds for the six months ended April 30, 2020 is as follows:
Fund | Market Value 10/31/19 (000) | Purchases at Cost (000) | Sales Proceeds (000) | Market Value 4/30/20 (000) | Dividend Income (000) | |||||||||||||||
Government Money Market Portfolio | $ | 3,423 | $ | 199,337 | $ | 202,760 | $ | – 0 | – | $ | 26 | |||||||||
| 66 | AB BOND INFLATION STRATEGY | abfunds.com | |
NOTES TO FINANCIAL STATEMENTS (continued)
During the year ended October 31, 2019, the Adviser reimbursed the Fund $5,918 for trading losses incurred due to a trade entry error.
During the second quarter of 2018, AXA S.A. (“AXA”), a French holding company for the AXA Group, completed the sale of a minority stake in its subsidiary, AXA Equitable Holdings, Inc. (now named Equitable Holdings, Inc.)(“Equitable”), through an initial public offering. Equitable is the holding company for a diverse group of financial services companies, including an approximately 64.9% economic interest in the Adviser and a 100% interest in AllianceBernstein Corporation, the general partner of the Adviser. Since the initial sale, AXA has completed additional offerings, most recently during the fourth quarter of 2019. As a result, AXA currently owns less than 10% of the outstanding shares of common stock of Equitable, and no longer owns a controlling interest in Equitable. AXA previously announced its intention to sell its entire interest in Equitable over time, subject to market conditions and other factors (the “Plan”). Most of AXA’s remaining Equitable shares are to be delivered on redemption of AXA bonds mandatorily exchangeable into Equitable shares and maturing in May 2021. AXA retains sole discretion to determine the timing of any future sales of its remaining shares of Equitable common stock.
Sales under the Plan that were completed on November 13, 2019 resulted in the indirect transfer of a “controlling block” of voting securities of the Adviser (a “Change of Control Event”) and may have been deemed to have been an “assignment” causing a termination of the Fund’s investment advisory and administration agreements. In order to ensure that investment advisory and administration services could continue uninterrupted in the event of a Change of Control Event, the Board previously approved new investment advisory and administration agreements with the Adviser, and shareholders of the Fund subsequently approved the new investment advisory agreement. These agreements became effective on November 13, 2019.
NOTE C
Distribution Services Agreement
The Fund has adopted a Distribution Services Agreement (the “Agreement”) pursuant to Rule 12b-1 under the Investment Company Act of 1940. Under the Agreement, the Fund pays distribution and servicing fees to the Distributor at an annual rate of up to .30% of the Fund’s average daily net assets attributable to Class A shares, 1% of the Fund’s average daily net assets attributable to Class C shares, .50% of the Fund’s average daily net assets attributable to Class R shares, .25% of the Fund’s average daily net assets attributable to Class K shares and .10% of the Fund’s average daily net assets attributable to Class 1 shares. There are no distribution and servicing fees on the Advisor Class, Class I, Class 2 and Class Z shares. Payments under the Agreement in respect of Class A
| abfunds.com | AB BOND INFLATION STRATEGY | 67 | |
NOTES TO FINANCIAL STATEMENTS (continued)
shares are currently limited to an annual rate of .25% of Class A shares’ average daily net assets. The fees are accrued daily and paid monthly. The Agreement provides that the Distributor will use such payments in their entirety for distribution assistance and promotional activities. Since the commencement of the Fund’s operations, the Distributor has incurred expenses in excess of the distribution costs reimbursed by the Fund in the amounts of $254,264, $50,064, $54,626 and $1,583,133 for Class C, Class R, Class K and Class 1 shares, respectively. While such costs may be recovered from the Fund in future periods so long as the Agreement is in effect, the rate of the distribution and servicing fees payable under the Agreement may not be increased without a shareholder vote. In accordance with the Agreement, there is no provision for recovery of unreimbursed distribution costs incurred by the Distributor beyond the current fiscal year for Class A shares. The Agreement also provides that the Adviser may use its own resources to finance the distribution of the Fund’s shares.
NOTE D
Investment Transactions
Purchases and sales of investment securities (excluding short-term investments) for the six months ended April 30, 2020 were as follows:
| Purchases | Sales | |||||||
Investment securities (excluding U.S. government securities) | $ | 77,233,630 | $ | 53,307,962 | ||||
U.S. government securities | 187,662,251 | 149,672,976 | ||||||
The cost of investments for federal income tax purposes was substantially the same as the cost for financial reporting purposes. Accordingly, gross unrealized appreciation and unrealized depreciation are as follows:
Gross unrealized appreciation | $ | 37,977,419 | ||
Gross unrealized depreciation | (39,120,082 | ) | ||
|
| |||
Net unrealized depreciation | $ | (1,142,663 | ) | |
|
|
1. Derivative Financial Instruments
The Fund may use derivatives in an effort to earn income and enhance returns, to replace more traditional direct investments, to obtain exposure to otherwise inaccessible markets (collectively, “investment purposes”), or to hedge or adjust the risk profile of its portfolio.
The principal types of derivatives utilized by the Fund, as well as the methods in which they may be used are:
| • | Futures |
The Fund may buy or sell futures for investment purposes or for the purpose of hedging its portfolio against adverse effects of potential
| 68 | AB BOND INFLATION STRATEGY | abfunds.com | |
NOTES TO FINANCIAL STATEMENTS (continued)
movements in the market. The Fund bears the market risk that arises from changes in the value of these instruments and the imperfect correlation between movements in the price of the futures and movements in the price of the assets, reference rates or indices which they are designed to track. Among other things, the Fund may purchase or sell futures for foreign currencies or options thereon for non-hedging purposes as a means of making direct investment in foreign currencies, as described below under “Currency Transactions”.
At the time the Fund enters into futures, the Fund deposits and maintains as collateral an initial margin with the broker, as required by the exchange on which the transaction is effected. Such amount is shown as cash collateral due from broker on the statement of assets and liabilities. Pursuant to the contract, the Fund agrees to receive from or pay to the broker an amount of cash equal to the daily fluctuation in the value of the contract. Such receipts or payments are known as variation margin and are recorded by the Fund as unrealized gains or losses. Risks may arise from the potential inability of a counterparty to meet the terms of the contract. The credit/counterparty risk for exchange-traded futures is generally less than privately negotiated futures, since the clearinghouse, which is the issuer or counterparty to each exchange-traded future, has robust risk mitigation standards, including the requirement to provide initial and variation margin. When the contract is closed, the Fund records a realized gain or loss equal to the difference between the value of the contract at the time it was opened and the time it was closed.
Use of long futures subjects the Fund to risk of loss in excess of the amounts shown on the statement of assets and liabilities, up to the notional value of the futures. Use of short futures subjects the Fund to unlimited risk of loss. Under some circumstances, futures exchanges may establish daily limits on the amount that the price of futures can vary from the previous day’s settlement price, which could effectively prevent liquidation of unfavorable positions.
During the six months ended April 30, 2020, the Fund held futures for hedging and non-hedging purposes.
| • | Forward Currency Exchange Contracts |
The Fund may enter into forward currency exchange contracts in order to hedge its exposure to changes in foreign currency exchange rates on its foreign portfolio holdings, to hedge certain firm purchase and sale commitments denominated in foreign currencies and for non-hedging purposes as a means of making direct investments in foreign currencies, as described below under “Currency Transactions”.
| abfunds.com | AB BOND INFLATION STRATEGY | 69 | |
NOTES TO FINANCIAL STATEMENTS (continued)
A forward currency exchange contract is a commitment to purchase or sell a foreign currency at a future date at a negotiated forward rate. The gain or loss arising from the difference between the original contract and the closing of such contract would be included in net realized gain or loss on forward currency exchange contracts. Fluctuations in the value of open forward currency exchange contracts are recorded for financial reporting purposes as unrealized appreciation and/or depreciation by the Fund. Risks may arise from the potential inability of a counterparty to meet the terms of a contract and from unanticipated movements in the value of a foreign currency relative to the U.S. dollar.
During the six months ended April 30, 2020, the Fund held forward currency exchange contracts for hedging and non-hedging purposes.
| • | Option Transactions |
For hedging and investment purposes, the Fund may purchase and write (sell) put and call options on U.S. and foreign securities, including government securities, and foreign currencies that are traded on U.S. and foreign securities exchanges and over-the-counter markets. Among other things, the Fund may use options transactions for non-hedging purposes as a means of making direct investments in foreign currencies, as described below under “Currency Transactions” and may use options strategies involving the purchase and/or writing of various combinations of call and/or put options, for hedging and investment purposes.
The risk associated with purchasing an option is that the Fund pays a premium whether or not the option is exercised. Additionally, the Fund bears the risk of loss of the premium and change in market value should the counterparty not perform under the contract. If a put or call option purchased by the Fund were permitted to expire without being sold or exercised, its premium would represent a loss to the Fund. Put and call options purchased are accounted for in the same manner as portfolio securities. The cost of securities acquired through the exercise of call options is increased by premiums paid. The proceeds from securities sold through the exercise of put options are decreased by the premiums paid.
When the Fund writes an option, the premium received by the Fund is recorded as a liability and is subsequently adjusted to the current market value of the option written. The Fund’s maximum payment for written put options equates to the number of shares multiplied by the strike price. In certain circumstances maximum payout amounts may be partially offset by recovery values of the respective referenced assets and upfront premium received upon entering into the contract. Premiums received from written options which expire unexercised are
| 70 | AB BOND INFLATION STRATEGY | abfunds.com | |
NOTES TO FINANCIAL STATEMENTS (continued)
recorded by the Fund on the expiration date as realized gains from options written. The difference between the premium received and the amount paid on effecting a closing purchase transaction, including brokerage commissions, is also treated as a realized gain, or if the premium received is less than the amount paid for the closing purchase transaction, as a realized loss. If a call option is exercised, the premium received is added to the proceeds from the sale of the underlying security or currency in determining whether the Fund has realized a gain or loss. If a put option is exercised, the premium received reduces the cost basis of the security or currency purchased by the Fund. In writing an option, the Fund bears the market risk of an unfavorable change in the price of the security or currency underlying the written option. Exercise of an option written by the Fund could result in the Fund selling or buying a security or currency at a price different from the current market value.
The Fund may also invest in options on swap agreements, also called “swaptions”. A swaption is an option that gives the buyer the right, but not the obligation, to enter into a swap on a future date in exchange for paying a market-based “premium”. A receiver swaption gives the owner the right to receive the total return of a specified asset, reference rate, or index. A payer swaption gives the owner the right to pay the total return on a specified asset, reference rate, or index. Swaptions also include options that allow an existing swap to be terminated or extended by one of the counterparties. The Fund’s maximum payment for written put swaptions equates to the notional amount of the underlying swap. In certain circumstances maximum payout amounts may be partially offset by recovery values of the respective referenced assets and upfront premium received upon entering into the contract.
During the six months ended April 30, 2020, the Fund held purchased swaptions for hedging and non-hedging purposes.
During the six months ended April 30, 2020, the Fund held written swaptions for hedging and non-hedging purposes.
| • | Swaps |
The Fund may enter into swaps to hedge its exposure to interest rates, credit risk or currencies. The Fund may also enter into swaps for non-hedging purposes as a means of gaining market exposures, making direct investments in foreign currencies, as described below under “Currency Transactions.” A swap is an agreement that obligates two parties to exchange a series of cash flows at specified intervals based upon or calculated by reference to changes in specified prices or rates for a specified amount of an underlying asset. The payment flows are usually netted against each other, with the
| abfunds.com | AB BOND INFLATION STRATEGY | 71 | |
NOTES TO FINANCIAL STATEMENTS (continued)
difference being paid by one party to the other. In addition, collateral may be pledged or received by the Fund in accordance with the terms of the respective swaps to provide value and recourse to the Fund or its counterparties in the event of default, bankruptcy or insolvency by one of the parties to the swap.
Risks may arise as a result of the failure of the counterparty to the swap to comply with the terms of the swap. The loss incurred by the failure of a counterparty is generally limited to the net interim payment to be received by the Fund, and/or the termination value at the end of the contract. Therefore, the Fund considers the creditworthiness of each counterparty to a swap in evaluating potential counterparty risk. This risk is mitigated by having a netting arrangement between the Fund and the counterparty and by the posting of collateral by the counterparty to the Fund to cover the Fund’s exposure to the counterparty. Additionally, risks may arise from unanticipated movements in interest rates or in the value of the underlying securities. The Fund accrues for the interim payments on swaps on a daily basis, with the net amount recorded within unrealized appreciation/depreciation of swaps on the statement of assets and liabilities, where applicable. Once the interim payments are settled in cash, the net amount is recorded as realized gain/(loss) on swaps on the statement of operations, in addition to any realized gain/(loss) recorded upon the termination of swaps. Upfront premiums paid or received for OTC swaps are recognized as cost or proceeds on the statement of assets and liabilities and are amortized on a straight line basis over the life of the contract. Amortized upfront premiums are included in net realized gain/(loss) from swaps on the statement of operations. Fluctuations in the value of swaps are recorded as a component of net change in unrealized appreciation/depreciation of swaps on the statement of operations.
Certain standardized swaps, including certain interest rate swaps and credit default swaps, are (or soon will be) subject to mandatory central clearing. Cleared swaps are transacted through futures commission merchants (“FCMs”) that are members of central clearinghouses, with
the clearinghouse serving as central counterparty, similar to transactions in futures contracts. Centralized clearing will be required for additional categories of swaps on a phased-in basis based on requirements published by the Securities and Exchange Commission and Commodity Futures Trading Commission.
At the time the Fund enters into a centrally cleared swap, the Fund deposits and maintains as collateral an initial margin with the broker, as required by the clearinghouse on which the transaction is effected. Such amount is shown as cash collateral due from broker on the
| 72 | AB BOND INFLATION STRATEGY | abfunds.com | |
NOTES TO FINANCIAL STATEMENTS (continued)
statement of assets and liabilities. Pursuant to the contract, the Fund agrees to receive from or pay to the broker an amount of cash equal to the daily fluctuation in the value of the contract. Such receipts or payments are known as variation margin and are recorded by the Fund as unrealized gains or losses. Risks may arise from the potential inability of a counterparty to meet the terms of the contract. The credit/counterparty risk for centrally cleared swaps is generally less than non-centrally cleared swaps, since the clearinghouse, which is the issuer or counterparty to each centrally cleared swap, has robust risk mitigation standards, including the requirement to provide initial and variation margin. When the contract is closed, the Fund records a realized gain or loss equal to the difference between the value of the contract at the time it was opened and the time it was closed.
Interest Rate Swaps:
The Fund is subject to interest rate risk exposure in the normal course of pursuing its investment objectives. Because the Fund holds fixed rate bonds, the value of these bonds may decrease if interest rates rise. To help hedge against this risk and to maintain its ability to generate income at prevailing market rates, the Fund may enter into interest rate swaps. Interest rate swaps are agreements between two parties to exchange cash flows based on a notional amount. The Fund may elect to pay a fixed rate and receive a floating rate, or, receive a fixed rate and pay a floating rate on a notional amount.
In addition, the Fund may also enter into interest rate swap transactions to preserve a return or spread on a particular investment or portion of its portfolio, or protecting against an increase in the price of securities the Fund anticipates purchasing at a later date. Interest rate swaps involve the exchange by a Fund with another party of their respective commitments to pay or receive interest (e.g., an exchange of floating rate payments for fixed rate payments) computed based on a contractually-based principal (or “notional”) amount. Interest rate swaps are entered into on a net basis (i.e., the two payment streams are netted out, with the Fund receiving or paying, as the case may be, only the net amount of the two payments).
During the six months ended April 30, 2020, the Fund held interest rate swaps for hedging and non-hedging purposes.
Inflation (CPI) Swaps:
Inflation swap agreements are contracts in which one party agrees to pay the cumulative percentage increase in a price index (the Consumer Price Index with respect to CPI swaps) over the term of the swap (with some lag on the inflation index), and the other pays a compounded fixed rate. Inflation swaps may be used to protect the net asset value, or NAV, of a Fund against an unexpected change in
| abfunds.com | AB BOND INFLATION STRATEGY | 73 | |
NOTES TO FINANCIAL STATEMENTS (continued)
the rate of inflation measured by an inflation index since the value of
these agreements is expected to increase if there are unexpected inflation increases.
During the six months ended April 30, 2020, the Fund held inflation (CPI) swaps for hedging and non-hedging purposes.
Credit Default Swaps:
The Fund may enter into credit default swaps, including to manage its exposure to the market or certain sectors of the market, to reduce its risk exposure to defaults by corporate and sovereign issuers held by the Fund, or to create exposure to corporate or sovereign issuers to which it is not otherwise exposed. The Fund may purchase credit protection (“Buy Contract”) or provide credit protection (“Sale Contract”) on the referenced obligation of the credit default swap. During the term of the swap, the Fund receives/(pays) fixed payments from/(to) the respective counterparty, calculated at the agreed upon rate applied to the notional amount. If the Fund is a buyer/(seller) of protection and a credit event occurs, as defined under the terms of the swap, the Fund will either (i) receive from the seller/(pay to the buyer) of protection an amount equal to the notional amount of the swap (the “Maximum Payout Amount”) and deliver/(take delivery of) the referenced obligation or (ii) receive/(pay) a net settlement amount in the form of cash or securities equal to the notional amount of the swap less the recovery value of the referenced obligation. In certain circumstances Maximum Payout Amounts may be partially offset by recovery values of the respective referenced obligations, upfront premium received upon entering into the agreement, or net amounts received from settlement of buy protection credit default swaps entered into by the Fund for the same referenced obligations with the same counterparty.
Credit default swaps may involve greater risks than if a Fund had invested in the referenced obligation directly. Credit default swaps are subject to general market risk, liquidity risk, counterparty risk and credit risk. If the Fund is a buyer of protection and no credit event occurs, it will lose the payments it made to its counterparty. If the Fund is a seller of protection and a credit event occurs, the value of the referenced obligation received by the Fund coupled with the periodic payments previously received, may be less than the Maximum Payout Amount it pays to the buyer, resulting in a net loss to the Fund.
Implied credit spreads over U.S. Treasuries of comparable maturity utilized in determining the market value of credit default swaps on issuers as of period end are disclosed in the portfolio of investments. The implied spreads serve as an indicator of the current status of the
| 74 | AB BOND INFLATION STRATEGY | abfunds.com | |
NOTES TO FINANCIAL STATEMENTS (continued)
payment/performance risk and typically reflect the likelihood of default by the issuer of the referenced obligation. The implied credit spread of a particular reference obligation also reflects the cost of buying/selling protection and may reflect upfront payments required to be made to enter into the agreement. Widening credit spreads typically represent a deterioration of the referenced obligation’s credit soundness and greater likelihood of default or other credit event occurring as defined under the terms of the agreement. A credit spread identified as “Defaulted” indicates a credit event has occurred for the referenced obligation.
During the six months ended April 30, 2020, the Fund held credit default swaps for hedging and non-hedging purposes.
The Fund typically enters into International Swaps and Derivatives Association, Inc. Master Agreements (“ISDA Master Agreement”) with its OTC derivative contract counterparties in order to, among other things, reduce its credit risk to OTC counterparties. ISDA Master Agreements include provisions for general obligations, representations, collateral and events of default or termination. Under an ISDA Master Agreement, the Fund typically may offset with the OTC counterparty certain derivative financial instruments’ payables and/or receivables with collateral held and/or posted and create one single net payment (close-out netting) in the event of default or termination. In the event of a default by an OTC counterparty, the return of collateral with market value in excess of the Fund’s net liability, held by the defaulting party, may be delayed or denied.
The Fund’s ISDA Master Agreements may contain provisions for early termination of OTC derivative transactions in the event the net assets of the Fund decline below specific levels (“net asset contingent features”). If these levels are triggered, the Fund’s OTC counterparty has the right to terminate such transaction and require the Fund to pay or receive a settlement amount in connection with the terminated transaction. If OTC derivatives were held at period end, please refer to netting arrangements by the OTC counterparty table below for additional details.
During the six months ended April 30, 2020, the Fund had entered into the following derivatives:
Asset Derivatives | Liability Derivatives | |||||||||||
Derivative Type | Statement of | Fair Value | Statement of | Fair Value | ||||||||
Interest rate contracts | Receivable/Payable for variation margin on futures | $ | 300,748 | * | Receivable/Payable for variation margin on futures | $ | 3,969,674 | * | ||||
| abfunds.com | AB BOND INFLATION STRATEGY | 75 | |
NOTES TO FINANCIAL STATEMENTS (continued)
Asset Derivatives | Liability Derivatives | |||||||||||
Derivative Type | Statement of | Fair Value | Statement of | Fair Value | ||||||||
Credit contracts | Receivable/Payable for variation margin on centrally cleared swaps | 2,116,034 | * | |||||||||
Interest rate contracts | Receivable/Payable for variation margin on centrally cleared swaps |
| 5,652,399 | * | Receivable/Payable for variation margin on centrally cleared swaps |
| 12,643,805 | * | ||||
Foreign currency contracts | Unrealized appreciation on forward currency exchange contracts |
| 89,323 |
| Unrealized depreciation on forward currency exchange contracts |
| 148,707 |
| ||||
Interest rate contracts | Investments in securities, at value |
| 697,860 |
| ||||||||
Interest rate contracts | Swaptions written, at value |
| 682,325 |
| ||||||||
Interest rate contracts | Unrealized depreciation on inflation swaps |
| 1,283,624 |
| ||||||||
Credit contracts | Market value on credit default swaps | 1,676,780 | Market value on credit default swaps | 10,089,866 | ||||||||
|
|
|
| |||||||||
Total | $ | 8,417,110 | $ | 30,934,035 | ||||||||
|
|
|
| |||||||||
| * | Only variation margin receivable/payable at period end is reported within the statement of assets and liabilities. This amount reflects cumulative unrealized appreciation/(depreciation) on futures and centrally cleared swaps as reported in the portfolio of investments. |
Derivative Type | Location of Gain | Realized Gain or (Loss) on Derivatives | Change in Unrealized Appreciation or (Depreciation) | |||||||
Interest rate contracts | Net realized gain (loss) on futures; Net change in unrealized appreciation/depreciation of futures | $ | (2,045,317 | ) | $ | (4,113,927 | ) | |||
| 76 | AB BOND INFLATION STRATEGY | abfunds.com | |
NOTES TO FINANCIAL STATEMENTS (continued)
Derivative Type | Location of Gain | Realized Gain or (Loss) on Derivatives | Change in Unrealized Appreciation or (Depreciation) | |||||||
Foreign currency contracts | Net realized gain (loss) on forward currency exchange contracts; Net change in unrealized appreciation/depreciation of forward currency exchange contracts | $ | 2,468,828 | $ | (11,110 | ) | ||||
Interest rate contracts | Net realized gain (loss) on investment transactions; Net change in unrealized appreciation/depreciation of investments | – 0 | – | (592,434 | ) | |||||
Interest rate contracts | Net realized gain (loss) on swaptions written; Net change in unrealized appreciation/depreciation of swaptions written | – 0 | – | 465,656 | ||||||
Interest rate contracts | Net realized gain (loss) on swaps; Net change in unrealized appreciation/depreciation of swaps | (1,480,702 | ) | (5,470,965 | ) | |||||
Credit contracts | Net realized gain (loss) on swaps; Net change in unrealized appreciation/depreciation of swaps | 4,257,071 | (7,747,817 | ) | ||||||
|
|
|
| |||||||
Total | $ | 3,199,880 | $ | (17,470,597 | ) | |||||
|
|
|
| |||||||
The following table represents the average monthly volume of the Fund’s derivative transactions during the six months ended April 30, 2020:
Futures: | ||||
Average notional amount of buy contracts | $ | 54,196,712 | ||
Average notional amount of sale contracts | $ | 102,024,929 | ||
Forward Currency Exchange Contracts: | ||||
Average principal amount of buy contracts | $ | 8,522,011 | (a) | |
Average principal amount of sale contracts | $ | 24,161,285 | ||
Purchased Swaptions: | ||||
Average notional amount | $ | 29,505,000 | (b) |
| abfunds.com | AB BOND INFLATION STRATEGY | 77 | |
NOTES TO FINANCIAL STATEMENTS (continued)
Swaptions Written: | ||||
Average notional amount | $ | 28,298,609 | (b) | |
Interest Rate Swaps: | ||||
Average notional amount | $ | 595,000 | ||
Inflation Swaps: | ||||
Average notional amount | $ | 45,071,429 | ||
Centrally Cleared Interest Rate Swaps: | ||||
Average notional amount | $ | 157,232,790 | ||
Centrally Cleared Inflation Swaps: | ||||
Average notional amount | $ | 220,257,143 | ||
Credit Default Swaps: | ||||
Average notional amount of buy contracts | $ | 8,854,857 | ||
Average notional amount of sale contracts | $ | 28,868,286 | ||
Centrally Cleared Credit Default Swaps: | ||||
Average notional amount of buy contracts | $ | 74,047,286 | ||
Average notional amount of sale contracts | $ | 46,250,000 | (c) |
| (a) | Positions were open for five months during the period. |
| (b) | Positions were open for two months during the period. |
| (c) | Positions were open for one month during the period. |
For financial reporting purposes, the Fund does not offset derivative assets and derivative liabilities that are subject to netting arrangements in the statement of assets and liabilities.
All OTC derivatives held at period end were subject to netting arrangements. The following table presents the Fund’s derivative assets and liabilities by OTC counterparty net of amounts available for offset under ISDA Master Agreements (“MA”) and net of the related collateral received/pledged by the Fund as of April 30, 2020. Exchange-traded derivatives and centrally cleared swaps are not subject to netting arrangements and as such are excluded from the table.
Counterparty | Derivative Assets Subject to a MA | Derivatives Available for Offset | Cash Collateral Received* | Security Collateral Received* | Net Amount of Derivative Assets | |||||||||||||||
Bank of America, NA | $ | 408,895 | $ | (364,641 | ) | $ | – 0 | – | $ | – 0 | – | $ | 44,254 | |||||||
Citibank, NA | 111,421 | (111,421 | ) | – 0 | – | – 0 | – | – 0 | – | |||||||||||
Citigroup Global Markets, Inc. | 1,676,780 | (1,676,780 | ) | – 0 | – | – 0 | – | – 0 | – | |||||||||||
Goldman Sachs Bank USA/ Goldman Sachs International | 85,448 | (85,448 | ) | – 0 | – | – 0 | – | – 0 | – | |||||||||||
JPMorgan Chase Bank, NA | 180,787 | (180,787 | ) | – 0 | – | – 0 | – | – 0 | – | |||||||||||
Standard Chartered Bank | 632 | (632 | ) | – 0 | – | – 0 | – | – 0 | – | |||||||||||
|
|
|
|
|
|
|
|
|
| |||||||||||
Total | $ | 2,463,963 | $ | (2,419,709 | ) | $ | – 0 | – | $ | – 0 | – | $ | 44,254 | ^ | ||||||
|
|
|
|
|
|
|
|
|
| |||||||||||
| 78 | AB BOND INFLATION STRATEGY | abfunds.com | |
NOTES TO FINANCIAL STATEMENTS (continued)
Counterparty | Derivative Liabilities Subject to a MA | Derivatives Available for Offset | Cash Collateral Pledged* | Security Collateral Pledged* | Net Amount of Derivative Liabilities | |||||||||||||||
Bank of America, NA | $ | 364,641 | $ | (364,641 | ) | $ | – 0 | – | $ | – 0 | – | $ | – 0 | – | ||||||
BNP Paribas SA | 16,192 | – 0 | – | – 0 | – | – 0 | – | 16,192 | ||||||||||||
Citibank, NA | 463,997 | (111,421 | ) | (320,000 | ) | – 0 | – | 32,576 | ||||||||||||
Citigroup Global Markets, Inc. | 5,633,552 | (1,676,780 | ) | �� | (390,000 | ) | (3,566,772 | ) | – 0 | – | ||||||||||
Credit Suisse International | 722,597 | – 0 | – | – 0 | – | (548,267 | ) | 174,330 | ||||||||||||
Deutsche Bank AG | 1,062,100 | – 0 | – | – 0 | – | (1,062,100 | ) | – 0 | – | |||||||||||
Goldman Sachs International/ Goldman Sachs Bank USA | 1,734,936 | (85,448 | ) | – 0 | – | (1,649,488 | ) | – 0 | – | |||||||||||
JPMorgan Chase Bank, NA/JPMorgan Securities, LLC | 1,534,498 | (180,787 | ) | (1,353,711 | ) | – 0 | – | – 0 | – | |||||||||||
Morgan Stanley & Co. International PLC/Morgan Stanley Capital Services LLC | 668,688 | – 0 | – | (260,000 | ) | (299,211 | ) | 109,477 | ||||||||||||
Standard Chartered Bank | 3,321 | (632 | ) | – 0 | – | – 0 | – | 2,689 | ||||||||||||
|
|
|
|
|
|
|
|
|
| |||||||||||
Total | $ | 12,204,522 | $ | (2,419,709 | ) | $ | (2,323,711 | ) | $ | (7,125,838 | ) | $ | 335,264 | ^ | ||||||
|
|
|
|
|
|
|
|
|
| |||||||||||
| * | The actual collateral received/pledged may be more than the amount reported due to over-collateralization. |
| ^ | Net amount represents the net receivable/payable that would be due from/to the counterparty in the event of default or termination. The net amount from OTC financial derivative instruments can only be netted across transactions governed under the same master agreement with the same counterparty. |
See Note D.3 for additional disclosure of netting arrangements regarding reverse repurchase agreements.
2. Currency Transactions
The Fund may invest in non-U.S. Dollar-denominated securities on a currency hedged or unhedged basis. The Fund may seek investment opportunities by taking long or short positions in currencies through the use of currency-related derivatives, including forward currency exchange contracts, futures and options on futures, swaps, and other options. The Fund may enter into transactions for investment opportunities when it anticipates that a foreign currency will appreciate or depreciate in value but securities denominated in that currency are not held by the Fund and do not present attractive investment opportunities. Such transactions may also be used when the Adviser believes that it may be more efficient than a direct investment in a foreign currency-denominated security. The Fund may also
| abfunds.com | AB BOND INFLATION STRATEGY | 79 | |
NOTES TO FINANCIAL STATEMENTS (continued)
conduct currency exchange contracts on a spot basis (i.e., for cash at the spot rate prevailing in the currency exchange market for buying or selling currencies).
3. Reverse Repurchase Agreements
The Fund may enter into reverse repurchase transactions (“RVP”) in accordance with the terms of a Master Repurchase Agreement (“MRA”), under which the Fund sells securities and agrees to repurchase them at a mutually agreed upon date and price. At the time the Fund enters into a reverse repurchase agreement, it will establish a segregated account with the custodian containing liquid assets having a value comparable to the repurchase price. Under the MRA and other Master Agreements, the Fund is permitted to offset payables and/or receivables with collateral held and/or posted to the counterparty and create one single net payment due to or from the Fund in the event of a default. In the event of a default by a MRA counterparty, the Fund may be considered an unsecured creditor with respect to any excess collateral (collateral with a market value in excess of the repurchase price) held by and/or posted to the counterparty, and as such the return of such excess collateral may be delayed or denied. For the six months ended April 30, 2020, the average amount of reverse repurchase agreements outstanding was $230,053,821 and the daily weighted average interest rate was 0.8%. At April 30, 2020, the Fund had reverse repurchase agreements outstanding in the amount of $231,104,639 as reported on the statement of assets and liabilities.
The following table presents the Fund’s RVP liabilities by counterparty net of the related collateral pledged by the Fund as of April 30, 2020:
Counterparty | RVP Liabilities Subject to a MRA | Securities Collateral Pledged†* | Net Amount of RVP Liabilities | |||||||||
HSBC Bank USA | $ | 97,116,811 | $ | (97,116,811 | ) | $ | – 0 | – | ||||
JPMorgan Chase Bank | 133,987,828 | (133,987,828 | ) | – 0 | – | |||||||
|
|
|
|
|
| |||||||
Total | $ | 231,104,639 | $ | (231,104,639 | ) | $ | – 0 | – | ||||
|
|
|
|
|
| |||||||
| † | Including accrued interest. |
| * | The actual collateral pledged may be more than the amount reported due to overcollateralization. |
| 80 | AB BOND INFLATION STRATEGY | abfunds.com | |
NOTES TO FINANCIAL STATEMENTS (continued)
NOTE E
Capital Stock
Each class consists of 3,000,000,000 authorized shares. Transactions in capital shares for each class were as follows:
| Shares | Amount | |||||||||||||||||||||||
| Six Months Ended April 30, 2020 (unaudited) | Year Ended October 31, 2019 | Six Months Ended April 30, 2020 | Year Ended October 31, 2019 | |||||||||||||||||||||
|
| |||||||||||||||||||||||
| Class A | ||||||||||||||||||||||||
Shares sold | 755,859 | 1,335,847 | $ | 8,295,403 | $ | 14,431,686 | ||||||||||||||||||
| ||||||||||||||||||||||||
Shares issued in reinvestment of dividends | 17,401 | 62,261 | 189,392 | 668,363 | ||||||||||||||||||||
| ||||||||||||||||||||||||
Shares converted from Class C | 4,347 | 12,244 | 47,753 | 134,636 | ||||||||||||||||||||
| ||||||||||||||||||||||||
Shares redeemed | (1,661,746 | ) | (2,875,737 | ) | (17,953,049 | ) | (30,519,097 | ) | ||||||||||||||||
| ||||||||||||||||||||||||
Net decrease | (884,139 | ) | (1,465,385 | ) | $ | (9,420,501 | ) | $ | (15,284,412 | ) | ||||||||||||||
| ||||||||||||||||||||||||
| Class C | ||||||||||||||||||||||||
Shares sold | 106,507 | 35,201 | $ | 1,136,821 | $ | 369,805 | ||||||||||||||||||
| ||||||||||||||||||||||||
Shares issued in reinvestment of dividends | 924 | 3,952 | 9,731 | 41,489 | ||||||||||||||||||||
| ||||||||||||||||||||||||
Shares converted to Class A | (4,457 | ) | (12,562 | ) | (47,753 | ) | (134,636 | ) | ||||||||||||||||
| ||||||||||||||||||||||||
Shares redeemed | (48,699 | ) | (113,462 | ) | (516,104 | ) | (1,186,063 | ) | ||||||||||||||||
| ||||||||||||||||||||||||
Net increase (decrease) | 54,275 | (86,871 | ) | $ | 582,695 | $ | (909,405 | ) | ||||||||||||||||
| ||||||||||||||||||||||||
| Advisor Class | ||||||||||||||||||||||||
Shares sold | 3,593,803 | 8,127,810 | $ | 39,274,936 | $ | 87,174,658 | ||||||||||||||||||
| ||||||||||||||||||||||||
Shares issued in reinvestment of dividends | 104,368 | 321,349 | 1,140,146 | 3,475,201 | ||||||||||||||||||||
| ||||||||||||||||||||||||
Shares redeemed | (5,748,726 | ) | (7,376,016 | ) | (62,379,182 | ) | (78,961,128 | ) | ||||||||||||||||
| ||||||||||||||||||||||||
Net increase (decrease) | (2,050,555 | ) | 1,073,143 | $ | (21,964,100 | ) | $ | 11,688,731 | ||||||||||||||||
| ||||||||||||||||||||||||
| Class R | ||||||||||||||||||||||||
Shares sold | 53,204 | 220,089 | $ | 567,894 | $ | 2,367,556 | ||||||||||||||||||
| ||||||||||||||||||||||||
Shares issued in reinvestment of dividends | 2,055 | 12,562 | 22,291 | 135,386 | ||||||||||||||||||||
| ||||||||||||||||||||||||
Shares redeemed | (419,962 | ) | (200,399 | ) | (4,572,432 | ) | (2,150,725 | ) | ||||||||||||||||
| ||||||||||||||||||||||||
Net increase (decrease) | (364,703 | ) | 32,252 | $ | (3,982,247 | ) | $ | 352,217 | ||||||||||||||||
|
|
| ||||||||||||||||||||||
| abfunds.com | AB BOND INFLATION STRATEGY | 81 | |
NOTES TO FINANCIAL STATEMENTS (continued)
| Shares | Amount | |||||||||||||||||||||||
| Six Months Ended April 30, 2020 (unaudited) | Year Ended October 31, 2019 | Six Months Ended April 30, 2020 | Year Ended October 31, 2019 | |||||||||||||||||||||
|
| |||||||||||||||||||||||
| Class K | ||||||||||||||||||||||||
Shares sold | 195,388 | 209,936 | $ | 2,173,742 | $ | 2,243,823 | ||||||||||||||||||
| ||||||||||||||||||||||||
Shares issued in reinvestment of dividends | 3,714 | 14,611 | 40,366 | 155,925 | ||||||||||||||||||||
| ||||||||||||||||||||||||
Shares redeemed | (120,386 | ) | (915,078 | ) | (1,278,338 | ) | (9,803,750 | ) | ||||||||||||||||
| ||||||||||||||||||||||||
Net increase (decrease) | 78,716 | (690,531 | ) | $ | 935,770 | $ | (7,404,002 | ) | ||||||||||||||||
| ||||||||||||||||||||||||
| Class I | ||||||||||||||||||||||||
Shares sold | 194,525 | 665,974 | $ | 2,107,688 | $ | 6,999,802 | ||||||||||||||||||
| ||||||||||||||||||||||||
Shares issued in reinvestment of dividends | 8,139 | 21,589 | 87,858 | 231,059 | ||||||||||||||||||||
| ||||||||||||||||||||||||
Shares redeemed | (144,747 | ) | (322,578 | ) | (1,557,202 | ) | (3,425,749 | ) | ||||||||||||||||
| ||||||||||||||||||||||||
Net increase | 57,917 | 364,985 | $ | 638,344 | $ | 3,805,112 | ||||||||||||||||||
| ||||||||||||||||||||||||
| Class 1 | ||||||||||||||||||||||||
Shares sold | 2,913,389 | 5,037,568 | $ | 31,376,832 | $ | 53,163,034 | ||||||||||||||||||
| ||||||||||||||||||||||||
Shares issued in reinvestment of dividends | 186,909 | 588,041 | 2,004,100 | 6,246,030 | ||||||||||||||||||||
| ||||||||||||||||||||||||
Shares redeemed | (4,378,071 | ) | (5,661,186 | ) | (46,668,786 | ) | (59,833,807 | ) | ||||||||||||||||
| ||||||||||||||||||||||||
Net decrease | (1,277,773 | ) | (35,577 | ) | $ | (13,287,854 | ) | $ | (424,743 | ) | ||||||||||||||
| ||||||||||||||||||||||||
| Class 2 | ||||||||||||||||||||||||
Shares sold | 1,597,659 | 1,269,811 | $ | 17,087,692 | $ | 13,428,822 | ||||||||||||||||||
| ||||||||||||||||||||||||
Shares issued in reinvestment of dividends | 42,231 | 117,535 | 452,913 | 1,249,674 | ||||||||||||||||||||
| ||||||||||||||||||||||||
Shares redeemed | (1,949,126 | ) | (832,324 | ) | (20,668,665 | ) | (8,662,540 | ) | ||||||||||||||||
| ||||||||||||||||||||||||
Net increase (decrease) | (309,236 | ) | 555,022 | $ | (3,128,060 | ) | $ | 6,015,956 | ||||||||||||||||
| ||||||||||||||||||||||||
| Class Z | ||||||||||||||||||||||||
Shares sold | 1,005,265 | 1,121,518 | $ | 10,754,715 | $ | 11,902,841 | ||||||||||||||||||
| ||||||||||||||||||||||||
Shares issued in reinvestment of dividends | 27,580 | 78,469 | 296,728 | 836,980 | ||||||||||||||||||||
| ||||||||||||||||||||||||
Shares redeemed | (1,028,957 | ) | (704,502 | ) | (11,006,242 | ) | (7,491,195 | ) | ||||||||||||||||
| ||||||||||||||||||||||||
Net increase | 3,888 | 495,485 | $ | 45,201 | $ | 5,248,626 | ||||||||||||||||||
| ||||||||||||||||||||||||
NOTE F
Risks Involved in Investing in the Fund
Market Risk—The market value of a security may move up or down, sometimes rapidly and unpredictably. These fluctuations may cause a
| 82 | AB BOND INFLATION STRATEGY | abfunds.com | |
NOTES TO FINANCIAL STATEMENTS (continued)
security to be worth less than the price originally paid for it, or less than it was worth at an earlier time. Market risk may affect a single issuer, industry, sector of the economy or the market as a whole. Global economies and financial markets are increasingly interconnected, which increases the probabilities that conditions in one country or region might adversely impact issuers in a different country or region. Conditions affecting the general economy, including political, social, or economic instability at the local, regional, or global level may also affect the market value of a security. Health crises, such as pandemic and epidemic diseases, as well as other incidents that interrupt the expected course of events, such as natural disasters, war or civil disturbance, acts of terrorism, power outages and other unforeseeable and external events, and the public response to or fear of such diseases or events, have and may in the future have an adverse effect on the Fund’s investments and net asset value and can lead to increased market volatility. For example, any preventative or protective actions that governments may take in respect of such diseases or events may result in periods of business disruption, inability to obtain raw materials, supplies and component parts, and reduced or disrupted operations for the Fund’s portfolio companies. The occurrence and pendency of such diseases or events could adversely affect the economies and financial markets either in specific countries or worldwide.
Credit Risk—An issuer or guarantor of a fixed-income security, or the counterparty to a derivatives or other contract, may be unable or unwilling to make timely payments of interest or principal, or to otherwise honor its obligations. The issuer or guarantor may default, causing a loss of the full principal amount of a security and any accrued interest. The degree of risk for a particular security may be reflected in its credit rating. There is the possibility that the credit rating of a fixed-income security may be downgraded after purchase, which may adversely affect the value of the security. Investments in fixed-income securities with lower ratings tend to have a higher probability that an issuer will default or fail to meet its payment obligations.
Interest Rate Risk—Changes in interest rates will affect the value of investments in fixed-income securities. When interest rates rise, the value of existing investments in fixed-income securities tends to fall and this decrease in value may not be offset by higher income from new investments. Interest rate risk is generally greater for fixed-income securities with longer maturities or durations.
Duration Risk—Duration is a measure that relates the expected price volatility of a fixed-income security to changes in interest rates. The duration of a fixed-income security may be shorter than or equal to full maturity of a fixed-income security. Fixed-income securities with longer durations have more risk and will decrease in price as interest rates rise.
| abfunds.com | AB BOND INFLATION STRATEGY | 83 | |
NOTES TO FINANCIAL STATEMENTS (continued)
Inflation Risk—This is the risk that the value of assets or income from investments will be less in the future as inflation decreases the value of money. As inflation increases, the value of the Fund’s assets can decline as can the value of the Fund’s distributions. This risk is significantly greater for fixed-income securities with longer maturities. Although the Fund invests principally in inflation-indexed securities, the value of its securities may be vulnerable to changes in expectations of inflation or interest rates.
Derivatives Risk—The Fund may enter into derivative transactions such as forwards, options, futures and swaps. Derivatives may be illiquid, difficult to price, and leveraged so that small changes may produce disproportionate losses for the Fund, and subject to counterparty risk to a greater degree than more traditional investments. Derivatives may result in significant losses, including losses that are far greater than the value of the derivatives reflected on the statement of assets and liabilities.
Foreign (Non-U.S.) Risk—Investments in securities of non-U.S. issuers may involve more risk than those of U.S. issuers. These securities may fluctuate more widely in price and may be more difficult to trade due to adverse market, economic, political, regulatory or other factors.
Currency Risk—Fluctuations in currency exchange rates may negatively affect the value of the Fund’s investments or reduce its returns.
Mortgage-Related and/or Other Asset-Backed Securities Risk—Investments in mortgage-related and other asset-backed securities are subject to certain additional risks. The value of these securities may be particularly sensitive to changes in interest rates. These risks include “extension risk”, which is the risk that, in periods of rising interest rates, issuers may delay the payment of principal, and “prepayment risk”, which is the risk that in periods of falling interest rates, issuers may pay principal sooner than expected, exposing the Fund to a lower rate of return upon reinvestment of principal. Mortgage-backed securities offered by non-governmental issuers and other asset-backed securities may be subject to other risks, such as higher rates of default in the mortgages or assets backing the securities or risks associated with the nature and servicing of mortgages or assets backing the securities.
Leverage Risk—When the Fund borrows money or otherwise leverages its investments, its performance may be volatile because leverage tends to exaggerate the effect of any increase or decrease in the value of the Fund’s investments. The Fund may create leverage through the use of reverse repurchase arrangements, forward currency exchange contracts, forward commitments, dollar rolls or futures or by borrowing money. The use of other types of derivative instruments by the Fund, such as options
| 84 | AB BOND INFLATION STRATEGY | abfunds.com | |
NOTES TO FINANCIAL STATEMENTS (continued)
and swaps, may also result in a form of leverage. Leverage may result in higher returns to the Fund than if the Fund were not leveraged, but may also adversely affect returns, particularly if the market is declining.
Illiquid Investments Risk—Illiquid investments risk exists when certain investments are or become difficult to purchase or sell. Difficulty in selling such investments may result in sales at disadvantageous prices affecting the value of your investment in the Fund. Causes of illiquid investments risk may include low trading volumes, large positions and heavy redemptions of Fund shares. Illiquid investments risk may be higher in a rising interest rate environment, when the value and liquidity of fixed-income securities generally go down.
LIBOR Risk—The Fund may invest in certain debt securities, derivatives or other financial instruments that utilize the London Interbank Offered Rate, or “LIBOR,” as a “benchmark” or “reference rate” for various interest rate calculations. In July 2017, the United Kingdom Financial Conduct Authority, which regulates LIBOR, announced a desire to phase out the use of LIBOR by the end of 2021. Although financial regulators and industry working groups have suggested alternative reference rates, such as European Interbank Offer Rate (“EURIBOR”), Sterling Overnight Interbank Average Rate (“SONIA”) and Secured Overnight Financing Rate (“SOFR”), global consensus on alternative rates is lacking and the process for amending existing contracts or instruments to transition away from LIBOR remains unclear. The elimination of LIBOR or changes to other reference rates or any other changes or reforms to the determination or supervision of reference rates could have an adverse impact on the market for, or value of, any securities or payments linked to those reference rates, which may adversely affect the Fund’s performance and/or net asset value. Uncertainty and risk also remain regarding the willingness and ability of issuers and lenders to include revised provisions in new and existing contracts or instruments. Consequently, the transition away from LIBOR to other reference rates may lead to increased volatility and illiquidity in markets that are tied to LIBOR, fluctuations in values of LIBOR-related investments or investments in issuers that utilize LIBOR, increased difficulty in borrowing or refinancing and diminished effectiveness of hedging strategies, adversely affecting the Fund’s performance. Furthermore, the risks associated with the expected discontinuation of LIBOR and transition may be exacerbated if the work necessary to effect an orderly transition to an alternative reference rate is not completed in a timely manner. Because the usefulness of LIBOR as a benchmark could deteriorate during the transition period, these effects could occur prior to the end of 2021.
Indemnification Risk—In the ordinary course of business, the Fund enters into contracts that contain a variety of indemnifications. The Fund’s
| abfunds.com | AB BOND INFLATION STRATEGY | 85 | |
NOTES TO FINANCIAL STATEMENTS (continued)
maximum exposure under these arrangements is unknown. However, the Fund has not had prior claims or losses pursuant to these indemnification provisions and expects the risk of loss thereunder to be remote. Therefore, the Fund has not accrued any liability in connection with these indemnification provisions.
Management Risk—The Fund is subject to management risk because it is an actively-managed investment fund. The Adviser will apply its investment techniques and risk analyses in making investment decisions, but there is no guarantee that its techniques will produce the intended results. Some of these techniques may incorporate, or rely upon, quantitative models, but there is no guarantee that these models will generate accurate forecasts, reduce risk or otherwise perform as expected.
NOTE G
Joint Credit Facility
A number of open-end mutual funds managed by the Adviser, including the Fund, participate in a $325 million revolving credit facility (the “Facility”) intended to provide short-term financing, if necessary, subject to certain restrictions in connection with abnormal redemption activity. Commitment fees related to the Facility are paid by the participating funds and are included in miscellaneous expenses in the statement of operations. The Fund did not utilize the Facility during the six months ended April 30, 2020.
NOTE H
Distributions to Shareholders
The tax character of distributions to be paid for the year ending October 31, 2020 will be determined at the end of the current fiscal year. The tax character of distributions paid during the fiscal years ended October 31, 2019 and October 31, 2018 were as follows:
| 2019 | 2018 | |||||||
Distributions paid from: | ||||||||
Ordinary income | $ | 16,015,055 | $ | 15,459,233 | ||||
|
|
|
| |||||
Total taxable distributions paid | $ | 16,015,055 | $ | 15,459,233 | ||||
Return of capital | 371,868 | 0 | ||||||
|
|
|
| |||||
Total distributions paid | $ | 16,386,923 | $ | 15,459,233 | ||||
|
|
|
| |||||
As of October 31, 2019, the components of accumulated earnings/(deficit) on a tax basis were as follows:
Accumulated capital and other losses | $ | (17,522,444 | )(a) | |
Unrealized appreciation/(depreciation) | 15,471,810 | (b) | ||
|
| |||
Total accumulated earnings/(deficit) | $ | (2,050,634 | )(c) | |
|
|
| (a) | As of October 31, 2019, the Fund had a net capital loss carryforward of $17,522,444. |
| 86 | AB BOND INFLATION STRATEGY | abfunds.com | |
NOTES TO FINANCIAL STATEMENTS (continued)
| (b) | The differences between book-basis and tax-basis unrealized appreciation/(depreciation) are attributable primarily to the recognition for tax purposes of unrealized gains/losses on certain derivative instruments, the tax treatment of swaps, and the tax deferral of losses on wash sales. |
| (c) | The differences between book-basis and tax-basis components of accumulated earnings/(deficit) are attributable primarily to the accrual of foreign capital gains tax and the tax treatment of defaulted securities. |
For tax purposes, net realized capital losses may be carried over to offset future capital gains, if any. Funds are permitted to carry forward capital losses for an indefinite period, and such losses will retain their character as either short-term or long-term capital losses. As of October 31, 2019, the Fund had a net short-term capital loss carryforward of $3,811,867 and a net long-term capital loss carryforward of $13,710,577, which may be carried forward for an indefinite period.
NOTE I
Recent Accounting Pronouncements
In March 2017, the Financial Accounting Standards Board issued an Accounting Standards Update, ASU 2017-08, Receivables—Nonrefundable Fees and Other Costs (Subtopic 310-20), Premium Amortization on Purchased Callable Debt Securities which amends the amortization period for certain purchased callable debt securities held at a premium, shortening such period to the earliest call date. ASU 2017-08 does not require any accounting change for debt securities held at a discount; the discount continues to be amortized to maturity. ASU 2017-08 is effective for fiscal years, and interim periods within those fiscal years, beginning after December 15, 2018. The Fund has adopted ASU 2017-08, which did not have a material impact on the Fund’s financial position or the results of its operations, and had no impact on the Fund’s net assets.
NOTE J
Subsequent Events
Management has evaluated subsequent events for possible recognition or disclosure in the financial statements through the date the financial statements are issued. Management has determined that there are no material events that would require disclosure in the Fund’s financial statements through this date.
| abfunds.com | AB BOND INFLATION STRATEGY | 87 | |
FINANCIAL HIGHLIGHTS
Selected Data For A Share Of Capital Stock Outstanding Throughout Each Period
| Class A | ||||||||||||||||||||||||
Six Months (unaudited) | Year Ended October 31, | |||||||||||||||||||||||
| 2019 | 2018 | 2017 | 2016 | 2015 | ||||||||||||||||||||
|
| |||||||||||||||||||||||
Net asset value, beginning of | $ 10.95 | $ 10.47 | $ 10.83 | $ 10.92 | $ 10.44 | $ 10.77 | ||||||||||||||||||
|
| |||||||||||||||||||||||
Income From Investment | ||||||||||||||||||||||||
Net investment income(a)(b) | .12 | .21 | .28 | .21 | .18 | .08 | ||||||||||||||||||
Net realized and unrealized | (.22 | ) | .52 | (.38 | ) | (.11 | ) | .51 | (.31 | ) | ||||||||||||||
Contributions from Affiliates | – 0 | – | .00 | (c) | – 0 | – | .00 | (c) | – 0 | – | – 0 | – | ||||||||||||
|
| |||||||||||||||||||||||
Net increase (decrease) in net | (.10 | ) | .73 | (.10 | ) | .10 | .69 | (.23 | ) | |||||||||||||||
|
| |||||||||||||||||||||||
Less: Dividends and Distributions | ||||||||||||||||||||||||
Dividends from net investment | (.08 | ) | (.24 | ) | (.26 | ) | (.19 | ) | (.21 | ) | (.10 | ) | ||||||||||||
Return of capital | – 0 | – | (.01 | ) | – 0 | – | – 0 | – | – 0 | – | – 0 | – | ||||||||||||
|
| |||||||||||||||||||||||
Total dividends and distributions | (.08 | ) | (.25 | ) | (.26 | ) | (.19 | ) | (.21 | ) | (.10 | ) | ||||||||||||
|
| |||||||||||||||||||||||
Net asset value, end of | $ 10.77 | $ 10.95 | $ 10.47 | $ 10.83 | $ 10.92 | $ 10.44 | ||||||||||||||||||
|
| |||||||||||||||||||||||
Total Return | ||||||||||||||||||||||||
Total investment return based | (.94 | )% | 7.00 | % | (.99 | )% | .91 | % | 6.63 | % | (2.18 | )% | ||||||||||||
Ratios/Supplemental Data | ||||||||||||||||||||||||
Net assets, end of period | $28,273 | $38,422 | $52,116 | $27,718 | $16,712 | $13,660 | ||||||||||||||||||
Ratio to average net assets of: | ||||||||||||||||||||||||
Expenses, net of waivers/reimbursements(e) | .99 | %^ | 1.25 | % | 1.31 | % | 1.01 | % | .98 | % | .88 | % | ||||||||||||
Expenses, before waivers/reimbursements(e) | 1.25 | %^ | 1.51 | % | 1.56 | % | 1.34 | % | 1.42 | % | 1.36 | % | ||||||||||||
Net investment income(b) | 2.25 | %^ | 1.93 | % | 2.60 | % | 1.95 | % | 1.71 | % | .75 | % | ||||||||||||
Portfolio turnover rate | 27 | % | 40 | % | 36 | % | 42 | % | 41 | % | 51 | % | ||||||||||||
See footnote summary on page 97.
| 88 | AB BOND INFLATION STRATEGY | abfunds.com | |
FINANCIAL HIGHLIGHTS (continued)
Selected Data For A Share Of Capital Stock Outstanding Throughout Each Period
| Class C | ||||||||||||||||||||||||
Six Months (unaudited) | Year Ended October 31, | |||||||||||||||||||||||
| 2019 | 2018 | 2017 | 2016 | 2015 | ||||||||||||||||||||
|
| |||||||||||||||||||||||
Net asset value, beginning of | $ 10.67 | $ 10.24 | $10.61 | $ 10.71 | $ 10.27 | $ 10.64 | ||||||||||||||||||
|
| |||||||||||||||||||||||
Income From Investment | ||||||||||||||||||||||||
Net investment income(a)(b) | .09 | .13 | .19 | .13 | .10 | .00 | (c) | |||||||||||||||||
Net realized and unrealized | (.23 | ) | .49 | (.37 | ) | (.11 | ) | .50 | (.31 | ) | ||||||||||||||
Contributions from Affiliates | – 0 | – | .00 | (c) | – 0 | – | .00 | (c) | – 0 | – | – 0 | – | ||||||||||||
|
| |||||||||||||||||||||||
Net increase (decrease) in net | (.14 | ) | .62 | (.18 | ) | .02 | .60 | (.31 | ) | |||||||||||||||
|
| |||||||||||||||||||||||
Less: Dividends | ||||||||||||||||||||||||
Dividends from net investment | (.05 | ) | (.19 | ) | (.19 | ) | (.12 | ) | (.16 | ) | (.06 | ) | ||||||||||||
|
| |||||||||||||||||||||||
Net asset value, end of | $ 10.48 | $ 10.67 | $ 10.24 | $ 10.61 | $ 10.71 | $ 10.27 | ||||||||||||||||||
|
| |||||||||||||||||||||||
Total Return | ||||||||||||||||||||||||
Total investment return based on net asset value(d) | (1.24 | )% | 6.18 | % | (1.77 | )% | .16 | % | 5.86 | % | (2.93 | )% | ||||||||||||
Ratios/Supplemental Data | ||||||||||||||||||||||||
Net assets, end of period | $3,130 | $2,607 | $3,391 | $3,627 | $2,505 | $2,679 | ||||||||||||||||||
Ratio to average net assets of: | ||||||||||||||||||||||||
Expenses, net of waivers/reimbursements(e) | 1.73 | %^ | 1.99 | % | 2.03 | % | 1.76 | % | 1.72 | % | 1.58 | % | ||||||||||||
Expenses, before waivers/reimbursements(e) | 2.00 | %^ | 2.26 | % | 2.29 | % | 2.09 | % | 2.16 | % | 2.07 | % | ||||||||||||
Net investment income(b) | 1.64 | %^ | 1.28 | % | 1.77 | % | 1.26 | % | .96 | % | .06 | % | ||||||||||||
Portfolio turnover rate | 27 | % | 40 | % | 36 | % | 42 | % | 41 | % | 51 | % | ||||||||||||
See footnote summary on page 97.
| abfunds.com | AB BOND INFLATION STRATEGY | 89 | |
FINANCIAL HIGHLIGHTS (continued)
Selected Data For A Share Of Capital Stock Outstanding Throughout Each Period
| Advisor Class | ||||||||||||||||||||||||
Six Months (unaudited) | Year Ended October 31, | |||||||||||||||||||||||
| 2019 | 2018 | 2017 | 2016 | 2015 | ||||||||||||||||||||
|
| |||||||||||||||||||||||
Net asset value, beginning of | $ 10.96 | $ 10.49 | $ 10.84 | $ 10.93 | $ 10.46 | $ 10.79 | ||||||||||||||||||
|
| |||||||||||||||||||||||
Income From Investment | ||||||||||||||||||||||||
Net investment income(a)(b) | .14 | .27 | .30 | .25 | .22 | .13 | ||||||||||||||||||
Net realized and unrealized | (.23 | ) | .48 | (.37 | ) | (.13 | ) | .49 | (.33 | ) | ||||||||||||||
Contributions from Affiliates | – 0 | – | .00 | (c) | – 0 | – | .00 | (c) | – 0 | – | – 0 | – | ||||||||||||
|
| |||||||||||||||||||||||
Net increase (decrease) in net | (.09 | ) | .75 | (.07 | ) | .12 | .71 | (.20 | ) | |||||||||||||||
|
| |||||||||||||||||||||||
Less: Dividends and | ||||||||||||||||||||||||
Dividends from net investment | (.09 | ) | (.27 | ) | (.28 | ) | (.21 | ) | (.24 | ) | (.13 | ) | ||||||||||||
Return of capital | – 0 | – | (.01 | ) | – 0 | – | – 0 | – | – 0 | – | – 0 | – | ||||||||||||
|
| |||||||||||||||||||||||
Total dividends and distributions | (.09 | ) | (.28 | ) | (.28 | ) | (.21 | ) | (.24 | ) | (.13 | ) | ||||||||||||
|
| |||||||||||||||||||||||
Net asset value, end of period | $ 10.78 | $ 10.96 | $ 10.49 | $ 10.84 | $ 10.93 | $ 10.46 | ||||||||||||||||||
|
| |||||||||||||||||||||||
Total Return | ||||||||||||||||||||||||
Total investment return based | (.81 | )% | 7.21 | % | (.68 | )% | 1.15 | % | 6.87 | % | (1.90 | )% | ||||||||||||
Ratios/Supplemental Data | ||||||||||||||||||||||||
Net assets, end of period | $143,568 | $168,440 | $150,011 | $107,545 | $29,186 | $18,343 | ||||||||||||||||||
Ratio to average net assets of: | ||||||||||||||||||||||||
Expenses, net of waivers/reimbursements(e) | .74 | %^ | .97 | % | 1.05 | % | .77 | % | .73 | % | .58 | % | ||||||||||||
Expenses, before waivers/reimbursements(e) | 1.00 | %^ | 1.24 | % | 1.31 | % | 1.10 | % | 1.16 | % | 1.06 | % | ||||||||||||
Net investment income(b) | 2.51 | %^ | 2.47 | % | 2.80 | % | 2.31 | % | 2.04 | % | 1.23 | % | ||||||||||||
Portfolio turnover rate | 27 | % | 40 | % | 36 | % | 42 | % | 41 | % | 51 | % | ||||||||||||
See footnote summary on page 97.
| 90 | AB BOND INFLATION STRATEGY | abfunds.com | |
FINANCIAL HIGHLIGHTS (continued)
Selected Data For A Share Of Capital Stock Outstanding Throughout Each Period
| Class R | ||||||||||||||||||||||||
| Six Months Ended April 30, 2020 | Year Ended October 31, | |||||||||||||||||||||||
| (unaudited) | 2019 | 2018 | 2017 | 2016 | 2015 | |||||||||||||||||||
|
| |||||||||||||||||||||||
Net asset value, beginning of | $ 10.93 | $ 10.46 | $ 10.82 | $ 10.89 | $ 10.44 | $ 10.78 | ||||||||||||||||||
|
| |||||||||||||||||||||||
Income From Investment | ||||||||||||||||||||||||
Net investment income (loss)(a)(b) | .10 | .20 | .24 | .21 | .29 | (.08 | ) | |||||||||||||||||
Net realized and unrealized | (.21 | ) | .49 | (.37 | ) | (.12 | ) | .37 | (.19 | ) | ||||||||||||||
Contributions from Affiliates | – 0 | – | .00 | (c) | – 0 | – | .00 | (c) | – 0 | – | – 0 | – | ||||||||||||
|
| |||||||||||||||||||||||
Net increase (decrease) in net | (.11 | ) | .69 | (.13 | ) | .09 | .66 | (.27 | ) | |||||||||||||||
|
| |||||||||||||||||||||||
Less: Dividends | ||||||||||||||||||||||||
Dividends from net investment | (.06 | ) | (.22 | ) | (.23 | ) | (.16 | ) | (.21 | ) | (.07 | ) | ||||||||||||
|
| |||||||||||||||||||||||
Net asset value, end of period | $ 10.76 | $ 10.93 | $ 10.46 | $ 10.82 | $ 10.89 | $ 10.44 | ||||||||||||||||||
|
| |||||||||||||||||||||||
Total Return | ||||||||||||||||||||||||
Total investment return based | (1.02 | )% | 6.64 | % | (1.15 | )% | .80 | %‡ | 6.41 | % | (2.49 | )% | ||||||||||||
Ratios/Supplemental Data | ||||||||||||||||||||||||
Net assets, end of period | $2,959 | $6,992 | $6,354 | $5,364 | $408 | $20 | ||||||||||||||||||
Ratio to average net assets of: | ||||||||||||||||||||||||
Expenses, net of waivers/reimbursements(e) | 1.32 | %^ | 1.47 | % | 1.54 | % | 1.29 | % | 1.24 | % | 1.06 | % | ||||||||||||
Expenses, before waivers/reimbursements(e) | 1.69 | %^ | 1.83 | % | 1.90 | % | 1.67 | % | 1.71 | % | 1.50 | % | ||||||||||||
Net investment income (loss)(b) | 1.88 | %^ | 1.88 | % | 2.24 | % | 2.08 | % | 2.71 | % | (.68 | )% | ||||||||||||
Portfolio turnover rate | 27 | % | 40 | % | 36 | % | 42 | % | 41 | % | 51 | % | ||||||||||||
See footnote summary on page 97.
| abfunds.com | AB BOND INFLATION STRATEGY | 91 | |
FINANCIAL HIGHLIGHTS (continued)
Selected Data For A Share Of Capital Stock Outstanding Throughout Each Period
| Class K | ||||||||||||||||||||||||
Six Months (unaudited) | Year Ended October 31, | |||||||||||||||||||||||
| 2019 | 2018 | 2017 | 2016 | 2015 | ||||||||||||||||||||
|
| |||||||||||||||||||||||
Net asset value, beginning of | $ 10.92 | $ 10.45 | $ 10.81 | $ 10.89 | $ 10.42 | $ 10.77 | ||||||||||||||||||
|
| |||||||||||||||||||||||
Income From Investment | ||||||||||||||||||||||||
Net investment income(a)(b) | .13 | .17 | .27 | .21 | .20 | .07 | ||||||||||||||||||
Net realized and unrealized | (.23 | ) | .54 | (.38 | ) | (.11 | ) | .49 | (.31 | ) | ||||||||||||||
Contributions from Affiliates | – 0 | – | .00 | (c) | – 0 | – | .00 | (c) | – 0 | – | – 0 | – | ||||||||||||
|
| |||||||||||||||||||||||
Net increase (decrease) in net | (.10 | ) | .71 | (.11 | ) | .10 | .69 | (.24 | ) | |||||||||||||||
|
| |||||||||||||||||||||||
Less: Dividends and Distributions | ||||||||||||||||||||||||
Dividends from net investment | (.08 | ) | (.23 | ) | (.25 | ) | (.18 | ) | (.22 | ) | (.11 | ) | ||||||||||||
Return of capital | – 0 | – | (.01 | ) | – 0 | – | – 0 | – | – 0 | – | – 0 | – | ||||||||||||
|
| |||||||||||||||||||||||
Total dividends and distributions | (.08 | ) | (.24 | ) | (.25 | ) | (.18 | ) | (.22 | ) | (.11 | ) | ||||||||||||
|
| |||||||||||||||||||||||
Net asset value, end of period | $ 10.74 | $ 10.92 | $ 10.45 | $ 10.81 | $ 10.89 | $ 10.42 | ||||||||||||||||||
|
| |||||||||||||||||||||||
Total Return | ||||||||||||||||||||||||
Total investment return based | (.85 | )% | 6.88 | % | (1.01 | )% | .96 | % | 6.66 | % | (2.24 | )% | ||||||||||||
Ratios/Supplemental Data | ||||||||||||||||||||||||
Net assets, end of period | $5,813 | $5,051 | $12,055 | $2,903 | $2,409 | $1,616 | ||||||||||||||||||
Ratio to average net assets of: | ||||||||||||||||||||||||
Expenses, net of waivers/reimbursements(e) | .97 | %^ | 1.27 | % | 1.35 | % | 1.01 | % | .98 | % | .83 | % | ||||||||||||
Expenses, before waivers/reimbursements(e) | 1.29 | %^ | 1.57 | % | 1.65 | % | 1.37 | % | 1.36 | % | 1.17 | % | ||||||||||||
Net investment income(b) | 2.46 | %^ | 1.61 | % | 2.57 | % | 1.95 | % | 1.87 | % | .70 | % | ||||||||||||
Portfolio turnover rate | 27 | % | 40 | % | 36 | % | 42 | % | 41 | % | 51 | % | ||||||||||||
See footnote summary on page 97.
| 92 | AB BOND INFLATION STRATEGY | abfunds.com | |
FINANCIAL HIGHLIGHTS (continued)
Selected Data For A Share Of Capital Stock Outstanding Throughout Each Period
| Class I | ||||||||||||||||||||||||
Six Months (unaudited) | Year Ended October 31, | |||||||||||||||||||||||
| 2019 | 2018 | 2017 | 2016 | 2015 | ||||||||||||||||||||
|
| |||||||||||||||||||||||
Net asset value, beginning of period | $ 10.84 | $ 10.38 | $ 10.74 | $ 10.84 | $ 10.38 | $ 10.73 | ||||||||||||||||||
|
| |||||||||||||||||||||||
Income From Investment | ||||||||||||||||||||||||
Net investment income (loss)(a)(b) | .14 | .25 | .28 | .24 | .22 | (.06 | ) | |||||||||||||||||
Net realized and unrealized | (.22 | ) | .49 | (.36 | ) | (.12 | ) | .50 | (.14 | ) | ||||||||||||||
Contributions from Affiliates | – 0 | – | .00 | (c) | – 0 | – | .00 | (c) | – 0 | – | – 0 | – | ||||||||||||
|
| |||||||||||||||||||||||
Net increase (decrease) in net | (.08 | ) | .74 | (.08 | ) | .12 | .72 | (.20 | ) | |||||||||||||||
|
| |||||||||||||||||||||||
Less: Dividends and Distributions | ||||||||||||||||||||||||
Dividends from net investment | (.10 | ) | (.27 | ) | (.28 | ) | (.22 | ) | (.26 | ) | (.15 | ) | ||||||||||||
Return of capital | – 0 | – | (.01 | ) | – 0 | – | – 0 | – | – 0 | – | – 0 | – | ||||||||||||
|
| |||||||||||||||||||||||
Total dividends and distributions | (.10 | ) | (.28 | ) | (.28 | ) | (.22 | ) | (.26 | ) | (.15 | ) | ||||||||||||
|
| |||||||||||||||||||||||
Net asset value, end of period | $ 10.66 | $ 10.84 | $ 10.38 | $ 10.74 | $ 10.84 | $ 10.38 | ||||||||||||||||||
|
| |||||||||||||||||||||||
Total Return | ||||||||||||||||||||||||
Total investment return based | (.79 | )% | 7.23 | % | (.73 | )% | 1.15 | % | 6.98 | % | (1.88 | )% | ||||||||||||
Ratios/Supplemental Data | ||||||||||||||||||||||||
Net assets, end of period | $10,344 | $9,893 | $5,688 | $642 | $345 | $265 | ||||||||||||||||||
Ratio to average net assets of: | ||||||||||||||||||||||||
Expenses, net of waivers/reimbursements(e) | .73 | %^ | .94 | % | 1.11 | % | .76 | % | .72 | % | .57 | % | ||||||||||||
Expenses, before waivers/reimbursements(e) | .95 | %^ | 1.18 | % | 1.34 | % | .99 | % | 1.03 | % | .76 | % | ||||||||||||
Net investment income (loss)(b) | 2.59 | %^ | 2.40 | % | 2.67 | % | 2.25 | % | 2.08 | % | (.50 | )% | ||||||||||||
Portfolio turnover rate | 27 | % | 40 | % | 36 | % | 42 | % | 41 | % | 51 | % | ||||||||||||
See footnote summary on page 97.
| abfunds.com | AB BOND INFLATION STRATEGY | 93 | |
FINANCIAL HIGHLIGHTS (continued)
Selected Data For A Share Of Capital Stock Outstanding Throughout Each Period
| Class 1 | ||||||||||||||||||||||||
Six Months (unaudited) | Year Ended October 31, | |||||||||||||||||||||||
| 2019 | 2018 | 2017 | 2016 | 2015 | ||||||||||||||||||||
|
| |||||||||||||||||||||||
Net asset value, beginning of | $ 10.77 | $ 10.33 | $ 10.69 | $ 10.80 | $ 10.35 | $ 10.71 | ||||||||||||||||||
|
| |||||||||||||||||||||||
Income From Investment Operations | ||||||||||||||||||||||||
Net investment income(a)(b) | .13 | .24 | .28 | .22 | .20 | .10 | ||||||||||||||||||
Net realized and unrealized gain (loss) on investment and foreign currency transactions | (.23 | ) | .48 | (.36 | ) | (.11 | ) | .51 | (.32 | ) | ||||||||||||||
Contributions from Affiliates | – 0 | – | .00 | (c) | – 0 | – | .00 | (c) | – 0 | – | – 0 | – | ||||||||||||
|
| |||||||||||||||||||||||
Net increase (decrease) in net asset value from operations | (.10 | ) | .72 | (.08 | ) | .11 | .71 | (.22 | ) | |||||||||||||||
|
| |||||||||||||||||||||||
Less: Dividends and Distributions | ||||||||||||||||||||||||
Dividends from net investment | (.09 | ) | (.27 | ) | (.28 | ) | (.22 | ) | (.26 | ) | (.14 | ) | ||||||||||||
Return of capital | – 0 | – | (.01 | ) | – 0 | – | – 0 | – | – 0 | – | – 0 | – | ||||||||||||
|
| |||||||||||||||||||||||
Total dividends and distributions | (.09 | ) | (.28 | ) | (.28 | ) | (.22 | ) | (.26 | ) | (.14 | ) | ||||||||||||
|
| |||||||||||||||||||||||
Net asset value, end of period | $ 10.58 | $ 10.77 | $ 10.33 | $ 10.69 | $ 10.80 | $ 10.35 | ||||||||||||||||||
|
| |||||||||||||||||||||||
Total Return | ||||||||||||||||||||||||
Total investment return based on net asset value(d) | (.80 | )% | 7.18 | % | (.77 | )%‡ | 1.01 | % | 6.89 | % | (2.04 | )% | ||||||||||||
Ratios/Supplemental Data | ||||||||||||||||||||||||
Net assets, end of period | $300,240 | $319,282 | $306,620 | $274,366 | $226,408 | $253,402 | ||||||||||||||||||
Ratio to average net assets of: | ||||||||||||||||||||||||
Expenses, net of waivers/reimbursements(e) | .83 | %^ | 1.07 | % | 1.14 | % | .86 | % | .82 | % | .68 | % | ||||||||||||
Expenses, before waivers/reimbursements(e) | .96 | %^ | 1.20 | % | 1.28 | % | 1.04 | % | 1.03 | % | .87 | % | ||||||||||||
Net investment income(b) | 2.46 | %^ | 2.31 | % | 2.66 | % | 2.10 | % | 1.86 | % | .98 | % | ||||||||||||
Portfolio turnover rate | 27 | % | 40 | % | 36 | % | 42 | % | 41 | % | 51 | % | ||||||||||||
See footnote summary on page 97.
| 94 | AB BOND INFLATION STRATEGY | abfunds.com | |
FINANCIAL HIGHLIGHTS (continued)
Selected Data For A Share Of Capital Stock Outstanding Throughout Each Period
| Class 2 | ||||||||||||||||||||||||
| Six Months Ended April 30, 2020 | Year Ended October 31, | |||||||||||||||||||||||
| (unaudited) | 2019 | 2018 | 2017 | 2016 | 2015 | |||||||||||||||||||
|
| |||||||||||||||||||||||
Net asset value, beginning of | $ 10.76 | $ 10.32 | $ 10.69 | $ 10.79 | $ 10.35 | $ 10.71 | ||||||||||||||||||
|
| |||||||||||||||||||||||
Income From Investment Operations | ||||||||||||||||||||||||
Net investment income(a)(b) | .13 | .26 | .29 | .24 | .20 | .11 | ||||||||||||||||||
Net realized and unrealized gain (loss) on investment and foreign currency transactions | (.22 | ) | .48 | (.37 | ) | (.11 | ) | .51 | (.32 | ) | ||||||||||||||
Contributions from Affiliates | – 0 | – | .00 | (c) | – 0 | – | .00 | (c) | – 0 | – | – 0 | – | ||||||||||||
|
| |||||||||||||||||||||||
Net increase (decrease) in net asset value from operations | (.09 | ) | .74 | (.08 | ) | .13 | .71 | (.21 | ) | |||||||||||||||
|
| |||||||||||||||||||||||
Less: Dividends and Distributions | ||||||||||||||||||||||||
Dividends from net investment | (.10 | ) | (.29 | ) | (.29 | ) | (.23 | ) | (.27 | ) | (.15 | ) | ||||||||||||
Return of capital | – 0 | – | (.01 | ) | – 0 | – | – 0 | – | – 0 | – | – 0 | – | ||||||||||||
|
| |||||||||||||||||||||||
Total dividends and distributions | (.10 | ) | (.30 | ) | (.29 | ) | (.23 | ) | (.27 | ) | (.15 | ) | ||||||||||||
|
| |||||||||||||||||||||||
Net asset value, end of period | $ 10.57 | $ 10.76 | $ 10.32 | $ 10.69 | $ 10.79 | $ 10.35 | ||||||||||||||||||
|
| |||||||||||||||||||||||
Total Return | ||||||||||||||||||||||||
Total investment return based on net asset value(d) | (.75 | )% | 7.19 | % | (.77 | )% | 1.21 | % | 6.92 | % | (1.95 | )% | ||||||||||||
Ratios/Supplemental Data | ||||||||||||||||||||||||
Net assets, end of period | $54,544 | $58,829 | $50,705 | $54,118 | $37,207 | $40,897 | ||||||||||||||||||
Ratio to average net assets of: | ||||||||||||||||||||||||
Expenses, net of waivers/reimbursements(e) | .74 | %^ | .96 | % | 1.03 | % | .76 | % | .72 | % | .58 | % | ||||||||||||
Expenses, before waivers/reimbursements(e) | .86 | %^ | 1.09 | % | 1.17 | % | .94 | % | .93 | % | .77 | % | ||||||||||||
Net investment income(b) | 2.50 | %^ | 2.45 | % | 2.78 | % | 2.24 | % | 1.93 | % | 1.09 | % | ||||||||||||
Portfolio turnover rate | 27 | % | 40 | % | 36 | % | 42 | % | 41 | % | 51 | % | ||||||||||||
See footnote summary on page 97.
| abfunds.com | AB BOND INFLATION STRATEGY | 95 | |
FINANCIAL HIGHLIGHTS (continued)
Selected Data For A Share Of Capital Stock Outstanding Throughout Each Period
| Class Z | ||||||||||||||||||||||||
Six Months (unaudited) | Year Ended October 31, | December 11, 2014(f) to October 31, | ||||||||||||||||||||||
| 2019 | 2018 | 2017 | 2016 | 2015 | ||||||||||||||||||||
|
| |||||||||||||||||||||||
Net asset value, beginning of | $ 10.80 | $ 10.35 | $ 10.72 | $ 10.82 | $ 10.38 | $ 10.62 | ||||||||||||||||||
|
| |||||||||||||||||||||||
Income From Investment Operations | ||||||||||||||||||||||||
Net investment income(a)(b) | .14 | .27 | .28 | .24 | .25 | .19 | ||||||||||||||||||
Net realized and unrealized | (.23 | ) | .47 | (.36 | ) | (.11 | ) | .46 | (.28 | ) | ||||||||||||||
Contributions from Affiliates | – 0 | – | .00 | (c) | – 0 | – | .00 | (c) | – 0 | – | – 0 | – | ||||||||||||
|
| |||||||||||||||||||||||
Net increase (decrease) in net asset value from operations | (.09 | ) | .74 | (.08 | ) | .13 | .71 | (.09 | ) | |||||||||||||||
|
| |||||||||||||||||||||||
Less: Dividends and Distributions | ||||||||||||||||||||||||
Dividends from net investment | (.10 | ) | (.28 | ) | (.29 | ) | (.23 | ) | (.27 | ) | (.15 | ) | ||||||||||||
Return of capital | – 0 | – | (.01 | ) | – 0 | – | – 0 | – | – 0 | – | – 0 | – | ||||||||||||
|
| |||||||||||||||||||||||
Total dividends and distributions | (.10 | ) | (.29 | ) | (.29 | ) | (.23 | ) | (.27 | ) | (.15 | ) | ||||||||||||
|
| |||||||||||||||||||||||
Net asset value, end of period | $ 10.61 | $ 10.80 | $ 10.35 | $ 10.72 | $ 10.82 | $ 10.38 | ||||||||||||||||||
|
| |||||||||||||||||||||||
| Total Return | ||||||||||||||||||||||||
Total investment return based on net asset value(d) | (.85 | )% | 7.26 | % | (.77 | )% | 1.19 | % | 6.89 | % | (.86 | )% | ||||||||||||
Ratios/Supplemental Data | ||||||||||||||||||||||||
Net assets, end of period | $32,084 | $32,606 | $26,142 | $16,019 | $11,576 | $3,821 | ||||||||||||||||||
Ratio to average net assets of: | ||||||||||||||||||||||||
Expenses, net of waivers/reimbursements(e) | .74 | %^ | .96 | % | 1.06 | % | .76 | % | .73 | % | .61 | %^ | ||||||||||||
Expenses, before waivers/reimbursements(e) | .87 | %^ | 1.10 | % | 1.21 | % | .94 | % | .95 | % | .84 | %^ | ||||||||||||
Net investment income(b) | 2.53 | %^ | 2.50 | % | 2.69 | % | 2.22 | % | 2.40 | % | 2.09 | %^ | ||||||||||||
Portfolio turnover rate | 27 | % | 40 | % | 36 | % | 42 | % | 41 | % | 51 | % | ||||||||||||
See footnote summary on page 97.
| 96 | AB BOND INFLATION STRATEGY | abfunds.com | |
FINANCIAL HIGHLIGHTS (continued)
Selected Data For A Share Of Capital Stock Outstanding Throughout Each Period
| (a) | Based on average shares outstanding. |
| (b) | Net of expenses waived/reimbursed by the Adviser. |
| (c) | Amount is less than $.005. |
| (d) | Total investment return is calculated assuming an initial investment made at the net asset value at the beginning of the period, reinvestment of all dividends and distributions at net asset value during the period, and redemption on the last day of the period. Initial sales charges or contingent deferred sales charges are not reflected in the calculation of total investment return. Total return does not reflect the deduction of taxes that a shareholder would pay on fund distributions or the redemption of fund shares. Total investment return calculated for a period of less than one year is not annualized. |
| (e) | The expense ratios presented below exclude interest expense: |
Six Months (unaudited) | Year Ended October 31, | |||||||||||||||||||||||
| 2019 | 2018 | 2017 | 2016 | 2015 | ||||||||||||||||||||
|
| |||||||||||||||||||||||
Class A | ||||||||||||||||||||||||
Net of waivers/reimbursements | .75 | %^ | .75 | % | .75 | % | .75 | % | .76 | % | .80 | % | ||||||||||||
Before waivers/reimbursements | 1.01 | %^ | 1.02 | % | 1.01 | % | 1.07 | % | 1.20 | % | 1.28 | % | ||||||||||||
Class C | ||||||||||||||||||||||||
Net of waivers/reimbursements | 1.50 | %^ | 1.50 | % | 1.50 | % | 1.50 | % | 1.50 | % | 1.50 | % | ||||||||||||
Before waivers/reimbursements | 1.77 | %^ | 1.77 | % | 1.76 | % | 1.82 | % | 1.94 | % | 1.99 | % | ||||||||||||
Advisor Class | ||||||||||||||||||||||||
Net of waivers/reimbursements | .50 | %^ | .50 | % | .50 | % | .50 | % | .50 | % | .50 | % | ||||||||||||
Before waivers/reimbursements | .76 | %^ | .77 | % | .76 | % | .83 | % | .93 | % | .98 | % | ||||||||||||
Class R | ||||||||||||||||||||||||
Net of waivers/reimbursements | 1.00 | %^ | 1.00 | % | 1.00 | % | 1.00 | % | 1.00 | % | 1.00 | % | ||||||||||||
Before waivers/reimbursements | 1.37 | %^ | 1.36 | % | 1.36 | % | 1.38 | % | 1.47 | % | 1.44 | % | ||||||||||||
Class K | ||||||||||||||||||||||||
Net of waivers/reimbursements | .75 | %^ | .75 | % | .75 | % | .75 | % | .75 | % | .75 | % | ||||||||||||
Before waivers/reimbursements | 1.06 | %^ | 1.04 | % | 1.05 | % | 1.10 | % | 1.13 | % | 1.09 | % | ||||||||||||
Class I | ||||||||||||||||||||||||
Net of waivers/reimbursements | .50 | %^ | .50 | % | .50 | % | .50 | % | .50 | % | .50 | % | ||||||||||||
Before waivers/reimbursements | .72 | %^ | .73 | % | .73 | % | .72 | % | .81 | % | .69 | % | ||||||||||||
Class 1 | ||||||||||||||||||||||||
Net of waivers/reimbursements | .60 | %^ | .60 | % | .60 | % | .60 | % | .60 | % | .60 | % | ||||||||||||
Before waivers/reimbursements | .73 | %^ | .73 | % | .74 | % | .77 | % | .81 | % | .79 | % | ||||||||||||
Class 2 | ||||||||||||||||||||||||
Net of waivers/reimbursements | .50 | %^ | .50 | % | .50 | % | .50 | % | .50 | % | .50 | % | ||||||||||||
Before waivers/reimbursements | .62 | %^ | .63 | % | .64 | % | .67 | % | .71 | % | .69 | % | ||||||||||||
Class Z(g) | ||||||||||||||||||||||||
Net of waivers/reimbursements | .50 | %^ | .50 | % | .50 | % | .50 | % | .50 | % | .50 | %^ | ||||||||||||
Before waivers/reimbursements | .63 | %^ | .64 | % | .65 | % | .68 | % | .72 | % | .73 | %^ | ||||||||||||
| (f) | Commencement of distributions. |
| (g) | Commenced distribution on December 11, 2014. |
| ‡ | The net asset value and total return include adjustments in accordance with accounting principles generally accepted in the United States of America for financial reporting purposes. As such, the net asset value and total return for shareholder transactions may differ from financial statements. |
| ^ | Annualized. |
See notes to financial statements.
| abfunds.com | AB BOND INFLATION STRATEGY | 97 | |
BOARD OF DIRECTORS
Marshall C. Turner, Jr.(1), Chairman Jorge A. Bermudez(1) Michael J. Downey(1) Nancy P. Jacklin(1) | Robert M. Keith, President and Jeanette Loeb(1) Carol C. McMullen(1) Garry L. Moody(1) Earl D. Weiner(1) |
OFFICERS
Michael Canter(2), Vice President Shawn E. Keegan(2), Vice President Janaki Rao(2), Vice President Dimitri Silva(2), Vice President Emilie D. Wrapp, Secretary | Michael B. Reyes, Senior Analyst Joseph J. Mantineo, Treasurer and Chief Financial Officer Phyllis J. Clarke, Controller Vincent S. Noto, Chief Compliance Officer |
Custodian and Accounting Agent State Street Bank and Trust Company State Street Corporation CCB/5 1 Iron Street Boston, MA 02210
Principal Underwriter AllianceBernstein Investments, Inc. 1345 Avenue of the Americas New York, NY 10105
Transfer Agent AllianceBernstein Investor Services, Inc. P.O. Box 786003 San Antonio, TX 78278-6003 Toll-Free (800) 221-5672 | Independent Registered Public Ernst & Young LLP 5 Times Square New York, NY 10036
Legal Counsel Seward & Kissel LLP One Battery Park Plaza New York, NY 10004 |
| 1 | Member of the Audit Committee, the Governance and Nominating Committee, and the Independent Directors Committee. |
| 2 | The day-to-day management of, and investment decisions for, the Fund’s portfolio are made by the Adviser’s U.S. Multi-Sector Fixed-Income Team. Messrs. Canter, Keegan, Rao and Silva are the investment professionals with the most significant responsibility for the day-to-day management of the Fund’s portfolio. |
| 98 | AB BOND INFLATION STRATEGY | abfunds.com | |
Operation and Effectiveness of the Fund’s Liquidity Risk Management Program:
In October 2016, the Securities and Exchange Commission (“SEC”) adopted the open-end fund liquidity rule (the “Liquidity Rule”). In June 2018 the SEC adopted a requirement that funds disclose information about the operation and effectiveness of their Liquidity Risk Management Program (“LRMP”) in their reports to shareholders.
One of the requirements of the Liquidity Rule is for the Fund to designate an Administrator of the Fund’s Liquidity Risk Management Program. The Administrator of the Fund’s LRMP is AllianceBernstein L.P., the Fund’s investment adviser (the “Adviser”). The Adviser has delegated the responsibility to its Liquidity Risk Management Committee (the “Committee”). Another requirement of the Liquidity Rule is for the Fund’s Board of Directors (the “Fund Board”) to receive an annual written report from the Administrator of the LRMP, which addresses the operation of the Fund’s LRMP and assesses its adequacy and effectiveness. The Adviser provided the Fund’s Board with such annual report during the first quarter of 2020, which covered the period December 1, 2018 through December 31, 2019 (the “Program Reporting Period”).
The LRMP’s principal objectives include supporting the Fund’s compliance with limits on investments in illiquid assets and mitigating the risk that the Fund will be unable to meet its redemption obligations in a timely manner. Pursuant to the LRMP, the Fund classifies the liquidity of its portfolio investments into one of the four categories defined by the SEC: Highly Liquid, Moderately Liquid, Less Liquid, and Illiquid. These classifications are reported to the SEC on Form N-PORT.
During the Program Reporting Period, the Committee reviewed whether the Fund’s strategy is appropriate for an open-end structure, taking into account any holdings of less liquid and illiquid assets. The Committee also performed an analysis to determine whether the Fund is required to maintain a Highly Liquid Investment Minimum (“HLIM”). If the Fund participated in derivative transactions, the exposure from such transactions were considered in the LRMP. The Committee also incorporated the following information when determining the Fund’s reasonably anticipated trading size for purposes of liquidity monitoring: historical net redemption activity, a Fund’s concentration in an issuer, shareholder concentration, investment performance, total net assets, and distribution channels.
The Adviser informed the Fund Board that the Committee believes the Fund’s LRMP is adequately designed, has been implemented as intended, and has operated effectively since its inception. No material exceptions have been noted since the implementation of the LRMP, and there were no liquidity events that impacted the Fund or its ability to timely meet redemptions during the Program Reporting Period.
| abfunds.com | AB BOND INFLATION STRATEGY | 99 | |
Information Regarding the Review and Approval of the Fund’s Advisory Agreement
The disinterested directors (the “directors”) of AB Bond Fund, Inc. (the “Company”) unanimously approved the continuance of the Company’s Advisory Agreement with the Adviser in respect of AB Bond Inflation Strategy (the “Fund”) at a meeting held on November 4-6, 2019 (the “Meeting”.)*
Prior to approval of the continuance of the Advisory Agreement, the directors had requested from the Adviser, and received and evaluated, extensive materials. They reviewed the proposed continuance of the Advisory Agreement with the Adviser and with experienced counsel who are independent of the Adviser, who advised on the relevant legal standards. The directors also reviewed additional materials, including comparative analytical data prepared by the Senior Analyst for the Fund. The directors also discussed the proposed continuance in private sessions with counsel.
The directors considered their knowledge of the nature and quality of the services provided by the Adviser to the Fund gained from their experience as directors or trustees of most of the registered investment companies advised by the Adviser, their overall confidence in the Adviser’s integrity and competence they have gained from that experience, the Adviser’s initiative in identifying and raising potential issues with the directors and its responsiveness, frankness and attention to concerns raised by the directors in the past, including the Adviser’s willingness to consider and implement organizational and operational changes designed to improve investment results and the services provided to the AB Funds. The directors noted that they have four regular meetings each year, at each of which they review extensive materials and information from the Adviser, including information on the investment performance of the Fund and the underlying fund advised by the Adviser in which the Fund invests.
The directors also considered all factors they believed relevant, including the specific matters discussed below. During the course of their deliberations, the directors evaluated, among other things, the reasonableness of the advisory fee. The directors did not identify any particular information that was all-important or controlling, and different directors may have attributed different weights to the various factors. The directors determined that the selection of the Adviser to manage the Fund and the overall arrangements between the Fund and the Adviser, as provided in the Advisory Agreement, including the advisory fee, were fair and reasonable in light of the services performed, expenses incurred and such other matters as the directors considered relevant in the exercise of their business
| * | Following transactions completed on November 13, 2019 that may have been deemed to have been an “assignment” causing termination of the Fund’s investment advisory agreement, a new investment advisory agreement, having the same terms as the prior one, was entered into by the Fund and the Adviser. |
| 100 | AB BOND INFLATION STRATEGY | abfunds.com | |
judgment. The material factors and conclusions that formed the basis for the directors’ determinations included the following:
Nature, Extent and Quality of Services Provided
The directors considered the scope and quality of services provided by the Adviser under the Advisory Agreement, including the quality of the investment research capabilities of the Adviser and the other resources it has dedicated to performing services for the Fund. The directors noted that the Adviser from time to time reviews the Fund’s investment strategies and from time to time proposes changes intended to improve the Fund’s relative or absolute performance for the directors’ consideration. They also noted the professional experience and qualifications of the Fund’s portfolio management team and other senior personnel of the Adviser. The directors also considered that the Advisory Agreement provides that the Fund will reimburse the Adviser for the cost to it of providing certain clerical, accounting, administrative and other services to the Fund by employees of the Adviser or its affiliates. Requests for these reimbursements are made on a quarterly basis and subject to approval by the directors. Reimbursements, to the extent requested and paid, result in a higher rate of total compensation from the Fund to the Adviser than the fee rate stated in the Advisory Agreement. The directors noted that the methodology used to determine the reimbursement amounts had been reviewed by an independent consultant retained by the Fund’s former Senior Officer/Independent Compliance Officer. The quality of administrative and other services, including the Adviser’s role in coordinating the activities of the Fund’s other service providers, also was considered. The directors concluded that, overall, they were satisfied with the nature, extent and quality of services provided to the Fund under the Advisory Agreement.
Costs of Services Provided and Profitability
The directors reviewed a schedule of the revenues and expenses and related notes indicating the profitability of the Fund to the Adviser for calendar years 2017 and 2018 that had been prepared with an expense allocation methodology arrived at in consultation with an independent consultant retained by the Fund’s former Senior Officer/Independent Compliance Officer. The directors noted the assumptions and methods of allocation used by the Adviser in preparing fund-specific profitability data and understood that there are a number of potentially acceptable allocation methodologies for information of this type. The directors noted that the profitability information reflected all revenues and expenses of the Adviser’s relationship with the Fund, including those relating to its subsidiaries that provide transfer agency and distribution services to the Fund. The directors recognized that it is difficult to make comparisons of the profitability of the Advisory Agreement with the profitability of fund advisory contracts for unaffiliated funds because comparative information is not generally publicly available and is affected by numerous factors. The directors focused on the profitability of the Adviser’s relationship with the Fund before taxes and
| abfunds.com | AB BOND INFLATION STRATEGY | 101 | |
distribution expenses. The directors concluded that the Adviser’s level of profitability from its relationship with the Fund was not unreasonable.
Fall-Out Benefits
The directors considered the other benefits to the Adviser and its affiliates from their relationships with the Fund and the underlying fund advised by the Adviser in which the Fund invests, including, but not limited to, benefits relating to 12b-1 fees and sales charges received by the Fund’s principal underwriter (which is a wholly owned subsidiary of the Adviser) in respect of certain classes of the Fund’s shares; and transfer agency fees paid by the Fund to a wholly owned subsidiary of the Adviser. The directors recognized that the Fund’s recent profitability to the Adviser would be somewhat lower without these benefits. The directors understood that the Adviser also might derive reputational and other benefits from its association with the Fund.
Investment Results
In addition to the information reviewed by the directors in connection with the Meeting, the directors receive detailed performance information for the Fund at each regular Board meeting during the year.
At the Meeting, the directors reviewed performance information prepared by an independent service provider (the “15(c) service provider”), showing the performance of the Class A Shares of the Fund against a group of similar funds (“peer group”) and a larger group of similar funds (“peer universe”), each selected by the 15(c) service provider, and information prepared by the Adviser showing performance of the Class A Shares against a broad-based securities market index, in each case for the 1-, 3- and 5-year periods ended July 31, 2019 and (in the case of comparisons with the broad-based securities market index) for the period from inception. Based on their review, the directors concluded that the Fund’s investment performance was acceptable.
Advisory Fees and Other Expenses
The directors considered the advisory fee rate payable by the Fund to the Adviser and information prepared by the 15(c) service provider concerning advisory fee rates payable by other funds in the same category as the Fund. The directors recognized that it is difficult to make comparisons of advisory fees because there are variations in the services that are included in the fees payable by other funds. The directors compared the Fund’s contractual effective advisory fee rate with a peer group median and noted that it was above the median. The directors took into account the impact on the advisory fee rate of the administrative expense reimbursement paid to the Adviser in the latest fiscal year.
The directors also considered the Adviser’s fee schedule for other clients utilizing investment strategies similar to those of the Fund. For this
| 102 | AB BOND INFLATION STRATEGY | abfunds.com | |
purpose, they reviewed the relevant advisory fee information from the Adviser’s Form ADV and in a report from the Fund’s Senior Analyst and noted the differences between the Fund’s fee schedule, on the one hand, and the Adviser’s institutional fee schedule and the schedule of fees charged by the Adviser to any offshore funds and for services to any sub-advised funds utilizing investment strategies similar to those of the Fund, on the other. The directors noted that the Adviser may, in some cases, agree to fee rates with large institutional clients that are lower than those reviewed by the directors and that they had previously discussed with the Adviser its policies in respect of such arrangements. The directors previously discussed these matters with an independent fee consultant.
The Adviser reviewed with the directors the significantly greater scope of the services it provides to the Fund relative to institutional, offshore fund and sub-advised fund clients. In this regard, the Adviser noted, among other things, that, compared to institutional and offshore or sub-advisory accounts, the Fund (i) demands considerably more portfolio management, research and trading resources due to significantly higher daily cash flows; (ii) has more tax and regulatory restrictions and compliance obligations; (iii) must prepare and file or distribute regulatory and other communications about fund operations; and (iv) must provide shareholder servicing to retail investors. The Adviser also reviewed the greater legal risks presented by the large and changing population of Fund shareholders who may assert claims against the Adviser in individual or class actions, and the greater entrepreneurial risk in offering new fund products, which require substantial investment to launch, may not succeed, and generally must be priced to compete with larger, more established funds resulting in lack of profitability to the Adviser until a new fund achieves scale. In light of the substantial differences in services rendered by the Adviser to institutional, offshore fund and sub-advised fund clients as compared to the Fund, and the different risk profile, the directors considered these fee comparisons inapt and did not place significant weight on them in their deliberations.
In connection with their review of the Fund’s advisory fee, the directors also considered the total expense ratio of the Class A shares of the Fund in comparison to a peer group and a peer universe selected by the 15(c) service provider. The Class A expense ratio of the Fund was based on the Fund’s latest fiscal year and the directors considered the Adviser’s expense cap for the Fund. The directors noted that it was likely that the expense ratios of some of the other funds in the Fund’s category were lowered by waivers or reimbursements by those funds’ investment advisers, which in some cases might be voluntary or temporary. The directors view expense ratio information as relevant to their evaluation of the Adviser’s services because the Adviser is responsible for coordinating services provided to the Fund by others. Based on their review, the directors concluded that the Fund’s expense ratio was acceptable.
| abfunds.com | AB BOND INFLATION STRATEGY | 103 | |
Economies of Scale
The directors noted that the advisory fee schedule for the Fund contains breakpoints that reduce the fee rates on assets above specified levels. The directors took into consideration prior presentations by an independent consultant on economies of scale in the mutual fund industry and for the AB Funds, and presentations from time to time by the Adviser concerning certain of its views on economies of scale. The directors also previously discussed economies of scale with an independent fee consultant. The directors also had requested and received from the Adviser certain updates on economies of scale in advance of the Meeting. The directors believe that economies of scale may be realized (if at all) by the Adviser across a variety of products and services, and not only in respect of a single fund. The directors noted that there is no established methodology for setting breakpoints that give effect to the fund-specific services provided by a fund’s adviser and to the economies of scale that an adviser may realize in its overall mutual fund business or those components of it which directly or indirectly affect a fund’s operations. The directors observed that in the mutual fund industry as a whole, as well as among funds similar to the Fund, there is no uniformity or pattern in the fees and asset levels at which breakpoints (if any) apply. The directors also noted that the advisory agreements for many funds do not have breakpoints at all. Having taken these factors into account, the directors concluded that the Fund’s shareholders would benefit from a sharing of economies of scale in the event the Fund’s net assets exceed a breakpoint in the future.
| 104 | AB BOND INFLATION STRATEGY | abfunds.com | |
This page is not part of the Shareholder Report or the Financial Statements.
AB FAMILY OF FUNDS
US EQUITY
CORE
Core Opportunities Fund
FlexFee™ US Thematic Portfolio
Select US Equity Portfolio
GROWTH
Concentrated Growth Fund
Discovery Growth Fund
FlexFee™ Large Cap Growth Portfolio
Growth Fund
Large Cap Growth Fund
Small Cap Growth Portfolio
VALUE
Discovery Value Fund
Equity Income Fund
Relative Value Fund
Small Cap Value Portfolio
Value Fund
INTERNATIONAL/ GLOBAL EQUITY
CORE
FlexFee™ International Strategic Core Portfolio
Global Core Equity Portfolio
International Portfolio
International Strategic Core Portfolio
Sustainable Global Thematic Fund
Tax-Managed International Portfolio
Tax-Managed Wealth Appreciation Strategy
Wealth Appreciation Strategy
INTERNATIONAL/ GLOBAL EQUITY (continued)
GROWTH
Concentrated International Growth Portfolio
FlexFee™ Emerging Markets Growth Portfolio
Sustainable International Thematic Fund
VALUE
All China Equity Portfolio
International Value Fund
FIXED INCOME
MUNICIPAL
High Income Municipal Portfolio
Intermediate California Municipal Portfolio
Intermediate Diversified Municipal Portfolio
Intermediate New York Municipal Portfolio
Municipal Bond Inflation Strategy
Tax-Aware Fixed Income Opportunities Portfolio1
National Portfolio
Arizona Portfolio
California Portfolio
Massachusetts Portfolio
Minnesota Portfolio
New Jersey Portfolio
New York Portfolio
Ohio Portfolio
Pennsylvania Portfolio
Virginia Portfolio
FIXED INCOME (continued)
TAXABLE
Bond Inflation Strategy
FlexFee™ High Yield Portfolio
FlexFee™ International Bond Portfolio
Global Bond Fund
High Income Fund
Income Fund
Intermediate Duration Portfolio
Limited Duration High Income Portfolio
Short Duration Income Portfolio
Short Duration Portfolio
Total Return Bond Portfolio1
ALTERNATIVES
All Market Real Return Portfolio
Global Real Estate Investment Fund
Select US Long/Short Portfolio
Unconstrained Bond Fund
MULTI-ASSET
All Market Income Portfolio
All Market Total Return Portfolio
Conservative Wealth Strategy
Emerging Markets Multi-Asset Portfolio
Global Risk Allocation Fund
Tax-Managed All Market Income Portfolio
CLOSED-END FUNDS
AllianceBernstein Global High Income Fund
AllianceBernstein National Municipal Income Fund
We also offer Government Money Market Portfolio, which serves as the money market fund exchange vehicle for the AB mutual funds. You could lose money by investing in the Fund. Although the Fund seeks to preserve the value of your investment at $1.00 per share, it cannot guarantee it will do so. The Fund may impose a fee upon sale of your shares or may temporarily suspend your ability to sell shares if the Fund’s liquidity falls below required minimums because of market conditions or other factors. An investment in the Fund is not insured or guaranteed by the Federal Deposit Insurance Corporation or any other government agency. The Fund’s sponsor has no legal obligation to provide financial support to the Fund, and you should not expect that the sponsor will provide financial support to the Fund at any time.
Investors should consider the investment objectives, risks, charges and expenses of the Fund carefully before investing. For copies of our prospectus or summary prospectus, which contain this and other information, visit us online at www.abfunds.com or contact your AB representative. Please read the prospectus and/or summary prospectus carefully before investing.
| 1 | Prior to July 12, 2019, Total Return Bond Portfolio was named Intermediate Bond Portfolio; prior to February 5, 2020, Tax-Aware Fixed Income Opportunities Portfolio was named Tax-Aware Fixed Income Portfolio. |
| abfunds.com | AB BOND INFLATION STRATEGY | 105 | |
NOTES
| 106 | AB BOND INFLATION STRATEGY | abfunds.com | |
NOTES
| abfunds.com | AB BOND INFLATION STRATEGY | 107 | |
NOTES
| 108 | AB BOND INFLATION STRATEGY | abfunds.com | |
AB BOND INFLATION STRATEGY
1345 Avenue of the Americas
New York, NY 10105
800 221 5672
BIS-0152-0420 
APR 04.30.20

SEMI-ANNUAL REPORT
AB INCOME FUND

Beginning January 1, 2021, as permitted by new regulations adopted by the Securities and Exchange Commission, the Fund’s annual and semi-annual shareholder reports will no longer be sent by mail, unless you specifically request paper copies of the reports. Instead, the reports will be made available on a website, and you will be notified by mail each time a report is posted and provided with a website address to access the report.
If you already elected to receive shareholder reports electronically, you will not be affected by this change and you need not take any action. You may elect to receive shareholder reports and other communications from the Fund electronically at any time by contacting your financial intermediary (such as a broker-dealer or bank) or, if you are a direct investor, by calling the Fund at (800) 221 5672.
You may elect to receive all future reports in paper form free of charge. If you invest through a financial intermediary, you can contact your financial intermediary to request that you continue to receive paper copies of your shareholder reports; if you invest directly with the Fund, you can call the Fund at (800) 221 5672. Your election to receive reports in paper form will apply to all funds held in your account with your financial intermediary or, if you invest directly, to all AB Mutual Funds you hold.
| Investment Products Offered | • Are Not FDIC Insured • May Lose Value • Are Not Bank Guaranteed | |
Investors should consider the investment objectives, risks, charges and expenses of the Fund carefully before investing. For copies of our prospectus or summary prospectus, which contain this and other information, visit us online at www.abfunds.com or contact your AB representative. Please read the prospectus and/or summary prospectus carefully before investing.
This shareholder report must be preceded or accompanied by the Fund’s prospectus for individuals who are not current shareholders of the Fund.
You may obtain a description of the Fund’s proxy voting policies and procedures, and information regarding how the Fund voted proxies relating to portfolio securities during the most recent 12-month period ended June 30, without charge. Simply visit AB’s website at www.abfunds.com, or go to the Securities and Exchange Commission’s (the “Commission”) website at www.sec.gov, or call AB at (800) 227 4618.
The Fund files its complete schedule of portfolio holdings with the Commission for the first and third quarters of each fiscal year as an exhibit to its reports on Form N-PORT. The Fund’s Form N-PORT reports are available on the Commission’s website at www.sec.gov. The Fund’s Forms N-PORT may also be reviewed and copied at the Commission’s Public Reference Room in Washington, DC; information on the operation of the Public Reference Room may be obtained by calling (800) SEC 0330. AB publishes full portfolio holdings for the Fund monthly at www.abfunds.com.
AllianceBernstein Investments, Inc. (ABI) is the distributor of the AB family of mutual funds. ABI is a member of FINRA and is an affiliate of AllianceBernstein L.P., the Adviser of the funds.
The [A/B] logo is a registered service mark of AllianceBernstein and AllianceBernstein® is a registered service mark used by permission of the owner, AllianceBernstein L.P.
| FROM THE PRESIDENT |  |
Dear Shareholder,
We are pleased to provide this report for AB Income Fund (the “Fund”). Please review the discussion of Fund performance, the market conditions during the reporting period and the Fund’s investment strategy.
As always, AB strives to keep clients ahead of what’s next by:
| + | Transforming uncommon insights into uncommon knowledge with a global research scope |
| + | Navigating markets with seasoned investment experience and sophisticated solutions |
| + | Providing thoughtful investment insights and actionable ideas |
Whether you’re an individual investor or a multi-billion-dollar institution, we put knowledge and experience to work for you.
AB’s global research organization connects and collaborates across platforms and teams to deliver impactful insights and innovative products. Better insights lead to better opportunities—anywhere in the world.
For additional information about AB’s range of products and shareholder resources, please log on to www.abfunds.com.
Thank you for your investment in the AB Mutual Funds.
Sincerely,

Robert M. Keith
President and Chief Executive Officer, AB Mutual Funds
| abfunds.com | AB INCOME FUND | 1 | |
SEMI-ANNUAL REPORT
June 15, 2020
This report provides management’s discussion of fund performance for AB Income Fund for the semi-annual reporting period ended April 30, 2020.
The investment objective of the Fund is to seek high current income consistent with preservation of capital.
NAV RETURNS AS OF APRIL 30, 2020 (unaudited)
| 6 Months | 12 Months | |||||||
| AB INCOME FUND | ||||||||
| Class A Shares | -3.72% | 1.48% | ||||||
| Class C Shares | -4.07% | 0.72% | ||||||
| Advisor Class Shares1 | -3.59% | 1.73% | ||||||
| Class Z Shares | -3.53% | 2 | — | |||||
| Bloomberg Barclays US Aggregate Bond Index | 4.86% | 10.84% | ||||||
| 1 | Please note that this share class is for investors purchasing shares through accounts established under certain fee-based programs sponsored and maintained by certain broker-dealers and financial intermediaries, institutional pension plans and/or investment advisory clients of, and certain other persons associated with, the Adviser and its affiliates or the Fund, or through other limited or special arrangements approved by the Adviser, such as purchases by shareholders of the Fund’s Predecessor Fund. |
| 2 | Since inception on 11/20/2019. |
INVESTMENT RESULTS
The table above shows the Fund’s performance compared to its benchmark, the Bloomberg Barclays US Aggregate Bond Index, for the six- and 12-month periods ended April 30, 2020. The inception date for Class Z shares was November 20, 2019; due to limited performance history, there is no discussion of performance for this share class.
During the six-month period, all share classes underperformed the benchmark, before sales charges. Sector allocation was the primary detractor, relative to the benchmark, due to exposures in high-yield corporate bonds, agency risk-sharing transactions and emerging-market corporate bonds, partially offset by gains in investment-grade corporate bonds. Security selection also detracted, as losses from commercial mortgage-backed securities (“CMBS”), emerging-market sovereign bonds and asset-backed securities were greater than gains in emerging-market corporate bonds. Country, yield-curve and currency decisions did not have a meaningful impact on performance.
During the 12-month period, all share classes underperformed the benchmark, before sales charges. Sector allocation was the primary detractor
| 2 | AB INCOME FUND | abfunds.com | |
because of exposures in agency risk-sharing transactions, high-yield corporate bonds and emerging-market corporate bonds, which were partially offset by gains in investment-grade corporate bonds. Security selection also detracted, as losses from CMBS, asset-backed securities and emerging-market sovereign bonds were greater than gains in emerging-market corporate bonds. Yield-curve positioning and currency decisions were minor detractors, while country allocations were a minor contributor to performance.
During both periods, the Fund utilized derivatives in the form of futures, interest rate swaptions and interest rate swaps to manage and hedge duration risk and/or to take active yield-curve positioning. Currency forwards and currency options, both written and purchased, were used to hedge foreign currency exposure and to take active currency risk. Purchased and written exchange-traded fund options and index options were used in an effort to add alpha (a measure of how the Fund is performing on a risk-adjusted basis versus its benchmark) through different strategies, including but not limited to relative value, put spreads and call spreads. Written swaptions were used as hedging tools against other active equity-like risks in the Fund, as well as to take active risk through high-yield exposure. Credit default swaps, both single name and index, were used to create synthetic exposure in investment-grade and high-yield credit risk. Total return swaps were used to create synthetic high-yield exposure in the Fund. The utilization of government-agency-related To Be Announced mortgage short-term positions was a significant contributor to the Fund’s turnover rate of 111%.
MARKET REVIEW AND INVESTMENT STRATEGY
Global fixed-income market returns were mixed over the six-month period ended April 30, 2020. The UK’s exit from the European Union and a US-China trade truce in January led markets higher until investor sentiment turned decidedly negative in March due to the spread of COVID-19. The US Federal Reserve (the “Fed”) initiated several measures during the period to provide liquidity in short-term repurchase agreements and US Treasuries. Investor uncertainty led to an unprecedented flight to quality as credit spreads on risk assets quickly widened to levels not seen since the 2008–2009 global financial crisis. Markets began to recover in April as governments and central banks initiated over $9 trillion of monetary and fiscal stimulus measures to combat the economic fallout from the virus and governments began to relax social distancing and stay-at-home guidelines.
The Fed lowered interest rates 150 basis points to zero, and most other major central banks followed suit with substantial rate cuts. Longer maturity and higher quality developed-market treasury returns were the best performers, along with investment-grade US corporate bonds that rallied in April on the back of record new issuance. High-yield corporate bond returns were negative as investors retreated from risk assets.
| abfunds.com | AB INCOME FUND | 3 | |
Securitized asset results were mixed. Emerging-market returns fell as sharply lower oil prices impacted emerging-market commodity exporters. The US dollar advanced against most developed- and emerging-market currencies. The Swiss franc and the yen, which are also considered safe haven currencies, advanced against the US dollar.
The Fund’s Senior Investment Management Team (the “Team”) continues to pursue high income, while preserving capital by investing primarily in government bonds from both US and non-US issuers as well as corporate bonds, with scope to invest a select amount in below investment-grade bonds. The Team manages the Fund with a core fixed-income strategy through a global, multi-sector approach that seeks an attractive risk/return profile.
INVESTMENT POLICIES
The Fund pursues its objective by investing, under normal circumstances, at least 80% of its net assets in income-producing securities. The Fund also normally invests at least 65% of its total assets in securities of US and foreign governments, their agencies or instrumentalities and repurchase agreements relating to US government securities.
The Fund normally invests at least 65% of its total assets in US dollar-denominated securities. The Fund may also invest up to 35% of its total assets in non-government fixed-income securities, including corporate debt securities, non-government mortgage-backed and other asset-backed securities, certificates of deposit and commercial paper. The Fund may invest up to 35% of its net assets in below investment-grade securities (commonly known as “junk bonds”). The Fund may invest no more than 25% of its total assets in securities of issuers in any one country other than the US. The Fund’s investments in foreign securities may include investments in securities of emerging-market countries or of issuers in emerging markets.
The Adviser selects securities for purchase or sale based on its assessment of the securities’ risks and return characteristics as well as the securities’ impact on the overall risks and return characteristics of the Fund. In making this assessment, the Adviser takes into account various factors, including the credit quality and sensitivity to interest rates of the securities under consideration and of the Fund’s other holdings. The Fund may invest in fixed-income securities with any maturity or duration.
The Fund utilizes derivatives, such as options, futures contracts, forwards and swaps to a significant extent. The Fund may, for example, use credit default, interest rate and total return swaps to establish
(continued on next page)
| 4 | AB INCOME FUND | abfunds.com | |
exposure to the fixed-income markets or particular fixed-income securities. Derivatives may provide a more efficient and economical exposure to market segments than direct investments, and may also be a more efficient way to alter the Fund’s exposure. The Fund may also enter into transactions such as reverse repurchase agreements that are similar to borrowings for investment purposes. The Fund’s use of derivatives and these borrowing transactions may create aggregate exposure that is substantially in excess of its net assets, effectively leveraging the Fund.
| abfunds.com | AB INCOME FUND | 5 | |
DISCLOSURES AND RISKS
Benchmark Disclosure
The Bloomberg Barclays US Aggregate Bond Index is unmanaged and does not reflect fees and expenses associated with the active management of a mutual fund portfolio. The Bloomberg Barclays US Aggregate Bond Index represents the performance of securities within the US investment-grade fixed-rate bond market, with index components for government and corporate securities, mortgage pass-through securities, asset-backed securities and commercial mortgage-backed securities. The index is not leveraged, whereas the Fund utilizes leverage. An investor cannot invest directly in an index, and its results are not indicative of the performance for any specific investment, including the Fund.
A Word About Risk
Market Risk: The market value of a security may move up or down, sometimes rapidly and unpredictably. These fluctuations may cause a security to be worth less than the price originally paid for it, or less than it was worth at an earlier time. Market risk may affect a single issuer, industry, sector of the economy or the market as a whole. Global economies and financial markets are increasingly interconnected, which increases the probabilities that conditions in one country or region might adversely impact issuers in a different country or region. Conditions affecting the general economy, including political, social, or economic instability at the local, regional, or global level may also affect the market value of a security. Health crises, such as pandemic and epidemic diseases, as well as other incidents that interrupt the expected course of events, such as natural disasters, war or civil disturbance, acts of terrorism, power outages and other unforeseeable and external events, and the public response to or fear of such diseases or events, have and may in the future have an adverse effect on the Fund’s investments and net asset value and can lead to increased market volatility. For example, any preventative or protective actions that governments may take in respect of such diseases or events may result in periods of business disruption, inability to obtain raw materials, supplies and component parts, and reduced or disrupted operations for the Fund’s portfolio companies. The occurrence and pendency of such diseases or events could adversely affect the economies and financial markets either in specific countries or worldwide.
Credit Risk: An issuer or guarantor of a fixed-income security, or the counterparty to a derivatives or other contract, may be unable or unwilling to make timely payments of interest or principal, or to otherwise honor its obligations. The issuer or guarantor may default, causing a loss of the full principal amount of a security. The degree of risk for a particular security may be reflected in its credit rating. There is the possibility that the credit rating of a fixed-income security may be downgraded after purchase, which may adversely affect the value of the security.
| 6 | AB INCOME FUND | abfunds.com | |
DISCLOSURES AND RISKS (continued)
Below Investment-Grade Securities Risk: Investments in fixed-income securities with lower ratings (commonly known as “junk bonds”) are subject to higher probability that an issuer will default or fail to meet its payment obligations. These securities may be subject to greater price volatility due to such factors as specific corporate developments and negative perceptions of the junk bond market generally and may be more difficult to trade than other types of securities.
Interest-Rate Risk: Changes in interest rates will affect the value of investments in fixed-income securities. When interest rates rise, the value of existing investments in fixed-income securities tends to fall and this decrease in value may not be offset by higher income from new investments. Interest-rate risk is generally greater for fixed-income securities with longer maturities or durations.
Duration Risk: Duration is a measure that relates the expected price volatility of a fixed-income security to changes in interest rates. The duration of a fixed-income security may be shorter than or equal to the full maturity of a fixed-income security. Fixed-income securities with longer durations have more risk and will decrease in price as interest rates rise.
Inflation Risk: This is the risk that the value of assets or income from investments will be less in the future as inflation decreases the value of money. As inflation increases, the value of the Fund’s assets can decline, as can the value of the Fund’s distributions. This risk is significantly greater for fixed-income securities with longer maturities.
Foreign (Non-US) Risk: Investments in securities of non-US issuers may involve more risk than those of US issuers. These securities may fluctuate more widely in price and may be more difficult to trade due to adverse market, economic, political, regulatory or other factors.
Emerging-Market Risk: Investments in emerging-market countries may have more risk because the markets are less developed and less liquid as well as being subject to increased economic, political, regulatory or other uncertainties.
Leverage Risk: To the extent the Fund uses leveraging techniques, its net asset value (“NAV”) may be more volatile because leverage tends to exaggerate the effect of changes in interest rates and any increase or decrease in the value of the Fund’s investments.
Currency Risk: Fluctuations in currency exchange rates may negatively affect the value of the Fund’s investments or reduce its returns.
| abfunds.com | AB INCOME FUND | 7 | |
DISCLOSURES AND RISKS (continued)
Illiquid Investments Risk: Illiquid investments risk exists when certain investments become difficult to purchase or sell. Difficulty in selling such investments may result in sales at disadvantageous prices affecting the value of your investment in the Fund. Causes of illiquid investments risk may include low trading volumes, large positions and heavy redemptions of Fund shares. Illiquid investments risk may be higher in a rising interest-rate environment, when the value and liquidity of fixed-income securities generally decline.
Mortgage-Related and/or Other Asset-Backed Securities Risk: Investments in mortgage-related and other asset-backed securities are subject to certain additional risks. The value of these securities may be particularly sensitive to changes in interest rates. These risks include “extension risk”, which is the risk that, in periods of rising interest rates, issuers may delay the payment of principal, and “prepayment risk”, which is the risk that in periods of falling interest rates, issuers may pay principal sooner than expected, exposing the Fund to a lower rate of return upon reinvestment of principal. Mortgage-backed securities offered by non-governmental issuers and other asset-backed securities may be subject to other risks, such as higher rates of default in the mortgages or assets backing the securities or risks associated with the nature and servicing of mortgages or assets backing the securities.
Derivatives Risk: Derivatives may be difficult to price or unwind and leveraged so that small changes may produce disproportionate losses for the Fund. Derivatives, especially over-the-counter derivatives, are also subject to counterparty risk.
Management Risk: The Fund is subject to management risk because it is an actively managed investment fund. The Adviser will apply its investment techniques and risk analyses in making investment decisions, but there is no guarantee that its techniques will produce the intended results. Some of these techniques may incorporate, or rely upon, quantitative models, but there is no guarantee that these models will generate accurate forecasts, reduce risk or otherwise perform as expected.
These risks are fully discussed in the Fund’s prospectus. As with all investments, you may lose money by investing in the Fund.
An Important Note About Historical Performance
The investment return and principal value of an investment in the Fund will fluctuate, so that shares, when redeemed, may be worth more or less than their original cost. Performance shown in this report represents past performance and does not guarantee future results. Current performance may be lower or higher than the performance information shown. You may obtain performance
| 8 | AB INCOME FUND | abfunds.com | |
DISCLOSURES AND RISKS (continued)
information current to the most recent month-end by visiting www.abfunds.com.
All fees and expenses related to the operation of the Fund have been deducted. NAV returns do not reflect sales charges; if sales charges were reflected, the Fund’s quoted performance would be lower. SEC returns reflect the applicable sales charges for each share class: a 4.25% maximum front-end sales charge for Class A shares and a 1% 1-year contingent deferred sales charge for Class C shares. Returns for the different share classes will vary due to different expenses associated with each class. Performance assumes reinvestment of distributions and does not account for taxes.
The Fund commenced operations on April 22, 2016. The Fund acquired the assets and liabilities of the AllianceBernstein Income Fund, Inc., a closed-end fund (the “Predecessor Fund”), effective at the close of business on April 21, 2016 (the “Reorganization”). The Fund has the same investment objective that the Predecessor Fund had and similar investment strategies and policies. In addition, the Fund has higher expenses (including transfer agency and shareholder servicing fees), and a different advisory fee arrangement than the Predecessor Fund had.
Performance information prior to April 22, 2016 shown in this report reflects the historical performance of the Predecessor Fund based on its NAV. Such performance information may not be representative of performance the Fund would have achieved as an open-end fund under its current investment strategies and policies and expense levels.
| abfunds.com | AB INCOME FUND | 9 | |
HISTORICAL PERFORMANCE
AVERAGE ANNUAL RETURNS AS OF APRIL 30, 2020 (unaudited)
| NAV Returns | SEC Returns (reflects applicable sales charges) | SEC Yields1 | ||||||||||
| CLASS A SHARES | 3.26% | |||||||||||
| 1 Year | 1.48% | -2.80% | ||||||||||
| Since Inception2 | 3.15% | 2.06% | ||||||||||
| CLASS C SHARES | 2.67% | |||||||||||
| 1 Year | 0.72% | -0.26% | ||||||||||
| Since Inception2 | 2.40% | 2.40% | ||||||||||
| ADVISOR CLASS SHARES3 | 3.66% | |||||||||||
| 1 Year | 1.73% | 1.73% | ||||||||||
| 5 Years | 2.95% | 2.95% | ||||||||||
| 10 Years | 5.03% | 5.03% | ||||||||||
| CLASS Z SHARES3 | 3.77% | |||||||||||
| Since Inception2 | -3.53% | -3.53% | ||||||||||
The Fund’s current prospectus fee table shows the Fund’s total annual operating expense ratios as 0.83%, 1.57%, 0.58% and 0.50% for Class A, Class C, Advisor Class and Class Z shares, respectively, gross of any fee waivers or expense reimbursements. Contractual fee waivers and/or expense reimbursements limit the Fund’s annual operating expense ratios exclusive of acquired fund fees and expenses other than the advisory fees of any AB mutual funds in which the Fund may invest, interest expense, taxes, extraordinary expenses and brokerage commissions and other transaction costs to 0.77%, 1.52%, 0.52% and 0.52% for Class A, Class C, Advisor Class and Class Z shares, respectively. These waivers/reimbursements may not be terminated before January 31, 2021. Any fees waived and expense borne by the Adviser through April 22, 2018 under the expense limitations in effect prior to that date may be reimbursed by the Fund until the end of the third fiscal year after the fiscal period in which the fee was waived or the expense was borne, provided that no reimbursement payment will be made that would cause the Fund’s total annual operating expenses to exceed the expense limitations. Absent reimbursements or waivers, performance would have been lower. The Financial Highlights section of this report sets forth expense ratio data for the current reporting period; the expense ratios shown above may differ from the expense ratios in the Financial Highlights section since they are based on different time periods.
| 1 | SEC yields are calculated based on SEC guidelines for the 30-day period ended April 30, 2020. |
| 2 | Inception dates: 4/21/2016 for all share classes except Class Z; 11/20/2019 for Class Z shares. |
| 3 | Performance returns of Advisor Class shares for the periods prior to April 21, 2016 are based on the NAV per share of the Predecessor Fund. This share class is offered at NAV to eligible investors and the SEC returns are the same as the NAV returns. Please note that this share class is for investors purchasing shares through accounts established under certain fee-based programs sponsored and maintained by certain broker-dealers and financial intermediaries, institutional pension plans and/or investment advisory clients of, and certain other persons associated with, the Adviser and its affiliates or the Fund, or through other limited or special arrangements approved by the Adviser, such as purchases by shareholders of the Fund’s Predecessor Fund. |
| 10 | AB INCOME FUND | abfunds.com | |
HISTORICAL PERFORMANCE (continued)
SEC AVERAGE ANNUAL RETURNS
AS OF THE MOST RECENT CALENDAR QUARTER-END
MARCH 31, 2020 (unaudited)
| SEC Returns (reflects applicable sales charges) | ||||
| CLASS A SHARES | ||||
| 1 Year | -4.13% | |||
| Since Inception1 | 1.61% | |||
| CLASS C SHARES | ||||
| 1 Year | -1.62% | |||
| Since Inception1 | 1.98% | |||
| ADVISOR CLASS SHARES2 | ||||
| 1 Year | 0.34% | |||
| 5 Years | 2.57% | |||
| 10 Years | 5.01% | |||
| CLASS Z SHARES2 | ||||
| Since Inception1 | -5.37% | |||
| 1 | Inception dates: 4/21/2016 for all share classes except Class Z; 11/20/2019 for Class Z shares. |
| 2 | Performance returns of Advisor Class shares for the periods prior to April 21, 2016 are based on the NAV per share of the Predecessor Fund. Please note that this share class is for investors purchasing shares through accounts established under certain fee-based programs sponsored and maintained by certain broker-dealers and financial intermediaries, institutional pension plans and/or investment advisory clients of, and certain other persons associated with, the Adviser and its affiliates or the Fund, or through other limited or special arrangements approved by the Adviser, such as purchases by shareholders of the Fund’s Predecessor Fund. |
| abfunds.com | AB INCOME FUND | 11 | |
EXPENSE EXAMPLE
(unaudited)
As a shareholder of the Fund, you incur two types of costs: (1) transaction costs, including sales charges (loads) on purchase payments, contingent deferred sales charges on redemptions and (2) ongoing costs, including management fees; distribution (12b-1) fees; and other Fund expenses. This example is intended to help you understand your ongoing costs (in dollars) of investing in the Fund and to compare these costs with the ongoing costs of investing in other mutual funds.
The Example is based on an investment of $1,000 invested at the beginning of the period and held for the entire period as indicated below.
Actual Expenses
The first line of the table below provides information about actual account values and actual expenses. You may use the information in this line, together with the amount you invested, to estimate the expenses that you paid over the period. Simply divide your account value by $1,000 (for example, an $8,600 account value divided by $1,000 = 8.6), then multiply the result by the number in the first line under the heading entitled “Expenses Paid During Period” to estimate the expenses you paid on your account during this period.
Hypothetical Example for Comparison Purposes
The second line of the table below provides information about hypothetical account values and hypothetical expenses based on the Fund’s actual expense ratio and an assumed annual rate of return of 5% before expenses, which is not the Fund’s actual return. The hypothetical account values and expenses may not be used to estimate the actual ending account balance or expenses you paid for the period. You may use this information to compare the ongoing costs of investing in the Fund and other funds by comparing this 5% hypothetical example with the 5% hypothetical examples that appear in the shareholder reports of other funds.
| Beginning Account Value November 1, 2019 | Ending Account Value April 30, 2020 | Expenses Paid During Period* | Annualized Expense Ratio* | |||||||||||||
Class A | ||||||||||||||||
Actual | $ | 1,000 | $ | 962.80 | $ | 3.76 | 0.77 | % | ||||||||
Hypothetical** | $ | 1,000 | $ | 1,021.03 | $ | 3.87 | 0.77 | % | ||||||||
Class C | ||||||||||||||||
Actual | $ | 1,000 | $ | 959.30 | $ | 7.40 | 1.52 | % | ||||||||
Hypothetical** | $ | 1,000 | $ | 1,017.30 | $ | 7.62 | 1.52 | % | ||||||||
Advisor Class | ||||||||||||||||
Actual | $ | 1,000 | $ | 964.10 | $ | 2.54 | 0.52 | % | ||||||||
Hypothetical** | $ | 1,000 | $ | 1,022.28 | $ | 2.61 | 0.52 | % | ||||||||
Class Z | ||||||||||||||||
Actual | $ | 1,000 | $ | 964.70 | $ | 2.19 | *** | 0.50 | %*** | |||||||
Hypothetical** | $ | 1,000 | $ | 1,020.04 | $ | 2.25 | *** | 0.50 | %*** | |||||||
| * | Expenses are equal to the classes’ annualized expense ratios, multiplied by the average account value over the period, multiplied by 182/366 (to reflect the one-half year period). |
| ** | Assumes 5% annual return before expenses. |
| *** | Expenses paid are based on the period from November 20, 2019 (commencement of distribution) and are equal to the class’s annualized expense ratio, multiplied by the average account value over the period, multiplied by 163/366 (to reflect the since inception period). |
| 12 | AB INCOME FUND | abfunds.com | |
PORTFOLIO SUMMARY
April 30, 2020 (unaudited)
PORTFOLIO STATISTICS
Net Assets ($mil): $4,207.0
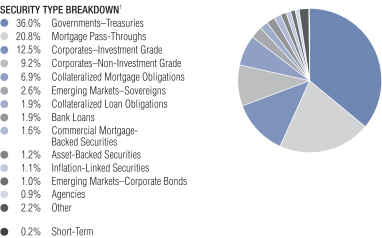
| 1 | All data are as of April 30, 2020. The Fund’s security type breakdown is expressed as a percentage of total investments and may vary over time. The Fund also enters into derivative transactions, which may be used for hedging or investment purposes (see “Portfolio of Investments” section of the report for additional details). “Other” security type weightings represent 0.7% or less in the following types: Common Stocks, Emerging Markets–Treasuries, Governments–Sovereign Bonds, Local Governments–Provincial Bonds, Local Governments–US Municipal Bonds, Preferred Stocks, Quasi-Sovereigns, Warrants and Whole Loan Trusts. |
| abfunds.com | AB INCOME FUND | 13 | |
PORTFOLIO SUMMARY (continued)
April 30, 2020 (unaudited)
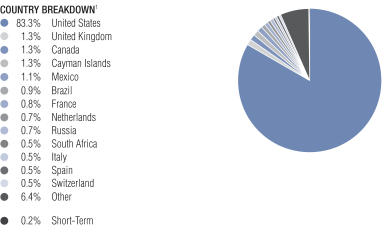
| 1 | All data are as of April 30, 2020. The Fund’s country breakdown is expressed as a percentage of total investments and may vary over time. The Fund also enters into derivative transactions, which may be used for hedging or investment purposes (see “Portfolio of Investments” section of the report for additional details). “Other” country weightings represent 0.4% or less in the following: Angola, Argentina, Australia, Bahamas, Bahrain, Chile, China, Colombia, Costa Rica, Denmark, Dominican Republic, Ecuador, Egypt, El Salvador, Finland, Germany, Ghana, Guatemala, Honduras, Hong Kong, India, Indonesia, Ireland, Israel, Ivory Coast, Jamaica, Kazakhstan, Kenya, Lebanon, Luxembourg, Malaysia, Mauritius, Nigeria, Norway, Oman, Pakistan, Panama, Peru, Qatar, Saudi Arabia, Senegal, Sri Lanka, Sweden, Turkey, Ukraine, United Arab Emirates and Zambia. |
| 14 | AB INCOME FUND | abfunds.com | |
PORTFOLIO OF INVESTMENTS
April 30, 2020 (unaudited)
| Principal Amount (000) | U.S. $ Value | |||||||||||
|
| |||||||||||
GOVERNMENTS – | ||||||||||||
Indonesia – 0.4% | ||||||||||||
Indonesia Treasury Bond | IDR | 23,106,000 | $ | 15,248,076 | ||||||||
|
| |||||||||||
Mexico – 0.7% | ||||||||||||
Mexican Bonos | MXN | 645,000 | 30,233,121 | |||||||||
|
| |||||||||||
Russia – 0.9% | ||||||||||||
Russian Federal Bond – OFZ | RUB | 670,156 | 9,269,359 | |||||||||
Series 6227 | 1,925,000 | 27,673,520 | ||||||||||
|
| |||||||||||
| 36,942,879 | ||||||||||||
|
| |||||||||||
United States – 45.2% | ||||||||||||
U.S. Treasury Bonds | U.S.$ | 17,631 | 27,248,160 | |||||||||
5.50%, 08/15/2028(a)(b) | 161,400 | 225,707,813 | ||||||||||
6.00%, 02/15/2026 | 30,903 | 40,704,650 | ||||||||||
6.125%, 11/15/2027(c) | 469,196 | 663,473,034 | ||||||||||
6.125%, 08/15/2029 | 47,418 | 71,171,454 | ||||||||||
6.25%, 05/15/2030 | 1,061 | 1,642,449 | ||||||||||
6.375%, 08/15/2027 | 45,300 | 64,305,333 | ||||||||||
6.50%, 11/15/2026 | 39,144 | 54,275,603 | ||||||||||
6.625%, 02/15/2027 | 61,822 | 87,100,980 | ||||||||||
6.875%, 08/15/2025 | 18,100 | 24,254,000 | ||||||||||
7.50%, 11/15/2024 | 20,000 | 26,437,500 | ||||||||||
U.S. Treasury Notes | 88,818 | 94,397,093 | ||||||||||
1.625%, 08/15/2022(a) | 100,287 | 103,515,194 | ||||||||||
1.625%, 10/31/2023-08/15/2029 | 45,600 | 48,389,495 | ||||||||||
1.75%, 11/15/2029 | 78,385 | 86,590,930 | ||||||||||
2.125%, 07/31/2024(a) | 125,561 | 135,056,873 | ||||||||||
2.25%, 11/15/2025(a)(d) | 16,500 | 18,144,844 | ||||||||||
2.625%, 02/15/2029 | 9,944 | 11,668,663 | ||||||||||
2.875%, 09/30/2023 | 65,000 | 70,738,281 | ||||||||||
3.125%, 11/15/2028 | 39,000 | 47,226,563 | ||||||||||
|
| |||||||||||
| 1,902,048,912 | ||||||||||||
|
| |||||||||||
Total Governments – Treasuries | 1,984,472,988 | |||||||||||
|
| |||||||||||
| abfunds.com | AB INCOME FUND | 15 | |
PORTFOLIO OF INVESTMENTS (continued)
| Principal Amount (000) | U.S. $ Value | |||||||||||
|
| |||||||||||
MORTGAGE PASS-THROUGHS – 27.3% |
| |||||||||||
Agency Fixed Rate 30-Year – 27.3% |
| |||||||||||
FHLMC Uniform Mortgage-Backed Security | U.S.$ | 7,121 | $ | 7,947,080 | ||||||||
FNMA Uniform Mortgage-Backed Security | 6 | 6,085 | ||||||||||
Series 1999 | 11 | 12,332 | ||||||||||
Series 2020 | 13,272 | 14,657,823 | ||||||||||
Government National Mortgage Association | 77,688 | 82,686,205 | ||||||||||
Uniform Mortgage-Backed Security | 92,255 | 98,251,604 | ||||||||||
4.50%, 05/01/2050, TBA | 271,125 | 292,285,840 | ||||||||||
Series 2019 | 315,523 | 333,111,472 | ||||||||||
3.50%, 05/01/2049, TBA | 13,429 | 14,188,350 | ||||||||||
5.00%, 05/01/2050, TBA | 282,809 | 307,378,376 | ||||||||||
|
| |||||||||||
Total Mortgage Pass-Throughs | 1,150,525,167 | |||||||||||
|
| |||||||||||
CORPORATES – INVESTMENT | ||||||||||||
Industrial – 8.1% | ||||||||||||
Basic – 1.0% | ||||||||||||
Alpek SAB de CV | 407 | 352,055 | ||||||||||
Anglo American Capital PLC | 2,450 | 2,578,527 | ||||||||||
5.375%, 04/01/2025(e) | 3,216 | 3,449,932 | ||||||||||
ArcelorMittal SA | 2,450 | 2,359,644 | ||||||||||
7.00%, 10/15/2039 | 1,180 | 1,221,264 | ||||||||||
Braskem Netherlands Finance BV | 8,070 | 6,584,016 | ||||||||||
Glencore Funding LLC | 7,218 | 7,402,781 | ||||||||||
Gold Fields Orogen Holdings BVI Ltd. | 2,230 | 2,225,122 | ||||||||||
5.125%, 05/15/2024(e) | 1,445 | 1,482,931 | ||||||||||
| 16 | AB INCOME FUND | abfunds.com | |
PORTFOLIO OF INVESTMENTS (continued)
| Principal Amount (000) | U.S. $ Value | |||||||||||
|
| |||||||||||
GTL Trade Finance, Inc. | U.S.$ | 274 | $ | 300,030 | ||||||||
GTL Trade Finance, Inc./Gerdau Holdings, Inc. | 1,243 | 1,257,916 | ||||||||||
GUSAP III LP | 1,491 | 1,356,810 | ||||||||||
Industrias Penoles SAB de CV | 970 | 919,681 | ||||||||||
Minsur SA | 285 | 296,774 | ||||||||||
Nexa Resources SA | 10,030 | 9,033,269 | ||||||||||
Suzano Austria GmbH | 1,532 | 1,553,065 | ||||||||||
|
| |||||||||||
| 42,373,817 | ||||||||||||
|
| |||||||||||
Capital Goods – 0.1% | ||||||||||||
General Electric Co. | 815 | 829,751 | ||||||||||
3.625%, 05/01/2030 | 1,324 | 1,330,501 | ||||||||||
Series D | 1,203 | 985,221 | ||||||||||
Westinghouse Air Brake Technologies Corp. | 1,451 | 1,462,913 | ||||||||||
|
| |||||||||||
| 4,608,386 | ||||||||||||
|
| |||||||||||
Communications - Media – 0.8% | ||||||||||||
Charter Communications Operating LLC/Charter Communications Operating Capital | 487 | 539,460 | ||||||||||
4.908%, 07/23/2025 | 2,553 | 2,885,477 | ||||||||||
Interpublic Group of Cos., Inc. (The) | 4,199 | 4,348,779 | ||||||||||
Omnicom Group, Inc. | 1,318 | 1,400,019 | ||||||||||
Prosus NV | 5,224 | 5,222,368 | ||||||||||
5.50%, 07/21/2025(e) | 683 | 747,031 | ||||||||||
ViacomCBS, Inc. | 3,105 | 3,157,133 | ||||||||||
4.00%, 01/15/2026 | 3,500 | 3,626,560 | ||||||||||
4.75%, 05/15/2025 | 5,642 | 6,036,714 | ||||||||||
Weibo Corp. | 4,574 | 4,639,751 | ||||||||||
|
| |||||||||||
| 32,603,292 | ||||||||||||
|
| |||||||||||
| abfunds.com | AB INCOME FUND | 17 | |
PORTFOLIO OF INVESTMENTS (continued)
| Principal Amount (000) | U.S. $ Value | |||||||||||
|
| |||||||||||
Communications - | ||||||||||||
British Telecommunications PLC | U.S.$ | 3,600 | $ | 5,506,236 | ||||||||
Sprint Spectrum Co. LLC/Sprint Spectrum Co. II LLC/Sprint Spectrum Co. III LLC | 1,990 | 2,108,922 | ||||||||||
5.152%, 03/20/2028(e) | 1,990 | 2,212,283 | ||||||||||
Vodafone Group PLC | 1,100 | 1,186,691 | ||||||||||
|
| |||||||||||
| 11,014,132 | ||||||||||||
|
| |||||||||||
Consumer Cyclical - | ||||||||||||
BMW US Capital LLC | 10,528 | 11,167,365 | ||||||||||
General Motors Financial Co., Inc. | EUR | 1,571 | 1,561,783 | |||||||||
3.50%, 11/07/2024 | U.S.$ | 951 | 875,538 | |||||||||
3.70%, 05/09/2023 | 336 | 322,133 | ||||||||||
3.95%, 04/13/2024 | 1,800 | 1,706,400 | ||||||||||
4.15%, 06/19/2023 | 1,073 | 1,040,842 | ||||||||||
5.10%, 01/17/2024 | 5,068 | 4,996,643 | ||||||||||
5.25%, 03/01/2026 | 146 | 140,522 | ||||||||||
Harley-Davidson Financial Services, Inc. | 130 | 125,103 | ||||||||||
Hyundai Capital America 5.875%, 04/07/2025(e) | 14,357 | 15,288,052 | ||||||||||
Lear Corp. | 1,064 | 914,678 | ||||||||||
3.80%, 09/15/2027 | 315 | 292,159 | ||||||||||
|
| |||||||||||
| 38,431,218 | ||||||||||||
|
| |||||||||||
Consumer Cyclical - | ||||||||||||
Carnival Corp. | 12,710 | 13,276,866 | ||||||||||
|
| |||||||||||
Consumer Cyclical - Other – 0.0% | ||||||||||||
Lennar Corp. | 75 | 77,340 | ||||||||||
Marriott International, Inc./MD | 1,526 | 1,595,372 | ||||||||||
|
| |||||||||||
| 1,672,712 | ||||||||||||
|
| |||||||||||
Consumer Cyclical - | ||||||||||||
McDonald’s Corp. | 4,263 | 4,649,185 | ||||||||||
|
| |||||||||||
| 18 | AB INCOME FUND | abfunds.com | |
PORTFOLIO OF INVESTMENTS (continued)
| Principal Amount (000) | U.S. $ Value | |||||||||||
|
| |||||||||||
Consumer Cyclical - Retailers – 0.4% | ||||||||||||
Nordstrom, Inc. | U.S.$ | 381 | $ | 407,038 | ||||||||
Ross Stores, Inc. | 6,890 | 7,524,845 | ||||||||||
VF Corp. | 4,879 | 4,960,479 | ||||||||||
2.80%, 04/23/2027 | 2,807 | 2,879,308 | ||||||||||
|
| |||||||||||
| 15,771,670 | ||||||||||||
|
| |||||||||||
Consumer Non-Cyclical – 0.8% | ||||||||||||
Altria Group, Inc. | 1,145 | 1,280,225 | ||||||||||
BAT Capital Corp. | 5,837 | 6,007,616 | ||||||||||
4.70%, 04/02/2027 | 1,583 | 1,745,400 | ||||||||||
Cigna Corp. | 6,987 | 7,274,515 | ||||||||||
CVS Health Corp. | 2,714 | 2,967,135 | ||||||||||
HCA, Inc. | 548 | 612,165 | ||||||||||
Kraft Heinz Foods Co. | 4,422 | 4,511,678 | ||||||||||
3.95%, 07/15/2025 | 4,520 | 4,751,017 | ||||||||||
Sysco Corp. | 1,445 | 1,620,336 | ||||||||||
5.95%, 04/01/2030 | 863 | 1,017,227 | ||||||||||
Zimmer Biomet Holdings, Inc. | 3,820 | 3,833,064 | ||||||||||
|
| |||||||||||
| 35,620,378 | ||||||||||||
|
| |||||||||||
Energy – 1.4% | �� | |||||||||||
Boardwalk Pipelines LP | 1,798 | 1,638,805 | ||||||||||
BP Capital Markets America, Inc. | 8,060 | 8,463,000 | ||||||||||
Cenovus Energy, Inc. | 2,500 | 2,083,350 | ||||||||||
Ecopetrol SA | 281 | 286,480 | ||||||||||
Empresa Electrica Cochrane SpA | 1,038 | 1,002,319 | ||||||||||
Enable Midstream Partners LP | 5,350 | 4,148,765 | ||||||||||
Energy Transfer Operating LP | 2,295 | 2,271,522 | ||||||||||
5.50%, 06/01/2027 | 7,425 | 7,473,931 | ||||||||||
| abfunds.com | AB INCOME FUND | 19 | |
PORTFOLIO OF INVESTMENTS (continued)
| Principal Amount (000) | U.S. $ Value | |||||||||||
|
| |||||||||||
Eni SpA | U.S.$ | 1,969 | $ | 2,011,255 | ||||||||
EOG Resources, Inc. | 2,356 | 2,623,170 | ||||||||||
Hess Corp. | 8,898 | 8,270,691 | ||||||||||
Marathon Petroleum Corp. | 6,758 | 6,770,164 | ||||||||||
4.70%, 05/01/2025 | 5,477 | 5,515,722 | ||||||||||
MPLX LP | 591 | 590,131 | ||||||||||
ONEOK, Inc. | 3,952 | 3,501,591 | ||||||||||
Plains All American Pipeline LP/PAA Finance Corp. | 1,152 | 1,060,865 | ||||||||||
4.65%, 10/15/2025 | 2,194 | 2,073,988 | ||||||||||
Sunoco Logistics Partners Operations LP | 179 | 167,711 | ||||||||||
|
| |||||||||||
| 59,953,460 | ||||||||||||
|
| |||||||||||
Services – 0.3% | ||||||||||||
Booking Holdings, Inc. | 3,523 | 3,735,120 | ||||||||||
Expedia Group, Inc. | 3,612 | 3,691,464 | ||||||||||
7.00%, 05/01/2025(e) | 5,188 | 5,300,268 | ||||||||||
|
| |||||||||||
| 12,726,852 | ||||||||||||
|
| |||||||||||
Technology – 1.1% | ||||||||||||
Analog Devices, Inc. | 1,322 | 1,381,279 | ||||||||||
Autodesk, Inc. | 1,517 | 1,664,604 | ||||||||||
Baidu, Inc. | 797 | 814,300 | ||||||||||
3.425%, 04/07/2030 | 225 | 235,724 | ||||||||||
Broadcom, Inc. | 2,560 | 2,697,165 | ||||||||||
4.25%, 04/15/2026(e) | 6,425 | 6,902,378 | ||||||||||
4.70%, 04/15/2025(e) | 3,524 | 3,884,082 | ||||||||||
Dell International LLC/EMC Corp. | 4,940 | 5,127,522 | ||||||||||
5.85%, 07/15/2025(e) | 1,171 | 1,274,809 | ||||||||||
KLA Corp. | 2,739 | 3,047,767 | ||||||||||
NXP BV/NXP Funding LLC | 2,460 | 2,543,591 | ||||||||||
4.625%, 06/15/2022-06/01/2023(e) | 3,520 | 3,678,805 | ||||||||||
| 20 | AB INCOME FUND | abfunds.com | |
PORTFOLIO OF INVESTMENTS (continued)
| Principal Amount (000) | U.S. $ Value | |||||||||||
|
| |||||||||||
4.875%, 03/01/2024(e) | U.S.$ | 2,937 | $ | 3,184,413 | ||||||||
5.35%, 03/01/2026(e) | 3,499 | 3,938,719 | ||||||||||
NXP BV/NXP Funding LLC/NXP USA, Inc. | 502 | 507,472 | ||||||||||
3.875%, 06/18/2026(e) | 1,227 | 1,293,761 | ||||||||||
VMware, Inc. | 5,333 | 5,638,474 | ||||||||||
|
| |||||||||||
| 47,814,865 | ||||||||||||
|
| |||||||||||
Transportation - Airlines – 0.4% | ||||||||||||
Delta Air Lines, Inc. | 6,060 | 6,221,135 | ||||||||||
Southwest Airlines Co. | 3,994 | 3,965,323 | ||||||||||
5.25%, 05/04/2025 | 4,552 | 4,532,882 | ||||||||||
|
| |||||||||||
| 14,719,340 | ||||||||||||
|
| |||||||||||
Transportation - Railroads – 0.1% | ||||||||||||
Lima Metro Line 2 Finance Ltd. | 387 | 393,772 | ||||||||||
5.875%, 07/05/2034(e) | 1,799 | 2,014,327 | ||||||||||
|
| |||||||||||
| 2,408,099 | ||||||||||||
|
| |||||||||||
Transportation - Services – 0.1% | ||||||||||||
Aviation Capital Group LLC | 1,560 | 1,337,357 | ||||||||||
DP World Crescent Ltd. | 296 | 265,568 | ||||||||||
DP World PLC | 696 | 665,767 | ||||||||||
FedEx Corp. | 2,385 | 2,557,030 | ||||||||||
|
| |||||||||||
| 4,825,722 | ||||||||||||
|
| |||||||||||
| 342,469,994 | ||||||||||||
|
| |||||||||||
Financial Institutions – 7.5% | ||||||||||||
Banking – 5.0% | ||||||||||||
AIB Group PLC | 7,005 | 7,115,399 | ||||||||||
4.75%, 10/12/2023(e) | 5,359 | 5,545,547 | ||||||||||
Ally Financial, Inc. | 3,501 | 3,731,786 | ||||||||||
8.00%, 11/01/2031 | 75 | 91,760 | ||||||||||
American Express Co. | 711 | 608,588 | ||||||||||
Australia & New Zealand Banking Group Ltd. | 200 | 213,136 | ||||||||||
4.50%, 03/19/2024(e) | 2,577 | 2,729,301 | ||||||||||
| abfunds.com | AB INCOME FUND | 21 | |
PORTFOLIO OF INVESTMENTS (continued)
| Principal Amount (000) | U.S. $ Value | |||||||||
|
| |||||||||
Banco Santander Mexico SA Institucion de Banca Multiple Grupo Financiero Santand | U.S.$ | 3,998 | $ | 4,102,948 | ||||||
Banco Santander SA | 7,400 | 7,597,950 | ||||||||
5.179%, 11/19/2025 | 1,000 | 1,084,770 | ||||||||
Bank of America Corp. | 1,436 | 1,446,626 | ||||||||
Series DD | 2,526 | 2,732,071 | ||||||||
Series X | 6,520 | 6,782,234 | ||||||||
Series Z | 2,072 | 2,236,102 | ||||||||
Bank of New York Mellon Corp. (The) | 844 | 809,084 | ||||||||
Barclays Bank PLC | 656 | 787,200 | ||||||||
Barclays PLC | GBP | 333 | 397,394 | |||||||
7.25%, 03/15/2023(e)(f) | 1,350 | 1,676,945 | ||||||||
7.875%, 03/15/2022(e)(f) | U.S.$ | 205 | 203,214 | |||||||
8.00%, 12/15/2020(f) | EUR | 614 | 663,284 | |||||||
BBVA Bancomer SA/Texas | U.S.$ | 5,343 | 4,688,483 | |||||||
BNP Paribas SA | 1,296 | 1,299,616 | ||||||||
7.625%, 03/30/2021(e)(f) | 4,218 | 4,301,390 | ||||||||
CIT Bank NA | 500 | 453,755 | ||||||||
Citigroup, Inc. | 10,886 | 11,398,622 | ||||||||
5.95%, 01/30/2023(f) | 2,055 | 2,042,136 | ||||||||
Series Q | 927 | 860,173 | ||||||||
Series T | 1,388 | 1,474,889 | ||||||||
Series U | 2,540 | 2,293,569 | ||||||||
Series V | 3,590 | 3,134,752 | ||||||||
Commonwealth Bank of Australia | 6,462 | 6,930,172 | ||||||||
Cooperatieve Rabobank UA | 2,250 | 2,403,473 | ||||||||
| 22 | AB INCOME FUND | abfunds.com | |
PORTFOLIO OF INVESTMENTS (continued)
| Principal Amount (000) | U.S. $ Value | |||||||||
|
| |||||||||
Credit Agricole SA | EUR | 3,780 | $ | 4,145,542 | ||||||
8.125%, 12/23/2025(e)(f) | U.S.$ | 2,233 | 2,481,533 | |||||||
Credit Agricole SA/London | 3,890 | 4,055,247 | ||||||||
Credit Suisse AG/New York NY | 2,443 | 2,570,280 | ||||||||
Danske Bank A/S | 478 | 494,998 | ||||||||
5.375%, 01/12/2024(e) | 4,714 | 5,073,772 | ||||||||
5.875%, 04/06/2022(e)(f) | EUR | 3,302 | 3,664,197 | |||||||
Discover Bank | U.S.$ | 500 | 497,235 | |||||||
Goldman Sachs Group, Inc. (The) | 2,092 | 2,230,721 | ||||||||
Series O | 760 | 775,474 | ||||||||
HSBC Holdings PLC | EUR | 5,371 | 5,620,947 | |||||||
6.00%, 09/29/2023(e) (f) | 2,515 | 2,852,524 | ||||||||
ING Groep NV | U.S.$ | 6,341 | 6,261,674 | |||||||
6.875%, 04/16/2022(e) (f) | 515 | 514,593 | ||||||||
Intesa Sanpaolo SpA | 3,000 | 3,076,200 | ||||||||
JPMorgan Chase & Co. | 2,837 | 2,657,134 | ||||||||
Series HH | 4,110 | 3,699,329 | ||||||||
Series S | 2,998 | 3,207,320 | ||||||||
Series V | 37 | 32,538 | ||||||||
Series Z | 119 | 112,873 | ||||||||
Lloyds Banking Group PLC | 2,629 | 2,675,717 | ||||||||
3.87%, 07/09/2025 | 9,435 | 9,924,771 | ||||||||
4.50%, 11/04/2024 | 4,360 | 4,633,895 | ||||||||
Morgan Stanley Series J | 847 | 779,096 | ||||||||
Nationwide Building Society | 1,150 | 1,179,670 | ||||||||
4.363%, 08/01/2024(e) | 1,505 | 1,593,253 | ||||||||
Nordea Bank Abp | 8,725 | 8,797,766 | ||||||||
| abfunds.com | AB INCOME FUND | 23 | |
PORTFOLIO OF INVESTMENTS (continued)
| Principal Amount (000) | U.S. $ Value | |||||||||||
|
| |||||||||||
Royal Bank of Scotland Group PLC | U.S.$ | 3,800 | $ | 3,893,442 | ||||||||
Santander Holdings USA, Inc. | 341 | 328,403 | ||||||||||
4.40%, 07/13/2027 | 463 | 469,338 | ||||||||||
Santander UK PLC | 502 | 527,923 | ||||||||||
Societe Generale SA | 8,825 | 9,328,819 | ||||||||||
Standard Chartered PLC | 7,800 | 6,074,562 | ||||||||||
4.247%, 01/20/2023(e) | 2,645 | 2,719,404 | ||||||||||
7.50%, 04/02/2022(e)(f) | 1,278 | 1,282,499 | ||||||||||
7.75%, 04/02/2023(e)(f) | 265 | 268,376 | ||||||||||
Swedbank AB | 200 | 195,810 | ||||||||||
Series NC5 | 2,000 | 1,923,380 | ||||||||||
UBS Group AG | 3,569 | 3,656,906 | ||||||||||
UniCredit SpA | EUR | 2,970 | 3,270,751 | |||||||||
|
| |||||||||||
| 209,384,281 | ||||||||||||
|
| |||||||||||
Brokerage – 0.1% | ||||||||||||
Charles Schwab Corp. (The) | U.S.$ | 3,889 | 4,010,454 | |||||||||
|
| |||||||||||
Finance – 0.7% | ||||||||||||
Air Lease Corp. | 3,166 | 2,962,711 | ||||||||||
GE Capital International Funding Co. Unlimited Co. | 7,000 | 7,211,050 | ||||||||||
Huarong Finance II Co., Ltd. | 2,067 | 2,174,872 | ||||||||||
5.50%, 01/16/2025(e) | 4,215 | 4,493,412 | ||||||||||
Synchrony Financial | 6,904 | 6,537,605 | ||||||||||
4.25%, 08/15/2024 | 4,715 | 4,589,675 | ||||||||||
4.50%, 07/23/2025 | 576 | 563,662 | ||||||||||
|
| |||||||||||
| 28,532,987 | ||||||||||||
|
| |||||||||||
Insurance – 1.2% | ||||||||||||
ACE Capital Trust II | 750 | 1,053,225 | ||||||||||
| 24 | AB INCOME FUND | abfunds.com | |
PORTFOLIO OF INVESTMENTS (continued)
| Principal Amount (000) | U.S. $ Value | |||||||||||
|
| |||||||||||
AIG Life Holdings, Inc. | U.S.$ | 509 | $ | 618,084 | ||||||||
Assicurazioni Generali SpA | EUR | 6,630 | 8,138,212 | |||||||||
Caisse Nationale de Reassurance Mutuelle Agricole Groupama | 3,100 | 4,065,791 | ||||||||||
CNP Assurances | U.S.$ | 7,200 | 7,928,542 | |||||||||
Fairfax Financial Holdings Ltd. | 5,000 | 5,959,550 | ||||||||||
Hartford Financial Services Group, Inc. (The) | 3,275 | 2,615,677 | ||||||||||
MetLife Capital Trust IV | 4,117 | 5,064,939 | ||||||||||
Prudential Financial, Inc. | 4,029 | 4,030,652 | ||||||||||
5.625%, 06/15/2043 | 2,868 | 2,959,948 | ||||||||||
Voya Financial, Inc. | 7,483 | 7,387,667 | ||||||||||
|
| |||||||||||
| 49,822,287 | ||||||||||||
|
| |||||||||||
REITS – 0.5% | ||||||||||||
GLP Capital LP/GLP Financing II, Inc. | 1,290 | 1,141,844 | ||||||||||
5.25%, 06/01/2025 | 886 | 870,442 | ||||||||||
5.375%, 04/15/2026 | 283 | 281,930 | ||||||||||
5.75%, 06/01/2028 | 1,134 | 1,117,092 | ||||||||||
Kite Realty Group LP | 515 | 477,714 | ||||||||||
MPT Operating Partnership LP/MPT Finance Corp. | 1,047 | 1,040,634 | ||||||||||
5.00%, 10/15/2027 | 75 | 76,481 | ||||||||||
Omega Healthcare Investors, Inc. | 336 | 330,795 | ||||||||||
Regency Centers LP | 1,700 | 1,755,777 | ||||||||||
Sabra Health Care LP | 1,946 | 1,890,831 | ||||||||||
Service Properties Trust | 2,425 | 2,034,623 | ||||||||||
4.50%, 03/15/2025 | 1,695 | 1,380,815 | ||||||||||
4.75%, 10/01/2026 | 4,718 | 3,870,789 | ||||||||||
Spirit Realty LP | 2,453 | 2,167,814 | ||||||||||
| abfunds.com | AB INCOME FUND | 25 | |
PORTFOLIO OF INVESTMENTS (continued)
| Principal Amount (000) | U.S. $ Value | |||||||||||
|
| |||||||||||
3.40%, 01/15/2030 | U.S.$ | 1,800 | $ | 1,491,570 | ||||||||
4.45%, 09/15/2026 | 1,010 | 993,689 | ||||||||||
STORE Capital Corp. | 1,143 | 1,116,471 | ||||||||||
|
| |||||||||||
| 22,039,311 | ||||||||||||
|
| |||||||||||
| 313,789,320 | ||||||||||||
|
| |||||||||||
Utility – 0.4% | ||||||||||||
Electric – 0.4% | ||||||||||||
Colbun SA | 209 | 199,151 | ||||||||||
ComEd Financing III | 3,462 | 3,636,277 | ||||||||||
Duke Energy Corp. | 3,057 | 3,056,083 | ||||||||||
Empresas Publicas de Medellin ESP | 3,775 | 3,544,961 | ||||||||||
Enel Finance International NV | 5,060 | 5,547,126 | ||||||||||
LLPL Capital Pte Ltd. | 1,182 | 1,201,613 | ||||||||||
|
| |||||||||||
| 17,185,211 | ||||||||||||
|
| |||||||||||
Total Corporates – Investment Grade | 673,444,525 | |||||||||||
|
| |||||||||||
CORPORATES – NON-INVESTMENT GRADE – 12.4% | ||||||||||||
Industrial – 10.1% | ||||||||||||
Basic – 1.3% | ||||||||||||
Advanced Drainage Systems, Inc. | 489 | 483,381 | ||||||||||
Alcoa Nederland Holding BV | 510 | 494,618 | ||||||||||
Arconic Corp. | 1,765 | 1,778,590 | ||||||||||
6.125%, 02/15/2028(e) | 770 | 729,860 | ||||||||||
CF Industries, Inc. | 75 | 76,592 | ||||||||||
Cleveland-Cliffs, Inc. | 3,089 | 3,042,634 | ||||||||||
Constellium SE | EUR | 2,060 | 2,065,070 | |||||||||
Eldorado Gold Corp. | U.S.$ | 5,278 | 5,632,682 | |||||||||
ERP Iron Ore, LLC | 118 | 100,624 | ||||||||||
FMG Resources (August 2006) Pty Ltd. | 3,594 | 3,516,082 | ||||||||||
| 26 | AB INCOME FUND | abfunds.com | |
PORTFOLIO OF INVESTMENTS (continued)
| Principal Amount (000) | U.S. $ Value | |||||||||||
|
| |||||||||||
Freeport-McMoRan, Inc. | U.S.$ | 682 | $ | 664,725 | ||||||||
5.25%, 09/01/2029 | 682 | 673,959 | ||||||||||
5.45%, 03/15/2043 | 1,908 | 1,750,208 | ||||||||||
Graphic Packaging International LLC | 1,032 | 1,066,985 | ||||||||||
Hecla Mining Co. | 5,371 | 5,303,003 | ||||||||||
INEOS Group Holdings SA | EUR | 3,215 | 3,447,056 | |||||||||
Joseph T Ryerson & Son, Inc. | U.S.$ | 2,275 | 2,212,392 | |||||||||
Kaiser Aluminum Corp. | 1,211 | 1,232,495 | ||||||||||
Magnetation LLC/Mag Finance Corp. | 1,407 | – 0 | – | |||||||||
OCI NV | 2,672 | 2,642,020 | ||||||||||
Olin Corp. | 3,148 | 2,846,988 | ||||||||||
Peabody Energy Corp. | 2,380 | 1,811,823 | ||||||||||
Polyone Corp. | 1,790 | 1,811,981 | ||||||||||
Sealed Air Corp. | 2,180 | 2,378,838 | ||||||||||
SPCM SA | 913 | 927,864 | ||||||||||
Starfruit Finco BV/Starfruit US Holdco LLC 6.50%, 10/01/2026(e) | EUR | 2,515 | 2,623,468 | |||||||||
8.00%, 10/01/2026(e) | U.S.$ | 2,272 | 2,128,319 | |||||||||
Valvoline, Inc. | 1,485 | 1,444,727 | ||||||||||
|
| |||||||||||
| 52,886,984 | ||||||||||||
|
| |||||||||||
Capital Goods – 1.1% | ||||||||||||
ARD Finance SA | EUR | 1,076 | 1,067,234 | |||||||||
6.50% (6.50% Cash or 7.25% PIK), 06/30/2027(e) (m) | U.S.$ | 5,393 | 5,046,554 | |||||||||
Bombardier, Inc. | 2,000 | 1,500,420 | ||||||||||
7.50%, 12/01/2024-03/15/2025(e) | 2,675 | 1,758,058 | ||||||||||
7.875%, 04/15/2027(e) | 1,946 | 1,281,869 | ||||||||||
Clean Harbors, Inc. | 2,962 | 3,061,908 | ||||||||||
| abfunds.com | AB INCOME FUND | 27 | |
PORTFOLIO OF INVESTMENTS (continued)
| Principal Amount (000) | U.S. $ Value | |||||||||||
|
| |||||||||||
Cleaver-Brooks, Inc. | U.S.$ | 1,258 | $ | 1,036,227 | ||||||||
Colfax Corp. | 338 | 343,290 | ||||||||||
6.375%, 02/15/2026(e) | 361 | 373,122 | ||||||||||
Crown European Holdings SA | EUR | 1,075 | 1,188,970 | |||||||||
F-Brasile SpA/F–Brasile US LLC | U.S.$ | 2,778 | 1,894,790 | |||||||||
Gates Global LLC/Gates Corp. | 4,047 | 3,683,215 | ||||||||||
GFL Environmental, Inc. | 273 | 283,890 | ||||||||||
7.00%, 06/01/2026(e) | 910 | 957,902 | ||||||||||
8.50%, 05/01/2027(e) | 960 | 1,046,813 | ||||||||||
Griffon Corp. | 6,525 | 6,249,775 | ||||||||||
Harsco Corp. | 2,423 | 2,299,185 | ||||||||||
OI European Group BV | EUR | 3,140 | 3,309,351 | |||||||||
Signature Aviation US Holdings, Inc. | U.S.$ | 2,300 | 1,985,268 | |||||||||
Terex Corp. | 677 | 615,495 | ||||||||||
TransDigm, Inc. | 1,033 | 1,015,243 | ||||||||||
6.375%, 06/15/2026 | 847 | 729,479 | ||||||||||
6.50%, 07/15/2024 | 1,489 | 1,376,804 | ||||||||||
8.00%, 12/15/2025(e) | 920 | 957,260 | ||||||||||
Triumph Group, Inc. | 1,309 | 1,058,575 | ||||||||||
7.75%, 08/15/2025 | 1,305 | 846,306 | ||||||||||
Trivium Packaging Finance BV | EUR | 100 | 107,478 | |||||||||
8.50%, 08/15/2027(e) | U.S.$ | 2,328 | 2,436,089 | |||||||||
|
| |||||||||||
| 47,510,570 | ||||||||||||
|
| |||||||||||
Communications - Media – 1.2% | ||||||||||||
Altice Financing SA | 2,600 | 2,712,424 | ||||||||||
Banijay Entertainment SASU | EUR | 600 | 621,347 | |||||||||
5.375%, 03/01/2025(e) | U.S.$ | 1,955 | 1,818,482 | |||||||||
CCO Holdings LLC/CCO Holdings Capital Corp. | 75 | 78,200 | ||||||||||
| 28 | AB INCOME FUND | abfunds.com | |
PORTFOLIO OF INVESTMENTS (continued)
| Principal Amount (000) | U.S. $ Value | |||||||||||
|
| |||||||||||
Clear Channel Worldwide Holdings, Inc. | U.S.$ | 1,977 | $ | 1,859,487 | ||||||||
CSC Holdings LLC | 692 | 756,425 | ||||||||||
7.50%, 04/01/2028(e) | 1,631 | 1,794,997 | ||||||||||
Diamond Sports Group LLC/Diamond Sports Finance Co. | 2,925 | 2,223,731 | ||||||||||
6.625%, 08/15/2027(c)(e) | 2,667 | 1,463,010 | ||||||||||
DISH DBS Corp. | 3,045 | 2,999,325 | ||||||||||
iHeartCommunications, Inc. | 1,439 | 1,316,685 | ||||||||||
6.375%, 05/01/2026 | 81 | 77,091 | ||||||||||
8.375%, 05/01/2027 | 147 | 122,359 | ||||||||||
LCPR Senior Secured Financing DAC | 3,152 | 3,311,302 | ||||||||||
Meredith Corp. | 2,853 | 2,442,140 | ||||||||||
National CineMedia LLC | 2,267 | 1,632,376 | ||||||||||
Outfront Media Capital LLC/Outfront Media Capital Corp. | 1,021 | 941,791 | ||||||||||
Radiate Holdco LLC/Radiate Finance, Inc. | 3,664 | 3,647,805 | ||||||||||
6.875%, 02/15/2023(e) | 1,031 | 1,020,721 | ||||||||||
Scripps Escrow, Inc. | 1,008 | 858,322 | ||||||||||
Sinclair Television Group, Inc. | 3,151 | 2,615,078 | ||||||||||
Sirius XM Radio, Inc. | 75 | 79,142 | ||||||||||
TEGNA, Inc. | 3,630 | 3,235,419 | ||||||||||
Univision Communications, Inc. | 3,651 | 3,481,864 | ||||||||||
Virgin Media Receivables Financing Notes I DAC | GBP | 3,270 | 4,118,564 | |||||||||
Ziggo Bond Co. BV | U.S.$ | 693 | 687,297 | |||||||||
6.00%, 01/15/2027(e) | 3,000 | 3,055,710 | ||||||||||
|
| |||||||||||
| 48,971,094 | ||||||||||||
|
| |||||||||||
Communications - Telecommunications – 0.4% | ||||||||||||
Altice France SA/France | 562 | 587,661 | ||||||||||
| abfunds.com | AB INCOME FUND | 29 | |
PORTFOLIO OF INVESTMENTS (continued)
| Principal Amount (000) | U.S. $ Value | |||||||||||
|
| |||||||||||
C&W Senior Financing DAC | U.S.$ | 1,247 | $ | 1,236,226 | ||||||||
7.50%, 10/15/2026(e) | 893 | 910,815 | ||||||||||
Connect Finco SARL/Connect US Finco LLC | 2,301 | 2,203,875 | ||||||||||
DKT Finance ApS | EUR | 1,424 | 1,539,923 | |||||||||
Hughes Satellite Systems Corp. | U.S.$ | 810 | 863,962 | |||||||||
Intelsat Jackson Holdings SA | 4,941 | 2,688,645 | ||||||||||
Nexstar Broadcasting, Inc. | 1,729 | 1,652,423 | ||||||||||
Telecom Italia Capital SA | 75 | 87,145 | ||||||||||
Zayo Group Holdings, Inc. | 886 | 860,315 | ||||||||||
6.125%, 03/01/2028(e) | 2,825 | 2,661,941 | ||||||||||
|
| |||||||||||
| 15,292,931 | ||||||||||||
|
| |||||||||||
Consumer Cyclical - | ||||||||||||
Adient US LLC | 2,568 | 2,677,833 | ||||||||||
Allison Transmission, Inc. | 1,101 | 1,067,287 | ||||||||||
Dealer Tire LLC/DT Issuer LLC | 2,269 | 1,593,927 | ||||||||||
Exide International Holdings LP (Superpriority Lien) | 3,093 | 2,638,661 | ||||||||||
Exide Technologies | 2,770 | 831,031 | ||||||||||
(First Lien) | 933 | – 0 | – | |||||||||
Ford Motor Co. | 8,065 | 8,057,338 | ||||||||||
9.00%, 04/22/2025 | 2,242 | 2,182,677 | ||||||||||
Ford Motor Credit Co. LLC | 5,895 | 5,164,845 | ||||||||||
IHO Verwaltungs GmbH | EUR | 560 | 549,113 | |||||||||
3.875% (3.875% Cash or 4.625% PIK), 05/15/2027(e) (m) | 623 | 608,653 | ||||||||||
| 30 | AB INCOME FUND | abfunds.com | |
PORTFOLIO OF INVESTMENTS (continued)
| Principal Amount (000) | U.S. $ Value | |||||||||||
|
| |||||||||||
Navistar International Corp. | U.S.$ | 1,347 | $ | 1,413,340 | ||||||||
Panther BF Aggregator 2 LP/Panther Finance Co., Inc. | EUR | 360 | 365,107 | |||||||||
6.25%, 05/15/2026(e) | U.S.$ | 226 | 227,272 | |||||||||
8.50%, 05/15/2027(e) | 1,679 | 1,422,298 | ||||||||||
Tenneco, Inc. | 2,680 | 1,225,832 | ||||||||||
Titan International, Inc. | 873 | 404,051 | ||||||||||
Truck Hero, Inc. | 2,691 | 2,232,750 | ||||||||||
ZF North America Capital, Inc. | 2,660 | 2,476,593 | ||||||||||
|
| |||||||||||
| 35,138,608 | ||||||||||||
|
| |||||||||||
Consumer Cyclical - | ||||||||||||
AMC Entertainment Holdings, Inc. | 2,000 | 453,480 | ||||||||||
Cedar Fair LP | 996 | 855,524 | ||||||||||
Cedar Fair LP/Canada’s Wonderland Co./Magnum Management Corp./Millennium Op | 9,251 | 9,251,000 | ||||||||||
Mattel, Inc. | 3,091 | 3,028,809 | ||||||||||
6.75%, 12/31/2025(e) | 450 | 456,948 | ||||||||||
SeaWorld Parks & Entertainment, Inc. | 4,017 | 4,005,672 | ||||||||||
Six Flags Theme Parks, Inc. | 1,820 | 1,896,768 | ||||||||||
Vail Resorts, Inc. | 1,380 | 1,414,500 | ||||||||||
Viking Cruises Ltd. | 1,057 | 710,441 | ||||||||||
VOC Escrow Ltd. | 75 | 59,081 | ||||||||||
|
| |||||||||||
| 22,132,223 | ||||||||||||
|
| |||||||||||
Consumer Cyclical - Other – 0.8% | ||||||||||||
Adams Homes, Inc. | 2,232 | 2,053,574 | ||||||||||
Beazer Homes USA, Inc. | 663 | 513,036 | ||||||||||
| abfunds.com | AB INCOME FUND | 31 | |
PORTFOLIO OF INVESTMENTS (continued)
| Principal Amount (000) | U.S. $ Value | |||||||||
|
| |||||||||
Brookfield Residential Properties, Inc./Brookfield Residential US Corp. | U.S.$ | 937 | $ | 772,594 | ||||||
6.25%, 09/15/2027(e) | 3,475 | 3,197,000 | ||||||||
Five Point Operating Co. LP/Five Point Capital Corp. | 2,330 | 2,252,434 | ||||||||
Forestar Group, Inc. | 1,669 | 1,459,540 | ||||||||
8.00%, 04/15/2024(e) | 1,470 | 1,449,200 | ||||||||
Hilton Domestic Operating Co., Inc. | 75 | 71,486 | ||||||||
5.375%, 05/01/2025(e) | 314 | 313,743 | ||||||||
5.75%, 05/01/2028(e) | 339 | 341,322 | ||||||||
Installed Building Products, Inc. | 846 | 811,500 | ||||||||
International Game Technology PLC | 735 | 713,663 | ||||||||
K. Hovnanian Enterprises, Inc. | 3,302 | 2,137,715 | ||||||||
Marriott Ownership Resorts, Inc./ILG LLC | 2,111 | 2,014,738 | ||||||||
Mattamy Group Corp. | 2,454 | 2,301,607 | ||||||||
MGM Resorts International | 850 | 780,419 | ||||||||
Shea Homes LP/Shea Homes Funding Corp. | 1,969 | 1,699,779 | ||||||||
6.125%, 04/01/2025(e) | 1,821 | 1,726,162 | ||||||||
Stars Group Holdings BV/Stars Group US Co-Borrower LLC | 2,138 | 2,215,118 | ||||||||
Sugarhouse HSP Gaming Prop Mezz LP/Sugarhouse HSP Gaming Finance Corp. | 688 | 585,701 | ||||||||
Taylor Morrison Communities, Inc. | 2,845 | 2,616,034 | ||||||||
Twin River Worldwide Holdings, Inc. | 1,720 | 1,352,780 | ||||||||
Wyndham Hotels & Resorts, Inc. | 1,410 | 1,297,694 | ||||||||
Wynn Las Vegas LLC/Wynn Las Vegas Capital Corp. | 75 | 66,570 | ||||||||
| 32 | AB INCOME FUND | abfunds.com | |
PORTFOLIO OF INVESTMENTS (continued)
| Principal Amount (000) | U.S. $ Value | |||||||||||
|
| |||||||||||
Wynn Resorts Finance LLC/Wynn Resorts Capital Corp. | U.S.$ | 1,583 | $ | 1,487,197 | ||||||||
7.75%, 04/15/2025(e) | 793 | 811,675 | ||||||||||
|
| |||||||||||
| 35,042,281 | ||||||||||||
|
| |||||||||||
Consumer Cyclical - | ||||||||||||
1011778 BC ULC/New Red Finance, Inc. | 2,014 | 1,951,606 | ||||||||||
IRB Holding Corp. | 1,031 | 859,432 | ||||||||||
Yum! Brands, Inc. | 3,231 | 3,527,735 | ||||||||||
|
| |||||||||||
| 6,338,773 | ||||||||||||
|
| |||||||||||
Consumer Cyclical - Retailers – 0.5% | ||||||||||||
Asbury Automotive Group, Inc. | 796 | 667,653 | ||||||||||
4.75%, 03/01/2030(e) | 492 | 411,740 | ||||||||||
Burlington Coat Factory Warehouse Corp. | 616 | 626,595 | ||||||||||
FirstCash, Inc. | 271 | 267,379 | ||||||||||
L Brands, Inc. | 252 | 180,984 | ||||||||||
6.75%, 07/01/2036 | 704 | 513,920 | ||||||||||
6.875%, 11/01/2035 | 3,416 | 2,530,573 | ||||||||||
7.50%, 06/15/2029 | 236 | 174,048 | ||||||||||
PetSmart, Inc. | 5,621 | 5,381,096 | ||||||||||
Rite Aid Corp. | 3,444 | 3,390,893 | ||||||||||
Staples, Inc. | 4,173 | 3,263,745 | ||||||||||
10.75%, 04/15/2027(e) | 1,108 | 620,436 | ||||||||||
TPro Acquisition Corp. | 1,216 | 1,170,473 | ||||||||||
|
| |||||||||||
| 19,199,535 | ||||||||||||
|
| |||||||||||
Consumer Non-Cyclical – 1.0% | ||||||||||||
Air Medical Group Holdings, Inc. | 887 | 823,526 | ||||||||||
Albertsons Cos., Inc./Safeway, Inc./New Albertsons LP/Albertsons LLC | 2,299 | 2,319,944 | ||||||||||
4.875%, 02/15/2030(e) | 1,582 | 1,604,907 | ||||||||||
Avantor, Inc. | 930 | 1,009,720 | ||||||||||
| abfunds.com | AB INCOME FUND | 33 | |
PORTFOLIO OF INVESTMENTS (continued)
| Principal Amount (000) | U.S. $ Value | |||||||||||
|
| |||||||||||
Bausch Health Americas, Inc. | U.S.$ | 223 | $ | 245,722 | ||||||||
Bausch Health Cos., Inc. | EUR | 1,800 | 1,933,572 | |||||||||
5.50%, 11/01/2025(e) | U.S.$ | 75 | 77,918 | |||||||||
6.125%, 04/15/2025(e) | 446 | 451,562 | ||||||||||
7.25%, 05/30/2029(e) | 223 | 238,367 | ||||||||||
CHS/Community Health Systems, Inc. | 1,444 | 1,357,071 | ||||||||||
6.625%, 02/15/2025(e) | 1,620 | 1,499,861 | ||||||||||
8.125%, 06/30/2024(e) | 162 | 110,534 | ||||||||||
Endo Dac/Endo Finance LLC/Endo Finco, Inc. | 3,982 | 2,931,852 | ||||||||||
Envision Healthcare Corp. | 3,093 | 1,036,402 | ||||||||||
Grifols SA | EUR | 5,083 | 5,572,487 | |||||||||
Hadrian Merger Sub, Inc. | U.S.$ | 1,159 | 1,008,295 | |||||||||
IQVIA, Inc. | EUR | 1,060 | 1,171,404 | |||||||||
Mallinckrodt International Finance SA/Mallinckrodt CB LLC | U.S.$ | 548 | 140,266 | |||||||||
5.625%, 10/15/2023(e) | 107 | 30,611 | ||||||||||
MEDNAX, Inc. | 75 | 67,883 | ||||||||||
Post Holdings, Inc. | 3,622 | 3,554,884 | ||||||||||
5.50%, 12/15/2029(e) | 1,008 | 1,015,943 | ||||||||||
Radiology Partners, Inc. | 3,294 | 3,137,370 | ||||||||||
RegionalCare Hospital Partners Holdings, Inc./LifePoint Health, Inc. | 4,840 | 5,175,993 | ||||||||||
Spectrum Brands, Inc. | 1,334 | 1,329,958 | ||||||||||
Sunshine Mid BV | EUR | 2,077 | 2,215,536 | |||||||||
Tenet Healthcare Corp. | U.S.$ | 2,520 | 2,708,849 | |||||||||
8.125%, 04/01/2022 | 389 | 392,178 | ||||||||||
Vizient, Inc. | 561 | 588,921 | ||||||||||
|
| |||||||||||
| 43,751,536 | ||||||||||||
|
| |||||||||||
| 34 | AB INCOME FUND | abfunds.com | |
PORTFOLIO OF INVESTMENTS (continued)
| Principal Amount (000) | U.S. $ Value | |||||||||||
|
| |||||||||||
Energy – 1.1% | ||||||||||||
Antero Resources Corp. | U.S.$ | 1,908 | $ | 1,332,986 | ||||||||
Callon Petroleum, Co. | 1,252 | 257,549 | ||||||||||
Cheniere Energy Partners LP | 1,350 | 1,246,104 | ||||||||||
CITGO Petroleum Corp. | 1,577 | 1,501,509 | ||||||||||
Denbury Resources, Inc. | 871 | 157,947 | ||||||||||
Diamond Offshore Drilling, Inc. | 2,642 | 275,693 | ||||||||||
EnLink Midstream Partners LP | 318 | 199,780 | ||||||||||
EP Energy LLC/Everest Acquisition Finance, Inc. | 492 | 197 | ||||||||||
9.375%, 05/01/2024(e)(l)(p) | 1,384 | 18,795 | ||||||||||
EQT Corp. | 6,152 | 5,779,804 | ||||||||||
Genesis Energy LP/Genesis Energy Finance Corp. | 1,149 | 959,105 | ||||||||||
6.50%, 10/01/2025 | 179 | 151,251 | ||||||||||
7.75%, 02/01/2028 | 4,346 | 3,706,182 | ||||||||||
Gran Tierra Energy, Inc. | 1,998 | 447,752 | ||||||||||
Gulfport Energy Corp. | 280 | 139,241 | ||||||||||
6.375%, 05/15/2025-01/15/2026 | 2,469 | 1,152,731 | ||||||||||
Hess Midstream Operations LP | 2,739 | 2,546,640 | ||||||||||
HighPoint Operating Corp. | 343 | 101,545 | ||||||||||
Indigo Natural Resources LLC | 2,570 | 2,386,708 | ||||||||||
Nabors Industries Ltd. | 1,294 | 487,359 | ||||||||||
7.50%, 01/15/2028(e) | 1,372 | 547,936 | ||||||||||
NGL Energy Partners LP/NGL Energy Finance Corp. | 2,596 | 1,758,790 | ||||||||||
Noble Holding International Ltd. | 279 | 11,729 | ||||||||||
Occidental Petroleum Corp. | 4,990 | 3,742,700 | ||||||||||
| abfunds.com | AB INCOME FUND | 35 | |
PORTFOLIO OF INVESTMENTS (continued)
| Principal Amount (000) | U.S. $ Value | |||||||||||
|
| |||||||||||
3.20%, 08/15/2026 | U.S.$ | 771 | $ | 554,280 | ||||||||
Parkland Fuel Corp. | 2,841 | 2,754,008 | ||||||||||
PDC Energy, Inc. | 1,075 | 830,534 | ||||||||||
QEP Resources, Inc. | 581 | 194,635 | ||||||||||
5.625%, 03/01/2026 | 1,571 | 494,346 | ||||||||||
Range Resources Corp. | 961 | 862,676 | ||||||||||
SandRidge Energy, Inc. | 1,259 | – 0 | – | |||||||||
SM Energy Co. | 685 | 194,841 | ||||||||||
Sunoco LP/Sunoco Finance Corp. | 992 | 952,320 | ||||||||||
5.875%, 03/15/2028 | 1,164 | 1,108,198 | ||||||||||
6.00%, 04/15/2027 | 87 | 82,772 | ||||||||||
Targa Resources Partners LP/Targa Resources Partners Finance Corp. | 775 | 695,880 | ||||||||||
Transocean Phoenix 2 Ltd. | 520 | 464,688 | ||||||||||
Transocean, Inc. | 1,061 | 400,984 | ||||||||||
8.00%, 02/01/2027(e) | 2,513 | 999,772 | ||||||||||
Vantage Drilling International | 3,068 | – 0 | – | |||||||||
Vine Oil & Gas LP/Vine Oil & Gas Finance Corp. | 3,507 | 1,855,904 | ||||||||||
Western Midstream Operating LP | 207 | 183,926 | ||||||||||
4.05%, 02/01/2030 | 1,254 | 1,144,262 | ||||||||||
4.65%, 07/01/2026 | 3,058 | 2,725,473 | ||||||||||
4.75%, 08/15/2028 | 1,490 | 1,311,185 | ||||||||||
Whiting Petroleum Corp. | 732 | 74,825 | ||||||||||
6.625%, 01/15/2026(l)(p) | 87 | 8,730 | ||||||||||
|
| |||||||||||
| 46,804,272 | ||||||||||||
|
| |||||||||||
Other Industrial – 0.1% | ||||||||||||
American Builders & Contractors Supply Co., Inc. | 1,133 | 1,080,406 | ||||||||||
IAA, Inc. | 869 | 868,235 | ||||||||||
| 36 | AB INCOME FUND | abfunds.com | |
PORTFOLIO OF INVESTMENTS (continued)
| Principal Amount (000) | U.S. $ Value | |||||||||||
|
| |||||||||||
KAR Auction Services, Inc. | U.S.$ | 75 | $ | 64,256 | ||||||||
Laureate Education, Inc. | 992 | 1,013,249 | ||||||||||
Performance Food Group, Inc. | 909 | 863,050 | ||||||||||
|
| |||||||||||
| 3,889,196 | ||||||||||||
|
| |||||||||||
Services – 0.6% | ||||||||||||
Allied Universal Holdco LLC/Allied Universal Finance Corp. | 2,167 | 2,241,220 | ||||||||||
9.75%, 07/15/2027(e) | 1,513 | 1,553,261 | ||||||||||
APX Group, Inc. | 3,506 | 3,015,195 | ||||||||||
7.625%, 09/01/2023(c) | 2,000 | 1,591,820 | ||||||||||
7.875%, 12/01/2022 | 694 | 660,619 | ||||||||||
Aramark Services, Inc. | 2,767 | 2,877,486 | ||||||||||
eDreams ODIGEO SA | EUR | 1,327 | 983,979 | |||||||||
Garda World Security Corp. | U.S.$ | 3,358 | 3,354,306 | |||||||||
Monitronics International, Inc. | 1,835 | – 0 | – | |||||||||
Prime Security Services Borrower LLC/Prime Finance, Inc. | 75 | 73,622 | ||||||||||
6.25%, 01/15/2028(e) | 3,102 | 2,779,578 | ||||||||||
Refinitiv US Holdings, Inc. | 348 | 386,151 | ||||||||||
Sabre GLBL, Inc. | 1,581 | 1,669,410 | ||||||||||
Verscend Escrow Corp. | 4,000 | 4,166,400 | ||||||||||
|
| |||||||||||
| 25,353,047 | ||||||||||||
|
| |||||||||||
Technology – 0.3% | ||||||||||||
Banff Merger Sub, Inc. | 2,954 | 2,650,417 | ||||||||||
CDW LLC/CDW Finance Corp. | 1,675 | 1,681,817 | ||||||||||
CommScope, Inc. | 1,147 | 1,147,012 | ||||||||||
6.00%, 03/01/2026(e) | 589 | 590,237 | ||||||||||
8.25%, 03/01/2027(e) | 1,061 | 1,017,860 | ||||||||||
NCR Corp. | 473 | 473,974 | ||||||||||
6.125%, 09/01/2029(e) | 366 | 365,393 | ||||||||||
8.125%, 04/15/2025(e) | 1,180 | 1,251,130 | ||||||||||
| abfunds.com | AB INCOME FUND | 37 | |
PORTFOLIO OF INVESTMENTS (continued)
| Principal Amount (000) | U.S. $ Value | |||||||||||
|
| |||||||||||
Presidio Holdings, Inc. | U.S.$ | 165 | $ | 162,081 | ||||||||
8.25%, 02/01/2028(e) | 1,836 | 1,805,522 | ||||||||||
Science Applications International Corp. | 448 | 439,891 | ||||||||||
Veritas US, Inc./Veritas Bermuda Ltd. | 1,257 | 1,222,898 | ||||||||||
Xerox Corp. | 27 | 26,846 | ||||||||||
|
| |||||||||||
| 12,835,078 | ||||||||||||
|
| |||||||||||
Transportation - Services – 0.3% | ||||||||||||
Algeco Global Finance PLC | 2,258 | 2,004,088 | ||||||||||
Avis Budget Car Rental LLC/Avis Budget Finance, Inc. | 787 | 457,428 | ||||||||||
Europcar Mobility Group | EUR | 1,936 | 1,339,259 | |||||||||
Heathrow Finance PLC | GBP | 3,945 | 4,579,824 | |||||||||
Herc Holdings, Inc. | U.S.$ | 1,193 | 1,130,797 | |||||||||
Hertz Corp. (The) | 1,478 | 308,252 | ||||||||||
6.00%, 01/15/2028(e) | 1,078 | 186,914 | ||||||||||
7.125%, 08/01/2026(e) | 358 | 77,382 | ||||||||||
XPO Logistics, Inc. | 1,670 | 1,722,037 | ||||||||||
|
| |||||||||||
| 11,805,981 | ||||||||||||
|
| |||||||||||
| 426,952,109 | ||||||||||||
|
| |||||||||||
Financial Institutions – 2.1% | ||||||||||||
Banking – 0.9% | ||||||||||||
Alliance Data Systems Corp. | 3,780 | 2,808,805 | ||||||||||
Banco Bilbao Vizcaya Argentaria SA | EUR | 6,400 | 6,591,527 | |||||||||
Series 9 | U.S.$ | 1,800 | 1,633,788 | |||||||||
Banco Santander SA | EUR | 3,700 | 4,020,747 | |||||||||
Citizens Financial Group, Inc. | U.S.$ | 222 | 187,741 | |||||||||
| 38 | AB INCOME FUND | abfunds.com | |
PORTFOLIO OF INVESTMENTS (continued)
| Principal Amount (000) | U.S. $ Value | |||||||||||
|
| |||||||||||
Credit Suisse Group AG | U.S.$ | 640 | $ | 656,646 | ||||||||
6.375%, 08/21/2026(e)(f) | 3,961 | 3,903,288 | ||||||||||
7.50%, 07/17/2023-12/11/2023(e) (f) | 7,239 | 7,361,479 | ||||||||||
HSBC Finance Corp. | 2,765 | 2,796,410 | ||||||||||
Intesa Sanpaolo SpA | 999 | 1,007,821 | ||||||||||
Societe Generale SA | 2,015 | 2,055,502 | ||||||||||
UniCredit SpA | EUR | 2,700 | 2,982,671 | |||||||||
|
| |||||||||||
| 36,006,425 | ||||||||||||
|
| |||||||||||
Brokerage – 0.1% | ||||||||||||
LPL Holdings, Inc. | U.S.$ | 1,169 | 1,154,902 | |||||||||
NFP Corp. | 1,858 | 1,778,199 | ||||||||||
|
| |||||||||||
| 2,933,101 | ||||||||||||
|
| |||||||||||
Finance – 0.2% | ||||||||||||
Compass Group Diversified Holdings LLC | 1,375 | 1,443,860 | ||||||||||
Curo Group Holdings Corp. | 2,000 | 1,612,760 | ||||||||||
Enova International, Inc. | 3,418 | 2,992,322 | ||||||||||
goeasy Ltd. | 2,145 | 1,917,759 | ||||||||||
Jefferies Finance LLC/JFIN Co-Issuer Corp. | 823 | 746,543 | ||||||||||
Lincoln Financing SARL | EUR | 759 | 707,487 | |||||||||
|
| |||||||||||
| 9,420,731 | ||||||||||||
|
| |||||||||||
Insurance – 0.3% | ||||||||||||
Acrisure LLC/Acrisure Finance, Inc. | U.S.$ | 4,241 | 3,805,237 | |||||||||
10.125%, 08/01/2026(e) | 831 | 834,656 | ||||||||||
Alliant Holdings Intermediate LLC/Alliant Holdings Co-Issuer | 1,620 | 1,615,837 | ||||||||||
ASR Nederland NV | EUR | 1,040 | 1,061,695 | |||||||||
Polaris Intermediate Corp. | U.S.$ | 6,392 | 5,361,030 | |||||||||
|
| |||||||||||
| 12,678,455 | ||||||||||||
|
| |||||||||||
| abfunds.com | AB INCOME FUND | 39 | |
PORTFOLIO OF INVESTMENTS (continued)
| Principal Amount (000) | U.S. $ Value | |||||||||||
|
| |||||||||||
Other Finance – 0.3% | ||||||||||||
Altice France Holding SA | U.S.$ | 3,024 | $ | 3,265,466 | ||||||||
Intrum AB | EUR | 633 | 610,474 | |||||||||
3.00%, 09/15/2027(e) | 1,490 | 1,207,777 | ||||||||||
3.50%, 07/15/2026(e) | 543 | 452,307 | ||||||||||
Nordic Aviation Capital | U.S.$ | 12,450 | 8,484,675 | |||||||||
|
| |||||||||||
| 14,020,699 | ||||||||||||
|
| |||||||||||
REITS – 0.3% | ||||||||||||
Brookfield Property REIT, Inc./BPR Cumulus LLC/BPR Nimbus LLC/GGSI Sellco LL | 2,479 | 1,982,481 | ||||||||||
Diversified Healthcare Trust | 2,739 | 2,621,086 | ||||||||||
Iron Mountain, Inc. | 1,110 | 1,064,347 | ||||||||||
MGM Growth Properties Operating Partnership LP/MGP Finance Co-Issuer, Inc. | 1,187 | 1,202,645 | ||||||||||
Realogy Group LLC/Realogy Co-Issuer Corp. | 4,479 | 3,131,537 | ||||||||||
SBA Communications Corp. | 2,817 | 2,875,115 | ||||||||||
|
| |||||||||||
| 12,877,211 | ||||||||||||
|
| |||||||||||
| 87,936,622 | ||||||||||||
|
| |||||||||||
Utility – 0.2% | ||||||||||||
Electric – 0.2% | ||||||||||||
Calpine Corp. | 2,694 | 2,626,515 | ||||||||||
5.50%, 02/01/2024 | 576 | 576,351 | ||||||||||
5.75%, 01/15/2025 | 520 | 521,103 | ||||||||||
NRG Energy, Inc. | 75 | 80,063 | ||||||||||
Talen Energy Supply LLC | 394 | 271,931 | ||||||||||
7.25%, 05/15/2027(e) | 850 | 841,143 | ||||||||||
10.50%, 01/15/2026(e) | 3,081 | 2,538,528 | ||||||||||
Vistra Operations Co. LLC | 75 | 79,032 | ||||||||||
|
| |||||||||||
| 7,534,666 | ||||||||||||
|
| |||||||||||
Total Corporates – Non-Investment Grade | 522,423,397 | |||||||||||
|
| |||||||||||
| 40 | AB INCOME FUND | abfunds.com | |
PORTFOLIO OF INVESTMENTS (continued)
| Principal Amount (000) | U.S. $ Value | |||||||||||
|
| |||||||||||
COLLATERALIZED MORTGAGE OBLIGATIONS – 9.1% | ||||||||||||
Risk Share Floating Rate – 7.9% | ||||||||||||
Bellemeade Re Ltd. | U.S.$ | 138 | $ | 137,239 | ||||||||
Series 2018-2A, Class M1B | 3,397 | 3,252,936 | ||||||||||
Series 2018-3A, Class M1B | 1,423 | 1,339,486 | ||||||||||
Series 2019-1A, Class M2 | 1,340 | 995,753 | ||||||||||
Series 2019-2A, Class M1C | 9,029 | 8,201,521 | ||||||||||
Series 2019-3A, Class M1B | 634 | 551,712 | ||||||||||
Series 2019-3A, Class M1C | 15,567 | 11,782,921 | ||||||||||
Series 2019-4A, Class M1C | 7,608 | 6,504,013 | ||||||||||
Connecticut Avenue Securities Trust | 8,387 | 8,194,329 | ||||||||||
Eagle RE Ltd. | 656 | 623,062 | ||||||||||
Federal Home Loan Mortgage Corp. | 5,485 | 4,098,845 | ||||||||||
Series 2013-DN2, Class M2 | 8,798 | 7,463,260 | ||||||||||
Series 2014-DN3, Class M3 | 2,992 | 2,376,460 | ||||||||||
| abfunds.com | AB INCOME FUND | 41 | |
PORTFOLIO OF INVESTMENTS (continued)
| Principal Amount (000) | U.S. $ Value | |||||||||
|
| |||||||||
Series 2016-DNA4, Class M3 | U.S.$ | 5,307 | $ | 5,128,333 | ||||||
Series 2018-HQA2, Class M2 | 11,000 | 9,286,752 | ||||||||
Series 2020-DNA1, Class M2 | 26,178 | 19,923,878 | ||||||||
Series 2020-HQA2, Class M2 | 509 | 355,775 | ||||||||
Federal Home Loan Mortgage Corp. Structured Agency Credit Risk Debt Notes | 4,455 | 2,809,402 | ||||||||
Series 2014-DN2, Class M3 | 350 | 233,421 | ||||||||
Series 2014-HQ2, Class M3 | 1,010 | 780,486 | ||||||||
Series 2015-DN1, Class B | 2,557 | 1,862,007 | ||||||||
Series 2015-DNA1, Class M3 | 773 | 765,616 | ||||||||
Series 2015-DNA2, Class B | 1,489 | 1,130,409 | ||||||||
Series 2015-DNA3, Class B | 2,474 | 1,876,361 | ||||||||
Series 2015-HQA1, Class B | 1,576 | 1,166,750 | ||||||||
Series 2016-DNA1, Class B | 2,228 | 1,761,314 | ||||||||
Series 2016-DNA2, Class M3 | 5,555 | 5,471,991 | ||||||||
Series 2016-HQA2, Class M3 | 8,537 | 8,537,011 | ||||||||
| 42 | AB INCOME FUND | abfunds.com | |
PORTFOLIO OF INVESTMENTS (continued)
| Principal Amount (000) | U.S. $ Value | |||||||||
|
| |||||||||
Series 2017-DNA1, Class M2 | U.S.$ | 2,600 | $ | 2,477,603 | ||||||
Series 2017-DNA2, Class B1 | 5,178 | 4,012,675 | ||||||||
Series 2017-DNA2, Class M2 | 1,168 | 1,120,147 | ||||||||
Series 2017-DNA3, Class B1 | 4,550 | 3,374,990 | ||||||||
Series 2017-HQA2, Class B1 | 3,000 | 2,213,517 | ||||||||
Series 2017-HQA3, Class B1 | 4,750 | 3,475,183 | ||||||||
Series 2017-HQA3, Class M2 | 7,987 | 6,965,638 | ||||||||
Series 2018-HQA1, Class B1 | 4,520 | 3,381,630 | ||||||||
Series 2018-HQA1, Class M2 | 4,156 | 3,655,380 | ||||||||
Federal National Mortgage Association Connecticut Avenue Securities | 9,954 | 7,835,957 | ||||||||
Series 2014-C02, Class 1M2 | 3,473 | 2,592,774 | ||||||||
Series 2014-C03, Class 1M2 | 11,475 | 8,741,194 | ||||||||
Series 2014-C04, Class 1M2 | 6,705 | 5,264,690 | ||||||||
Series 2014-C04, Class 2M2 | 1,175 | 1,025,592 | ||||||||
Series 2015-C01, Class 1M2 | 2,316 | 1,836,520 | ||||||||
| abfunds.com | AB INCOME FUND | 43 | |
PORTFOLIO OF INVESTMENTS (continued)
| Principal Amount (000) | U.S. $ Value | |||||||||
|
| |||||||||
Series 2015-C02, Class 1M2 | U.S.$ | 3,753 | $ | 3,038,171 | ||||||
Series 2015-C02, Class 2M2 | 1,294 | 1,108,086 | ||||||||
Series 2015-C03, Class 1M2 | 3,320 | 2,440,895 | ||||||||
Series 2015-C03, Class 2M2 | 1,209 | 920,760 | ||||||||
Series 2015-C04, Class 1M2 | 4,102 | 4,143,354 | ||||||||
Series 2015-C04, Class 2M2 | 2,263 | 2,286,100 | ||||||||
Series 2016-C01, Class 1M2 | 2,845 | 2,916,817 | ||||||||
Series 2016-C01, Class 2M2 | 1,193 | 1,228,695 | ||||||||
Series 2016-C02, Class 1M2 | 7,802 | 7,938,990 | ||||||||
Series 2016-C04, Class 1M2 | 602 | 591,306 | ||||||||
Series 2016-C05, Class 2B | 2,743 | 2,057,775 | ||||||||
Series 2016-C05, Class 2M2 | 5,643 | 5,538,899 | ||||||||
Series 2016-C07, Class 2B | 1,189 | 847,143 | ||||||||
Series 2016-C07, Class 2M2 | 657 | 643,630 | ||||||||
Series 2017-C01, Class 1B1 | 16,579 | 13,659,746 | ||||||||
Series 2017-C02, Class 2B1 | 6,180 | 4,413,562 | ||||||||
| 44 | AB INCOME FUND | abfunds.com | |
PORTFOLIO OF INVESTMENTS (continued)
| Principal Amount (000) | U.S. $ Value | |||||||||
|
| |||||||||
Series 2017-C02, Class 2M2 | U.S.$ | 700 | $ | 661,663 | ||||||
Series 2017-C03, Class 1B1 | 7,080 | 5,590,953 | ||||||||
Series 2017-C03, Class 1M2 | 211 | 199,624 | ||||||||
Series 2017-C05, Class 1B1 | 7,280 | 5,161,636 | ||||||||
Series 2017-C07, Class 1M2 | 1,150 | 1,027,956 | ||||||||
Series 2018-C01, Class 1B1 | 8,575 | 5,798,835 | ||||||||
Series 2018-C01, Class 1M1 | 1,879 | 1,873,063 | ||||||||
Series 2018-C03, Class 1B1 | 7,250 | 5,058,569 | ||||||||
Series 2018-C04, Class 2M2 | 1,507 | 1,303,005 | ||||||||
Series 2018-C05, Class 1B1 | 6,873 | 4,844,732 | ||||||||
Series 2018-C05, Class 1M1 | 514 | 513,529 | ||||||||
Series 2018-C06, Class 2M2 | 709 | 628,653 | ||||||||
Home Re Ltd. | 951 | 899,612 | ||||||||
Series 2019-1, Class B1 | 2,000 | 1,346,013 | ||||||||
JP Morgan Madison Avenue Securities Trust | 1,118 | 1,156,023 | ||||||||
| abfunds.com | AB INCOME FUND | 45 | |
PORTFOLIO OF INVESTMENTS (continued)
| Principal Amount (000) | U.S. $ Value | |||||||||
|
| |||||||||
Series 2015-CH1, Class M2 | U.S.$ | 1,980 | $ | 1,504,580 | ||||||
Mortgage Insurance-Linked Notes | 13,630 | 11,668,740 | ||||||||
Series 2020-1, Class M1A | 6,523 | 6,263,260 | ||||||||
Series 2020-1, Class M1B | 4,640 | 4,124,840 | ||||||||
Series 2020-1, Class M1C | 2,088 | 1,745,799 | ||||||||
Oaktown Re III Ltd. | 7,478 | 5,344,297 | ||||||||
Oaktown Re Ltd. | 559 | 522,308 | ||||||||
PMT Credit Risk Transfer Trust | 3,323 | 2,600,797 | ||||||||
Series 2019-2R, Class A | 4,622 | 3,428,768 | ||||||||
Series 2019-3R, Class A | 2,062 | 1,569,959 | ||||||||
Series 2020-1R, Class A | 9,841 | 7,372,289 | ||||||||
Radnor Re Ltd. | 1,500 | 1,002,155 | ||||||||
Series 2018-1, Class M2 | 721 | 627,799 | ||||||||
Series 2019-1, Class M1B | 3,393 | 3,145,010 | ||||||||
| 46 | AB INCOME FUND | abfunds.com | |
PORTFOLIO OF INVESTMENTS (continued)
| Principal Amount (000) | U.S. $ Value | |||||||||||
|
| |||||||||||
Series 2019-1, Class M2 | U.S.$ | 6,106 | $ | 4,712,888 | ||||||||
Series 2019-2, Class M1B | 9,100 | 7,963,839 | ||||||||||
STACR Trust | 7,000 | 4,849,510 | ||||||||||
Wells Fargo Credit Risk Transfer Securities Trust | 681 | 523,592 | ||||||||||
|
| |||||||||||
| 333,392,758 | ||||||||||||
|
| |||||||||||
Agency Floating Rate – 1.1% | ||||||||||||
Federal Home Loan Mortgage Corp. REMICs | 1,567 | 397,144 | ||||||||||
Series 3856, Class KS | 10,977 | 2,066,850 | ||||||||||
Series 4248, Class SL | 965 | 190,533 | ||||||||||
Series 4372, Class JS | 5,871 | 1,144,358 | ||||||||||
Series 4570, Class ST | 2,228 | 503,416 | ||||||||||
Series 4735, Class SA | 10,713 | 2,543,509 | ||||||||||
Series 4763, Class SB | 20,832 | 4,579,297 | ||||||||||
Series 4774, Class BS | 12,012 | 1,917,270 | ||||||||||
Series 4774, Class SL | 15,443 | 2,550,934 | ||||||||||
| abfunds.com | AB INCOME FUND | 47 | |
PORTFOLIO OF INVESTMENTS (continued)
| Principal Amount (000) | U.S. $ Value | |||||||||||
|
| |||||||||||
Series 4927, Class SJ | U.S.$ | 6,551 | $ | 1,124,698 | ||||||||
Federal National Mortgage Association REMICs | 3,623 | 733,053 | ||||||||||
Series 2014-88, Class BS | 3,374 | 672,840 | ||||||||||
Series 2015-90, Class SA | 24,993 | 5,504,820 | ||||||||||
Series 2016-69, Class DS | 37,113 | 7,326,068 | ||||||||||
Series 2017-49, Class SP | 3,122 | 675,221 | ||||||||||
Series 2018-32, Class SB | 6,892 | 1,459,387 | ||||||||||
Series 2018-45, Class SL | 4,420 | 979,469 | ||||||||||
Series 2018-57, Class SL | 21,785 | 3,402,587 | ||||||||||
Series 2018-58, Class SA | 7,835 | 1,214,111 | ||||||||||
Series 2018-59, Class HS | 21,736 | 3,194,763 | ||||||||||
Series 2019-25, Class SA | 6,065 | 1,260,668 | ||||||||||
Series 2019-60, Class SJ | 6,208 | 1,212,092 | ||||||||||
|
| |||||||||||
| 44,653,088 | ||||||||||||
|
| |||||||||||
Non-Agency Fixed Rate – 0.1% | ||||||||||||
Alternative Loan Trust | 1,198 | 828,383 | ||||||||||
| 48 | AB INCOME FUND | abfunds.com | |
PORTFOLIO OF INVESTMENTS (continued)
| Principal Amount (000) | U.S. $ Value | |||||||||||
|
| |||||||||||
CHL Mortgage Pass-Through Trust | U.S.$ | 696 | $ | 514,008 | ||||||||
Series 2007-HY4, Class 1A1 | 279 | 240,005 | ||||||||||
Citigroup Mortgage Loan Trust | 183 | 157,556 | ||||||||||
CSMC Mortgage-Backed Trust | 488 | 329,910 | ||||||||||
Wells Fargo Mortgage Backed Securities Trust | 1,148 | 1,078,756 | ||||||||||
|
| |||||||||||
| 3,148,618 | ||||||||||||
|
| |||||||||||
Agency Fixed Rate – 0.0% | ||||||||||||
Federal National Mortgage Association REMICs | 3,983 | 189,938 | ||||||||||
Series 2016-26, Class IO | 700 | 126,431 | ||||||||||
|
| |||||||||||
| 316,369 | ||||||||||||
|
| |||||||||||
Non-Agency Floating Rate – 0.0% | ||||||||||||
First Horizon Alternative Mortgage Securities Trust | 432 | 146,255 | ||||||||||
Lehman XS Trust | 361 | 69,861 | ||||||||||
|
| |||||||||||
| 216,116 | ||||||||||||
|
| |||||||||||
Total Collateralized Mortgage Obligations | 381,726,949 | |||||||||||
|
| |||||||||||
EMERGING MARKETS – | ||||||||||||
Angola – 0.1% | ||||||||||||
Angolan Government International Bond | 8,094 | 3,480,420 | ||||||||||
8.25%, 05/09/2028(e) | 460 | 197,800 | ||||||||||
9.50%, 11/12/2025(e) | 4,256 | 2,010,960 | ||||||||||
|
| |||||||||||
| 5,689,180 | ||||||||||||
|
| |||||||||||
| abfunds.com | AB INCOME FUND | 49 | |
PORTFOLIO OF INVESTMENTS (continued)
| Principal Amount (000) | U.S. $ Value | |||||||||||
|
| |||||||||||
Bahamas – 0.0% | ||||||||||||
Bahamas Government International Bond | U.S.$ | 2,300 | $ | 1,888,875 | ||||||||
|
| |||||||||||
Bahrain – 0.1% | ||||||||||||
Bahrain Government International Bond | 1,709 | 1,654,526 | ||||||||||
7.00%, 10/12/2028(e) | 2,107 | 2,092,514 | ||||||||||
CBB International Sukuk Programme Co. | 1,087 | 1,027,215 | ||||||||||
|
| |||||||||||
| 4,774,255 | ||||||||||||
|
| |||||||||||
Costa Rica – 0.2% | ||||||||||||
Costa Rica Government International Bond | 5,214 | 4,247,780 | ||||||||||
7.158%, 03/12/2045(e) | 4,004 | 3,091,839 | ||||||||||
|
| |||||||||||
| 7,339,619 | ||||||||||||
|
| |||||||||||
Dominican Republic – 0.5% |
| |||||||||||
Dominican Republic International Bond | 9,442 | 7,761,324 | ||||||||||
5.95%, 01/25/2027(e) | 1,251 | 1,125,900 | ||||||||||
6.40%, 06/05/2049(e) | 1,551 | 1,259,218 | ||||||||||
6.875%, 01/29/2026(e) | 6,782 | 6,481,049 | ||||||||||
7.50%, 05/06/2021(e) | 3,333 | 3,323,958 | ||||||||||
|
| |||||||||||
| 19,951,449 | ||||||||||||
|
| |||||||||||
Ecuador – 0.1% | ||||||||||||
Ecuador Government International Bond | 1,350 | 376,650 | ||||||||||
9.65%, 12/13/2026(e)(l)(p) | 499 | 139,970 | ||||||||||
10.75%, 03/28/2022(e)(l)(p) | 5,983 | 1,869,687 | ||||||||||
|
| |||||||||||
| 2,386,307 | ||||||||||||
|
| |||||||||||
Egypt – 0.5% | ||||||||||||
Egypt Government International Bond | 5,970 | 5,949,478 | ||||||||||
6.20%, 03/01/2024(e) | 4,724 | 4,564,565 | ||||||||||
6.588%, 02/21/2028(e) | 1,000 | 913,125 | ||||||||||
7.053%, 01/15/2032(e) | 2,597 | 2,295,099 | ||||||||||
7.50%, 01/31/2027(e) | 6,064 | 5,866,920 | ||||||||||
7.60%, 03/01/2029(e) | 217 | 205,879 | ||||||||||
|
| |||||||||||
| 19,795,066 | ||||||||||||
|
| |||||||||||
El Salvador – 0.0% | ||||||||||||
El Salvador Government International Bond | 628 | 473,944 | ||||||||||
|
| |||||||||||
| 50 | AB INCOME FUND | abfunds.com | |
PORTFOLIO OF INVESTMENTS (continued)
| Principal Amount (000) | U.S. $ Value | |||||||||||
|
| |||||||||||
Ghana – 0.3% | ||||||||||||
Ghana Government International Bond | U.S.$ | 13,133 | $ | 10,046,745 | ||||||||
10.75%, 10/14/2030(e) | 693 | 720,720 | ||||||||||
|
| |||||||||||
| 10,767,465 | ||||||||||||
|
| |||||||||||
Guatemala – 0.0% | ||||||||||||
Guatemala Government Bond | 200 | 203,500 | ||||||||||
6.125%, 06/01/2050(e) | 1,172 | 1,217,415 | ||||||||||
|
| |||||||||||
| 1,420,915 | ||||||||||||
|
| |||||||||||
Honduras – 0.2% | ||||||||||||
Honduras Government International Bond | 1,555 | 1,463,158 | ||||||||||
7.50%, 03/15/2024(e) | 3,298 | 3,168,141 | ||||||||||
8.75%, 12/16/2020(e) | 5,825 | 5,737,625 | ||||||||||
|
| |||||||||||
| 10,368,924 | ||||||||||||
|
| |||||||||||
Ivory Coast – 0.1% | ||||||||||||
Ivory Coast Government International Bond | 2,440 | 2,171,600 | ||||||||||
|
| |||||||||||
Kenya – 0.2% | ||||||||||||
Kenya Government International Bond | 620 | 562,650 | ||||||||||
7.00%, 05/22/2027(e) | 1,680 | 1,507,800 | ||||||||||
7.25%, 02/28/2028(e) | 1,639 | 1,471,003 | ||||||||||
8.00%, 05/22/2032(e) | 3,420 | 3,085,481 | ||||||||||
|
| |||||||||||
| 6,626,934 | ||||||||||||
|
| |||||||||||
Lebanon – 0.0% | ||||||||||||
Lebanon Government International Bond | 507 | 79,853 | ||||||||||
6.85%, 03/23/2027(e)(l)(p) | 1,053 | 167,164 | ||||||||||
Series G 6.60%, 11/27/2026(e)(l)(p) | 1,284 | 203,032 | ||||||||||
|
| |||||||||||
| 450,049 | ||||||||||||
|
| |||||||||||
Nigeria – 0.2% | ||||||||||||
Nigeria Government International Bond | 248 | 216,458 | ||||||||||
6.75%, 01/28/2021(e) | 2,136 | 2,012,512 | ||||||||||
7.625%, 11/21/2025(e) | 8,728 | 7,298,790 | ||||||||||
7.875%, 02/16/2032(e) | 426 | 323,094 | ||||||||||
|
| |||||||||||
| 9,850,854 | ||||||||||||
|
| |||||||||||
Oman – 0.3% | ||||||||||||
Oman Government International Bond | 5,200 | 4,524,000 | ||||||||||
4.875%, 02/01/2025(e) | 1,810 | 1,475,150 | ||||||||||
| abfunds.com | AB INCOME FUND | 51 | |
PORTFOLIO OF INVESTMENTS (continued)
| Principal Amount (000) | U.S. $ Value | |||||||||||
|
| |||||||||||
5.375%, 03/08/2027(e) | U.S.$ | 4,550 | $ | 3,453,734 | ||||||||
6.00%, 08/01/2029(e) | 4,272 | 3,254,730 | ||||||||||
|
| |||||||||||
| 12,707,614 | ||||||||||||
|
| |||||||||||
Pakistan – 0.0% | ||||||||||||
Pakistan Government International Bond | 245 | 211,619 | ||||||||||
|
| |||||||||||
Senegal – 0.2% | ||||||||||||
Senegal Government International Bond | 5,158 | 4,518,085 | ||||||||||
6.75%, 03/13/2048(e) | 3,730 | 3,106,391 | ||||||||||
8.75%, 05/13/2021(e) | 864 | 838,620 | ||||||||||
|
| |||||||||||
| 8,463,096 | ||||||||||||
|
| |||||||||||
South Africa – 0.3% | ||||||||||||
Republic of South Africa Government International Bond | 425 | 355,937 | ||||||||||
4.85%, 09/30/2029 | 9,846 | 8,442,945 | ||||||||||
5.875%, 06/22/2030 | 2,797 | 2,559,255 | ||||||||||
|
| |||||||||||
| 11,358,137 | ||||||||||||
|
| |||||||||||
Sri Lanka – 0.1% | ||||||||||||
Sri Lanka Government International Bond | 2,000 | 1,156,800 | ||||||||||
6.20%, 05/11/2027(e) | 685 | 388,738 | ||||||||||
6.85%, 03/14/2024(e) | 3,325 | 1,951,376 | ||||||||||
7.85%, 03/14/2029(e) | 2,144 | 1,205,807 | ||||||||||
|
| |||||||||||
| 4,702,721 | ||||||||||||
|
| |||||||||||
Zambia – 0.0% | ||||||||||||
Zambia Government International Bond | 1,217 | 396,666 | ||||||||||
|
| |||||||||||
Total Emerging Markets – Sovereigns | 141,795,289 | |||||||||||
|
| |||||||||||
COLLATERALIZED LOAN OBLIGATIONS – 2.5% | ||||||||||||
CLO - Floating Rate – 2.5% | ||||||||||||
Apidos CLO | 550 | 391,215 | ||||||||||
Ares XXXIV CLO Ltd. | 9,437 | 8,188,774 | ||||||||||
| 52 | AB INCOME FUND | abfunds.com | |
PORTFOLIO OF INVESTMENTS (continued)
| Principal Amount (000) | U.S. $ Value | |||||||||
|
| |||||||||
Ballyrock CLO Ltd. | U.S.$ | 8,315 | $ | 8,119,007 | ||||||
Black Diamond CLO Ltd. | 5,300 | 4,773,742 | ||||||||
BlueMountain Fuji US CLO II Ltd. | 3,300 | 1,963,830 | ||||||||
CBAM Ltd. | 1,604 | 1,007,536 | ||||||||
Series 2018-7A, Class B1 | 1,996 | 1,831,552 | ||||||||
Dryden CLO Ltd. | 1,480 | 1,306,112 | ||||||||
Series 2020-78A, Class D | 6,824 | 5,406,578 | ||||||||
Dryden Senior Loan Fund | 605 | 439,302 | ||||||||
Elevation CLO Ltd. | 4,490 | 3,383,282 | ||||||||
GoldenTree Loan Opportunities Ltd. | 2,815 | 2,294,906 | ||||||||
Greywolf CLO VI Ltd. | 5,300 | 4,980,664 | ||||||||
Halcyon Loan Advisors Funding Ltd. | 1,826 | 1,635,662 | ||||||||
Series 2018-1A, Class C | 2,000 | 1,392,916 | ||||||||
| abfunds.com | AB INCOME FUND | 53 | |
PORTFOLIO OF INVESTMENTS (continued)
| Principal Amount (000) | U.S. $ Value | |||||||||
|
| |||||||||
Kayne CLO 7 Ltd. | U.S.$ | 2,663 | $ | 2,541,390 | ||||||
Marble Point CLO XI Ltd. | 2,400 | 2,280,168 | ||||||||
Mariner CLO LLC | 4,575 | 4,429,218 | ||||||||
Northwoods Capital Ltd. | 1,350 | 1,210,047 | ||||||||
Octagon Investment Partners 29 Ltd. | 6,571 | 5,013,510 | ||||||||
OZLM Ltd. | 1,000 | 784,240 | ||||||||
Series 2018-18A, Class B | 5,450 | 4,954,023 | ||||||||
Rockford Tower CLO Ltd. | 4,444 | 3,668,502 | ||||||||
Series 2017-3A, Class A | 1,931 | 1,837,494 | ||||||||
Romark CLO III Ltd. | 4,450 | 4,104,315 | ||||||||
Series 2019-3A, Class B | 600 | 512,336 | ||||||||
Sound Point CLO Ltd. | 7,931 | 7,349,467 | ||||||||
THL Credit Wind River CLO Ltd. | 12,200 | 11,773,561 | ||||||||
| 54 | AB INCOME FUND | abfunds.com | |
PORTFOLIO OF INVESTMENTS (continued)
| Principal Amount (000) | U.S. $ Value | |||||||||||
|
| |||||||||||
TIAA CLO II Ltd. | U.S.$ | 1,000 | $ | 957,663 | ||||||||
Venture CLO Ltd. | 1,591 | 1,293,440 | ||||||||||
Voya CLO Ltd. | 4,595 | 3,606,476 | ||||||||||
York CLO-7 Ltd. | 4,400 | 4,211,720 | ||||||||||
|
| |||||||||||
Total Collateralized Loan Obligations | 107,642,648 | |||||||||||
|
| |||||||||||
BANK LOANS – 2.5% | ||||||||||||
Industrial – 2.2% | ||||||||||||
Basic – 0.0% | ||||||||||||
Arconic Corporation | 630 | 623,700 | ||||||||||
Nouryon Finance B.V. (fka AkzoNobel) | 169 | 152,777 | ||||||||||
|
| |||||||||||
| 776,477 | ||||||||||||
|
| |||||||||||
Capital Goods – 0.3% | ||||||||||||
Apex Tool Group, LLC | 4,968 | 3,972,597 | ||||||||||
Brookfield WEC Holdings Inc. (fka Westinghouse Electric Company LLC) | 753 | 711,640 | ||||||||||
BWay Holding Company | 5,578 | 4,772,536 | ||||||||||
Granite US Holdings Corporation | 3,616 | 2,928,822 | ||||||||||
| abfunds.com | AB INCOME FUND | 55 | |
PORTFOLIO OF INVESTMENTS (continued)
| Principal Amount (000) | U.S. $ Value | |||||||||||
|
| |||||||||||
Honeywell Technologies SARL (fka Garrett Motion Inc.) | U.S.$ | 2,085 | $ | 1,772,602 | ||||||||
|
| |||||||||||
| 14,158,197 | ||||||||||||
|
| |||||||||||
Communications - Media – 0.0% | ||||||||||||
Diamond Sports Group, LLC | 359 | 291,131 | ||||||||||
iHeartCommunications, Inc. (fka Clear Channel Communications, Inc.) | 249 | 222,844 | ||||||||||
Univision Communications Inc. | 1,042 | 913,506 | ||||||||||
|
| |||||||||||
| 1,427,481 | ||||||||||||
|
| |||||||||||
Communications - | ||||||||||||
Intelsat Jackson Holdings S.A. | 252 | 250,000 | ||||||||||
6.750% (PRIME 3 Month + 3.50%), 01/02/2024(s) | 150 | 147,917 | ||||||||||
|
| |||||||||||
| 397,917 | ||||||||||||
|
| |||||||||||
Consumer Cyclical - | ||||||||||||
Navistar, Inc. | 2,711 | 2,442,000 | ||||||||||
Panther BF Aggregator 2 L P | 408 | 368,379 | ||||||||||
|
| |||||||||||
| 2,810,379 | ||||||||||||
|
| |||||||||||
Consumer Cyclical - | ||||||||||||
Motion Acquisition Limited | 137 | 117,654 | ||||||||||
4.700% (LIBOR 3 Month + 3.25%), 11/12/2026(s) | 1,135 | 976,920 | ||||||||||
|
| |||||||||||
| 1,094,574 | ||||||||||||
|
| |||||||||||
| 56 | AB INCOME FUND | abfunds.com | |
PORTFOLIO OF INVESTMENTS (continued)
| Principal Amount (000) | U.S. $ Value | |||||||||||
|
| |||||||||||
Consumer Cyclical - Other – 0.3% | ||||||||||||
Caesars Resort Collection, LLC (fka Caesars Growth Properties Holdings, LLC) | U.S.$ | 4,588 | $ | 3,861,805 | ||||||||
Landry’s Finance Acquisition Co | 1,470 | 1,511,645 | ||||||||||
Playtika Holding Corp. | 6,037 | 5,961,130 | ||||||||||
Scientific Games International, Inc. | 505 | 416,391 | ||||||||||
3.453% (LIBOR 2 Month + 2.75%), 08/14/2024(s) | 13 | 10,864 | ||||||||||
3.612% (LIBOR 2 Month + 2.75%), 08/14/2024(s) | 2,065 | 1,702,101 | ||||||||||
Stars Group Holdings B.V. | 671 | 665,682 | ||||||||||
|
| |||||||||||
| 14,129,618 | ||||||||||||
|
| |||||||||||
Consumer Cyclical - | ||||||||||||
IRB Holding Corp. (fka Arby’s/Buffalo Wild Wings) | 563 | 489,680 | ||||||||||
3.954% (LIBOR 3 Month + 2.75%), 02/05/2025(s) | 1 | 1,253 | ||||||||||
Whatabrands LLC | 605 | 556,285 | ||||||||||
|
| |||||||||||
| 1,047,218 | ||||||||||||
|
| |||||||||||
Consumer Cyclical - Retailers – 0.1% | ||||||||||||
Bass Pro Group, LLC | 1,220 | 1,024,660 | ||||||||||
PetSmart, Inc. | 1,121 | 1,086,048 | ||||||||||
Specialty Building Products Holdings, LLC | 1,011 | 857,259 | ||||||||||
|
| |||||||||||
| 2,967,967 | ||||||||||||
|
| |||||||||||
| abfunds.com | AB INCOME FUND | 57 | |
PORTFOLIO OF INVESTMENTS (continued)
| Principal Amount (000) | U.S. $ Value | |||||||||||
|
| |||||||||||
Consumer Non-Cyclical – 0.5% | ||||||||||||
Air Medical Group Holdings, Inc. | U.S.$ | 1,161 | $ | 1,030,022 | ||||||||
Aldevron, L.L.C. | 2,609 | 2,537,530 | ||||||||||
Alphabet Holding Company, Inc. (fka Nature’s Bounty) | 3,524 | 2,798,920 | ||||||||||
BI-LO, LLC | 1,557 | 1,467,324 | ||||||||||
9.314% (LIBOR 2 Month + 8.00%), 05/31/2024(s) | 1,542 | 1,453,633 | ||||||||||
9.737% (LIBOR 2 Month + 8.00%), 05/31/2024(s) | 1,617 | 1,523,874 | ||||||||||
Chobani, LLC (Chobani Idaho, LLC) | 2,049 | 1,944,671 | ||||||||||
Froneri International Limited | 322 | 303,673 | ||||||||||
LifePoint Health, Inc. (fka Regionalcare Hospital Partners Holdings, Inc.) | 1,176 | 1,084,654 | ||||||||||
U.S. Renal Care, Inc. | 6,022 | 5,677,839 | ||||||||||
|
| |||||||||||
| 19,822,140 | ||||||||||||
|
| |||||||||||
Energy – 0.1% | ||||||||||||
California Resources Corporation | 295 | 10,516 | ||||||||||
Chesapeake Energy Corporation | 4,133 | 1,460,313 | ||||||||||
CITGO Petroleum Corporation | 1,767 | 1,555,153 | ||||||||||
|
| |||||||||||
| 3,025,982 | ||||||||||||
|
| |||||||||||
Other Industrial – 0.1% | ||||||||||||
American Tire Distributors, Inc. | 292 | 267,707 | ||||||||||
| 58 | AB INCOME FUND | abfunds.com | |
PORTFOLIO OF INVESTMENTS (continued)
| Principal Amount (000) | U.S. $ Value | |||||||||||
|
| |||||||||||
8.500% (LIBOR 1 Month + 7.50%), 09/01/2023(i)(s) | U.S.$ | 655 | $ | 394,346 | ||||||||
8.950% (LIBOR 1 Month + 7.50%), 09/02/2024(i)(s) | 83 | 49,766 | ||||||||||
Dealer Tire, LLC | 1,327 | 1,160,841 | ||||||||||
KAR Auction Services, Inc. | 201 | 182,096 | ||||||||||
Rockwood Service Corporation | 183 | 166,149 | ||||||||||
|
| |||||||||||
| 2,220,905 | ||||||||||||
|
| |||||||||||
Services – 0.2% | ||||||||||||
Allied Universal Holdco LLC (fka USAGM Holdco, LLC) | 414 | 383,736 | ||||||||||
Amentum Government Services Holdings LLC | 450 | 428,625 | ||||||||||
Garda World Security Corporation | 390 | 373,497 | ||||||||||
Parexel International Corporation | 2,735 | 2,497,739 | ||||||||||
Team Health Holdings, Inc. | 2,663 | 1,950,878 | ||||||||||
Verscend Holding Corp. | 1,965 | 1,846,540 | ||||||||||
|
| |||||||||||
| 7,481,015 | ||||||||||||
|
| |||||||||||
Technology – 0.5% | ||||||||||||
athenahealth, Inc. | 4,998 | 4,597,952 | ||||||||||
Avaya Inc. | 2,534 | 2,216,530 | ||||||||||
Boxer Parent Company Inc. (fka BMC Software, Inc.) | 3,505 | 3,014,303 | ||||||||||
| abfunds.com | AB INCOME FUND | 59 | |
PORTFOLIO OF INVESTMENTS (continued)
| Principal Amount (000) | U.S. $ Value | |||||||||||
|
| |||||||||||
Pitney Bowes Inc. | U.S.$ | 2,946 | $ | 2,518,830 | ||||||||
Presidio Holdings Inc. | 1,648 | 1,549,577 | ||||||||||
Solera, LLC (Solera Finance, Inc.) | 2,065 | 1,953,865 | ||||||||||
Veritas US Inc. | �� | 5,776 | 5,010,254 | |||||||||
|
| |||||||||||
| 20,861,311 | ||||||||||||
|
| |||||||||||
Transportation - Airlines – 0.0% | ||||||||||||
Delta Air Lines, Inc. | 690 | 686,260 | ||||||||||
|
| |||||||||||
| 92,907,441 | ||||||||||||
|
| |||||||||||
Financial Institutions – 0.2% |
| |||||||||||
Finance – 0.1% |
| |||||||||||
Ellie Mae, Inc. | 2,019 | 1,900,474 | ||||||||||
Jefferies Finance LLC | 1,813 | 1,604,181 | ||||||||||
|
| |||||||||||
| 3,504,655 | ||||||||||||
|
| |||||||||||
Insurance – 0.1% | ||||||||||||
Hub International Limited | 2,884 | 2,757,817 | ||||||||||
Sedgwick Claims Management Services, Inc. (Lightning Cayman Merger Sub, Ltd.) | 2,265 | 2,110,227 | ||||||||||
|
| |||||||||||
| 4,868,044 | ||||||||||||
|
| |||||||||||
| 8,372,699 | ||||||||||||
|
| |||||||||||
Utility – 0.1% | ||||||||||||
Electric – 0.1% | ||||||||||||
Granite Generation LLC 4.750% (LIBOR 1 Month + 3.75%), 11/09/2026(s) | 3,573 | 3,363,143 | ||||||||||
5.200% (LIBOR 1 Month + 3.75%), 11/09/2026(s) | 632 | 595,246 | ||||||||||
|
| |||||||||||
| 3,958,389 | ||||||||||||
|
| |||||||||||
Total Bank Loans | 105,238,529 | |||||||||||
|
| |||||||||||
| 60 | AB INCOME FUND | abfunds.com | |
PORTFOLIO OF INVESTMENTS (continued)
| Principal Amount (000) | U.S. $ Value | |||||||||||
|
| |||||||||||
COMMERCIAL MORTGAGE-BACKED SECURITIES – 2.1% | ||||||||||||
Non-Agency Fixed Rate CMBS – 1.6% | ||||||||||||
Banc of America Commercial Mortgage Trust | U.S.$ | 372 | $ | 321,288 | ||||||||
Barclays Commercial Mortgage Trust | 10,934 | 767,581 | ||||||||||
CD Mortgage Trust | 14,863 | 686,153 | ||||||||||
CFCRE Commercial Mortgage Trust | 14,373 | 890,091 | ||||||||||
Citigroup Commercial Mortgage Trust | 516 | 480,360 | ||||||||||
Series 2016-C3, Class XA | 37,847 | 1,650,768 | ||||||||||
Commercial Mortgage Trust | 42,455 | 1,149,753 | ||||||||||
Series 2015-CR27, Class XA | 7,346 | 272,574 | ||||||||||
CSAIL Commercial Mortgage Trust | 670 | 466,906 | ||||||||||
Series 2019-C15, Class B | 960 | 931,487 | ||||||||||
GS Mortgage Securities Trust | 375 | 320,620 | ||||||||||
Series 2011-GC5, Class D | 14,025 | 9,924,679 | ||||||||||
Series 2014-GC22, Class D | 1,805 | 1,088,033 | ||||||||||
Series 2016-GS3, Class XA | 35,157 | 1,847,044 | ||||||||||
JP Morgan Chase Commercial Mortgage Securities Trust | 2,411 | 2,346,635 | ||||||||||
Series 2012-C8, Class E | 2,103 | 1,084,995 | ||||||||||
| abfunds.com | AB INCOME FUND | 61 | |
PORTFOLIO OF INVESTMENTS (continued)
| Principal Amount (000) | U.S. $ Value | |||||||||
|
| |||||||||
Series 2012-CBX, Class E | U.S.$ | 1,863 | $ | 1,070,631 | ||||||
Series 2012-LC9, Class E | 7,500 | 5,900,323 | ||||||||
Series 2012-LC9, Class G | 831 | 578,145 | ||||||||
Series 2016-JP2, Class XA | 16,353 | 1,400,864 | ||||||||
JPMBB Commercial Mortgage Securities Trust | 1,599 | 1,532,726 | ||||||||
Series 2014-C21, Class D | 3,450 | 2,611,795 | ||||||||
Series 2014-C24, Class C | 5,869 | 4,836,739 | ||||||||
LB-UBS Commercial Mortgage Trust | 1,108 | 647,697 | ||||||||
LCCM | 47,869 | 2,812,079 | ||||||||
Madison Avenue Trust | 920 | 921,166 | ||||||||
Morgan Stanley Bank of America Merrill Lynch Trust | 680 | 516,403 | ||||||||
Series 2014-C18, Class C | 4,408 | 3,897,006 | ||||||||
Series 2015-C22, Class XA | 12,616 | 464,153 | ||||||||
UBS Commercial Mortgage Trust | 2,000 | 1,557,737 | ||||||||
Series 2017-C1, Class XA | 9,011 | 698,907 | ||||||||
UBS-Barclays Commercial Mortgage Trust | 2,414 | 2,341,893 | ||||||||
Series 2013-C5, Class C | 782 | 694,546 | ||||||||
Wells Fargo Commercial Mortgage Trust | 8,386 | 362,553 | ||||||||
Series 2016-C36, Class XA | 50,876 | 2,981,332 | ||||||||
| 62 | AB INCOME FUND | abfunds.com | |
PORTFOLIO OF INVESTMENTS (continued)
| Principal Amount (000) | U.S. $ Value | |||||||||||
|
| |||||||||||
Series 2016-LC24, Class XA | U.S.$ | 31,741 | $ | 2,029,693 | ||||||||
Series 2016-LC25, Class XA | 20,067 | 823,003 | ||||||||||
Series 2019-C52, Class XA | 20,080 | 2,006,045 | ||||||||||
WFRBS Commercial Mortgage Trust | 489 | 297,249 | ||||||||||
Series 2014-LC14, Class C | 134 | 119,277 | ||||||||||
|
| |||||||||||
| 65,330,929 | ||||||||||||
|
| |||||||||||
Non-Agency Floating Rate | ||||||||||||
BFLD | 11,227 | 9,181,693 | ||||||||||
DBWF Mortgage Trust | 1,994 | 1,604,100 | ||||||||||
Great Wolf Trust | 12,005 | 9,596,886 | ||||||||||
Morgan Stanley Capital I Trust | 1,651 | 1,253,940 | ||||||||||
|
| |||||||||||
| 21,636,619 | ||||||||||||
|
| |||||||||||
Agency CMBS – 0.0% | ||||||||||||
Government National Mortgage Association Series 2006-32, Class XM | 215 | 242 | ||||||||||
|
| |||||||||||
Total Commercial Mortgage-Backed Securities | 86,967,790 | |||||||||||
|
| |||||||||||
ASSET-BACKED SECURITIES – 1.5% | ||||||||||||
Other ABS - Fixed Rate – 0.8% | ||||||||||||
CLUB Credit Trust | 2,191 | 1,844,005 | ||||||||||
Consumer Loan Underlying Bond Certificate Issuer Trust I | 2,327 | 2,064,498 | ||||||||||
| abfunds.com | AB INCOME FUND | 63 | |
PORTFOLIO OF INVESTMENTS (continued)
| Principal Amount (000) | U.S. $ Value | |||||||||||
|
| |||||||||||
Series 2019-36, Class PT | U.S.$ | 1,898 | $ | 1,584,012 | ||||||||
Series 2019-43, Class PT | 1,511 | 1,348,044 | ||||||||||
Consumer Loan Underlying Bond Credit Trust | 3,255 | 2,397,267 | ||||||||||
Marlette Funding Trust | 4,539 | 3,885,092 | ||||||||||
Series 2018-4A, Class C | 558 | 525,030 | ||||||||||
Series 2019-2A, Class C | 2,692 | 2,059,695 | ||||||||||
Series 2019-3A, Class C | 4,413 | 3,328,571 | ||||||||||
SoFi Consumer Loan Program LLC | 3,123 | 539,427 | ||||||||||
Series 2016-5, Class R | 24 | 215,649 | ||||||||||
Series 2017-5, Class R1 | 17 | 291,180 | ||||||||||
SoFi Consumer Loan Program Trust | 37 | 1,033,118 | ||||||||||
Series 2018-2, Class C | 1,400 | 1,323,345 | ||||||||||
Series 2018-3, Class C | 4,611 | 4,147,635 | ||||||||||
Series 2019-2, Class D | 1,000 | 729,764 | ||||||||||
Series 2019-3, Class D | 5,378 | 4,564,102 | ||||||||||
Series 2019-4, Class D | 3,000 | 2,494,119 | ||||||||||
|
| |||||||||||
| 34,374,553 | ||||||||||||
|
| |||||||||||
Autos - Fixed Rate – 0.7% | ||||||||||||
Avis Budget Rental Car Funding AESOP LLC | 2,372 | 2,143,361 | ||||||||||
CPS Auto Receivables Trust | 1,500 | 1,526,490 | ||||||||||
| 64 | AB INCOME FUND | abfunds.com | |
PORTFOLIO OF INVESTMENTS (continued)
| Principal Amount (000) | U.S. $ Value | |||||||||||
|
| |||||||||||
CPS Auto Trust | U.S.$ | 3,000 | $ | 2,951,379 | ||||||||
Series 2017-A, Class E | 4,200 | 4,268,028 | ||||||||||
Exeter Automobile Receivables Trust | 2,000 | 1,860,612 | ||||||||||
Series 2017-3A, Class D | 4,370 | 3,902,707 | ||||||||||
Series 2019-2A, Class E | 2,670 | 2,231,889 | ||||||||||
Series 2019-3A, Class E | 4,355 | 3,204,406 | ||||||||||
First Investors Auto Owner Trust | 450 | 456,382 | ||||||||||
Flagship Credit Auto Trust | 1,000 | 1,018,158 | ||||||||||
Series 2018-3, Class D | 670 | 624,565 | ||||||||||
Series 2019-4, Class E | 2,970 | 2,524,405 | ||||||||||
Hertz Vehicle Financing II LP | 1,000 | 795,936 | ||||||||||
Westlake Automobile Receivables Trust | 2,551 | 2,244,201 | ||||||||||
|
| |||||||||||
| 29,752,519 | ||||||||||||
|
| |||||||||||
Total Asset-Backed Securities | 64,127,072 | |||||||||||
|
| |||||||||||
INFLATION-LINKED | ||||||||||||
United States – 1.5% | ||||||||||||
U.S. Treasury Inflation Index | 61,138 | 62,102,920 | ||||||||||
|
| |||||||||||
EMERGING MARKETS – CORPORATE BONDS – 1.3% | ||||||||||||
Industrial – 1.1% | ||||||||||||
Basic – 0.3% | ||||||||||||
Consolidated Energy Finance SA | 787 | 609,964 | ||||||||||
| abfunds.com | AB INCOME FUND | 65 | |
PORTFOLIO OF INVESTMENTS (continued)
| Principal Amount (000) | U.S. $ Value | |||||||||||
|
| |||||||||||
CSN Resources SA | U.S.$ | 5,342 | $ | 4,037,508 | ||||||||
First Quantum Minerals Ltd. | 910 | 843,172 | ||||||||||
7.25%, 04/01/2023(e) | 1,952 | 1,751,920 | ||||||||||
7.50%, 04/01/2025(e) | 410 | 357,341 | ||||||||||
HTA Group Ltd./Mauritius | 3,256 | 3,146,110 | ||||||||||
Sasol Financing USA LLC | 1,467 | 953,550 | ||||||||||
Vedanta Resources Finance II PLC | 780 | 284,700 | ||||||||||
|
| |||||||||||
| 11,984,265 | ||||||||||||
|
| |||||||||||
Capital Goods – 0.0% | ||||||||||||
Odebrecht Finance Ltd. | 6,760 | 221,813 | ||||||||||
5.25%, 06/27/2029(e)(l)(p) | 2,103 | 84,330 | ||||||||||
|
| |||||||||||
| 306,143 | ||||||||||||
|
| |||||||||||
Communications - Media – 0.0% | ||||||||||||
Globo Comunicacao e Participacoes SA | 996 | 886,440 | ||||||||||
|
| |||||||||||
Communications - Telecommunications – 0.1% | ||||||||||||
Digicel Group One Ltd. | 1,338 | 793,480 | ||||||||||
Digicel Group Two Ltd. | 1,456 | 43,789 | ||||||||||
Digicel Ltd. | 700 | 406,875 | ||||||||||
MTN Mauritius Investments Ltd. | 701 | 684,351 | ||||||||||
Network i2i Ltd. | 810 | 726,975 | ||||||||||
Sable International Finance Ltd. | 2,638 | 2,641,192 | ||||||||||
VF Ukraine PAT via VFU Funding PLC | 1,020 | 933,300 | ||||||||||
|
| |||||||||||
| 6,229,962 | ||||||||||||
|
| |||||||||||
Consumer Cyclical - Other – 0.1% | ||||||||||||
Melco Resorts Finance Ltd. | 200 | 188,000 | ||||||||||
5.625%, 07/17/2027(e) | 2,333 | 2,263,010 | ||||||||||
MGM China Holdings Ltd. | 569 | 554,064 | ||||||||||
5.875%, 05/15/2026(e) | 598 | 580,807 | ||||||||||
|
| |||||||||||
| 3,585,881 | ||||||||||||
|
| |||||||||||
| 66 | AB INCOME FUND | abfunds.com | |
PORTFOLIO OF INVESTMENTS (continued)
| Principal Amount (000) | U.S. $ Value | |||||||||||
|
| |||||||||||
Consumer Non-Cyclical – 0.3% | ||||||||||||
BRF GmbH | U.S.$ | 945 | $ | 817,112 | ||||||||
BRF SA | 4,401 | 3,812,504 | ||||||||||
Cosan Ltd. | 437 | 381,718 | ||||||||||
Inretail Pharma SA | 2,434 | 2,449,973 | ||||||||||
Minerva Luxembourg SA | 261 | 253,170 | ||||||||||
Tonon Luxembourg SA | 863 | 25,965 | ||||||||||
Turkiye Sise ve Cam Fabrikalari AS | 2,655 | 2,560,416 | ||||||||||
Virgolino de Oliveira Finance SA | 4,738 | 40,747 | ||||||||||
10.875%, 01/13/2020(k)(l)(n) | 750 | 191,460 | ||||||||||
11.75%, 02/09/2022(l)(n)(p) | 1,690 | 15,883 | ||||||||||
|
| |||||||||||
| 10,548,948 | ||||||||||||
|
| |||||||||||
Energy – 0.3% | ||||||||||||
Geopark Ltd. | 410 | 257,019 | ||||||||||
6.50%, 09/21/2024(e) | 2,178 | 1,549,865 | ||||||||||
Medco Oak Tree Pte Ltd. | 1,031 | 628,910 | ||||||||||
Medco Platinum Road Pte Ltd. | 1,532 | 949,840 | ||||||||||
MV24 Capital BV | 1,767 | 1,490,370 | ||||||||||
Petrobras Global Finance BV | 7,273 | 6,981,762 | ||||||||||
|
| |||||||||||
| 11,857,766 | ||||||||||||
|
| |||||||||||
Transportation - Services – 0.0% | ||||||||||||
Rumo Luxembourg SARL | 1,250 | 1,282,813 | ||||||||||
|
| |||||||||||
| 46,682,218 | ||||||||||||
|
| |||||||||||
Utility – 0.2% | ||||||||||||
Electric – 0.2% | ||||||||||||
AES Gener SA | 1,816 | 1,707,040 | ||||||||||
Cemig Geracao e Transmissao SA | 2,251 | 2,345,542 | ||||||||||
| abfunds.com | AB INCOME FUND | 67 | |
PORTFOLIO OF INVESTMENTS (continued)
| Principal Amount (000) | U.S. $ Value | |||||||||||
|
| |||||||||||
Centrais Eletricas Brasileiras SA | U.S.$ | 936 | $ | 850,163 | ||||||||
4.625%, 02/04/2030(e) | 568 | 484,575 | ||||||||||
Light Servicos de Eletricidade SA/Light Energia SA | 1,396 | 1,283,011 | ||||||||||
Star Energy Geothermal Wayang Windu Ltd. | 839 | 778,149 | ||||||||||
Terraform Global Operating LLC | 638 | 633,764 | ||||||||||
|
| |||||||||||
| 8,082,244 | ||||||||||||
|
| |||||||||||
Financial Institutions – 0.0% | ||||||||||||
Banking – 0.0% | ||||||||||||
Fidelity Bank PLC | 575 | 532,414 | ||||||||||
|
| |||||||||||
Total Emerging Markets – Corporate Bonds | 55,296,876 | |||||||||||
|
| |||||||||||
AGENCIES – 1.1% | ||||||||||||
Agency Debentures – 1.1% | ||||||||||||
Federal Home Loan Banks | 8,695 | 13,636,803 | ||||||||||
Federal Home Loan Mortgage Corp. | 10,400 | 16,436,368 | ||||||||||
Series GDIF | 4,606 | 6,898,821 | ||||||||||
6.75%, 03/15/2031 | 4,000 | 6,291,640 | ||||||||||
Residual Funding Corp. Principal Strip Zero Coupon, 07/15/2020 | 5,277 | 5,272,884 | ||||||||||
|
| |||||||||||
Total Agencies | 48,536,516 | |||||||||||
|
| |||||||||||
GOVERNMENTS – SOVEREIGN | ||||||||||||
Israel – 0.2% | ||||||||||||
Israel Government International Bond | 7,916 | 8,304,379 | ||||||||||
|
| |||||||||||
Mexico – 0.1% | ||||||||||||
Mexico Government International Bond | 1,205 | 1,216,447 | ||||||||||
4.75%, 04/27/2032 | 2,706 | 2,724,942 | ||||||||||
|
| |||||||||||
| 3,941,389 | ||||||||||||
|
| |||||||||||
| 68 | AB INCOME FUND | abfunds.com | |
PORTFOLIO OF INVESTMENTS (continued)
| Principal Amount (000) | U.S. $ Value | |||||||||||
|
| |||||||||||
Peru – 0.0% | ||||||||||||
Peruvian Government International Bond | U.S.$ | 247 | $ | 250,705 | ||||||||
2.783%, 01/23/2031 | 719 | 740,570 | ||||||||||
|
| |||||||||||
| 991,275 | ||||||||||||
|
| |||||||||||
Qatar – 0.2% | ||||||||||||
Qatar Government International Bond | 4,399 | 4,647,818 | ||||||||||
3.40%, 04/16/2025(e) | 1,074 | 1,142,803 | ||||||||||
3.75%, 04/16/2030(e) | 1,810 | 1,979,688 | ||||||||||
3.875%, 04/23/2023(e) | 861 | 913,736 | ||||||||||
|
| |||||||||||
| 8,684,045 | ||||||||||||
|
| |||||||||||
Saudi Arabia – 0.2% | ||||||||||||
Saudi Government International Bond | 3,031 | 3,070,391 | ||||||||||
3.25%, 10/22/2030(e) | 3,774 | 3,817,401 | ||||||||||
|
| |||||||||||
| 6,887,792 | ||||||||||||
|
| |||||||||||
United Arab Emirates – 0.2% | ||||||||||||
Abu Dhabi Government International Bond | 2,587 | 2,658,134 | ||||||||||
3.125%, 04/16/2030(e) | 4,640 | 4,918,362 | ||||||||||
|
| |||||||||||
| 7,576,496 | ||||||||||||
|
| |||||||||||
Total Governments – Sovereign Bonds | 36,385,376 | |||||||||||
|
| |||||||||||
LOCAL GOVERNMENTS –PROVINCIAL BONDS – 0.7% | ||||||||||||
Canada – 0.7% | ||||||||||||
Province of Alberta Canada | CAD | 5,934 | 4,638,065 | |||||||||
Province of British Columbia Canada | 3,539 | 3,412,512 | ||||||||||
Province of Quebec Canada | 12,134 | 12,386,191 | ||||||||||
Province of Saskatchewan Canada | 12,746 | 9,981,978 | ||||||||||
|
| |||||||||||
Total Local Governments – Provincial Bonds | 30,418,746 | |||||||||||
|
| |||||||||||
QUASI-SOVEREIGNS – 0.7% | ||||||||||||
Quasi-Sovereign Bonds – 0.7% | ||||||||||||
Bahrain – 0.1% | ||||||||||||
Oil and Gas Holding Co. BSCC (The) | U.S.$ | 668 | 644,620 | |||||||||
| abfunds.com | AB INCOME FUND | 69 | |
PORTFOLIO OF INVESTMENTS (continued)
| Principal Amount (000) | U.S. $ Value | |||||||||||
|
| |||||||||||
8.375%, 11/07/2028(e) | U.S.$ | 3,912 | $ | 3,793,417 | ||||||||
|
| |||||||||||
| 4,438,037 | ||||||||||||
|
| |||||||||||
Chile – 0.0% | ||||||||||||
Corp. Nacional del Cobre de Chile | 212 | 215,453 | ||||||||||
|
| |||||||||||
Indonesia – 0.0% | ||||||||||||
Indonesia Asahan Aluminium Persero PT | 277 | 284,098 | ||||||||||
|
| |||||||||||
Kazakhstan – 0.1% | ||||||||||||
KazMunayGas National Co. JSC | 768 | 760,320 | ||||||||||
5.375%, 04/24/2030(e) | 1,940 | 1,913,325 | ||||||||||
|
| |||||||||||
| 2,673,645 | ||||||||||||
|
| |||||||||||
Malaysia – 0.1% | ||||||||||||
Petronas Capital Ltd. | 3,739 | 3,915,668 | ||||||||||
|
| |||||||||||
Mexico – 0.3% | ||||||||||||
Petroleos Mexicanos | 11,914 | 8,629,310 | ||||||||||
6.49%, 01/23/2027(e) | 1,455 | 1,176,222 | ||||||||||
6.50%, 01/23/2029 | 403 | 316,063 | ||||||||||
6.84%, 01/23/2030(e) | 2,180 | 1,707,894 | ||||||||||
7.69%, 01/23/2050(e) | 2,630 | 1,933,050 | ||||||||||
|
| |||||||||||
| 13,762,539 | ||||||||||||
|
| |||||||||||
Panama – 0.0% | ||||||||||||
Aeropuerto Internacional de Tocumen SA | 1,017 | 1,034,798 | ||||||||||
|
| |||||||||||
Ukraine – 0.1% | ||||||||||||
NAK Naftogaz Ukraine via Kondor Finance PLC | 2,168 | 1,831,960 | ||||||||||
|
| |||||||||||
United States – 0.0% | ||||||||||||
Citgo Holding, Inc. | 737 | 662,821 | ||||||||||
|
| |||||||||||
Total Quasi-Sovereigns | 28,819,019 | |||||||||||
|
| |||||||||||
| 70 | AB INCOME FUND | abfunds.com | |
PORTFOLIO OF INVESTMENTS (continued)
| Principal Amount (000) | U.S. $ Value | |||||||||||
|
| |||||||||||
EMERGING MARKETS – | ||||||||||||
Argentina – 0.0% | ||||||||||||
Argentine Bonos del Tesoro | ARS | 2 | $ | 12 | ||||||||
|
| |||||||||||
Brazil – 0.2% | ||||||||||||
Brazil Notas do Tesouro Nacional | BRL | 47,870 | 10,041,437 | |||||||||
|
| |||||||||||
Dominican Republic – 0.1% | ||||||||||||
Dominican Republic International Bond 16.95%, 02/04/2022(e) | DOP | 149,900 | 3,020,741 | |||||||||
|
| |||||||||||
South Africa – 0.2% | ||||||||||||
Republic of South Africa Government Bond Series 2023 7.75%, 02/28/2023 | ZAR | 110,304 | 6,280,701 | |||||||||
|
| |||||||||||
Total Emerging Markets – Treasuries | 19,342,891 | |||||||||||
|
| |||||||||||
| Shares | ||||||||||||
COMMON STOCKS – 0.1% | ||||||||||||
Energy – 0.1% | ||||||||||||
Oil, Gas & Consumable Fuels – 0.1% | ||||||||||||
Berry Petroleum Corp. | 137,884 | 472,942 | ||||||||||
Golden Energy Offshore Services AS(i)(l) | 1,497,659 | 185,653 | ||||||||||
Paragon Litigation – Class A(h)(i) | 10,360 | 1,036 | ||||||||||
Paragon Litigation – Class B(h)(i) | 15,538 | 163,149 | ||||||||||
Tervita Corp.(l) | 116,270 | 266,462 | ||||||||||
Vantage Drilling International(i)(l) | 15,207 | 98,846 | ||||||||||
|
| |||||||||||
| 1,188,088 | ||||||||||||
|
| |||||||||||
Information Technology – 0.0% | ||||||||||||
IT Services – 0.0% | ||||||||||||
Paysafe Group Ltd.(h)(i)(j) | 3,109 | 218,158 | ||||||||||
|
| |||||||||||
Software – 0.0% | ||||||||||||
Avaya Holdings Corp.(l) | 34,533 | 343,258 | ||||||||||
Monitronics International, Inc.(h)(i)(j)(l) | 68,348 | 368,757 | ||||||||||
|
| |||||||||||
| 712,015 | ||||||||||||
|
| |||||||||||
| 930,173 | ||||||||||||
|
| |||||||||||
Consumer Discretionary – 0.0% | ||||||||||||
Auto Components – 0.0% | ||||||||||||
ATD New Holdings, Inc.(h)(i)(l) | 29,486 | 434,919 | ||||||||||
Exide Technologies(h)(i)(j)(l) | 429,159 | – 0 | – | |||||||||
|
| |||||||||||
| 434,919 | ||||||||||||
|
| |||||||||||
| abfunds.com | AB INCOME FUND | 71 | |
PORTFOLIO OF INVESTMENTS (continued)
| Company | Shares | U.S. $ Value | ||||||||||
|
| |||||||||||
Media – 0.0% | ||||||||||||
Ion Media Networks, Inc. – Class A(h)(i)(j)(l) | 2,512 | $ | 276,948 | |||||||||
|
| |||||||||||
| 711,867 | ||||||||||||
|
| |||||||||||
Consumer Staples – 0.0% | ||||||||||||
Food & Staples Retailing – 0.0% | ||||||||||||
Southeastern Grocers, Inc. Npv(h)(i)(j)(l) | 16,421 | 541,893 | ||||||||||
|
| |||||||||||
Communication Services – 0.0% | ||||||||||||
Media – 0.0% | ||||||||||||
Clear Channel Outdoor Holdings, Inc.(l) | 33,826 | 32,635 | ||||||||||
iHeartMedia, Inc. – Class A(i)(l) | 1,690 | 11,864 | ||||||||||
|
| |||||||||||
| 44,499 | ||||||||||||
|
| |||||||||||
Industrials – 0.0% | ||||||||||||
Consumer Cyclical - | ||||||||||||
Exide Technologies(h)(i)(j)(l) | 156,301 | – 0 | – | |||||||||
Exide Technologies/Old(h)(i)(j)(l) | 45,970 | – 0 | – | |||||||||
|
| |||||||||||
| – 0 | – | |||||||||||
|
| |||||||||||
Total Common Stocks | 3,416,520 | |||||||||||
|
| |||||||||||
| Principal Amount (000) | ||||||||||||
LOCAL GOVERNMENTS – US MUNICIPAL BONDS – 0.1% | ||||||||||||
United States – 0.1% | ||||||||||||
Texas Transportation Commission State Highway Fund | U.S.$ | 2,560 | 3,189,248 | |||||||||
|
| |||||||||||
| Shares | ||||||||||||
PREFERRED STOCKS – 0.0% | ||||||||||||
Financial Institutions – 0.0% | ||||||||||||
Banking – 0.0% | ||||||||||||
Paysafe Holdings UK Ltd. | 867,323 | 867,323 | ||||||||||
|
| |||||||||||
WHOLE LOAN TRUSTS – 0.0% | ||||||||||||
Performing Asset – 0.0% | ||||||||||||
Sheridan Auto Loan Holdings I LLC | 1,728 | 160,414 | ||||||||||
| 72 | AB INCOME FUND | abfunds.com | |
PORTFOLIO OF INVESTMENTS (continued)
| Company | Shares | U.S. $ Value | ||||||||||
|
| |||||||||||
Sheridan Consumer Finance Trust | 0 | ** | $ | 50 | ||||||||
|
| |||||||||||
Total Whole Loan Trusts | 160,464 | |||||||||||
|
| |||||||||||
WARRANTS – 0.0% | ||||||||||||
Avaya Holdings Corp., expiring 12/15/2022(l) | 2,936 | 1,027 | ||||||||||
Encore Automotive Acceptance, expiring 07/05/2031(h)(i)(j)(l) | 12 | – 0 | – | |||||||||
Flexpath Capital, Inc., expiring | 17,195 | – 0 | – | |||||||||
iHeartMedia, Inc., expiring 05/01/2039(i)(l) | 12,695 | 77,757 | ||||||||||
SandRidge Energy, Inc., A-CW22, expiring 10/04/2022(i)(l) | 2,475 | 14 | ||||||||||
SandRidge Energy, Inc., B-CW22, expiring 10/04/2022(i)(l) | 1,042 | 31 | ||||||||||
|
| |||||||||||
Total Warrants | 78,829 | |||||||||||
|
| |||||||||||
SHORT-TERM INVESTMENTS – 0.3% | ||||||||||||
Investment Companies – 0.3% | ||||||||||||
AB Fixed Income Shares, Inc. – Government Money Market Portfolio – Class AB, 0.35%(u)(v)(w) (cost $12,564,213) | 12,564,213 | 12,564,213 | ||||||||||
|
| |||||||||||
Total Investments – 131.2% | 5,519,543,295 | |||||||||||
Other assets less liabilities – (31.2)% | (1,312,543,918 | ) | ||||||||||
|
| |||||||||||
Net Assets – 100.0% | $ | 4,206,999,377 | ||||||||||
|
| |||||||||||
| abfunds.com | AB INCOME FUND | 73 | |
PORTFOLIO OF INVESTMENTS (continued)
FUTURES (see Note D)
| Description | Number of Contracts | Expiration Month | Current Notional | Value and Unrealized Appreciation/ (Depreciation) | ||||||||||||
Purchased Contracts |
| |||||||||||||||
Euro-BOBL Futures | 9 | June 2020 | $ | 1,343,894 | $ | (3,067 | ) | |||||||||
U.S. T-Note 10 Yr (CBT) Futures | 4,138 | June 2020 | 557,828,507 | 17,612,118 | ||||||||||||
| Sold Contracts |
| |||||||||||||||
Euro Buxl 30 Yr Bond Futures | 75 | June 2020 | 17,972,511 | (43,256 | ) | |||||||||||
Euro-Bund Futures | 65 | June 2020 | 12,445,921 | 21,234 | ||||||||||||
Euro-Schatz Futures | 651 | June 2020 | 80,213,788 | 102,751 | ||||||||||||
Long Gilt Futures | 303 | June 2020 | 51,340,156 | (1,210,079 | ) | |||||||||||
U.S. 10 Yr Ultra Futures | 181 | June 2020 | 26,422,922 | (1,999,734 | ) | |||||||||||
U.S. T-Note 2 Yr (CBT) Futures | 1,111 | June 2020 | 242,860,055 | (2,037,329 | ) | |||||||||||
Us Ultra Bond(CBT) Futures | 38 | June 2020 | 7,569,725 | (971,963 | ) | |||||||||||
|
| |||||||||||||||
| $ | 11,470,675 | |||||||||||||||
|
| |||||||||||||||
FORWARD CURRENCY EXCHANGE CONTRACTS (see Note D)
| Counterparty | Contracts to Deliver (000) | In Exchange For (000) | Settlement Date | Unrealized Appreciation/ (Depreciation) | ||||||||||||
Bank of America, NA | CAD | 43,048 | USD | 29,986 | 05/22/2020 | $ | (940,888 | ) | ||||||||
Citibank, NA | EUR | 12,964 | USD | 14,172 | 06/10/2020 | (44,808 | ) | |||||||||
Deutsche Bank AG | BRL | 61,115 | USD | 12,220 | 05/05/2020 | 981,722 | ||||||||||
Deutsche Bank AG | USD | 11,261 | BRL | 61,115 | 05/05/2020 | (22,573 | ) | |||||||||
Goldman Sachs Bank USA | RUB | 2,808,480 | USD | 38,676 | 05/20/2020 | 964,660 | ||||||||||
Goldman Sachs Bank USA | MXN | 670,322 | USD | 27,231 | 06/19/2020 | (382,045 | ) | |||||||||
JPMorgan Chase Bank, NA | GBP | 8,710 | USD | 11,202 | 05/15/2020 | 231,927 | ||||||||||
Morgan Stanley Capital Services, Inc. | IDR | 263,888,746 | USD | 17,410 | 05/05/2020 | (330,065 | ) | |||||||||
Morgan Stanley Capital Services, Inc. | IDR | 263,888,746 | USD | 16,493 | 07/23/2020 | (618,474 | ) | |||||||||
Morgan Stanley Capital Services, Inc. | USD | 16,883 | IDR | 263,888,746 | 05/05/2020 | 856,943 | ||||||||||
Standard Chartered Bank | IDR | 840,124,885 | USD | 60,932 | 05/05/2020 | 4,452,615 | ||||||||||
Standard Chartered Bank | USD | 55,428 | IDR | 840,124,885 | 05/05/2020 | 1,050,806 | ||||||||||
State Street Bank & Trust Co. | ZAR | 96,433 | USD | 5,128 | 05/15/2020 | (68,242 | ) | |||||||||
State Street Bank & Trust Co. | EUR | 778 | USD | 843 | 06/10/2020 | (10,478 | ) | |||||||||
State Street Bank & Trust Co. | USD | 1,154 | IDR | 17,306,877 | 05/05/2020 | 9,465 | ||||||||||
State Street Bank & Trust Co. | USD | 38,822 | IDR | 558,929,262 | 05/05/2020 | (1,247,052 | ) | |||||||||
UBS AG | BRL | 61,115 | USD | 11,261 | 05/05/2020 | 22,573 | ||||||||||
UBS AG | BRL | 61,115 | USD | 10,831 | 06/02/2020 | (380,180 | ) | |||||||||
UBS AG | EUR | 61,068 | USD | 66,056 | 06/10/2020 | (912,599 | ) | |||||||||
UBS AG | USD | 10,855 | BRL | 61,115 | 05/05/2020 | 383,474 | ||||||||||
|
| |||||||||||||||
| $ | 3,996,781 | |||||||||||||||
|
| |||||||||||||||
| 74 | AB INCOME FUND | abfunds.com | |
PORTFOLIO OF INVESTMENTS (continued)
CENTRALLY CLEARED CREDIT DEFAULT SWAPS (see Note D)
Description | Fixed Rate (Pay)/ Receive | Payment Frequency | Implied Credit Spread at April 30, 2020 | Notional Amount (000) | Market Value | Upfront Premiums Paid/ (Received) | Unrealized Appreciation/ (Depreciation) | |||||||||||||||||||||||||
Buy Contracts |
| |||||||||||||||||||||||||||||||
CDX-NAHY Series 33, 5 Year Index, 12/20/2024* | 1.00 | % | Quarterly | 6.61 | % | USD | 5,716 | $ | 300,918 | $ | 334,263 | $ | (33,345 | ) | ||||||||||||||||||
CDX-NAHY Series 33, 5 Year Index, 12/20/2024* | (5.00 | ) | Quarterly | 6.61 | USD | 6,843 | 376,235 | 410,600 | (34,365 | ) | ||||||||||||||||||||||
CDX-NAHY Series 34, 5 Year Index, 06/20/2025* | (5.00 | ) | Quarterly | 6.31 | USD | 9,347 | 451,515 | 567,394 | (115,879 | ) | ||||||||||||||||||||||
iTraxx -Xover Series 32, 5 Year Index, 12/20/2024* | (5.00 | ) | Quarterly | 4.73 | EUR | 2,500 | (45,371 | ) | 16,420 | (61,791 | ) | |||||||||||||||||||||
Sale Contracts |
| |||||||||||||||||||||||||||||||
CDX-NAHY Series 33, 5 Year Index, 12/20/2024* | 5.00 | Quarterly | 6.61 | USD | 1,284 | (70,582 | ) | 113,389 | (183,971 | ) | ||||||||||||||||||||||
CDX-NAHY Series 33, 5 Year Index, 12/20/2024* | 5.00 | Quarterly | 6.61 | USD | 208,969 | (11,515,289 | ) | (5,489,590 | ) | (6,025,699 | ) | |||||||||||||||||||||
CDX-NAHY Series 34, 5 Year Index, 06/20/2025* | 5.00 | Quarterly | 6.31 | USD | 5,323 | (248,407 | ) | (279,458 | ) | 31,051 | ||||||||||||||||||||||
CDX-NAHY Series 34, 5 Year Index, 06/20/2025* | 5.00 | Quarterly | 6.31 | USD | 6,387 | (308,530 | ) | (345,058 | ) | 36,528 | ||||||||||||||||||||||
iTraxx -Xover Series 32, 5 Year Index, 12/20/2024* | 5.00 | Quarterly | 4.73 | EUR | 2,500 | 45,156 | 347,065 | (301,909 | ) | |||||||||||||||||||||||
iTraxx -Xover Series 33, 5 Year Index, 06/20/2025* | 5.00 | Quarterly | 4.91 | EUR | 123,710 | 1,292,292 | (1,657,625 | ) | 2,949,917 | |||||||||||||||||||||||
Republic of Colombia, 10.375%, 01/28/33, 06/20/2025* | 1.00 | Quarterly | 2.41 | USD | 5,872 | (392,570 | ) | (363,238 | ) | (29,332 | ) | |||||||||||||||||||||
Republic of South Africa, 5.875%, 09/16/2025, 06/20/2025* | 1.00 | Quarterly | 4.17 | USD | 6,075 | (868,769 | ) | (829,994 | ) | (38,775 | ) | |||||||||||||||||||||
| abfunds.com | AB INCOME FUND | 75 | |
PORTFOLIO OF INVESTMENTS (continued)
Description | Fixed Rate (Pay)/ Receive | Payment Frequency | Implied Credit Spread at April 30, 2020 | Notional Amount (000) | Market Value | Upfront Premiums Paid/ (Received) | Unrealized Appreciation/ (Depreciation) | |||||||||||||||||||||||||
Republic of Turkey, 11.875%, 01/15/2030, 12/20/2024* | 1.00 | % | Quarterly | 5.87 | % | USD | 2 | $ | (379 | ) | $ | (225 | ) | $ | (154 | ) | ||||||||||||||||
Russian Federation, 7.50%, 03/31/2030, 6/20/2025* | 1.00 | Quarterly | 1.68 | USD | 5,872 | (191,320 | ) | (282,197 | ) | 90,877 | ||||||||||||||||||||||
|
|
|
|
|
| |||||||||||||||||||||||||||
| $ | (11,175,101 | ) | $ | (7,458,254 | ) | $ | (3,716,847 | ) | ||||||||||||||||||||||||
|
|
|
|
|
| |||||||||||||||||||||||||||
| * | Termination date |
CENTRALLY CLEARED INTEREST RATE SWAPS (see Note D)
| Rate Type | ||||||||||||||||||||||||||||||||
Notional (000) | Termination Date | Payments made by the Fund | Payments received by the Fund | Payment Frequency Paid/ Received | Market Value | Upfront Premiums Paid/ (Received) | Unrealized Appreciation/ (Depreciation) | |||||||||||||||||||||||||
| USD | 109,350 | 04/20/2023 | 2.850% | | 3 Month LIBOR | | | Semi- Annual/ Quarterly |
| $ | (8,137,727 | ) | $ | – 0 | – | $ | (8,137,727 | ) | ||||||||||||||
| USD | 46,860 | 04/02/2024 | 2.851% | | 3 Month LIBOR | | | Semi- Annual/ Quarterly |
| (4,563,710 | ) | – 0 | – | (4,563,710 | ) | |||||||||||||||||
| USD | 30,755 | 02/10/2025 | 2.034% | | 3 Month LIBOR | | | Semi- Annual/ Quarterly |
| (2,422,801 | ) | – 0 | – | (2,422,801 | ) | |||||||||||||||||
| USD | 6,010 | 06/09/2025 | 2.491% | | 3 Month LIBOR | | | Semi- Annual/ Quarterly |
| (685,479 | ) | – 0 | – | (685,479 | ) | |||||||||||||||||
| USD | 10,000 | 01/11/2027 | 2.285% | | 3 Month LIBOR | | | Semi- Annual/ Quarterly |
| (1,239,533 | ) | – 0 | – | (1,239,533 | ) | |||||||||||||||||
| USD | 11,920 | 04/26/2027 | 2.287% | | 3 Month LIBOR | | | Semi- Annual/ Quarterly |
| (1,462,851 | ) | – 0 | – | (1,462,851 | ) | |||||||||||||||||
|
|
|
|
|
| |||||||||||||||||||||||||||
| $ | (18,512,101 | ) | $ | – 0 | – | $ | (18,512,101 | ) | ||||||||||||||||||||||||
|
|
|
|
|
| |||||||||||||||||||||||||||
| 76 | AB INCOME FUND | abfunds.com | |
PORTFOLIO OF INVESTMENTS (continued)
CREDIT DEFAULT SWAPS (see Note D)
| Swap Counterparty & Referenced Obligation | Fixed Rate (Pay)/ Receive | Payment Frequency | Implied Credit Spread at April 30, 2020 | Notional Amount (000) | Market Value | Upfront Premiums Paid/ (Received) | Unrealized Appreciation/ (Depreciation) | |||||||||||||||||||||||||
Sale Contracts | ||||||||||||||||||||||||||||||||
Barclays Bank PLC | ||||||||||||||||||||||||||||||||
CDX-CMBX.NA.BB Series 6, 05/11/2063* | 5.00 | % | Monthly | 25.00 | % | USD | 5,000 | $ | (2,575,334 | ) | $ | (123,822 | ) | $ | (2,451,512 | ) | ||||||||||||||||
Citigroup Global Markets, Inc. |
| |||||||||||||||||||||||||||||||
BondABS.Towd, 2.750%, 04/25/2057* | 0.45 | Monthly | 0.45 | USD | 10,441 | (260,793 | ) | – 0 | – | (260,793 | ) | |||||||||||||||||||||
CDX-CMBX.NA.BB Series 6, 05/11/2063* | 5.00 | Monthly | 25.00 | USD | 4,000 | (2,060,267 | ) | (611,820 | ) | (1,448,447 | ) | |||||||||||||||||||||
CDX-CMBX.NA.BBB- Series 6, 05/11/2063* | 3.00 | Monthly | 13.94 | USD | 14,347 | (4,662,775 | ) | (894,432 | ) | (3,768,343 | ) | |||||||||||||||||||||
CDX-CMBX.NA.BBB- Series 6, 05/11/2063* | 3.00 | Monthly | 13.94 | USD | 9,564 | (3,108,300 | ) | (600,590 | ) | (2,507,710 | ) | |||||||||||||||||||||
CDX-CMBX.NA.BBB- Series 6, 05/11/2063* | 3.00 | Monthly | 13.94 | USD | 13,543 | (4,401,475 | ) | (1,163,892 | ) | (3,237,583 | ) | |||||||||||||||||||||
CDX-CMBX.NA.BBB- Series 6, 05/11/2063* | 3.00 | Monthly | 13.94 | USD | 9,029 | (2,934,426 | ) | (779,876 | ) | (2,154,550 | ) | |||||||||||||||||||||
CDX-CMBX.NA.BBB- Series 6, 05/11/2063* | 3.00 | Monthly | 20.78 | USD | 2,227 | (724,146 | ) | (556,219 | ) | (167,927 | ) | |||||||||||||||||||||
CDX-CMBX.NA.BBB- Series 6, 05/11/2063* | 3.00 | Monthly | 20.78 | USD | 2,969 | (965,420 | ) | (734,127 | ) | (231,293 | ) | |||||||||||||||||||||
CDX-CMBX.NA.BBB- Series 6, 05/11/2063* | 3.00 | Monthly | 20.78 | USD | 1,187 | (385,973 | ) | (320,184 | ) | (65,789 | ) | |||||||||||||||||||||
CDX-CMBX.NA.BBB- Series 6, 05/11/2063* | 3.00 | Monthly | 20.78 | USD | 2,227 | (724,146 | ) | (550,657 | ) | (173,489 | ) | |||||||||||||||||||||
CDX-CMBX.NA.BBB- Series 6, 05/11/2063* | 3.00 | Monthly | 13.94 | USD | 1,529 | (496,925 | ) | (155,457 | ) | (341,468 | ) | |||||||||||||||||||||
CDX-CMBX.NA.BBB- Series 6, 05/11/2063* | 3.00 | Monthly | 13.94 | USD | 5,300 | (1,722,500 | ) | (332,081 | ) | (1,390,419 | ) | |||||||||||||||||||||
CDX-CMBX.NA.BBB- Series 6, 05/11/2063* | 3.00 | Monthly | 13.94 | USD | 9,557 | (3,106,025 | ) | (966,094 | ) | (2,139,931 | ) | |||||||||||||||||||||
CDX-CMBX.NA.BBB- Series 6, 05/11/2063* | 3.00 | Monthly | 13.94 | USD | 9,557 | (3,106,025 | ) | (956,371 | ) | (2,149,654 | ) | |||||||||||||||||||||
CDX-CMBX.NA.BBB- Series 6, 05/11/2063* | 3.00 | Monthly | 13.94 | USD | 9,557 | (3,106,025 | ) | (956,371 | ) | (2,149,654 | ) | |||||||||||||||||||||
CDX-CMBX.NA.BBB- Series 6, 05/11/2063* | 3.00 | Monthly | 13.94 | USD | 3,250 | (1,056,250 | ) | (335,806 | ) | (720,444 | ) | |||||||||||||||||||||
CDX-CMBX.NA.BBB- Series 6, 05/11/2063* | 3.00 | Monthly | 13.94 | USD | 13,500 | (4,387,500 | ) | (1,195,142 | ) | (3,192,358 | ) | |||||||||||||||||||||
CDX-CMBX.NA.BBB- Series 6, 05/11/2063* | 3.00 | Monthly | 13.94 | USD | 660 | (214,500 | ) | (56,123 | ) | (158,377 | ) | |||||||||||||||||||||
CDX-CMBX.NA.BBB- Series 6, 05/11/2063* | 3.00 | Monthly | 13.94 | USD | 643 | (209,029 | ) | (72,697 | ) | (136,332 | ) | |||||||||||||||||||||
| abfunds.com | AB INCOME FUND | 77 | |
PORTFOLIO OF INVESTMENTS (continued)
| Swap Counterparty & Referenced Obligation | Fixed Rate (Pay)/ Receive | Payment Frequency | Implied Credit Spread at April 30, 2020 | Notional Amount (000) | Market Value | Upfront Premiums Paid/ (Received) | Unrealized Appreciation/ (Depreciation) | |||||||||||||||||||||||||
CDX-CMBX.NA.BBB- Series 6, 05/11/2063* | 3.00 | % | Monthly | 13.94 | % | USD | 19,075 | $ | (6,200,964 | ) | $ | (2,050,200 | ) | $ | (4,150,764 | ) | ||||||||||||||||
CDX-CMBX.NA.BBB- Series 6, 05/11/2063* | 3.00 | Monthly | 13.94 | USD | 12,000 | (3,901,001 | ) | (1,521,514 | ) | (2,379,487 | ) | |||||||||||||||||||||
CDX-CMBX.NA.BBB- Series 6, 05/11/2063* | 3.00 | Monthly | 13.94 | USD | 5,000 | (1,625,000 | ) | (512,592 | ) | (1,112,408 | ) | |||||||||||||||||||||
CDX-CMBX.NA.BBB- Series 6, 05/11/2063* | 3.00 | Monthly | 13.94 | USD | 5,000 | (1,625,000 | ) | (505,177 | ) | (1,119,823 | ) | |||||||||||||||||||||
CDX-CMBX.NA.BBB- Series 6, 05/11/2063* | 3.00 | Monthly | 13.94 | USD | 5,000 | (1,625,000 | ) | (608,147 | ) | (1,016,853 | ) | |||||||||||||||||||||
CDX-CMBX.NA.BBB- Series 6, 05/11/2063* | 3.00 | Monthly | 13.94 | USD | 162 | (52,732 | ) | (10,240 | ) | (42,492 | ) | |||||||||||||||||||||
CDX-CMBX.NA.BBB- Series 6, 05/11/2063* | 3.00 | Monthly | 13.94 | USD | 25,200 | (8,190,000 | ) | (1,654,271 | ) | (6,535,729 | ) | |||||||||||||||||||||
CDX-CMBX.NA.BBB- Series 6, 05/11/2063* | 3.00 | Monthly | 13.94 | USD | 1,146 | (372,450 | ) | (183,083 | ) | (189,367 | ) | |||||||||||||||||||||
Credit Suisse International |
| |||||||||||||||||||||||||||||||
CDX-CMBX.NA.A Series 6, 05/11/63* | 2.00 | Monthly | 6.85 | USD | 15,000 | (2,118,333 | ) | (423,517 | ) | (1,694,816 | ) | |||||||||||||||||||||
CDX-CMBX.NA.A Series 6, 05/11/63* | 2.00 | Monthly | 6.85 | USD | 1,136 | (160,366 | ) | (45,841 | ) | (114,525 | ) | |||||||||||||||||||||
CDX-CMBX.NA.A Series 6, 05/11/63* | 2.00 | Monthly | 6.85 | USD | 567 | (80,041 | ) | (22,454 | ) | (57,587 | ) | |||||||||||||||||||||
CDX-CMBX.NA.A Series 6, 05/11/63* | 2.00 | Monthly | 6.85 | USD | 2,839 | (400,772 | ) | (112,429 | ) | (288,343 | ) | |||||||||||||||||||||
CDX-CMBX.NA.A Series 6, 05/11/63* | 2.00 | Monthly | 6.85 | USD | 6,500 | (917,583 | ) | (350,907 | ) | (566,676 | ) | |||||||||||||||||||||
CDX-CMBX.NA.BBB- Series 6, 05/11/2063* | 3.00 | Monthly | 13.94 | USD | 763 | (248,039 | ) | (86,378 | ) | (161,661 | ) | |||||||||||||||||||||
CDX-CMBX.NA.BBB- Series 6, 05/11/2063* | 3.00 | Monthly | 13.94 | USD | 9,220 | (2,996,500 | ) | (1,114,614 | ) | (1,881,886 | ) | |||||||||||||||||||||
CDX-CMBX.NA.BBB- Series 6, 05/11/2063* | 3.00 | Monthly | 13.94 | USD | 17,343 | (5,637,920 | ) | (2,148,359 | ) | (3,489,561 | ) | |||||||||||||||||||||
Deutsche Bank AG | ||||||||||||||||||||||||||||||||
CDX-CMBX.NA.A Series 6, 05/11/63* | 2.00 | Monthly | 6.85 | USD | 23,700 | (3,345,650 | ) | (1,037,900 | ) | (2,307,750 | ) | |||||||||||||||||||||
CDX-CMBX.NA.BBB- Series 6, 05/11/2063* | 3.00 | Monthly | 13.94 | USD | 10,000 | (3,250,000 | ) | (1,584,360 | ) | (1,665,640 | ) | |||||||||||||||||||||
CDX-CMBX.NA.BBB- Series 6, 05/11/2063* | 3.00 | Monthly | 13.94 | USD | 20,000 | (6,500,000 | ) | (2,888,303 | ) | (3,611,697 | ) | |||||||||||||||||||||
Goldman Sachs International |
| |||||||||||||||||||||||||||||||
CDX-CMBX.NA.BB Series 6, 05/11/2063* | 5.00 | Monthly | 25.00 | USD | 16,500 | (8,498,600 | ) | (3,727,639 | ) | (4,770,961 | ) | |||||||||||||||||||||
CDX-CMBX.NA.BBB- Series 6, 05/11/2063* | 3.00 | Monthly | 13.94 | USD | 9,029 | (2,934,425 | ) | (776,152 | ) | (2,158,273 | ) | |||||||||||||||||||||
CDX-CMBX.NA.BBB- Series 6, 05/11/2063* | 3.00 | Monthly | 13.94 | USD | 13,000 | (4,225,000 | ) | (1,318,276 | ) | (2,906,724 | ) | |||||||||||||||||||||
CDX-CMBX.NA.BBB- Series 6, 05/11/2063* | 3.00 | Monthly | 13.94 | USD | 2,500 | (812,708 | ) | (158,847 | ) | (653,861 | ) | |||||||||||||||||||||
| 78 | AB INCOME FUND | abfunds.com | |
PORTFOLIO OF INVESTMENTS (continued)
| Swap Counterparty & Referenced Obligation | Fixed Rate (Pay)/ Receive | Payment Frequency | Implied Credit Spread at April 30, 2020 | Notional Amount (000) | Market Value | Upfront Premiums Paid/ (Received) | Unrealized Appreciation/ (Depreciation) | |||||||||||||||||||||||||
CDX-CMBX.NA.BBB- Series 6, 05/11/2063* | 3.00 | % | Monthly | 13.94 | % | USD | 11,909 | $ | (3,871,418 | ) | $ | (1,382,254 | ) | $ | (2,489,164 | ) | ||||||||||||||||
CDX-CMBX.NA.BBB- Series 6, 05/11/2063* | 3.00 | Monthly | 13.94 | USD | 14,291 | (4,645,766 | ) | (1,661,883 | ) | (2,983,883 | ) | |||||||||||||||||||||
CDX-CMBX.NA.BBB- Series 6, 05/11/2063* | 3.00 | Monthly | 13.94 | USD | 32,853 | (10,677,225 | ) | (4,577,024 | ) | (6,100,201 | ) | |||||||||||||||||||||
CDX-CMBX.NA.BBB- Series 6, 05/11/2063* | 3.00 | Monthly | 13.94 | USD | 8,827 | (2,868,775 | ) | (1,451,543 | ) | (1,417,232 | ) | |||||||||||||||||||||
CDX-CMBX.NA.BBB- Series 6, 05/11/2063* | 3.00 | Monthly | 13.94 | USD | 6,323 | (2,054,975 | ) | (1,025,027 | ) | (1,029,948 | ) | |||||||||||||||||||||
JPMorgan Securities LLC |
| |||||||||||||||||||||||||||||||
CDX-CMBX.NA.BB Series 6, 05/11/2063* | 5.00 | Monthly | 25.00 | USD | 3,869 | (1,993,330 | ) | (739,519 | ) | (1,253,811 | ) | |||||||||||||||||||||
CDX-CMBX.NA.BB Series 6, 05/11/2063* | 5.00 | Monthly | 25.00 | USD | 3,748 | (1,930,991 | ) | (726,894 | ) | (1,204,097 | ) | |||||||||||||||||||||
CDX-CMBX.NA.BBB- Series 6, 05/11/2063* | 3.00 | Monthly | 13.94 | USD | 4,514 | (1,467,050 | ) | (387,935 | ) | (1,079,115 | ) | |||||||||||||||||||||
CDX-CMBX.NA.BBB- Series 6, 05/11/2063* | 3.00 | Monthly | 13.94 | USD | 3,000 | (975,000 | ) | (189,329 | ) | (785,671 | ) | |||||||||||||||||||||
CDX-CMBX.NA.BBB- Series 6, 05/11/2063* | 3.00 | Monthly | 13.94 | USD | 9,543 | (3,101,475 | ) | (1,076,442 | ) | (2,025,033 | ) | |||||||||||||||||||||
Morgan Stanley & Co. International PLC | ||||||||||||||||||||||||||||||||
CDX-CMBX.NA.A Series 6, 05/11/63* | 2.00 | Monthly | 6.85 | USD | 293 | (41,369 | ) | (12,027 | ) | (29,342 | ) | |||||||||||||||||||||
CDX-CMBX.NA.BBB- Series 6, 05/11/2063* | 3.00 | Monthly | 13.94 | USD | 547 | (177,775 | ) | (45,590 | ) | (132,185 | ) | |||||||||||||||||||||
Morgan Stanley Capital Services LLC | ||||||||||||||||||||||||||||||||
CDX-CMBX.NA.BBB- Series 6, 05/11/2063* | 3.00 | Monthly | 13.94 | USD | 9,997 | (3,249,025 | ) | (615,651 | ) | (2,633,374 | ) | |||||||||||||||||||||
|
|
|
|
|
| |||||||||||||||||||||||||||
| $ | (142,980,092 | ) | $ | (48,094,079 | ) | $ | (94,886,013 | ) | ||||||||||||||||||||||||
|
|
|
|
|
| |||||||||||||||||||||||||||
| * | Termination date |
REVERSE REPURCHASE AGREEMENTS (see Note D)
| Broker | Principal Amount (000) | Currency | Interest Rate | Maturity | U.S. $ Value at April 30, 2020 | |||||||||||||||
Barclays Capital, Inc.† | 1,580 | USD | (2.50 | )%* | — | $ | 1,586,803 | |||||||||||||
Barclays Capital, Inc.† | 842 | USD | (0.50 | )%* | — | 842,475 | ||||||||||||||
Barclays Capital, Inc.† | 374 | USD | (0.25 | )%* | — | 374,539 | ||||||||||||||
First Boston† | 1,224 | EUR | (1.25 | )%* | — | 1,341,320 | ||||||||||||||
JPMorgan Chase Bank† | 86,400 | USD | 0.11 | % | — | 86,404,032 | ||||||||||||||
|
| |||||||||||||||||||
| $ | 90,549,169 | |||||||||||||||||||
|
| |||||||||||||||||||
| * | Interest payment due from counterparty. |
| † | The reverse repurchase agreement matures on demand. Interest rate resets daily and the rate shown is the rate in effect on April 30, 2020. |
| abfunds.com | AB INCOME FUND | 79 | |
PORTFOLIO OF INVESTMENTS (continued)
The type of underlying collateral and the remaining maturity of open reverse repurchase agreements on the statements of assets and liabilities as follows:
| Overnight and Continuous | Up to 30 Days | 31-90 Days | Greater than 90 Days | Total | ||||||||||||||||
Corporates – Non-Investment Grade | $ | 88,833,310 | $ | – 0 | – | $ | – 0 | – | $ | – 0 | – | $ | 88,833,310 | |||||||
Emerging Markets – Corporate Bonds | 374,539 | – 0 | – | – 0 | – | – 0 | – | 374,539 | ||||||||||||
Government-Treasuries | 1,341,320 | – 0 | – | – 0 | – | – 0 | – | 1,341,320 | ||||||||||||
|
|
|
|
|
|
|
|
|
| |||||||||||
Total | $ | 90,549,169 | $ | – 0 | – | $ | – 0 | – | $ | – 0 | – | $ | 90,549,169 | |||||||
|
|
|
|
|
|
|
|
|
| |||||||||||
| ** | Principle amount less than 500. |
| (a) | Position, or a portion thereof, has been segregated to collateralize OTC derivatives outstanding. |
| (b) | Position, or a portion thereof, has been segregated to collateralize margin requirements for open centrally cleared swaps. |
| (c) | Position, or a portion thereof, has been segregated to collateralize reverse repurchase agreements. |
| (d) | Position, or a portion thereof, has been segregated to collateralize margin requirements for open futures contracts. |
| (e) | Security is exempt from registration under Rule 144A of the Securities Act of 1933. These securities are considered restricted, but liquid and may be resold in transactions exempt from registration, normally to qualified institutional buyers. At April 30, 2020, the aggregate market value of these securities amounted to $1,283,858,423 or 30.5% of net assets. |
| (f) | Securities are perpetual and, thus, do not have a predetermined maturity date. The date shown, if applicable, reflects the next call date. |
| (g) | Floating Rate Security. Stated interest/floor/ceiling rate was in effect at April 30, 2020. |
| (h) | Security in which significant unobservable inputs (Level 3) were used in determining fair value. |
| (i) | Illiquid security. |
| (j) | Fair valued by the Adviser. |
| (k) | Defaulted matured security. |
| (l) | Non-income producing security. |
| (m) | Pay-In-Kind Payments (PIK). The issuer may pay cash interest and/or interest in additional debt securities. Rates shown are the rates in effect at April 30, 2020. |
| (n) | Security is exempt from registration under Rule 144A of the Securities Act of 1933. These securities, which represent 1.13% of net assets as of April 30, 2020, are considered illiquid and restricted. Additional information regarding such securities follows: |
| 144A/Restricted & Illiquid Securities | Acquisition Date | Cost | Market Value | Percentage of Net Assets | ||||||||||||
Apidos CLO | ||||||||||||||||
7.235%, 07/18/2029 | 04/28/2017 | $ | 543,662 | $ | 391,215 | 0.01 | % | |||||||||
BFLD | ||||||||||||||||
3.054%, 10/15/2034 | 10/02/2019 | 11,197,177 | 9,181,693 | 0.22 | % | |||||||||||
| 80 | AB INCOME FUND | abfunds.com | |
PORTFOLIO OF INVESTMENTS (continued)
| 144A/Restricted & Illiquid Securities | Acquisition Date | Cost | Market Value | Percentage of Net Assets | ||||||||||||
CBAM Ltd. | ||||||||||||||||
7.634%, 10/17/2029 | 09/08/2017 | $ | 1,603,575 | $ | 1,007,536 | 0.02 | % | |||||||||
Consumer Loan Underlying Bond Certificate Issuer Trust I Series 2018-20, Class PT | 09/27/2018 | 2,325,284 | 2,064,498 | 0.05 | % | |||||||||||
Consumer Loan Underlying Bond Certificate Issuer Trust I Series 2019-36, Class PT | 09/04/2019 | 1,878,925 | 1,584,012 | 0.04 | % | |||||||||||
Consumer Loan Underlying Bond Certificate Issuer Trust I Series 2019-43, Class PT | 10/09/2019 | 1,500,477 | 1,348,044 | 0.03 | % | |||||||||||
Digicel Group One Ltd. | 01/09/2019 | 1,229,305 | 793,480 | 0.02 | % | |||||||||||
Dryden Senior Loan Fund | 05/23/2017 | 599,866 | 439,302 | 0.01 | % | |||||||||||
Exide International Holdings LP(Superpriority Lien) | 10/31/2019 | 2,892,363 | 2,638,661 | 0.06 | % | |||||||||||
Exide Technologies(Exchange Priority) | 06/21/2019 | 2,367,012 | 831,031 | 0.02 | % | |||||||||||
Exide Technologies(First Lien) | 12/01/2019 | 690,179 | – 0 | – | 0.00 | % | ||||||||||
GS Mortgage Securities Trust Series 2014-GC22, Class D | 09/25/2019 | 1,770,611 | 1,088,033 | 0.03 | % | |||||||||||
Home RE Ltd. | 12/20/2019 | 2,079,514 | 1,346,013 | 0.03 | % | |||||||||||
JP Morgan Chase Commercial Mortgage Securities Trust Series 2012-CBX, Class E | 10/16/2015 | 1,866,103 | 1,070,631 | 0.03 | % | |||||||||||
JP Morgan Madison Avenue Securities Trust | 11/06/2015 | 1,109,666 | 1,156,023 | 0.03 | % | |||||||||||
JP Morgan Madison Avenue Securities Trust | 09/18/2015 | 1,969,352 | 1,504,580 | 0.04 | % | |||||||||||
Madison Avenue Trust Series 2013-650M, Class E | 04/20/2018 | 909,434 | 921,166 | 0.02 | % | |||||||||||
Magnetation LLC/Mag Finance Corp. | 02/19/2015 | 861,787 | – 0 | – | 0.00 | % | ||||||||||
PMT Credit Risk Transfer Trust | 03/21/2019 | 3,323,487 | 2,600,797 | 0.06 | % | |||||||||||
| abfunds.com | AB INCOME FUND | 81 | |
PORTFOLIO OF INVESTMENTS (continued)
| 144A/Restricted & Illiquid Securities | Acquisition Date | Cost | Market Value | Percentage of Net Assets | ||||||||||||
PMT Credit Risk Transfer Trust | 06/07/2019 | $ | 4,621,920 | $ | 3,428,768 | 0.08 | % | |||||||||
PMT Credit Risk Transfer Trust | 10/11/2019 | 2,061,922 | 1,569,959 | 0.04 | % | |||||||||||
PMT Credit Risk Transfer Trust | 02/11/2020 | 9,840,856 | 7,372,289 | 0.18 | % | |||||||||||
Radnor Re Ltd. | 12/23/2019 | 1,544,783 | 1,002,155 | 0.02 | % | |||||||||||
SoFi Consumer Loan Program LLC | 07/19/2017 | 1,003,511 | 539,427 | 0.01 | % | |||||||||||
SoFi Consumer Loan Program LLC Series 2016-5, Class R | 06/23/2017 | 1,275,923 | 215,649 | 0.01 | % | |||||||||||
SoFi Consumer Loan Program LLC Series 2017-5, Class R1 | 09/18/2017 | 1,758,337 | 291,180 | 0.01 | % | |||||||||||
SoFi Consumer Loan Program Trust Series 2018-1, Class R1 | 02/01/2018 | 3,677,430 | 1,033,118 | 0.02 | % | |||||||||||
Terraform Global Operating LLC | 02/08/2018 | 638,000 | 633,764 | 0.02 | % | |||||||||||
Tonon Luxembourg SA | 07/24/2015 | 2,020,999 | 25,965 | 0.00 | % | |||||||||||
Virgolino de Oliveira Finance SA | 06/19/2013 | 3,510,949 | 40,747 | 0.00 | % | |||||||||||
Virgolino de Oliveira Finance SA | 06/09/2014 | 745,965 | 191,460 | 0.01 | % | |||||||||||
Virgolino de Oliveira Finance SA | 01/31/2014 | 916,308 | 15,883 | 0.00 | % | |||||||||||
Wells Fargo Credit Risk Transfer Securities Trust | 09/06/2016 | 687,191 | 523,592 | 0.01 | % | |||||||||||
| (o) | Pays 10.75% cash or up to 4.5% PIK and remaining in cash. |
| (p) | Defaulted. |
| (q) | Inverse interest only security. |
| (r) | IO – Interest Only. |
| (s) | The stated coupon rate represents the greater of the LIBOR or the LIBOR floor rate plus a spread at April 30, 2020. |
| (t) | This position or a portion of this position represents an unsettled loan purchase. The coupon rate will be determined at the time of settlement and will be based upon the London-Interbank Offered Rate (“LIBOR”) plus a premium which was determined at the time of purchase. |
| (u) | Affiliated investments. |
| (v) | To obtain a copy of the fund’s shareholder report, please go to the Securities and Exchange Commission’s website at www.sec.gov, or call AB at (800) 227-4618. |
| (w) | The rate shown represents the 7-day yield as of period end. |
| 82 | AB INCOME FUND | abfunds.com | |
PORTFOLIO OF INVESTMENTS (continued)
Currency Abbreviations:
ARS – Argentine Peso BRL – Brazilian Real CAD – Canadian Dollar DOP – Dominican Peso EUR – Euro | GBP – Great British Pound IDR – Indonesian Rupiah MXN – Mexican Peso RUB – Russian Ruble USD – United States Dollar ZAR – South African Rand |
Glossary:
ABS – Asset-Backed Securities
BOBL – Bundesobligationen
CBT – Chicago Board of Trade
CDX-CMBX.NA – North American Commercial Mortgage-Backed Index
CDX-NAHY – North American High Yield Credit Default Swap Index
CLO – Collateralized Loan Obligations
CMBS – Commercial Mortgage-Backed Securities
FHLMC – Federal Home Loan Mortgage Corporation
FNMA – Federal National Mortgage Association
JSC – Joint Stock Company
LIBOR – London Interbank Offered Rates
REIT – Real Estate Investment Trust
REMICs – Real Estate Mortgage Investment Conduits
TBA – To Be Announced
TIPS – Treasury Inflation Protected Security
See notes to financial statements.
| abfunds.com | AB INCOME FUND | 83 | |
STATEMENT OF ASSETS & LIABILITIES
April 30, 2020 (unaudited)
Assets |
| |||
Investments in securities, at value | ||||
Unaffiliated issuers (cost $5,637,453,465) | $ | 5,506,979,082 | ||
Affiliated issuers (cost $12,564,213) | 12,564,213 | |||
Cash collateral due from broker | 4,207,711 | |||
Foreign currencies, at value (cost $6,918,324) | 6,754,036 | |||
Interest receivable | 49,098,606 | |||
Receivable for capital stock sold | 34,549,796 | |||
Unrealized appreciation on forward currency exchange contracts | 8,954,185 | |||
Receivable for investment securities sold and foreign currency transactions | 3,769,579 | |||
Receivable for newly entered credit default swaps | 556,207 | |||
Affiliated dividends receivable | 8,964 | |||
Other assets | 19,722 | |||
|
| |||
Total assets | 5,627,462,101 | |||
|
| |||
| Liabilities | ||||
Due to custodian | 169,226 | |||
Payable for investment securities purchased and foreign currency transactions | 1,155,861,162 | |||
Market value on credit default swaps (net premiums received $48,094,079) | 142,980,092 | |||
Payable for reverse repurchase agreements | 90,549,169 | |||
Payable for capital stock repurchased | 13,401,703 | |||
Cash collateral due to broker | 6,739,000 | |||
Unrealized depreciation on forward currency exchange contracts | 4,957,404 | |||
Advisory fee payable | 1,364,213 | |||
Dividends payable | 1,265,464 | |||
Payable for variation margin on centrally cleared swaps | 1,195,714 | |||
Payable for newly entered credit default swaps | 671,599 | |||
Payable for variation margin on futures | 371,271 | |||
Distribution fee payable | 207,242 | |||
Administrative fee payable | 24,241 | |||
Transfer Agent fee payable | 4,286 | |||
Directors’ fees payable | 395 | |||
Accrued expenses and other liabilities | 700,543 | |||
|
| |||
Total liabilities | 1,420,462,724 | |||
|
| |||
Net Assets | $ | 4,206,999,377 | ||
|
| |||
| Composition of Net Assets | ||||
Capital stock, at par | $ | 556,483 | ||
Additional paid-in capital | 4,511,274,396 | |||
Accumulated loss | (304,831,502 | ) | ||
|
| |||
| $ | 4,206,999,377 | |||
|
| |||
See notes to financial statements.
| 84 | AB INCOME FUND | abfunds.com | |
STATEMENT OF ASSETS & LIABILITIES (continued)
Net Asset Value Per Share—33 billion shares of capital stock authorized, $.001 par value
| Class | Net Assets | Shares Outstanding | Net Asset Value | |||||||||
| ||||||||||||
| A | $ | 260,672,622 | 34,518,431 | $ | 7.55 | * | ||||||
| ||||||||||||
| C | $ | 191,967,174 | 25,389,862 | $ | 7.56 | |||||||
| ||||||||||||
| Advisor | $ | 3,737,988,269 | 494,408,343 | $ | 7.56 | |||||||
| ||||||||||||
| Z | $ | 16,371,312 | 2,165,912 | $ | 7.56 | |||||||
| ||||||||||||
| * | The maximum offering price per share for Class A shares was $7.89 which reflects a sales charge of 4.25%. |
See notes to financial statements.
| abfunds.com | AB INCOME FUND | 85 | |
STATEMENT OF OPERATIONS
Six Months Ended April 30, 2020 (unaudited)
| Investment Income | ||||||||
Interest (net of foreign taxes withheld of $658,903) | $ | 78,158,209 | ||||||
Dividends | ||||||||
Unaffiliated issuers | 641,829 | |||||||
Affiliated issuers | 376,021 | |||||||
Other income | 18,638 | $ | 79,194,697 | |||||
|
| |||||||
| Expenses | ||||||||
Advisory fee (see Note B) | 9,197,923 | |||||||
Distribution fee—Class A | 328,660 | |||||||
Distribution fee—Class C | 931,778 | |||||||
Transfer agency—Class A | 91,328 | |||||||
Transfer agency—Class C | 64,831 | |||||||
Transfer agency—Advisor Class | 1,328,983 | |||||||
Transfer agency—Class Z | 318 | |||||||
Custodian | 173,559 | |||||||
Registration fees | 127,003 | |||||||
Printing | 104,815 | |||||||
Audit and tax | 70,642 | |||||||
Administrative | 43,130 | |||||||
Directors’ fees | 23,678 | |||||||
Legal | 19,027 | |||||||
Miscellaneous | 41,704 | |||||||
|
| |||||||
Total expenses before interest expense | 12,547,379 | |||||||
Interest expense | 92,872 | |||||||
Total expenses | 12,640,251 | |||||||
|
| |||||||
Less: expenses waived and reimbursed by the Adviser (see Note B) | (164,294 | ) | ||||||
|
| |||||||
Net expenses | 12,475,957 | |||||||
|
| |||||||
Net investment income | 66,718,740 | |||||||
|
| |||||||
| Realized and Unrealized Gain (Loss) on Investment and Foreign Currency Transactions | ||||||||
Net realized gain (loss) on: | ||||||||
Investment transactions(a) | 39,737,093 | |||||||
Forward currency exchange contracts | 2,304,091 | |||||||
Futures | 30,036,610 | |||||||
Swaps | (42,120,544 | ) | ||||||
Foreign currency transactions | 9,752,785 | |||||||
Net change in unrealized appreciation/depreciation of: | ||||||||
Investments(b) | (194,631,756 | ) | ||||||
Forward currency exchange contracts | 7,333,488 | |||||||
Futures | 13,694,164 | |||||||
Swaps | (123,874,703 | ) | ||||||
Foreign currency denominated assets and liabilities | (940,614 | ) | ||||||
|
| |||||||
Net loss on investment and foreign currency transactions | (258,709,386 | ) | ||||||
|
| |||||||
Net Decrease in Net Assets from Operations | $ | (191,990,646 | ) | |||||
|
|
| (a) | Net of foreign capital gains taxes of $679,153. |
| (b) | Net of decrease in accrued foreign capital gains taxes of $194,224. |
See notes to financial statements.
| 86 | AB INCOME FUND | abfunds.com | |
STATEMENT OF CHANGES IN NET ASSETS
| Six Months Ended April 30, 2020 (unaudited) | Year Ended October 31, 2019 | |||||||
| Increase (Decrease) in Net Assets from Operations | ||||||||
Net investment income | $ | 66,718,740 | $ | 120,023,768 | ||||
Net realized gain on investment and foreign currency transactions | 39,710,035 | 31,842,411 | ||||||
Net change in unrealized appreciation/depreciation of investments and foreign currency denominated assets and liabilities | (298,419,421 | ) | 156,494,849 | |||||
Contributions from Affiliates (see Note B) | – 0 | – | 6,818 | |||||
|
|
|
| |||||
Net increase (decrease) in net assets from operations | (191,990,646 | ) | 308,367,846 | |||||
Distributions to Shareholders | ||||||||
Class A | (4,626,280 | ) | (7,312,426 | ) | ||||
Class C | (2,569,819 | ) | (3,340,007 | ) | ||||
Advisor Class | (72,112,272 | ) | (102,301,258 | ) | ||||
Class Z(a) | (60,577 | ) | – 0 | – | ||||
Return of capital | ||||||||
Class A | – 0 | – | (1,342,784 | ) | ||||
Class C | – 0 | – | (613,327 | ) | ||||
Advisor Class | – 0 | – | (18,785,630 | ) | ||||
| Capital Stock Transactions | ||||||||
Net increase | 510,977,194 | 1,255,456,371 | ||||||
|
|
|
| |||||
Total increase | 239,617,600 | 1,430,128,785 | ||||||
| Net Assets | ||||||||
Beginning of period | 3,967,381,777 | 2,537,252,992 | ||||||
|
|
|
| |||||
End of period | $ | 4,206,999,377 | $ | 3,967,381,777 | ||||
|
|
|
| |||||
| (a) | Commenced distribution on November 20, 2019. |
See notes to financial statements.
| abfunds.com | AB INCOME FUND | 87 | |
NOTES TO FINANCIAL STATEMENTS
April 30, 2020 (unaudited)
NOTE A
Significant Accounting Policies
AB Bond Fund, Inc. (the “Company”) is registered under the Investment Company Act of 1940 as an open-end management investment company. The Company, which is a Maryland corporation, operates as a series company comprised of ten portfolios currently in operation. Each portfolio is considered to be a separate entity for financial reporting and tax purposes. This report relates only to the AB Income Fund, Inc. (the “Fund”), a diversified portfolio. The Fund acquired the assets and liabilities of the AllianceBernstein Income Fund, Inc., a closed-end fund (the “Predecessor Fund”), effective at the close of business on April 21, 2016 (the “Reorganization”). The Predecessor Fund was the accounting survivor in the Reorganization and as such, the financial statements and the Advisor Class shares financial highlights reflect the financial information of the Predecessor Fund through April 21, 2016. The Fund has authorized the issuance of Class A, Class B, Class C, Advisor Class, Class R, Class K, Class I, Class Z, Class T, Class 1 and Class 2 shares. Effective November 20, 2019, the Fund commenced offering Class Z shares. Class B, Class K, Class R, Class I, Class T, Class 1 and Class 2 shares have not been issued. Class A shares are sold with a front-end sales charge of up to 4.25% for purchases not exceeding $1,000,000. With respect to purchases of $1,000,000 or more, Class A shares redeemed within one year of purchase may be subject to a contingent deferred sales charge of 1%. Class C shares are subject to a contingent deferred sales charge of 1% on redemptions made within the first year after purchase, and 0% after the first year of purchase. Class C shares will automatically convert to Class A shares ten years after the end of the calendar month of purchase. Advisor Class and Class Z shares are sold without an initial or contingent deferred sales charge and are not subject to ongoing distribution expenses. All eleven classes of shares have identical voting, dividend, liquidation and other rights, except that the classes bear different distribution and transfer agency expenses. Each class has exclusive voting rights with respect to its distribution plan. The financial statements have been prepared in conformity with U.S. generally accepted accounting principles (“U.S. GAAP”) which require management to make certain estimates and assumptions that affect the reported amounts of assets and liabilities in the financial statements and amounts of income and expenses during the reporting period. Actual results could differ from those estimates. The Fund is an investment company under U.S. GAAP and follows the accounting and reporting guidance applicable to investment companies. The following is a summary of significant accounting policies followed by the Fund.
| 88 | AB INCOME FUND | abfunds.com | |
NOTES TO FINANCIAL STATEMENTS (continued)
1. Security Valuation
Portfolio securities are valued at their current market value determined on the basis of market quotations or, if market quotations are not readily available or are deemed unreliable, at “fair value” as determined in accordance with procedures established by and under the general supervision of the Company’s Board of Directors (the “Board”).
In general, the market values of securities which are readily available and deemed reliable are determined as follows: securities listed on a national securities exchange (other than securities listed on the NASDAQ Stock Market, Inc. (“NASDAQ”)) or on a foreign securities exchange are valued at the last sale price at the close of the exchange or foreign securities exchange. If there has been no sale on such day, the securities are valued at the last traded price from the previous day. Securities listed on more than one exchange are valued by reference to the principal exchange on which the securities are traded; securities listed only on NASDAQ are valued in accordance with the NASDAQ Official Closing Price; listed or over the counter (“OTC”) market put or call options are valued at the mid level between the current bid and ask prices. If either a current bid or current ask price is unavailable, AllianceBernstein L.P. (the “Adviser”) will have discretion to determine the best valuation (e.g., last trade price in the case of listed options); open futures are valued using the closing settlement price or, in the absence of such a price, the most recent quoted bid price. If there are no quotations available for the day of valuation, the last available closing settlement price is used; U.S. Government securities and any other debt instruments having 60 days or less remaining until maturity are generally valued at market by an independent pricing vendor, if a market price is available. If a market price is not available, the securities are valued at amortized cost. This methodology is commonly used for short term securities that have an original maturity of 60 days or less, as well as short term securities that had an original term to maturity that exceeded 60 days. In instances when amortized cost is utilized, the Valuation Committee (the “Committee”) must reasonably conclude that the utilization of amortized cost is approximately the same as the fair value of the security. Such factors the Committee will consider include, but are not limited to, an impairment of the creditworthiness of the issuer or material changes in interest rates. Fixed-income securities, including mortgage-backed and asset-backed securities, may be valued on the basis of prices provided by a pricing service or at a price obtained from one or more of the major broker-dealers. In cases where broker-dealer quotes are obtained, the Adviser may establish procedures whereby changes in market yields or spreads are used to adjust, on a daily basis, a recently obtained quoted price on a security. Swaps and other derivatives are valued daily, primarily using independent pricing services, independent pricing models using
| abfunds.com | AB INCOME FUND | 89 | |
NOTES TO FINANCIAL STATEMENTS (continued)
market inputs, as well as third party broker-dealers or counterparties. Open end mutual funds are valued at the closing net asset value per share, while exchange traded funds are valued at the closing market price per share.
Securities for which market quotations are not readily available (including restricted securities) or are deemed unreliable are valued at fair value as deemed appropriate by the Adviser. Factors considered in making this determination may include, but are not limited to, information obtained by contacting the issuer, analysts, analysis of the issuer’s financial statements or other available documents. In addition, the Fund may use fair value pricing for securities primarily traded in non-U.S. markets because most foreign markets close well before the Fund values its securities at 4:00 p.m., Eastern Time. The earlier close of these foreign markets gives rise to the possibility that significant events, including broad market moves, may have occurred in the interim and may materially affect the value of those securities. To account for this, the Fund generally values many of its foreign equity securities using fair value prices based on third party vendor modeling tools to the extent available.
2. Fair Value Measurements
In accordance with U.S. GAAP regarding fair value measurements, fair value is defined as the price that the Fund would receive to sell an asset or pay to transfer a liability in an orderly transaction between market participants at the measurement date. U.S. GAAP establishes a framework for measuring fair value, and a three-level hierarchy for fair value measurements based upon the transparency of inputs to the valuation of an asset or liability (including those valued based on their market values as described in Note A.1 above). Inputs may be observable or unobservable and refer broadly to the assumptions that market participants would use in pricing the asset or liability. Observable inputs reflect the assumptions market participants would use in pricing the asset or liability based on market data obtained from sources independent of the Fund. Unobservable inputs reflect the Fund’s own assumptions about the assumptions that market participants would use in pricing the asset or liability based on the best information available in the circumstances. Each investment is assigned a level based upon the observability of the inputs which are significant to the overall valuation. The three-tier hierarchy of inputs is summarized below.
| • | Level 1—quoted prices in active markets for identical investments |
| • | Level 2—other significant observable inputs (including quoted prices for similar investments, interest rates, prepayment speeds, credit risk, etc.) |
| • | Level 3—significant unobservable inputs (including the Fund’s own assumptions in determining the fair value of investments) |
| 90 | AB INCOME FUND | abfunds.com | |
NOTES TO FINANCIAL STATEMENTS (continued)
The fair value of debt instruments, such as bonds, and over-the-counter derivatives is generally based on market price quotations, recently executed market transactions (where observable) or industry recognized modeling techniques and are generally classified as Level 2. Pricing vendor inputs to Level 2 valuations may include quoted prices for similar investments in active markets, interest rate curves, coupon rates, currency rates, yield curves, option adjusted spreads, default rates, credit spreads and other unique security features in order to estimate the relevant cash flows which are then discounted to calculate fair values. If these inputs are unobservable and significant to the fair value, these investments will be classified as Level 3.
Where readily available market prices or relevant bid prices are not available for certain equity investments, such investments may be valued based on similar publicly traded investments, movements in relevant indices since last available prices or based upon underlying company fundamentals and comparable company data (such as multiples to earnings or other multiples to equity). Where an investment is valued using an observable input, such as another publicly traded security, the investment will be classified as Level 2. If management determines that an adjustment is appropriate based on restrictions on resale, illiquidity or uncertainty, and such adjustment is a significant component of the valuation, the investment will be classified as Level 3. An investment will also be classified as Level 3 where management uses company fundamentals and other significant inputs to determine the valuation.
Options are valued using market-based inputs to models, broker or dealer quotations, or alternative pricing sources with reasonable levels of price transparency, where such inputs and models are available. Alternatively, the values may be obtained through unobservable management determined inputs and/or management’s proprietary models. Where models are used, the selection of a particular model to value an option depends upon the contractual terms of, and specific risks inherent in, the option as well as the availability of pricing information in the market. Valuation models require a variety of inputs, including contractual terms, market prices, measures of volatility and correlations of such inputs. Exchange traded options generally will be classified as Level 2. For options that do not trade on exchange but trade in liquid markets, inputs can generally be verified and model selection does not involve significant management judgment. Options are classified within Level 2 on the fair value hierarchy when all of the significant inputs can be corroborated to market evidence. Otherwise such instruments are classified as Level 3.
Valuations of mortgage-backed or other asset-backed securities, by pricing vendors, are based on both proprietary and industry recognized models and discounted cash flow techniques. Significant inputs to the valuation
| abfunds.com | AB INCOME FUND | 91 | |
NOTES TO FINANCIAL STATEMENTS (continued)
of these instruments are value of the collateral, the rates and timing of delinquencies, the rates and timing of prepayments, and default and loss expectations, which are driven in part by housing prices for residential mortgages. Significant inputs are determined based on relative value analyses, which incorporate comparisons to instruments with similar collateral and risk profiles, including relevant indices. Mortgage and asset-backed securities for which management has collected current observable data through pricing services are generally categorized within Level 2. Those investments for which current observable data has not been provided are classified as Level 3.
Bank loan prices are provided by third party pricing services and consist of a composite of the quotes received by the vendor into a consensus price. Certain bank loans are classified as Level 3, as a significant input used in the fair value measurement of these instruments is the market quotes that are received by the vendor and these inputs are not observable.
Other fixed income investments, including non-U.S. government and corporate debt, are generally valued using quoted market prices, if available, which are typically impacted by current interest rates, maturity dates and any perceived credit risk of the issuer. Additionally, in the absence of quoted market prices, these inputs are used by pricing vendors to derive a valuation based upon industry or proprietary models which incorporate issuer specific data with relevant yield/spread comparisons with more widely quoted bonds with similar key characteristics. Those investments for which there are observable inputs are classified as Level 2. Where the inputs are not observable, the investments are classified as Level 3.
The following table summarizes the valuation of the Fund’s investments by the above fair value hierarchy levels as of April 30, 2020:
Investments in | Level 1 | Level 2 | Level 3 | Total | ||||||||||||
Assets: | ||||||||||||||||
Governments – Treasuries | $ | –0 | – | $ | 1,984,472,988 | $ | – 0 | – | $ | 1,984,472,988 | ||||||
Mortgage Pass-Throughs | – 0 | – | 1,150,525,167 | – 0 | – | 1,150,525,167 | ||||||||||
Corporates – Investment Grade | – 0 | – | 673,444,525 | – 0 | – | 673,444,525 | ||||||||||
Corporates – Non-Investment Grade | – 0 | – | 510,368,406 | 12,054,991 | (a) | 522,423,397 | ||||||||||
Collateralized Mortgage Obligations | – 0 | – | 381,726,949 | – 0 | – | 381,726,949 | ||||||||||
| 92 | AB INCOME FUND | abfunds.com | |
NOTES TO FINANCIAL STATEMENTS (continued)
Investments in | Level 1 | Level 2 | Level 3 | Total | ||||||||||||
Emerging Markets – Sovereigns | $ | – 0 | – | $ | 141,795,289 | $ | – 0 | – | $ | 141,795,289 | ||||||
Collateralized Loan Obligations | – 0 | – | 107,642,648 | – 0 | – | 107,642,648 | ||||||||||
Bank Loans | – 0 | – | 90,257,199 | 14,981,330 | 105,238,529 | |||||||||||
Commercial Mortgage-Backed Securities | – 0 | – | 86,967,790 | – 0 | – | 86,967,790 | ||||||||||
Asset-Backed Securities | – 0 | – | 62,047,698 | 2,079,374 | 64,127,072 | |||||||||||
Inflation-Linked Securities | – 0 | – | 62,102,920 | – 0 | – | 62,102,920 | ||||||||||
Emerging Markets – Corporate Bonds | – 0 | – | 55,270,911 | 25,965 | 55,296,876 | |||||||||||
Agencies | – 0 | – | 48,536,516 | – 0 | – | 48,536,516 | ||||||||||
Governments – Sovereign Bonds | – 0 | – | 36,385,376 | – 0 | – | 36,385,376 | ||||||||||
Local Governments – Provincial Bonds | – 0 | – | 30,418,746 | – 0 | – | 30,418,746 | ||||||||||
Quasi-Sovereigns | – 0 | – | 28,819,019 | – 0 | – | 28,819,019 | ||||||||||
Emerging Markets – Treasuries | – 0 | – | 19,342,891 | – 0 | – | 19,342,891 | ||||||||||
Common Stocks | 1,599,227 | – 0 | – | 1,817,293 | (a) | 3,416,520 | ||||||||||
Local Governments – US Municipal Bonds | – 0 | – | 3,189,248 | – 0 | – | 3,189,248 | ||||||||||
Preferred Stocks | – 0 | – | – 0 | – | 867,323 | 867,323 | ||||||||||
Whole Loan Trusts | – 0 | – | – 0 | – | 160,464 | 160,464 | ||||||||||
Warrants | 78,829 | – 0 | – | 0 | (a) | 78,829 | ||||||||||
Short-Term Investments | 12,564,213 | – 0 | – | – 0 | – | 12,564,213 | ||||||||||
|
|
|
|
|
|
|
| |||||||||
Total Investments in Securities | 14,242,269 | 5,473,314,286 | 31,986,740 | 5,519,543,295 | ||||||||||||
Other Financial Instruments(b): | ||||||||||||||||
Assets: | ||||||||||||||||
Futures | 17,736,103 | – 0 | – | – 0 | – | 17,736,103 | (c) | |||||||||
Forward Currency Exchange | ||||||||||||||||
Contracts | – 0 | – | 8,954,185 | – 0 | – | 8,954,185 | ||||||||||
| abfunds.com | AB INCOME FUND | 93 | |
NOTES TO FINANCIAL STATEMENTS (continued)
Investments in | Level 1 | Level 2 | Level 3 | Total | ||||||||||||
Centrally Cleared Credit Default Swaps | $ | – 0 | – | $ | 2,466,116 | $ | – 0 | – | $ | 2,466,116 | (c) | |||||
Liabilities: | ||||||||||||||||
Futures | (6,265,428 | ) | – 0 | – | – 0 | – | (6,265,428 | )(c) | ||||||||
Forward Currency Exchange Contracts | – 0 | – | (4,957,404 | ) | – 0 | – | (4,957,404 | ) | ||||||||
Centrally Cleared Credit Default Swaps | – 0 | – | (13,641,217 | ) | – 0 | – | (13,641,217 | )(c) | ||||||||
Centrally Cleared Interest Rate Swaps | – 0 | – | (18,512,101 | ) | – 0 | – | (18,512,101 | )(c) | ||||||||
Credit Default Swaps | – 0 | – | (142,980,092 | ) | – 0 | – | (142,980,092 | ) | ||||||||
Reverse Repurchase Agreements | (90,549,169 | ) | – 0 | – | – 0 | – | (90,549,169 | ) | ||||||||
|
|
|
|
|
|
|
| |||||||||
Total | $ | (64,836,225 | ) | $ | 5,304,643,773 | $ | 31,986,740 | $ | 5,271,794,288 | (d) | ||||||
|
|
|
|
|
|
|
| |||||||||
| (a) | The Fund held securities with zero market value at period end. |
| (b) | Other financial instruments are derivative instruments, such as futures, forwards and swaps, which are valued at the unrealized appreciation/(depreciation) on the instrument. Other financial instruments may also include swaps with upfront premiums, options written and swaptions written which are valued at market value. |
| (c) | Only variation margin receivable/(payable) at period end is reported within the statement of assets and liabilities. This amount reflects cumulative unrealized appreciation/(depreciation) on futures and centrally cleared swaps as reported in the portfolio of investments. Where applicable, centrally cleared swaps with upfront premiums are presented here at market value. |
| (d) | Amounts of $41,088,168, $3,165,579, $51,481,876 and $1,296,862 for Asset-Backed Securities, Bank Loans, Collateralized Loan Obligations and Collateralized Mortgage Olbigations, respectively, were transferred out of Level 3 into Level 2 as improved transparency of price inputs received from pricing vendors has increased the observability during the reporting period. |
3. Currency Translation
Assets and liabilities denominated in foreign currencies and commitments under forward currency exchange contracts are translated into U.S. dollars at the mean of the quoted bid and ask prices of such currencies against the U.S. dollar. Purchases and sales of portfolio securities are translated into U.S. dollars at the rates of exchange prevailing when such securities were acquired or sold. Income and expenses are translated into U.S. dollars at rates of exchange prevailing when accrued.
Net realized gain or loss on foreign currency transactions represents foreign exchange gains and losses from sales and maturities of foreign fixed income investments, holding of foreign currencies, currency gains or losses realized between the trade and settlement dates on foreign investment transactions, and the difference between the amounts of dividends,
| 94 | AB INCOME FUND | abfunds.com | |
NOTES TO FINANCIAL STATEMENTS (continued)
interest and foreign withholding taxes recorded on the Fund’s books and the U.S. dollar equivalent amounts actually received or paid. Net unrealized currency gains and losses from valuing foreign currency denominated assets and liabilities at period end exchange rates are reflected as a component of net unrealized appreciation or depreciation of foreign currency denominated assets and liabilities.
4. Taxes
It is the Fund’s policy to meet the requirements of the Internal Revenue Code applicable to regulated investment companies and to distribute all of its investment company taxable income and net realized gains, if any, to shareholders. Therefore, no provisions for federal income or excise taxes are required. The Fund may be subject to taxes imposed by countries in which it invests. Such taxes are generally based on income and/or capital gains earned or repatriated. Taxes are accrued and applied to net investment income, net realized gains and net unrealized appreciation/depreciation as such income and/or gains are earned.
In accordance with U.S. GAAP requirements regarding accounting for uncertainties in income taxes, management has analyzed the Fund’s tax positions taken or expected to be taken on federal and state income tax returns for all open tax years (the current and the prior three tax years) and has concluded that no provision for income tax is required in the Fund’s financial statements.
5. Investment Income and Investment Transactions
Dividend income is recorded on the ex-dividend date or as soon as the Fund is informed of the dividend. Interest income is accrued daily. Investment transactions are accounted for on the date the securities are purchased or sold. Investment gains or losses are determined on the identified cost basis. The Fund amortizes premiums and accretes discounts as adjustments to interest income.
6. Class Allocations
All income earned and expenses incurred by the Fund are borne on a pro-rata basis by each outstanding class of shares, based on the proportionate interest in the Fund represented by the net assets of such class, except for class specific expenses which are allocated to the respective class. Expenses of the Company are charged proportionately to each fund or based on other appropriate methods. Realized and unrealized gains and losses are allocated among the various share classes based on respective net assets.
7. Dividends and Distributions
Dividends and distributions to shareholders, if any, are recorded on the ex-dividend date. Income dividends and capital gains distributions are
| abfunds.com | AB INCOME FUND | 95 | |
NOTES TO FINANCIAL STATEMENTS (continued)
determined in accordance with federal tax regulations and may differ from those determined in accordance with U.S. GAAP. To the extent these differences are permanent, such amounts are reclassified within the capital accounts based on their federal tax basis treatment; temporary differences do not require such reclassification.
NOTE B
Advisory Fee and Other Transactions with Affiliates
Under the terms of the investment advisory agreement, the Fund pays the Adviser an advisory fee at an annual rate of .45% of the first $2.5 billion of the Fund’s average daily net assets, .40% of the excess over $2.5 billion up to $5 billion and .35% in excess of $5 billion, of the Fund’s average daily net assets. The fee is accrued daily and paid monthly. The Adviser has agreed to waive its fees and bear certain expenses to the extent necessary to limit total operating expenses (excluding acquired fund fees and expenses other than the advisory fees of any AB mutual funds in which the Fund may invest, interest expense, taxes, extraordinary expenses, and brokerage commissions and other transaction costs) on an annual basis (the “Expense Caps”) to .77%, 1.52%, .52%, and .52% of daily average net assets for Class A, Class C, Advisor Class, and Class Z shares, respectively. For the six months ended April 30, 2020, such reimbursement/waivers amounted to $138,116. The Expense Caps may not be terminated by the Adviser before January 31, 2021. Any fees waived and expenses borne by the Adviser through April 22, 2018 are subject to repayment by the Fund until the end of the third fiscal year after the fiscal period in which the fee was waived or the expense was borne; such waivers that are subject to repayment amounted to $990,111, $1,361,441 and $396,862 for the years ended October 31, 2016, October 31, 2017 and October 31, 2018, respectively. In any case, no reimbursement payment will be made that would cause the Fund’s total annual operating expenses to exceed the Expense Caps’ net fee percentage set forth above.
Pursuant to the investment advisory agreement, the Fund may reimburse the Adviser for certain legal and accounting services provided to the Fund by the Adviser. For the six months ended April 30, 2020, the reimbursement for such services amounted to $43,130.
The Fund compensates AllianceBernstein Investor Services, Inc. (“ABIS”), a wholly-owned subsidiary of the Adviser, under a Transfer Agency Agreement for providing personnel and facilities to perform transfer agency services for the Fund. ABIS may make payments to intermediaries that provide omnibus account services, sub-accounting services and/or networking services. Such compensation retained by ABIS amounted to $469,401 for the six months ended April 30, 2020.
| 96 | AB INCOME FUND | abfunds.com | |
NOTES TO FINANCIAL STATEMENTS (continued)
AllianceBernstein Investments, Inc. (the “Distributor”), a wholly-owned subsidiary of the Adviser, serves as the distributor of the Fund’s shares. The Distributor has advised the Fund that it has retained front-end sales charges of $44,260 from the sale of Class A shares and received $38,161 and $74,282 in contingent deferred sales charges imposed upon redemptions by shareholders of Class A and Class C shares, respectively, for the six months ended April 30, 2020.
The Fund may invest in AB Government Money Market Portfolio (the “Government Money Market Portfolio”) which has a contractual annual advisory fee rate of .20% of the portfolio’s average daily net assets and bears its own expenses. The Adviser has contractually agreed to waive .10% of the advisory fee of Government Money Market Portfolio (resulting in a net advisory fee of .10%) until August 31, 2020. In connection with the investment by the Fund in Government Money Market Portfolio, the Adviser has contractually agreed to waive its advisory fee from the Fund in an amount equal to the Fund’s pro rata share of the effective advisory fee of Government Money Market Portfolio, as borne indirectly by the Fund as an acquired fund fee and expense. For the six months ended April 30, 2020, such waiver amounted to $26,178.
A summary of the Fund’s transactions in AB mutual funds for the six months ended April 30, 2020 is as follows:
| Fund | Market Value 10/31/19 (000) | Purchases (000) | Sales Proceeds (000) | Market Value 4/30/20 (000) | Dividend Income (000) | |||||||||||||||
Government Money Market Portfolio | $ | 51,924 | $ | 902,353 | $ | 941,713 | $ | 12,564 | $ | 376 | ||||||||||
During the year ended October 31, 2019, the Adviser reimbursed the Fund $6,818 for trading losses incurred due to a trade entry error.
During the second quarter of 2018, AXA S.A. (“AXA”), a French holding company for the AXA Group, completed the sale of a minority stake in its subsidiary, AXA Equitable Holdings, Inc. (now named Equitable Holdings, Inc.)(“Equitable”), through an initial public offering. Equitable is the holding company for a diverse group of financial services companies, including an approximately 64.9% economic interest in the Adviser and a 100% interest in AllianceBernstein Corporation, the general partner of the Adviser. Since the initial sale, AXA has completed additional offerings, most recently during the fourth quarter of 2019. As a result, AXA currently owns less than 10% of the outstanding shares of common stock of Equitable, and no longer owns a controlling interest in Equitable. AXA previously announced its intention to sell its entire interest in Equitable over time, subject to market conditions and other factors (the “Plan”). Most of AXA’s remaining
| abfunds.com | AB INCOME FUND | 97 | |
NOTES TO FINANCIAL STATEMENTS (continued)
Equitable shares are to be delivered on redemption of AXA bonds mandatorily exchangeable into Equitable shares and maturing in May 2021. AXA retains sole discretion to determine the timing of any future sales of its remaining shares of Equitable common stock.
Sales under the Plan that were completed on November 13, 2019 resulted in the indirect transfer of a “controlling block” of voting securities of the Adviser (a “Change of Control Event”) and may have been deemed to have been an “assignment” causing a termination of the Fund’s investment advisory and administration agreements. In order to ensure that investment advisory and administration services could continue uninterrupted in the event of a Change of Control Event, the Board previously approved new investment advisory and administration agreements with the Adviser, and shareholders of the Fund subsequently approved the new investment advisory agreement. These agreements became effective on November 13, 2019.
NOTE C
Distribution Services Agreement
The Fund has adopted a Distribution Services Agreement (the “Agreement”) pursuant to Rule 12b-1 under the Investment Company Act of 1940. Under the Agreement, the Fund pays distribution and servicing fees to the Distributor at an annual rate of up to .30% of the Fund’s average daily net assets attributable to Class A shares and 1% of the Fund’s average daily net assets attributable to Class C shares. There are no distribution and servicing fees on the Advisor Class and Class Z shares. Payments under the Agreement in respect of Class A shares are currently limited to an annual rate of .25% of Class A shares’ average daily net assets. The fees are accrued daily and paid monthly. The Agreement provides that the Distributor will use such payments in their entirety for distribution assistance and promotional activities. Since the commencement of the Fund’s operations, the Distributor has incurred expenses in excess of the distribution costs reimbursed by the Fund in the amount of $1,104,840 for Class C shares. While such costs may be recovered from the Fund in future periods so long as the Agreement is in effect, the rate of the distribution and servicing fees payable under the Agreement may not be increased without a shareholder vote. In accordance with the Agreement, there is no provision for recovery of unreimbursed distribution costs incurred by the Distributor beyond the current fiscal year for Class A shares. The Agreement also provides that the Adviser may use its own resources to finance the distribution of the Fund’s shares.
| 98 | AB INCOME FUND | abfunds.com | |
NOTES TO FINANCIAL STATEMENTS (continued)
NOTE D
Investment Transactions
Purchases and sales of investment securities (excluding short-term investments) for the six months ended April 30, 2020 were as follows:
| Purchases | Sales | |||||||
Investment securities (excluding U.S. government securities) | $ | 1,094,575,899 | $ | 359,698,372 | ||||
U.S. government securities | 5,711,220,447 | 5,277,603,187 | ||||||
The cost of investments for federal income tax purposes was substantially the same as the cost for financial reporting purposes. Accordingly, gross unrealized appreciation and unrealized depreciation are as follows:
Gross unrealized appreciation | $ | 248,563,537 | ||
Gross unrealized depreciation | (480,685,425 | ) | ||
|
| |||
Net unrealized depreciation | $ | (232,121,888 | ) | |
|
|
1. Derivative Financial Instruments
The Fund may use derivatives in an effort to earn income and enhance returns, to replace more traditional direct investments, to obtain exposure to otherwise inaccessible markets (collectively, “investment purposes”), or to hedge or adjust the risk profile of its portfolio.
The principal types of derivatives utilized by the Fund, as well as the methods in which they may be used are:
| • | Futures |
The Fund may buy or sell futures for investment purposes or for the purpose of hedging its portfolio against adverse effects of potential movements in the market. The Fund bears the market risk that arises from changes in the value of these instruments and the imperfect correlation between movements in the price of the futures and movements in the price of the assets, reference rates or indices which they are designed to track. Among other things, the Fund may purchase or sell futures for foreign currencies or options thereon for non-hedging purposes as a means of making direct investment in foreign currencies, as described below under “Currency Transactions”.
At the time the Fund enters into futures, the Fund deposits and maintains as collateral an initial margin with the broker, as required by the exchange on which the transaction is effected. Such amount is shown as cash collateral due from broker on the statement of assets and liabilities. Pursuant to the contract, the Fund agrees to receive from or pay to the broker an amount of cash equal to the daily
| abfunds.com | AB INCOME FUND | 99 | |
NOTES TO FINANCIAL STATEMENTS (continued)
fluctuation in the value of the contract. Such receipts or payments are known as variation margin and are recorded by the Fund as unrealized gains or losses. Risks may arise from the potential inability of a counterparty to meet the terms of the contract. The credit/counterparty risk for exchange-traded futures is generally less than privately negotiated futures, since the clearinghouse, which is the issuer or counterparty to each exchange-traded future, has robust risk mitigation standards, including the requirement to provide initial and variation margin. When the contract is closed, the Fund records a realized gain or loss equal to the difference between the value of the contract at the time it was opened and the time it was closed.
Use of long futures subjects the Fund to risk of loss in excess of the amounts shown on the statement of assets and liabilities, up to the notional value of the futures. Use of short futures subjects the Fund to unlimited risk of loss. Under some circumstances, futures exchanges may establish daily limits on the amount that the price of futures can vary from the previous day’s settlement price, which could effectively prevent liquidation of unfavorable positions.
During the six months ended April 30, 2020, the Fund held futures for hedging and non-hedging purposes.
| • | Forward Currency Exchange Contracts |
The Fund may enter into forward currency exchange contracts in order to hedge its exposure to changes in foreign currency exchange rates on its foreign portfolio holdings, to hedge certain firm purchase and sale commitments denominated in foreign currencies and for non-hedging purposes as a means of making direct investments in foreign currencies, as described below under “Currency Transactions”.
A forward currency exchange contract is a commitment to purchase or sell a foreign currency at a future date at a negotiated forward rate. The gain or loss arising from the difference between the original contract and the closing of such contract would be included in net realized gain or loss on forward currency exchange contracts. Fluctuations in the value of open forward currency exchange contracts are recorded for financial reporting purposes as unrealized appreciation and/or depreciation by the Fund. Risks may arise from the potential inability of a counterparty to meet the terms of a contract and from unanticipated movements in the value of a foreign currency relative to the U.S. dollar.
During the six months ended April 30, 2020, the Fund held forward currency exchange contracts for hedging and non-hedging purposes.
| 100 | AB INCOME FUND | abfunds.com | |
NOTES TO FINANCIAL STATEMENTS (continued)
| • | Option Transactions |
For hedging and investment purposes, the Fund may purchase and write (sell) put and call options on U.S. and foreign securities, including government securities, and foreign currencies that are traded on U.S. and foreign securities exchanges and over-the-counter markets. Among other things, the Fund may use options transactions for non-hedging purposes as a means of making direct investments in foreign currencies, as described below under “Currency Transactions” and may use options strategies involving the purchase and/or writing of various combinations of call and/or put options, for hedging and investment purposes.
The risk associated with purchasing an option is that the Fund pays a premium whether or not the option is exercised. Additionally, the Fund bears the risk of loss of the premium and change in market value should the counterparty not perform under the contract. If a put or call option purchased by the Fund were permitted to expire without being sold or exercised, its premium would represent a loss to the Fund. Put and call options purchased are accounted for in the same manner as portfolio securities. The cost of securities acquired through the exercise of call options is increased by premiums paid. The proceeds from securities sold through the exercise of put options are decreased by the premiums paid.
When the Fund writes an option, the premium received by the Fund is recorded as a liability and is subsequently adjusted to the current market value of the option written. The Fund’s maximum payment for written put options equates to the number of shares multiplied by the strike price. In certain circumstances maximum payout amounts may be partially offset by recovery values of the respective referenced assets and upfront premium received upon entering into the contract. Premiums received from written options which expire unexercised are recorded by the Fund on the expiration date as realized gains from options written. The difference between the premium received and the amount paid on effecting a closing purchase transaction, including brokerage commissions, is also treated as a realized gain, or if the premium received is less than the amount paid for the closing purchase transaction, as a realized loss. If a call option is exercised, the premium received is added to the proceeds from the sale of the underlying security or currency in determining whether the Fund has realized a gain or loss. If a put option is exercised, the premium received reduces the cost basis of the security or currency purchased by the Fund. In writing an option, the Fund bears the market risk of an unfavorable change in the price of the security or currency underlying the written option. Exercise of an option written by the Fund could result in the Fund selling or buying a security or currency at a price different from the current market value.
| abfunds.com | AB INCOME FUND | 101 | |
NOTES TO FINANCIAL STATEMENTS (continued)
The Fund may also invest in options on swap agreements, also called “swaptions”. A swaption is an option that gives the buyer the right, but not the obligation, to enter into a swap on a future date in exchange for paying a market-based “premium”. A receiver swaption gives the owner the right to receive the total return of a specified asset, reference rate, or index. A payer swaption gives the owner the right to pay the total return on a specified asset, reference rate, or index. Swaptions also include options that allow an existing swap to be terminated or extended by one of the counterparties. The Fund’s maximum payment for written put swaptions equates to the notional amount of the underlying swap. In certain circumstances maximum payout amounts may be partially offset by recovery values of the respective referenced assets and upfront premium received upon entering into the contract.
During the six months ended April 30, 2020, the Fund held purchased swaptions for hedging and non-hedging purposes.
| • | Swaps |
The Fund may enter into swaps to hedge its exposure to interest rates, credit risk, equity markets or currencies. The Fund may also enter into swaps for non-hedging purposes as a means of gaining market exposures, making direct investments in foreign currencies, as described below under “Currency Transactions.” A swap is an agreement that obligates two parties to exchange a series of cash flows at specified intervals based upon or calculated by reference to changes in specified prices or rates for a specified amount of an underlying asset. The payment flows are usually netted against each other, with the difference being paid by one party to the other. In addition, collateral may be pledged or received by the Fund in accordance with the terms of the respective swaps to provide value and recourse to the Fund or its counterparties in the event of default, bankruptcy or insolvency by one of the parties to the swap.
Risks may arise as a result of the failure of the counterparty to the swap to comply with the terms of the swap. The loss incurred by the failure of a counterparty is generally limited to the net interim payment to be received by the Fund, and/or the termination value at the end of the contract. Therefore, the Fund considers the creditworthiness of each counterparty to a swap in evaluating potential counterparty risk. This risk is mitigated by having a netting arrangement between the Fund and the counterparty and by the posting of collateral by the counterparty to the Fund to cover the Fund’s exposure to the counterparty. Additionally, risks may arise from unanticipated movements in interest rates or in the value of the underlying securities. The Fund accrues for the interim payments on swaps on a daily basis,
| 102 | AB INCOME FUND | abfunds.com | |
NOTES TO FINANCIAL STATEMENTS (continued)
with the net amount recorded within unrealized appreciation/depreciation of swaps on the statement of assets and liabilities, where applicable. Once the interim payments are settled in cash, the net amount is recorded as realized gain/(loss) on swaps on the statement of operations, in addition to any realized gain/(loss) recorded upon the termination of swaps. Upfront premiums paid or received for OTC swaps are recognized as cost or proceeds on the statement of assets and liabilities and are amortized on a straight line basis over the life of the contract. Amortized upfront premiums are included in net realized gain/(loss) from swaps on the statement of operations. Fluctuations in the value of swaps are recorded as a component of net change in unrealized appreciation/depreciation of swaps on the statement of operations.
Certain standardized swaps, including certain interest rate swaps and credit default swaps, are (or soon will be) subject to mandatory central clearing. Cleared swaps are transacted through futures commission merchants (“FCMs”) that are members of central clearinghouses, with the clearinghouse serving as central counterparty, similar to transactions in futures contracts. Centralized clearing will be required for additional categories of swaps on a phased-in basis based on requirements published by the Securities and Exchange Commission and Commodity Futures Trading Commission.
At the time the Fund enters into a centrally cleared swap, the Fund deposits and maintains as collateral an initial margin with the broker, as required by the clearinghouse on which the transaction is effected. Such amount is shown as cash collateral due from broker on the statement of assets and liabilities. Pursuant to the contract, the Fund agrees to receive from or pay to the broker an amount of cash equal to the daily fluctuation in the value of the contract. Such receipts or payments are known as variation margin and are recorded by the Fund as unrealized gains or losses. Risks may arise from the potential inability of a counterparty to meet the terms of the contract. The credit/counterparty risk for centrally cleared swaps is generally less than non-centrally cleared swaps, since the clearinghouse, which is the issuer or counterparty to each centrally cleared swap, has robust risk mitigation standards, including the requirement to provide initial and variation margin. When the contract is closed, the Fund records a realized gain or loss equal to the difference between the value of the contract at the time it was opened and the time it was closed.
Interest Rate Swaps:
The Fund is subject to interest rate risk exposure in the normal course of pursuing its investment objectives. Because the Fund holds fixed rate bonds, the value of these bonds may decrease if interest rates
| abfunds.com | AB INCOME FUND | 103 | |
NOTES TO FINANCIAL STATEMENTS (continued)
rise. To help hedge against this risk and to maintain its ability to generate income at prevailing market rates, the Fund may enter into interest rate swaps. Interest rate swaps are agreements between two parties to exchange cash flows based on a notional amount. The Fund may elect to pay a fixed rate and receive a floating rate, or, receive a fixed rate and pay a floating rate on a notional amount.
In addition, the Fund may also enter into interest rate swap transactions to preserve a return or spread on a particular investment or portion of its portfolio, or protecting against an increase in the price of securities the Fund anticipates purchasing at a later date. Interest rate swaps involve the exchange by a Fund with another party of their respective commitments to pay or receive interest (e.g., an exchange of floating rate payments for fixed rate payments) computed based on a contractually-based principal (or “notional”) amount. Interest rate swaps are entered into on a net basis (i.e., the two payment streams are netted out, with the Fund receiving or paying, as the case may be, only the net amount of the two payments).
During the six months ended April 30, 2020, the Fund held interest rate swaps for hedging and non-hedging purposes.
Credit Default Swaps:
The Fund may enter into credit default swaps, including to manage its exposure to the market or certain sectors of the market, to reduce its risk exposure to defaults by corporate and sovereign issuers held by the Fund, or to create exposure to corporate or sovereign issuers to which it is not otherwise exposed. The Fund may purchase credit protection (“Buy Contract”) or provide credit protection (“Sale Contract”) on the referenced obligation of the credit default swap. During the term of the swap, the Fund receives/(pays) fixed payments from/(to) the respective counterparty, calculated at the agreed upon rate applied to the notional amount. If the Fund is a buyer/(seller) of protection and a credit event occurs, as defined under the terms of the swap, the Fund will either (i) receive from the seller/(pay to the buyer) of protection an amount equal to the notional amount of the swap (the “Maximum Payout Amount”) and deliver/(take delivery of) the referenced obligation or (ii) receive/(pay) a net settlement amount in the form of cash or securities equal to the notional amount of the swap less the recovery value of the referenced obligation. In certain circumstances Maximum Payout Amounts may be partially offset by recovery values of the respective referenced obligations, upfront premium received upon entering into the agreement, or net amounts received from settlement of buy protection credit default swaps entered into by the Fund for the same referenced obligations with the same counterparty.
| 104 | AB INCOME FUND | abfunds.com | |
NOTES TO FINANCIAL STATEMENTS (continued)
Credit default swaps may involve greater risks than if a Fund had invested in the referenced obligation directly. Credit default swaps are subject to general market risk, liquidity risk, counterparty risk and credit risk. If the Fund is a buyer of protection and no credit event occurs, it will lose the payments it made to its counterparty. If the Fund is a seller of protection and a credit event occurs, the value of the referenced obligation received by the Fund coupled with the periodic payments previously received, may be less than the Maximum Payout Amount it pays to the buyer, resulting in a net loss to the Fund.
Implied credit spreads over U.S. Treasuries of comparable maturity utilized in determining the market value of credit default swaps on issuers as of period end are disclosed in the portfolio of investments. The implied spreads serve as an indicator of the current status of the payment/performance risk and typically reflect the likelihood of default by the issuer of the referenced obligation. The implied credit spread of a particular reference obligation also reflects the cost of buying/selling protection and may reflect upfront payments required to be made to enter into the agreement. Widening credit spreads typically represent a deterioration of the referenced obligation’s credit soundness and greater likelihood of default or other credit event occurring as defined under the terms of the agreement. A credit spread identified as “Defaulted” indicates a credit event has occurred for the referenced obligation.
During the six months ended April 30, 2020, the Fund held credit default swaps for non-hedging purposes.
The Fund typically enters into International Swaps and Derivatives Association, Inc. Master Agreements (“ISDA Master Agreement”) with its OTC derivative contract counterparties in order to, among other things, reduce its credit risk to OTC counterparties. ISDA Master Agreements include provisions for general obligations, representations, collateral and events of default or termination. Under an ISDA Master Agreement, the Fund typically may offset with the OTC counterparty certain derivative financial instruments’ payables and/or receivables with collateral held and/or posted and create one single net payment (close-out netting) in the event of default or termination. In the event of a default by an OTC counterparty, the return of collateral with market value in excess of the Fund’s net liability, held by the defaulting party, may be delayed or denied.
The Fund’s ISDA Master Agreements may contain provisions for early termination of OTC derivative transactions in the event the net assets of the Fund decline below specific levels (“net asset contingent features”). If these levels are triggered, the Fund’s OTC counterparty has the right to
| abfunds.com | AB INCOME FUND | 105 | |
NOTES TO FINANCIAL STATEMENTS (continued)
terminate such transaction and require the Fund to pay or receive a settlement amount in connection with the terminated transaction. If OTC derivatives were held at period end, please refer to netting arrangements by the OTC counterparty table below for additional details.
During the six months ended April 30, 2020, the Fund had entered into the following derivatives:
Asset Derivatives | Liability Derivatives | |||||||||||
Derivative Type | Statement of Location | Fair Value | Statement of Location | Fair Value | ||||||||
Interest rate contracts | Receivable/Payable for variation margin on futures | $ | 17,736,103 | * | Receivable/Payable for variation margin on futures | $ | 6,265,428 | * | ||||
Credit contracts | Receivable/Payable for variation margin on centrally cleared swaps |
| 3,108,373 | * | Receivable/Payable for variation margin on centrally cleared swaps |
| 6,825,220 | * | ||||
Interest rate contracts | Receivable/Payable for variation margin on centrally cleared swaps |
| 18,512,101 | * | ||||||||
Foreign currency contracts | Unrealized appreciation on forward currency exchange contracts |
| 8,954,185 |
| Unrealized depreciation on forward currency exchange contracts |
| 4,957,404 |
| ||||
Credit contracts | Market value on credit default swaps |
| 142,980,092 |
| ||||||||
|
|
|
| |||||||||
Total | $ | 29,798,661 | $ | 179,540,245 | ||||||||
|
|
|
| |||||||||
| * | Only variation margin receivable/payable at period end is reported within the statement of assets and liabilities. This amount reflects cumulative unrealized appreciation/(depreciation) on futures and centrally cleared swaps as reported in the portfolio of investments. |
| 106 | AB INCOME FUND | abfunds.com | |
NOTES TO FINANCIAL STATEMENTS (continued)
This amount reflects cumulative unrealized appreciation/(depreciation) on futures and centrally cleared swaps as reported in the portfolio of investments.
Derivative Type | Location of Gain or (Loss) on Derivatives Within Statement of Operations | Realized Gain or (Loss) on Derivatives | Change in Unrealized Appreciation or (Depreciation) | |||||||||||
Interest rate contracts | Net realized gain (loss) on futures; Net change in unrealized appreciation/depreciation of futures | $ | 30,036,610 |
| $ | 13,694,164 |
| |||||||
Foreign currency contracts | Net realized gain (loss) on forward currency exchange contracts; Net change in unrealized appreciation/depreciation of forward currency exchange contracts |
| 2,304,091 |
|
| 7,333,488 |
| |||||||
Interest rate contracts | Net realized gain (loss) on investment transactions; Net change in unrealized appreciation/depreciation of investments |
| (967,587 | ) |
| – 0 | – | |||||||
Interest rate contracts | Net realized gain (loss) on swaps; Net change in unrealized appreciation/depreciation of swaps |
| (815,118 | ) |
| (8,330,903 | ) | |||||||
Credit contracts | Net realized gain (loss) on swaps; Net change in unrealized appreciation/depreciation of swaps | (41,305,426 | ) | (115,543,800 | ) | |||||||||
|
|
|
| |||||||||||
Total | $ | (10,747,430 | ) | $ | (102,847,051 | ) | ||||||||
|
|
|
| |||||||||||
The following table represents the average monthly volume of the Fund’s derivative transactions during the six months ended April 30, 2020:
Futures: | ||||
Average notional amount of buy contracts | $ | 779,832,397 | ||
Average notional amount of sale contracts | $ | 406,887,487 | ||
Forward Currency Exchange Contracts: | ||||
Average principal amount of buy contracts | $ | 80,651,146 | ||
Average principal amount of sale contracts | $ | 390,306,140 | ||
Purchased Swaptions: | ||||
Average notional amount | $ | 194,920,000 | (a) | |
Centrally Cleared Interest Rate Swaps: | ||||
Average notional amount | $ | 214,895,000 |
| abfunds.com | AB INCOME FUND | 107 | |
NOTES TO FINANCIAL STATEMENTS (continued)
Credit Default Swaps: | ||||
Average notional amount of buy contracts | $ | 25,750,000 | (b) | |
Average notional amount of sale contracts | $ | 382,069,441 | ||
Centrally Cleared Credit Default Swaps: | ||||
Average notional amount of buy contracts | $ | 71,220,361 | (c) | |
Average notional amount of sale contracts | $ | 423,354,636 |
| (a) | Positions were open for three months during the period. |
| (b) | Positions were open for one month during the period. |
| (c) | Positions were open for two months during the period. |
For financial reporting purposes, the Fund does not offset derivative assets and derivative liabilities that are subject to netting arrangements in the statement of assets and liabilities.
All OTC derivatives held at period end were subject to netting arrangements. The following table presents the Fund’s derivative assets and liabilities by OTC counterparty net of amounts available for offset under ISDA Master Agreements (“MA”) and net of the related collateral received/pledged by the Fund as of April 30, 2020. Exchange-traded derivatives and centrally cleared swaps are not subject to netting arrangements and as such are excluded from the table.
Counterparty | Derivative Assets Subject to a MA | Derivatives Available for Offset | Cash Collateral Received* | Security Collateral Received* | Net Amount of Derivative Assets | |||||||||||||||
Deutsche Bank AG | $ | 981,722 | $ | (981,722 | ) | $ | – 0 | – | $ | –0 | – | $ | –0 | – | ||||||
Goldman Sachs Bank USA/Goldman Sachs International | 964,660 | (964,660 | ) | – 0 | – | – 0 | – | – 0 | – | |||||||||||
JPMorgan Chase Bank, NA/JPMorgan Securities LLC | 231,927 | (231,927 | ) | – 0 | – | – 0 | – | – 0 | – | |||||||||||
Morgan Stanley & Co. International PLC/Morgan Stanley Capital Services LLC/Morgan Stanley Capital Services, Inc. | 856,943 | (856,943 | ) | – 0 | – | – 0 | – | – 0 | – | |||||||||||
Standard Chartered Bank | 5,503,421 | – 0 | – | (5,503,421 | ) | – 0 | – | – 0 | – | |||||||||||
State Street Bank & Trust Co. | 9,465 | (9,465 | ) | – 0 | – | – 0 | – | – 0 | – | |||||||||||
UBS AG | 406,047 | (406,047 | ) | – 0 | – | – 0 | – | – 0 | – | |||||||||||
|
|
|
|
|
|
|
|
|
| |||||||||||
Total | $ | 8,954,185 | $ | (3,450,764 | ) | $ | (5,503,421 | ) | $ | – 0 | – | $ | – 0 | –^ | ||||||
|
|
|
|
|
|
|
|
|
| |||||||||||
| 108 | AB INCOME FUND | abfunds.com | |
NOTES TO FINANCIAL STATEMENTS (continued)
Counterparty | Derivative Liabilities Subject to a MA | Derivatives Available for Offset | Cash Collateral Pledged* | Security Collateral Pledged* | Net Amount of Derivative Liabilities | |||||||||||||||
Bank of America, NA | $ | 940,888 | $ | – 0 | – | $ | – 0 | – | $ | – 0 | – | $ | 940,888 | |||||||
Barclays Bank PLC | 2,575,334 | – 0 | – | – 0 | – | (2,519,974 | ) | 55,360 | ||||||||||||
Citibank, NA | 44,808 | – 0 | – | – 0 | – | – 0 | – | 44,808 | ||||||||||||
Citigroup Global Markets, Inc. | 61,224,647 | – 0 | – | (2,657,000 | ) | (58,567,647 | ) | – 0 | – | |||||||||||
Credit Suisse International | 12,559,554 | – 0 | – | – 0 | – | (12,559,554 | ) | – 0 | – | |||||||||||
Deutsche Bank AG | 13,118,223 | (981,722 | ) | (270,000 | ) | (11,866,501 | ) | – 0 | – | |||||||||||
Goldman Sachs Bank USA/Goldman Sachs International | 40,970,937 | (964,660 | ) | – 0 | – | (40,006,277 | ) | – 0 | – | |||||||||||
JPMorgan Securities LLC | 9,467,846 | (231,927 | ) | – 0 | – | (9,235,919 | ) | – 0 | – | |||||||||||
Morgan Stanley & Co. International PLC/Morgan Stanley Capital Services LLC/Morgan Stanley Capital Services, Inc. | 4,416,708 | (856,943 | ) | – 0 | – | (3,523,062 | ) | 36,703 | ||||||||||||
State Street Bank & Trust Co. | 1,325,772 | (9,465 | ) | – 0 | – | (1,316,307 | ) | – 0 | – | |||||||||||
UBS AG | 1,292,779 | (406,047 | ) | – 0 | – | – 0 | – | 886,732 | ||||||||||||
|
|
|
|
|
|
|
|
|
| |||||||||||
Total | $ | 147,937,496 | $ | (3,450,764 | ) | $ | (2,927,000 | ) | $ | (139,595,241 | ) | $ | 1,964,491 | ^ | ||||||
|
|
|
|
|
|
|
|
|
| |||||||||||
| * | The actual collateral received/pledged may be more than the amount reported due to over-collateralization. |
| ^ | Net amount represents the net receivable/payable that would be due from/to the counterparty in the event of default or termination. The net amount from OTC financial derivative instruments can only be netted across transactions governed under the same master agreement with the same counterparty. |
2. Currency Transactions
The Fund may invest in non-U.S. Dollar-denominated securities on a currency hedged or unhedged basis. The Fund may seek investment opportunities by taking long or short positions in currencies through the use of currency-related derivatives, including forward currency exchange contracts, futures and options on futures, swaps, and other options. The Fund may enter into transactions for investment opportunities when it anticipates that a foreign currency will appreciate or depreciate in value but securities denominated in that currency are not held by the Fund and do not present attractive investment opportunities. Such transactions may also be used
| abfunds.com | AB INCOME FUND | 109 | |
NOTES TO FINANCIAL STATEMENTS (continued)
when the Adviser believes that it may be more efficient than a direct investment in a foreign currency-denominated security. The Fund may also conduct currency exchange contracts on a spot basis (i.e., for cash at the spot rate prevailing in the currency exchange market for buying or selling currencies).
3. TBA and Dollar Rolls
The Fund may invest in TBA mortgage-backed securities. A TBA, or “To Be Announced”, trade represents a contract for the purchase or sale of mortgage-backed securities to be delivered at a future agree-upon date; however, the specific mortgage pool numbers or the number of pools that will be delivered to fulfill the trade obligation or terms of the contract are unknown at the time of the trade. Mortgage pools (including fixed-rate or variable-rate mortgages) guaranteed by the Government National Mortgage Association, or GNMA, the Federal National Mortgage Association, or FNMA, or the Federal Home Loan Mortgage Corporation, or FHLMC, are subsequently allocated to the TBA transactions.
The Fund may enter into certain TBA transactions known as dollar rolls. Dollar rolls involve sales by the Fund of securities for delivery in the current month and the Fund’s simultaneously contracting to repurchase substantially similar (same type and coupon) securities on a specified future date. During the roll period, the Fund forgoes principal and interest paid on the securities. The Fund is compensated by the difference between the current sales price and the lower forward price for the future purchase (often referred to as the “drop”) as well as by the interest earned on the cash proceeds of the initial sale. Dollar rolls involve the risk that the market value of the securities the Fund is obligated to repurchase under the agreement may decline below the repurchase price. Dollar rolls are speculative techniques. For the six months ended April 30, 2020, the Fund earned drop income of $464,934 which is included in interest income in the accompanying statement of operations.
4. Reverse Repurchase Agreements
The Fund may enter into reverse repurchase transactions (“RVP”) in accordance with the terms of a Master Repurchase Agreement (“MRA”), under which the Fund sells securities and agrees to repurchase them at a mutually agreed upon date and price. At the time the Fund enters into a reverse repurchase agreement, it will establish a segregated account with the custodian containing liquid assets having a value comparable to the repurchase price. Under the MRA and other Master Agreements, the Fund is permitted to offset payables and/or receivables with collateral held and/or posted to the counterparty and create one single net payment due to or from the Fund in the event of a default. In the event of a default by a MRA counterparty, the Fund may be considered an unsecured creditor
| 110 | AB INCOME FUND | abfunds.com | |
NOTES TO FINANCIAL STATEMENTS (continued)
with respect to any excess collateral (collateral with a market value in excess of the repurchase price) held by and/or posted to the counterparty, and as such the return of such excess collateral may be delayed or denied. For the six months ended April 30, 2020, the average amount of reverse repurchase agreements outstanding was $15,436,752 and the daily weighted average interest rate was 0.37%. At April 30, 2020, the Fund had reverse repurchase agreements outstanding in the amount of $90,549,169 as reported on the statement of assets and liabilities.
The following table presents the Fund’s RVP liabilities by counterparty net of the related collateral pledged by the Fund as of April 30, 2020:
Counterparty | RVP Liabilities Subject to a MRA | Securities Collateral Pledged†* | Net Amount of RVP Liabilities | |||||||||
Barclays Capital, Inc. | $ | 2,803,817 | $ | (2,803,817 | ) | $ | – 0 | – | ||||
First Boston | 1,341,320 | (1,304,077 | ) | 37,243 | ||||||||
JPMorgan Chase Bank | 86,404,032 | (86,404,032 | ) | – 0 | – | |||||||
|
|
|
|
|
| |||||||
Total | $ | 90,549,169 | $ | (90,511,926 | ) | $ | 37,243 | |||||
|
|
|
|
|
| |||||||
| † | Including accrued interest. |
| * | The actual collateral pledged may be more than the amount reported due to overcollateralization. |
5. Loan Participations and Assignments
The Fund may invest in direct debt instruments which are interests in amounts owed to lenders or lending syndicates by corporate, governmental, or other borrowers, either in the form of participations at the time the loan is originated (“Participations”) or by buying an interest in the loan in the secondary market from a financial institution or institutional investor (“Assignments”). A loan is often administered by a bank or other financial institution (the “Lender”) that acts as agent for all holders. The agent administers the term of the loan as specified in the loan agreement. When investing in Participations, the Fund generally has no right to enforce compliance with the terms of the loan agreement with the borrower. In addition, when investing in Participations, the Fund has the right to receive payments of principal, interest and any fees to which it is entitled only from the Lender and only upon receipt of payments by the Lender from the borrower. As a result, the Fund may be subject to the credit risk of both the borrower and the Lender. When the Fund purchases Assignments from Lenders, it will typically acquire direct rights against the borrower on the loan. These loans may include participations in “bridge loans”, which are loans taken out by borrowers for a short period (typically less than six months) pending arrangement of more permanent financing through, for example, the issuance of bonds, frequently high-yield bonds issued for the purpose of acquisitions. The Fund may also participate in unfunded loan commitments, which are contractual obligations for investing in future Participations, and may receive a commitment fee based on the amount of
| abfunds.com | AB INCOME FUND | 111 | |
NOTES TO FINANCIAL STATEMENTS (continued)
the commitment. Under these arrangements, the Fund may receive a fixed rate commitment fee and, if and to the extent the borrower borrows under the facility, the Fund may receive an additional funding fee.
Unfunded loan commitments and funded loans are marked to market daily.
During the six months ended April 30, 2020, the Fund had no commitments outstanding and did not receive commitment fees.
NOTE E
Capital Stock
Each class consists of 3,000,000,000 authorized shares. Transactions in capital shares for each class were as follows:
| Shares | Amount | |||||||||||||||||||||||
| Six Months Ended April 30, 2020 (unaudited) | Year Ended October 31, 2019 | Six Months Ended April 30, 2020 (unaudited) | Year Ended 2019 | |||||||||||||||||||||
|
|
|
|
|
|
|
| |||||||||||||||||
| Class A |
| |||||||||||||||||||||||
Shares sold | 12,253,707 | 19,499,931 | $ | 97,302,788 | $ | 151,947,171 | ||||||||||||||||||
|
|
|
|
|
|
|
|
| ||||||||||||||||
Shares issued in reinvestment of dividends and distributions | 373,317 | 691,103 | 2,938,519 | 5,360,840 | ||||||||||||||||||||
|
|
|
|
|
|
|
|
| ||||||||||||||||
Shares converted from Class C | 42,418 | 292,725 | 333,687 | 2,325,762 | ||||||||||||||||||||
|
|
|
|
|
|
|
|
| ||||||||||||||||
Shares redeemed | (8,279,234 | ) | (21,445,308 | ) | (63,949,174 | ) | (163,431,602 | ) | ||||||||||||||||
|
|
|
|
|
|
|
|
| ||||||||||||||||
Net increase (decrease) | 4,390,208 | (961,549 | ) | $ | 36,625,820 | $ | (3,797,829 | ) | ||||||||||||||||
|
|
|
|
|
|
|
|
| ||||||||||||||||
| Class C |
| |||||||||||||||||||||||
Shares sold | 7,615,796 | 12,928,047 | $ | 60,641,469 | $ | 101,302,295 | ||||||||||||||||||
|
|
|
|
|
|
|
|
| ||||||||||||||||
Shares issued in reinvestment of dividends and distributions | 220,097 | 331,542 | 1,733,604 | 2,584,334 | ||||||||||||||||||||
|
|
|
|
|
|
|
|
| ||||||||||||||||
Shares converted to Class A | (42,364 | ) | (292,359 | ) | (333,687 | ) | (2,325,762 | ) | ||||||||||||||||
|
|
|
|
|
|
|
|
| ||||||||||||||||
Shares redeemed | (2,968,351 | ) | (3,371,776 | ) | (22,812,730 | ) | (25,885,420 | ) | ||||||||||||||||
|
|
|
|
|
|
|
|
| ||||||||||||||||
Net increase | 4,825,178 | 9,595,454 | $ | 39,228,656 | $ | 75,675,447 | ||||||||||||||||||
|
|
|
|
|
|
|
|
| ||||||||||||||||
| 112 | AB INCOME FUND | abfunds.com | |
NOTES TO FINANCIAL STATEMENTS (continued)
| Shares | Amount | |||||||||||||||||||||||
| Six Months Ended April 30, 2020 (unaudited) | Year Ended October 31, 2019 | Six Months Ended April 30, 2020 (unaudited) | Year Ended 2019 | |||||||||||||||||||||
| Advisor Class |
| |||||||||||||||||||||||
Shares sold | 172,954,849 | 243,748,977 | $ | 1,368,091,407 | $ | 1,904,501,801 | ||||||||||||||||||
|
|
|
|
|
|
|
|
| ||||||||||||||||
Shares issued in reinvestment of dividends and distributions | 5,864,943 | 9,782,125 | 46,218,385 | 76,229,658 | ||||||||||||||||||||
|
|
|
|
|
|
|
|
| ||||||||||||||||
Shares redeemed | (130,011,335 | ) | (104,179,175 | ) | (994,968,867 | ) | (797,152,706 | ) | ||||||||||||||||
|
|
|
|
|
|
|
|
| ||||||||||||||||
Net increase | 48,808,457 | 149,351,927 | $ | 419,340,925 | $ | 1,183,578,753 | ||||||||||||||||||
|
|
|
|
|
|
|
|
| ||||||||||||||||
| Class Z(a) |
| |||||||||||||||||||||||
Shares sold | 2,335,302 | – 0 | – | $ | 17,031,382 | $ | – 0 | – | ||||||||||||||||
|
|
|
|
|
|
|
|
| ||||||||||||||||
Share issued in reinvestment of dividends and distributions | 5,273 | – 0 | – | 39,858 | – 0 | – | ||||||||||||||||||
|
|
|
|
|
|
|
|
| ||||||||||||||||
Shares redeemed | (174,663 | ) | – 0 | – | (1,289,447 | ) | – 0 | – | ||||||||||||||||
|
|
|
|
|
|
|
|
| ||||||||||||||||
Net increase | 2,165,912 | – 0 | – | $ | 15,781,793 | $ | – 0 | – | ||||||||||||||||
|
|
|
|
|
|
|
|
| ||||||||||||||||
| (a) | Commenced distributions on November 20, 2019. |
NOTE F
Risks Involved in Investing in the Fund
Market Risk—The market value of a security may move up or down, sometimes rapidly and unpredictably. These fluctuations may cause a security to be worth less than the price originally paid for it, or less than it was worth at an earlier time. Market risk may affect a single issuer, industry, sector of the economy or the market as a whole. Global economies and financial markets are increasingly interconnected, which increases the probabilities that conditions in one country or region might adversely impact issuers in a different country or region. Conditions affecting the general economy, including political, social, or economic instability at the local, regional, or global level may also affect the market value of a security. Health crises, such as pandemic and epidemic diseases, as well as other incidents that interrupt the expected course of events, such as natural disasters, war or civil disturbance, acts of terrorism, power outages and other unforeseeable and external events, and the public response to or fear of such diseases or events, have and may in the future have an adverse effect on the Fund’s investments and net asset value and can lead to increased market volatility. For example, any preventative or protective actions that governments may take in respect of such diseases or events may result in periods of business disruption, inability to obtain raw materials, supplies and component parts, and reduced or disrupted operations for the Fund’s portfolio companies. The occurrence and pendency of such diseases or events could adversely affect the economies and financial markets either in specific countries or worldwide.
| abfunds.com | AB INCOME FUND | 113 | |
NOTES TO FINANCIAL STATEMENTS (continued)
Credit Risk—An issuer or guarantor of a fixed-income security, or the counterparty to a derivatives or other contract, may be unable or unwilling to make timely payments of interest or principal, or to otherwise honor its obligations. The issuer or guarantor may default, causing a loss of the full principal amount of a security and any accrued interest. The degree of risk for a particular security may be reflected in its credit rating. There is the possibility that the credit rating of a fixed-income security may be downgraded after purchase, which may adversely affect the value of the security.
Below Investment Grade Securities Risk—Investments in fixed-income securities with lower ratings (commonly known as “junk bonds”) are subject to a higher probability that an issuer will default or fail to meet its payment obligations. These securities may be subject to greater price volatility due to such factors as specific corporate developments and negative perceptions of the junk bond market generally and may be more difficult to trade than other types of securities.
Interest Rate Risk—Changes in interest rates will affect the value of investments in fixed-income securities. When interest rates rise, the value of existing investments in fixed-income securities tends to fall and this decrease in value may not be offset by higher income from new investments. Interest rate risk is generally greater for fixed-income securities with longer maturities or durations.
Duration Risk—Duration is a measure that relates the expected price volatility of a fixed-income security to changes in interest rates. The duration of a fixed-income security may be shorter than or equal to full maturity of a fixed-income security. Fixed-income securities with longer durations have more risk and will decrease in price as interest rates rise.
Inflation Risk—This is the risk that the value of assets or income from investments will be less in the future as inflation decreases the value of money. As inflation increases, the value of the Fund’s assets can decline as can the value of the Fund’s distributions. This risk is significantly greater for fixed-income securities with longer maturities.
Foreign (Non-U.S.) Risk—Investments in securities of non-U.S. issuers may involve more risk than those of U.S. issuers. These securities may fluctuate more widely in price and may be more difficult to trade due to adverse market, economic, political, regulatory or other factors.
Emerging Market Risk—Investments in emerging market countries may have more risk because the markets are less developed and less liquid as well as being subject to increased economic, political, regulatory or other uncertainties.
| 114 | AB INCOME FUND | abfunds.com | |
NOTES TO FINANCIAL STATEMENTS (continued)
Leverage Risk—When the Fund borrows money or otherwise leverages its investments, its performance may be volatile because leverage tends to exaggerate the effect of any increase or decrease in the value of the Fund’s investments. The Fund may create leverage through the use of reverse repurchase arrangements, forward currency exchange contracts, forward commitments, dollar rolls or futures or by borrowing money. The use of other types of derivative instruments by the Fund, such as options and swaps, may also result in a form of leverage. Leverage may result in higher returns to the Fund than if the Fund were not leveraged, but may also adversely affect returns, particularly if the market is declining.
Currency Risk—Fluctuations in currency exchange rates may negatively affect the value of the Fund’s investments or reduce its returns.
Illiquid Investments Risk—Illiquid investments risk exists when certain investments are or become difficult to purchase or sell. Difficulty in selling such investments may result in sales at disadvantageous prices affecting the value of your investment in the Fund. Causes of illiquid investments risk may include low trading volumes, large positions and heavy redemptions of Fund shares. Illiquid investments risk may be higher in a rising interest rate environment, when the value and liquidity of fixed-income securities generally decline.
Mortgage-Related and/or Other Asset-Backed Securities Risk—Investments in mortgage-related and other asset-backed securities are subject to certain additional risks. The value of these securities may be particularly sensitive to changes in interest rates. These risks include “extension risk”, which is the risk that, in periods of rising interest rates, issuers may delay the payment of principal, and “prepayment risk”, which is the risk that in periods of falling interest rates, issuers may pay principal sooner than expected, exposing the Fund to a lower rate of return upon reinvestment of principal. Mortgage-backed securities offered by non-governmental issuers and other asset-backed securities may be subject to other risks, such as higher rates of default in the mortgages or assets backing the securities or risks associated with the nature and servicing of mortgages or assets backing the securities.
Derivatives Risk—The Fund may enter into derivative transactions such as forwards, options, futures and swaps. Derivatives may be illiquid, difficult to price, and leveraged so that small changes may produce disproportionate losses for the Fund, and subject to counterparty risk to a greater degree than more traditional investments. Derivatives may result in significant losses, including losses that are far greater than the value of the derivatives reflected on the statement of assets and liabilities.
| abfunds.com | AB INCOME FUND | 115 | |
NOTES TO FINANCIAL STATEMENTS (continued)
LIBOR Risk—The Fund may invest in certain debt securities, derivatives or other financial instruments that utilize the London Interbank Offered Rate, or “LIBOR,” as a “benchmark” or “reference rate” for various interest rate calculations. In July 2017, the United Kingdom Financial Conduct Authority, which regulates LIBOR, announced a desire to phase out the use of LIBOR by the end of 2021. Although financial regulators and industry working groups have suggested alternative reference rates, such as European Interbank Offer Rate (“EURIBOR”), Sterling Overnight Interbank Average Rate (“SONIA”) and Secured Overnight Financing Rate (“SOFR”), global consensus on alternative rates is lacking and the process for amending existing contracts or instruments to transition away from LIBOR remains unclear. The elimination of LIBOR or changes to other reference rates or any other changes or reforms to the determination or supervision of reference rates could have an adverse impact on the market for, or value of, any securities or payments linked to those reference rates, which may adversely affect the Fund’s performance and/or net asset value. Uncertainty and risk also remain regarding the willingness and ability of issuers and lenders to include revised provisions in new and existing contracts or instruments. Consequently, the transition away from LIBOR to other reference rates may lead to increased volatility and illiquidity in markets that are tied to LIBOR, fluctuations in values of LIBOR-related investments or investments in issuers that utilize LIBOR, increased difficulty in borrowing or refinancing and diminished effectiveness of hedging strategies, adversely affecting the Fund’s performance. Furthermore, the risks associated with the expected discontinuation of LIBOR and transition may be exacerbated if the work necessary to effect an orderly transition to an alternative reference rate is not completed in a timely manner. Because the usefulness of LIBOR as a benchmark could deteriorate during the transition period, these effects could occur prior to the end of 2021.
Indemnification Risk—In the ordinary course of business, the Fund enters into contracts that contain a variety of indemnifications. The Fund’s maximum exposure under these arrangements is unknown. However, the Fund has not had prior claims or losses pursuant to these indemnification provisions and expects the risk of loss thereunder to be remote. Therefore, the Fund has not accrued any liability in connection with these indemnification provisions.
Management Risk—The Fund is subject to management risk because it is an actively-managed investment fund. The Adviser will apply its investment techniques and risk analyses in making investment decisions, but there is no guarantee that its techniques will produce the intended results.
| 116 | AB INCOME FUND | abfunds.com | |
NOTES TO FINANCIAL STATEMENTS (continued)
NOTE G
Joint Credit Facility
A number of open-end mutual funds managed by the Adviser, including the Fund, participate in a $325 million revolving credit facility (the “Facility”) intended to provide short-term financing, if necessary, subject to certain restrictions in connection with abnormal redemption activity. Commitment fees related to the Facility are paid by the participating funds and are included in miscellaneous expenses in the statement of operations. The Fund did not utilize the Facility during the six months ended April 30, 2020.
NOTE H
Distributions to Shareholders
The tax character of distributions to be paid for the year ending October 31, 2020 will be determined at the end of the current fiscal year. The tax character of distributions paid during the fiscal years ended October 31, 2019 and October 31, 2018 were as follows:
| 2019 | 2018 | |||||||
Distributions paid from: | ||||||||
Ordinary income | $ | 112,953,691 | $ | 119,744,550 | ||||
|
|
|
| |||||
Total taxable distributions paid | $ | 112,953,691 | $ | 119,744,550 | ||||
Return of capital | 20,741,741 | 10,545,474 | ||||||
|
|
|
| |||||
Total distributions paid | $ | 133,695,432 | $ | 130,290,024 | ||||
|
|
|
| |||||
As of October 31, 2019, the components of accumulated earnings/(deficit) on a tax basis were as follows:
Accumulated capital and other losses | $ | (82,260,748 | )(a) | |
Unrealized appreciation/(depreciation) | 55,324,791 | (b) | ||
|
| |||
Total accumulated earnings/(deficit) | $ | (26,935,957 | )(c) | |
|
|
| (a) | As of October 31, 2019, the Fund had a net capital loss carryforward of $76,251,662. During the fiscal year, the Fund utilized $61,735,806 of capital loss carry forwards to offset current year net realized gains. As of October 31, 2019, the cumulative deferred loss on straddles was $6,009,086. |
| (b) | The differences between book-basis and tax-basis unrealized appreciation/(depreciation) are attributable primarily to the recognition for tax purposes of unrealized gains/losses on certain derivative instruments, the tax treatment of passive foreign investment companies (PFICs), the tax treatment of swaps, the tax deferral of losses on wash sales, the tax treatment of partnership investments, and the tax treatment of grantor trusts. |
| (c) | The differences between book-basis and tax-basis components of accumulated earnings/(deficit) are attributable primarily to the accrual of foreign capital gains tax, the tax treatment of defaulted securities, and dividends payable. |
For tax purposes, net realized capital losses may be carried over to offset future capital gains, if any. Funds are permitted to carry forward capital losses for an indefinite period, and such losses will retain their character as either short-term or long-term capital losses. As of October 31, 2019, the Fund had a net short-term capital loss carryforward of $9,151,496 and a
| abfunds.com | AB INCOME FUND | 117 | |
NOTES TO FINANCIAL STATEMENTS (continued)
net long-term capital loss carryforward of $67,100,166, which may be carried forward for an indefinite period.
NOTE I
Recent Accounting Pronouncements
In March 2017, the Financial Accounting Standards Board issued an Accounting Standards Update, ASU 2017-08, Receivables—Nonrefundable Fees and Other Costs (Subtopic 310-20), Premium Amortization on Purchased Callable Debt Securities which amends the amortization period for certain purchased callable debt securities held at a premium, shortening such period to the earliest call date. ASU 2017-08 does not require any accounting change for debt securities held at a discount; the discount continues to be amortized to maturity. ASU 2017-08 is effective for fiscal years, and interim periods within those fiscal years, beginning after December 15, 2018. The Fund has adopted ASU 2017-08, which did not have a material impact on the Fund’s financial position or the results of its operations, and had no impact on the Fund’s net assets.
NOTE J
Subsequent Events
Management has evaluated subsequent events for possible recognition or disclosure in the financial statements through the date the financial statements are issued. Management has determined that there are no material events that would require disclosure in the Fund’s financial statements through this date.
| 118 | AB INCOME FUND | abfunds.com | |
FINANCIAL HIGHLIGHTS
Selected Data For A Share Of Capital Stock Outstanding Throughout Each Period
| Class A | ||||||||||||||||||||
Six Months (unaudited) | Year Ended October 31, | April 21, 2016(a) to October 31, 2016 | ||||||||||||||||||
| 2019 | 2018 | 2017 | ||||||||||||||||||
|
| |||||||||||||||||||
Net asset value, beginning of period | $ 7.98 | $ 7.49 | $ `8.09 | $ 8.08 | $ 7.99 | |||||||||||||||
|
| |||||||||||||||||||
Income From Investment Operations | ||||||||||||||||||||
Net investment income(b)(c) | .11 | .31 | .29 | .36 | .17 | † | ||||||||||||||
Net realized and unrealized gain (loss) on investment and foreign currency transactions | (.40 | ) | .53 | (.50 | ) | .05 | .08 | |||||||||||||
Contributions from Affiliates | – 0 | – | .00 | (d) | .00 | (d) | .00 | (d) | – 0 | – | ||||||||||
|
| |||||||||||||||||||
Net increase (decrease) in net asset value from operations | (.29 | ) | .84 | (.21 | ) | .41 | .25 | |||||||||||||
|
| |||||||||||||||||||
Less: Dividends and Distributions | ||||||||||||||||||||
Dividends from net investment income | (.14 | ) | (.30 | ) | (.36 | ) | (.40 | ) | (.16 | ) | ||||||||||
Return of capital | – 0 | – | (.05 | ) | (.03 | ) | – 0 | – | – 0 | – | ||||||||||
|
| |||||||||||||||||||
Total dividends and distributions | (.14 | ) | (.35 | ) | (.39 | ) | (.40 | ) | (.16 | ) | ||||||||||
|
| |||||||||||||||||||
Net asset value, end of period | $ 7.55 | $ 7.98 | $ 7.49 | $ 8.09 | $ 8.08 | |||||||||||||||
|
| |||||||||||||||||||
Total Return | ||||||||||||||||||||
Total investment return based on net asset value(e) | (3.72 | )% | 11.50 | % | (2.71 | ) % | 5.17 | % | 3.14 | %† | ||||||||||
Ratios/Supplemental Data | ||||||||||||||||||||
Net assets, end of period (000’s omitted) | $260,673 | $240,567 | $232,931 | $165,294 | $2,104 | |||||||||||||||
Ratio to average net assets of: | ||||||||||||||||||||
Expenses, net of waivers/reimbursements(f) | .77 | %^ | .77 | % | 1.08 | % | 1.03 | % | 1.16 | %^ | ||||||||||
Expenses, before waivers/reimbursements(f) | .78 | %^ | .83 | % | 1.16 | % | 1.11 | % | 1.37 | %^ | ||||||||||
Net investment income(c) | 2.93 | %^ | 4.02 | % | 3.73 | % | 4.42 | % | 4.06 | %†^ | ||||||||||
Portfolio turnover rate** | 111 | % | 270 | % | 105 | % | 42 | % | 14 | % | ||||||||||
See footnote summary on page 122-123.
| abfunds.com | AB INCOME FUND | 119 | |
FINANCIAL HIGHLIGHTS (continued)
Selected Data For A Share Of Capital Stock Outstanding Throughout Each Period
| Class C | ||||||||||||||||||||
Six Months (unaudited) | Year Ended October 31, | April 21, 2016(a) to October 31, 2016 | ||||||||||||||||||
| 2019 | 2018 | 2017 | ||||||||||||||||||
|
| |||||||||||||||||||
Net asset value, beginning of period | $ 7.99 | $ 7.50 | $ 8.10 | $ 8.09 | $ 7.99 | |||||||||||||||
|
| |||||||||||||||||||
Income From Investment Operations | ||||||||||||||||||||
Net investment income(b)(c) | .08 | .25 | .23 | .30 | .14 | † | ||||||||||||||
Net realized and unrealized gain (loss) on investment and foreign currency transactions | (.40 | ) | .53 | (.50 | ) | .05 | .09 | |||||||||||||
Contributions from Affiliates | – 0 | – | .00 | (d) | .00 | (d) | .00 | (d) | – 0 | – | ||||||||||
|
| |||||||||||||||||||
Net increase (decrease) in net asset value from operations | (.32 | ) | .78 | (.27 | ) | .35 | .23 | |||||||||||||
|
| |||||||||||||||||||
Less: Dividends and Distributions | ||||||||||||||||||||
Dividends from net investment income | (.11 | ) | (.25 | ) | (.30 | ) | (.34 | ) | (.13 | ) | ||||||||||
Return of capital | – 0 | – | (.04 | ) | (.03 | ) | – 0 | – | – 0 | – | ||||||||||
|
| |||||||||||||||||||
Total dividends and distributions | (.11 | ) | (.29 | ) | (.33 | ) | (.34 | ) | (.13 | ) | ||||||||||
|
| |||||||||||||||||||
Net asset value, end of period | $ 7.56 | $ 7.99 | $ 7.50 | $ 8.10 | $ 8.09 | |||||||||||||||
|
| |||||||||||||||||||
Total Return | ||||||||||||||||||||
Total investment return based on net asset value(e) | (4.07 | )% | 10.65 | % | (3.43 | )% | 4.37 | % | 2.85 | %† | ||||||||||
Ratios/Supplemental Data | ||||||||||||||||||||
Net assets, end of period (000’s omitted) | $191,967 | $164,413 | $82,283 | $62,121 | $1,133 | |||||||||||||||
Ratio to average net assets of: | ||||||||||||||||||||
Expenses, net of waivers/reimbursements(f) | 1.52 | %^ | 1.52 | % | 1.83 | % | 1.78 | % | 1.90 | %^ | ||||||||||
Expenses, before waivers/reimbursements(f) | 1.53 | %^ | 1.57 | % | 1.92 | % | 1.87 | % | 2.15 | %^ | ||||||||||
Net investment income(c) | 2.17 | %^ | 3.21 | % | 2.98 | % | 3.68 | % | 3.34 | %†^ | ||||||||||
Portfolio turnover rate** | 111 | % | 270 | % | 105 | % | 42 | % | 14 | % | ||||||||||
See footnote summary on page 122-123.
| 120 | AB INCOME FUND | abfunds.com | |
FINANCIAL HIGHLIGHTS (continued)
Selected Data For A Share Of Capital Stock Outstanding Throughout Each Period
| Advisor Class | ||||||||||||||||||||||||||||
Six Months (unaudited) | Year Ended October 31, | January 1, 2016 to October 31, | Year Ended December 31, | |||||||||||||||||||||||||
| 2019 | 2018 | 2017 | 2016(g) | 2015 | 2014 | |||||||||||||||||||||||
|
| |||||||||||||||||||||||||||
Net asset value, beginning of period | $ 7.99 | $ 7.50 | $ 8.10 | $ 8.09 | $ 7.86 | $ 8.34 | $ 8.13 | |||||||||||||||||||||
|
| |||||||||||||||||||||||||||
Income From Investment Operations | ||||||||||||||||||||||||||||
Net investment income(b) | .12 | (c) | .33 | (c) | .31 | (c) | .41 | (c) | .29 | (c)† | .38 | .42 | ||||||||||||||||
Net realized and unrealized gain (loss) on investment and foreign currency transactions | (.40 | ) | .53 | (.50 | ) | .02 | .22 | (.41 | ) | .19 | ||||||||||||||||||
Contributions from Affiliates | – 0 | – | .00 | (d) | .00 | (d) | .00 | (d) | – 0 | – | – 0 | – | – 0 | – | ||||||||||||||
|
| |||||||||||||||||||||||||||
Net increase (decrease) in net asset value from operations | (.28 | ) | .86 | (.19 | ) | .43 | .51 | (.03 | ) | .61 | ||||||||||||||||||
|
| |||||||||||||||||||||||||||
Less: Dividends and Distributions | ||||||||||||||||||||||||||||
Dividends from net investment income | (.15 | ) | (.31 | ) | (.38 | ) | (.42 | ) | (.28 | ) | (.46 | ) | (.45 | ) | ||||||||||||||
Distributions from net realized gain on investment transactions | – 0 | – | – 0 | – | – 0 | – | – 0 | – | – 0 | – | (.05 | ) | – 0 | – | ||||||||||||||
Return of capital | – 0 | – | (.06 | ) | (.03 | ) | – 0 | – | – 0 | – | – 0 | – | – 0 | – | ||||||||||||||
|
| |||||||||||||||||||||||||||
Total dividends and distributions | (.15 | ) | (.37 | ) | (.41 | ) | (.42 | ) | (.28 | ) | (.51 | ) | (.45 | ) | ||||||||||||||
|
| |||||||||||||||||||||||||||
Redemption fee | – 0 | – | – 0 | – | – 0 | – | – 0 | – | .00 | (d) | – 0 | – | – 0 | – | ||||||||||||||
Anti-Dilutive Effect of Share Repurchase Program | – 0 | – | – 0 | – | – 0 | – | – 0 | – | – 0 | – | .06 | .05 | ||||||||||||||||
|
| |||||||||||||||||||||||||||
Net asset value, end of period | $ 7.56 | $ 7.99 | $ 7.50 | $ 8.10 | $ 8.09 | $ 7.86 | $ 8.34 | |||||||||||||||||||||
|
| |||||||||||||||||||||||||||
Market value, end of period | N/A | N/A | N/A | N/A | N/A | $7.67 | $7.47 | |||||||||||||||||||||
|
| |||||||||||||||||||||||||||
Discount, end of period | N/A | N/A | N/A | N/A | N/A | (2.42 | )% | (10.43 | )% | |||||||||||||||||||
Total Return | ||||||||||||||||||||||||||||
Total investment return based on: | ||||||||||||||||||||||||||||
Market value | N/A | N/A | N/A | N/A | N/A | 9.71 | %(h) | 11.28 | %(h) | |||||||||||||||||||
Net asset value | (3.59 | )%(e) | 11.76 | %(e) | (2.46 | )%(e) | 5.44 | %(e) | 6.66 | %(e)† | .70 | %(h) | 8.96 | %(h) | ||||||||||||||
Ratios/Supplemental Data |
| |||||||||||||||||||||||||||
Net assets, end of period (000,000’s omitted) | $3,738 | $3,562 | $2,222 | $1,806 | $916 | $1,696 | $1,902 | |||||||||||||||||||||
Ratio to average net assets of: | ||||||||||||||||||||||||||||
Expenses, net of waivers/reimbursements(f) | .52 | %^ | .52 | % | .83 | % | .81 | % | .88 | %^ | `.75 | % | .67 | % | ||||||||||||||
Expenses, before waivers/reimbursements(f) | .53 | %^ | .58 | % | .91 | % | .93 | % | .96 | %^ | .75 | % | .67 | % | ||||||||||||||
Net investment income | 3.17 | %(c)^ | 4.24 | %(c) | 3.98 | %(c) | 5.11 | %(c) | 4.29 | %(c)†^ | 4.57 | % | 5.02 | % | ||||||||||||||
Portfolio turnover rate** | 111 | % | 270 | % | 105 | % | 42 | % | 14 | % | 34 | % | 32 | % | ||||||||||||||
See footnote summary on page 122-123.
| abfunds.com | AB INCOME FUND | 121 | |
FINANCIAL HIGHLIGHTS (continued)
Selected Data For A Share Of Capital Stock Outstanding Throughout Each Period
| Class Z | ||||
November 20, April 30, 2020 | ||||
| (unaudited) | ||||
|
| |||
Net asset value, beginning of period | $ 7.97 | |||
|
| |||
Income From Investment Operations | ||||
Net investment income(b)(c) | .10 | |||
Net realized and unrealized gain on investment and foreign currency transactions | (.38 | ) | ||
|
| |||
Net increase in net asset value from operations | (.28 | ) | ||
|
| |||
Less: Dividends | ||||
Dividends from net investment income | (.13 | ) | ||
|
| |||
Net asset value, end of period | $ 7.56 | |||
|
| |||
Total Return | ||||
Total investment return based on net asset value(e) | (3.53 | )% | ||
Ratios/Supplemental Data | ||||
Net assets, end of period (000’s omitted) | $16,371 | |||
Ratio to average net assets of: | ||||
Expenses, net of waivers/reimbursements(f) | .50 | % | ||
Expenses, before waivers/reimbursements(f) | .50 | % | ||
Net investment income(c) | 3.04 | % | ||
Portfolio turnover rate** | 111 | % | ||
| (a) | Inception date. |
| (b) | Based on average shares outstanding. |
| (c) | Net of expenses waived/reimbursed by the Adviser. |
| (d) | Amount is less than $.005. |
| (e) | Total investment return is calculated assuming an initial investment made at the net asset value at the beginning of the period, reinvestment of all dividends and distributions at net asset value during the period, and redemption on the last day of the period. Initial sales charges or contingent deferred sales charges are not reflected in the calculation of total investment return. Total return does not reflect the deduction of taxes that a shareholder would pay on fund distributions or the redemption of fund shares. Total investment return calculated for a period of less than one year is not annualized. |
| (f) | The expense ratios, excluding interest expense are: |
Six Months (unaudited) | Year Ended October 31, | January 1, 2016(g) | Year Ended December 31, | |||||||||||||||||||||||||
| 2019 | 2018 | 2017 | 2015 | 2014 | ||||||||||||||||||||||||
|
| |||||||||||||||||||||||||||
Class A | ||||||||||||||||||||||||||||
Net of waivers/reimbursements | .77 | %^ | .77 | % | .77 | % | .77 | % | .88 | %^ | N/A | N/A | ||||||||||||||||
Before waivers/reimbursements | .78 | %^ | .82 | % | .85 | % | .85 | % | 1.09 | %^ | N/A | N/A | ||||||||||||||||
| 122 | AB INCOME FUND | abfunds.com | |
FINANCIAL HIGHLIGHTS (continued)
Selected Data For A Share Of Capital Stock Outstanding Throughout Each Period
Six Months (unaudited) | Year Ended October 31, | January 1, 2016(g) | Year Ended December 31, | |||||||||||||||||||||||||
| 2019 | 2018 | 2017 | 2015 | 2014 | ||||||||||||||||||||||||
|
|
|
|
|
|
|
|
|
|
|
|
|
| |||||||||||||||
Class C | ||||||||||||||||||||||||||||
Net of waivers/reimbursements | 1.52 | %^ | 1.52 | % | 1.52 | % | 1.52 | % | 1.63 | %^ | N/A | N/A | ||||||||||||||||
Before waivers/reimbursements | 1.53 | %^ | 1.57 | % | 1.60 | % | 1.61 | % | 1.87 | %^ | N/A | N/A | ||||||||||||||||
Advisor Class | ||||||||||||||||||||||||||||
Net of waivers/reimbursements | .52 | %^ | .52 | % | .52 | % | .54 | % | .61 | %^ | .61 | % | .61 | % | ||||||||||||||
Before waivers/reimbursements | .53 | %^ | .57 | % | .60 | % | .65 | % | .69 | %^ | .61 | % | .61 | % | ||||||||||||||
Class Z |
| |||||||||||||||||||||||||||
Net of waivers/reimbursements | .49 | %^ | N/A | N/A | N/A | N/A | N/A | N/A | ||||||||||||||||||||
Before waivers/reimbursements | .49 | %^ | N/A | N/A | N/A | N/A | N/A | N/A | ||||||||||||||||||||
| (g) | The Predecessor Fund’s fiscal year end was December 31 and the Fund’s fiscal year end is October 31. |
| (h) | Total investment return is calculated assuming a purchase of common stock on the opening of the first day and a sale on the closing of the last day of each period reported. Dividends and distributions, if any, are assumed for purposes of this calculation, to be reinvested at prices obtained under the Fund’s dividend reinvestment plan. Generally, total investment return based on net asset value will be higher than total investment return based on market value in periods where there is an increase in the discount or a decrease in the premium of the market value to the net asset value from the beginning to the end of such periods. Conversely, total investment return based on net asset value will be lower than total investment return based on market value in periods where there is a decrease in the discount or an increase in the premium of the market value to the net asset value from the beginning to the end of such periods. Total investment return calculated for a period of less than one year is not annualized. |
| (i) | Commencement of distributions. |
| † | For the year ended October 31, 2016, the amount includes a refund for overbilling of prior years’ custody out of pocket fees as follows: |
| Net Investment Income Per Share | Net Investment Income Ratio | Total Return | ||
| $.003 | .04% | .03% |
| ** | The Fund accounts for dollar roll transactions as purchases and sales. |
| ^ | Annualized. |
See notes to financial statements
| abfunds.com | AB INCOME FUND | 123 | |
BOARD OF DIRECTORS
Marshall C. Turner, Jr.(1), Chairman Jorge A. Bermudez(1) Michael J. Downey(1) Nancy P. Jacklin(1) | Robert M. Keith, President and Chief Executive Officer Jeanette Loeb(1) Carol C. McMullen(1) Garry L. Moody(1) Earl D. Weiner(1) |
OFFICERS
Scott A. DiMaggio(2), Vice President Gershon M. Distenfeld(2), Douglas J. Peebles(2),*, Vice President Matthew S. Sheridan(2), Vice President | Emilie D. Wrapp, Secretary Michael B. Reyes, Senior Analyst Joseph J. Mantineo, Treasurer and Chief Financial Officer Phyllis J. Clarke, Controller |
Custodian and Accounting Agent State Street Bank and Trust Company State Street Corporation CCB/5 1 Iron Street Boston, MA 02210
Principal Underwriter AllianceBernstein Investments, Inc. 1345 Avenue of the Americas New York, NY 10105
Transfer Agent AllianceBernstein Investor Services, Inc. P.O. Box 786003 San Antonio, TX 78278-6003 Toll-Free (800) 221-5672 | Independent Registered Public Ernst & Young LLP 5 Times Square New York, NY 10036
Legal Counsel Seward & Kissel LLP One Battery Park Plaza New York, NY 10004 |
| 1 | Member of the Audit Committee, the Governance and Nominating Committee and the Independent Directors Committee. |
| 2 | The day-to-day management of, and investment decisions for, the Fund’s portfolio are made by the Adviser’s U.S. Investment Grade: Core Fixed Income Investment Team. Messrs. DiMaggio, Distenfeld, Peebles and Sheridan are the investment professionals with the most significant responsibility for the day-to-day management of the Fund’s portfolio. |
| * | Mr. Peebles is expected to retire from the Adviser effective December 30, 2020. |
| 124 | AB INCOME FUND | abfunds.com | |
Operation and Effectiveness of the Fund’s Liquidity Risk Management Program:
In October 2016, the Securities and Exchange Commission (“SEC”) adopted the open-end fund liquidity rule (the “Liquidity Rule”). In June 2018 the SEC adopted a requirement that funds disclose information about the operation and effectiveness of their Liquidity Risk Management Program (“LRMP”) in their reports to shareholders.
One of the requirements of the Liquidity Rule is for the Fund to designate an Administrator of the Fund’s Liquidity Risk Management Program. The Administrator of the Fund’s LRMP is AllianceBernstein L.P., the Fund’s investment adviser (the “Adviser”). The Adviser has delegated the responsibility to its Liquidity Risk Management Committee (the “Committee”). Another requirement of the Liquidity Rule is for the Fund’s Board of Directors (the “Fund Board”) to receive an annual written report from the Administrator of the LRMP, which addresses the operation of the Fund’s LRMP and assesses its adequacy and effectiveness. The Adviser provided the Fund’s Board with such annual report during the first quarter of 2020, which covered the period December 1, 2018 through December 31, 2019 (the “Program Reporting Period”).
The LRMP’s principal objectives include supporting the Fund’s compliance with limits on investments in illiquid assets and mitigating the risk that the Fund will be unable to meet its redemption obligations in a timely manner. Pursuant to the LRMP, the Fund classifies the liquidity of its portfolio investments into one of the four categories defined by the SEC: Highly Liquid, Moderately Liquid, Less Liquid, and Illiquid. These classifications are reported to the SEC on Form N-PORT.
During the Program Reporting Period, the Committee reviewed whether the Fund’s strategy is appropriate for an open-end structure, taking into account any holdings of less liquid and illiquid assets. The Committee also performed an analysis to determine whether the Fund is required to maintain a Highly Liquid Investment Minimum (“HLIM”). If the Fund participated in derivative transactions, the exposure from such transactions were considered in the LRMP. The Committee also incorporated the following information when determining the Fund’s reasonably anticipated trading size for purposes of liquidity monitoring: historical net redemption activity, a Fund’s concentration in an issuer, shareholder concentration, investment performance, total net assets, and distribution channels.
The Adviser informed the Fund Board that the Committee believes the Fund’s LRMP is adequately designed, has been implemented as intended, and has operated effectively since its inception. No material exceptions have been noted since the implementation of the LRMP, and there were no liquidity events that impacted the Fund or its ability to timely meet redemptions during the Program Reporting Period.
| abfunds.com | AB INCOME FUND | 125 | |
Information Regarding the Review and Approval of the Fund’s Advisory Agreement
The disinterested directors (the “directors”) of AB Bond Fund, Inc. (the “Company”) unanimously approved the continuance of the Company’s Advisory Agreement with the Adviser in respect of AB Income Fund (the “Fund”) at a meeting held on November 4-6, 2019 (the “Meeting”.)*
Prior to approval of the continuance of the Advisory Agreement, the directors had requested from the Adviser, and received and evaluated, extensive materials. They reviewed the proposed continuance of the Advisory Agreement with the Adviser and with experienced counsel who are independent of the Adviser, who advised on the relevant legal standards. The directors also reviewed additional materials, including comparative analytical data prepared by the Senior Analyst for the Fund. The directors also discussed the proposed continuance in private sessions with counsel.
The directors considered their knowledge of the nature and quality of the services provided by the Adviser to the Fund gained from their experience as directors or trustees of most of the registered investment companies advised by the Adviser, their overall confidence in the Adviser’s integrity and competence they have gained from that experience, the Adviser’s initiative in identifying and raising potential issues with the directors and its responsiveness, frankness and attention to concerns raised by the directors in the past, including the Adviser’s willingness to consider and implement organizational and operational changes designed to improve investment results and the services provided to the AB Funds. The directors noted that they have four regular meetings each year, at each of which they review extensive materials and information from the Adviser, including information on the investment performance of the Fund and the underlying fund advised by the Adviser in which the Fund invests.
The directors also considered all factors they believed relevant, including the specific matters discussed below. During the course of their deliberations, the directors evaluated, among other things, the reasonableness of the advisory fee. The directors did not identify any particular information that was all-important or controlling, and different directors may have attributed different weights to the various factors. The directors determined that the selection of the Adviser to manage the Fund and the overall arrangements between the Fund and the Adviser, as provided in the Advisory Agreement, including the advisory fee, were fair and reasonable in light of the services performed, expenses incurred and such other matters as the directors considered relevant in the exercise of their business
| * | Following transactions completed on November 13, 2019 that may have been deemed to have been an “assignment” causing termination of the Fund’s investment advisory agreement, a new investment advisory agreement, having the same terms as the prior one, was entered into by the Fund and the Adviser. |
| 126 | AB INCOME FUND | abfunds.com | |
judgment. The material factors and conclusions that formed the basis for the directors’ determinations included the following:
Nature, Extent and Quality of Services Provided
The directors considered the scope and quality of services provided by the Adviser under the Advisory Agreement, including the quality of the investment research capabilities of the Adviser and the other resources it has dedicated to performing services for the Fund. The directors noted that the Adviser from time to time reviews the Fund’s investment strategies and from time to time proposes changes intended to improve the Fund’s relative or absolute performance for the directors’ consideration. They also noted the professional experience and qualifications of the Fund’s portfolio management team and other senior personnel of the Adviser. The directors also considered that the Advisory Agreement provides that the Fund will reimburse the Adviser for the cost to it of providing certain clerical, accounting, administrative and other services to the Fund by employees of the Adviser or its affiliates. Requests for these reimbursements are made on a quarterly basis and subject to approval by the directors. Reimbursements, to the extent requested and paid, result in a higher rate of total compensation from the Fund to the Adviser than the fee rate stated in the Advisory Agreement. The directors noted that the methodology used to determine the reimbursement amounts had been reviewed by an independent consultant retained by the Fund’s former Senior Officer/Independent Compliance Officer. The quality of administrative and other services, including the Adviser’s role in coordinating the activities of the Fund’s other service providers, also was considered. The directors concluded that, overall, they were satisfied with the nature, extent and quality of services provided to the Fund under the Advisory Agreement.
Costs of Services Provided and Profitability
The directors reviewed a schedule of the revenues and expenses and related notes indicating the profitability of the Fund to the Adviser for calendar years 2017 and 2018 that had been prepared with an expense allocation methodology arrived at in consultation with an independent consultant retained by the Fund’s former Senior Officer/Independent Compliance Officer. The directors noted the assumptions and methods of allocation used by the Adviser in preparing fund-specific profitability data and understood that there are a number of potentially acceptable allocation methodologies for information of this type. The directors noted that the profitability information reflected all revenues and expenses of the Adviser’s relationship with the Fund, including those relating to its subsidiaries that provide transfer agency, distribution and brokerage services to the Fund. The directors recognized that it is difficult to make comparisons of the profitability of the Advisory Agreement with the profitability of fund advisory contracts for unaffiliated funds because comparative information is not generally publicly available and is affected by numerous factors. The directors focused on the profitability of the Adviser’s relationship with the Fund
| abfunds.com | AB INCOME FUND | 127 | |
before taxes and distribution expenses. The directors concluded that the Adviser’s level of profitability from its relationship with the Fund was not unreasonable.
Fall-Out Benefits
The directors considered the other benefits to the Adviser and its affiliates from their relationships with the Fund and the underlying fund advised by the Adviser in which the Fund invests, including, but not limited to, benefits relating to 12b-1 fees and sales charges received by the Fund’s principal underwriter (which is a wholly owned subsidiary of the Adviser) in respect of certain classes of the Fund’s shares; and transfer agency fees paid by the Fund to a wholly owned subsidiary of the Adviser. The directors recognized that the Adviser’s profitability would be somewhat lower without these benefits. The directors understood that the Adviser also might derive reputational and other benefits from its association with the Fund.
Investment Results
In addition to the information reviewed by the directors in connection with the Meeting, the directors receive detailed performance information for the Fund at each regular Board meeting during the year.
At the Meeting, the directors reviewed performance information prepared by an independent service provider (the “15(c) service provider”), showing the performance of the Class A Shares of the Fund against a group of similar funds (“peer group”) and a larger group of similar funds (“peer universe”), each selected by the 15(c) service provider, and information prepared by the Adviser showing performance of the Class A Shares against a broad-based securities market index, in each case for the 1- and 3-year periods ended July 31, 2019 and (in the case of comparisons with the broad-based securities market index) for the period from inception. Based on their review, the directors concluded that the Fund’s investment performance was acceptable.
Advisory Fees and Other Expenses
The directors considered the advisory fee rate payable by the Fund to the Adviser and information prepared by the 15(c) service provider concerning advisory fee rates payable by other funds in the same category as the Fund. The directors recognized that it is difficult to make comparisons of advisory fees because there are variations in the services that are included in the fees payable by other funds. The directors compared the Fund’s contractual effective advisory fee rate with a peer group median and noted that it was above the median. The directors took into account the impact on the advisory fee rate of the administrative expense reimbursement paid to the Adviser in the latest fiscal year.
The Adviser informed the directors that there were no institutional products managed by the Adviser that utilize investment strategies similar to those of the Fund.
| 128 | AB INCOME FUND | abfunds.com | |
The directors noted that the Fund invests in shares of exchange-traded funds (“ETFs”), subject to the restrictions and limitations of the Investment Company Act of 1940 as these may be varied as a result of exemptive orders issued by the SEC. The directors also noted that ETFs pay advisory fees pursuant to their advisory contracts, and that the Adviser had provided, and they had reviewed, information about the expense ratios of the relevant ETFs. The directors concluded, based on the Adviser’s explanation of how it uses ETFs when they are the most cost-effective way to obtain desired exposures, in some cases pending purchases of underlying securities, that the advisory fee for the Fund is for services that are in addition to, rather than duplicative of, the services provided under the advisory contracts of the ETFs.
In connection with their review of the Fund’s advisory fee, the directors also considered the total expense ratio of the Class A shares of the Fund in comparison to a peer group and a peer universe selected by the 15(c) service provider. The Class A expense ratio of the Fund was based on the Fund’s latest fiscal year and the directors considered the Adviser’s expense cap for the Fund. The directors noted that it was likely that the expense ratios of some of the other funds in the Fund’s category were lowered by waivers or reimbursements by those funds’ investment advisers, which in some cases might be voluntary or temporary. The directors view expense ratio information as relevant to their evaluation of the Adviser’s services because the Adviser is responsible for coordinating services provided to the Fund by others. Based on their review, the directors concluded that the Fund’s expense ratio was acceptable.
Economies of Scale
The directors noted that the advisory fee schedule for the Fund contains breakpoints that reduce the fee rates on assets above specified levels and that the Fund’s net assets were above the first breakpoint level. Accordingly, the Fund’s current effective advisory fee rate reflected a reduction due to the breakpoint and would be further reduced to the extent the net assets of the Fund increase. The directors took into consideration prior presentations by an independent consultant on economies of scale in the mutual fund industry and for the AB Funds, and presentations from time to time by the Adviser concerning certain of its views on economies of scale. The directors also previously discussed economies of scale with an independent fee consultant. The directors also had requested and received from the Adviser certain updates on economies of scale in advance of the Meeting. The directors believe that economies of scale may be realized (if at all) by the Adviser across a variety of products and services, and not only in respect of a single fund. The directors noted that there is no established methodology for setting breakpoints that give effect to the fund-specific services provided by a fund’s adviser and to the economies of scale that an adviser may realize in its overall mutual fund business or those components of it which directly or indirectly affect a
| abfunds.com | AB INCOME FUND | 129 | |
fund’s operations. The directors observed that in the mutual fund industry as a whole, as well as among funds similar to the Fund, there is no uniformity or pattern in the fees and asset levels at which breakpoints (if any) apply. The directors also noted that the advisory agreements for many funds do not have breakpoints at all. Having taken these factors into account, the directors concluded that the Fund’s breakpoint arrangements were acceptable and provide a means for sharing economies of scale.
| 130 | AB INCOME FUND | abfunds.com | |
This page is not part of the Shareholder Report or the Financial Statements.
AB FAMILY OF FUNDS
US EQUITY
CORE
Core Opportunities Fund
FlexFee™ US Thematic Portfolio
Select US Equity Portfolio
GROWTH
Concentrated Growth Fund
Discovery Growth Fund
FlexFee™ Large Cap Growth Portfolio
Growth Fund
Large Cap Growth Fund
Small Cap Growth Portfolio
VALUE
Discovery Value Fund
Equity Income Fund
Relative Value Fund
Small Cap Value Portfolio
Value Fund
INTERNATIONAL/ GLOBAL EQUITY
CORE
FlexFee™ International Strategic Core Portfolio
Global Core Equity Portfolio
International Portfolio
International Strategic Core Portfolio
Sustainable Global Thematic Fund
Tax-Managed International Portfolio
Tax-Managed Wealth Appreciation Strategy
Wealth Appreciation Strategy
INTERNATIONAL/ GLOBAL EQUITY (continued)
GROWTH
Concentrated International Growth Portfolio
FlexFee™ Emerging Markets Growth Portfolio
Sustainable International Thematic Fund
VALUE
All China Equity Portfolio
International Value Fund
FIXED INCOME
MUNICIPAL
High Income Municipal Portfolio
Intermediate California Municipal Portfolio
Intermediate Diversified Municipal Portfolio
Intermediate New York Municipal Portfolio
Municipal Bond Inflation Strategy
Tax-Aware Fixed Income Opportunities Portfolio1
National Portfolio
Arizona Portfolio
California Portfolio
Massachusetts Portfolio
Minnesota Portfolio
New Jersey Portfolio
New York Portfolio
Ohio Portfolio
Pennsylvania Portfolio
Virginia Portfolio
FIXED INCOME (continued)
TAXABLE
Bond Inflation Strategy
FlexFee™ High Yield Portfolio
FlexFee™ International Bond Portfolio
Global Bond Fund
High Income Fund
Income Fund
Intermediate Duration Portfolio
Limited Duration High Income Portfolio
Short Duration Income Portfolio
Short Duration Portfolio
Total Return Bond Portfolio1
ALTERNATIVES
All Market Real Return Portfolio
Global Real Estate Investment Fund
Select US Long/Short Portfolio
Unconstrained Bond Fund
MULTI-ASSET
All Market Income Portfolio
All Market Total Return Portfolio
Conservative Wealth Strategy
Emerging Markets Multi-Asset Portfolio
Global Risk Allocation Fund
Tax-Managed All Market Income Portfolio
CLOSED-END FUNDS
AllianceBernstein Global High Income Fund
AllianceBernstein National Municipal Income Fund
We also offer Government Money Market Portfolio, which serves as the money market fund exchange vehicle for the AB mutual funds. You could lose money by investing in the Fund. Although the Fund seeks to preserve the value of your investment at $1.00 per share, it cannot guarantee it will do so. The Fund may impose a fee upon sale of your shares or may temporarily suspend your ability to sell shares if the Fund’s liquidity falls below required minimums because of market conditions or other factors. An investment in the Fund is not insured or guaranteed by the Federal Deposit Insurance Corporation or any other government agency. The Fund’s sponsor has no legal obligation to provide financial support to the Fund, and you should not expect that the sponsor will provide financial support to the Fund at any time.
Investors should consider the investment objectives, risks, charges and expenses of the Fund carefully before investing. For copies of our prospectus or summary prospectus, which contain this and other information, visit us online at www.abfunds.com or contact your AB representative. Please read the prospectus and/or summary prospectus carefully before investing.
| 1 | Prior to July 12, 2019, Total Return Bond Portfolio was named Intermediate Bond Portfolio; prior to February 5, 2020, Tax-Aware Fixed Income Opportunities Portfolio was named Tax-Aware Fixed Income Portfolio. |
| abfunds.com | AB INCOME FUND | 131 | |
NOTES
| 132 | AB INCOME FUND | abfunds.com | |
AB INCOME FUND
1345 Avenue of the Americas
New York, NY 10105
800 221 5672
IF-0152-0420 
APR 04.30.20

SEMI-ANNUAL REPORT
AB TOTAL RETURN BOND PORTFOLIO

Beginning January 1, 2021, as permitted by new regulations adopted by the Securities and Exchange Commission, the Fund’s annual and semi-annual shareholder reports will no longer be sent by mail, unless you specifically request paper copies of the reports. Instead, the reports will be made available on a website, and you will be notified by mail each time a report is posted and provided with a website address to access the report.
If you already elected to receive shareholder reports electronically, you will not be affected by this change and you need not take any action. You may elect to receive shareholder reports and other communications from the Fund electronically at any time by contacting your financial intermediary (such as a broker-dealer or bank) or, if you are a direct investor, by calling the Fund at (800) 221 5672.
You may elect to receive all future reports in paper form free of charge. If you invest through a financial intermediary, you can contact your financial intermediary to request that you continue to receive paper copies of your shareholder reports; if you invest directly with the Fund, you can call the Fund at (800) 221 5672. Your election to receive reports in paper form will apply to all funds held in your account with your financial intermediary or, if you invest directly, to all AB Mutual Funds you hold.
| Investment Products Offered | • Are Not FDIC Insured • May Lose Value • Are Not Bank Guaranteed | |
Investors should consider the investment objectives, risks, charges and expenses of the Fund carefully before investing. For copies of our prospectus or summary prospectus, which contain this and other information, visit us online at www.abfunds.com or contact your AB representative. Please read the prospectus and/or summary prospectus carefully before investing.
This shareholder report must be preceded or accompanied by the Fund’s prospectus for individuals who are not current shareholders of the Fund.
You may obtain a description of the Fund’s proxy voting policies and procedures, and information regarding how the Fund voted proxies relating to portfolio securities during the most recent 12-month period ended June 30, without charge. Simply visit AB’s website at www.abfunds.com, or go to the Securities and Exchange Commission’s (the “Commission”) website at www.sec.gov, or call AB at (800) 227 4618.
The Fund files its complete schedule of portfolio holdings with the Commission for the first and third quarters of each fiscal year as an exhibit to its reports on Form N-PORT. The Fund’s Form N-PORT reports are available on the Commission’s website at www.sec.gov. The Fund’s Forms N-PORT may also be reviewed and copied at the Commission’s Public Reference Room in Washington, DC; information on the operation of the Public Reference Room may be obtained by calling (800) SEC 0330. AB publishes full portfolio holdings for the Fund monthly at www.abfunds.com.
AllianceBernstein Investments, Inc. (ABI) is the distributor of the AB family of mutual funds. ABI is a member of FINRA and is an affiliate of AllianceBernstein L.P., the Adviser of the funds.
The [A/B] logo is a registered service mark of AllianceBernstein and AllianceBernstein® is a registered service mark used by permission of the owner, AllianceBernstein L.P.
| FROM THE PRESIDENT |  |
Dear Shareholder,
We are pleased to provide this report for AB Total Return Bond Portfolio (the “Fund”). Please review the discussion of Fund performance, the market conditions during the reporting period and the Fund’s investment strategy.
As always, AB strives to keep clients ahead of what’s next by:
| + | Transforming uncommon insights into uncommon knowledge with a global research scope |
| + | Navigating markets with seasoned investment experience and sophisticated solutions |
| + | Providing thoughtful investment insights and actionable ideas |
Whether you’re an individual investor or a multi-billion-dollar institution, we put knowledge and experience to work for you.
AB’s global research organization connects and collaborates across platforms and teams to deliver impactful insights and innovative products. Better insights lead to better opportunities—anywhere in the world.
For additional information about AB’s range of products and shareholder resources, please log on to www.abfunds.com.
Thank you for your investment in the AB Mutual Funds.
Sincerely,

Robert M. Keith
President and Chief Executive Officer, AB Mutual Funds
| abfunds.com | AB TOTAL RETURN BOND PORTFOLIO | 1 | |
SEMI-ANNUAL REPORT
June 12, 2020
This report provides management’s discussion of fund performance for AB Total Return Bond Portfolio for the semi-annual reporting period ended April 30, 2020.
On July 12, 2019, the Fund implemented its current investment policies (the change eliminated the guidelines for the average duration and maturity of the Fund and addressed certain related matters) and also changed its name from AB Intermediate Bond Portfolio to AB Total Return Bond Portfolio. Accordingly, the performance shown for periods prior to July 12, 2019, is based on the Fund’s prior investment strategies and may not be representative of the Fund’s performance under its current investment policies.
The Fund’s investment objective is to maximize long-term total return without assuming what the Adviser considers undue risk.
NAV RETURNS AS OF APRIL 30, 2020 (unaudited)
| 6 Months | 12 Months | |||||||
| AB TOTAL RETURN BOND PORTFOLIO | ||||||||
| Class A Shares | -2.54% | 2.21% | ||||||
| Class C Shares | -2.82% | 1.45% | ||||||
| Advisor Class Shares1 | -2.33% | 2.46% | ||||||
| Class R Shares1 | -2.58% | 1.95% | ||||||
| Class K Shares1 | -2.54% | 2.11% | ||||||
| Class I Shares1 | -2.33% | 2.46% | ||||||
| Class Z Shares1 | -2.41% | 2.37% | ||||||
| Bloomberg Barclays US Aggregate Bond Index | 4.86% | 10.84% | ||||||
| 1 | Please note that these share classes are for investors purchasing shares through accounts established under certain fee-based programs sponsored and maintained by certain broker-dealers and financial intermediaries, institutional pension plans and/or investment advisory clients of, and certain other persons associated with, the Adviser and its affiliates or the Fund. |
INVESTMENT RESULTS
The table above shows the Fund’s performance compared to its benchmark, the Bloomberg Barclays US Aggregate Bond Index, for the six- and 12-month periods ended April 30, 2020.
During the six-month period, all share classes of the Fund underperformed the benchmark, before sales charges. Sector allocation was the primary detractor, relative to the benchmark, from off-benchmark exposure to agency risk-sharing transactions, an underweight to US Treasuries, an
| 2 | AB TOTAL RETURN BOND PORTFOLIO | abfunds.com | |
overweight to commercial mortgage-backed securities (“CMBS”) and exposure to emerging-market corporate bonds, partially offset by gains from an underweight to US investment-grade corporate bonds. Security selection in CMBS and asset-backed securities also detracted, partially offset by gains in emerging-market corporate bonds. Country allocation (a result of bottom-up security analysis combined with fundamental research) to non-US markets also detracted. Yield-curve positioning in five- to 10-year maturities contributed to returns. Currency decisions did not have a meaningful impact on performance.
During the 12-month period, all share classes of the Fund underperformed the benchmark, before sales charges. Sector allocation was the primary detractor, due to off-benchmark exposure to agency risk-sharing transactions, an underweight to US Treasuries and an overweight to CMBS, partially offset by an underweight to US investment-grade corporate bonds. Security selection in CMBS and asset-backed securities also detracted, partially offset by gains in emerging-market corporate bonds and US high-yield bonds. Country allocation to non-US markets also detracted. Yield-curve positioning in short-term instruments and five-year maturities contributed, but it was more than offset by being underweight to 20-year maturities and longer. Currency decisions did not have a meaningful impact on performance.
During both periods, the Fund utilized currency forwards to hedge currency risk and actively manage currency positions. Credit default swaps were utilized in the corporate and commercial mortgage-backed securities sectors for hedging and investment purposes. Treasury futures and interest rate swaps were utilized to manage duration, country exposure and yield-curve positioning.
MARKET REVIEW AND INVESTMENT STRATEGY
Global fixed-income market returns were mixed over the six-month period ended April 30, 2020. The UK’s exit from the European Union and a US-China trade truce in January led markets higher until investor sentiment turned decidedly negative in March due to the spread of COVID-19. The US Federal Reserve (the “Fed”) initiated several measures during the period to provide liquidity in short-term repurchase agreements and US Treasuries. Investor uncertainty led to an unprecedented flight to quality as credit spreads on risk assets quickly widened to levels not seen since the 2008–2009 global financial crisis. Markets began to recover in April as governments and central banks initiated over $9 trillion of monetary and fiscal stimulus measures to combat the economic fallout from the virus and governments began to relax social distancing and stay-at-home guidelines.
The Fed lowered interest rates 150 basis points to zero, and most other major central banks followed suit with substantial rate cuts. Longer maturity and higher quality developed-market treasury returns were the
| abfunds.com | AB TOTAL RETURN BOND PORTFOLIO | 3 | |
best performers, along with investment-grade US corporate bonds that rallied in April on the back of record new issuance. High-yield corporate bond returns were negative as investors retreated from risk assets. Securitized asset results were mixed. Emerging-market returns fell as sharply lower oil prices impacted emerging-market commodity exporters. The US dollar advanced against most developed- and emerging-market currencies. The Swiss franc and the yen, which are also considered safe haven currencies, advanced against the US dollar.
INVESTMENT POLICIES
The Fund invests, under normal circumstances, at least 80% of its net assets in fixed-income securities. The Fund expects to invest in readily marketable fixed-income securities with a range of maturities from short- to long-term and relatively attractive yields that do not involve undue risk of loss of capital. The Fund may invest up to 25% of its net assets in below investment-grade bonds. The Fund may use leverage for investment purposes.
The Fund may invest without limit in US dollar-denominated foreign fixed-income securities and may invest up to 25% of its assets in non-US dollar-denominated foreign fixed-income securities. These investments may include, in each case, developed- and emerging-market debt securities.
The Adviser selects securities for purchase or sale based on its assessment of the securities’ risk and return characteristics as well as the securities’ impact on the overall risk and return characteristics of the Fund. In making this assessment, the Adviser takes into account various factors, including the credit quality and sensitivity to interest rates of the securities under consideration and of the Fund’s other holdings.
The Fund may invest in mortgage-related and other asset-backed securities, loan participations and assignments, inflation-indexed securities, variable, floating, and inverse floating-rate instruments and preferred stock, and may use other investment techniques. The Fund intends, among other things, to enter into transactions such as reverse repurchase agreements and dollar rolls. The Fund may invest, without limit, in derivatives, such as options, futures contracts, forwards or swaps.
| 4 | AB TOTAL RETURN BOND PORTFOLIO | abfunds.com | |
DISCLOSURES AND RISKS
Benchmark Disclosure
The Bloomberg Barclays US Aggregate Bond Index is unmanaged and does not reflect fees and expenses associated with the active management of a mutual fund portfolio. The Bloomberg Barclays US Aggregate Bond Index represents the performance of securities within the US investment-grade fixed-rate bond market, with index components for government and corporate securities, mortgage pass-through securities, asset-backed securities and commercial mortgage-backed securities. An investor cannot invest directly in an index, and its results are not indicative of the performance for any specific investment, including the Fund.
A Word About Risk
Market Risk: The market value of a security may move up or down, sometimes rapidly and unpredictably. These fluctuations may cause a security to be worth less than the price originally paid for it, or less than it was worth at an earlier time. Market risk may affect a single issuer, industry, sector of the economy or the market as a whole. Global economies and financial markets are increasingly interconnected, which increases the probabilities that conditions in one country or region might adversely impact issuers in a different country or region. Conditions affecting the general economy, including political, social, or economic instability at the local, regional, or global level may also affect the market value of a security. Health crises, such as pandemic and epidemic diseases, as well as other incidents that interrupt the expected course of events, such as natural disasters, war or civil disturbance, acts of terrorism, power outages and other unforeseeable and external events, and the public response to or fear of such diseases or events, have and may in the future have an adverse effect on the Fund’s investments and net asset value and can lead to increased market volatility. For example, any preventative or protective actions that governments may take in respect of such diseases or events may result in periods of business disruption, inability to obtain raw materials, supplies and component parts, and reduced or disrupted operations for the Fund’s portfolio companies. The occurrence and pendency of such diseases or events could adversely affect the economies and financial markets either in specific countries or worldwide.
Interest-Rate Risk: Changes in interest rates will affect the value of investments in fixed-income securities. When interest rates rise, the value of existing investments in fixed-income securities tends to fall and this decrease in value may not be offset by higher income from new investments. Interest-rate risk is generally greater for fixed-income securities with longer maturities or durations.
Credit Risk: An issuer or guarantor of a fixed-income security, or the counterparty to a derivatives or other contract, may be unable or unwilling
| abfunds.com | AB TOTAL RETURN BOND PORTFOLIO | 5 | |
DISCLOSURES AND RISKS (continued)
to make timely payments of interest or principal, or to otherwise honor its obligations. The issuer or guarantor may default, causing a loss of the full principal amount of a security and accrued interest. The degree of risk for a particular security may be reflected in its credit rating. There is the possibility that the credit rating of a fixed-income security may be downgraded after purchase, which may adversely affect the value of the security.
Below Investment-Grade Securities Risk: Investments in fixed-income securities with lower ratings (commonly known as “junk bonds”) are subject to a higher probability that an issuer will default or fail to meet its payment obligations. These securities may be subject to greater price volatility due to such factors as specific corporate developments and negative perceptions of the junk bond market generally and may be more difficult to trade than other types of securities.
Duration Risk: Duration is a measure that relates the expected price volatility of a fixed-income security to changes in interest rates. The duration of a fixed-income security may be shorter than or equal to full maturity of a fixed-income security. Fixed-income securities with longer durations have more risk and will decrease in price as interest rates rise.
Inflation Risk: This is the risk that the value of assets or income from investments will be less in the future as inflation decreases the value of money. As inflation increases, the value of the Fund’s assets can decline as can the value of the Fund’s distributions. This risk is significantly greater for fixed-income securities with longer maturities. The Fund invests in inflation-indexed securities, the value of which may be vulnerable to changes in expectations of inflation or interest rates.
Foreign (Non-US) Risk: Investments in securities of non-US issuers may involve more risk than those of US issuers. These securities may fluctuate more widely in price and may be more difficult to trade due to adverse market, economic, political, regulatory or other factors.
Emerging-Market Risk: Investments in emerging-market countries may have more risk because the markets are less developed and less liquid as well as being subject to increased economic, political, regulatory or other uncertainties.
Currency Risk: Fluctuations in currency exchange rates may negatively affect the value of the Fund’s investments or reduce its returns.
Mortgage-Related and/or Other Asset-Backed Securities Risk: Investments in mortgage-related and other asset-backed securities are subject to certain additional risks. The value of these securities may be
| 6 | AB TOTAL RETURN BOND PORTFOLIO | abfunds.com | |
DISCLOSURES AND RISKS (continued)
particularly sensitive to changes in interest rates. These risks include “extension risk”, which is the risk that, in periods of rising interest rates, issuers may delay the payment of principal, and “prepayment risk”, which is the risk that in periods of falling interest rates, issuers may pay principal sooner than expected, exposing the Fund to a lower rate of return upon reinvestment of principal. Mortgage-backed securities offered by non-governmental issuers and other asset-backed securities may be subject to other risks, such as higher rates of default in the mortgages or assets backing the securities or risks associated with the nature and servicing of mortgages or assets backing the securities.
Leverage Risk: To the extent the Fund uses leveraging techniques, its net asset value (“NAV”) may be more volatile because leverage tends to exaggerate the effect of changes in interest rates and any increase or decrease in the value of the Fund’s investments.
Derivatives Risk: Derivatives may be difficult to price or unwind and leveraged so that small changes may produce disproportionate losses for the Fund. Derivatives, especially over-the-counter derivatives, are also subject to counterparty risk.
Illiquid Investments Risk: Illiquid investments risk exists when certain investments are or become difficult to purchase or sell. Difficulty in selling such investments may result in sales at disadvantageous prices affecting the value of your investment in the Fund. Causes of illiquid investments risk may include low trading volumes, large positions and heavy redemptions of Fund shares. Illiquid investments risk may be higher in a rising interest-rate environment, when the value and liquidity of fixed-income securities generally decline.
Active Trading Risk: The Fund expects to engage in active and frequent trading of its portfolio securities and its portfolio turnover rate may greatly exceed 100%. A higher rate of portfolio turnover increases transaction costs, which may negatively affect the Fund’s return. In addition, a high rate of portfolio turnover may result in substantial short-term gains, which may have adverse tax consequences for Fund shareholders.
Management Risk: The Fund is subject to management risk because it is an actively managed investment fund. The Adviser will apply its investment techniques and risk analyses in making investment decisions, but there is no guarantee that its techniques will produce the intended results. Some of these techniques may incorporate, or rely upon, quantitative models, but there is no guarantee that these models will generate accurate forecasts, reduce risk or otherwise perform as expected.
| abfunds.com | AB TOTAL RETURN BOND PORTFOLIO | 7 | |
DISCLOSURES AND RISKS (continued)
These risks are fully discussed in the Fund’s prospectus. As with all investments, you may lose money by investing in the Fund.
An Important Note About Historical Performance
The investment return and principal value of an investment in the Fund will fluctuate, so that shares, when redeemed, may be worth more or less than their original cost. Performance shown in this report represents past performance and does not guarantee future results. Current performance may be lower or higher than the performance information shown. You may obtain performance information current to the most recent month-end by visiting www.abfunds.com. Class B shares are no longer being offered. Effective November 7, 2019, all outstanding Class B shares were converted to Class A shares. Please see Note A for more information.
All fees and expenses related to the operation of the Fund have been deducted. NAV returns do not reflect sales charges; if sales charges were reflected, the Fund’s quoted performance would be lower. SEC returns reflect the applicable sales charges for each share class: a 4.25% maximum front-end sales charge for Class A shares and a 1% 1-year contingent deferred sales charge for Class C shares. Returns for the different share classes will vary due to different expenses associated with each class. Performance assumes reinvestment of distributions and does not account for taxes.
| 8 | AB TOTAL RETURN BOND PORTFOLIO | abfunds.com | |
HISTORICAL PERFORMANCE
AVERAGE ANNUAL RETURNS AS OF APRIL 30, 2020 (unaudited)
| NAV Returns | SEC Returns (reflects applicable sales charges) | SEC Yields1 | ||||||||||
| CLASS A SHARES | 2.21% | |||||||||||
| 1 Year | 2.21% | -2.15% | ||||||||||
| 5 Years | 2.29% | 1.41% | ||||||||||
| 10 Years | 3.36% | 2.91% | ||||||||||
| CLASS C SHARES | 1.57% | |||||||||||
| 1 Year | 1.45% | 0.46% | ||||||||||
| 5 Years | 1.53% | 1.53% | ||||||||||
| 10 Years | 2.62% | 2.62% | ||||||||||
| ADVISOR CLASS SHARES2 | 2.58% | |||||||||||
| 1 Year | 2.46% | 2.46% | ||||||||||
| 5 Years | 2.56% | 2.56% | ||||||||||
| 10 Years | 3.65% | 3.65% | ||||||||||
| CLASS R SHARES2 | 1.94% | |||||||||||
| 1 Year | 1.95% | 1.95% | ||||||||||
| 5 Years | 2.04% | 2.04% | ||||||||||
| 10 Years | 3.13% | 3.13% | ||||||||||
| CLASS K SHARES2 | 2.24% | |||||||||||
| 1 Year | 2.11% | 2.11% | ||||||||||
| 5 Years | 2.29% | 2.29% | ||||||||||
| 10 Years | 3.39% | 3.39% | ||||||||||
| CLASS I SHARES2 | 2.62% | |||||||||||
| 1 Year | 2.46% | 2.46% | ||||||||||
| 5 Years | 2.56% | 2.56% | ||||||||||
| 10 Years | 3.65% | 3.65% | ||||||||||
| CLASS Z SHARES2 | 2.66% | |||||||||||
| 1 Year | 2.37% | 2.37% | ||||||||||
| 5 Years | 2.54% | 2.54% | ||||||||||
| Since Inception3 | 2.91% | 2.91% | ||||||||||
The Fund’s prospectus fee table shows the Fund’s total annual operating expense ratios as 1.04%, 1.79%, 0.79%, 1.42%, 1.10%, 0.75% and 0.68% for Class A, Class C, Advisor Class, Class R, Class K, Class I and Class Z shares, respectively, gross of any fee waivers or expense reimbursements. Contractual fee waivers and/or expense reimbursements limit the Fund’s annual operating expense ratios exclusive of interest expense to 0.77%, 1.52%, 0.52%, 1.02%, 0.77%, 0.52% and 0.52% for Class A, Class C, Advisor Class, Class R, Class K, Class I and Class Z shares, respectively. These waivers/reimbursements may not be terminated before January 31, 2021, and may be extended by the Adviser for additional one-year terms. Absent reimbursements or waivers, performance would have been lower. The Financial Highlights section of this report sets forth expense ratio data for the current reporting period; the expense ratios shown above may differ from the expense ratios in the Financial Highlights section since they are based on different time periods.
(footnotes continued on next page)
| abfunds.com | AB TOTAL RETURN BOND PORTFOLIO | 9 | |
HISTORICAL PERFORMANCE (continued)
| 1 | SEC yields are calculated based on SEC guidelines for the 30-day period ended April 30, 2020. |
| 2 | These share classes are offered at NAV to eligible investors and their SEC returns are the same as their NAV returns. Please note that these share classes are for investors purchasing shares through accounts established under certain fee-based programs sponsored and maintained by certain broker-dealers and financial intermediaries, institutional pension plans and/or investment advisory clients of, and certain other persons associated with, the Adviser and its affiliates or the Fund. |
| 3 | Inception date: 4/25/2014. |
| 10 | AB TOTAL RETURN BOND PORTFOLIO | abfunds.com | |
HISTORICAL PERFORMANCE (continued)
SEC AVERAGE ANNUAL RETURNS
AS OF THE MOST RECENT CALENDAR QUARTER-END
MARCH 31, 2020 (unaudited)
| SEC Returns (reflects applicable sales charges) | ||||
| CLASS A SHARES | ||||
| 1 Year | -4.17% | |||
| 5 Years | 0.87% | |||
| 10 Years | 2.85% | |||
| CLASS C SHARES | ||||
| 1 Year | -1.52% | |||
| 5 Years | 0.99% | |||
| 10 Years | 2.56% | |||
| ADVISOR CLASS SHARES1 | ||||
| 1 Year | 0.45% | |||
| 5 Years | 2.00% | |||
| 10 Years | 3.58% | |||
| CLASS R SHARES1 | ||||
| 1 Year | -0.05% | |||
| 5 Years | 1.49% | |||
| 10 Years | 3.07% | |||
| CLASS K SHARES1 | ||||
| 1 Year | 0.11% | |||
| 5 Years | 1.75% | |||
| 10 Years | 3.32% | |||
| CLASS I SHARES1 | ||||
| 1 Year | 0.45% | |||
| 5 Years | 2.00% | |||
| 10 Years | 3.58% | |||
| CLASS Z SHARES1 | ||||
| 1 Year | 0.45% | |||
| 5 Years | 2.00% | |||
| Since Inception2 | 2.56% | |||
| 1 | Please note that these share classes are for investors purchasing shares through accounts established under certain fee-based programs sponsored and maintained by certain broker-dealers and financial intermediaries, institutional pension plans and/or investment advisory clients of, and certain other persons associated with, the Adviser and its affiliates or the Fund. |
| 2 | Inception date: 4/25/2014. |
| abfunds.com | AB TOTAL RETURN BOND PORTFOLIO | 11 | |
EXPENSE EXAMPLE
(unaudited)
As a shareholder of the Fund, you incur two types of costs: (1) transaction costs, including sales charges (loads) on purchase payments, contingent deferred sales charges on redemptions and (2) ongoing costs, including management fees; distribution (12b-1) fees; and other Fund expenses. This example is intended to help you understand your ongoing costs (in dollars) of investing in the Fund and to compare these costs with the ongoing costs of investing in other mutual funds.
The Example is based on an investment of $1,000 invested at the beginning of the period and held for the entire period as indicated below.
Actual Expenses
The table below provides information about actual account values and actual expenses. You may use the information, together with the amount you invested, to estimate the expenses that you paid over the period. Simply divide your account value by $1,000 (for example, an $8,600 account value divided by $1,000 = 8.6), then multiply the result by the number under the heading entitled “Expenses Paid During Period” to estimate the expenses you paid on your account during this period.
Hypothetical Example for Comparison Purposes
The table below also provides information about hypothetical account values and hypothetical expenses based on the Fund’s actual expense ratio and an assumed annual rate of return of 5% before expenses, which is not the Fund’s actual return. The hypothetical account values and expenses may not be used to estimate the actual ending account balance or expenses you paid for the period. You may use this information to compare the ongoing costs of investing in the Fund and other funds by comparing this 5% hypothetical example with the 5% hypothetical examples that appear in the shareholder reports of other funds.
Please note that the expenses shown in the table are meant to highlight your ongoing costs only and do not reflect any transactional costs, such as sales charges (loads), or contingent deferred sales charges on redemptions. Therefore, the hypothetical example is useful in comparing ongoing costs only, and will not help you determine the relative total costs of owning different funds. In addition, if these transactional costs were included, your costs would have been higher.
| 12 | AB TOTAL RETURN BOND PORTFOLIO | abfunds.com | |
EXPENSE EXAMPLE (continued)
| Beginning Account Value November 1, 2019 | Ending Account Value April 30, 2020 | Expenses Paid During Period* | Annualized Expense Ratio* | |||||||||||||
| Class A | ||||||||||||||||
Actual | $ | 1,000 | $ | 974.60 | $ | 3.78 | 0.77 | % | ||||||||
Hypothetical** | $ | 1,000 | $ | 1,021.03 | $ | 3.87 | 0.77 | % | ||||||||
| Class C | ||||||||||||||||
Actual | $ | 1,000 | $ | 971.80 | $ | 7.45 | 1.52 | % | ||||||||
Hypothetical** | $ | 1,000 | $ | 1,017.30 | $ | 7.62 | 1.52 | % | ||||||||
| Advisor Class | ||||||||||||||||
Actual | $ | 1,000 | $ | 976.70 | $ | 2.56 | 0.52 | % | ||||||||
Hypothetical** | $ | 1,000 | $ | 1,022.28 | $ | 2.61 | 0.52 | % | ||||||||
| Class R | ||||||||||||||||
Actual | $ | 1,000 | $ | 974.20 | $ | 5.01 | 1.02 | % | ||||||||
Hypothetical** | $ | 1,000 | $ | 1,019.79 | $ | 5.12 | 1.02 | % | ||||||||
| Class K | ||||||||||||||||
Actual | $ | 1,000 | $ | 974.60 | $ | 3.78 | 0.77 | % | ||||||||
Hypothetical** | $ | 1,000 | $ | 1,021.03 | $ | 3.87 | 0.77 | % | ||||||||
| Class I | ||||||||||||||||
Actual | $ | 1,000 | $ | 976.70 | $ | 2.56 | 0.52 | % | ||||||||
Hypothetical** | $ | 1,000 | $ | 1,022.28 | $ | 2.61 | 0.52 | % | ||||||||
| Class Z | ||||||||||||||||
Actual | $ | 1,000 | $ | 975.90 | $ | 2.55 | 0.52 | % | ||||||||
Hypothetical** | $ | 1,000 | $ | 1,022.28 | $ | 2.61 | 0.52 | % | ||||||||
| * | Expenses are equal to the classes’ annualized expense ratios, multiplied by the average account value over the period, multiplied by 182/366 (to reflect the one-half year period). |
| ** | Assumes 5% annual return before expenses. |
| abfunds.com | AB TOTAL RETURN BOND PORTFOLIO | 13 | |
PORTFOLIO SUMMARY
APRIL 30, 2020 (unaudited)
PORTFOLIO STATISTICS
Net Assets ($mil): $357.6
TOP TEN SECTORS (including derivatives)1
| Governments–Treasuries2 | 68.47 | % | ||
| Corporates–Investment Grade | 25.70 | |||
| Commercial Mortgage-Backed Securities3 | 19.16 | |||
| Collateralized Mortgage Obligations | 15.36 | |||
| Mortgage Pass-Throughs | 14.20 | |||
| Interest Rate Swaps4 | 12.03 | |||
| Inflation-Linked Securities | 6.84 | |||
| Asset-Backed Securities | 5.42 | |||
| Corporates–Non-Investment Grade3 | 2.14 | |||
| Collateralized Loan Obligations | 0.76 | |||
SECTOR BREAKDOWN (excluding derivatives)5
| Corporates–Investment Grade | 25.5 | % | ||
| Collateralized Mortgage Obligations | 15.2 | |||
| Commercial Mortgage-Backed Securities | 14.8 | |||
| Mortgage Pass–Throughs | 14.1 | |||
| Governments–Treasuries | 11.9 | |||
| Inflation-Linked Securities | 6.8 | |||
| Asset-Backed Securities | 5.4 | |||
| Corporates–Non-Investment Grade | 1.5 | |||
| Governments–Sovereign Bonds | 0.9 | |||
| Collateralized Loan Obligations | 0.7 | |||
| Local Governments–US Municipal Bonds | 0.7 | |||
| Quasi-Sovereigns | 0.6 | |||
| Emerging Markets–Corporate Bonds | 0.4 | |||
| Other | 0.5 | |||
| Short-Term | 1.0 | |||
| 100.0 | % | |||
| 1 | All data are as of April 30, 2020. The Fund’s sectors include derivative exposure and are expressed as approximate percentages of the Fund’s total net assets, based on the Adviser’s internal classification. The percentages will vary over time. |
| 2 | Includes Treasury Futures. |
| 3 | Includes Credit Default Swaps. |
| 4 | Represents the exposure of the Fund’s fixed-rate payments on the Interest Rate Swaps. Interest Rate Swaps involve the exchange by a fund with another party of payments calculated by reference to specified interest rates (e.g., an exchange of floating-rate payments for fixed-rate payments). |
| 5 | All data are as of April 30, 2020. The Fund’s sector breakdown is expressed as a percentage of total investments and may vary over time. The Fund also enters into derivative transactions, which may be used for hedging or investment purposes (see “Portfolio of Investments” section of the report for additional details). “Other” sector breakdown weightings represent 0.2% or less in the following: Common Stocks, Emerging Markets-Sovereigns and Emerging Markets–Treasuries. |
| 14 | AB TOTAL RETURN BOND PORTFOLIO | abfunds.com | |
PORTFOLIO OF INVESTMENTS
April 30, 2020 (unaudited)
| Principal Amount (000) | U.S. $ Value | |||||||||||
| ||||||||||||
CORPORATES – INVESTMENT |
| |||||||||||
Industrial – 14.9% | ||||||||||||
Basic – 1.3% | ||||||||||||
Alpek SAB de CV | U.S.$ | 203 | $ | 175,595 | ||||||||
Braskem Netherlands Finance BV | 895 | 718,797 | ||||||||||
Celulosa Arauco y Constitucion SA | 332 | 320,785 | ||||||||||
DuPont de Nemours, Inc. | 485 | 525,032 | ||||||||||
4.493%, 11/15/2025 | 485 | 533,345 | ||||||||||
Eastman Chemical Co. | 220 | 230,307 | ||||||||||
Glencore Funding LLC | 516 | 525,974 | ||||||||||
GUSAP III LP | 535 | 486,850 | ||||||||||
Inversiones CMPC SA | 490 | 497,350 | ||||||||||
Inversiones CMPC SA/Cayman Islands Branch | 225 | 229,992 | ||||||||||
Orbia Advance Corp. SAB de CV | 350 | 329,765 | ||||||||||
4.875%, 09/19/2022(a) | 225 | 225,900 | ||||||||||
|
| |||||||||||
| 4,799,692 | ||||||||||||
|
| |||||||||||
Capital Goods – 0.6% | ||||||||||||
Embraer Netherlands Finance BV | 540 | 453,600 | ||||||||||
General Electric Co. | EUR | 815 | 852,284 | |||||||||
3.45%, 05/01/2027 | U.S.$ | 910 | 926,471 | |||||||||
|
| |||||||||||
| 2,232,355 | ||||||||||||
|
| |||||||||||
Communications - Media – 0.7% | ||||||||||||
Charter Communications Operating LLC/Charter Communications Operating Capital | ||||||||||||
4.20%, 03/15/2028 | 48 | 53,170 | ||||||||||
4.908%, 07/23/2025 | 1,016 | 1,148,314 | ||||||||||
Cox Communications, Inc. | 233 | 242,180 | ||||||||||
Fox Corp. | 61 | 64,714 | ||||||||||
ViacomCBS, Inc. | 850 | 909,466 | ||||||||||
|
| |||||||||||
| 2,417,844 | ||||||||||||
|
| |||||||||||
| abfunds.com | AB TOTAL RETURN BOND PORTFOLIO | 15 | |
PORTFOLIO OF INVESTMENTS (continued)
| Principal Amount (000) | U.S. $ Value | |||||||||||
| ||||||||||||
Communications - | ||||||||||||
AT&T, Inc. | U.S.$ | 1,610 | $ | 1,710,078 | ||||||||
4.125%, 02/17/2026 | 1,161 | 1,275,719 | ||||||||||
4.35%, 03/01/2029 | 500 | 563,010 | ||||||||||
4.55%, 03/09/2049 | 395 | 453,349 | ||||||||||
Sprint Spectrum Co. LLC/Sprint Spectrum Co. II LLC/Sprint Spectrum Co. III LLC | 740 | 784,222 | ||||||||||
Verizon Communications, Inc. | 328 | 354,853 | ||||||||||
4.862%, 08/21/2046 | 355 | 480,979 | ||||||||||
5.012%, 04/15/2049 | 443 | 622,769 | ||||||||||
Vodafone Group PLC | 1,249 | 1,347,434 | ||||||||||
|
| |||||||||||
| 7,592,413 | ||||||||||||
|
| |||||||||||
Consumer Cyclical - Automotive – 0.4% | ||||||||||||
BMW US Capital LLC | 450 | 477,329 | ||||||||||
General Motors Financial Co., Inc. | 135 | 126,877 | ||||||||||
5.10%, 01/17/2024 | 665 | 655,637 | ||||||||||
5.25%, 03/01/2026 | 165 | 158,809 | ||||||||||
|
| |||||||||||
| 1,418,652 | ||||||||||||
|
| |||||||||||
Consumer Cyclical - Entertainment – 0.1% | ||||||||||||
Carnival Corp. | 279 | 291,443 | ||||||||||
|
| |||||||||||
Consumer Cyclical - Other – 0.0% | ||||||||||||
Marriott International, Inc./MD | 93 | 97,228 | ||||||||||
|
| |||||||||||
Consumer Cyclical - Restaurants – 0.1% | ||||||||||||
McDonald’s Corp. | 367 | 400,247 | ||||||||||
|
| |||||||||||
Consumer Cyclical - Retailers – 0.2% | ||||||||||||
Ross Stores, Inc. | 430 | 469,620 | ||||||||||
TJX Cos., Inc. (The) | 213 | 229,748 | ||||||||||
|
| |||||||||||
| 699,368 | ||||||||||||
|
| |||||||||||
Consumer Non-Cyclical – 2.6% | ||||||||||||
Anheuser-Busch InBev Worldwide, Inc. | 616 | 679,035 | ||||||||||
5.55%, 01/23/2049 | 945 | 1,181,732 | ||||||||||
| 16 | AB TOTAL RETURN BOND PORTFOLIO | abfunds.com | |
PORTFOLIO OF INVESTMENTS (continued)
| Principal Amount (000) | U.S. $ Value | |||||||||||
| ||||||||||||
BAT Capital Corp. | U.S.$ | 728 | $ | 749,279 | ||||||||
Becton Dickinson and Co. | 180 | 194,323 | ||||||||||
Cigna Corp. | 168 | 179,775 | ||||||||||
4.125%, 11/15/2025 | 299 | 334,841 | ||||||||||
4.375%, 10/15/2028 | 399 | 457,246 | ||||||||||
Coca-Cola Co. (The) | 877 | 952,966 | ||||||||||
Coca-Cola Femsa SAB de CV | 443 | 442,884 | ||||||||||
CVS Health Corp. | 194 | 212,094 | ||||||||||
4.10%, 03/25/2025 | 1,417 | 1,562,866 | ||||||||||
Gilead Sciences, Inc. | 910 | 914,969 | ||||||||||
Reynolds American, Inc. | 345 | 345,000 | ||||||||||
Tyson Foods, Inc. | 541 | 594,094 | ||||||||||
Zimmer Biomet Holdings, Inc. | 208 | 208,711 | ||||||||||
Zoetis, Inc. | 334 | 333,957 | ||||||||||
|
| |||||||||||
| 9,343,772 | ||||||||||||
|
| |||||||||||
Energy – 4.3% | ||||||||||||
Baker Hughes a GE Co. LLC/Baker Hughes Co-Obligor, Inc. | ||||||||||||
3.337%, 12/15/2027 | 433 | 415,022 | ||||||||||
4.08%, 12/15/2047 | 60 | 51,408 | ||||||||||
BP Capital Markets America, Inc. | 685 | 719,250 | ||||||||||
Cenovus Energy, Inc. | 42 | 33,027 | ||||||||||
Energy Transfer Operating LP | 515 | 469,422 | ||||||||||
4.50%, 04/15/2024 | 78 | 77,424 | ||||||||||
4.75%, 01/15/2026 | 1,138 | 1,126,358 | ||||||||||
Energy Transfer Partners LP/Regency Energy Finance Corp. | 135 | 135,036 | ||||||||||
Eni SpA | 850 | 868,241 | ||||||||||
Enterprise Products Operating LLC | 235 | 237,326 | ||||||||||
| abfunds.com | AB TOTAL RETURN BOND PORTFOLIO | 17 | |
PORTFOLIO OF INVESTMENTS (continued)
| Principal Amount (000) | U.S. $ Value | |||||||||||
| ||||||||||||
EOG Resources, Inc. | U.S.$ | 927 | $ | 1,032,122 | ||||||||
Equinor ASA | 1,049 | 1,099,090 | ||||||||||
Exxon Mobil Corp. | 1,065 | 1,077,716 | ||||||||||
2.992%, 03/19/2025 | 881 | 940,820 | ||||||||||
Husky Energy, Inc. | 874 | 709,985 | ||||||||||
Kinder Morgan, Inc. | 1,700 | 1,735,054 | ||||||||||
Marathon Oil Corp. | 111 | 95,426 | ||||||||||
6.80%, 03/15/2032 | 650 | 518,394 | ||||||||||
Marathon Petroleum Corp. | 868 | 869,562 | ||||||||||
Newfield Exploration Co. | 325 | 228,147 | ||||||||||
ONEOK, Inc. | 425 | 376,563 | ||||||||||
Sabine Pass Liquefaction LLC | 482 | 494,146 | ||||||||||
5.625%, 03/01/2025 | 396 | 416,038 | ||||||||||
Shell International Finance BV | 377 | 388,970 | ||||||||||
Valero Energy Corp. | 674 | 674,674 | ||||||||||
Williams Cos., Inc. (The) | 403 | 404,197 | ||||||||||
|
| |||||||||||
| 15,193,418 | ||||||||||||
|
| |||||||||||
Other Industrial – 0.2% | ||||||||||||
Alfa SAB de CV | 530 | 526,992 | ||||||||||
|
| |||||||||||
Services – 0.6% | ||||||||||||
Booking Holdings, Inc. | 216 | 229,005 | ||||||||||
Expedia Group, Inc. | 636 | 550,312 | ||||||||||
6.25%, 05/01/2025(a) | 179 | 182,938 | ||||||||||
7.00%, 05/01/2025(a) | 286 | 292,189 | ||||||||||
Global Payments, Inc. | 309 | 328,591 | ||||||||||
S&P Global, Inc. | 584 | 674,158 | ||||||||||
|
| |||||||||||
| 2,257,193 | ||||||||||||
|
| |||||||||||
| 18 | AB TOTAL RETURN BOND PORTFOLIO | abfunds.com | |
PORTFOLIO OF INVESTMENTS (continued)
| Principal Amount (000) | U.S. $ Value | |||||||||||
| ||||||||||||
Technology – 1.3% | ||||||||||||
Analog Devices, Inc. | U.S.$ | 58 | $ | 60,601 | ||||||||
Baidu, Inc. | 202 | 211,628 | ||||||||||
Broadcom Corp./Broadcom Cayman Finance Ltd. | 146 | 152,609 | ||||||||||
3.875%, 01/15/2027 | 395 | 412,151 | ||||||||||
Broadcom, Inc. | 270 | 284,467 | ||||||||||
4.25%, 04/15/2026(a) | 311 | 334,107 | ||||||||||
4.70%, 04/15/2025(a) | 200 | 220,436 | ||||||||||
Dell International LLC/EMC Corp. | 469 | 508,429 | ||||||||||
KLA Corp. | 614 | 683,216 | ||||||||||
Lam Research Corp. | 269 | 274,122 | ||||||||||
NXP BV/NXP Funding LLC/NXP USA, Inc. | 132 | 133,439 | ||||||||||
Oracle Corp. | 1,031 | 1,087,612 | ||||||||||
Seagate HDD Cayman | 165 | 170,527 | ||||||||||
|
| |||||||||||
| 4,533,344 | ||||||||||||
|
| |||||||||||
Transportation - Airlines – 0.1% | ||||||||||||
Southwest Airlines Co. | 516 | 512,295 | ||||||||||
|
| |||||||||||
Transportation - Railroads – 0.1% | ||||||||||||
Lima Metro Line 2 Finance Ltd. | 216 | 219,780 | ||||||||||
5.875%, 07/05/2034(a) | 188 | 211,019 | ||||||||||
|
| |||||||||||
| 430,799 | ||||||||||||
|
| |||||||||||
Transportation - Services – 0.2% | ||||||||||||
Adani Ports & Special Economic Zone Ltd. | 545 | 524,733 | ||||||||||
FedEx Corp. | 205 | 219,786 | ||||||||||
|
| |||||||||||
| 744,519 | ||||||||||||
|
| |||||||||||
| 53,491,574 | ||||||||||||
|
| |||||||||||
Financial Institutions – 9.9% | ||||||||||||
Banking – 8.4% | ||||||||||||
ABN AMRO Bank NV | 200 | 214,782 | ||||||||||
| abfunds.com | AB TOTAL RETURN BOND PORTFOLIO | 19 | |
PORTFOLIO OF INVESTMENTS (continued)
| Principal Amount (000) | U.S. $ Value | |||||||||
| ||||||||||
AIB Group PLC | U.S.$ | 500 | $ | 507,880 | ||||||
4.75%, 10/12/2023(a) | 225 | 232,832 | ||||||||
American Express Co. | 461 | 394,598 | ||||||||
Australia & New Zealand Banking Group Ltd. | 510 | 543,497 | ||||||||
Banco Santander Mexico SA Institucion de Banca Multiple Grupo Financiero Santand | 443 | 454,629 | ||||||||
Banco Santander SA | 1,000 | 1,084,770 | ||||||||
Bank of America Corp. | 185 | 200,092 | ||||||||
Series L | 1,455 | 1,566,744 | ||||||||
Series Z | 289 | 311,889 | ||||||||
Bank of New York Mellon Corp. (The) | 284 | 288,166 | ||||||||
Barclays Bank PLC | 129 | 154,800 | ||||||||
BNP Paribas SA | 1,007 | 1,075,334 | ||||||||
BPCE SA | 230 | 249,019 | ||||||||
CIT Group, Inc. | 383 | 381,533 | ||||||||
Citigroup, Inc. | 874 | 915,157 | ||||||||
3.70%, 01/12/2026 | 1,000 | 1,079,860 | ||||||||
3.875%, 03/26/2025 | 827 | 882,326 | ||||||||
5.95%, 01/30/2023(b) | 216 | 214,648 | ||||||||
Series Q | 575 | 533,548 | ||||||||
Commonwealth Bank of Australia | 505 | 541,587 | ||||||||
Cooperatieve Rabobank UA | 1,373 | 1,479,243 | ||||||||
Credit Agricole SA/London | 257 | 267,917 | ||||||||
Danske Bank A/S | 492 | 491,380 | ||||||||
| 20 | AB TOTAL RETURN BOND PORTFOLIO | abfunds.com | |
PORTFOLIO OF INVESTMENTS (continued)
| Principal Amount (000) | U.S. $ Value | |||||||||
| ||||||||||
Discover Bank | U.S.$ | 250 | $ | 255,338 | ||||||
Goldman Sachs Group, Inc. (The) | 529 | 564,078 | ||||||||
3.75%, 05/22/2025 | 254 | 271,968 | ||||||||
Series M | 482 | 446,139 | ||||||||
Series P | 133 | 120,100 | ||||||||
HSBC Bank USA NA | 360 | 364,212 | ||||||||
HSBC Holdings PLC | 462 | 500,965 | ||||||||
4.25%, 03/14/2024 | 282 | 299,047 | ||||||||
4.292%, 09/12/2026 | 536 | 588,775 | ||||||||
ING Groep NV | 425 | 424,664 | ||||||||
JPMorgan Chase & Co. | 465 | 471,529 | ||||||||
3.22%, 03/01/2025 | 890 | 937,570 | ||||||||
Series FF | 68 | 63,689 | ||||||||
Series Z | 200 | 189,702 | ||||||||
Lloyds Banking Group PLC | 1,047 | 1,101,350 | ||||||||
Mastercard, Inc. | 417 | 465,093 | ||||||||
Morgan Stanley | 448 | 453,268 | ||||||||
5.00%, 11/24/2025 | 396 | 448,767 | ||||||||
Series G | 1,030 | 1,132,742 | ||||||||
Series J | 110 | 101,181 | ||||||||
Nationwide Building Society | 950 | 981,103 | ||||||||
Royal Bank of Scotland Group PLC | 320 | 327,869 | ||||||||
Series U | 700 | 609,182 | ||||||||
Santander Holdings USA, Inc. | 220 | 211,873 | ||||||||
4.40%, 07/13/2027 | 603 | 611,255 | ||||||||
Standard Chartered PLC | 400 | 311,516 | ||||||||
| abfunds.com | AB TOTAL RETURN BOND PORTFOLIO | 21 | |
PORTFOLIO OF INVESTMENTS (continued)
| Principal Amount (000) | U.S. $ Value | |||||||||||
| ||||||||||||
5.20%, 01/26/2024(a) | U.S.$ | 350 | $ | 368,956 | ||||||||
7.50%, 04/02/2022(a)(b) | 363 | 364,278 | ||||||||||
State Street Corp. | 77 | 81,809 | ||||||||||
UBS AG/London | 359 | 360,537 | ||||||||||
UBS AG/Stamford CT | 620 | 671,782 | ||||||||||
UBS Group AG | 436 | 479,208 | ||||||||||
7.00%, 02/19/2025(a)(b) | 312 | 335,328 | ||||||||||
US Bancorp | 380 | 388,166 | ||||||||||
Wells Fargo & Co. | 770 | 774,997 | ||||||||||
|
| |||||||||||
| 30,144,267 | ||||||||||||
|
| |||||||||||
Brokerage – 0.4% | ||||||||||||
Charles Schwab Corp. (The) | 807 | 909,206 | ||||||||||
Series G | 334 | 344,431 | ||||||||||
|
| |||||||||||
| 1,253,637 | ||||||||||||
|
| |||||||||||
Finance – 0.5% | ||||||||||||
GE Capital International Funding Co. Unlimited Co. | 556 | 572,763 | ||||||||||
4.418%, 11/15/2035 | 272 | 283,443 | ||||||||||
Synchrony Financial | 1,008 | 986,409 | ||||||||||
|
| |||||||||||
| 1,842,615 | ||||||||||||
|
| |||||||||||
Insurance – 0.6% | ||||||||||||
Centene Corp. | 116 | 121,350 | ||||||||||
4.625%, 12/15/2029(a) | 132 | 144,480 | ||||||||||
Guardian Life Insurance Co. of America (The) | 294 | 378,372 | ||||||||||
MetLife Capital Trust IV | 699 | 859,945 | ||||||||||
Nationwide Mutual Insurance Co. | 246 | 408,594 | ||||||||||
Voya Financial, Inc. | 180 | 177,707 | ||||||||||
|
| |||||||||||
| 2,090,448 | ||||||||||||
|
| |||||||||||
| 35,330,967 | ||||||||||||
|
| |||||||||||
| 22 | AB TOTAL RETURN BOND PORTFOLIO | abfunds.com | |
PORTFOLIO OF INVESTMENTS (continued)
| Principal Amount (000) | U.S. $ Value | |||||||||||
| ||||||||||||
Utility – 0.8% | ||||||||||||
Electric – 0.8% | ||||||||||||
Berkshire Hathaway Energy Co. | U.S.$ | 239 | $ | 305,834 | ||||||||
Colbun SA | 400 | 381,150 | ||||||||||
Consolidated Edison Co. of New York, Inc. | 234 | 281,181 | ||||||||||
Enel Chile SA | 514 | 547,410 | ||||||||||
Florida Power & Light Co. | 195 | 211,476 | ||||||||||
Israel Electric Corp., Ltd. | 580 | 628,575 | ||||||||||
NextEra Energy Capital Holdings, Inc. | 211 | 224,673 | ||||||||||
PacifiCorp | 172 | 186,699 | ||||||||||
|
| |||||||||||
| 2,766,998 | ||||||||||||
|
| |||||||||||
Total Corporates – Investment Grade | 91,589,539 | |||||||||||
|
| |||||||||||
COLLATERALIZED MORTGAGE OBLIGATIONS – 15.3% | ||||||||||||
Risk Share Floating Rate – 13.4% | ||||||||||||
Bellemeade Re Ltd. | 14 | 14,242 | ||||||||||
Series 2018-2A, Class M1B | 377 | 361,449 | ||||||||||
Series 2018-3A, Class M1B | 670 | 631,030 | ||||||||||
Series 2018-3A, Class M2 | 325 | 253,605 | ||||||||||
Series 2019-1A, Class M1B | 1,000 | 866,110 | �� | |||||||||
Series 2019-2A, Class M1C | 487 | 442,505 | ||||||||||
| abfunds.com | AB TOTAL RETURN BOND PORTFOLIO | 23 | |
PORTFOLIO OF INVESTMENTS (continued)
| Principal Amount (000) | U.S. $ Value | |||||||||
| ||||||||||
Series 2019-2A, Class M2 | U.S.$ | 325 | $ | 251,466 | ||||||
Series 2019-3A, Class M1B | 359 | 312,266 | ||||||||
Series 2019-3A, Class M1C | 263 | 199,069 | ||||||||
Series 2019-4A, Class M1B | 885 | 807,163 | ||||||||
Series 2019-4A, Class M1C | 750 | 641,139 | ||||||||
Series 2019-4A, Class M2 | 540 | 375,874 | ||||||||
Connecticut Avenue Securities Trust | 295 | 275,278 | ||||||||
Series 2019-HRP1, Class M2 | 764 | 632,863 | ||||||||
Series 2019-R01, Class 2M2 | 794 | 706,941 | ||||||||
Series 2019-R02, Class 1M2 | 276 | 251,997 | ||||||||
Series 2019-R03, Class 1M2 | 589 | 535,380 | ||||||||
Series 2019-R04, Class 2M2 | 900 | 801,684 | ||||||||
Series 2019-R05, Class 1M2 | 834 | 759,554 | ||||||||
Series 2019-R06, Class 2M2 | 890 | 752,614 | ||||||||
Series 2019-R07, Class 1M2 | 895 | 773,742 | ||||||||
| 24 | AB TOTAL RETURN BOND PORTFOLIO | abfunds.com | |
PORTFOLIO OF INVESTMENTS (continued)
| Principal Amount (000) | U.S. $ Value | |||||||||
| ||||||||||
Series 2020-R01, Class 1B1 | U.S.$ | 500 | $ | 219,213 | ||||||
Series 2020-R01, Class 1M2 | 1,100 | 829,702 | ||||||||
Series 2020-R02, Class 2M2 | 950 | 670,103 | ||||||||
Series 2020-SBT1, Class 1M2 | 1,000 | 707,407 | ||||||||
Eagle Re Ltd. | 325 | 258,978 | ||||||||
Series 2019-1, Class M2 | 325 | 264,334 | ||||||||
Series 2020-1, Class M1A | 950 | 861,813 | ||||||||
Federal Home Loan Mortgage Corp. | 785 | 586,953 | ||||||||
Series 2016-DNA4, Class M3 | 1,000 | 966,392 | ||||||||
Series 2016-HQA3, Class M3 | 1,162 | 1,145,957 | ||||||||
Series 2018-HQA2, Class B1 | 1,250 | 787,816 | ||||||||
Series 2019-DNA1, Class B2 | 750 | 347,762 | ||||||||
Series 2019-DNA1, Class M2 | 1,050 | 931,798 | ||||||||
Series 2019-DNA3, Class B1 | 600 | 348,642 | ||||||||
Series 2019-DNA3, Class M2 | 789 | 675,008 | ||||||||
| abfunds.com | AB TOTAL RETURN BOND PORTFOLIO | 25 | |
PORTFOLIO OF INVESTMENTS (continued)
| Principal Amount (000) | U.S. $ Value | |||||||||
| ||||||||||
Series 2019-DNA4, Class M2 | U.S.$ | 885 | $ | 751,714 | ||||||
Series 2019-FTR2, Class B1 | 750 | 394,336 | ||||||||
Series 2019-FTR2, Class M2 | 895 | 712,094 | ||||||||
Series 2019-FTR3, Class B2 | 700 | 186,044 | ||||||||
Series 2019-HQA1, Class M2 | 735 | 669,249 | ||||||||
Series 2019-HQA2, Class B1 | 750 | 453,746 | ||||||||
Series 2019-HQA3, Class B1 | 500 | 297,467 | ||||||||
Series 2019-HQA3, Class M2 | 355 | 301,491 | ||||||||
Series 2019-HQA4, Class B1 | 750 | 429,962 | ||||||||
Series 2020-DNA1, Class M2 | 890 | 677,370 | ||||||||
Series 2020-DNA2, Class M2 | 690 | 510,927 | ||||||||
Series 2020-HQA2, Class M1 | 540 | 516,605 | ||||||||
Federal Home Loan Mortgage Corp. Structured Agency Credit Risk Debt Notes | 1,000 | 666,918 | ||||||||
Series 2015-HQA2, Class M3 | 500 | 496,500 | ||||||||
Series 2016-DNA1, Class M3 | 330 | 331,195 | ||||||||
| 26 | AB TOTAL RETURN BOND PORTFOLIO | abfunds.com | |
PORTFOLIO OF INVESTMENTS (continued)
| Principal Amount (000) | U.S. $ Value | |||||||||
| ||||||||||
Series 2016-DNA2, Class M3 | U.S.$ | 888 | $ | 874,689 | ||||||
Series 2017-DNA1, Class M2 | 365 | 347,817 | ||||||||
Series 2017-DNA2, Class B1 | 750 | 581,260 | ||||||||
Series 2017-DNA3, Class M2 | 250 | 235,095 | ||||||||
Series 2017-HQA1, Class M2 | 967 | 890,053 | ||||||||
Series 2017-HQA2, Class B1 | 800 | 590,271 | ||||||||
Series 2017-HQA2, Class M2 | 250 | 221,620 | ||||||||
Series 2017-HQA3, Class B1 | 750 | 548,713 | ||||||||
Federal National Mortgage Association Connecticut Avenue Securities | 405 | 321,433 | ||||||||
Series 2015-C01, Class 2M2 | 150 | 130,108 | ||||||||
Series 2015-C02, Class 1M2 | 306 | 247,569 | ||||||||
Series 2015-C02, Class 2M2 | 166 | 141,960 | ||||||||
Series 2015-C03, Class 1M2 | 383 | 281,248 | ||||||||
Series 2015-C03, Class 2M2 | 300 | 228,599 | ||||||||
Series 2015-C04, Class 1M2 | 521 | 526,403 | ||||||||
| abfunds.com | AB TOTAL RETURN BOND PORTFOLIO | 27 | |
PORTFOLIO OF INVESTMENTS (continued)
| Principal Amount (000) | U.S. $ Value | |||||||||
| ||||||||||
Series 2015-C04, Class 2M2 | U.S.$ | 309 | $ | 312,014 | ||||||
Series 2016-C02, Class 1B | 149 | 134,410 | ||||||||
Series 2016-C03, Class 1B | 100 | 86,576 | ||||||||
Series 2016-C05, Class 2M2 | 902 | 885,348 | ||||||||
Series 2016-C06, Class 1B | 379 | 270,834 | ||||||||
Series 2016-C06, Class 1M2 | 375 | 366,633 | ||||||||
Series 2016-C07, Class 2B | 379 | 269,857 | ||||||||
Series 2017-C01, Class 1B1 | 750 | 617,945 | ||||||||
Series 2017-C01, Class 1M2 | 450 | 432,330 | ||||||||
Series 2017-C02, Class 2B1 | 750 | 535,626 | ||||||||
Series 2017-C03, Class 1M2 | 735 | 695,372 | ||||||||
Series 2017-C04, Class 2M2 | 320 | 293,179 | ||||||||
Series 2017-C05, Class 1M2 | 463 | 428,502 | ||||||||
Series 2017-C06, Class 2B1 | 750 | 481,068 | ||||||||
Series 2017-C07, Class 1B1 | 305 | 228,552 | ||||||||
Series 2017-C07, Class 2B1 | 750 | 475,375 | ||||||||
| 28 | AB TOTAL RETURN BOND PORTFOLIO | abfunds.com | |
PORTFOLIO OF INVESTMENTS (continued)
| Principal Amount (000) | U.S. $ Value | |||||||||
| ||||||||||
Series 2017-C07, Class 2M2 | U.S.$ | 259 | $ | 225,983 | ||||||
Home Re Ltd. | 500 | 315,981 | ||||||||
Series 2018-1, Class M1 | 264 | 249,835 | ||||||||
JP Morgan Madison Avenue Securities Trust | 63 | 64,778 | ||||||||
Mortgage Insurance-Linked Notes | 900 | 770,479 | ||||||||
Series 2020-1, Class M1A | 900 | 864,194 | ||||||||
Series 2020-1, Class M2A | 850 | 668,627 | ||||||||
Oaktown Re III Ltd. | 710 | 650,210 | ||||||||
PMT Credit Risk Transfer Trust | 525 | 410,748 | ||||||||
Series 2019-2R, Class A | 638 | 473,638 | ||||||||
Series 2019-3R, Class A | 556 | 423,273 | ||||||||
Series 2020-1R, Class A | 893 | 669,295 | ||||||||
Radnor Re Ltd. | 500 | 334,052 | ||||||||
Series 2019-1, Class M1B | 806 | 747,442 | ||||||||
| abfunds.com | AB TOTAL RETURN BOND PORTFOLIO | 29 | |
PORTFOLIO OF INVESTMENTS (continued)
| Principal Amount (000) | U.S. $ Value | |||||||||||
| ||||||||||||
Series 2019-2, Class M1B | U.S.$ | 351 | $ | 307,510 | ||||||||
STACR Trust | 740 | 291,767 | ||||||||||
Wells Fargo Credit Risk Transfer Securities Trust | 349 | 268,574 | ||||||||||
Series 2015-WF1, Class 2M2 | 100 | 77,869 | ||||||||||
|
| |||||||||||
| 48,138,181 | ||||||||||||
|
| |||||||||||
Agency Floating Rate – 1.1% | ||||||||||||
Federal Home Loan Mortgage Corp. REMICs | 1,196 | 280,400 | ||||||||||
Series 4719, Class JS | 1,673 | 276,535 | ||||||||||
Federal National Mortgage Association REMICs | 832 | 178,798 | ||||||||||
Series 2012-70, Class SA | 1,523 | 372,209 | ||||||||||
Series 2015-90, Class SL | 1,643 | 363,082 | ||||||||||
Series 2016-77, Class DS | 1,565 | 301,185 | ||||||||||
Series 2017-16, Class SG | 1,719 | 344,572 | ||||||||||
Series 2017-26, Class TS | 1,608 | 336,378 | ||||||||||
Series 2017-62, Class AS | 1,670 | 313,205 | ||||||||||
| 30 | AB TOTAL RETURN BOND PORTFOLIO | abfunds.com | |
PORTFOLIO OF INVESTMENTS (continued)
| Principal Amount (000) | U.S. $ Value | |||||||||||
| ||||||||||||
Series 2017-81, Class SA | U.S.$ | 1,734 | $ | 366,955 | ||||||||
Series 2017-97, Class LS | 1,505 | 355,113 | ||||||||||
Government National Mortgage Association | 1,647 | 347,554 | ||||||||||
|
| |||||||||||
| 3,835,986 | ||||||||||||
|
| |||||||||||
Non-Agency Fixed Rate – 0.4% | ||||||||||||
Alternative Loan Trust | 261 | 180,624 | ||||||||||
Series 2006-28CB, Class A14 | 193 | 142,668 | ||||||||||
Series 2006-J1, Class 1A13 | 135 | 116,816 | ||||||||||
Countrywide Home Loan Mortgage Pass-Through Trust | 65 | 44,537 | ||||||||||
First Horizon Alternative Mortgage Securities Trust | 226 | 158,874 | ||||||||||
JP Morgan Alternative Loan Trust | 597 | 465,893 | ||||||||||
Structured Asset Securities Corp. Mortgage Pass-Through Certificates | 452 | 237,312 | ||||||||||
|
| |||||||||||
| 1,346,724 | ||||||||||||
|
| |||||||||||
Agency Fixed Rate – 0.2% | ||||||||||||
Federal National Mortgage Association Grantor Trust | 65 | 57,692 | ||||||||||
Federal National Mortgage Association REMICs | 4,846 | 806,889 | ||||||||||
|
| |||||||||||
| 864,581 | ||||||||||||
|
| |||||||||||
| abfunds.com | AB TOTAL RETURN BOND PORTFOLIO | 31 | |
PORTFOLIO OF INVESTMENTS (continued)
| Principal Amount (000) | U.S. $ Value | |||||||||||
| ||||||||||||
Non-Agency Floating Rate – 0.2% | ||||||||||||
Chase Mortgage Reference Notes | U.S.$ | 197 | $ | 170,237 | ||||||||
Deutsche Alt-A Securities Mortgage Loan Trust | 570 | 258,175 | ||||||||||
HomeBanc Mortgage Trust | 153 | 125,806 | ||||||||||
Impac Secured Assets Corp. | 271 | 130,667 | ||||||||||
Residential Accredit Loans, Inc. Trust | 612 | 59,777 | ||||||||||
|
| |||||||||||
| 744,662 | ||||||||||||
|
| |||||||||||
Total Collateralized Mortgage Obligations | 54,930,134 | |||||||||||
|
| |||||||||||
COMMERCIAL MORTGAGE-BACKED SECURITIES – 14.9% | ||||||||||||
Non-Agency Fixed Rate CMBS – 11.6% | ||||||||||||
BAMLL Commercial Mortgage Securities Trust | 960 | 828,308 | ||||||||||
Banc of America Commercial Mortgage Trust Series 2015-UBS7, Class AS | 860 | 892,605 | ||||||||||
CFCRE Commercial Mortgage Trust | 735 | 762,045 | ||||||||||
Series 2016-C4, Class AM | 375 | 378,604 | ||||||||||
CGRBS Commercial Mortgage Trust | 1,305 | 1,366,461 | ||||||||||
| 32 | AB TOTAL RETURN BOND PORTFOLIO | abfunds.com | |
PORTFOLIO OF INVESTMENTS (continued)
| Principal Amount (000) | U.S. $ Value | |||||||||
| ||||||||||
Citigroup Commercial Mortgage Trust | U.S.$ | 500 | $ | 490,706 | ||||||
Series 2013-GC17, Class D | 565 | 453,393 | ||||||||
Series 2015-GC27, Class A5 | 1,223 | 1,274,361 | ||||||||
Series 2015-GC35, Class A4 | 340 | 366,044 | ||||||||
Series 2016-GC36, Class A5 | 425 | 455,981 | ||||||||
Series 2018-B2, Class A4 | 1,050 | 1,177,542 | ||||||||
Commercial Mortgage Trust | 223 | 219,485 | ||||||||
Series 2014-LC17, Class B | 800 | 808,937 | ||||||||
Series 2014-UBS6, Class AM | 375 | 383,052 | ||||||||
Series 2015-3BP, Class A | 170 | 176,168 | ||||||||
Series 2015-CR24, Class A5 | 430 | 462,236 | ||||||||
Series 2015-CR25, Class A4 | 1,045 | 1,113,546 | ||||||||
Series 2015-DC1, Class A5 | 765 | 787,224 | ||||||||
Series 2015-PC1, Class A5 | 685 | 724,172 | ||||||||
Series 2019-GC44, Class AM | 991 | 1,040,734 | ||||||||
CSAIL Commercial Mortgage Trust | 332 | 341,238 | ||||||||
Series 2015-C3, Class A4 | 573 | 610,539 | ||||||||
Series 2015-C4, Class A4 | 1,450 | 1,527,672 | ||||||||
GS Mortgage Securities Trust | 1,750 | 1,238,415 | ||||||||
Series 2013-G1, Class A2 | 766 | 714,760 | ||||||||
Series 2014-GC22, Class A5 | 658 | 699,542 | ||||||||
Series 2018-GS9, Class A4 | 1,125 | 1,251,489 | ||||||||
| abfunds.com | AB TOTAL RETURN BOND PORTFOLIO | 33 | |
PORTFOLIO OF INVESTMENTS (continued)
| Principal Amount (000) | U.S. $ Value | |||||||||
| ||||||||||
JP Morgan Chase Commercial Mortgage Securities Trust | U.S.$ | 127 | $ | 114,436 | ||||||
Series 2012-C6, Class D | 690 | 490,063 | ||||||||
Series 2012-C6, Class E | 389 | 254,784 | ||||||||
Series 2012-C8, Class AS | 850 | 843,235 | ||||||||
JPMBB Commercial Mortgage Securities Trust | 735 | 776,358 | ||||||||
Series 2014-C24, Class C | 890 | 733,493 | ||||||||
Series 2015-C30, Class A5 | 425 | 460,238 | ||||||||
Series 2015-C31, Class A3 | 1,009 | 1,092,595 | ||||||||
Series 2015-C31, Class B | 948 | 952,308 | ||||||||
Series 2015-C33, Class A4 | 1,050 | 1,138,621 | ||||||||
JPMCC Commercial Mortgage Securities Trust | 4,716 | 249,701 | ||||||||
LB-UBS Commercial Mortgage Trust | 135 | 78,719 | ||||||||
LSTAR Commercial Mortgage Trust | 615 | 619,567 | ||||||||
Morgan Stanley Bank of America Merrill Lynch Trust | 730 | 767,234 | ||||||||
Morgan Stanley Capital I Trust | 100 | 99,923 | ||||||||
Series 2016-UB12, Class A4 | 660 | 697,749 | ||||||||
SG Commercial Mortgage Securities Trust | 540 | 525,393 | ||||||||
| 34 | AB TOTAL RETURN BOND PORTFOLIO | abfunds.com | |
PORTFOLIO OF INVESTMENTS (continued)
| Principal Amount (000) | U.S. $ Value | |||||||||||
| ||||||||||||
UBS Commercial Mortgage Trust | U.S.$ | 720 | $ | 781,898 | ||||||||
Series 2018-C9, Class A4 | 1,300 | 1,459,593 | ||||||||||
Series 2018-C10, Class A4 | 750 | 847,939 | ||||||||||
UBS-Barclays Commercial Mortgage Trust | 1,098 | 1,114,309 | ||||||||||
Wells Fargo Commercial Mortgage Trust | 1,040 | 1,081,878 | ||||||||||
Series 2015-SG1, Class A4 | 725 | 766,906 | ||||||||||
Series 2015-SG1, Class C | 516 | 444,441 | ||||||||||
Series 2016-C35, Class XA | 3,810 | 328,458 | ||||||||||
Series 2016-LC24, Class XA | 8,899 | 569,071 | ||||||||||
Series 2016-LC25, Class C | 545 | 450,998 | ||||||||||
Series 2016-NXS6, Class C | 600 | 498,877 | ||||||||||
Series 2018-C43, Class A4 | 900 | 999,024 | ||||||||||
Series 2018-C48, Class A5 | 89 | 103,344 | ||||||||||
WF-RBS Commercial Mortgage Trust | 7,489 | 198,747 | ||||||||||
WFRBS Commercial Mortgage Trust | 480 | 467,940 | ||||||||||
WFRBS Commercial Mortgage Trust 2014-C24 | 945 | 941,690 | ||||||||||
|
| |||||||||||
| 41,494,789 | ||||||||||||
|
| |||||||||||
Non-Agency Floating Rate CMBS – 3.3% | ||||||||||||
Ashford Hospitality Trust | 568 | 510,316 | ||||||||||
Series 2018-KEYS, Class A | 1,000 | 867,209 | ||||||||||
| abfunds.com | AB TOTAL RETURN BOND PORTFOLIO | 35 | |
PORTFOLIO OF INVESTMENTS (continued)
| Principal Amount (000) | U.S. $ Value | |||||||||
| ||||||||||
Atrium Hotel Portfolio Trust | U.S.$ | 750 | $ | 675,005 | ||||||
BAMLL Commercial Mortgage Securities Trust | 1,330 | 1,283,529 | ||||||||
BFLD | 530 | 447,013 | ||||||||
BHMS | 547 | 507,936 | ||||||||
Braemar Hotels & Resorts Trust | 700 | 632,420 | ||||||||
BX Trust | 780 | 641,687 | ||||||||
CLNY Trust | 540 | 395,111 | ||||||||
DBWF Mortgage Trust | 541 | 500,610 | ||||||||
Great Wolf Trust | 1,019 | 919,325 | ||||||||
GS Mortgage Securities Corp. Trust | 725 | 668,265 | ||||||||
Series 2019-SMP, Class A 1.964% (LIBOR 1 Month + 1.15%), 08/15/2032(a)(c) | 700 | 598,518 | ||||||||
JP Morgan Chase Commercial Mortgage Securities Trust | 1,000 | 903,486 | ||||||||
| 36 | AB TOTAL RETURN BOND PORTFOLIO | abfunds.com | |
PORTFOLIO OF INVESTMENTS (continued)
| Principal Amount (000) | U.S. $ Value | |||||||||||
| ||||||||||||
Morgan Stanley Capital I Trust | U.S.$ | 173 | $ | 156,776 | ||||||||
Series 2019-BPR, Class C | 520 | 408,192 | ||||||||||
Natixis Commercial Mortgage Securities Trust Series 2018-850T, Class A | 540 | 519,220 | ||||||||||
Series 2019-MILE, Class A | 379 | 356,424 | ||||||||||
Starwood Retail Property Trust | 1,045 | 976,354 | ||||||||||
|
| |||||||||||
| 11,967,396 | ||||||||||||
|
| |||||||||||
Agency CMBS – 0.0% | ||||||||||||
Government National Mortgage Association | 763 | 8 | ||||||||||
|
| |||||||||||
Total Commercial Mortgage-Backed Securities | 53,462,193 | |||||||||||
|
| |||||||||||
MORTGAGE PASS-THROUGHS – 14.2% | ||||||||||||
Agency Fixed Rate 30-Year – 13.0% | ||||||||||||
Federal Home Loan Mortgage Corp. Gold | 156 | 179,228 | ||||||||||
Series 2007 | 22 | 25,174 | ||||||||||
Series 2016 | 1,136 | 1,249,159 | ||||||||||
Series 2017 | 880 | 966,221 | ||||||||||
Series 2018 | 2,469 | 2,680,962 | ||||||||||
4.50%, 03/01/2048-11/01/2048 | 3,127 | 3,418,713 | ||||||||||
5.00%, 11/01/2048 | 572 | 632,584 | ||||||||||
FHLMC Uniform Mortgage-Backed Security Series 2019 | 3,879 | 4,181,003 | ||||||||||
Series 2020 | 1,248 | 1,360,757 | ||||||||||
| abfunds.com | AB TOTAL RETURN BOND PORTFOLIO | 37 | |
PORTFOLIO OF INVESTMENTS (continued)
| Principal Amount (000) | U.S. $ Value | |||||||||||
| ||||||||||||
FNMA Uniform Mortgage-Backed Security Series 2003 | U.S.$ | 145 | $ | 165,511 | ||||||||
Series 2004 | 486 | 558,160 | ||||||||||
Series 2005 | 60 | 69,092 | ||||||||||
Series 2007 | 290 | 332,256 | ||||||||||
Series 2010 | 525 | 577,231 | ||||||||||
Series 2012 | 3,486 | 3,808,666 | ||||||||||
Series 2013 | 1,666 | 1,820,671 | ||||||||||
4.00%, 10/01/2043 | 1,210 | 1,331,059 | ||||||||||
Series 2016 | 1,198 | 1,282,244 | ||||||||||
Series 2017 | 3,342 | 3,563,685 | ||||||||||
Series 2018 | 1,555 | 1,667,213 | ||||||||||
4.00%, 08/01/2048-12/01/2048 | 2,965 | 3,218,360 | ||||||||||
4.50%, 09/01/2048 | 3,123 | 3,414,227 | ||||||||||
Series 2019 | 4,916 | 5,287,020 | ||||||||||
4.00%, 06/01/2049 | 1,636 | 1,789,780 | ||||||||||
Series 2020 | 1,276 | 1,380,318 | ||||||||||
Government National Mortgage Association Series 2016 | 846 | 904,149 | ||||||||||
Series 2019 | 600 | 638,602 | ||||||||||
|
| |||||||||||
| 46,502,045 | ||||||||||||
|
| |||||||||||
Agency Fixed Rate 15-Year – 1.2% | ||||||||||||
FNMA Uniform Mortgage-Backed Security | 3,086 | 3,237,403 | ||||||||||
Series 2017 | 930 | 975,661 | ||||||||||
|
| |||||||||||
| 4,213,064 | ||||||||||||
|
| |||||||||||
Other Agency Fixed Rate Programs – 0.0% | ||||||||||||
FNMA Uniform Mortgage-Backed Security | 50 | 51,984 | ||||||||||
|
| |||||||||||
| 38 | AB TOTAL RETURN BOND PORTFOLIO | abfunds.com | |
PORTFOLIO OF INVESTMENTS (continued)
| Principal Amount (000) | U.S. $ Value | |||||||||||
| ||||||||||||
Agency ARMs – 0.0% | ||||||||||||
Federal Home Loan Mortgage Corp. | U.S.$ | 19 | $ | 19,398 | ||||||||
|
| |||||||||||
Total Mortgage Pass-Throughs | 50,786,491 | |||||||||||
|
| |||||||||||
GOVERNMENTS – TREASURIES – 12.1% | ||||||||||||
Malaysia – 0.3% | ||||||||||||
Malaysia Government Bond | MYR | 3,708 | 884,524 | |||||||||
|
| |||||||||||
United States – 11.8% | ||||||||||||
U.S. Treasury Bonds | U.S.$ | 1,378 | 1,677,715 | |||||||||
2.375%, 11/15/2049 | 555 | 704,850 | ||||||||||
2.50%, 02/15/2045-05/15/2046 | 4,460 | 5,658,180 | ||||||||||
2.875%, 08/15/2045-11/15/2046 | 1,556 | 2,110,266 | ||||||||||
3.00%, 05/15/2045-05/15/2047 | 3,331 | 4,628,706 | ||||||||||
3.125%, 08/15/2044(g) | 8,704 | 12,117,182 | ||||||||||
4.375%, 02/15/2038-11/15/2039 | 5,613 | 8,917,116 | ||||||||||
U.S. Treasury Notes | ||||||||||||
1.75%, 12/31/2024(g) | 2,098 | 2,234,370 | ||||||||||
2.00%, 12/31/2021 | 1,698 | 1,748,675 | ||||||||||
2.25%, 04/30/2021(g) | 2,420 | 2,469,606 | ||||||||||
|
| |||||||||||
| 42,266,666 | ||||||||||||
|
| |||||||||||
Total Governments – Treasuries | 43,151,190 | |||||||||||
|
| |||||||||||
INFLATION-LINKED SECURITIES – 6.8% | ||||||||||||
Japan – 1.0% | ||||||||||||
Japanese Government CPI Linked Bond | JPY | 379,848 | 3,528,938 | |||||||||
|
| |||||||||||
United States – 5.8% | ||||||||||||
U.S. Treasury Inflation Index | U.S.$ | 16,318 | 16,251,674 | |||||||||
0.375%, 07/15/2025 (TIPS) | 4,496 | 4,673,500 | ||||||||||
|
| |||||||||||
| 20,925,174 | ||||||||||||
|
| |||||||||||
Total Inflation-Linked Securities | 24,454,112 | |||||||||||
|
| |||||||||||
| abfunds.com | AB TOTAL RETURN BOND PORTFOLIO | 39 | |
PORTFOLIO OF INVESTMENTS (continued)
| Principal Amount (000) | U.S. $ Value | |||||||||||
| ||||||||||||
ASSET-BACKED SECURITIES – 5.4% | ||||||||||||
Autos - Fixed Rate – 3.3% | ||||||||||||
Avis Budget Rental Car Funding AESOP LLC | U.S.$ | 418 | $ | 394,990 | ||||||||
Series 2018-1A, Class A | 920 | 876,113 | ||||||||||
Series 2018-2A, Class A | 755 | 710,790 | ||||||||||
CPS Auto Trust | 550 | 558,909 | ||||||||||
Exeter Automobile Receivables Trust | 250 | 253,909 | ||||||||||
Series 2016-3A, Class D | 350 | 358,910 | ||||||||||
Series 2017-1A, Class D | 525 | 488,411 | ||||||||||
Series 2017-3A, Class C | 385 | 383,533 | ||||||||||
First Investors Auto Owner Trust | 540 | 544,115 | ||||||||||
Flagship Credit Auto Trust | 350 | 364,853 | ||||||||||
Series 2016-4, Class E | 565 | 577,915 | ||||||||||
Series 2017-4, Class A | 22 | 22,365 | ||||||||||
Series 2018-3, Class B | 675 | 679,515 | ||||||||||
Series 2019-3, Class E | 960 | 822,933 | ||||||||||
Series 2020-1, Class E 3 | 1,000 | 823,093 | ||||||||||
Ford Credit Floorplan Master Owner Trust | 710 | 709,622 | ||||||||||
Hertz Vehicle Financing II LP | 180 | 172,016 | ||||||||||
Series 2017-1A, Class A | 950 | 888,276 | ||||||||||
Series 2019-1A, Class A | 680 | 656,262 | ||||||||||
| 40 | AB TOTAL RETURN BOND PORTFOLIO | abfunds.com | |
PORTFOLIO OF INVESTMENTS (continued)
| Principal Amount (000) | U.S. $ Value | |||||||||||
| ||||||||||||
Series 2019-2A, Class A | U.S.$ | 500 | $ | 454,898 | ||||||||
Hertz Vehicle Financing LLC | 1,035 | 962,644 | ||||||||||
|
| |||||||||||
| 11,704,072 | ||||||||||||
|
| |||||||||||
Other ABS - Fixed Rate – 1.4% | ||||||||||||
Consumer Loan Underlying Bond Credit Trust | 62 | 60,887 | ||||||||||
Marlette Funding Trust | 459 | 455,515 | ||||||||||
Series 2018-3A, Class A | 66 | 65,915 | ||||||||||
Series 2018-4A, Class A | 133 | 131,450 | ||||||||||
Series 2019-3A, Class A | 401 | 395,146 | ||||||||||
Series 2020-1A, Class A | 1,372 | 1,352,794 | ||||||||||
Prosper Marketplace Issuance Trust | 187 | 184,098 | ||||||||||
SBA Tower Trust | 688 | 688,729 | ||||||||||
SoFi Consumer Loan Program LLC | 28 | 28,052 | ||||||||||
Series 2016-3, Class A | 33 | 33,236 | ||||||||||
Series 2017-1, Class A | 49 | 49,366 | ||||||||||
Series 2017-2, Class A | 76 | 76,134 | ||||||||||
Series 2017-3, Class A | 85 | 84,890 | ||||||||||
Series 2017-4, Class B | 870 | 801,959 | ||||||||||
Series 2017-6, Class A2 | 367 | 364,718 | ||||||||||
SoFi Consumer Loan Program Trust | 311 | 306,612 | ||||||||||
|
| |||||||||||
| 5,079,501 | ||||||||||||
|
| |||||||||||
| abfunds.com | AB TOTAL RETURN BOND PORTFOLIO | 41 | |
PORTFOLIO OF INVESTMENTS (continued)
| Principal Amount (000) | U.S. $ Value | |||||||||||
| ||||||||||||
Credit Cards - Fixed Rate – 0.7% | ||||||||||||
World Financial Network Credit Card Master Trust | U.S.$ | 330 | $ | 330,749 | ||||||||
Series 2018-B, Class M | 825 | 822,256 | ||||||||||
Series 2019-A, Class M | 780 | 795,032 | ||||||||||
Series 2019-B, Class M | 600 | 576,683 | ||||||||||
|
| |||||||||||
| 2,524,720 | ||||||||||||
|
| |||||||||||
Home Equity Loans - Fixed Rate – 0.0% | ||||||||||||
Credit-Based Asset Servicing & Securitization LLC | 55 | 54,324 | ||||||||||
|
| |||||||||||
Home Equity Loans - Floating Rate – 0.0% | ||||||||||||
ABFC Trust | 23 | 21,410 | ||||||||||
|
| |||||||||||
Total Asset-Backed Securities | 19,384,027 | |||||||||||
|
| |||||||||||
CORPORATES – NON-INVESTMENT | ||||||||||||
Industrial – 1.1% | ||||||||||||
Basic – 0.1% | ||||||||||||
Sealed Air Corp. | 379 | 374,255 | ||||||||||
|
| |||||||||||
Capital Goods – 0.1% | ||||||||||||
TransDigm, Inc. | 362 | 355,777 | ||||||||||
|
| |||||||||||
Communications - Media – 0.1% | ||||||||||||
CSC Holdings LLC | 120 | 125,132 | ||||||||||
Diamond Sports Group LLC/Diamond | 226 | 171,817 | ||||||||||
|
| |||||||||||
| 296,949 | ||||||||||||
|
| |||||||||||
Consumer Cyclical - Automotive – 0.1% | ||||||||||||
Ford Motor Credit Co. LLC | 360 | 315,411 | ||||||||||
| 42 | AB TOTAL RETURN BOND PORTFOLIO | abfunds.com | |
PORTFOLIO OF INVESTMENTS (continued)
| Principal Amount (000) | U.S. $ Value | |||||||||||
| ||||||||||||
Panther BF Aggregator 2 LP/Panther | EUR | 130 | $ | 131,844 | ||||||||
|
| |||||||||||
| 447,255 | ||||||||||||
|
| |||||||||||
Consumer Non-Cyclical – 0.4% | ||||||||||||
Albertsons Cos., Inc./Safeway, Inc./New | U.S.$ | 671 | 664,176 | |||||||||
Spectrum Brands, Inc. | 512 | 510,449 | ||||||||||
|
| |||||||||||
| 1,174,625 | ||||||||||||
|
| |||||||||||
Energy – 0.3% | ||||||||||||
Occidental Petroleum Corp. | 630 | 437,541 | ||||||||||
Sunoco LP/Sunoco Finance Corp. | 459 | 449,297 | ||||||||||
Transocean Poseidon Ltd. | 225 | 175,016 | ||||||||||
|
| |||||||||||
| 1,061,854 | ||||||||||||
|
| |||||||||||
Technology – 0.0% | ||||||||||||
CommScope, Inc. | 75 | 75,157 | ||||||||||
|
| |||||||||||
| 3,785,872 | ||||||||||||
|
| |||||||||||
Financial Institutions – 0.5% | ||||||||||||
Banking – 0.4% | ||||||||||||
Credit Suisse Group AG | 1,020 | 1,019,908 | ||||||||||
Intesa Sanpaolo SpA | 288 | 290,543 | ||||||||||
|
| |||||||||||
| 1,310,451 | ||||||||||||
|
| |||||||||||
Finance – 0.1% | ||||||||||||
Navient Corp. | 440 | 437,554 | ||||||||||
7.25%, 01/25/2022 | 99 | 97,141 | ||||||||||
|
| |||||||||||
| 534,695 | ||||||||||||
|
| |||||||||||
| 1,845,146 | ||||||||||||
|
| |||||||||||
Total Corporates – Non-Investment Grade | 5,631,018 | |||||||||||
|
| |||||||||||
GOVERNMENTS – SOVEREIGN BONDS – 0.9% | ||||||||||||
Israel – 0.1% | ||||||||||||
Israel Government International Bond | 430 | 475,553 | ||||||||||
|
| |||||||||||
| abfunds.com | AB TOTAL RETURN BOND PORTFOLIO | 43 | |
PORTFOLIO OF INVESTMENTS (continued)
| Principal Amount (000) | U.S. $ Value | |||||||||||
| ||||||||||||
Mexico – 0.1% | ||||||||||||
Mexico Government International Bond | U.S.$ | 493 | $ | 497,684 | ||||||||
|
| |||||||||||
Peru – 0.1% | ||||||||||||
Peruvian Government International Bond | 202 | 205,030 | ||||||||||
|
| |||||||||||
Qatar – 0.2% | ||||||||||||
Qatar Government International Bond | 488 | 519,262 | ||||||||||
|
| |||||||||||
Saudi Arabia – 0.2% | ||||||||||||
Saudi Government International Bond | 692 | 700,993 | ||||||||||
|
| |||||||||||
United Arab Emirates – 0.2% | ||||||||||||
Abu Dhabi Government International Bond | 396 | 406,889 | ||||||||||
3.875%, 04/16/2050(a) | 356 | 378,247 | ||||||||||
|
| |||||||||||
| 785,136 | ||||||||||||
|
| |||||||||||
Total Governments – Sovereign Bonds | 3,183,658 | |||||||||||
|
| |||||||||||
COLLATERALIZED LOAN OBLIGATIONS – 0.8% | ||||||||||||
CLO - Floating Rate – 0.8% | ||||||||||||
Dryden CLO Ltd. | 440 | 440,000 | ||||||||||
Elevation CLO Ltd. | 1,000 | 753,515 | ||||||||||
Goldentree Loan Management US CLO 7 Ltd. | 630 | 630,141 | ||||||||||
SCFF I Ltd. | 750 | 737,625 | ||||||||||
Voya CLO Ltd. | 210 | 164,812 | ||||||||||
|
| |||||||||||
Total Collateralized Loan Obligations | 2,726,093 | |||||||||||
|
| |||||||||||
| 44 | AB TOTAL RETURN BOND PORTFOLIO | abfunds.com | |
PORTFOLIO OF INVESTMENTS (continued)
| Principal Amount (000) | U.S. $ Value | |||||||||||
| ||||||||||||
LOCAL GOVERNMENTS – US MUNICIPAL BONDS – 0.8% | ||||||||||||
United States – 0.8% | ||||||||||||
State of California | U.S.$ | 970 | $ | 1,615,758 | ||||||||
State of Florida | 1,103 | 1,106,629 | ||||||||||
|
| |||||||||||
Total Local Governments – US Municipal Bonds | 2,722,387 | |||||||||||
|
| |||||||||||
QUASI-SOVEREIGNS – 0.6% | ||||||||||||
Quasi-Sovereign Bonds – 0.6% | ||||||||||||
Chile – 0.2% | ||||||||||||
Corp. Nacional del Cobre de Chile | 565 | 545,931 | ||||||||||
3.75%, 01/15/2031(a) | 201 | 204,274 | ||||||||||
|
| |||||||||||
| 750,205 | ||||||||||||
|
| |||||||||||
Indonesia – 0.2% | ||||||||||||
Pertamina Persero PT | 570 | 630,919 | ||||||||||
|
| |||||||||||
Malaysia – 0.1% | ||||||||||||
Petronas Capital Ltd. | 332 | 364,536 | ||||||||||
|
| |||||||||||
Mexico – 0.1% | ||||||||||||
Petroleos Mexicanos | 392 | 270,578 | ||||||||||
6.84%, 01/23/2030(a) | 143 | 112,032 | ||||||||||
|
| |||||||||||
| 382,610 | ||||||||||||
|
| |||||||||||
Total Quasi-Sovereigns | 2,128,270 | |||||||||||
|
| |||||||||||
EMERGING MARKETS – CORPORATE BONDS – 0.4% | ||||||||||||
Industrial – 0.4% | ||||||||||||
Capital Goods – 0.0% | ||||||||||||
Odebrecht Finance Ltd. | 341 | 13,674 | ||||||||||
7.125%, 06/26/2042(a)(i)(j) | 394 | 19,749 | ||||||||||
|
| |||||||||||
| 33,423 | ||||||||||||
|
| |||||||||||
Communications - Media – 0.1% | ||||||||||||
Globo Comunicacao e Participacoes SA | 417 | 371,130 | ||||||||||
|
| |||||||||||
| abfunds.com | AB TOTAL RETURN BOND PORTFOLIO | 45 | |
PORTFOLIO OF INVESTMENTS (continued)
| Principal Amount (000) | U.S. $ Value | |||||||||||
| ||||||||||||
Consumer Non-Cyclical – 0.2% | ||||||||||||
BRF GmbH | U.S.$ | 350 | $ | 302,634 | ||||||||
BRF SA | 203 | 190,947 | ||||||||||
Virgolino de Oliveira Finance SA | 660 | 5,676 | ||||||||||
|
| |||||||||||
| 499,257 | ||||||||||||
|
| |||||||||||
Transportation - Services – 0.1% | ||||||||||||
Rumo Luxembourg SARL | 315 | 310,669 | ||||||||||
|
| |||||||||||
| 1,214,479 | ||||||||||||
|
| |||||||||||
Utility – 0.0% | ||||||||||||
Electric – 0.0% | ||||||||||||
Terraform Global Operating LLC | 139 | 138,077 | ||||||||||
|
| |||||||||||
Total Emerging Markets – Corporate Bonds | 1,352,556 | |||||||||||
|
| |||||||||||
EMERGING MARKETS – TREASURIES – 0.2% | ||||||||||||
South Africa – 0.2% | ||||||||||||
Republic of South Africa Government Bond | ZAR | 14,386 | 667,240 | |||||||||
|
| |||||||||||
| Shares | ||||||||||||
COMMON STOCKS – 0.2% | ||||||||||||
Financials – 0.2% | ||||||||||||
Insurance – 0.2% | ||||||||||||
Mt Logan Re Ltd. (Preference Shares)(h)(l)(m) | 626 | 613,561 | ||||||||||
|
| |||||||||||
| Principal Amount (000) | ||||||||||||
EMERGING MARKETS – SOVEREIGNS – 0.1% | ||||||||||||
Egypt – 0.1% | ||||||||||||
Egypt Government International Bond | U.S.$ | 235 | 234,192 | |||||||||
|
| |||||||||||
| 46 | AB TOTAL RETURN BOND PORTFOLIO | abfunds.com | |
PORTFOLIO OF INVESTMENTS (continued)
| Principal Amount (000) | U.S. $ Value | |||||||||||
| ||||||||||||
SHORT-TERM INVESTMENTS – 1.0% | ||||||||||||
Governments – Treasuries – 0.6% | ||||||||||||
Japan – 0.6% | ||||||||||||
Japan Treasury Discount Bill | JPY | 241,600 | $ | 2,251,451 | ||||||||
|
| |||||||||||
Short-Term Municipal Notes – 0.3% | ||||||||||||
Texas – 0.3% | ||||||||||||
State of Texas | U.S.$ | 1,125 | 1,137,397 | |||||||||
|
| |||||||||||
| Shares | ||||||||||||
Investment Companies – 0.1% | ||||||||||||
AB Fixed Income Shares, Inc. – Government Money Market Portfolio – Class AB, | 289,237 | 289,237 | ||||||||||
|
| |||||||||||
Total Short-Term Investments | 3,678,085 | |||||||||||
|
| |||||||||||
Total Investments – 100.9% | 360,694,746 | |||||||||||
Other assets less liabilities – (0.9)% | (3,104,688 | ) | ||||||||||
|
| |||||||||||
Net Assets – 100.0% | $ | 357,590,058 | ||||||||||
|
| |||||||||||
FUTURES (see Note D)
| Description | Number of Contracts | Expiration Month | Current Notional | Value and Unrealized Appreciation/ (Depreciation) | ||||||||||
Purchased Contracts |
| |||||||||||||
Euro-Bund Futures | 23 | June 2020 | $ | 4,396,428 | $ | (14,917 | ) | |||||||
Long Gilt Futures | 1 | June 2020 | 173,433 | 3,475 | ||||||||||
U.S. 10 Yr Ultra Futures | 125 | June 2020 | 19,628,906 | 475,929 | ||||||||||
U.S. T-Note 2 Yr (CBT) Futures | 648 | June 2020 | 142,838,438 | 122,774 | ||||||||||
U.S. T-Note 5 Yr (CBT) Futures | 205 | June 2020 | 25,724,297 | (5,286 | ) | |||||||||
U.S. T-Note 10 Yr (CBT) Futures | 9 | June 2020 | 1,251,563 | 59,191 | ||||||||||
U.S. Ultra Bond (CBT) Futures | 29 | June 2020 | 6,518,656 | (47,730 | ) | |||||||||
Sold Contracts |
| |||||||||||||
10 Yr Japan Bond (OSE) Futures | 3 | June 2020 | 4,271,258 | 51,838 | ||||||||||
|
| |||||||||||||
| $ | 645,274 | |||||||||||||
|
| |||||||||||||
| abfunds.com | AB TOTAL RETURN BOND PORTFOLIO | 47 | |
PORTFOLIO OF INVESTMENTS (continued)
FORWARD CURRENCY EXCHANGE CONTRACTS (see Note D)
Counterparty | Contracts to Deliver (000) | In Exchange For (000) | Settlement Date | Unrealized Appreciation/ (Depreciation) | ||||||||||||||||
BNP Paribas SA | CAD | 935 | USD | 663 | 05/22/2020 | $ | (9,217 | ) | ||||||||||||
BNP Paribas SA | EUR | 597 | USD | 652 | 06/10/2020 | (3,236 | ) | |||||||||||||
Goldman Sachs Bank USA | MYR | 3,844 | USD | 936 | 08/13/2020 | 47,767 | ||||||||||||||
Morgan Stanley & Co., Inc. | JPY | 641,452 | USD | 5,897 | 06/05/2020 | (82,143 | ) | |||||||||||||
State Street Bank & Trust Co. | GBP | 2 | USD | 2 | 05/15/2020 | 71 | ||||||||||||||
|
| |||||||||||||||||||
| $ | (46,758 | ) | ||||||||||||||||||
|
| |||||||||||||||||||
CENTRALLY CLEARED CREDIT DEFAULT SWAPS (see Note D)
| Fixed Rate (Pay)/ Receive | Payment Frequency | Implied Credit Spread at April 30, 2020 | Notional | Market Value | Upfront Premiums Paid/ (Received) | Unrealized Appreciation/ (Depreciation) | |||||||||||||||||||||||||
Buy Contracts |
| |||||||||||||||||||||||||||||||
CDX-NAHY Series 33, 5 Year Index, 12/20/2024* | (5.00 | )% | Quarterly | 6.61 | % | USD | 175 | $ | 9,644 | $ | 10,525 | $ | (881 | ) | ||||||||||||||||||
CDX-NAHY Series 33, 5 Year Index, 12/20/2024* | 5.00 | Quarterly | 6.61 | USD | 147 | 7,738 | 8,596 | (858 | ) | |||||||||||||||||||||||
CDX-NAHY Series 34, 5 Year Index, 06/20/2025* | (5.00 | ) | Quarterly | 6.31 | USD | 3,165 | 152,888 | 109,431 | 43,457 | |||||||||||||||||||||||
Sale Contracts |
| |||||||||||||||||||||||||||||||
CDX-NAHY Series 33, 5 Year Index, 12/20/2024* | 5.00 | Quarterly | 6.61 | USD | 5,400 | (296,993 | ) | (284,912 | ) | (12,081 | ) | |||||||||||||||||||||
CDX-NAHY Series 34, 5 Year Index, 06/20/2025* | 5.00 | Quarterly | 6.31 | USD | 135 | (6,300 | ) | (7,088 | ) | 788 | ||||||||||||||||||||||
CDX-NAHY Series 34, 5 Year Index, 06/20/2025* | 5.00 | Quarterly | 6.31 | USD | 162 | (7,825 | ) | (8,752 | ) | 927 | ||||||||||||||||||||||
|
|
|
|
|
| |||||||||||||||||||||||||||
| $ | (140,848 | ) | $ | (172,200 | ) | $ | 31,352 | |||||||||||||||||||||||||
|
|
|
|
|
| |||||||||||||||||||||||||||
| * | Termination date |
| 48 | AB TOTAL RETURN BOND PORTFOLIO | abfunds.com | |
PORTFOLIO OF INVESTMENTS (continued)
CENTRALLY CLEARED INTEREST RATE SWAPS (see Note D)
| Rate Type | ||||||||||||||||||||||||||
Notional (000) | Termination Date | Payments made by the Fund | Payments received by the Fund | Payment Frequency Paid/ Received | Market Value | Upfront Premiums Paid/ (Received) | Unrealized Appreciation/ (Depreciation) | |||||||||||||||||||
| JPY | 1,155,060 | 12/13/2029 | 6 Month LIBOR | 0.080% | Semi-Annual/ Semi-Annual | $ | 120,104 | $ | — | $ | 120,104 | |||||||||||||||
| SEK | 121,200 | 08/30/2024 | 3 Month STIBOR | (0.165)% | Quarterly/Annual | (178,289 | ) | — | (178,289 | ) | ||||||||||||||||
| CAD | 27,650 | 08/27/2021 | 3 Month CDOR | 1.623% | Semi-Annual/ Semi-Annual | 243,724 | 124 | 243,600 | ||||||||||||||||||
| CAD | 3,457 | 01/14/2025 | 3 Month CDOR | 1.950% | Semi-Annual/ Semi-Annual | 139,411 | 7 | 139,404 | ||||||||||||||||||
| USD | 2,000 | 12/13/2029 | 1.764% | 3 Month LIBOR | Semi-Annual/Quarterly | (227,907 | ) | — | (227,907 | ) | ||||||||||||||||
| CAD | 736 | 01/14/2050 | 2.210% | 3 Month CDOR | Semi-Annual/ Semi-Annual | (106,452 | ) | 2 | (106,454 | ) | ||||||||||||||||
|
|
|
|
|
| |||||||||||||||||||||
| $ | (9,409 | ) | $ | 133 | $ | (9,542 | ) | |||||||||||||||||||
|
|
|
|
|
| |||||||||||||||||||||
CREDIT DEFAULT SWAPS (see Note D)
| Swap Counterparty & Referenced Obligation | Fixed Rate (Pay)/ Receive | Payment Frequency | Implied Credit Spread at April 30, 2020 | Notional Amount (000) | Market Value | Upfront Premiums Paid/ (Received) | Unrealized Appreciation/ (Depreciation) | |||||||||||||||||||||||||
Sale Contracts |
| |||||||||||||||||||||||||||||||
Citibank, NA |
| |||||||||||||||||||||||||||||||
CDX-CMBX.NA.BBB- Series 6, 05/11/2063* | 3.00 | % | Monthly | 13.94 | % | USD | 153 | $ | (49,738 | ) | $ | (19,254 | ) | $ | (30,484 | ) | ||||||||||||||||
CDX-CMBX.NA.BBB- Series 6, 05/11/2063* | 3.00 | Monthly | 13.94 | USD | 36 | (11,703 | ) | (4,598 | ) | (7,105 | ) | |||||||||||||||||||||
Citigroup Global Markets, Inc. | ||||||||||||||||||||||||||||||||
CDX-CMBX.NA.BB Series 6, 05/11/2063* | 5.00 | Monthly | 25.00 | USD | 1,284 | (661,346 | ) | (205,339 | ) | (456,007 | ) | |||||||||||||||||||||
CDX-CMBX.NA.BB Series 6, 05/11/2063* | 5.00 | Monthly | 25.00 | USD | 144 | (74,169 | ) | (23,178 | ) | (50,991 | ) | |||||||||||||||||||||
CDX-CMBX.NA.BB Series 6, 05/11/2063* | 5.00 | Monthly | 25.00 | USD | 16 | (8,241 | ) | (2,549 | ) | (5,692 | ) | |||||||||||||||||||||
CDX-CMBX.NA.BB Series 6, 05/11/2063* | 5.00 | Monthly | 25.00 | USD | 26 | (13,396 | ) | (4,127 | ) | (9,269 | ) | |||||||||||||||||||||
CDX-CMBX.NA.BB Series 6, 05/11/2063* | 5.00 | Monthly | 25.00 | USD | 304 | (156,580 | ) | (47,138 | ) | (109,442 | ) | |||||||||||||||||||||
CDX-CMBX.NA.BB Series 6, 05/11/2063* | 5.00 | Monthly | 25.00 | USD | 152 | (78,291 | ) | (23,295 | ) | (54,996 | ) | |||||||||||||||||||||
CDX-CMBX.NA.BB Series 6, 05/11/2063* | 5.00 | Monthly | 25.00 | USD | 5,000 | (2,576,722 | ) | (558,519 | ) | (2,018,203 | ) | |||||||||||||||||||||
| abfunds.com | AB TOTAL RETURN BOND PORTFOLIO | 49 | |
PORTFOLIO OF INVESTMENTS (continued)
| Swap Counterparty & Referenced Obligation | Fixed Rate (Pay)/ Receive | Payment Frequency | Implied Credit Spread at April 30, 2020 | Notional Amount (000) | Market Value | Upfront Premiums Paid/ (Received) | Unrealized Appreciation/ (Depreciation) | |||||||||||||||||||||||||
CDX-CMBX.NA.BBB- Series 6, 05/11/2063* | 3.00 | % | Monthly | 13.94 | % | USD | 41 | $ | (13,325 | ) | $ | (6,550 | ) | $ | (6,775 | ) | ||||||||||||||||
CDX-CMBX.NA.BBB- Series 6, 05/11/2063* | 3.00 | Monthly | 13.94 | USD | 269 | (87,425 | ) | (39,762 | ) | (47,663 | ) | |||||||||||||||||||||
CDX-CMBX.NA.BBB- Series 6, 05/11/2063* | 3.00 | Monthly | 13.94 | USD | 252 | (81,921 | ) | (28,614 | ) | (53,307 | ) | |||||||||||||||||||||
CDX-CMBX.NA.BBB- Series 6, 05/11/2063* | 3.00 | Monthly | 13.94 | USD | 362 | (117,681 | ) | (41,105 | ) | (76,576 | ) | |||||||||||||||||||||
CDX-CMBX.NA.BBB- Series 6, 05/11/2063* | 3.00 | Monthly | 13.94 | USD | 504 | (163,842 | ) | (55,964 | ) | (107,878 | ) | |||||||||||||||||||||
CDX-CMBX.NA.BBB- Series 6, 05/11/2063* | 3.00 | Monthly | 13.94 | USD | 723 | (235,035 | ) | (80,282 | ) | (154,753 | ) | |||||||||||||||||||||
CDX-CMBX.NA.BBB- Series 6, 05/11/2063* | 3.00 | Monthly | 13.94 | USD | 504 | (163,842 | ) | (54,866 | ) | (108,976 | ) | |||||||||||||||||||||
CDX-CMBX.NA.BBB- Series 6, 05/11/2063* | 3.00 | Monthly | 13.94 | USD | 857 | (278,597 | ) | (91,112 | ) | (187,485 | ) | |||||||||||||||||||||
CDX-CMBX.NA.BBB- Series 6, 05/11/2063* | 3.00 | Monthly | 13.94 | USD | 540 | (175,545 | ) | (57,703 | ) | (117,842 | ) | |||||||||||||||||||||
CDX-CMBX.NA.BBB- Series 6, 05/11/2063* | 3.00 | Monthly | 13.94 | USD | 200 | (65,016 | ) | (21,344 | ) | (43,672 | ) | |||||||||||||||||||||
CDX-CMBX.NA.BBB- Series 6, 05/11/2063* | 3.00 | Monthly | 13.94 | USD | 180 | (58,515 | ) | (22,652 | ) | (35,863 | ) | |||||||||||||||||||||
CDX-CMBX.NA.BBB- Series 6, 05/11/2063* | 3.00 | Monthly | 13.94 | USD | 252 | (81,921 | ) | (31,712 | ) | (50,209 | ) | |||||||||||||||||||||
CDX-CMBX.NA.BBB- Series 6, 05/11/2063* | 3.00 | Monthly | 13.94 | USD | 178 | (57,864 | ) | (23,137 | ) | (34,727 | ) | |||||||||||||||||||||
CDX-CMBX.NA.BBB- Series 6, 05/11/2063* | 3.00 | Monthly | 13.94 | USD | 351 | (114,133 | ) | (41,981 | ) | (72,152 | ) | |||||||||||||||||||||
CDX-CMBX.NA.BBB- Series 6, 05/11/2063* | 3.00 | Monthly | 13.94 | USD | 105 | (34,142 | ) | (12,558 | ) | (21,584 | ) | |||||||||||||||||||||
CDX-CMBX.NA.BBB- Series 6, 05/11/2063* | 3.00 | Monthly | 13.94 | USD | 107 | (34,775 | ) | (10,794 | ) | (23,981 | ) | |||||||||||||||||||||
CDX-CMBX.NA.BBB- Series 6, 05/11/2063* | 3.00 | Monthly | 13.94 | USD | 201 | (65,325 | ) | (26,440 | ) | (38,885 | ) | |||||||||||||||||||||
CDX-CMBX.NA.BBB- Series 6, 05/11/2063* | 3.00 | Monthly | 13.94 | USD | 85 | (27,625 | ) | (11,447 | ) | (16,178 | ) | |||||||||||||||||||||
CDX-CMBX.NA.BBB- Series 6, 05/11/2063* | 3.00 | Monthly | 13.94 | USD | 297 | (96,525 | ) | (45,222 | ) | (51,303 | ) | |||||||||||||||||||||
| 50 | AB TOTAL RETURN BOND PORTFOLIO | abfunds.com | |
PORTFOLIO OF INVESTMENTS (continued)
| Swap Counterparty & Referenced Obligation | Fixed Rate (Pay)/ Receive | Payment Frequency | Implied Credit Spread at April 30, 2020 | Notional Amount (000) | Market Value | Upfront Premiums Paid/ (Received) | Unrealized Appreciation/ (Depreciation) | |||||||||||||||||||||||||
Credit Suisse International |
| |||||||||||||||||||||||||||||||
CDX-CMBX.NA.BBB- Series 6, 05/11/2063* | 3.00 | % | Monthly | 13.94 | % | USD | 509 | $ | (165,425 | ) | $ | (32,659 | ) | $ | (132,766 | ) | ||||||||||||||||
CDX-CMBX.NA.BBB- Series 6, 05/11/2063* | 3.00 | Monthly | 13.94 | USD | 155 | (50,375 | ) | (10,629 | ) | (39,746 | ) | |||||||||||||||||||||
CDX-CMBX.NA.BBB- Series 6, 05/11/2063* | 3.00 | Monthly | 13.94 | USD | 291 | (94,575 | ) | (42,819 | ) | (51,756 | ) | |||||||||||||||||||||
CDX-CMBX.NA.BBB- Series 6, 05/11/2063* | 3.00 | Monthly | 13.94 | USD | 1,882 | (611,590 | ) | (76,312 | ) | (535,278 | ) | |||||||||||||||||||||
Deutsche Bank AG | ||||||||||||||||||||||||||||||||
CDX-CMBX.NA.A Series 6, 05/11/63* | 2.00 | Monthly | 6.85 | USD | 850 | (119,992 | ) | (16,492 | ) | (103,500 | ) | |||||||||||||||||||||
CDX-CMBX.NA.BBB- Series 6, 05/11/2063* | 3.00 | Monthly | 13.94 | USD | 745 | (242,125 | ) | (51,788 | ) | (190,337 | ) | |||||||||||||||||||||
CDX-CMBX.NA.BBB- Series 6, 05/11/2063* | 3.00 | Monthly | 13.94 | USD | 46 | (14,950 | ) | (2,619 | ) | (12,331 | ) | |||||||||||||||||||||
CDX-CMBX.NA.BBB- Series 6, 05/11/2063* | 3.00 | Monthly | 13.94 | USD | 131 | (42,575 | ) | (10,687 | ) | (31,888 | ) | |||||||||||||||||||||
CDX-CMBX.NA.BBB- Series 6, 05/11/2063* | 3.00 | Monthly | 13.94 | USD | 52 | (16,900 | ) | (6,046 | ) | (10,854 | ) | |||||||||||||||||||||
CDX-CMBX.NA.BBB- Series 6, 05/11/2063* | 3.00 | Monthly | 13.94 | USD | 322 | (104,650 | ) | (40,244 | ) | (64,406 | ) | |||||||||||||||||||||
CDX-CMBX.NA.BBB- Series 6, 05/11/2063* | 3.00 | Monthly | 13.94 | USD | 4 | (1,300 | ) | (454 | ) | (846 | ) | |||||||||||||||||||||
CDX-CMBX.NA.BBB- Series 6, 05/11/2063* | 3.00 | Monthly | 13.94 | USD | 181 | (58,825 | ) | (20,527 | ) | (38,298 | ) | |||||||||||||||||||||
CDX-CMBX.NA.BBB- Series 6, 05/11/2063* | 3.00 | Monthly | 13.94 | USD | 530 | (172,250 | ) | (56,632 | ) | (115,618 | ) | |||||||||||||||||||||
Goldman Sachs International | ||||||||||||||||||||||||||||||||
CDX-CMBX.NA.BBB- Series 6, 05/11/2063* | 3.00 | Monthly | 13.94 | USD | 311 | (101,075 | ) | (26,655 | ) | (74,420 | ) | |||||||||||||||||||||
CDX-CMBX.NA.BBB- Series 6, 05/11/2063* | 3.00 | Monthly | 13.94 | USD | 26 | (8,450 | ) | (2,311 | ) | (6,139 | ) | |||||||||||||||||||||
CDX-CMBX.NA.BBB- Series 6, 05/11/2063* | 3.00 | Monthly | 13.94 | USD | 52 | (16,900 | ) | (4,708 | ) | (12,192 | ) | |||||||||||||||||||||
CDX-CMBX.NA.BBB- Series 6, 05/11/2063* | 3.00 | Monthly | 13.94 | USD | 52 | (16,900 | ) | (5,094 | ) | (11,806 | ) | |||||||||||||||||||||
| abfunds.com | AB TOTAL RETURN BOND PORTFOLIO | 51 | |
PORTFOLIO OF INVESTMENTS (continued)
| Swap Counterparty & Referenced Obligation | Fixed Rate (Pay)/ Receive | Payment Frequency | Implied Credit Spread at April 30, 2020 | Notional Amount (000) | Market Value | Upfront Premiums Paid/ (Received) | Unrealized Appreciation/ (Depreciation) | |||||||||||||||||||||||||
CDX-CMBX.NA.BBB- Series 6, 05/11/2063* | 3.00 | % | Monthly | 13.94 | % | USD | 224 | $ | (72,800 | ) | $ | (36,313 | ) | $ | (36,487 | ) | ||||||||||||||||
CDX-CMBX.NA.BBB- Series 6, 05/11/2063* | 3.00 | Monthly | 13.94 | USD | 313 | (101,725 | ) | (51,471 | ) | (50,254 | ) | |||||||||||||||||||||
CDX-CMBX.NA.BBB- Series 6, 05/11/2063* | 3.00 | Monthly | 13.94 | USD | 20 | (6,500 | ) | (3,013 | ) | (3,487 | ) | |||||||||||||||||||||
CDX-CMBX.NA.BBB- Series 6, 05/11/2063* | 3.00 | Monthly | 13.94 | USD | 104 | (33,800 | ) | (11,136 | ) | (22,664 | ) | |||||||||||||||||||||
CDX-CMBX.NA.BBB- Series 6, 05/11/2063* | 3.00 | Monthly | 13.94 | USD | 260 | (84,500 | ) | (35,096 | ) | (49,404 | ) | |||||||||||||||||||||
CDX-CMBX.NA.BBB- Series 6, 05/11/2063* | 3.00 | Monthly | 13.94 | USD | 356 | (115,700 | ) | (37,619 | ) | (78,081 | ) | |||||||||||||||||||||
CDX-CMBX.NA.BBB- Series 6, 05/11/2063* | 3.00 | Monthly | 13.94 | USD | 325 | (105,625 | ) | (49,551 | ) | (56,074 | ) | |||||||||||||||||||||
CDX-CMBX.NA.BBB- Series 6, 05/11/2063* | 3.00 | Monthly | 13.94 | USD | 760 | (247,000 | ) | (60,010 | ) | (186,990 | ) | |||||||||||||||||||||
CDX-CMBX.NA.BBB- Series 6, 05/11/2063* | 3.00 | Monthly | 13.94 | USD | 219 | (71,175 | ) | (14,400 | ) | (56,775 | ) | |||||||||||||||||||||
CDX-CMBX.NA.BBB- Series 6, 05/11/2063* | 3.00 | Monthly | 13.94 | USD | 90 | (29,258 | ) | (11,448 | ) | (17,810 | ) | |||||||||||||||||||||
CDX-CMBX.NA.BBB- Series 6, 05/11/2063* | 3.00 | Monthly | 13.94 | USD | 574 | (186,550 | ) | (75,480 | ) | (111,070 | ) | |||||||||||||||||||||
JPMorgan Securities LLC | ||||||||||||||||||||||||||||||||
CDX-CMBX.NA.BBB- Series 6, 05/11/2063* | 3.00 | Monthly | 13.94 | USD | 374 | (121,550 | ) | (45,492 | ) | (76,058 | ) | |||||||||||||||||||||
CDX-CMBX.NA.BBB- Series 6, 05/11/2063* | 3.00 | Monthly | 13.94 | USD | 130 | (42,250 | ) | (15,952 | ) | (26,298 | ) | |||||||||||||||||||||
CDX-CMBX.NA.BBB- Series 6, 05/11/2063* | 3.00 | Monthly | 13.94 | USD | 131 | (42,575 | ) | (12,642 | ) | (29,933 | ) | |||||||||||||||||||||
CDX-CMBX.NA.BBB- Series 6, 05/11/2063* | 3.00 | Monthly | 13.94 | USD | 30 | (9,750 | ) | (2,903 | ) | (6,847 | ) | |||||||||||||||||||||
CDX-CMBX.NA.BBB- Series 6, 05/11/2063* | 3.00 | Monthly | 13.94 | USD | 32 | (10,400 | ) | (3,097 | ) | (7,303 | ) | |||||||||||||||||||||
CDX-CMBX.NA.BBB- Series 6, 05/11/2063* | 3.00 | Monthly | 13.94 | USD | 61 | (19,825 | ) | (7,721 | ) | (12,104 | ) | |||||||||||||||||||||
Morgan Stanley & Co. International PLC | ||||||||||||||||||||||||||||||||
CDX-CMBX.NA.BBB- Series 6, 05/11/2063* | 3.00 | Monthly | 13.94 | USD | 800 | (260,000 | ) | (117,265 | ) | (142,735 | ) | |||||||||||||||||||||
|
|
|
|
|
| |||||||||||||||||||||||||||
| $ | (8,983,080 | ) | $ | (2,588,527 | ) | $ | (6,394,553 | ) | ||||||||||||||||||||||||
|
|
|
|
|
| |||||||||||||||||||||||||||
| 52 | AB TOTAL RETURN BOND PORTFOLIO | abfunds.com | |
PORTFOLIO OF INVESTMENTS (continued)
| * | Termination date |
| (a) | Security is exempt from registration under Rule 144A of the Securities Act of 1933. These securities are considered restricted, but liquid and may be resold in transactions exempt from registration, normally to qualified institutional buyers. At April 30, 2020, the aggregate market value of these securities amounted to $91,861,806 or 25.7% of net assets. |
| (b) | Securities are perpetual and, thus, do not have a predetermined maturity date. The date shown, if applicable, reflects the next call date. |
| (c) | Floating Rate Security. Stated interest/floor/ceiling rate was in effect at April 30, 2020. |
| (d) | Security is exempt from registration under Rule 144A of the Securities Act of 1933. These securities, which represent 2.01% of net assets as of April 30, 2020, are considered illiquid and restricted. Additional information regarding such securities follows: |
| 144A/Restricted & Illiquid Securities | Acquisition Date | Cost | Market Value | Percentage of Net Assets | ||||||||||||
BAMLL Commercial Mortgage Securities Trust | 12/04/2017 | $ | 1,330,000 | $ | 1,283,529 | 0.36 | % | |||||||||
BHMS | 07/13/2018 | 547,087 | 507,936 | 0.14 | % | |||||||||||
Federal Home Loan Mortgage Corp. | 02/11/2000 | 1,034,146 | 347,762 | 0.10 | % | |||||||||||
Federal Home Loan Mortgage Corp. | 10/07/2000 | 733,624 | 186,044 | 0.05 | % | |||||||||||
JP Morgan Chase Commercial Mortgage Securities Trust | 11/06/2015 | 1,000,000 | 903,486 | 0.25 | % | |||||||||||
JP Morgan Madison Avenue Securities Trust | 11/06/2015 | 62,181 | 64,778 | 0.02 | % | |||||||||||
Morgan Stanley Capital I Trust Series 2015-XLF2, Class SNMA | 11/16/2015 | 172,212 | 156,776 | 0.04 | % | |||||||||||
PMT Credit Risk Transfer Trust | 03/21/2019 | 524,564 | 410,748 | 0.11 | % | |||||||||||
PMT Credit Risk Transfer Trust | 06/07/2019 | 638,456 | 473,638 | 0.13 | % | |||||||||||
PMT Credit Risk Transfer Trust | 10/11/2019 | 556,058 | 423,273 | 0.12 | % | |||||||||||
PMT Credit Risk Transfer Trust | 02/11/2000 | 893,405 | 669,295 | 0.19 | % | |||||||||||
| abfunds.com | AB TOTAL RETURN BOND PORTFOLIO | 53 | |
PORTFOLIO OF INVESTMENTS (continued)
| 144A/Restricted & Illiquid Securities | Acquisition Date | Cost | Market Value | Percentage of Net Assets | ||||||||||||
Radnor Re Ltd. | 01/10/2000 | $ | 518,137 | $ | 334,052 | 0.09 | % | |||||||||
SBA Tower Trust | 10/06/2015 | 688,000 | 688,729 | 0.19 | % | |||||||||||
STACR Trust | 02/10/2000 | 960,659 | 291,767 | 0.08 | % | |||||||||||
Terraform Global Operating LLC 6.125%, 03/01/2026 | 02/08/2018 | 139,000 | 138,077 | 0.04 | % | |||||||||||
Virgolino de Oliveira Finance SA | 01/24/2014 | 365,927 | 5,676 | 0.00 | % | |||||||||||
Wells Fargo Credit Risk Transfer Securities Trust | 09/28/2015 | 356,946 | 268,574 | 0.08 | % | |||||||||||
Wells Fargo Credit Risk Transfer Securities Trust | 09/28/2015 | 101,770 | 77,869 | 0.02 | % | |||||||||||
| (e) | Inverse interest only security. |
| (f) | IO – Interest Only. |
| (g) | Position, or a portion thereof, has been segregated to collateralize OTC derivatives outstanding. |
| (h) | Security in which significant unobservable inputs (Level 3) were used in determining fair value. |
| (i) | Non-income producing security. |
| (j) | Defaulted. |
| (k) | Defaulted matured security. |
| (l) | Fair valued by the Adviser. |
| (m) | Restricted and illiquid security. |
| Restricted & Illiquid Securities | Acquisition Date | Cost | Market Value | Percentage of Net Assets | ||||||||||||
Mt Logan Re Ltd. (Preference Shares) | 01/02/2014 | $ | 626,000 | $ | 613,561 | 0.17 | % | |||||||||
| (n) | Affiliated investments. |
| (o) | To obtain a copy of the fund’s shareholder report, please go to the Securities and Exchange Commission’s website at www.sec.gov, or call AB at (800) 227-4618. |
| (p) | The rate shown represents the 7-day yield as of period end. |
Currency Abbreviations:
CAD – Canadian Dollar
EUR – Euro
GBP – Great British Pound
JPY – Japanese Yen
MYR – Malaysian Ringgit
SEK – Swedish Krona
USD – United States Dollar
ZAR – South African Rand
| 54 | AB TOTAL RETURN BOND PORTFOLIO | abfunds.com | |
PORTFOLIO OF INVESTMENTS (continued)
Glossary:
ABS – Asset-Backed Securities
ARMs – Adjustable Rate Mortgages
CBT – Chicago Board of Trade
CDOR – Canadian Dealer Offered Rate
CDX-CMBX.NA – North American Commercial Mortgage-Backed Index
CDX-NAHY – North American High Yield Credit Default Swap Index
CLO – Collateralized Loan Obligations
CMBS – Commercial Mortgage-Backed Securities
CPI – Consumer Price Index
FHLMC – Federal Home Loan Mortgage Corporation
FNMA – Federal National Mortgage Association
LIBOR – London Interbank Offered Rates
OSE – Osaka Securities Exchange
REMICs – Real Estate Mortgage Investment Conduits
STIBOR – Stockholm Interbank Offered Rate
TBA – To Be Announced
TIPS – Treasury Inflation Protected Security
See notes to financial statements.
| abfunds.com | AB TOTAL RETURN BOND PORTFOLIO | 55 | |
STATEMENT OF ASSETS & LIABILITIES
April 30, 2020 (unaudited)
| Assets | ||||
Investments in securities, at value | ||||
Unaffiliated issuers (cost $365,714,457) | $ | 360,405,509 | ||
Affiliated issuers (cost $289,237) | 289,237 | |||
Cash | 6,042 | |||
Cash collateral due from broker | 7,645,383 | |||
Foreign currencies, at value (cost $34,608) | 33,385 | |||
Interest receivable | 1,783,944 | |||
Receivable for investment securities sold | 1,195,877 | |||
Receivable for capital stock sold | 398,345 | |||
Receivable for variation margin on futures | 75,261 | |||
Unrealized appreciation on forward currency exchange contracts | 47,838 | |||
Receivable for newly entered credit default swaps | 14,107 | |||
Affiliated dividends receivable | 723 | |||
|
| |||
Total assets | 371,895,651 | |||
|
| |||
| Liabilities | ||||
Market value on credit default swaps (net premiums received $2,588,527) | 8,983,080 | |||
Payable for investment securities purchased | 4,304,846 | |||
Payable for capital stock redeemed | 338,463 | |||
Dividends payable | 208,792 | |||
Unrealized depreciation on forward currency exchange contracts | 94,596 | |||
Advisory fee payable | 60,499 | |||
Distribution fee payable | 53,301 | |||
Payable for variation margin on centrally cleared swaps | 29,121 | |||
Administrative fee payable | 27,643 | |||
Transfer Agent fee payable | 26,398 | |||
Payable for newly entered credit default swaps | 17,240 | |||
Directors’ fees payable | 3,026 | |||
Accrued expenses and other liabilities | 158,588 | |||
|
| |||
Total liabilities | 14,305,593 | |||
|
| |||
Net Assets | $ | 357,590,058 | ||
|
| |||
| Composition of Net Assets | ||||
Capital stock, at par | $ | 32,829 | ||
Additional paid-in capital | 366,705,452 | |||
Accumulated loss | (9,148,223 | ) | ||
|
| |||
| $ | 357,590,058 | |||
|
|
See notes to financial statements.
| 56 | AB TOTAL RETURN BOND PORTFOLIO | abfunds.com | |
STATEMENT OF ASSETS & LIABILITIES (continued)
Net Asset Value Per Share—27 billion shares of capital stock authorized, $.001 par value
| Class | Net Assets | Shares Outstanding | Net Asset Value | |||||||||
| ||||||||||||
| A | $ | 209,065,046 | 19,196,446 | $ | 10.89 | * | ||||||
| ||||||||||||
| C | $ | 11,098,304 | 1,021,271 | $ | 10.87 | |||||||
| ||||||||||||
| Advisor | $ | 118,568,839 | 10,882,157 | $ | 10.90 | |||||||
| ||||||||||||
| R | $ | 2,116,854 | 194,406 | $ | 10.89 | |||||||
| ||||||||||||
| K | $ | 5,801,500 | 532,131 | $ | 10.90 | |||||||
| ||||||||||||
| I | $ | 2,212,545 | 202,820 | $ | 10.91 | |||||||
| ||||||||||||
| Z | $ | 8,726,970 | 799,689 | $ | 10.91 | |||||||
| ||||||||||||
| * | The maximum offering price per share for Class A shares was $11.37 which reflects a sales charge of 4.25%. |
See notes to financial statements.
| abfunds.com | AB TOTAL RETURN BOND PORTFOLIO | 57 | |
STATEMENT OF OPERATIONS
Six Months Ended April 30, 2020 (unaudited)
| Investment Income | ||||||||
Interest | $ | 6,108,702 | ||||||
Dividends—Affiliated issuers | 21,355 | |||||||
Other income | 810 | $ | 6,130,867 | |||||
|
| |||||||
| Expenses | ||||||||
Advisory fee (see Note B) | 819,511 | |||||||
Distribution fee—Class A | 269,415 | |||||||
Distribution fee—Class B | 78 | |||||||
Distribution fee—Class C | 52,531 | |||||||
Distribution fee—Class R | 7,870 | |||||||
Distribution fee—Class K | 9,053 | |||||||
Transfer agency—Class A | 133,921 | |||||||
Transfer agency—Class B | 16 | |||||||
Transfer agency—Class C | 6,681 | |||||||
Transfer agency—Advisor Class | 71,466 | |||||||
Transfer agency—Class R | 3,724 | |||||||
Transfer agency—Class K | 7,243 | |||||||
Transfer agency—Class I | 1,397 | |||||||
Transfer agency—Class Z | 852 | |||||||
Custodian | 85,406 | |||||||
Registration fees | 59,335 | |||||||
Audit and tax | 51,592 | |||||||
Administrative | 44,398 | |||||||
Printing | 35,818 | |||||||
Legal | 19,390 | |||||||
Directors’ fees | 11,609 | |||||||
Miscellaneous | 9,654 | |||||||
|
| |||||||
Total expenses | 1,700,960 | |||||||
Less: expenses waived and reimbursed by the Adviser (see Note B) | (415,922 | ) | ||||||
|
| |||||||
Net expenses | 1,285,038 | |||||||
|
| |||||||
Net investment income | 4,845,829 | |||||||
|
| |||||||
| Realized and Unrealized Gain (Loss) on Investment and Foreign Currency Transactions | ||||||||
Net realized gain (loss) on: | ||||||||
Investment transactions | 4,324,903 | |||||||
Forward currency exchange contracts | (190,883 | ) | ||||||
Futures | 3,229,973 | |||||||
Swaps | (726,914 | ) | ||||||
Foreign currency transactions | 88,332 | |||||||
Net change in unrealized appreciation/depreciation of: | ||||||||
Investments(a) | (16,826,968 | ) | ||||||
Forward currency exchange contracts | 8,425 | |||||||
Futures | 711,119 | |||||||
Swaps | (6,016,054 | ) | ||||||
Foreign currency denominated assets and liabilities | 23,328 | |||||||
|
| |||||||
Net loss on investment and foreign currency transactions | (15,374,739 | ) | ||||||
|
| |||||||
Net Decrease in Net Assets from Operations | $ | (10,528,910 | ) | |||||
|
|
| (a) | Net of decrease in accrued foreign capital gains taxes of $9,396. |
See notes to financial statements.
| 58 | AB TOTAL RETURN BOND PORTFOLIO | abfunds.com | |
STATEMENT OF CHANGES IN NET ASSETS
| Six Months Ended April 30, 2020 (unaudited) | Year Ended October 31, 2019 | |||||||
| Increase (Decrease) in Net Assets from Operations | ||||||||
Net investment income | $ | 4,845,829 | $ | 10,364,693 | ||||
Net realized gain on investment and foreign currency transactions | 6,725,411 | 3,530,308 | ||||||
Net change in unrealized appreciation/depreciation of investments and foreign currency denominated assets and liabilities | (22,100,150 | ) | 19,671,907 | |||||
Contributions from Affiliates (see Note B) | – 0 | – | 3,028 | |||||
|
|
|
| |||||
Net increase (decrease) in net assets from operations | (10,528,910 | ) | 33,569,936 | |||||
Distributions to Shareholders | ||||||||
Class A | (3,205,355 | ) | (7,511,236 | ) | ||||
Class B | (201 | ) | (12,399 | ) | ||||
Class C | (117,303 | ) | (292,422 | ) | ||||
Advisor Class | (1,864,282 | ) | (3,142,500 | ) | ||||
Class R | (42,904 | ) | (97,619 | ) | ||||
Class K | (107,704 | ) | (272,681 | ) | ||||
Class I | (49,955 | ) | (127,077 | ) | ||||
Class Z | (136,818 | ) | (273,970 | ) | ||||
| Capital Stock Transactions | ||||||||
Net increase | 13,879,870 | 11,877,351 | ||||||
|
|
|
| |||||
Total increase (decrease) | (2,173,562 | ) | 33,717,383 | |||||
| Net Assets | ||||||||
Beginning of period | 359,763,620 | 326,046,237 | ||||||
|
|
|
| |||||
End of period | $ | 357,590,058 | $ | 359,763,620 | ||||
|
|
|
| |||||
See notes to financial statements.
| abfunds.com | AB TOTAL RETURN BOND PORTFOLIO | 59 | |
NOTES TO FINANCIAL STATEMENTS
April 30, 2020 (unaudited)
NOTE A
Significant Accounting Policies
AB Bond Fund, Inc. (the “Company”) is registered under the Investment Company Act of 1940 as an open-end management investment company. The Company, which is a Maryland corporation, operates as a series company comprised of ten portfolios currently in operation. Each portfolio is considered to be a separate entity for financial reporting and tax purposes. This report relates only to the AB Total Return Bond Portfolio (the “Fund”) (formerly AB Intermediate Bond Portfolio), a diversified portfolio. The Fund offers Class A, Class C, Advisor Class, Class R, Class K, Class I, Class T and Class Z shares. Class B and Class T shares have been authorized but currently are not offered. Effective August 2, 2019, sales of Class B shares were suspended. On November 7, 2019, all remaining outstanding Class B shares of the Fund were converted to Class A shares. Class A shares are sold with a front-end sales charge of up to 4.25% for purchases not exceeding $1,000,000. With respect to purchases of $1,000,000 or more, Class A shares redeemed within one year of purchase may be subject to a contingent deferred sales charge of 1%. Class C shares are subject to a contingent deferred sales charge of 1% on redemptions made within the first year after purchase, and 0% after the first year of purchase. Class C shares will automatically convert to Class A shares ten years after the end of the calendar month of purchase. Class R and Class K shares are sold without an initial or contingent deferred sales charge. Advisor Class, Class I and Class Z shares are sold without an initial or contingent deferred sales charge and are not subject to ongoing distribution expenses. All nine classes of shares have identical voting, dividend, liquidation and other rights, except that the classes bear different distribution and transfer agency expenses. Each class has exclusive voting rights with respect to its distribution plan. The financial statements have been prepared in conformity with U.S. generally accepted accounting principles (“U.S. GAAP”) which require management to make certain estimates and assumptions that affect the reported amounts of assets and liabilities in the financial statements and amounts of income and expenses during the reporting period. Actual results could differ from those estimates. The Fund is an investment company under U.S. GAAP and follows the accounting and reporting guidance applicable to investment companies. The following is a summary of significant accounting policies followed by the Fund.
1. Security Valuation
Portfolio securities are valued at their current market value determined on the basis of market quotations or, if market quotations are not readily available or are deemed unreliable, at “fair value” as determined in accordance with procedures established by and under the general supervision of the Company’s Board of Directors (the “Board”).
| 60 | AB TOTAL RETURN BOND PORTFOLIO | abfunds.com | |
NOTES TO FINANCIAL STATEMENTS (continued)
In general, the market values of securities which are readily available and deemed reliable are determined as follows: securities listed on a national securities exchange (other than securities listed on the NASDAQ Stock Market, Inc. (“NASDAQ”)) or on a foreign securities exchange are valued at the last sale price at the close of the exchange or foreign securities exchange. If there has been no sale on such day, the securities are valued at the last traded price from the previous day. Securities listed on more than one exchange are valued by reference to the principal exchange on which the securities are traded; securities listed only on NASDAQ are valued in accordance with the NASDAQ Official Closing Price; listed or over the counter (“OTC”) market put or call options are valued at the mid level between the current bid and ask prices. If either a current bid or current ask price is unavailable, AllianceBernstein L.P. (the “Adviser”) will have discretion to determine the best valuation (e.g., last trade price in the case of listed options); open futures are valued using the closing settlement price or, in the absence of such a price, the most recent quoted bid price. If there are no quotations available for the day of valuation, the last available closing settlement price is used; U.S. Government securities and any other debt instruments having 60 days or less remaining until maturity are generally valued at market by an independent pricing vendor, if a market price is available. If a market price is not available, the securities are valued at amortized cost. This methodology is commonly used for short term securities that have an original maturity of 60 days or less, as well as short term securities that had an original term to maturity that exceeded 60 days. In instances when amortized cost is utilized, the Valuation Committee (the “Committee”) must reasonably conclude that the utilization of amortized cost is approximately the same as the fair value of the security. Such factors the Committee will consider include, but are not limited to, an impairment of the creditworthiness of the issuer or material changes in interest rates. Fixed-income securities, including mortgage-backed and asset-backed securities, may be valued on the basis of prices provided by a pricing service or at a price obtained from one or more of the major broker-dealers. In cases where broker-dealer quotes are obtained, the Adviser may establish procedures whereby changes in market yields or spreads are used to adjust, on a daily basis, a recently obtained quoted price on a security. Swaps and other derivatives are valued daily, primarily using independent pricing services, independent pricing models using market inputs, as well as third party broker-dealers or counterparties. Open end mutual funds are valued at the closing net asset value per share, while exchange traded funds are valued at the closing market price per share.
Securities for which market quotations are not readily available (including restricted securities) or are deemed unreliable are valued at fair value as deemed appropriate by the Adviser. Factors considered in making this
| abfunds.com | AB TOTAL RETURN BOND PORTFOLIO | 61 | |
NOTES TO FINANCIAL STATEMENTS (continued)
determination may include, but are not limited to, information obtained by contacting the issuer, analysts, analysis of the issuer’s financial statements or other available documents. In addition, the Fund may use fair value pricing for securities primarily traded in non-U.S. markets because most foreign markets close well before the Fund values its securities at 4:00 p.m., Eastern Time. The earlier close of these foreign markets gives rise to the possibility that significant events, including broad market moves, may have occurred in the interim and may materially affect the value of those securities. To account for this, the Fund generally values many of its foreign equity securities using fair value prices based on third party vendor modeling tools to the extent available.
2. Fair Value Measurements
In accordance with U.S. GAAP regarding fair value measurements, fair value is defined as the price that the Fund would receive to sell an asset or pay to transfer a liability in an orderly transaction between market participants at the measurement date. U.S. GAAP establishes a framework for measuring fair value, and a three-level hierarchy for fair value measurements based upon the transparency of inputs to the valuation of an asset or liability (including those valued based on their market values as described in Note A.1 above). Inputs may be observable or unobservable and refer broadly to the assumptions that market participants would use in pricing the asset or liability. Observable inputs reflect the assumptions market participants would use in pricing the asset or liability based on market data obtained from sources independent of the Fund. Unobservable inputs reflect the Fund’s own assumptions about the assumptions that market participants would use in pricing the asset or liability based on the best information available in the circumstances. Each investment is assigned a level based upon the observability of the inputs which are significant to the overall valuation. The three-tier hierarchy of inputs is summarized below.
| • | Level 1—quoted prices in active markets for identical investments |
| • | Level 2—other significant observable inputs (including quoted prices for similar investments, interest rates, prepayment speeds, credit risk, etc.) |
| • | Level 3—significant unobservable inputs (including the Fund’s own assumptions in determining the fair value of investments) |
The fair value of debt instruments, such as bonds, and over-the-counter derivatives is generally based on market price quotations, recently executed market transactions (where observable) or industry recognized modeling techniques and are generally classified as Level 2. Pricing vendor inputs to Level 2 valuations may include quoted prices for similar invest-
| 62 | AB TOTAL RETURN BOND PORTFOLIO | abfunds.com | |
NOTES TO FINANCIAL STATEMENTS (continued)
ments in active markets, interest rate curves, coupon rates, currency rates, yield curves, option adjusted spreads, default rates, credit spreads and other unique security features in order to estimate the relevant cash flows which are then discounted to calculate fair values. If these inputs are unobservable and significant to the fair value, these investments will be classified as Level 3.
Valuations of mortgage-backed or other asset-backed securities, by pricing vendors, are based on both proprietary and industry recognized models and discounted cash flow techniques. Significant inputs to the valuation of these instruments are value of the collateral, the rates and timing of delinquencies, the rates and timing of prepayments, and default and loss expectations, which are driven in part by housing prices for residential mortgages. Significant inputs are determined based on relative value analyses, which incorporate comparisons to instruments with similar collateral and risk profiles, including relevant indices. Mortgage and asset-backed securities for which management has collected current observable data through pricing services are generally categorized within Level 2. Those investments for which current observable data has not been provided are classified as Level 3.
Other fixed income investments, including non-U.S. government and corporate debt, are generally valued using quoted market prices, if available, which are typically impacted by current interest rates, maturity dates and any perceived credit risk of the issuer. Additionally, in the absence of quoted market prices, these inputs are used by pricing vendors to derive a valuation based upon industry or proprietary models which incorporate issuer specific data with relevant yield/spread comparisons with more widely quoted bonds with similar key characteristics. Those investments for which there are observable inputs are classified as Level 2. Where the inputs are not observable, the investments are classified as Level 3.
The following table summarizes the valuation of the Fund’s investments by the above fair value hierarchy levels as of April 30, 2020:
Investments in | Level 1 | Level 2 | Level 3 | Total | ||||||||||||
Assets: |
| |||||||||||||||
Corporates – Investment Grade | $ | – 0 | – | $ | 91,589,539 | $ | – 0 | – | $ | 91,589,539 | ||||||
Collateralized Mortgage Obligations | – 0 | – | 54,930,134 | – 0 | – | 54,930,134 | ||||||||||
Commercial Mortgage-Backed Securities | – 0 | – | 53,462,193 | – 0 | – | 53,462,193 | ||||||||||
Mortgage Pass-Throughs | – 0 | – | 50,786,491 | – 0 | – | 50,786,491 | ||||||||||
Governments – Treasuries | – 0 | – | 43,151,190 | – 0 | – | 43,151,190 | ||||||||||
Inflation-Linked Securities | – 0 | – | 24,454,112 | – 0 | – | 24,454,112 | ||||||||||
| abfunds.com | AB TOTAL RETURN BOND PORTFOLIO | 63 | |
NOTES TO FINANCIAL STATEMENTS (continued)
Investments in | Level 1 | Level 2 | Level 3 | Total | ||||||||||||
Asset-Backed Securities | $ | – 0 | – | $ | 19,384,027 | $ | – 0 | – | $ | 19,384,027 | ||||||
Corporates – Non-Investment Grade | – 0 | – | 5,631,018 | – 0 | – | 5,631,018 | ||||||||||
Governments – Sovereign Bonds | – 0 | – | 3,183,658 | – 0 | – | 3,183,658 | ||||||||||
Collateralized Loan Obligations | – 0 | – | 1,988,468 | 737,625 | 2,726,093 | |||||||||||
Local Governments – US Municipal Bonds | – 0 | – | 2,722,387 | – 0 | – | 2,722,387 | ||||||||||
Quasi-Sovereigns | – 0 | – | 2,128,270 | – 0 | – | 2,128,270 | ||||||||||
Emerging Markets – Corporate Bonds | – 0 | – | 1,352,556 | – 0 | – | 1,352,556 | ||||||||||
Emerging Markets – Treasuries | – 0 | – | 667,240 | – 0 | – | 667,240 | ||||||||||
Common Stocks | – 0 | – | – 0 | – | 613,561 | 613,561 | ||||||||||
Emerging Markets – Sovereigns | – 0 | – | 234,192 | – 0 | – | 234,192 | ||||||||||
Short-Term Investments: | ||||||||||||||||
Governments – Treasuries | – 0 | – | 2,251,451 | – 0 | – | 2,251,451 | ||||||||||
Short-Term Municipal Notes | – 0 | – | 1,137,397 | – 0 | – | 1,137,397 | ||||||||||
Investment Companies | 289,237 | – 0 | – | – 0 | – | 289,237 | ||||||||||
Total Investments in Securities | 289,237 | 359,054,323 | 1,351,186 | 360,694,746 | ||||||||||||
|
|
|
|
|
|
|
| |||||||||
Other Financial Instruments(a): | ||||||||||||||||
Assets: |
| |||||||||||||||
Futures | 713,207 | – 0 | – | – 0 | – | 713,207 | (b) | |||||||||
Forward Currency Exchange Contracts | – 0 | – | 47,838 | – 0 | – | 47,838 | ||||||||||
Centrally Cleared Credit Default Swaps | – 0 | – | 170,270 | – 0 | – | 170,270 | (b) | |||||||||
Centrally Cleared Interest Rate Swaps | – 0 | – | 503,239 | – 0 | – | 503,239 | (b) | |||||||||
Liabilities: |
| |||||||||||||||
Futures | (67,933 | ) | – 0 | – | – 0 | – | (67,933 | )(b) | ||||||||
Forward Currency Exchange Contracts | – 0 | – | (94,596 | ) | – 0 | – | (94,596 | ) | ||||||||
Centrally Cleared Credit Default Swaps | – 0 | – | (311,118 | ) | – 0 | – | (311,118 | )(b) | ||||||||
Centrally Cleared Interest Rate Swaps | – 0 | – | (512,648 | ) | – 0 | – | (512,648 | )(b) | ||||||||
Credit Default Swaps | – 0 | – | (8,983,080 | ) | – 0 | – | (8,983,080 | ) | ||||||||
|
|
|
|
|
|
|
| |||||||||
Total | $ | 934,511 | $ | 349,874,228 | $ | 1,351,186 | $ | 352,159,925 | (c) | |||||||
|
|
|
|
|
|
|
| |||||||||
| (a) | Other financial instruments are derivative instruments, such as futures, forwards and swaps, which are valued at the unrealized appreciation/(depreciation) on the instrument. Other financial instruments may also include swaps with upfront premiums, options written and swaptions written which are valued at market value. |
| (b) | Only variation margin receivable/(payable) at period end is reported within the statement of assets and liabilities. This amount reflects cumulative unrealized appreciation/(depreciation) on futures and centrally cleared swaps as reported in the portfolio of investments. Where applicable, centrally cleared swaps with upfront premiums are presented here at market value. |
| 64 | AB TOTAL RETURN BOND PORTFOLIO | abfunds.com | |
NOTES TO FINANCIAL STATEMENTS (continued)
| (c) | The amount of $5,604,183 for Asset-Backed Securities was transferred out of Level 3 into Level 2 as improved transparency of price inputs received from pricing vendors has increased the observability during the reporting period. |
3. Currency Translation
Assets and liabilities denominated in foreign currencies and commitments under forward currency exchange contracts are translated into U.S. dollars at the mean of the quoted bid and ask prices of such currencies against the U.S. dollar. Purchases and sales of portfolio securities are translated into U.S. dollars at the rates of exchange prevailing when such securities were acquired or sold. Income and expenses are translated into U.S. dollars at rates of exchange prevailing when accrued.
Net realized gain or loss on foreign currency transactions represents foreign exchange gains and losses from sales and maturities of foreign fixed income investments, holding of foreign currencies, currency gains or losses realized between the trade and settlement dates on foreign investment transactions, and the difference between the amounts of dividends, interest and foreign withholding taxes recorded on the Fund’s books and the U.S. dollar equivalent amounts actually received or paid. Net unrealized currency gains and losses from valuing foreign currency denominated assets and liabilities at period end exchange rates are reflected as a component of net unrealized appreciation or depreciation of foreign currency denominated assets and liabilities.
4. Taxes
It is the Fund’s policy to meet the requirements of the Internal Revenue Code applicable to regulated investment companies and to distribute all of its investment company taxable income and net realized gains, if any, to shareholders. Therefore, no provisions for federal income or excise taxes are required. The Fund may be subject to taxes imposed by countries in which it invests. Such taxes are generally based on income and/or capital gains earned or repatriated. Taxes are accrued and applied to net investment income, net realized gains and net unrealized appreciation/depreciation as such income and/or gains are earned.
In accordance with U.S. GAAP requirements regarding accounting for uncertainties in income taxes, management has analyzed the Fund’s tax positions taken or expected to be taken on federal and state income tax returns for all open tax years (the current and the prior three tax years) and has concluded that no provision for income tax is required in the Fund’s financial statements.
5. Investment Income and Investment Transactions
Dividend income is recorded on the ex-dividend date or as soon as the Fund is informed of the dividend. Interest income is accrued daily. Invest-
| abfunds.com | AB TOTAL RETURN BOND PORTFOLIO | 65 | |
NOTES TO FINANCIAL STATEMENTS (continued)
ment transactions are accounted for on the date the securities are purchased or sold. Investment gains or losses are determined on the identified cost basis. The Fund amortizes premiums and accretes discounts as adjustments to interest income.
6. Class Allocations
All income earned and expenses incurred by the Fund are borne on a pro-rata basis by each outstanding class of shares, based on the proportionate interest in the Fund represented by the net assets of such class, except for class specific expenses which are allocated to the respective class. Expenses of the Company are charged proportionately to each fund or based on other appropriate methods. Realized and unrealized gains and losses are allocated among the various share classes based on respective net assets.
7. Dividends and Distributions
Dividends and distributions to shareholders, if any, are recorded on the ex-dividend date. Income dividends and capital gains distributions are determined in accordance with federal tax regulations and may differ from those determined in accordance with U.S. GAAP. To the extent these differences are permanent, such amounts are reclassified within the capital accounts based on their federal tax basis treatment; temporary differences do not require such reclassification.
NOTE B
Advisory Fee and Other Transactions with Affiliates
Under the terms of the investment advisory agreement, the Fund pays the Adviser an advisory fee at an annual rate of .45% of the first $2.5 billion, .40% of the next $2.5 billion up to $5 billion, .35% of the excess over $5 billion up to $8 billion and .30% in excess of $8 billion, of the Fund’s average daily net assets. The fee is accrued daily and paid monthly. The Adviser has agreed to waive its fees and bear certain expenses to the extent necessary to limit total operating expenses (excluding interest expense) on an annual basis (the “Expense Caps”) to ..77%, 1.52%, .52%, 1.02%, .77%, .52%, and .52% of the daily average net assets for the Class A, Class C, Advisor Class, Class R, Class K, Class I, and Class Z shares, respectively. This waiver extends through January 31, 2021 and then may be extended by the Adviser for additional one year terms. For the six months ended April 30, 2020, such reimbursements/waivers amounted to $414,358.
Pursuant to the investment advisory agreement, the Fund may reimburse the Adviser for certain legal and accounting services provided to the Fund by the Adviser. For the six months ended April 30, 2020, the reimbursement for such services amounted to $44,398.
| 66 | AB TOTAL RETURN BOND PORTFOLIO | abfunds.com | |
NOTES TO FINANCIAL STATEMENTS (continued)
The Fund compensates AllianceBernstein Investor Services, Inc. (“ABIS”), a wholly-owned subsidiary of the Adviser, under a Transfer Agency Agreement for providing personnel and facilities to perform transfer agency services for the Fund. ABIS may make payments to intermediaries that provide omnibus account services, sub-accounting services and/or networking services. Such compensation retained by ABIS amounted to $89,895 for the six months ended April 30, 2020.
AllianceBernstein Investments, Inc. (the “Distributor”), a wholly-owned subsidiary of the Adviser, serves as the distributor of the Fund’s shares. The Distributor has advised the Fund that it has retained front-end sales charges of $2,150 from the sale of Class A shares and received $455 and $898 in contingent deferred sales charges imposed upon redemptions by shareholders of Class A and Class C shares, respectively, for the six months ended April 30, 2020.
The Fund may invest in AB Government Money Market Portfolio (the “Government Money Market Portfolio”) which has a contractual annual advisory fee rate of .20% of the portfolio’s average daily net assets and bears its own expenses. The Adviser has contractually agreed to waive .10% of the advisory fee of Government Money Market Portfolio (resulting in a net advisory fee of .10%) until August 31, 2020. In connection with the investment by the Fund in Government Money Market Portfolio, the Adviser has contractually agreed to waive its advisory fee from the Fund in an amount equal to the Fund’s pro rata share of the effective advisory fee of Government Money Market Portfolio, as borne indirectly by the Fund as an acquired fund fee and expense. For the six months ended April 30, 2020, such waiver amounted to $1,564.
Fund | Market Value 10/31/19 (000) | Purchases at Cost (000) | Sales Proceeds (000) | Market Value 4/30/20 (000) | Dividend Income (000) | |||||||||||||||
Government Money Market Portfolio | $ | 11,000 | $ | 97,780 | $ | 108,491 | $ | 289 | $ | 21 | ||||||||||
During the year ended October 31, 2019, the Adviser reimbursed the Fund $3,028 for trading losses incurred due to a trade entry error.
During the second quarter of 2018, AXA S.A. (“AXA”), a French holding company for the AXA Group, completed the sale of a minority stake in its subsidiary, AXA Equitable Holdings, Inc. (now named Equitable Holdings, Inc.)(“Equitable”), through an initial public offering. Equitable is the holding company for a diverse group of financial services companies, including an approximately 64.9% economic interest in the Adviser and a 100% interest
| abfunds.com | AB TOTAL RETURN BOND PORTFOLIO | 67 | |
NOTES TO FINANCIAL STATEMENTS (continued)
in AllianceBernstein Corporation, the general partner of the Adviser. Since the initial sale, AXA has completed additional offerings, most recently during the fourth quarter of 2019. As a result, AXA currently owns less than 10% of the outstanding shares of common stock of Equitable, and no longer owns a controlling interest in Equitable. AXA previously announced its intention to sell its entire interest in Equitable over time, subject to market conditions and other factors (the “Plan”). Most of AXA’s remaining Equitable shares are to be delivered on redemption of AXA bonds mandatorily exchangeable into Equitable shares and maturing in May 2021. AXA retains sole discretion to determine the timing of any future sales of its remaining shares of Equitable common stock.
Sales under the Plan that were completed on November 13, 2019 resulted in the indirect transfer of a “controlling block” of voting securities of the Adviser (a “Change of Control Event”) and may have been deemed to have been an “assignment” causing a termination of the Fund’s investment advisory and administration agreements. In order to ensure that investment advisory and administration services could continue uninterrupted in the event of a Change of Control Event, the Board previously approved new investment advisory and administration agreements with the Adviser, and shareholders of the Fund subsequently approved the new investment advisory agreement. These agreements became effective on November 13, 2019.
NOTE C
Distribution Services Agreement
The Fund has adopted a Distribution Services Agreement (the “Agreement”) pursuant to Rule 12b-1 under the Investment Company Act of 1940. Under the Agreement, the Fund pays distribution and servicing fees to the Distributor at an annual rate of up to .30% of the Fund’s average daily net assets attributable to Class A shares, 1% of the Fund’s average daily net assets attributable to both Class B and Class C shares, .50% of the Fund’s average daily net assets attributable to Class R shares and .25% of the Fund’s average daily net assets attributable to Class K shares. There are no distribution and servicing fees on the Advisor Class, Class I and Class Z shares. Payments under the Agreement in respect of Class A shares are limited to an annual rate of .25% of Class A shares’ average daily net assets. The fees are accrued daily and paid monthly. The Agreement provides that the Distributor will use such payments in their entirety for distribution assistance and promotional activities. Since the commencement of the Fund’s operations, the Distributor has incurred expenses in excess of the distribution costs reimbursed by the Fund in the amounts of $1,207,745, $145,064 and $62,321 for Class C, Class R and Class K shares, respectively. While such costs may be recovered from the Fund in future periods so long as the Agreement is in effect, the rate of the
| 68 | AB TOTAL RETURN BOND PORTFOLIO | abfunds.com | |
NOTES TO FINANCIAL STATEMENTS (continued)
distribution and servicing fees payable under the Agreement may not be increased without a shareholder vote. In accordance with the Agreement, there is no provision for recovery of unreimbursed distribution costs incurred by the Distributor beyond the current fiscal year for Class A shares. The Agreement also provides that the Adviser may use its own resources to finance the distribution of the Fund’s shares.
NOTE D
Investment Transactions
Purchases and sales of investment securities (excluding short-term investments) for the six months ended April 30, 2020 were as follows:
| Purchases | Sales | |||||||
Investment securities (excluding U.S. government securities) | $ | 75,765,784 | $ | 46,187,855 | ||||
U.S. government securities | 107,970,022 | 103,686,973 | ||||||
The cost of investments for federal income tax purposes was substantially the same as the cost for financial reporting purposes. Accordingly, gross unrealized appreciation and unrealized depreciation are as follows:
Gross unrealized appreciation | $ | 18,628,801 | ||
Gross unrealized depreciation | (29,711,976 | ) | ||
|
| |||
Net unrealized depreciation | $ | (11,083,175 | ) | |
|
|
1. Derivative Financial Instruments
The Fund may use derivatives in an effort to earn income and enhance returns, to replace more traditional direct investments, to obtain exposure to otherwise inaccessible markets (collectively, “investment purposes”), or to hedge or adjust the risk profile of its portfolio.
The principal types of derivatives utilized by the Fund, as well as the methods in which they may be used are:
| • | Futures |
The Fund may buy or sell futures for investment purposes or for the purpose of hedging its portfolio against adverse effects of potential movements in the market. The Fund bears the market risk that arises from changes in the value of these instruments and the imperfect correlation between movements in the price of the futures and movements in the price of the assets, reference rates or indices which they are designed to track. Among other things, the Fund may purchase or sell futures for foreign currencies or options thereon for non-hedging purposes as a means of making direct investment in foreign currencies, as described below under “Currency Transactions”.
| abfunds.com | AB TOTAL RETURN BOND PORTFOLIO | 69 | |
NOTES TO FINANCIAL STATEMENTS (continued)
At the time the Fund enters into futures, the Fund deposits and maintains as collateral an initial margin with the broker, as required by the exchange on which the transaction is effected. Such amount is shown as cash collateral due from broker on the statement of assets and liabilities. Pursuant to the contract, the Fund agrees to receive from or pay to the broker an amount of cash equal to the daily fluctuation in the value of the contract. Such receipts or payments are known as variation margin and are recorded by the Fund as unrealized gains or losses. Risks may arise from the potential inability of a counterparty to meet the terms of the contract. The credit/counterparty risk for exchange-traded futures is generally less than privately negotiated futures, since the clearinghouse, which is the issuer or counterparty to each exchange-traded future, has robust risk mitigation standards, including the requirement to provide initial and variation margin. When the contract is closed, the Fund records a realized gain or loss equal to the difference between the value of the contract at the time it was opened and the time it was closed.
Use of long futures subjects the Fund to risk of loss in excess of the amounts shown on the statement of assets and liabilities, up to the notional value of the futures. Use of short futures subjects the Fund to unlimited risk of loss. Under some circumstances, futures exchanges may establish daily limits on the amount that the price of futures can vary from the previous day’s settlement price, which could effectively prevent liquidation of unfavorable positions.
During the six months ended April 30, 2020, the Fund held futures for hedging and non-hedging purposes.
| • | Forward Currency Exchange Contracts |
The Fund may enter into forward currency exchange contracts in order to hedge its exposure to changes in foreign currency exchange rates on its foreign portfolio holdings, to hedge certain firm purchase and sale commitments denominated in foreign currencies and for non-hedging purposes as a means of making direct investments in foreign currencies, as described below under “Currency Transactions”.
A forward currency exchange contract is a commitment to purchase or sell a foreign currency at a future date at a negotiated forward rate. The gain or loss arising from the difference between the original contract and the closing of such contract would be included in net realized gain or loss on forward currency exchange contracts. Fluctuations in the value of open forward currency exchange contracts are recorded for financial reporting purposes as unrealized
| 70 | AB TOTAL RETURN BOND PORTFOLIO | abfunds.com | |
NOTES TO FINANCIAL STATEMENTS (continued)
appreciation and/or depreciation by the Fund. Risks may arise from the potential inability of a counterparty to meet the terms of a contract and from unanticipated movements in the value of a foreign currency relative to the U.S. dollar.
During the six months ended April 30, 2020, the Fund held forward currency exchange contracts for hedging and non-hedging purposes.
| • | Swaps |
The Fund may enter into swaps to hedge its exposure to interest rates, credit risk or currencies. The Fund may also enter into swaps for non-hedging purposes as a means of gaining market exposures, making direct investments in foreign currencies, as described below under “Currency Transactions.” A swap is an agreement that obligates two parties to exchange a series of cash flows at specified intervals based upon or calculated by reference to changes in specified prices or rates for a specified amount of an underlying asset. The payment flows are usually netted against each other, with the difference being paid by one party to the other. In addition, collateral may be pledged or received by the Fund in accordance with the terms of the respective swaps to provide value and recourse to the Fund or its counterparties in the event of default, bankruptcy or insolvency by one of the parties to the swap.
Risks may arise as a result of the failure of the counterparty to the swap to comply with the terms of the swap. The loss incurred by the failure of a counterparty is generally limited to the net interim payment to be received by the Fund, and/or the termination value at the end of the contract. Therefore, the Fund considers the creditworthiness of each counterparty to a swap in evaluating potential counterparty risk. This risk is mitigated by having a netting arrangement between the Fund and the counterparty and by the posting of collateral by the counterparty to the Fund to cover the Fund’s exposure to the counterparty. Additionally, risks may arise from unanticipated movements in interest rates or in the value of the underlying securities. The Fund accrues for the interim payments on swaps on a daily basis, with the net amount recorded within unrealized appreciation/depreciation of swaps on the statement of assets and liabilities, where applicable. Once the interim payments are settled in cash, the net amount is recorded as realized gain/(loss) on swaps on the statement of operations, in addition to any realized gain/(loss) recorded upon the termination of swaps. Upfront premiums paid or received for OTC swaps are recognized as cost or proceeds on the statement of assets and liabilities and are amortized on a straight line basis over the life of the contract. Amortized upfront premiums are included in net realized gain/(loss) from swaps on the statement of
| abfunds.com | AB TOTAL RETURN BOND PORTFOLIO | 71 | |
NOTES TO FINANCIAL STATEMENTS (continued)
operations. Fluctuations in the value of swaps are recorded as a component of net change in unrealized appreciation/depreciation of swaps on the statement of operations.
Certain standardized swaps, including certain interest rate swaps and credit default swaps, are (or soon will be) subject to mandatory central clearing. Cleared swaps are transacted through futures commission merchants (“FCMs”) that are members of central clearinghouses, with the clearinghouse serving as central counterparty, similar to transactions in futures contracts. Centralized clearing will be required for additional categories of swaps on a phased-in basis based on requirements published by the Securities and Exchange Commission and Commodity Futures Trading Commission.
At the time the Fund enters into a centrally cleared swap, the Fund deposits and maintains as collateral an initial margin with the broker, as required by the clearinghouse on which the transaction is effected. Such amount is shown as cash collateral due from broker on the statement of assets and liabilities. Pursuant to the contract, the Fund agrees to receive from or pay to the broker an amount of cash equal to the daily fluctuation in the value of the contract. Such receipts or payments are known as variation margin and are recorded by the Fund as unrealized gains or losses. Risks may arise from the potential inability of a counterparty to meet the terms of the contract. The credit/counterparty risk for centrally cleared swaps is generally less than non-centrally cleared swaps, since the clearinghouse, which is the issuer or counterparty to each centrally cleared swap, has robust risk mitigation standards, including the requirement to provide initial and variation margin. When the contract is closed, the Fund records a realized gain or loss equal to the difference between the value of the contract at the time it was opened and the time it was closed.
Interest Rate Swaps:
The Fund is subject to interest rate risk exposure in the normal course of pursuing its investment objectives. Because the Fund holds fixed rate bonds, the value of these bonds may decrease if interest rates rise. To help hedge against this risk and to maintain its ability to generate income at prevailing market rates, the Fund may enter into interest rate swaps. Interest rate swaps are agreements between two parties to exchange cash flows based on a notional amount. The Fund may elect to pay a fixed rate and receive a floating rate, or, receive a fixed rate and pay a floating rate on a notional amount.
In addition, the Fund may also enter into interest rate swap transactions to preserve a return or spread on a particular investment or portion of its portfolio, or protecting against an increase in the price of securities the Fund anticipates purchasing at a later date. Interest
| 72 | AB TOTAL RETURN BOND PORTFOLIO | abfunds.com | |
NOTES TO FINANCIAL STATEMENTS (continued)
rate swaps involve the exchange by a Fund with another party of their respective commitments to pay or receive interest (e.g., an exchange of floating rate payments for fixed rate payments) computed based on a contractually-based principal (or “notional”) amount. Interest rate swaps are entered into on a net basis (i.e., the two payment streams are netted out, with the Fund receiving or paying, as the case may be, only the net amount of the two payments).
During the six months ended April 30, 2020, the Fund held interest rate swaps for hedging and non-hedging purposes.
Credit Default Swaps:
The Fund may enter into credit default swaps, including to manage its exposure to the market or certain sectors of the market, to reduce its risk exposure to defaults by corporate and sovereign issuers held by the Fund, or to create exposure to corporate or sovereign issuers to which it is not otherwise exposed. The Fund may purchase credit protection (“Buy Contract”) or provide credit protection (“Sale Contract”) on the referenced obligation of the credit default swap. During the term of the swap, the Fund receives/(pays) fixed payments from/(to) the respective counterparty, calculated at the agreed upon rate applied to the notional amount. If the Fund is a buyer/(seller) of protection and a credit event occurs, as defined under the terms of the swap, the Fund will either (i) receive from the seller/(pay to the buyer) of protection an amount equal to the notional amount of the swap (the “Maximum Payout Amount”) and deliver/(take delivery of) the referenced obligation or (ii) receive/(pay) a net settlement amount in the form of cash or securities equal to the notional amount of the swap less the recovery value of the referenced obligation. In certain circumstances Maximum Payout Amounts may be partially offset by recovery values of the respective referenced obligations, upfront premium received upon entering into the agreement, or net amounts received from settlement of buy protection credit default swaps entered into by the Fund for the same referenced obligations with the same counterparty.
Credit default swaps may involve greater risks than if a Fund had invested in the referenced obligation directly. Credit default swaps are subject to general market risk, liquidity risk, counterparty risk and credit risk. If the Fund is a buyer of protection and no credit event occurs, it will lose the payments it made to its counterparty. If the Fund is a seller of protection and a credit event occurs, the value of the referenced obligation received by the Fund coupled with the periodic payments previously received, may be less than the Maximum Payout Amount it pays to the buyer, resulting in a net loss to the Fund.
| abfunds.com | AB TOTAL RETURN BOND PORTFOLIO | 73 | |
NOTES TO FINANCIAL STATEMENTS (continued)
Implied credit spreads over U.S. Treasuries of comparable maturity utilized in determining the market value of credit default swaps on issuers as of period end are disclosed in the portfolio of investments. The implied spreads serve as an indicator of the current status of the payment/performance risk and typically reflect the likelihood of default by the issuer of the referenced obligation. The implied credit spread of a particular reference obligation also reflects the cost of buying/selling protection and may reflect upfront payments required to be made to enter into the agreement. Widening credit spreads typically represent a deterioration of the referenced obligation’s credit soundness and greater likelihood of default or other credit event occurring as defined under the terms of the agreement. A credit spread identified as “Defaulted” indicates a credit event has occurred for the referenced obligation.
During the six months ended April 30, 2020, the Fund held credit default swaps for hedging and non-hedging purposes.
The Fund typically enters into International Swaps and Derivatives Association, Inc. Master Agreements (“ISDA Master Agreement”) with its OTC derivative contract counterparties in order to, among other things, reduce its credit risk to OTC counterparties. ISDA Master Agreements include provisions for general obligations, representations, collateral and events of default or termination. Under an ISDA Master Agreement, the Fund typically may offset with the OTC counterparty certain derivative financial instruments’ payables and/or receivables with collateral held and/or posted and create one single net payment (close-out netting) in the event of default or termination. In the event of a default by an OTC counterparty, the return of collateral with market value in excess of the Fund’s net liability, held by the defaulting party, may be delayed or denied.
The Fund’s ISDA Master Agreements may contain provisions for early termination of OTC derivative transactions in the event the net assets of the Fund decline below specific levels (“net asset contingent features”). If these levels are triggered, the Fund’s OTC counterparty has the right to terminate such transaction and require the Fund to pay or receive a settlement amount in connection with the terminated transaction. If OTC derivatives were held at period end, please refer to netting arrangements by the OTC counterparty table below for additional details.
| 74 | AB TOTAL RETURN BOND PORTFOLIO | abfunds.com | |
NOTES TO FINANCIAL STATEMENTS (continued)
During the six months ended April 30, 2020, the Fund had entered into the following derivatives:
Asset Derivatives | Liability Derivatives | |||||||||||
Derivative Type | Statement of | Fair Value | Statement of | Fair Value | ||||||||
Interest rate contracts | Receivable/Payable for variation margin on futures | $ | 713,207 | * | Receivable/Payable for variation margin on futures | $ | 67,933 | * | ||||
Credit contracts | Receivable/Payable for variation margin on centrally cleared swaps | 45,172 | * | Receivable/Payable for variation margin on centrally cleared swaps | 13,820 | * | ||||||
Interest rate contracts | Receivable/Payable for variation margin on centrally cleared swaps | | 503,108 | * | Receivable/Payable for variation margin on centrally cleared swaps | | 512,650 | * | ||||
Foreign currency contracts | Unrealized appreciation on forward currency exchange contracts | | 47,838 | Unrealized depreciation on forward currency exchange contracts | | 94,596 | ||||||
Credit contracts | Market value on credit default swaps | 8,983,080 | ||||||||||
|
|
|
| |||||||||
Total | $ | 1,309,325 | $ | 9,672,079 | ||||||||
|
|
|
| |||||||||
| * | Only variation margin receivable/payable at period end is reported within the statement of assets and liabilities. This amount reflects cumulative unrealized appreciation/(depreciation) on futures and centrally cleared swaps as reported in the portfolio of investments. |
Derivative Type | Location of | Realized Gain or (Loss) on Derivatives | Change in Unrealized Appreciation or (Depreciation) | |||||||
Interest rate contracts | Net realized gain (loss) on futures; Net change in unrealized appreciation/depreciation of futures | $ | 3,229,973 | $ | 711,119 | |||||
| abfunds.com | AB TOTAL RETURN BOND PORTFOLIO | 75 | |
NOTES TO FINANCIAL STATEMENTS (continued)
Derivative Type | Location of | Realized Gain or (Loss) on Derivatives | Change in Unrealized Appreciation or (Depreciation) | |||||||
Foreign currency contracts | Net realized gain (loss) on forward currency exchange contracts; Net change in unrealized appreciation/depreciation of forward currency exchange contracts | $ | (190,883 | ) | $ | 8,425 | ||||
Interest rate contracts | Net realized gain (loss) on swaps; Net change in unrealized appreciation/depreciation of swaps | 323,803 | 293,496 | |||||||
Credit contracts | Net realized gain (loss) on swaps; Net change in unrealized appreciation/depreciation of swaps | (1,050,717 | ) | (6,309,550 | ) | |||||
|
|
|
| |||||||
Total | $ | 2,312,176 | $ | (5,296,510 | ) | |||||
|
|
|
| |||||||
The following table represents the average monthly volume of the Fund’s derivative transactions during the six months ended April 30, 2020:
Futures: | ||||
Average notional amount of buy contracts | $ | 79,640,119 | ||
Average notional amount of sale contracts | $ | 5,652,852 | ||
Forward Currency Exchange Contracts: | ||||
Average principal amount of buy contracts | $ | 3,992,929 | (a) | |
Average principal amount of sale contracts | $ | 14,780,653 | ||
Centrally Cleared Interest Rate Swaps: | ||||
Average notional amount | $ | 44,883,169 | ||
Credit Default Swaps: | ||||
Average notional amount of buy contracts | $ | 12,037,000 | (b) | |
Average notional amount of sale contracts | $ | 25,779,100 | ||
Centrally Cleared Credit Default Swaps: | ||||
Average notional amount of buy contracts | $ | 4,456,108 | (a) | |
Average notional amount of sale contracts | $ | 4,687,377 | (c) |
| (a) | Positions were open for five months during the period. |
| (b) | Positions were open for two months during the period. |
| (c) | Positions were open for three months during the period. |
For financial reporting purposes, the Fund does not offset derivative assets and derivative liabilities that are subject to netting arrangements in the statement of assets and liabilities.
All OTC derivatives held at period end were subject to netting arrangements. The following table presents the Fund’s derivative assets and
| 76 | AB TOTAL RETURN BOND PORTFOLIO | abfunds.com | |
NOTES TO FINANCIAL STATEMENTS (continued)
liabilities by OTC counterparty net of amounts available for offset under ISDA Master Agreements (“MA”) and net of the related collateral received/pledged by the Fund as of April 30, 2020. Exchange-traded derivatives and centrally cleared swaps are not subject to netting arrangements and as such are excluded from the table.
Counterparty | Derivative Assets Subject to a MA | Derivatives Available for Offset | Cash Collateral Received* | Security Collateral Received* | Net Amount of Derivative Assets | |||||||||||||||
Goldman Sachs Bank USA/Goldman Sachs International | $ | 47,767 | $ | (47,767 | ) | $ | – 0 | – | $ | – 0 | – | $ | – 0 | – | ||||||
State Street Bank & Trust Co. | 71 | – 0 | – | – 0 | – | – 0 | – | 71 | ||||||||||||
|
|
|
|
|
|
|
|
|
| |||||||||||
Total | $ | 47,838 | $ | (47,767 | ) | $ | – 0 | – | $ | – 0 | – | $ | 71 | ^ | ||||||
|
|
|
|
|
|
|
|
|
| |||||||||||
Counterparty | Derivative Liabilities Subject to a MA | Derivatives Available for Offset | Cash Collateral Pledged* | Security Collateral Pledged* | Net Amount of Derivative Liabilities | |||||||||||||||
BNP Paribas SA | $ | 12,453 | $ | – 0 | – | $ | – 0 | – | $ | – 0 | – | $ | 12,453 | |||||||
Citibank, NA | 61,441 | – 0 | – | – 0 | – | – 0 | – | 61,441 | ||||||||||||
Citigroup Global Markets, Inc. | 5,521,799 | – 0 | – | (4,735,519 | ) | (786,280 | ) | – 0 | – | |||||||||||
Credit Suisse International | 921,965 | – 0 | – | – 0 | – | (804,767 | ) | 117,198 | ||||||||||||
Deutsche Bank AG | 773,567 | – 0 | – | (420,000 | ) | (280,672 | ) | 72,895 | ||||||||||||
Goldman Sachs Bank USA/Goldman Sachs International | 1,197,958 | (47,767 | ) | – 0 | – | (1,150,191 | ) | – 0 | – | |||||||||||
JPMorgan Securities LLC/JPMorgan Securities, LLC | 246,350 | – 0 | – | – 0 | – | (246,350 | ) | – 0 | – | |||||||||||
Morgan Stanley & Co. International PLC/Morgan Stanley & Co., Inc. | 342,143 | – 0 | – | – 0 | – | (256,239 | ) | 85,904 | ||||||||||||
|
|
|
|
|
|
|
|
|
| |||||||||||
Total | $ | 9,077,676 | $ | (47,767 | ) | $ | (5,155,519 | ) | $ | (3,524,499 | ) | $ | 349,891 | ^ | ||||||
|
|
|
|
|
|
|
|
|
| |||||||||||
| abfunds.com | AB TOTAL RETURN BOND PORTFOLIO | 77 | |
NOTES TO FINANCIAL STATEMENTS (continued)
| * | The actual collateral received/pledged may be more than the amount reported due to over-collateralization. |
| ^ | Net amount represents the net receivable/payable that would be due from/to the counterparty in the event of default or termination. The net amount from OTC financial derivative instruments can only be netted across transactions governed under the same master agreement with the same counterparty. |
2. Currency Transactions
The Fund may invest in non-U.S. Dollar-denominated securities on a currency hedged or unhedged basis. The Fund may seek investment opportunities by taking long or short positions in currencies through the use of currency-related derivatives, including forward currency exchange contracts, futures and options on futures, swaps, and other options. The Fund may enter into transactions for investment opportunities when it anticipates that a foreign currency will appreciate or depreciate in value but securities denominated in that currency are not held by the Fund and do not present attractive investment opportunities. Such transactions may also be used when the Adviser believes that it may be more efficient than a direct investment in a foreign currency-denominated security. The Fund may also conduct currency exchange contracts on a spot basis (i.e., for cash at the spot rate prevailing in the currency exchange market for buying or selling currencies).
3. TBA and Dollar Rolls
The Fund may invest in TBA mortgage-backed securities. A TBA, or “To Be Announced”, trade represents a contract for the purchase or sale of mortgage-backed securities to be delivered at a future agree-upon date; however, the specific mortgage pool numbers or the number of pools that will be delivered to fulfill the trade obligation or terms of the contract are unknown at the time of the trade. Mortgage pools (including fixed-rate or variable-rate mortgages) guaranteed by the Government National Mortgage Association, or GNMA, the Federal National Mortgage Association, or FNMA, or the Federal Home Loan Mortgage Corporation, or FHLMC, are subsequently allocated to the TBA transactions.
The Fund may enter into certain TBA transactions known as dollar rolls. Dollar rolls involve sales by the Fund of securities for delivery in the current month and the Fund’s simultaneously contracting to repurchase substantially similar (same type and coupon) securities on a specified future date. During the roll period, the Fund forgoes principal and interest paid on the securities. The Fund is compensated by the difference between the current sales price and the lower forward price for the future purchase (often referred to as the “drop”) as well as by the interest earned on the cash proceeds of the initial sale. Dollar rolls involve the risk that the market value of the securities the Fund is obligated to repurchase under the agreement may decline below the repurchase price. Dollar rolls are speculative techniques. For the six months ended April 30, 2020, the Fund
| 78 | AB TOTAL RETURN BOND PORTFOLIO | abfunds.com | |
NOTES TO FINANCIAL STATEMENTS (continued)
earned drop income of $5,366 which is included in interest income in the accompanying statement of operations.
NOTE E
Capital Stock
Each class consists of 3,000,000,000 authorized shares. Transactions in capital shares for each class were as follows:
| Shares | Amount | |||||||||||||||||||||||
| Six Months Ended April 30, 2020 (unaudited) | Year Ended October 31, 2019 | Six Months Ended April 30, 2020 (unaudited) | Year Ended October 31, 2019 | |||||||||||||||||||||
|
| |||||||||||||||||||||||
| Class A |
| |||||||||||||||||||||||
Shares sold | 801,706 | 1,757,218 | $ | 8,950,905 | $ | 19,196,029 | ||||||||||||||||||
| ||||||||||||||||||||||||
Shares issued in reinvestment of dividends and distributions | 221,371 | 524,378 | 2,486,410 | 5,781,216 | ||||||||||||||||||||
| ||||||||||||||||||||||||
Shares converted from Class B | 35,897 | 11,654 | 403,846 | 128,277 | ||||||||||||||||||||
| ||||||||||||||||||||||||
Shares converted from Class C | 54,661 | 161,067 | 618,785 | 1,793,569 | ||||||||||||||||||||
| ||||||||||||||||||||||||
Shares redeemed | (1,395,714 | ) | (3,348,527 | ) | (15,557,221 | ) | (36,976,828 | ) | ||||||||||||||||
| ||||||||||||||||||||||||
Net decrease | (282,079 | ) | (894,210 | ) | $ | (3,097,275 | ) | $ | (10,077,737 | ) | ||||||||||||||
| ||||||||||||||||||||||||
| Class B |
| |||||||||||||||||||||||
Shares sold | 2 | 3,175 | $ | 30 | $ | 34,706 | ||||||||||||||||||
| ||||||||||||||||||||||||
Shares issued in reinvestment of dividends and distributions | – 0 | – | 1,076 | – 0 | – | 11,835 | ||||||||||||||||||
| ||||||||||||||||||||||||
Shares converted to Class A | (35,897 | ) | (11,651 | ) | (403,846 | ) | (128,277 | ) | ||||||||||||||||
| ||||||||||||||||||||||||
Shares redeemed | (133 | ) | (4,565 | ) | (1,498 | ) | (50,676 | ) | ||||||||||||||||
| ||||||||||||||||||||||||
Net decrease | (36,028 | ) | (11,965 | ) | $ | (405,314 | ) | $ | (132,412 | ) | ||||||||||||||
| ||||||||||||||||||||||||
| Class C |
| |||||||||||||||||||||||
Shares sold | 277,686 | 233,063 | $ | 3,095,513 | $ | 2,560,907 | ||||||||||||||||||
| ||||||||||||||||||||||||
Shares issued in reinvestment of dividends and distributions | 7,406 | 18,800 | 83,005 | 206,427 | ||||||||||||||||||||
| ||||||||||||||||||||||||
Shares converted to Class A | (54,788 | ) | (161,416 | ) | (618,785 | ) | (1,793,569 | ) | ||||||||||||||||
| ||||||||||||||||||||||||
Shares redeemed | (142,018 | ) | (224,164 | ) | (1,560,287 | ) | (2,453,077 | ) | ||||||||||||||||
| ||||||||||||||||||||||||
Net increase (decrease) | 88,286 | (133,717 | ) | $ | 999,446 | $ | (1,479,312 | ) | ||||||||||||||||
| ||||||||||||||||||||||||
| abfunds.com | AB TOTAL RETURN BOND PORTFOLIO | 79 | |
NOTES TO FINANCIAL STATEMENTS (continued)
| Shares | Amount | |||||||||||||||||||||||
| Six Months Ended April 30, 2020 (unaudited) | Year Ended October 31, 2019 | Six Months Ended April 30, 2020 (unaudited) | Year Ended October 31, 2019 | |||||||||||||||||||||
|
| |||||||||||||||||||||||
| Advisor Class |
| |||||||||||||||||||||||
Shares sold | 3,880,714 | 5,806,792 | $ | 43,624,478 | $ | 63,820,451 | ||||||||||||||||||
| ||||||||||||||||||||||||
Shares issued in reinvestment of dividends and distributions | 84,897 | 165,044 | 955,387 | 1,825,673 | ||||||||||||||||||||
| ||||||||||||||||||||||||
Shares redeemed | (2,318,353 | ) | (3,908,822 | ) | (25,176,781 | ) | (42,732,896 | ) | ||||||||||||||||
| ||||||||||||||||||||||||
Net increase | 1,647,258 | 2,063,014 | $ | 19,403,084 | $ | 22,913,228 | ||||||||||||||||||
| ||||||||||||||||||||||||
| Class R |
| |||||||||||||||||||||||
Shares sold | 32,014 | 60,008 | $ | 353,333 | $ | 659,712 | ||||||||||||||||||
| ||||||||||||||||||||||||
Shares issued in reinvestment of dividends and distributions | 3,793 | 8,836 | 42,676 | 97,491 | ||||||||||||||||||||
| ||||||||||||||||||||||||
Shares redeemed | (132,131 | ) | (42,410 | ) | (1,414,381 | ) | (471,877 | ) | ||||||||||||||||
| ||||||||||||||||||||||||
Net increase (decrease) | (96,324 | ) | 26,434 | $ | (1,018,372 | ) | $ | 285,326 | ||||||||||||||||
| ||||||||||||||||||||||||
| Class K |
| |||||||||||||||||||||||
Shares sold | 127,295 | 332,303 | $ | 1,445,631 | $ | 3,617,130 | ||||||||||||||||||
| ||||||||||||||||||||||||
Shares issued in reinvestment of dividends and distributions | 9,556 | 24,713 | 107,545 | 272,598 | ||||||||||||||||||||
| ||||||||||||||||||||||||
Shares redeemed | (260,054 | ) | (439,474 | ) | (2,769,654 | ) | (4,827,553 | ) | ||||||||||||||||
| ||||||||||||||||||||||||
Net decrease | (123,203 | ) | (82,458 | ) | $ | (1,216,478 | ) | $ | (937,825 | ) | ||||||||||||||
| ||||||||||||||||||||||||
| Class I |
| |||||||||||||||||||||||
Shares sold | 39,429 | 169,670 | $ | 449,962 | $ | 1,880,717 | ||||||||||||||||||
| ||||||||||||||||||||||||
Shares issued in reinvestment of dividends and distributions | 4,009 | 10,943 | 45,280 | 121,108 | ||||||||||||||||||||
| ||||||||||||||||||||||||
Shares redeemed | (202,039 | ) | (90,545 | ) | (2,317,276 | ) | (1,008,280 | ) | ||||||||||||||||
| ||||||||||||||||||||||||
Net increase (decrease) | (158,601 | ) | 90,068 | $ | (1,822,034 | ) | $ | 993,545 | ||||||||||||||||
| ||||||||||||||||||||||||
| Class Z |
| |||||||||||||||||||||||
Shares sold | 221,014 | 372,346 | $ | 2,468,191 | $ | 4,155,412 | ||||||||||||||||||
| ||||||||||||||||||||||||
Shares issued in reinvestment of dividends and distributions | 12,166 | 24,733 | 136,840 | 273,479 | ||||||||||||||||||||
| ||||||||||||||||||||||||
Shares redeemed | (142,243 | ) | (369,959 | ) | (1,568,218 | ) | (4,116,353 | ) | ||||||||||||||||
| ||||||||||||||||||||||||
Net increase | 90,937 | 27,120 | $ | 1,036,813 | $ | 312,538 | ||||||||||||||||||
| ||||||||||||||||||||||||
| 80 | AB TOTAL RETURN BOND PORTFOLIO | abfunds.com | |
NOTES TO FINANCIAL STATEMENTS (continued)
NOTE F
Risks Involved in Investing in the Fund
Market Risk—The market value of a security may move up or down, sometimes rapidly and unpredictably. These fluctuations may cause a security to be worth less than the price originally paid for it, or less than it was worth at an earlier time. Market risk may affect a single issuer, industry, sector of the economy or the market as a whole. Global economies and financial markets are increasingly interconnected, which increases the probabilities that conditions in one country or region might adversely impact issuers in a different country or region. Conditions affecting the general economy, including political, social, or economic instability at the local, regional, or global level may also affect the market value of a security. Health crises, such as pandemic and epidemic diseases, as well as other incidents that interrupt the expected course of events, such as natural disasters, war or civil disturbance, acts of terrorism, power outages and other unforeseeable and external events, and the public response to or fear of such diseases or events, have and may in the future have an adverse effect on the Fund’s investments and net asset value and can lead to increased market volatility. For example, any preventative or protective actions that governments may take in respect of such diseases or events may result in periods of business disruption, inability to obtain raw materials, supplies and component parts, and reduced or disrupted operations for the Fund’s portfolio companies. The occurrence and pendency of such diseases or events could adversely affect the economies and financial markets either in specific countries or worldwide.
Interest Rate Risk—Changes in interest rates will affect the value of investments in fixed-income securities. When interest rates rise, the value of existing investments in fixed-income securities tends to fall and this decrease in value may not be offset by higher income from new investments. Interest rate risk is generally greater for fixed-income securities with longer maturities or durations.
Credit Risk—An issuer or guarantor of a fixed-income security, or the counterparty to a derivatives or other contract, may be unable or unwilling to make timely payments of interest or principal, or to otherwise honor its obligations. The issuer or guarantor may default, causing a loss of the full principal amount of a security and any accrued interest. The degree of risk for a particular security may be reflected in its credit rating. There is the possibility that the credit rating of a fixed-income security may be downgraded after purchase, which may adversely affect the value of the security.
Below Investment Grade Securities Risk—Investments in fixed-income securities with lower ratings (commonly known as “junk bonds”) are sub-
| abfunds.com | AB TOTAL RETURN BOND PORTFOLIO | 81 | |
NOTES TO FINANCIAL STATEMENTS (continued)
ject to a higher probability that an issuer will default or fail to meet its payment obligations. These securities may be subject to greater price volatility due to such factors as specific corporate developments and negative perceptions of the junk bond market generally and may be more difficult to trade than other types of securities.
Duration Risk—Duration is a measure that relates the expected price volatility of a fixed-income security to changes in interest rates. The duration of a fixed-income security may be shorter than or equal to full maturity of a fixed-income security. Fixed-income securities with longer durations have more risk and will decrease in price as interest rates rise.
Inflation Risk—This is the risk that the value of assets or income from investments will be less in the future as inflation decreases the value of money. As inflation increases, the value of the Fund’s assets can decline as can the value of the Fund’s distributions. This risk is significantly greater for fixed-income securities with longer maturities. The Fund invests in inflation-indexed securities, the value of which may be vulnerable to changes in expectations of inflation or interest rates.
Foreign (Non-U.S.) Risk—Investments in securities of non-U.S. issuers may involve more risk than those of U.S. issuers. These securities may fluctuate more widely in price and may be more difficult to trade due to adverse market, economic, political, regulatory or other factors.
Emerging Market Risk—Investments in emerging market countries may have more risk because the markets are less developed and less liquid as well as being subject to increased economic, political, regulatory or other uncertainties.
Currency Risk—Fluctuations in currency exchange rates may negatively affect the value of the Fund’s investments or reduce its returns.
Mortgage-Related and/or Other Asset-Backed Securities Risk—Investments in mortgage-related and other asset-backed securities are subject to certain additional risks. The value of these securities may be particularly sensitive to changes in interest rates. These risks include “extension risk”, which is the risk that, in periods of rising interest rates, issuers may delay the payment of principal, and “prepayment risk”, which is the risk that in periods of falling interest rates, issuers may pay principal sooner than expected, exposing the Fund to a lower rate of return upon reinvestment of principal. Mortgage-backed securities offered by non-governmental issuers and other asset-backed securities may be subject to other risks, such as higher rates of default in the mortgages or assets backing the securities or risks associated with the nature and servicing of mortgages or assets backing the securities.
| 82 | AB TOTAL RETURN BOND PORTFOLIO | abfunds.com | |
NOTES TO FINANCIAL STATEMENTS (continued)
Leverage Risk—When the Fund borrows money or otherwise leverages its investments, its performance may be volatile because leverage tends to exaggerate the effect of any increase or decrease in the value of the Fund’s investments. The Fund may create leverage through the use of reverse repurchase arrangements, forward currency exchange contracts, forward commitments, dollar rolls or futures or by borrowing money. The use of other types of derivative instruments by the Fund, such as options and swaps, may also result in a form of leverage. Leverage may result in higher returns to the Fund than if the Fund were not leveraged, but may also adversely affect returns, particularly if the market is declining.
Derivatives Risk—The Fund may enter into derivative transactions such as forwards, options, futures and swaps. Derivatives may be illiquid, difficult to price, and leveraged so that small changes may produce disproportionate losses for the Fund, and subject to counterparty risk to a greater degree than more traditional investments. Derivatives may result in significant losses, including losses that are far greater than the value of the derivatives reflected on the statement of assets and liabilities.
Illiquid Investments Risk—Illiquid investments risk exists when certain investments become are or difficult to purchase or sell. Difficulty in selling such investments may result in sales at disadvantageous prices affecting the value of your investment in the Fund. Causes of illiquid investments risk may include low trading volumes, large positions and heavy redemptions of Fund shares. Illiquid investments risk may be higher in a rising interest rate environment, when the value and liquidity of fixed-income securities generally decline.
Active Trading Risk—The Fund expects to engage in active and frequent trading of its portfolio securities and its portfolio turnover rate may greatly exceed 100%. A higher rate of portfolio turnover increases transaction costs, which may negatively affect the Fund’s return. In addition, a high rate of portfolio turnover may result in substantial short-term gains, which may have adverse tax consequences for Fund shareholders.
LIBOR Risk—The Fund may invest in certain debt securities, derivatives or other financial instruments that utilize the London Interbank Offered Rate, or “LIBOR,” as a “benchmark” or “reference rate” for various interest rate calculations. In July 2017, the United Kingdom Financial Conduct Authority, which regulates LIBOR, announced a desire to phase out the use of LIBOR by the end of 2021. Although financial regulators and industry working groups have suggested alternative reference rates, such as European Interbank Offer Rate (“EURIBOR”), Sterling Overnight Interbank Average Rate (“SONIA”) and Secured Overnight Financing Rate (“SOFR”), global consensus on alternative rates is lacking and the process
| abfunds.com | AB TOTAL RETURN BOND PORTFOLIO | 83 | |
NOTES TO FINANCIAL STATEMENTS (continued)
for amending existing contracts or instruments to transition away from LIBOR remains unclear. The elimination of LIBOR or changes to other reference rates or any other changes or reforms to the determination or supervision of reference rates could have an adverse impact on the market for, or value of, any securities or payments linked to those reference rates, which may adversely affect the Fund’s performance and/or net asset value. Uncertainty and risk also remain regarding the willingness and ability of issuers and lenders to include revised provisions in new and existing contracts or instruments. Consequently, the transition away from LIBOR to other reference rates may lead to increased volatility and illiquidity in markets that are tied to LIBOR, fluctuations in values of LIBOR-related investments or investments in issuers that utilize LIBOR, increased difficulty in borrowing or refinancing and diminished effectiveness of hedging strategies, adversely affecting the Fund’s performance. Furthermore, the risks associated with the expected discontinuation of LIBOR and transition may be exacerbated if the work necessary to effect an orderly transition to an alternative reference rate is not completed in a timely manner. Because the usefulness of LIBOR as a benchmark could deteriorate during the transition period, these effects could occur prior to the end of 2021.
Indemnification Risk—In the ordinary course of business, the Fund enters into contracts that contain a variety of indemnifications. The Fund’s maximum exposure under these arrangements is unknown. However, the Fund has not had prior claims or losses pursuant to these indemnification provisions and expects the risk of loss thereunder to be remote. Therefore, the Fund has not accrued any liability in connection with these indemnification provisions.
Management Risk—The Fund is subject to management risk because it is an actively-managed investment fund. The Adviser will apply its investment techniques and risk analyses in making investment decisions, but there is no guarantee that its techniques will produce the intended results. Some of these techniques may incorporate, or rely upon, quantitative models, but there is no guarantee that these models will generate accurate forecasts, reduce risk or otherwise perform as expected.
NOTE G
Joint Credit Facility
A number of open-end mutual funds managed by the Adviser, including the Fund, participate in a $325 million revolving credit facility (the “Facility”) intended to provide short-term financing, if necessary, subject to certain restrictions in connection with abnormal redemption activity. Commitment fees related to the Facility are paid by the participating funds and are included in miscellaneous expenses in the statement of operations. The Fund did not utilize the Facility during the six months ended April 30, 2020.
| 84 | AB TOTAL RETURN BOND PORTFOLIO | abfunds.com | |
NOTES TO FINANCIAL STATEMENTS (continued)
NOTE H
Distributions to Shareholders
The tax character of distributions to be paid for the year ending October 31, 2020 will be determined at the end of the current fiscal year. The tax character of distributions paid during the fiscal years ended October 31, 2019 and October 31, 2018 were as follows:
| 2019 | 2018 | |||||||
Distributions paid from: | ||||||||
Ordinary income | $ | 11,729,904 | $ | 8,976,063 | ||||
|
|
|
| |||||
Total taxable distributions paid | $ | 11,729,904 | $ | 8,976,063 | ||||
|
|
|
| |||||
As of October 31, 2019, the components of accumulated earnings/(deficit) on a tax basis were as follows:
Undistributed ordinary income | $ | 249,796 | ||
Accumulated capital and other losses | (3,806,814 | )(a) | ||
Unrealized appreciation/(depreciation) | 11,082,995 | (b) | ||
|
| |||
Total accumulated earnings/(deficit) | $ | 7,525,977 | (c) | |
|
|
| (a) | As of October 31, 2019, the Fund had a net capital loss carryforward of $3,757,123. During the fiscal year, the Fund utilized $4,206,090 of capital loss carry forwards to offset current year net realized gains. As of October 31, 2019, the cumulative deferred loss on straddles was $49,691. |
| (b) | The differences between book-basis and tax-basis unrealized appreciation/(depreciation) are attributable primarily to the recognition for tax purposes of unrealized gains/losses on certain derivative instruments, the tax treatment of swaps, the tax deferral of losses on wash sales, and corporate restructuring. |
| (c) | The differences between book-basis and tax-basis components of accumulated earnings/(deficit) are attributable primarily to the accrual of foreign capital gains tax, the tax treatment of defaulted securities, and dividends payable. |
For tax purposes, net realized capital losses may be carried over to offset future capital gains, if any. Funds are permitted to carry forward realized capital losses for an indefinite period, and such losses will retain their character as either short-term or long-term capital losses. As of October 31, 2019, the Fund had a net short-term capital loss carryforward of $740,497 and a net long-term capital loss carryforward of $3,016,626 which may be carried forward for an indefinite period.
NOTE I
Recent Accounting Pronouncements
In March 2017, the Financial Accounting Standards Board issued an Accounting Standards Update, ASU 2017-08, Receivables—Nonrefundable Fees and Other Costs (Subtopic 310-20), Premium Amortization on Purchased Callable Debt Securities which amends the amortization period for certain purchased callable debt securities held at a premium, shortening such period to the earliest call date. ASU 2017-08 does not require any accounting change for debt securities held at a dis-
| abfunds.com | AB TOTAL RETURN BOND PORTFOLIO | 85 | |
NOTES TO FINANCIAL STATEMENTS (continued)
count; the discount continues to be amortized to maturity. ASU 2017-08 is effective for fiscal years, and interim periods within those fiscal years, beginning after December 15, 2018. The Fund has adopted ASU 2017-08, which did not have a material impact on the Fund’s financial position or the results of its operations, and had no impact on the Fund’s net assets.
NOTE J
Subsequent Events
Management has evaluated subsequent events for possible recognition or disclosure in the financial statements through the date the financial statements are issued. Management has determined that there are no material events that would require disclosure in the Fund’s financial statements through this date.
| 86 | AB TOTAL RETURN BOND PORTFOLIO | abfunds.com | |
FINANCIAL HIGHLIGHTS
Selected Data For A Share Of Capital Stock Outstanding Throughout Each Period
| Class A | ||||||||||||||||||||||||
Six Months (unaudited) | Year Ended October 31, | |||||||||||||||||||||||
| 2019 | 2018 | 2017 | 2016 | 2015 | ||||||||||||||||||||
|
| |||||||||||||||||||||||
Net asset value, beginning of period | $ 11.35 | $ 10.65 | $ 11.11 | $ 11.23 | $ 11.06 | $ 11.24 | ||||||||||||||||||
|
|
|
|
|
|
|
|
|
|
|
| |||||||||||||
Income From Investment Operations | ||||||||||||||||||||||||
Net investment income(a)(b) | .15 | .33 | .25 | .24 | † | .26 | .28 | |||||||||||||||||
Net realized and unrealized gain (loss) on investment and foreign currency transactions | (.44 | ) | .74 | (.44 | ) | (.06 | ) | .27 | (.12 | ) | ||||||||||||||
Contributions from Affiliates | – 0 | – | .00 | (c) | – 0 | – | .00 | (c) | – 0 | – | – 0 | – | ||||||||||||
|
|
|
|
|
|
|
|
|
|
|
| |||||||||||||
Net increase (decrease) in net asset value from operations | (.29 | ) | 1.07 | (.19 | ) | .18 | .53 | .16 | ||||||||||||||||
|
|
|
|
|
|
|
|
|
|
|
| |||||||||||||
Less: Dividends and Distributions | ||||||||||||||||||||||||
Dividends from net investment income | (.17 | ) | (.37 | ) | (.27 | ) | (.23 | ) | (.36 | ) | (.34 | ) | ||||||||||||
Distributions from net realized gain on investment transactions | – 0 | – | – 0 | – | – 0 | – | (.04 | ) | – 0 | – | – 0 | – | ||||||||||||
Return of capital | – 0 | – | – 0 | – | – 0 | – | (.03 | ) | – 0 | – | – 0 | – | ||||||||||||
|
|
|
|
|
|
|
|
|
|
|
| |||||||||||||
Total dividends and distributions | (.17 | ) | (.37 | ) | (.27 | ) | (.30 | ) | (.36 | ) | (.34 | ) | ||||||||||||
|
|
|
|
|
|
|
|
|
|
|
| |||||||||||||
Net asset value, end of period | $ 10.89 | $ 11.35 | $ 10.65 | $ 11.11 | $ 11.23 | $ 11.06 | ||||||||||||||||||
|
| |||||||||||||||||||||||
Total Return | ||||||||||||||||||||||||
Total investment return based on net asset value(d) | (2.54 | )% | 10.23 | % | (1.75 | ) % | 1.68 | % † | 4.93 | % | 1.45 | % | ||||||||||||
Ratios/Supplemental Data | ||||||||||||||||||||||||
Net assets, end of period (000’s omitted) | $209,064 | $221,033 | $216,950 | $240,386 | $245,683 | $252,965 | ||||||||||||||||||
Ratio to average net assets of: | ||||||||||||||||||||||||
Expenses, net of waivers/reimbursements | .77 | %^ | .77 | % | .77 | % | .79 | % | .85 | % | .88 | % | ||||||||||||
Expenses, before waivers/reimbursements | 1.00 | %^ | 1.04 | % | 1.01 | % | 1.03 | % | 1.03 | % | 1.06 | % | ||||||||||||
Net investment income(b) | 2.60 | %^ | 2.98 | % | 2.29 | % | 2.16 | %† | 2.35 | % | 2.51 | % | ||||||||||||
Portfolio turnover rate** | 42 | % | 74 | % | 195 | % | 209 | % | 128 | % | 198 | % | ||||||||||||
See footnote summary on page 94.
| abfunds.com | AB TOTAL RETURN BOND PORTFOLIO | 87 | |
FINANCIAL HIGHLIGHTS (continued)
Selected Data For A Share Of Capital Stock Outstanding Throughout Each Period
| Class C | ||||||||||||||||||||||||
Six Months (unaudited) | Year Ended October 31, | |||||||||||||||||||||||
| 2019 | 2018 | 2017 | 2016 | 2015 | ||||||||||||||||||||
|
| |||||||||||||||||||||||
Net asset value, | $ 11.32 | $ 10.63 | $ 11.08 | $ 11.21 | $ 11.04 | $ 11.22 | ||||||||||||||||||
|
|
|
|
|
|
|
|
|
|
|
| |||||||||||||
Income From Investment Operations | ||||||||||||||||||||||||
Net investment income(a)(b) | .10 | .25 | .17 | .15 | † | .18 | .20 | |||||||||||||||||
Net realized and unrealized gain (loss) on investment and foreign currency transactions | (.43 | ) | .73 | (.43 | ) | (.06 | ) | .27 | (.12 | ) | ||||||||||||||
Contributions from Affiliates | – 0 | – | .00 | (c) | – 0 | – | .00 | (c) | – 0 | – | – 0 | – | ||||||||||||
|
|
|
|
|
|
|
|
|
|
|
| |||||||||||||
Net increase (decrease) in net asset value from operations | (.33 | ) | .98 | (.26 | ) | .09 | .45 | .08 | ||||||||||||||||
|
|
|
|
|
|
|
|
|
|
|
| |||||||||||||
Less: Dividends and Distributions | ||||||||||||||||||||||||
Dividends from net investment income | (.12 | ) | (.29 | ) | (.19 | ) | (.16 | ) | (.28 | ) | (.26 | ) | ||||||||||||
Distributions from net realized gain on investment transactions | – 0 | – | – 0 | – | – 0 | – | (.04 | ) | – 0 | – | – 0 | – | ||||||||||||
Return of capital | – 0 | – | – 0 | – | – 0 | – | (.02 | ) | – 0 | – | – 0 | – | ||||||||||||
|
|
|
|
|
|
|
|
|
|
|
| |||||||||||||
Total dividends and distributions | (.12 | ) | (.29 | ) | (.19 | ) | (.22 | ) | (.28 | ) | (.26 | ) | ||||||||||||
|
|
|
|
|
|
|
|
|
|
|
| |||||||||||||
Net asset value, end of period | $ 10.87 | $ 11.32 | $ 10.63 | $ 11.08 | $ 11.21 | $ 11.04 | ||||||||||||||||||
|
| |||||||||||||||||||||||
Total Return | ||||||||||||||||||||||||
Total investment return based on net asset value(d) | (2.82 | )% | 9.33 | % | (2.40 | )% | .83 | %† | 4.16 | % | .73 | % | ||||||||||||
Ratios/Supplemental Data | ||||||||||||||||||||||||
Net assets, end of period (000’s omitted) | $11,098 | $10,564 | $11,334 | $15,676 | $41,886 | $40,928 | ||||||||||||||||||
Ratio to average net assets of: | ||||||||||||||||||||||||
Expenses, net of waivers/reimbursements | 1.52 | %^ | 1.52 | % | 1.52 | % | 1.55 | % | 1.60 | % | 1.60 | % | ||||||||||||
Expenses, before waivers/reimbursements | 1.75 | %^�� | 1.79 | % | 1.76 | % | 1.78 | % | 1.78 | % | 1.78 | % | ||||||||||||
Net investment income(b) | 1.86 | %^ | 2.24 | % | 1.54 | % | 1.38 | %† | 1.60 | % | 1.79 | % | ||||||||||||
Portfolio turnover rate** | 42 | % | 74 | % | 195 | % | 209 | % | 128 | % | 198 | % | ||||||||||||
See footnote summary on page 94.
| 88 | AB TOTAL RETURN BOND PORTFOLIO | abfunds.com | |
FINANCIAL HIGHLIGHTS (continued)
Selected Data For A Share Of Capital Stock Outstanding Throughout Each Period
| Advisor Class | ||||||||||||||||||||||||
Six Months (unaudited) | Year Ended October 31, | |||||||||||||||||||||||
| 2019 | 2018 | 2017 | 2016 | 2015 | ||||||||||||||||||||
|
| |||||||||||||||||||||||
Net asset value, beginning of period | $ 11.35 | $ 10.65 | $ 11.11 | $ 11.24 | $ 11.06 | $ 11.24 | ||||||||||||||||||
|
|
|
|
|
|
|
|
|
|
|
| |||||||||||||
Income From Investment Operations | ||||||||||||||||||||||||
Net investment income(a)(b) | .16 | .35 | .28 | .27 | † | .29 | .31 | |||||||||||||||||
Net realized and unrealized gain (loss) on investment and foreign currency transactions | (.43 | ) | .75 | (.44 | ) | (.07 | ) | .28 | (.12 | ) | ||||||||||||||
Contributions from Affiliates | – 0 | – | .00 | (c) | – 0 | – | .00 | (c) | – 0 | – | – 0 | – | ||||||||||||
|
|
|
|
|
|
|
|
|
|
|
| |||||||||||||
Net increase (decrease) in net asset value from operations | (.27 | ) | 1.10 | (.16 | ) | .20 | .57 | .19 | ||||||||||||||||
|
|
|
|
|
|
|
|
|
|
|
| |||||||||||||
Less: Dividends and Distributions | ||||||||||||||||||||||||
Dividends from net investment income | (.18 | ) | (.40 | ) | (.30 | ) | (.25 | ) | (.39 | ) | (.37 | ) | ||||||||||||
Distributions from net realized gain on investment transactions | – 0 | – | – 0 | – | – 0 | – | (.04 | ) | – 0 | – | – 0 | – | ||||||||||||
Return of capital | – 0 | – | – 0 | – | – 0 | – | (.04 | ) | – 0 | – | – 0 | – | ||||||||||||
|
|
|
|
|
|
|
|
|
|
|
| |||||||||||||
Total dividends and distributions | (.18 | ) | (.40 | ) | (.30 | ) | (.33 | ) | (.39 | ) | (.37 | ) | ||||||||||||
|
|
|
|
|
|
|
|
|
|
|
| |||||||||||||
Net asset value, end of period | $ 10.90 | $ 11.35 | $ 10.65 | $ 11.11 | $ 11.24 | $ 11.06 | ||||||||||||||||||
|
| |||||||||||||||||||||||
Total Return | ||||||||||||||||||||||||
Total investment return based on net asset value(d) | (2.33 | )% | 10.50 | % | (1.50 | )% | 1.84 | %† | 5.29 | % | 1.73 | % | ||||||||||||
Ratios/Supplemental Data | ||||||||||||||||||||||||
Net assets, end of period (000’s omitted) | $118,569 | $104,850 | $76,406 | $67,357 | $56,068 | $22,705 | ||||||||||||||||||
Ratio to average net assets of: | ||||||||||||||||||||||||
Expenses, net of waivers/reimbursements | .52 | %^ | .52 | % | .52 | % | .54 | % | .60 | % | .60 | % | ||||||||||||
Expenses, before waivers/reimbursements | .75 | %^ | .79 | % | .76 | % | .78 | % | .78 | % | .77 | % | ||||||||||||
Net investment income(b) | 2.84 | %^ | 3.21 | % | 2.55 | % | 2.41 | %† | 2.60 | % | 2.78 | % | ||||||||||||
Portfolio turnover rate** | 42 | % | 74 | % | 195 | % | 209 | % | 128 | % | 198 | % | ||||||||||||
See footnote summary on page 94.
| abfunds.com | AB TOTAL RETURN BOND PORTFOLIO | 89 | |
FINANCIAL HIGHLIGHTS (continued)
Selected Data For A Share Of Capital Stock Outstanding Throughout Each Period
| Class R | ||||||||||||||||||||||||
Six Months (unaudited) | Year Ended October 31, | |||||||||||||||||||||||
| 2019 | 2018 | 2017 | 2016 | 2015 | ||||||||||||||||||||
|
| |||||||||||||||||||||||
Net asset value, beginning of period | $ 11.34 | $ 10.65 | $ 11.10 | $ 11.23 | $ 11.06 | $ 11.24 | ||||||||||||||||||
|
|
|
|
|
|
|
|
|
|
|
| |||||||||||||
Income From Investment Operations | ||||||||||||||||||||||||
Net investment income(a)(b) | .13 | .30 | .23 | .21 | † | .23 | .26 | |||||||||||||||||
Net realized and unrealized gain (loss) on investment and foreign currency transactions | (.43 | ) | .74 | (.44 | ) | (.06 | ) | .28 | (.12 | ) | ||||||||||||||
Contributions from Affiliates | – 0 | – | .00 | (c) | – 0 | – | .00 | (c) | – 0 | – | – 0 | – | ||||||||||||
|
|
|
|
|
|
|
|
|
|
|
| |||||||||||||
Net increase (decrease) in net asset value from operations | (.30 | ) | 1.04 | (.21 | ) | .15 | .51 | .14 | ||||||||||||||||
|
|
|
|
|
|
|
|
|
|
|
| |||||||||||||
Less: Dividends and Distributions | ||||||||||||||||||||||||
Dividends from net investment income | (.15 | ) | (.35 | ) | (.24 | ) | (.21 | ) | (.34 | ) | (.32 | ) | ||||||||||||
Distributions from net realized gain on investment transactions | – 0 | – | – 0 | – | – 0 | – | (.04 | ) | – 0 | – | – 0 | – | ||||||||||||
Return of capital | – 0 | – | – 0 | – | – 0 | – | (.03 | ) | – 0 | – | – 0 | – | ||||||||||||
|
|
|
|
|
|
|
|
|
|
|
| |||||||||||||
Total dividends and distributions | (.15 | ) | (.35 | ) | (.24 | ) | (.28 | ) | (.34 | ) | (.32 | ) | ||||||||||||
|
|
|
|
|
|
|
|
|
|
|
| |||||||||||||
Net asset value, end of period | $ 10.89 | $ 11.34 | $ 10.65 | $ 11.10 | $ 11.23 | $ 11.06 | ||||||||||||||||||
|
| |||||||||||||||||||||||
Total Return | ||||||||||||||||||||||||
Total investment return based on net asset value(d) | (2.58 | )% | 9.86 | % | (1.90 | )% | 1.34 | %† | 4.67 | % | 1.23 | % | ||||||||||||
Ratios/Supplemental Data | ||||||||||||||||||||||||
Net assets, end of period (000’s omitted) | $2,117 | $3,298 | $2,814 | $2,699 | $3,023 | $2,936 | ||||||||||||||||||
Ratio to average net assets of: | ||||||||||||||||||||||||
Expenses, net of waivers/reimbursements | 1.02 | %^ | 1.02 | % | 1.02 | % | 1.04 | % | 1.10 | % | 1.10 | % | ||||||||||||
Expenses, before waivers/reimbursements | 1.36 | %^ | 1.42 | % | 1.35 | % | 1.39 | % | 1.38 | % | 1.38 | % | ||||||||||||
Net investment income(b) | 2.36 | %^ | 2.73 | % | 2.07 | % | 1.91 | %† | 2.10 | % | 2.29 | % | ||||||||||||
Portfolio turnover rate** | 42 | % | 74 | % | 195 | % | 209 | % | 128 | % | 198 | % | ||||||||||||
See footnote summary on page 94
| 90 | AB TOTAL RETURN BOND PORTFOLIO | abfunds.com | |
FINANCIAL HIGHLIGHTS (continued)
Selected Data For A Share Of Capital Stock Outstanding Throughout Each Period
| Class K | ||||||||||||||||||||||||
Six Months (unaudited) | Year Ended October 31, | |||||||||||||||||||||||
| 2019 | 2018 | 2017 | 2016 | 2015 | ||||||||||||||||||||
|
| |||||||||||||||||||||||
Net asset value, beginning of period | $ 11.36 | $ 10.66 | $ 11.11 | $ 11.24 | $ 11.07 | $ 11.24 | ||||||||||||||||||
|
|
|
|
|
|
|
|
|
|
|
| |||||||||||||
Income From Investment Operations | ||||||||||||||||||||||||
Net investment income(a)(b) | .15 | .33 | .25 | .24 | † | .26 | .28 | |||||||||||||||||
Net realized and unrealized gain (loss) on investment and foreign currency transactions | (.44 | ) | .74 | (.43 | ) | (.07 | ) | .27 | (.10 | ) | ||||||||||||||
Contributions from Affiliates | – 0 | – | .00 | (c) | – 0 | – | .00 | (c) | – 0 | – | – 0 | – | ||||||||||||
|
|
|
|
|
|
|
|
|
|
|
| |||||||||||||
Net increase (decrease) in net asset value from operations | (.29 | ) | 1.07 | (.18 | ) | .17 | .53 | .18 | ||||||||||||||||
|
|
|
|
|
|
|
|
|
|
|
| |||||||||||||
Less: Dividends and Distributions | ||||||||||||||||||||||||
Dividends from net investment income | (.17 | ) | (.37 | ) | (.27 | ) | (.23 | ) | (.36 | ) | (.35 | ) | ||||||||||||
Distributions from net realized gain on investment transactions | – 0 | – | – 0 | – | – 0 | – | (.04 | ) | – 0 | – | – 0 | – | ||||||||||||
Return of capital | – 0 | – | – 0 | – | – 0 | – | (.03 | ) | – 0 | – | – 0 | – | ||||||||||||
|
|
|
|
|
|
|
|
|
|
|
| |||||||||||||
Total dividends and distributions | (.17 | ) | (.37 | ) | (.27 | ) | (.30 | ) | (.36 | ) | (.35 | ) | ||||||||||||
|
|
|
|
|
|
|
|
|
|
|
| |||||||||||||
Net asset value, end of period | $ 10.90 | $ 11.36 | $ 10.66 | $ 11.11 | $ 11.24 | $ 11.07 | ||||||||||||||||||
|
| |||||||||||||||||||||||
Total Return | ||||||||||||||||||||||||
Total investment return based on net asset value(d) | (2.54 | )% | 10.22 | % | (1.66 | )% | 1.59 | %† | 4.93 | % | 1.57 | % | ||||||||||||
Ratios/Supplemental Data | ||||||||||||||||||||||||
Net assets, end of period (000’s omitted) | $5,802 | $7,444 | $7,863 | $5,876 | $5,706 | $3,922 | ||||||||||||||||||
Ratio to average net assets of: | ||||||||||||||||||||||||
Expenses, net of waivers/reimbursements | .77 | %^ | .77 | % | .77 | % | .79 | % | .85 | % | .85 | % | ||||||||||||
Expenses, before waivers/reimbursements | 1.07 | %^ | 1.10 | % | 1.08 | % | 1.09 | % | 1.09 | % | 1.08 | % | ||||||||||||
Net investment income(b) | 2.60 | %^ | 2.98 | % | 2.32 | % | 2.15 | %† | 2.34 | % | 2.53 | % | ||||||||||||
Portfolio turnover rate** | 42 | % | 74 | % | 195 | % | 209 | % | 128 | % | 198 | % | ||||||||||||
See footnote summary on page 94.
| abfunds.com | AB TOTAL RETURN BOND PORTFOLIO | 91 | |
FINANCIAL HIGHLIGHTS (continued)
Selected Data For A Share Of Capital Stock Outstanding Throughout Each Period
| Class I | ||||||||||||||||||||||||
| Six Months Ended April 30, 2020 (unaudited) | Year Ended October 31, | |||||||||||||||||||||||
| 2019 | 2018 | 2017 | 2016 | 2015 | ||||||||||||||||||||
|
| |||||||||||||||||||||||
Net asset value, beginning of period | $ 11.36 | $ 10.66 | $ 11.12 | $ 11.24 | $ 11.07 | $ 11.25 | ||||||||||||||||||
|
|
|
|
|
|
|
|
|
|
|
| |||||||||||||
Income From Investment Operations | ||||||||||||||||||||||||
Net investment income(a)(b) | .16 | .36 | .28 | .27 | † | .28 | .31 | |||||||||||||||||
Net realized and unrealized gain (loss) on investment and foreign currency transactions | (.43 | ) | .74 | (.44 | ) | (.06 | ) | .28 | (.12 | ) | ||||||||||||||
Contributions from Affiliates | – 0 | – | .00 | (c) | – 0 | – | .00 | (c) | – 0 | – | – 0 | – | ||||||||||||
|
|
|
|
|
|
|
|
|
|
|
| |||||||||||||
Net increase (decrease) in net asset value from operations | (.27 | ) | 1.10 | (.16 | ) | .21 | .56 | .19 | ||||||||||||||||
|
|
|
|
|
|
|
|
|
|
|
| |||||||||||||
Less: Dividends and Distributions | ||||||||||||||||||||||||
Dividends from net investment income | (.18 | ) | (.40 | ) | (.30 | ) | (.25 | ) | (.39 | ) | (.37 | ) | ||||||||||||
Distributions from net realized gain on investment transactions | – 0 | – | – 0 | – | – 0 | – | (.04 | ) | – 0 | – | – 0 | – | ||||||||||||
Return of capital | – 0 | – | – 0 | – | – 0 | – | (.04 | ) | – 0 | – | – 0 | – | ||||||||||||
|
|
|
|
|
|
|
|
|
|
|
| |||||||||||||
Total dividends and distributions | (.18 | ) | (.40 | ) | (.30 | ) | (.33 | ) | (.39 | ) | (.37 | ) | ||||||||||||
|
|
|
|
|
|
|
|
|
|
|
| |||||||||||||
Net asset value, end of period | $ 10.91 | $ 11.36 | $ 10.66 | $ 11.12 | $ 11.24 | $ 11.07 | ||||||||||||||||||
|
| |||||||||||||||||||||||
Total Return | ||||||||||||||||||||||||
Total investment return based on net asset value(d) | (2.33 | )% | 10.50 | % | (1.50 | )% | 1.93 | %† | 5.20 | % | 1.73 | % | ||||||||||||
Ratios/Supplemental Data | ||||||||||||||||||||||||
Net assets, end of period (000’s omitted) | $2,213 | $4,107 | $2,894 | $2,729 | $2,613 | $511 | ||||||||||||||||||
Ratio to average net assets of: | ||||||||||||||||||||||||
Expenses, net of waivers/reimbursements | .52 | %^ | .52 | % | .52 | % | .54 | % | .60 | % | .60 | % | ||||||||||||
Expenses, before waivers/reimbursements | .71 | %^ | .75 | % | .72 | % | .75 | % | .76 | % | .75 | % | ||||||||||||
Net investment income(b) | 2.87 | %^ | 3.22 | % | 2.57 | % | 2.41 | %† | 2.56 | % | 2.74 | % | ||||||||||||
Portfolio turnover rate** | 42 | % | 74 | % | 195 | % | 209 | % | 128 | % | 198 | % | ||||||||||||
See footnote summary on page 94.
| 92 | AB TOTAL RETURN BOND PORTFOLIO | abfunds.com | |
FINANCIAL HIGHLIGHTS (continued)
Selected Data For A Share Of Capital Stock Outstanding Throughout Each Period
| Class Z | ||||||||||||||||||||||||
Six Months (unaudited) | Year Ended October 31, | |||||||||||||||||||||||
| 2019 | 2018 | 2017 | 2016 | 2015 | ||||||||||||||||||||
|
| |||||||||||||||||||||||
Net asset value, beginning of period | $ 11.37 | $ 10.67 | $ 11.13 | $ 11.26 | $ 11.08 | $ 11.26 | ||||||||||||||||||
|
|
|
|
|
|
|
|
|
|
|
| |||||||||||||
Income From Investment Operations | ||||||||||||||||||||||||
Net investment income(a)(b) | .16 | .36 | .27 | .27 | † | .28 | .32 | |||||||||||||||||
Net realized and unrealized gain (loss) on investment and foreign currency transactions | (.44 | ) | .74 | (.43 | ) | (.07 | ) | .29 | (.13 | ) | ||||||||||||||
Contributions from Affiliates | – 0 | – | .00 | (c) | – 0 | – | .00 | (c) | – 0 | – | – 0 | – | ||||||||||||
|
|
|
|
|
|
|
|
|
|
|
| |||||||||||||
Net increase (decrease) in net asset value from operations | (.28 | ) | 1.10 | (.16 | ) | .20 | .57 | .19 | ||||||||||||||||
|
|
|
|
|
|
|
|
|
|
|
| |||||||||||||
Less: Dividends | ||||||||||||||||||||||||
Dividends from net investment income | (.18 | ) | (.40 | ) | (.30 | ) | (.25 | ) | (.39 | ) | (.37 | ) | ||||||||||||
Distributions from net realized gain on investment transactions | – 0 | – | – 0 | – | – 0 | – | (.04 | ) | – 0 | – | – 0 | – | ||||||||||||
Return of capital | – 0 | – | – 0 | – | – 0 | – | (.04 | ) | – 0 | – | – 0 | – | ||||||||||||
|
|
|
|
|
|
|
|
|
|
|
| |||||||||||||
Total distributions | (.18 | ) | (.40 | ) | (.30 | ) | (.33 | ) | (.39 | ) | (.37 | ) | ||||||||||||
|
|
|
|
|
|
|
|
|
|
|
| |||||||||||||
Net asset value, end of period | $ 10.91 | $ 11.37 | $ 10.67 | $ 11.13 | $ 11.26 | $ 11.08 | ||||||||||||||||||
|
| |||||||||||||||||||||||
Total Return | ||||||||||||||||||||||||
Total investment return based on net asset value(d) | (2.41 | )% | 10.48 | % | (1.49 | )% | 1.84 | %† | 5.28 | % | 1.72 | % | ||||||||||||
Ratios/Supplemental Data | ||||||||||||||||||||||||
Net assets, end of period (000’s omitted) | $8,727 | $8,059 | $7,274 | $24,653 | $18,134 | $4,851 | ||||||||||||||||||
Ratio to average net assets of: | ||||||||||||||||||||||||
Expenses, net of waivers/reimbursements | .52 | %^ | .52 | % | .52 | % | .54 | % | .60 | % | .60 | % | ||||||||||||
Expenses, before waivers/reimbursements | .64 | %^ | .68 | % | .64 | % | .66 | % | .66 | % | .71 | % | ||||||||||||
Net investment income(b) | 2.84 | %^ | 3.22 | % | 2.48 | % | 2.42 | % | 2.52 | % | 2.91 | % | ||||||||||||
Portfolio turnover rate** | 42 | % | 74 | % | 195 | % | 209 | % | 128 | % | 198 | % | ||||||||||||
See footnote summary on page 94.
| abfunds.com | AB TOTAL RETURN BOND PORTFOLIO | 93 | |
FINANCIAL HIGHLIGHTS (continued)
Selected Data For A Share Of Capital Stock Outstanding Throughout Each Period
| (a) | Based on average shares outstanding. |
| (b) | Net of expenses waived/reimbursed by the Adviser. |
| (c) | Amount is less than $.005. |
| (d) | Total investment return is calculated assuming an initial investment made at the net asset value at the beginning of the period, reinvestment of all dividends and distributions at net asset value during the period, and redemption on the last day of the period. Initial sales charges or contingent deferred sales charges are not reflected in the calculation of total investment return. Total return does not reflect the deduction of taxes that a shareholder would pay on portfolio distributions or the redemption of portfolio shares. Total investment return calculated for a period of less than one year is not annualized. |
| † | For the year ended October 31, 2017, the amount includes a refund for overbilling of prior years’ custody out of pocket fees as follows: |
| Net Investment Income Per Share | Net Investment Income Ratio | Total Return | ||
| $.002 | .02% | .02% |
| ** | The Fund accounts for dollar roll transactions as purchases and sales. |
| ^ | Annualized. |
See notes to financial statements.
| 94 | AB TOTAL RETURN BOND PORTFOLIO | abfunds.com | |
BOARD OF DIRECTORS
Marshall C. Turner, Jr.(1), Chairman Jorge A. Bermudez(1) Michael J. Downey(1) Nancy P. Jacklin(1) | Robert M. Keith, President and Chief Executive Officer Jeanette Loeb(1) Carol C. McMullen(1) Garry L. Moody(1) Earl D. Weiner(1) |
OFFICERS
Michael Canter(2), Vice President Shawn E. Keegan(2), Vice President Douglas J. Peebles(2),* Vice President Janaki Rao(2), Vice President Dimitri Silva(2), Vice President | Emilie D. Wrapp, Secretary Michael B. Reyes, Senior Analyst Joseph J. Mantineo, Treasurer and Chief Financial Officer Phyllis J. Clarke, Controller Vincent S. Noto, Chief Compliance Officer |
Custodian and Accounting Agent State Street Bank and Trust Company State Street Corporation CCB/5 1 Iron Street Boston, MA 02210
Principal Underwriter AllianceBernstein Investments, Inc. 1345 Avenue of the Americas New York, NY 10105
Transfer Agent AllianceBernstein Investor Services, Inc. P.O. Box 786003 San Antonio, TX 78278-6003 Toll-Free (800) 221-5672 | Independent Registered Public Ernst & Young LLP 5 Times Square New York, NY 10036
Legal Counsel Seward & Kissel LLP One Battery Park Plaza New York, NY 10004 |
| 1 | Member of the Audit Committee, the Governance and Nominating Committee, and the Independent Directors Committee. |
| 2 | The management of, and investment decisions for, the Fund’s portfolio are made by the Adviser’s U.S. Investment Grade Core Fixed Income Team. Messrs. Canter, Keegan, Peebles, Rao and Silva are the investment professionals with the most significant responsibility for the day-to-day management of the Portfolio’s portfolio. |
| * | Mr. Peebles is expected to retire from the Adviser effective December 30, 2020. |
| abfunds.com | AB TOTAL RETURN BOND PORTFOLIO | 95 | |
Operation and Effectiveness of the Fund’s Liquidity Risk Management Program:
In October 2016, the Securities and Exchange Commission (“SEC”) adopted the open-end fund liquidity rule (the “Liquidity Rule”). In June 2018 the SEC adopted a requirement that funds disclose information about the operation and effectiveness of their Liquidity Risk Management Program (“LRMP”) in their reports to shareholders.
One of the requirements of the Liquidity Rule is for the Fund to designate an Administrator of the Fund’s Liquidity Risk Management Program. The Administrator of the Fund’s LRMP is AllianceBernstein L.P., the Fund’s investment adviser (the “Adviser”). The Adviser has delegated the responsibility to its Liquidity Risk Management Committee (the “Committee”). Another requirement of the Liquidity Rule is for the Fund’s Board of Directors (the “Fund Board”) to receive an annual written report from the Administrator of the LRMP, which addresses the operation of the Fund’s LRMP and assesses its adequacy and effectiveness. The Adviser provided the Fund’s Board with such annual report during the first quarter of 2020, which covered the period December 1, 2018 through December 31, 2019 (the “Program Reporting Period”).
The LRMP’s principal objectives include supporting the Fund’s compliance with limits on investments in illiquid assets and mitigating the risk that the Fund will be unable to meet its redemption obligations in a timely manner. Pursuant to the LRMP, the Fund classifies the liquidity of its portfolio investments into one of the four categories defined by the SEC: Highly Liquid, Moderately Liquid, Less Liquid, and Illiquid. These classifications are reported to the SEC on Form N-PORT.
During the Program Reporting Period, the Committee reviewed whether the Fund’s strategy is appropriate for an open-end structure, taking into account any holdings of less liquid and illiquid assets. The Committee also performed an analysis to determine whether the Fund is required to maintain a Highly Liquid Investment Minimum (“HLIM”). If the Fund participated in derivative transactions, the exposure from such transactions were considered in the LRMP. The Committee also incorporated the following information when determining the Fund’s reasonably anticipated trading size for purposes of liquidity monitoring: historical net redemption activity, a Fund’s concentration in an issuer, shareholder concentration, investment performance, total net assets, and distribution channels.
The Adviser informed the Fund Board that the Committee believes the Fund’s LRMP is adequately designed, has been implemented as intended, and has operated effectively since its inception. No material exceptions have been noted since the implementation of the LRMP, and there were no liquidity events that impacted the Fund or its ability to timely meet redemptions during the Program Reporting Period.
| 96 | AB TOTAL RETURN BOND PORTFOLIO | abfunds.com | |
Information Regarding the Review and Approval of the Fund’s Advisory Agreement
The disinterested directors (the “directors”) of AB Bond Fund, Inc. (the “Company”) unanimously approved the continuance of the Company’s Advisory Agreement with the Adviser in respect of AB Total Return Bond Portfolio (formerly AB Intermediate Bond Portfolio) (the “Fund”) at a meeting held on November 4-6, 2019 (the “Meeting”.)*
Prior to approval of the continuance of the Advisory Agreement, the directors had requested from the Adviser, and received and evaluated, extensive materials. They reviewed the proposed continuance of the Advisory Agreement with the Adviser and with experienced counsel who are independent of the Adviser, who advised on the relevant legal standards. The directors also reviewed additional materials, including comparative analytical data prepared by the Senior Analyst for the Fund. The directors also discussed the proposed continuance in private sessions with counsel.
The directors considered their knowledge of the nature and quality of the services provided by the Adviser to the Fund gained from their experience as directors or trustees of most of the registered investment companies advised by the Adviser, their overall confidence in the Adviser’s integrity and competence they have gained from that experience, the Adviser’s initiative in identifying and raising potential issues with the directors and its responsiveness, frankness and attention to concerns raised by the directors in the past, including the Adviser’s willingness to consider and implement organizational and operational changes designed to improve investment results and the services provided to the AB Funds. The directors noted that they have four regular meetings each year, at each of which they review extensive materials and information from the Adviser, including information on the investment performance of the Fund and the underlying fund advised by the Adviser in which the Fund invests.
The directors also considered all factors they believed relevant, including the specific matters discussed below. During the course of their deliberations, the directors evaluated, among other things, the reasonableness of the advisory fee. The directors did not identify any particular information that was all-important or controlling, and different directors may have attributed different weights to the various factors. The directors determined that the selection of the Adviser to manage the Fund and the overall arrangements between the Fund and the Adviser, as provided in the Advisory Agreement, including the advisory fee, were fair and reasonable in light of the services performed, expenses incurred and such other matters as the directors considered relevant in the exercise of their business
| * | Following transactions completed on November 13, 2019 that may have been deemed to have been an “assignment” causing termination of the Fund’s investment advisory agreement, a new investment advisory agreement, having the same terms as the prior one, was entered into by the Fund and the Adviser. |
| abfunds.com | AB TOTAL RETURN BOND PORTFOLIO | 97 | |
judgment. The material factors and conclusions that formed the basis for the directors’ determinations included the following:
Nature, Extent and Quality of Services Provided
The directors considered the scope and quality of services provided by the Adviser under the Advisory Agreement, including the quality of the investment research capabilities of the Adviser and the other resources it has dedicated to performing services for the Fund. The directors noted that the Adviser from time to time reviews the Fund’s investment strategies and from time to time proposes changes intended to improve the Fund’s relative or absolute performance for the directors’ consideration. They also noted the professional experience and qualifications of the Fund’s portfolio management team and other senior personnel of the Adviser. The directors also considered that the Advisory Agreement provides that the Fund will reimburse the Adviser for the cost to it of providing certain clerical, accounting, administrative and other services to the Fund by employees of the Adviser or its affiliates. Requests for these reimbursements are made on a quarterly basis and subject to approval by the directors. The directors noted that the methodology used to determine the reimbursement amounts had been reviewed by an independent consultant retained by the Fund’s former Senior Officer/Independent Compliance Officer. The Adviser did not request any reimbursements from the Fund in the Fund’s latest fiscal year. The quality of administrative and other services, including the Adviser’s role in coordinating the activities of the Fund’s other service providers, also was considered. The directors concluded that, overall, they were satisfied with the nature, extent and quality of services provided to the Fund under the Advisory Agreement.
Costs of Services Provided and Profitability
The directors reviewed a schedule of the revenues and expenses and related notes indicating the profitability of the Fund to the Adviser for calendar years 2017 and 2018 that had been prepared with an expense allocation methodology arrived at in consultation with an independent consultant retained by the Fund’s former Senior Officer/Independent Compliance Officer. The directors noted the assumptions and methods of allocation used by the Adviser in preparing fund-specific profitability data and understood that there are a number of potentially acceptable allocation methodologies for information of this type. The directors noted that the profitability information reflected all revenues and expenses of the Adviser’s relationship with the Fund, including those relating to its subsidiaries that provide transfer agency and distribution services to the Fund. The directors recognized that it is difficult to make comparisons of the profitability of the Advisory Agreement with the profitability of fund advisory contracts for unaffiliated funds because comparative information is not generally publicly available and is affected by numerous factors. The directors focused on the profitability of the Adviser’s relationship with the Fund before taxes and
| 98 | AB TOTAL RETURN BOND PORTFOLIO | abfunds.com | |
distribution expenses. The directors concluded that the Adviser’s level of profitability from its relationship with the Fund was not unreasonable.
Fall-Out Benefits
The directors considered the other benefits to the Adviser and its affiliates from their relationships with the Fund and the underlying fund advised by the Adviser in which the Fund invests, including, but not limited to, benefits relating to 12b-1 fees and sales charges received by the Fund’s principal underwriter (which is a wholly owned subsidiary of the Adviser) in respect of certain classes of the Fund’s shares; and transfer agency fees paid by the Fund to a wholly owned subsidiary of the Adviser. The directors recognized that the Adviser’s profitability would be somewhat lower without these benefits. The directors understood that the Adviser also might derive reputational and other benefits from its association with the Fund.
Investment Results
In addition to the information reviewed by the directors in connection with the Meeting, the directors receive detailed performance information for the Fund at each regular Board meeting during the year.
At the Meeting, the directors reviewed performance information prepared by an independent service provider (the “15(c) service provider”), showing the performance of the Class A Shares of the Fund against a group of similar funds (“peer group”) and a larger group of similar funds (“peer universe”), each selected by the 15(c) service provider, and information prepared by the Adviser showing performance of the Class A Shares against a broad-based securities market index, in each case for the 1-, 3-, 5- and 10-year periods ended July 31, 2019 and (in the case of comparisons with the broad-based securities market index) for the period from inception. Based on their review, the directors concluded that the Fund’s investment performance was acceptable.
Advisory Fees and Other Expenses
The directors considered the advisory fee rate payable by the Fund to the Adviser and information prepared by the 15(c) service provider concerning advisory fee rates payable by other funds in the same category as the Fund. The directors recognized that it is difficult to make comparisons of advisory fees because there are variations in the services that are included in the fees payable by other funds. The directors compared the Fund’s contractual effective advisory fee rate with a peer group median and took into account the impact on the advisory fee rate of the administrative expense reimbursement paid to the Adviser in the latest fiscal year.
The directors also considered the Adviser’s fee schedule for other clients utilizing investment strategies similar to those of the Fund. For this purpose, they reviewed the relevant advisory fee information from the Adviser’s Form ADV and in a report from the Fund’s Senior Analyst and
| abfunds.com | AB TOTAL RETURN BOND PORTFOLIO | 99 | |
noted the differences between the Fund’s fee schedule, on the one hand, and the Adviser’s institutional fee schedule and the schedule of fees charged by the Adviser to any offshore funds and for services to any sub-advised funds utilizing investment strategies similar to those of the Fund, on the other. The directors noted that the Adviser may, in some cases, agree to fee rates with large institutional clients that are lower than those reviewed by the directors and that they had previously discussed with the Adviser its policies in respect of such arrangements. The directors previously discussed these matters with an independent fee consultant. The directors also compared the advisory fee rate for the Fund with that for another fund advised by the Adviser utilizing similar investment strategies.
The Adviser reviewed with the directors the significantly greater scope of the services it provides to the Fund relative to institutional, offshore fund and sub-advised fund clients. In this regard, the Adviser noted, among other things, that, compared to institutional and offshore or sub-advisory accounts, the Fund (i) demands considerably more portfolio management, research and trading resources due to significantly higher daily cash flows; (ii) has more tax and regulatory restrictions and compliance obligations; (iii) must prepare and file or distribute regulatory and other communications about fund operations; and (iv) must provide shareholder servicing to retail investors. The Adviser also reviewed the greater legal risks presented by the large and changing population of Fund shareholders who may assert claims against the Adviser in individual or class actions, and the greater entrepreneurial risk in offering new fund products, which require substantial investment to launch, may not succeed, and generally must be priced to compete with larger, more established funds resulting in lack of profitability to the Adviser until a new fund achieves scale. In light of the substantial differences in services rendered by the Adviser to institutional, offshore fund and sub-advised fund clients as compared to the Fund, and the different risk profile, the directors considered these fee comparisons inapt and did not place significant weight on them in their deliberations.
In connection with their review of the Fund’s advisory fee, the directors also considered the total expense ratio of the Class A shares of the Fund in comparison to a peer group and a peer universe selected by the 15(c) service provider. The Class A expense ratio of the Fund was based on the Fund’s latest fiscal year and the directors considered the Adviser’s expense cap for the Fund. The directors noted that it was likely that the expense ratios of some of the other funds in the Fund’s category were lowered by waivers or reimbursements by those funds’ investment advisers, which in some cases might be voluntary or temporary. The directors view expense ratio information as relevant to their evaluation of the Adviser’s services because the Adviser is responsible for coordinating services provided to the Fund by others. Based on their review, the directors concluded that the Fund’s expense ratio was acceptable.
| 100 | AB TOTAL RETURN BOND PORTFOLIO | abfunds.com | |
Economies of Scale
The directors noted that the advisory fee schedule for the Fund contains breakpoints that reduce the fee rates on assets above specified levels. The directors took into consideration prior presentations by an independent consultant on economies of scale in the mutual fund industry and for the AB Funds, and presentations from time to time by the Adviser concerning certain of its views on economies of scale. The directors also previously discussed economies of scale with an independent fee consultant. The directors also had requested and received from the Adviser certain updates on economies of scale in advance of the Meeting. The directors believe that economies of scale may be realized (if at all) by the Adviser across a variety of products and services, and not only in respect of a single fund. The directors noted that there is no established methodology for setting breakpoints that give effect to the fund-specific services provided by a fund’s adviser and to the economies of scale that an adviser may realize in its overall mutual fund business or those components of it which directly or indirectly affect a fund’s operations. The directors observed that in the mutual fund industry as a whole, as well as among funds similar to the Fund, there is no uniformity or pattern in the fees and asset levels at which breakpoints (if any) apply. The directors also noted that the advisory agreements for many funds do not have breakpoints at all. Having taken these factors into account, the directors concluded that the Fund’s shareholders would benefit from a sharing of economies of scale in the event the Fund’s net assets exceed a breakpoint in the future.
| abfunds.com | AB TOTAL RETURN BOND PORTFOLIO | 101 | |
This page is not part of the Shareholder Report or the Financial Statements.
AB FAMILY OF FUNDS
US EQUITY
CORE
Core Opportunities Fund
FlexFee™ US Thematic Portfolio
Select US Equity Portfolio
GROWTH
Concentrated Growth Fund
Discovery Growth Fund
FlexFee™ Large Cap Growth Portfolio
Growth Fund
Large Cap Growth Fund
Small Cap Growth Portfolio
VALUE
Discovery Value Fund
Equity Income Fund
Relative Value Fund
Small Cap Value Portfolio
Value Fund
INTERNATIONAL/ GLOBAL EQUITY
CORE
FlexFee™ International Strategic Core Portfolio
Global Core Equity Portfolio
International Portfolio
International Strategic Core Portfolio
Sustainable Global Thematic Fund
Tax-Managed International Portfolio
Tax-Managed Wealth Appreciation Strategy
Wealth Appreciation Strategy
INTERNATIONAL/ GLOBAL EQUITY (continued)
GROWTH
Concentrated International Growth Portfolio
FlexFee™ Emerging Markets Growth Portfolio
Sustainable International Thematic Fund
VALUE
All China Equity Portfolio
International Value Fund
FIXED INCOME
MUNICIPAL
High Income Municipal Portfolio
Intermediate California Municipal Portfolio
Intermediate Diversified Municipal Portfolio
Intermediate New York Municipal Portfolio
Municipal Bond Inflation Strategy
Tax-Aware Fixed Income Opportunities Portfolio1
National Portfolio
Arizona Portfolio
California Portfolio
Massachusetts Portfolio
Minnesota Portfolio
New Jersey Portfolio
New York Portfolio
Ohio Portfolio
Pennsylvania Portfolio
Virginia Portfolio
FIXED INCOME (continued)
TAXABLE
Bond Inflation Strategy
FlexFee™ High Yield Portfolio
FlexFee™ International Bond Portfolio
Global Bond Fund
High Income Fund
Income Fund
Intermediate Duration Portfolio
Limited Duration High Income Portfolio
Short Duration Income Portfolio
Short Duration Portfolio
Total Return Bond Portfolio1
ALTERNATIVES
All Market Real Return Portfolio
Global Real Estate Investment Fund
Select US Long/Short Portfolio
Unconstrained Bond Fund
MULTI-ASSET
All Market Income Portfolio
All Market Total Return Portfolio
Conservative Wealth Strategy
Emerging Markets Multi-Asset Portfolio
Global Risk Allocation Fund
Tax-Managed All Market Income Portfolio
CLOSED-END FUNDS
AllianceBernstein Global High Income Fund
AllianceBernstein National Municipal Income Fund
We also offer Government Money Market Portfolio, which serves as the money market fund exchange vehicle for the AB mutual funds. You could lose money by investing in the Fund. Although the Fund seeks to preserve the value of your investment at $1.00 per share, it cannot guarantee it will do so. The Fund may impose a fee upon sale of your shares or may temporarily suspend your ability to sell shares if the Fund’s liquidity falls below required minimums because of market conditions or other factors. An investment in the Fund is not insured or guaranteed by the Federal Deposit Insurance Corporation or any other government agency. The Fund’s sponsor has no legal obligation to provide financial support to the Fund, and you should not expect that the sponsor will provide financial support to the Fund at any time.
Investors should consider the investment objectives, risks, charges and expenses of the Fund carefully before investing. For copies of our prospectus or summary prospectus, which contain this and other information, visit us online at www.abfunds.com or contact your AB representative. Please read the prospectus and/or summary prospectus carefully before investing.
| 1 | Prior to July 12, 2019, Total Return Bond Portfolio was named Intermediate Bond Portfolio; prior to February 5, 2020, Tax-Aware Fixed Income Opportunities Portfolio was named Tax-Aware Fixed Income Portfolio. |
| 102 | AB TOTAL RETURN BOND PORTFOLIO | abfunds.com | |
NOTES
| abfunds.com | AB TOTAL RETURN BOND PORTFOLIO | 103 | |
NOTES
| 104 | AB TOTAL RETURN BOND PORTFOLIO | abfunds.com | |
NOTES
| abfunds.com | AB TOTAL RETURN BOND PORTFOLIO | 105 | |
NOTES
| 106 | AB TOTAL RETURN BOND PORTFOLIO | abfunds.com | |
NOTES
| abfunds.com | AB TOTAL RETURN BOND PORTFOLIO | 107 | |
NOTES
| 108 | AB TOTAL RETURN BOND PORTFOLIO | abfunds.com | |
AB TOTAL RETURN BOND PORTFOLIO
1345 Avenue of the Americas
New York, NY 10105
800 221 5672
TRB-0152-0420 
APR 04.30.20

SEMI-ANNUAL REPORT
AB MUNICIPAL BOND INFLATION STRATEGY

Beginning January 1, 2021, as permitted by new regulations adopted by the Securities and Exchange Commission, the Fund’s annual and semi-annual shareholder reports will no longer be sent by mail, unless you specifically request paper copies of the reports. Instead, the reports will be made available on a website, and you will be notified by mail each time a report is posted and provided with a website address to access the report.
If you already elected to receive shareholder reports electronically, you will not be affected by this change and you need not take any action. You may elect to receive shareholder reports and other communications from the Fund electronically at any time by contacting your financial intermediary (such as a broker-dealer or bank) or, if you are a direct investor, by calling the Fund at (800) 221 5672.
You may elect to receive all future reports in paper form free of charge. If you invest through a financial intermediary, you can contact your financial intermediary to request that you continue to receive paper copies of your shareholder reports; if you invest directly with the Fund, you can call the Fund at (800) 221 5672. Your election to receive reports in paper form will apply to all funds held in your account with your financial intermediary or, if you invest directly, to all AB Mutual Funds you hold.
| Investment Products Offered | • Are Not FDIC Insured • May Lose Value • Are Not Bank Guaranteed | |
Investors should consider the investment objectives, risks, charges and expenses of the Fund carefully before investing. For copies of our prospectus or summary prospectus, which contain this and other information, visit us online at www.abfunds.com or contact your AB representative. Please read the prospectus and/or summary prospectus carefully before investing.
This shareholder report must be preceded or accompanied by the Fund’s prospectus for individuals who are not current shareholders of the Fund.
You may obtain a description of the Fund’s proxy voting policies and procedures, and information regarding how the Fund voted proxies relating to portfolio securities during the most recent 12-month period ended June 30, without charge. Simply visit AB’s website at www.abfunds.com, or go to the Securities and Exchange Commission’s (the “Commission”) website at www.sec.gov, or call AB at (800) 227 4618.
The Fund files its complete schedule of portfolio holdings with the Commission for the first and third quarters of each fiscal year as an exhibit to its reports on Form N-PORT. The Fund’s Form N-PORT reports are available on the Commission’s website at www.sec.gov. The Fund’s Forms N-PORT may also be reviewed and copied at the Commission’s Public Reference Room in Washington, DC; information on the operation of the Public Reference Room may be obtained by calling (800) SEC 0330. AB publishes full portfolio holdings for the Fund monthly at www.abfunds.com.
AllianceBernstein Investments, Inc. (ABI) is the distributor of the AB family of mutual funds. ABI is a member of FINRA and is an affiliate of AllianceBernstein L.P., the Adviser of the funds.
The [A/B] logo is a registered service mark of AllianceBernstein and AllianceBernstein® is a registered service mark used by permission of the owner, AllianceBernstein L.P.
| FROM THE PRESIDENT |  |
Dear Shareholder,
We are pleased to provide this report for AB Municipal Bond Inflation Strategy (the “Fund”). Please review the discussion of Fund performance, the market conditions during the reporting period and the Fund’s investment strategy.
As always, AB strives to keep clients ahead of what’s next by:
| + | Transforming uncommon insights into uncommon knowledge with a global research scope |
| + | Navigating markets with seasoned investment experience and sophisticated solutions |
| + | Providing thoughtful investment insights and actionable ideas |
Whether you’re an individual investor or a multi-billion-dollar institution, we put knowledge and experience to work for you.
AB’s global research organization connects and collaborates across platforms and teams to deliver impactful insights and innovative products. Better insights lead to better opportunities—anywhere in the world.
For additional information about AB’s range of products and shareholder resources, please log on to www.abfunds.com.
Thank you for your investment in the AB Mutual Funds.
Sincerely,

Robert M. Keith
President and Chief Executive Officer, AB Mutual Funds
| abfunds.com | AB MUNICIPAL BOND INFLATION STRATEGY | 1 | |
SEMI-ANNUAL REPORT
June 16, 2020
This report provides management’s discussion of fund performance for AB Municipal Bond Inflation Strategy for the semi-annual period ended April 30, 2020.
The Fund’s investment objective is to maximize real after-tax return for investors subject to federal income taxes, without undue risk to principal.
NAV RETURNS AS OF APRIL 30, 2020 (unaudited)
| 6 Months | 12 Months | |||||||
| AB MUNICIPAL BOND INFLATION STRATEGY | ||||||||
| Class 1 Shares1 | -5.14% | -4.35% | ||||||
| Class 2 Shares1 | -5.10% | -4.35% | ||||||
| Class A Shares | -5.20% | -4.51% | ||||||
| Class C Shares | -5.48% | -5.25% | ||||||
| Advisor Class Shares2 | -5.09% | -4.27% | ||||||
| Bloomberg Barclays 1-10 Year TIPS Index | 3.08% | 6.16% | ||||||
| 1 | Class 1 shares are only available to Bernstein Global Wealth Management private client accounts. Class 2 shares are only available to large Bernstein Global Wealth Management private client accounts and the Adviser’s institutional clients or through other limited arrangements. |
| 2 | Please note that this share class is for investors purchasing shares through accounts established under certain fee-based programs sponsored and maintained by certain broker-dealers and financial intermediaries, institutional pension plans and/or investment advisory clients of, and certain other persons associated with, the Adviser and its affiliates or the Fund. |
INVESTMENT RESULTS
The table above shows the Fund’s performance compared to its benchmark, the Bloomberg Barclays 1-10 Year Treasury Inflation-Protected Securities (“TIPS”) Index, for the six- and 12-month periods ended April 30, 2020.
All shares of the Fund underperformed the benchmark for both periods, before sales charges. The Fund invests primarily in municipal bonds and uses tax-efficient hedges for inflation protection. Over both periods, the Fund’s lower-than-benchmark interest-rate risk detracted, relative to the benchmark, as rates fell. Furthermore, owning municipal bonds and an overweight to credit detracted as the highest quality assets, US Treasuries, outperformed. An overweight to consumer price index (“CPI”) hedges detracted relative to the benchmark, while owning interest rate swaps contributed. For the six-month period, an overweight to six- to seven-year duration bonds also contributed.
| 2 | AB MUNICIPAL BOND INFLATION STRATEGY | abfunds.com | |
The Fund utilized derivatives in the form of CPI swaps for hedging purposes, which detracted from absolute performance for both periods. Interest rate swaps were utilized for hedging purposes and added for both periods. Credit default swaps were utilized for investment purposes and had no material impact on performance for either period.
MARKET REVIEW AND INVESTMENT STRATEGY
Themes of strong demand, light supply and supportive credit fundamentals were prominent until the last couple months of the six-month period ended April 30, 2020. In March, these themes sharply reversed and volatility spiked dramatically. The novel coronavirus pandemic quickly led to the increase in market volatility and to a sharp economic contraction. In this environment, investors fled to cash from nearly every other type of investment, and stocks and bonds fell dramatically. The municipal bond market was not spared; after 60 consecutive weeks of inflows, municipal bond funds had record outflows. Municipals had shown strong absolute and relative performance prior to March, with yields declining 0.8% to over 1% depending on the maturity since April of 2019. In March, open-end funds had to sell vast quantities of bonds to meet shareholder redemptions, and this selling contributed to yields rising over 2% in less than two weeks. The municipal market did recover toward the end of March and into April as investor demand returned following the actions taken by the US Federal Reserve to address market liquidity and the passing of the Coronavirus Aid, Relief, and Economic Security Act, which included direct aid to municipalities. As a result, after the large moves during both periods, yields for high-grade municipal bonds ended lower for the 12-month period by 0.3% to 0.7%, with yields for shorter-maturity bonds declining more; for the six-month period, longer-maturity municipal yields were higher by about 0.15% and shorter-maturity bonds declined by about 0.3%. Over both the six- and 12-month periods, the additional yield provided by more credit-sensitive bonds increased.
The Fund’s Senior Investment Management Team (the “Team”) continues to focus on real after-tax return by investing in municipal bonds that generate income exempt from federal income taxes. In seeking to manage volatility and interest-rate risk, the Team focuses on intermediate-term bonds and seeks to provide inflation protection by entering inflation swap agreements or investing in other inflation-protected instruments.
The Fund may purchase municipal securities that are insured under policies issued by certain insurance companies. Historically, insured municipal securities typically received a higher credit rating, which meant that the issuer of the securities paid a lower interest rate. As a result of declines in the credit quality and associated downgrades of most bond insurers, insurance has less value than it did in the past. The market now values insured municipal securities primarily based on the credit quality of the issuer of the security with little value given to the insurance feature. In
| abfunds.com | AB MUNICIPAL BOND INFLATION STRATEGY | 3 | |
purchasing such insured securities, the Adviser evaluates the risk and return of municipal securities through its own research. If an insurance company’s rating is downgraded or the company becomes insolvent, the prices of municipal securities insured by the insurance company may decline. As of April 30, 2020, the Fund’s percentages of investments in municipal bonds that are insured and in insured municipal bonds that have been pre-refunded or escrowed to maturity were 3.83% and 0.19%, respectively.
INVESTMENT POLICIES
The Fund seeks real after-tax return for investors subject to federal income taxes. Real return is the rate of return after adjusting for inflation. The Fund pursues its objective by investing principally in high-quality, predominantly investment-grade, municipal securities that pay interest exempt from federal taxation. As a fundamental policy, the Fund will invest at least 80% of its net assets in municipal securities. These securities may be subject to the federal alternative minimum tax for some taxpayers.
The Fund will invest at least 80% of its total assets in fixed-income securities rated A or better or the equivalent by one or more national rating agencies or deemed to be of comparable credit quality by the Adviser. In deciding whether to take direct or indirect exposure, the Fund may invest up to 20% of its total assets in fixed-income securities rated BB or B or the equivalent by one or more national rating agencies (or deemed to be of comparable credit quality by the Adviser), which are not investment grade (“junk bonds”). If the rating of a fixed-income security falls below investment-grade, the Fund will not be obligated to sell the security and may continue to hold it if, in the Adviser’s opinion, the investment is appropriate under the circumstances.
The Fund may invest in fixed-income securities with any maturity and duration.
To provide inflation protection, the Fund will typically enter into inflation swaps. The Fund may use other inflation-indexed instruments. Payments to the Fund pursuant to swaps will result in taxable income, either ordinary income or capital gains, rather than income exempt from federal income taxation. It is expected that the Fund’s primary use of derivatives will be for the purpose of inflation protection.
The Fund may also invest in forward commitments; zero-coupon municipal securities and variable, floating and inverse floating-rate
municipal securities; certain types of mortgage-related securities; and derivatives, such as options, futures contracts, forwards and swaps.
(continued on next page)
| 4 | AB MUNICIPAL BOND INFLATION STRATEGY | abfunds.com | |
The Fund may utilize leverage for investment purposes through the use of tender option bond transactions (“TOBs”). The Adviser considers the impact of TOBs, swaps and other derivatives in making its assessments of the Fund’s risks. The resulting exposures to markets, sectors, issuers or specific securities will be continuously monitored by the Adviser.
| abfunds.com | AB MUNICIPAL BOND INFLATION STRATEGY | 5 | |
DISCLOSURES AND RISKS
Benchmark Disclosure
The Bloomberg Barclays 1-10 Year TIPS Index is unmanaged and does not reflect fees and expenses associated with the active management of a mutual fund portfolio. The Bloomberg Barclays 1-10 Year TIPS Index represents the performance of inflation-protected securities issued by the US Treasury. An investor cannot invest directly in an index, and its results are not indicative of the performance for any specific investment, including the Fund.
A Word About Risk
Market Risk: The market value of a security may move up or down, sometimes rapidly and unpredictably. These fluctuations may cause a security to be worth less than the price originally paid for it, or less than it was worth at an earlier time. Market risk may affect a single issuer, industry, sector of the economy or the market as a whole. Global economies and financial markets are increasingly interconnected, which increases the probabilities that conditions in one country or region might adversely impact issuers in a different country or region. Conditions affecting the general economy, including political, social, or economic instability at the local, regional, or global level may also affect the market value of a security. Health crises, such as pandemic and epidemic diseases, as well as other incidents that interrupt the expected course of events, such as natural disasters, war or civil disturbance, acts of terrorism, power outages and other unforeseeable and external events, and the public response to or fear of such diseases or events, have and may in the future have an adverse effect on the Fund’s investments and net asset value and can lead to increased market volatility. For example, any preventative or protective actions that governments may take in respect of such diseases or events may result in periods of business disruption, inability to obtain raw materials, supplies and component parts, and reduced or disrupted operations for the Fund’s portfolio companies. The occurrence and pendency of such diseases or events could adversely affect the economies and financial markets either in specific countries or worldwide.
Credit Risk: An issuer or guarantor of a fixed-income security, or the counterparty to a derivatives or other contract, may be unable or unwilling to make timely payments of interest or principal, or to otherwise honor its obligations. The issuer or guarantor may default, causing a loss of the full principal amount of a security and accrued interest. The degree of risk for a particular security may be reflected in its credit rating. There is the possibility that the credit rating of a fixed-income security may be downgraded after purchase, which may adversely affect the value of the security. Investments in fixed-income securities with lower ratings tend to have a higher probability that an issuer will default or fail to meet its payment obligations.
| 6 | AB MUNICIPAL BOND INFLATION STRATEGY | abfunds.com | |
DISCLOSURES AND RISKS (continued)
Municipal Market Risk: This is the risk that special factors may adversely affect the value of municipal securities and have a significant effect on the yield or value of the Fund’s investments in municipal securities. These factors include economic conditions, political or legislative changes, uncertainties related to the tax status of municipal securities, or the rights of investors in these securities. To the extent that the Fund invests more of its assets in a particular state’s municipal securities, the Fund is vulnerable to events adversely affecting that state, including economic, political and regulatory occurrences, court decisions, terrorism and catastrophic natural disasters. The Fund’s investments in certain municipal securities with principal and interest payments that are made from the revenues of a specific project or facility, and not general tax revenues, may have increased risks. Factors affecting the project or facility, such as local business or economic conditions, could have a significant effect on the project’s ability to make payments of principal and interest on these securities.
Congress has previously considered making changes to the municipal securities provisions of the Internal Revenue Code that could change the US federal income tax treatment of certain types of municipal securities.
Interest-Rate Risk: Changes in interest rates will affect the value of investments in fixed-income securities. When interest rates rise, the value of existing investments in fixed-income securities tends to fall and this decrease in value may not be offset by higher income from new investments. Interest-rate risk is generally greater for fixed-income securities with longer maturities or durations.
Duration Risk: Duration is a measure that relates the expected price volatility of a fixed-income security to changes in interest rates. The duration of a fixed-income security may be shorter than or equal to full maturity of a fixed-income security. Fixed-income securities with longer durations have more risk and will decrease in price as interest rates rise.
Inflation Risk: This is the risk that the value of assets or income from investments will be less in the future as inflation decreases the value of money. As inflation increases, the value of the Fund’s assets can decline as can the value of the Fund’s distributions. This risk is significantly greater for fixed-income securities with longer maturities.
Derivatives Risk: Derivatives may be difficult to price or unwind and leveraged so that small changes may produce disproportionate losses for the Fund. Derivatives, especially over-the-counter derivatives, are also subject to counterparty risk.
Leverage Risk: To the extent the Fund uses leveraging techniques, such as TOBs, its net asset value (“NAV”) may be more volatile because lever-
| abfunds.com | AB MUNICIPAL BOND INFLATION STRATEGY | 7 | |
DISCLOSURES AND RISKS (continued)
age tends to exaggerate the effect of changes in interest rates and any increase or decrease in the value of the Fund’s investments.
Illiquid Investments Risk: Illiquid investments risk exists when certain investments become difficult to purchase or sell. Difficulty in selling such investments may result in sales at disadvantageous prices affecting the value of your investment in the Fund. Causes of illiquid investments risk may include low trading volumes, large positions and heavy redemptions of Fund shares. Illiquid investments risk may be higher in a rising interest-rate environment, when the value and liquidity of fixed-income securities generally go down.
Management Risk: The Fund is subject to management risk because it is an actively managed investment fund. The Adviser will apply its investment techniques and risk analyses in making investment decisions, but there is no guarantee that its techniques will produce the intended results. Some of these techniques may incorporate, or rely upon, quantitative models, but there is no guarantee that these models will generate accurate forecasts, reduce risk or otherwise perform as expected.
These risks are fully discussed in the Fund’s prospectus. As with all investments, you may lose money by investing in the Fund.
An Important Note About Historical Performance
The investment return and principal value of an investment in the Fund will fluctuate, so that shares, when redeemed, may be worth more or less than their original cost. Performance shown in this report represents past performance and does not guarantee future results. Current performance may be lower or higher than the performance information shown. You may obtain performance information current to the most recent month-end by visiting www.abfunds.com. For Class 1 shares visit www.bernstein.com, click on “Investments”, then “Mutual Fund and Money Market Information—Mutual Fund Performance at a Glance.”
All fees and expenses related to the operation of the Fund have been deducted. NAV returns do not reflect sales charges; if sales charges were reflected, the Fund’s quoted performance would be lower. SEC returns reflect the applicable sales charges for each share class: a 3.00% maximum front-end sales charge for Class A shares and a 1% 1-year contingent deferred sales charge for Class C shares. Class 1 and 2 shares do not carry sales charges. Returns for the different share classes will vary due to different expenses associated with each class. Performance assumes reinvestment of distributions and does not account for taxes.
| 8 | AB MUNICIPAL BOND INFLATION STRATEGY | abfunds.com | |
HISTORICAL PERFORMANCE
AVERAGE ANNUAL RETURNS AS OF APRIL 30, 2020 (unaudited)
| NAV Returns | SEC Returns (reflects applicable sales charges) | SEC Yields1 | ||||||||||
| CLASS 1 SHARES2 | 1.65% | |||||||||||
| 1 Year | -4.35% | -4.35% | ||||||||||
| 5 Years | 0.85% | 0.85% | ||||||||||
| 10 Years | 1.40% | 1.40% | ||||||||||
| CLASS 2 SHARES2 | 1.76% | |||||||||||
| 1 Year | -4.35% | -4.35% | ||||||||||
| 5 Years | 0.93% | 0.93% | ||||||||||
| 10 Years | 1.50% | 1.50% | ||||||||||
| CLASS A SHARES | 1.42% | |||||||||||
| 1 Year | -4.51% | -7.39% | ||||||||||
| 5 Years | 0.69% | 0.08% | ||||||||||
| 10 Years | 1.24% | 0.93% | ||||||||||
| CLASS C SHARES | 0.71% | |||||||||||
| 1 Year | -5.25% | -6.18% | ||||||||||
| 5 Years | -0.06% | -0.06% | ||||||||||
| 10 Years | 0.50% | 0.50% | ||||||||||
| ADVISOR CLASS SHARES3 | 1.71% | |||||||||||
| 1 Year | -4.27% | -4.27% | ||||||||||
| 5 Years | 0.93% | 0.93% | ||||||||||
| 10 Years | 1.50% | 1.50% | ||||||||||
The Fund’s current prospectus fee table shows the Fund’s total annual operating expense ratios as 0.67%, 0.57%, 0.86%, 1.61% and 0.61% for Class 1, Class 2, Class A, Class C and Advisor Class shares, respectively, gross of any fee waivers or expense reimbursements. Contractual fee waivers and/or expense reimbursements limit the Fund’s annual operating expense ratios exclusive of extraordinary expenses, interest expense, and acquired fund fees and expenses other than the advisory fees of any AB mutual funds in which the Fund may invest to 0.60%, 0.50%, 0.75%, 1.50% and 0.50% for Class 1, Class 2, Class A, Class C and Advisor Class shares, respectively. These waivers/reimbursements may not be terminated prior to January 31, 2021 and may be extended by the Adviser for additional one-year terms. Absent reimbursements or waivers, performance would have been lower. The Financial Highlights section of this report sets forth expense ratio data for the current reporting period; the expense ratios shown above may differ from the expense ratios in the Financial Highlights section since they are based on different time periods.
| 1 | SEC yields are calculated based on SEC guidelines for the 30-day period ended April 30, 2020. |
| 2 | Class 1 shares are only available to Bernstein Global Wealth Management private client accounts. Class 2 shares are only available to large Bernstein Global Wealth Management private client accounts and the Adviser’s institutional clients or through other limited arrangements. |
| 3 | This share class is offered at NAV to eligible investors and the SEC returns are the same as the NAV returns. Please note that this share class is for investors purchasing shares through accounts established under certain fee-based programs sponsored and maintained by certain broker-dealers and financial intermediaries, institutional pension plans and/or investment advisory clients of, and certain other persons associated with, the Adviser and its affiliates or the Fund. |
| abfunds.com | AB MUNICIPAL BOND INFLATION STRATEGY | 9 | |
HISTORICAL PERFORMANCE (continued)
SEC AVERAGE ANNUAL RETURNS
AS OF THE MOST RECENT CALENDAR QUARTER-END
MARCH 31, 2020 (unaudited)
| SEC Returns (reflects applicable sales charges) | ||||
| CLASS 1 SHARES1 | ||||
| 1 Year | -3.69% | |||
| 5 Years | 0.90% | |||
| 10 Years | 1.54% | |||
| CLASS 2 SHARES1 | ||||
| 1 Year | -3.59% | |||
| 5 Years | 1.01% | |||
| 10 Years | 1.65% | |||
| CLASS A SHARES | ||||
| 1 Year | -6.68% | |||
| 5 Years | 0.13% | |||
| 10 Years | 1.06% | |||
| CLASS C SHARES | ||||
| 1 Year | -5.44% | |||
| 5 Years | 0.00% | |||
| 10 Years | 0.63% | |||
| ADVISOR CLASS SHARES2 | ||||
| 1 Year | -3.62% | |||
| 5 Years | 1.00% | |||
| 10 Years | 1.64% | |||
| 1 | Class 1 shares are only available to Bernstein Global Wealth Management private client accounts. Class 2 shares are only available to large Bernstein Global Wealth Management private client accounts and the Adviser’s institutional clients or through other limited arrangements. |
| 2 | Please note that this share class is for investors purchasing shares through accounts established under certain fee-based programs sponsored and maintained by certain broker-dealers and financial intermediaries, institutional pension plans and/or investment advisory clients of, and certain other persons associated with, the Adviser and its affiliates or the Fund. |
| 10 | AB MUNICIPAL BOND INFLATION STRATEGY | abfunds.com | |
EXPENSE EXAMPLE
(unaudited)
As a shareholder of a mutual fund, you may incur two types of costs: (1) transaction costs, including sales charges (loads) on purchase payments, contingent deferred sales charges on redemptions and (2) ongoing costs, including management fees; distribution (12b-1) fees; and other fund expenses. This example is intended to help you understand your ongoing costs (in dollars) of investing in the Fund and to compare these costs with the ongoing costs of investing in other mutual funds.
The Example is based on an investment of $1,000 invested at the beginning of the period and held for the entire period as indicated below.
Actual Expenses
The table below provides information about actual account values and actual expenses. You may use the information in this line, together with the amount you invested, to estimate the expenses that you paid over the period. Simply divide your account value by $1,000 (for example, an $8,600 account value divided by $1,000 = 8.6), then multiply the result by the number in the first line under the heading entitled “Expenses Paid During Period” to estimate the expenses you paid on your account during this period.
Hypothetical Example for Comparison Purposes
The table below provides information about hypothetical account values and hypothetical expenses based on the Fund’s actual expense ratio and an assumed annual rate of return of 5% before expenses, which is not the Fund’s actual return. The hypothetical account values and expenses may not be used to estimate the actual ending account balance or expenses you paid for the period. You may use this information to compare the ongoing costs of investing in the Fund and other funds by comparing this 5% hypothetical example with the 5% hypothetical examples that appear in the shareholder reports of other funds.
Please note that the expenses shown in the table are meant to highlight your ongoing costs only and do not reflect any transactional costs, such as sales charges (loads), or contingent deferred sales charges on redemptions. Therefore, the hypothetical example is useful in comparing ongoing costs only, and will not help you determine the relative total costs of owning different funds. In addition, if these transactional costs were included, your costs would have been higher.
| abfunds.com | AB MUNICIPAL BOND INFLATION STRATEGY | 11 | |
EXPENSE EXAMPLE (continued)
| Beginning Account Value November 1, 2019 | Ending Account Value April 30, 2020 | Expenses Paid During Period* | Annualized Expense Ratio* | |||||||||||||
| Class A | ||||||||||||||||
Actual | $ | 1,000 | $ | 948.00 | $ | 3.63 | 0.75 | % | ||||||||
Hypothetical** | $ | 1,000 | $ | 1,021.13 | $ | 3.77 | 0.75 | % | ||||||||
| Class C | ||||||||||||||||
Actual | $ | 1,000 | $ | 945.20 | $ | 7.25 | 1.50 | % | ||||||||
Hypothetical** | $ | 1,000 | $ | 1,017.40 | $ | 7.52 | 1.50 | % | ||||||||
| Advisor Class | ||||||||||||||||
Actual | $ | 1,000 | $ | 949.10 | $ | 2.42 | 0.50 | % | ||||||||
Hypothetical** | $ | 1,000 | $ | 1,022.38 | $ | 2.51 | 0.50 | % | ||||||||
| Class 1 | ||||||||||||||||
Actual | $ | 1,000 | $ | 948.60 | $ | 2.91 | 0.60 | % | ||||||||
Hypothetical** | $ | 1,000 | $ | 1,021.88 | $ | 3.02 | 0.60 | % | ||||||||
| Class 2 | ||||||||||||||||
Actual | $ | 1,000 | $ | 949.00 | $ | 2.42 | 0.50 | % | ||||||||
Hypothetical** | $ | 1,000 | $ | 1,022.38 | $ | 2.51 | 0.50 | % | ||||||||
| * | Expenses are equal to the classes’ annualized expense ratios, multiplied by the average account value over the period, multiplied by 182/366 (to reflect the one-half year period). |
| ** | Assumes 5% annual return before expenses. |
| 12 | AB MUNICIPAL BOND INFLATION STRATEGY | abfunds.com | |
PORTFOLIO SUMMARY
April 30, 2020 (unaudited)
PORTFOLIO STATISTICS
Net Assets ($mil): $921.4
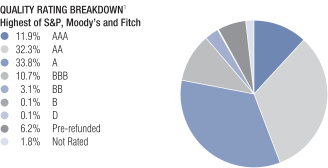
| 1 | All data are as of April 30, 2020. The Fund’s quality rating breakdown is expressed as a percentage of the Fund’s total investments in municipal securities and may vary over time. The Fund also enters into derivative transactions, which may be used for hedging or investment purposes (see “Portfolio of Investments” section of the report for additional details). The quality ratings are determined by using the S&P Global Ratings (“S&P”), Moody’s Investors Services, Inc.(“Moody’s”) and Fitch Ratings, Ltd.(“Fitch”). The Fund considers the credit ratings issued by S&P, Moody’s and Fitch and uses the highest rating issued by the agencies. These ratings are a measure of the quality and safety of a bond or portfolio, based on the issuer’s financial condition. AAA is the highest (best) and D is the lowest (worst). If applicable, the pre-refunded category includes bonds which are secured by U.S. Government securities and therefore are deemed high-quality investment grade by the Adviser. If applicable, Not Applicable (N/A) includes non credit worthy investments; such as equities, currency contracts, futures and options. If applicable, the Not Rated category includes bonds that are not rated by a nationally recognized statistical rating organization. The Adviser evaluates the creditworthiness of non-rated securities based on a number of factors including, but not limited to, cash flows, enterprise value and economic environment. |
| abfunds.com | AB MUNICIPAL BOND INFLATION STRATEGY | 13 | |
PORTFOLIO OF INVESTMENTS
April 30, 2020 (unaudited)
| Principal Amount (000) | U.S. $ Value | |||||||
| ||||||||
MUNICIPAL OBLIGATIONS – 102.5% |
| |||||||
Long-Term Municipal Bonds – 102.5% |
| |||||||
Alabama – 2.2% |
| |||||||
Alabama Special Care Facilities Financing Authority-Birmingham AL | $ | 3,905 | $ | 4,415,344 | ||||
Infirmary Health System Special Care Facilities Financing Authority of Mobile | 2,110 | 2,371,535 | ||||||
Special Care Facilities Financing Authority of the City of Pell City Alabama | 11,235 | 11,674,626 | ||||||
Tuscaloosa County Industrial Development Authority | 1,810 | 1,701,074 | ||||||
|
| |||||||
| 20,162,579 | ||||||||
|
| |||||||
American Samoa – 0.3% |
| |||||||
American Samoa Economic Development Authority | 295 | 334,418 | ||||||
7.125%, 09/01/2038(a) | 820 | 941,098 | ||||||
Series 2015A | 1,335 | 1,464,428 | ||||||
|
| |||||||
| 2,739,944 | ||||||||
|
| |||||||
Arizona – 2.6% |
| |||||||
Arizona State University | 7,260 | 7,769,127 | ||||||
City of Phoenix Civic Improvement Corp. | 3,330 | 3,487,209 | ||||||
County of Pima AZ Sewer System Revenue AGM Series 2010 | 1,765 | 1,776,649 | ||||||
| 14 | AB MUNICIPAL BOND INFLATION STRATEGY | abfunds.com | |
PORTFOLIO OF INVESTMENTS (continued)
| Principal Amount (000) | U.S. $ Value | |||||||
| ||||||||
Salt River Project Agricultural Improvement & Power District | $ | 3,140 | $ | 3,340,081 | ||||
State of Arizona Lottery Revenue 5.00%, 07/01/2028 | 5,000 | 6,353,800 | ||||||
Tempe Industrial Development Authority | 1,200 | 1,123,788 | ||||||
|
| |||||||
| 23,850,654 | ||||||||
|
| |||||||
California – 1.3% |
| |||||||
California Pollution Control Financing Authority | 250 | 222,340 | ||||||
Golden State Tobacco Securitization Corp. | 1,770 | 1,741,910 | ||||||
State of California | 5,000 | 5,091,850 | ||||||
Series 2014 | 4,250 | 4,771,794 | ||||||
|
| |||||||
| 11,827,894 | ||||||||
|
| |||||||
Colorado – 5.5% |
| |||||||
Centerra Metropolitan District No. 1 | 1,510 | 1,472,582 | ||||||
City & County of Denver CO Airport System Revenue (Denver Intl Airport) | 375 | 381,930 | ||||||
Series 2012A | 13,395 | 14,430,194 | ||||||
Series 2018A | 16,555 | 19,942,770 | ||||||
Colorado Health Facilities Authority | 2,860 | 3,182,802 | ||||||
Colorado Health Facilities Authority | 1,525 | 1,762,732 | ||||||
Denver City & County School District No. 1 | 4,730 | 5,374,841 | ||||||
| abfunds.com | AB MUNICIPAL BOND INFLATION STRATEGY | 15 | |
PORTFOLIO OF INVESTMENTS (continued)
| Principal Amount (000) | U.S. $ Value | |||||||
| ||||||||
Denver Urban Renewal Authority | $ | 1,640 | $ | 1,746,748 | ||||
Plaza Metropolitan District No. 1 | 1,310 | 1,320,677 | ||||||
Regional Transportation District | 440 | 440,471 | ||||||
Vauxmont Metropolitan District AGM | 260 | 295,100 | ||||||
|
| |||||||
| 50,350,847 | ||||||||
|
| |||||||
Connecticut – 3.1% |
| |||||||
City of New Haven CT | 1,920 | 2,138,765 | ||||||
State of Connecticut | 5,035 | 5,549,325 | ||||||
Series 2014A | 2,230 | 2,458,374 | ||||||
Series 2014F | 1,275 | 1,432,514 | ||||||
Series 2015B | 7,170 | 8,128,402 | ||||||
Series 2016A | 2,160 | 2,431,274 | ||||||
Series 2018B | 1,440 | 1,709,381 | ||||||
State of Connecticut Clean Water Fund – State Revolving Fund | 4,360 | 4,839,338 | ||||||
|
| |||||||
| 28,687,373 | ||||||||
|
| |||||||
District of Columbia – 1.1% |
| |||||||
District of Columbia | 250 | 250,000 | ||||||
Metropolitan Washington Airports Authority | 8,565 | 9,824,288 | ||||||
|
| |||||||
| 10,074,288 | ||||||||
|
| |||||||
| 16 | AB MUNICIPAL BOND INFLATION STRATEGY | abfunds.com | |
PORTFOLIO OF INVESTMENTS (continued)
| Principal Amount (000) | U.S. $ Value | |||||||
| ||||||||
Florida – 12.4% |
| |||||||
Capital Trust Agency, Inc. | $ | 300 | $ | 288,156 | ||||
Central Florida Expressway Authority | 6,000 | 7,194,300 | ||||||
5.00%, 07/01/2034(b) | 7,255 | 8,617,779 | ||||||
Citizens Property Insurance Corp. | 7,315 | 7,830,634 | ||||||
City of Jacksonville FL | 1,720 | 1,749,154 | ||||||
City of Jacksonville FL | 10,190 | 11,090,188 | ||||||
City Of South Miami Health Facilities Authority, Inc. (Baptist Health South Florida Obligated Group) | 4,500 | 5,064,165 | ||||||
City of Tampa FL Water & Wastewater System Revenue | 1,565 | 1,651,576 | ||||||
County of Miami-Dade FL | 18,500 | 20,878,304 | ||||||
County of Miami-Dade FL | 1,500 | 1,642,635 | ||||||
County of Osceola FL Transportation Revenue Series 2020A Zero Coupon, 10/01/2030-10/01/2034 | 595 | 409,959 | ||||||
Florida Development Finance Corp. | 33,250 | 33,195,470 | ||||||
Florida Municipal Power Agency | 2,890 | 3,046,522 | ||||||
Series 2015B 5.00%, 10/01/2023 | 1,500 | 1,692,990 | ||||||
| abfunds.com | AB MUNICIPAL BOND INFLATION STRATEGY | 17 | |
PORTFOLIO OF INVESTMENTS (continued)
| Principal Amount (000) | U.S. $ Value | |||||||
| ||||||||
Greater Orlando Aviation Authority | $ | 4,000 | $ | 4,488,600 | ||||
JEA Water & Sewer System Revenue NATL | 2,695 |
| 2,709,796 |
| ||||
Martin County Industrial Development Authority | 1,900 | 1,899,924 | ||||||
Mid-Bay Bridge Authority | 1,000 | 1,070,290 | ||||||
|
| |||||||
| 114,520,442 | ||||||||
|
| |||||||
Georgia – 3.1% |
| |||||||
Augusta Development Authority | 9,555 | 10,487,585 | ||||||
Cherokee County Board of Education | 1,000 | 1,010,300 | ||||||
Main Street Natural Gas, Inc. | 9,370 | 9,897,999 | ||||||
Series 2018C | 6,850 | 7,253,465 | ||||||
|
| |||||||
| 28,649,349 | ||||||||
|
| |||||||
Guam – 0.5% |
| |||||||
Territory of Guam | 165 | 153,397 | ||||||
Territory of Guam | 3,970 | 4,046,433 | ||||||
|
| |||||||
| 4,199,830 | ||||||||
|
| |||||||
Illinois – 7.2% |
| |||||||
Chicago Board of Education | 2,050 | 2,061,747 | ||||||
Series 2018A | 1,200 | 1,216,536 | ||||||
Series 2019A | 525 | 526,705 | ||||||
Series 2019B | 500 | 496,913 | ||||||
| 18 | AB MUNICIPAL BOND INFLATION STRATEGY | abfunds.com | |
PORTFOLIO OF INVESTMENTS (continued)
| Principal Amount (000) | U.S. $ Value | |||||||
| ||||||||
Chicago Housing Authority | $ | 8,760 | $ | 10,205,683 | ||||
Chicago O’Hare International Airport | 5,000 | 5,494,250 | ||||||
Series 2016C | 5,000 | 5,524,200 | ||||||
Series 2017B | 1,475 | 1,643,784 | ||||||
Chicago O’Hare International Airport | 2,500 | 2,628,475 | ||||||
5.50%, 01/01/2025 | 2,250 | 2,372,782 | ||||||
Illinois Finance Authority | 1,630 | 1,814,500 | ||||||
Illinois Finance Authority | 800 | 848,602 | ||||||
Sangamon County Water Reclamation District Series 2011A | 2,170 | 2,229,849 | ||||||
State of Illinois | 1,670 | 1,661,800 | ||||||
Series 2014 | 4,180 | 4,014,765 | ||||||
Series 2017B | 5,050 | 4,997,177 | ||||||
Series 2017D | 14,515 | 14,381,165 | ||||||
Series 2018A | 2,785 | 2,768,958 | ||||||
Series 2018B | 1,730 | 1,720,035 | ||||||
|
| |||||||
| 66,607,926 | ||||||||
|
| |||||||
Indiana – 0.5% |
| |||||||
Indiana Finance Authority | 2,380 | 1,913,330 | ||||||
Indiana Municipal Power Agency | 2,105 | 2,208,208 | ||||||
|
| |||||||
| 4,121,538 | ||||||||
|
| |||||||
| abfunds.com | AB MUNICIPAL BOND INFLATION STRATEGY | 19 | |
PORTFOLIO OF INVESTMENTS (continued)
| Principal Amount (000) | U.S. $ Value | |||||||
| ||||||||
Iowa – 0.2% |
| |||||||
Iowa Finance Authority | $ | 2,250 | $ | 2,194,448 | ||||
|
| |||||||
Kentucky – 5.0% |
| |||||||
City of Ashland KY | 650 | 734,961 | ||||||
Kentucky Municipal Power Agency NATL | 4,875 | 5,320,050 | ||||||
Kentucky Public Energy Authority | 7,260 | 7,616,321 | ||||||
Kentucky Public Energy Authority | 20,000 | 20,546,800 | ||||||
Series 2019C | 9,015 | 9,710,327 | ||||||
Kentucky Turnpike Authority | 2,275 | 2,464,212 | ||||||
|
| |||||||
| 46,392,671 | ||||||||
|
| |||||||
Louisiana – 2.5% |
| |||||||
Jefferson Sales Tax District AGM | 1,800 | 2,173,608 | ||||||
State of Louisiana | 8,935 | 10,762,654 | ||||||
State of Louisiana Gasoline & Fuels Tax Revenue | 2,860 | 3,100,440 | ||||||
5.00%, 05/01/2027 | 6,225 | 6,701,026 | ||||||
|
| |||||||
| 22,737,728 | ||||||||
|
| |||||||
Maryland – 1.5% |
| |||||||
County of Montgomery MD | 5,925 | 7,296,637 | ||||||
State of Maryland | 5,790 | 6,730,933 | ||||||
|
| |||||||
| 14,027,570 | ||||||||
|
| |||||||
| 20 | AB MUNICIPAL BOND INFLATION STRATEGY | abfunds.com | |
PORTFOLIO OF INVESTMENTS (continued)
| Principal Amount (000) | U.S. $ Value | |||||||
| ||||||||
Massachusetts – 2.8% |
| |||||||
Commonwealth of Massachusetts | $ | 3,450 | $ | 3,456,072 | ||||
Massachusetts Bay Transportation Authority | 3,330 | 3,497,299 | ||||||
Series 2004C | 2,650 | 2,653,286 | ||||||
Massachusetts Clean Water Trust (The) | 3,240 | 3,350,970 | ||||||
3.90% (CPI + 0.99%), 08/01/2023(d) | 2,275 | 2,377,944 | ||||||
Massachusetts Development Finance Agency | 1,655 | 2,059,962 | ||||||
Massachusetts School Building Authority | 2,475 | 2,689,830 | ||||||
Metropolitan Boston Transit Parking Corp. | 5,025 | 5,248,044 | ||||||
|
| |||||||
| 25,333,407 | ||||||||
|
| |||||||
Michigan – 4.0% |
| |||||||
City of Detroit MI | 1,055 | 1,035,285 | ||||||
City of Detroit MI Sewage Disposal System Revenue | 3,750 | 3,920,475 | ||||||
Michigan Finance Authority | 2,735 | 3,272,459 | ||||||
| abfunds.com | AB MUNICIPAL BOND INFLATION STRATEGY | 21 | |
PORTFOLIO OF INVESTMENTS (continued)
| Principal Amount (000) | U.S. $ Value | |||||||
| ||||||||
Michigan Finance Authority | $ | 10,545 | $ | 12,158,280 | ||||
Michigan Finance Authority | 1,785 | 1,994,523 | ||||||
Michigan Strategic Fund | 9,090 | 10,128,760 | ||||||
University of Michigan | 4,000 | 4,575,200 | ||||||
|
| |||||||
| 37,084,982 | ||||||||
|
| |||||||
Minnesota – 0.0% |
| |||||||
City of Minneapolis MN/St. Paul Housing & Redevelopment Authority | 100 | 100,000 | ||||||
|
| |||||||
Mississippi – 0.2% |
| |||||||
Mississippi Hospital Equipment & Facilities Authority | 1,500 | 1,570,905 | ||||||
|
| |||||||
Missouri – 0.2% |
| |||||||
Howard Bend Levee District XLCA | 255 | 276,272 | ||||||
Lee’s Summit Industrial Development Authority | 1,675 | 1,472,191 | ||||||
|
| |||||||
| 1,748,463 | ||||||||
|
| |||||||
Montana – 0.4% |
| |||||||
Montana Facility Finance Authority | 3,275 | 3,755,769 | ||||||
|
| |||||||
| 22 | AB MUNICIPAL BOND INFLATION STRATEGY | abfunds.com | |
PORTFOLIO OF INVESTMENTS (continued)
| Principal Amount (000) | U.S. $ Value | |||||||
| ||||||||
Nebraska – 1.8% |
| |||||||
Central Plains Energy Project | $ | 15,000 | $ | 16,179,750 | ||||
|
| |||||||
Nevada – 0.2% |
| |||||||
City of Sparks NV | 515 | 495,415 | ||||||
Las Vegas Valley Water District | 1,500 | 1,504,680 | ||||||
|
| |||||||
| 2,000,095 | ||||||||
|
| |||||||
New Hampshire – 0.2% |
| |||||||
New Hampshire Business Finance Authority | 2,000 | 2,002,320 | ||||||
|
| |||||||
New Jersey – 7.8% |
| |||||||
New Jersey Economic Development Authority | 1,150 | 1,167,124 | ||||||
Series 2017B | 1,000 | 1,008,220 | ||||||
New Jersey Economic Development Authority | 3,810 | 4,089,545 | ||||||
New Jersey Economic Development Authority | 1,365 | 1,350,995 | ||||||
New Jersey Transportation Trust Fund Authority | 4,390 | 4,712,621 | ||||||
Series 2018A | 21,670 | 23,282,544 | ||||||
New Jersey Transportation Trust Fund Authority (New Jersey Transportation Trust Fund Authority State Lease) | 10,000 | 10,153,300 | ||||||
| abfunds.com | AB MUNICIPAL BOND INFLATION STRATEGY | 23 | |
PORTFOLIO OF INVESTMENTS (continued)
| Principal Amount (000) | U.S. $ Value | |||||||
| ||||||||
Series 2014C | $ | 2,960 | $ | 3,010,083 | ||||
New Jersey Turnpike Authority | 1,600 | 1,774,144 | ||||||
5.00%, 01/01/2023 | 200 | 218,030 | ||||||
Series 2014A | 4,785 | 5,309,340 | ||||||
Series 2014C | 1,590 | 1,733,339 | ||||||
Series 2017A | 7,300 | 8,358,573 | ||||||
Tobacco Settlement Financing Corp. | 4,750 | 5,526,198 | ||||||
|
| |||||||
| 71,694,056 | ||||||||
|
| |||||||
New York – 8.2% |
| |||||||
City of New York NY | 1,030 | 1,085,836 | ||||||
5.00%, 08/01/2023 | 3,220 | 3,375,236 | ||||||
Series 2014J | 6,100 | 6,369,254 | ||||||
Metropolitan Transportation Authority | 4,065 | 4,501,581 | ||||||
5.00%, 11/15/2025 (Pre-refunded/ETM) | 5,000 | 5,537,000 | ||||||
Series 2012F | 3,635 | 3,641,761 | ||||||
Series 2013A | 2,300 | 2,587,178 | ||||||
Series 2013E | 8,510 | 9,729,398 | ||||||
New York City Municipal Water Finance Authority | 3,875 | 4,033,449 | ||||||
New York City Transitional Finance Authority Future Tax Secured Revenue | 6,830 | 7,391,290 | ||||||
New York State Dormitory Authority | 3,000 | 3,101,070 | ||||||
Series 2014A | 6,565 | 7,387,398 | ||||||
| 24 | AB MUNICIPAL BOND INFLATION STRATEGY | abfunds.com | |
PORTFOLIO OF INVESTMENTS (continued)
| Principal Amount (000) | U.S. $ Value | |||||||
| ||||||||
New York State Environmental Facilities Corp. | $ | 3,000 | $ | 3,134,280 | ||||
New York Transportation Development Corp. | 9,255 | 9,279,361 | ||||||
New York Transportation Development Corp. | 345 | 349,523 | ||||||
Triborough Bridge & Tunnel Authority | 4,100 | 4,189,872 | ||||||
|
| |||||||
| 75,693,487 | ||||||||
|
| |||||||
North Carolina – 0.8% |
| |||||||
State of North Carolina | 6,710 | 7,803,126 | ||||||
|
| |||||||
North Dakota – 0.1% |
| |||||||
County of Grand Forks ND | 1,000 | 756,400 | ||||||
|
| |||||||
Ohio – 4.5% |
| |||||||
American Municipal Power, Inc. | 5,000 | 5,742,550 | ||||||
Buckeye Tobacco Settlement Financing Authority | 10,000 | 9,989,800 | ||||||
Series 2020A | 1,000 | 1,050,840 | ||||||
City of Chillicothe/OH | 3,385 | 3,782,771 | ||||||
City of Cleveland OH Airport System Revenue AGM Series 2016B | 2,585 | 2,814,854 | ||||||
City of Cleveland OH Income Tax Revenue | 7,585 | 9,401,594 | ||||||
Series 2017B-2 | 1,485 | 1,842,959 | ||||||
| abfunds.com | AB MUNICIPAL BOND INFLATION STRATEGY | 25 | |
PORTFOLIO OF INVESTMENTS (continued)
| Principal Amount (000) | U.S. $ Value | |||||||
| ||||||||
County of Cuyahoga OH | $ | 5,600 | $ | 5,757,304 | ||||
Ohio Air Quality Development Authority | 235 | 236,763 | ||||||
Ohio Water Development Authority Water Pollution Control Loan Fund | 420 | 423,150 | ||||||
Series 2016B | 825 | 831,188 | ||||||
|
| |||||||
| 41,873,773 | ||||||||
|
| |||||||
Oklahoma – 0.1% |
| |||||||
Oklahoma Development Finance Authority | 500 | 473,440 | ||||||
|
| |||||||
Oregon – 0.9% |
| |||||||
Deschutes County Hospital Facilities Authority | 1,000 | 1,050,460 | ||||||
Tri-County Metropolitan Transportation District of Oregon | 4,605 | 4,879,320 | ||||||
Series 2018A | 1,910 | 2,354,533 | ||||||
|
| |||||||
| 8,284,313 | ||||||||
|
| |||||||
Pennsylvania – 5.7% |
| |||||||
City of Philadelphia PA | 12,990 | 15,975,232 | ||||||
City of Philadelphia PA Water & Wastewater Revenue | 2,135 | 2,535,661 | ||||||
Montgomery County Higher Education & Health Authority | 1,500 | 1,669,905 | ||||||
| 26 | AB MUNICIPAL BOND INFLATION STRATEGY | abfunds.com | |
PORTFOLIO OF INVESTMENTS (continued)
| Principal Amount (000) | U.S. $ Value | |||||||
| ||||||||
Moon Industrial Development Authority | $ | 2,060 | $ | 1,979,104 | ||||
Pennsylvania Turnpike Commission | 7,580 | 8,567,417 | ||||||
Series 2017S | 3,005 | 3,626,604 | ||||||
Series 2019 | 4,250 | 4,802,245 | ||||||
School District of Philadelphia (The) | 1,800 | 1,824,066 | ||||||
Series 2016F | 5,000 | 5,846,450 | ||||||
State Public School Building Authority | 2,400 | 2,590,992 | ||||||
5.00%, 04/01/2026 (Pre-refunded/ETM) | 2,750 | 2,968,845 | ||||||
|
| |||||||
| 52,386,521 | ||||||||
|
| |||||||
Puerto Rico – 0.6% |
| |||||||
Puerto Rico Electric Power Authority | 970 | 1,044,380 | ||||||
NATL Series 2007V | 320 | 325,560 | ||||||
Puerto Rico Highway & Transportation Authority AGC Series 2005L | 790 | 828,710 | ||||||
AGC Series 2007N | 2,105 | 2,244,099 | ||||||
AGM Series 2007C | 100 | 106,247 | ||||||
NATL Series 2007N | 205 | 206,863 | ||||||
Puerto Rico Public Buildings Authority | 100 | 106,107 | ||||||
Puerto Rico Sales Tax Financing Corp. Sales Tax Revenue | 1,144 | 973,613 | ||||||
|
| |||||||
| 5,835,579 | ||||||||
|
| |||||||
| abfunds.com | AB MUNICIPAL BOND INFLATION STRATEGY | 27 | |
PORTFOLIO OF INVESTMENTS (continued)
| Principal Amount (000) | U.S. $ Value | |||||||
| ||||||||
South Carolina – 1.3% |
| |||||||
Renewable Water Resources | $ | 1,425 | $ | 1,526,090 | ||||
5.00%, 01/01/2024 | 1,145 | 1,221,268 | ||||||
South Carolina Public Service Authority | 2,535 | 2,727,245 | ||||||
Series 2016B | 5,040 | 5,422,889 | ||||||
Series 2016C | 930 | 1,006,102 | ||||||
|
| |||||||
| 11,903,594 | ||||||||
|
| |||||||
Tennessee – 0.4% |
| |||||||
Bristol Industrial Development Board | 1,410 | 1,217,098 | ||||||
Metropolitan Government of Nashville & Davidson County TN | 455 | 496,423 | ||||||
5.00%, 07/01/2023 | 1,930 | 2,094,745 | ||||||
|
| |||||||
| 3,808,266 | ||||||||
|
| |||||||
Texas – 6.0% |
| |||||||
Birdville Independent School District | 3,825 | 4,101,356 | ||||||
Central Texas Regional Mobility Authority | 2,085 | 2,097,385 | ||||||
City of Corpus Christi TX Utility System Revenue | 5,675 | 5,944,392 | ||||||
City of Houston TX Airport System Revenue | 2,465 | 2,441,656 | ||||||
City of Houston TX Combined Utility System Revenue | 2,735 | 2,911,982 | ||||||
Series 2014C | 1,100 | 1,264,065 | ||||||
| 28 | AB MUNICIPAL BOND INFLATION STRATEGY | abfunds.com | |
PORTFOLIO OF INVESTMENTS (continued)
| Principal Amount (000) | U.S. $ Value | |||||||
| ||||||||
Dallas Area Rapid Transit | $ | 6,425 | $ | 7,078,554 | ||||
Harris County-Houston Sports Authority | 4,220 | 4,260,132 | ||||||
New Hope Cultural Education Facilities Finance Corp. | 1,000 | 1,036,990 | ||||||
North Texas Tollway Authority | 3,625 | 3,837,642 | ||||||
North Texas Tollway Authority | 3,000 | 3,176,070 | ||||||
Port Beaumont Navigation District | 240 | 196,162 | ||||||
Tarrant County Cultural Education Facilities Finance Corp. | 900 | 630,000 | ||||||
Tarrant County Cultural Education Facilities Finance Corp. | 13,405 | 15,700,104 | ||||||
Tarrant County Cultural Education Facilities Finance Corp. | 50 | 49,221 | ||||||
5.00%, 11/15/2025 | 1,105 | 990,533 | ||||||
|
| |||||||
| 55,716,244 | ||||||||
|
| |||||||
Virginia – 0.9% |
| |||||||
Fairfax County Economic Development Authority | 3,040 | 3,800,343 | ||||||
Federal Home Loan Mortgage Corp. | 3,870 | 4,012,803 | ||||||
|
| |||||||
| 7,813,146 | ||||||||
|
| |||||||
| abfunds.com | AB MUNICIPAL BOND INFLATION STRATEGY | 29 | |
PORTFOLIO OF INVESTMENTS (continued)
| Principal Amount (000) | U.S. $ Value | |||||||
| ||||||||
Washington – 4.4% |
| |||||||
Central Puget Sound Regional Transit Authority Series 2012P | $ | 7,815 | $ | 8,346,011 | ||||
Chelan County Public Utility District No. 1 | 3,305 | 3,468,201 | ||||||
City of Seattle WA Water System Revenue | 4,020 | 4,523,344 | ||||||
Port of Seattle WA | 3,000 | 3,425,760 | ||||||
Series 2013 | 4,820 | 5,270,381 | ||||||
State of Washington | 13,325 | 15,615,301 | ||||||
|
| |||||||
| 40,648,998 | ||||||||
|
| |||||||
Wisconsin – 2.0% |
| |||||||
UMA Education, Inc. 5.00%, 10/01/2022-10/01/2029(a) | 2,535 | 2,789,128 | ||||||
Wisconsin Department of Transportation | 9,520 | 10,672,980 | ||||||
5.00%, 07/01/2024 (Pre-refunded/ETM) | 2,480 | 2,800,044 | ||||||
Wisconsin Public Finance Authority | 2,550 | 2,503,284 | ||||||
|
| |||||||
| 18,765,436 | ||||||||
|
| |||||||
Total Long-Term Municipal Bonds | 944,377,151 | |||||||
|
| |||||||
Short-Term Municipal Notes – 0.0% |
| |||||||
Illinois – 0.0% |
| |||||||
Illinois Finance Authority | 155 | 156,799 | ||||||
|
| |||||||
Total Municipal Obligations | 944,533,950 | |||||||
|
| |||||||
| 30 | AB MUNICIPAL BOND INFLATION STRATEGY | abfunds.com | |
PORTFOLIO OF INVESTMENTS (continued)
| Principal Amount (000) | U.S. $ Value | |||||||
| ||||||||
GOVERNMENTS – TREASURIES – 2.3% |
| |||||||
United States – 2.3% |
| |||||||
U.S. Treasury Notes | $ | 15,000 | $ | 15,025,781 | ||||
2.625%, 02/15/2029(b) | 5,000 | 5,867,188 | ||||||
|
| |||||||
Total Governments – Treasuries | 20,892,969 | |||||||
|
| |||||||
COLLATERALIZED MORTGAGE OBLIGATIONS – 0.2% |
| |||||||
Risk Share Floating Rate – 0.2% |
| |||||||
Federal Home Loan Mortgage Corp. | 223 | 189,487 | ||||||
Series 2014-DN3, Class M3 | 148 | 117,298 | ||||||
Series 2016-DNA4, Class M3 | 250 | 241,598 | ||||||
Federal National Mortgage Association | 242 | 186,538 | ||||||
Series 2017-C01, Class 1M2 | 242 | 232,435 | ||||||
Series 2017-C02, Class 2M2 | 197 | 186,998 | ||||||
Series 2017-C03, Class 1M2 | 500 | 473,043 | ||||||
|
| |||||||
Total Collateralized Mortgage Obligations | 1,627,397 | |||||||
|
| |||||||
| abfunds.com | AB MUNICIPAL BOND INFLATION STRATEGY | 31 | |
PORTFOLIO OF INVESTMENTS (continued)
| Shares | U.S. $ Value | |||||||
| ||||||||
SHORT-TERM INVESTMENTS – 0.5% |
| |||||||
Investment Companies – 0.5% |
| |||||||
AB Fixed Income Shares, Inc. – Government Money Market Portfolio – Class AB, | 4,817,728 | $ | 4,817,728 | |||||
|
| |||||||
Total Investments – 105.5% | 971,872,044 | |||||||
Other assets less liabilities – (5.5)% | (50,510,769 | ) | ||||||
|
| |||||||
Net Assets – 100.0% | $ | 921,361,275 | ||||||
|
| |||||||
CENTRALLY CLEARED INFLATION (CPI) SWAPS (see Note D)
| Rate Type | ||||||||||||||||||||||||||||||||
| Notional Amount (000) | Termination Date | Payments made by the Fund | Payments received by the Fund | Payment Frequency Paid/ Received | Market Value | Upfront Premiums Paid/ (Received) | Unrealized Appreciation/ (Depreciation) | |||||||||||||||||||||||||
USD | 4,970 | 08/09/2024 | 1.690 | % | CPI | # | Maturity | $ | (200,553 | ) | $ | — | $ | (200,553 | ) | |||||||||||||||||
USD | 17,840 | 01/15/2025 | 1.671 | % | CPI | # | Maturity | (720,375 | ) | — | (720,375 | ) | ||||||||||||||||||||
USD | 17,837 | 01/15/2025 | 1.673 | % | CPI | # | Maturity | (751,394 | ) | — | (751,394 | ) | ||||||||||||||||||||
USD | 7,973 | 01/15/2025 | 1.637 | % | CPI | # | Maturity | (320,634 | ) | — | (320,634 | ) | ||||||||||||||||||||
USD | 19,310 | 01/15/2028 | 1.230 | % | CPI | # | Maturity | (72,838 | ) | — | (72,838 | ) | ||||||||||||||||||||
USD | 14,770 | 01/15/2028 | 0.735 | % | CPI | # | Maturity | 556,504 | — | 556,504 | ||||||||||||||||||||||
USD | 12,000 | 08/29/2029 | 1.748 | % | CPI | # | Maturity | (539,187 | ) | — | (539,187 | ) | ||||||||||||||||||||
USD | 15,000 | 12/23/2029 | 1.979 | % | CPI | # | Maturity | (1,070,283 | ) | — | (1,070,283 | ) | ||||||||||||||||||||
|
|
|
|
|
| |||||||||||||||||||||||||||
| $ | (3,118,760 | ) | $ | — | $ | (3,118,760 | ) | |||||||||||||||||||||||||
|
|
|
|
|
| |||||||||||||||||||||||||||
| # | Variable interest rate based on the rate of inflation as determined by the Consumer Price Index (CPI). |
CENTRALLY CLEARED INTEREST RATE SWAPS (see Note D)
| Rate Type | ||||||||||||||||||||||||||||
| Notional Amount (000) | Termination Date | Payments made by the Fund | Payments received by the Fund | Payment Frequency Paid/ Received | Market Value | Upfront Premiums Paid/ (Received) | Unrealized Appreciation/ (Depreciation) | |||||||||||||||||||||
USD | 45,150 | 06/17/2021 | 3 Month LIBOR | 1.907 | % | Quarterly/ Semi-Annual | $ | 1,056,476 | $ | — | $ | 1,056,476 | ||||||||||||||||
USD | 16,360 | 08/09/2022 | 3 Month LIBOR | 1.486 | % | Quarterly/ Semi-Annual | 426,342 | — | 426,342 | |||||||||||||||||||
USD | 32,000 | 09/10/2024 | 3 Month LIBOR | 1.341 | % | Quarterly/ Semi-Annual | 1,358,295 | — | 1,358,295 | |||||||||||||||||||
USD | 11,180 | 01/15/2025 | 3 Month LIBOR | 1.566 | % | Quarterly/ Semi-Annual | 651,334 | — | 651,334 | |||||||||||||||||||
USD | 3,172 | 02/05/2025 | 3 Month LIBOR | 1.361 | % | Quarterly/ Semi-Annual | 143,638 | — | 143,638 | |||||||||||||||||||
USD | 7,128 | 02/06/2025 | 3 Month LIBOR | 1.419 | % | Quarterly/ Semi-Annual | 343,207 | — | 343,207 | |||||||||||||||||||
| 32 | AB MUNICIPAL BOND INFLATION STRATEGY | abfunds.com | |
PORTFOLIO OF INVESTMENTS (continued)
| Rate Type | ||||||||||||||||||||||||||||
| Notional Amount (000) | Termination Date | Payments made by the Fund | Payments received by the Fund | Payment Frequency Paid/ Received | Market Value | Upfront Premiums Paid/ (Received) | Unrealized Appreciation/ (Depreciation) | |||||||||||||||||||||
USD | 8,235 | 10/09/2029 | 3 Month LIBOR | 1.470 | % | Quarterly/ Semi-Annual | $ | 646,907 | $ | — | $ | 646,907 | ||||||||||||||||
USD | 8,235 | 10/09/2029 | 3 Month LIBOR | 1.473 | % | Quarterly/ Semi-Annual | 649,228 | — | 649,228 | |||||||||||||||||||
|
|
|
|
|
| |||||||||||||||||||||||
| $ | 5,275,427 | $ | — | $ | 5,275,427 | |||||||||||||||||||||||
|
|
|
|
|
| |||||||||||||||||||||||
CREDIT DEFAULT SWAPS (see Note D)
| Swap Counterparty & Referenced Obligation | Fixed Rate (Pay/) Receive | Payment Frequency | Implied Credit Spread at April 30, 2020 | Notional Amount (000) | Market Value | Upfront Premiums Paid/ (Received) | Unrealized Appreciation/ (Depreciation) | |||||||||||||||||||||||||
Sale Contracts | ||||||||||||||||||||||||||||||||
Citigroup Global Markets, Inc. | ||||||||||||||||||||||||||||||||
CDX-CMBX.NA.BBB | 3.00 | % | Monthly | 13.94 | % | USD | 69 | $ | (22,431 | ) | $ | (6,832 | ) | $ | (15,599 | ) | ||||||||||||||||
CDX-CMBX.NA.BBB | 3.00 | Monthly | 13.94 | USD | 598 | (194,400 | ) | (76,384 | ) | (118,016 | ) | |||||||||||||||||||||
Credit Suisse International | ||||||||||||||||||||||||||||||||
CDX-CMBX.NA.BBB | 3.00 | Monthly | 13.94 | USD | 708 | (230,160 | ) | (69,012 | ) | (161,148 | ) | |||||||||||||||||||||
CDX-CMBX.NA.BBB | 3.00 | Monthly | 13.94 | USD | 38 | (12,353 | ) | (3,797 | ) | (8,556 | ) | |||||||||||||||||||||
CDX-CMBX.NA.BBB | 3.00 | Monthly | 13.94 | USD | 471 | (153,075 | ) | (47,120 | ) | (105,955 | ) | |||||||||||||||||||||
CDX-CMBX.NA.BBB | 3.00 | Monthly | 13.94 | USD | 1,216 | (395,301 | ) | (149,633 | ) | (245,668 | ) | |||||||||||||||||||||
CDX-CMBX.NA.BBB | 3.00 | Monthly | 13.94 | USD | 40 | (13,003 | ) | (4,955 | ) | (8,048 | ) | |||||||||||||||||||||
Goldman Sachs International | ||||||||||||||||||||||||||||||||
CDX-CMBX.NA.BBB | 3.00 | Monthly | 13.94 | USD | 614 | (199,601 | ) | (58,091 | ) | (141,510 | ) | |||||||||||||||||||||
CDX-CMBX.NA.BBB | 3.00 | Monthly | 13.94 | USD | 231 | (75,094 | ) | (29,383 | ) | (45,711 | ) | |||||||||||||||||||||
|
|
|
|
|
| |||||||||||||||||||||||||||
| $ | (1,295,418 | ) | $ | (445,207 | ) | $ | (850,211 | ) | ||||||||||||||||||||||||
|
|
|
|
|
| |||||||||||||||||||||||||||
| * | Termination date |
| abfunds.com | AB MUNICIPAL BOND INFLATION STRATEGY | 33 | |
PORTFOLIO OF INVESTMENTS (continued)
INFLATION (CPI) SWAPS (see Note D)
| Rate Type | ||||||||||||||||||||||||||||||||||||
| Swap Counterparty | Notional Amount (000) | Termination Date | Payments made by the Fund | Payments received by the Fund | Payment Frequency Paid Received | Market Value | Upfront Premiums Paid/ (Received) | Unrealized Appreciation/ (Depreciation) | ||||||||||||||||||||||||||||
Bank of America, NA | USD | 25,000 | 09/02/2020 | 1.548 | % | CPI# | Maturity | $ | 76,215 | $ | — | $ | 76,215 | |||||||||||||||||||||||
Bank of America, NA | USD | 25,000 | 02/02/2032 | 2.403 | % | CPI | # | Maturity | (3,931,252 | ) | — | (3,931,252 | ) | |||||||||||||||||||||||
Barclays Bank PLC | USD | 4,000 | 06/15/2020 | 2.480 | % | CPI | # | Maturity | (366,762 | ) | — | (366,762 | ) | |||||||||||||||||||||||
Barclays Bank PLC | USD | 35,000 | 07/02/2020 | 2.256 | % | CPI | # | Maturity | (2,008,261 | ) | — | (2,008,261 | ) | |||||||||||||||||||||||
Barclays Bank PLC | USD | 1,500 | 08/04/2020 | 2.308 | % | CPI | # | Maturity | (106,849 | ) | — | (106,849 | ) | |||||||||||||||||||||||
Barclays Bank PLC | USD | 25,256 | 09/20/2020 | 2.263 | % | CPI | # | Maturity | (534,323 | ) | — | (534,323 | ) | |||||||||||||||||||||||
Barclays Bank PLC | USD | 24,320 | 10/15/2020 | 2.208 | % | CPI | # | Maturity | (514,976 | ) | — | (514,976 | ) | |||||||||||||||||||||||
Barclays Bank PLC | USD | 12,934 | 10/15/2020 | 2.210 | % | CPI | # | Maturity | (274,538 | ) | — | (274,538 | ) | |||||||||||||||||||||||
Barclays Bank PLC | USD | 2,000 | 11/10/2020 | 2.500 | % | CPI | # | Maturity | (198,425 | ) | — | (198,425 | ) | |||||||||||||||||||||||
Barclays Bank PLC | USD | 1,000 | 05/04/2021 | 2.845 | % | CPI | # | Maturity | (166,521 | ) | — | (166,521 | ) | |||||||||||||||||||||||
Barclays Bank PLC | USD | 3,000 | 05/12/2021 | 2.815 | % | CPI | # | Maturity | (493,550 | ) | — | (493,550 | ) | |||||||||||||||||||||||
Barclays Bank PLC | USD | 14,000 | 04/03/2022 | 2.663 | % | CPI | # | Maturity | (2,267,180 | ) | — | (2,267,180 | ) | |||||||||||||||||||||||
Barclays Bank PLC | USD | 16,700 | 10/05/2022 | 2.765 | % | CPI | # | Maturity | (2,902,422 | ) | — | (2,902,422 | ) | |||||||||||||||||||||||
Barclays Bank PLC | USD | 25,000 | 08/07/2024 | 2.573 | % | CPI | # | Maturity | (4,048,609 | ) | — | (4,048,609 | ) | |||||||||||||||||||||||
Barclays Bank PLC | USD | 19,000 | 05/05/2025 | 2.125 | % | CPI | # | Maturity | (1,627,174 | ) | — | (1,627,174 | ) | |||||||||||||||||||||||
Barclays Bank PLC | USD | 5,400 | 03/06/2027 | 2.695 | % | CPI | # | Maturity | (1,391,754 | ) | — | (1,391,754 | ) | |||||||||||||||||||||||
Barclays Bank PLC | USD | 20,000 | 06/06/2032 | 2.145 | % | CPI | # | Maturity | (2,147,989 | ) | — | (2,147,989 | ) | |||||||||||||||||||||||
Barclays Bank PLC | USD | 14,000 | 09/01/2032 | 2.128 | % | CPI | # | Maturity | (1,421,491 | ) | — | (1,421,491 | ) | |||||||||||||||||||||||
Barclays Bank PLC | USD | 22,000 | 08/29/2033 | 2.368 | % | CPI | # | Maturity | (3,495,218 | ) | — | (3,495,218 | ) | |||||||||||||||||||||||
Citibank, NA | USD | 17,690 | 10/17/2020 | 2.220 | % | CPI | # | Maturity | (381,873 | ) | — | (381,873 | ) | |||||||||||||||||||||||
Citibank, NA | USD | 15,600 | 12/14/2020 | 1.548 | % | CPI | # | Maturity | 45,922 | — | 45,922 | |||||||||||||||||||||||||
Citibank, NA | USD | 35,000 | 07/03/2021 | 2.283 | % | CPI | # | Maturity | (1,432,228 | ) | — | (1,432,228 | ) | |||||||||||||||||||||||
Citibank, NA | USD | 9,000 | 06/29/2022 | 2.398 | % | CPI | # | Maturity | (1,215,249 | ) | — | (1,215,249 | ) | |||||||||||||||||||||||
Citibank, NA | USD | 5,400 | 07/19/2022 | 2.400 | % | CPI | # | Maturity | (720,963 | ) | — | (720,963 | ) | |||||||||||||||||||||||
Citibank, NA | USD | 4,000 | 08/10/2022 | 2.550 | % | CPI | # | Maturity | (600,044 | ) | — | (600,044 | ) | |||||||||||||||||||||||
Citibank, NA | USD | 15,500 | 12/07/2022 | 2.748 | % | CPI | # | Maturity | (2,790,979 | ) | — | (2,790,979 | ) | |||||||||||||||||||||||
Citibank, NA | USD | 47,000 | 05/24/2023 | 2.533 | % | CPI | # | Maturity | (7,229,752 | ) | — | (7,229,752 | ) | |||||||||||||||||||||||
Citibank, NA | USD | 30,000 | 10/29/2023 | 2.524 | % | CPI | # | Maturity | (4,498,189 | ) | — | (4,498,189 | ) | |||||||||||||||||||||||
Citibank, NA | USD | 30,000 | 09/19/2024 | 2.070 | % | CPI | # | Maturity | (1,735,411 | ) | — | (1,735,411 | ) | |||||||||||||||||||||||
Citibank, NA | USD | 25,000 | 07/03/2025 | 2.351 | % | CPI | # | Maturity | (2,314,622 | ) | — | (2,314,622 | ) | |||||||||||||||||||||||
Citibank, NA | USD | 15,800 | 02/08/2028 | 2.940 | % | CPI | # | Maturity | (4,889,116 | ) | — | (4,889,116 | ) | |||||||||||||||||||||||
Citibank, NA | USD | 12,000 | 11/05/2033 | 2.273 | % | CPI | # | Maturity | (1,667,268 | ) | — | (1,667,268 | ) | |||||||||||||||||||||||
Deutsche Bank AG | USD | 11,000 | 06/20/2021 | 2.655 | % | CPI | # | Maturity | (1,664,531 | ) | — | (1,664,531 | ) | |||||||||||||||||||||||
Deutsche Bank AG | USD | 9,800 | 09/07/2021 | 2.400 | % | CPI | # | Maturity | (1,205,312 | ) | — | (1,205,312 | ) | |||||||||||||||||||||||
Deutsche Bank AG | USD | 25,000 | 09/02/2025 | 1.880 | % | CPI | # | Maturity | (1,569,309 | ) | — | (1,569,309 | ) | |||||||||||||||||||||||
| 34 | AB MUNICIPAL BOND INFLATION STRATEGY | abfunds.com | |
PORTFOLIO OF INVESTMENTS (continued)
| Rate Type | ||||||||||||||||||||||||||||||||||||
| Swap Counterparty | Notional Amount (000) | Termination Date | Payments made by the Fund | Payments received by the Fund | Payment Frequency Paid Received | Market Value | Upfront Premiums Paid/ (Received) | Unrealized Appreciation/ (Depreciation) | ||||||||||||||||||||||||||||
JPMorgan Chase Bank, NA | USD | 1,000 | 07/29/2020 | 2.305 | % | CPI | # | Maturity | $ | (70,913 | ) | $ | — | $ | (70,913 | ) | ||||||||||||||||||||
JPMorgan Chase Bank, NA | USD | 22,064 | 08/30/2020 | 2.210 | % | CPI | # | Maturity | (419,130 | ) | — | (419,130 | ) | |||||||||||||||||||||||
JPMorgan Chase Bank, NA | USD | 19,000 | 08/17/2022 | 2.523 | % | CPI | # | Maturity | (2,772,332 | ) | — | (2,772,332 | ) | |||||||||||||||||||||||
JPMorgan Chase Bank, NA | USD | 1,400 | 06/30/2026 | 2.890 | % | CPI | # | Maturity | (421,660 | ) | — | (421,660 | ) | |||||||||||||||||||||||
JPMorgan Chase Bank, NA | USD | 3,300 | 07/21/2026 | 2.935 | % | CPI | # | Maturity | (1,033,856 | ) | — | (1,033,856 | ) | |||||||||||||||||||||||
JPMorgan Chase Bank, NA | USD | 2,400 | 10/03/2026 | 2.485 | % | CPI | # | Maturity | (515,416 | ) | — | (515,416 | ) | |||||||||||||||||||||||
JPMorgan Chase Bank, NA | USD | 5,400 | 11/14/2026 | 2.488 | % | CPI | # | Maturity | (1,171,936 | ) | — | (1,171,936 | ) | |||||||||||||||||||||||
JPMorgan Chase Bank, NA | USD | 4,850 | 12/23/2026 | 2.484 | % | CPI | # | Maturity | (1,040,350 | ) | — | (1,040,350 | ) | |||||||||||||||||||||||
JPMorgan Chase Bank, NA | USD | 13,000 | 03/01/2027 | 2.279 | % | CPI | # | Maturity | (1,340,901 | ) | — | (1,340,901 | ) | |||||||||||||||||||||||
JPMorgan Chase Bank, NA | USD | 21,350 | 02/20/2028 | 2.899 | % | CPI | # | Maturity | (6,402,827 | ) | — | (6,402,827 | ) | |||||||||||||||||||||||
JPMorgan Chase Bank, NA | USD | 12,000 | 03/26/2028 | 2.880 | % | CPI | # | Maturity | (3,537,181 | ) | — | (3,537,181 | ) | |||||||||||||||||||||||
JPMorgan Chase Bank, NA | USD | 10,000 | 07/03/2028 | 2.356 | % | CPI | # | Maturity | (1,171,451 | ) | — | (1,171,451 | ) | |||||||||||||||||||||||
JPMorgan Chase Bank, NA | USD | 25,000 | 11/05/2028 | 2.234 | % | CPI | # | Maturity | (2,575,210 | ) | — | (2,575,210 | ) | |||||||||||||||||||||||
JPMorgan Chase Bank, NA | USD | 18,000 | 04/17/2030 | 2.378 | % | CPI | # | Maturity | (2,430,399 | ) | — | (2,430,399 | ) | |||||||||||||||||||||||
JPMorgan Chase Bank, NA | USD | 24,000 | 11/17/2032 | 2.183 | % | CPI | # | Maturity | (2,757,142 | ) | — | (2,757,142 | ) | |||||||||||||||||||||||
Morgan Stanley Capital Services LLC | USD | 2,000 | 10/14/2020 | 2.370 | % | CPI | # | Maturity | (162,460 | ) | — | (162,460 | ) | |||||||||||||||||||||||
Morgan Stanley Capital Services LLC | USD | 13,000 | 05/23/2021 | 2.680 | % | CPI | # | Maturity | (1,946,002 | ) | — | (1,946,002 | ) | |||||||||||||||||||||||
Morgan Stanley Capital Services LLC | USD | 10,000 | 04/16/2023 | 2.690 | % | CPI | # | Maturity | (1,716,799 | ) | — | (1,716,799 | ) | |||||||||||||||||||||||
| abfunds.com | AB MUNICIPAL BOND INFLATION STRATEGY | 35 | |
PORTFOLIO OF INVESTMENTS (continued)
| Rate Type | ||||||||||||||||||||||||||||||||||||
| Swap Counterparty | Notional Amount (000) | Termination Date | Payments made by the Fund | Payments received by the Fund | Payment Frequency Paid Received | Market Value | Upfront Premiums Paid/ (Received) | Unrealized Appreciation/ (Depreciation) | ||||||||||||||||||||||||||||
Morgan Stanley Capital Services LLC | USD | 5,000 | 08/15/2026 | 2.885 | % | CPI | # | Maturity | $ | (1,508,804 | ) | $ | — | $ | (1,508,804 | ) | ||||||||||||||||||||
|
|
|
|
|
| |||||||||||||||||||||||||||||||
| $ | (94,684,772 | ) | $ | — | $ | (94,684,772 | ) | |||||||||||||||||||||||||||||
|
|
|
|
|
| |||||||||||||||||||||||||||||||
| # | Variable interest rate based on the rate of inflation as determined by the Consumer Price Index (CPI). |
INTEREST RATE SWAPS (see Note D)
| Rate Type | ||||||||||||||||||||||||||||||||||||
| Swap Counterparty | Notional Amount (000) | Termination Date | Payments made by the Fund | Payments received by the Fund | Payment Frequency Paid/ Received | Market Value | Upfront Premiums Paid/ (Received) | Unrealized Appreciation/ (Depreciation) | ||||||||||||||||||||||||||||
Citibank, NA | USD | 11,075 | 10/09/2029 | 1.120 | % | SIFMA* | | Quarterly/ Quarterly | $ | (544,813 | ) | $ | — | $ | (544,813 | ) | ||||||||||||||||||||
Citibank, NA | USD | 11,075 | 10/09/2029 | 1.125 | % | SIFMA | * | | Quarterly/ Quarterly | (550,539 | ) | — | (550,539 | ) | ||||||||||||||||||||||
|
|
|
|
|
| |||||||||||||||||||||||||||||||
| $ | (1,095,352 | ) | $ | — | $ | (1,095,352 | ) | |||||||||||||||||||||||||||||
|
|
|
|
|
| |||||||||||||||||||||||||||||||
| * | Variable interest rate based on the Securities Industry & Financial Markets Association (SIFMA) Municipal Swap Index. |
| (a) | Security is exempt from registration under Rule 144A of the Securities Act of 1933. These securities are considered restricted, but liquid and may be resold in transactions exempt from registration, normally to qualified institutional buyers. At April 30, 2020, the aggregate market value of these securities amounted to $24,433,597 or 2.7% of net assets. |
| (b) | Position, or a portion thereof, has been segregated to collateralize OTC derivatives outstanding. |
| (c) | An auction rate security whose interest rate resets at each auction date. Auctions are typically held every week or month. The rate shown is as of April 30, 2020 and the aggregate market value of these securities amounted to $350,000 or 0.04% of net assets. |
| (d) | Floating Rate Security. Stated interest/floor/ceiling rate was in effect at April 30, 2020. |
| (e) | When-Issued or delayed delivery security. |
| (f) | Non-income producing security. |
| (g) | Defaulted. |
| (h) | Illiquid security. |
| (i) | Affiliated investments. |
| (j) | The rate shown represents the 7-day yield as of period end. |
| (k) | To obtain a copy of the fund’s shareholder report, please go to the Securities and Exchange Commission’s website at www.sec.gov, or call AB at (800) 227-4618. |
| 36 | AB MUNICIPAL BOND INFLATION STRATEGY | abfunds.com | |
PORTFOLIO OF INVESTMENTS (continued)
As of April 30, 2020, the Fund’s percentages of investments in municipal bonds that are insured and in insured municipal bonds that have been pre-refunded or escrowed to maturity are 3.8% and 0.2%, respectively.
Glossary:
AGC – Assured Guaranty Corporation
AGM – Assured Guaranty Municipal
COP – Certificate of Participation
CPI – Consumer Price Index
ETM – Escrowed to Maturity
LIBOR – London Interbank Offered Rates
NATL – National Interstate Corporation
SRF – State Revolving Fund
XLCA – XL Capital Assurance Inc.
See notes to financial statements.
| abfunds.com | AB MUNICIPAL BOND INFLATION STRATEGY | 37 | |
STATEMENT OF ASSETS & LIABILITIES
April 30, 2020 (unaudited)
| Assets |
| |||
Investments in securities, at value | ||||
Unaffiliated issuers (cost $951,246,943) | $ | 967,054,316 | ||
Affiliated issuers (cost $4,817,728) | 4,817,728 | |||
Cash | 5,892 | |||
Cash collateral due from broker | 44,453,683 | |||
Interest receivable | 12,485,648 | |||
Receivable for investment securities sold | 1,780,969 | |||
Receivable for capital stock sold | 983,985 | |||
Unrealized appreciation on inflation swaps | 122,137 | |||
Affiliated dividends receivable | 870 | |||
|
| |||
Total assets | 1,031,705,228 | |||
|
| |||
| Liabilities | ||||
Unrealized depreciation on inflation swaps | 94,806,909 | |||
Payable for investment securities purchased | 11,106,045 | |||
Payable for capital stock redeemed | 1,490,267 | |||
Market value on credit default swaps (net premiums received $445,207) | 1,295,418 | |||
Unrealized depreciation on interest rate swaps | 1,095,352 | |||
Advisory fee payable | 320,154 | |||
Payable for variation margin on centrally cleared swaps | 63,366 | |||
Distribution fee payable | 59,765 | |||
Administrative fee payable | 25,257 | |||
Transfer Agent fee payable | 10,453 | |||
Directors’ fees payable | 715 | |||
Accrued expenses | 70,252 | |||
|
| |||
Total liabilities | 110,343,953 | |||
|
| |||
Net Assets | $ | 921,361,275 | ||
|
| |||
| Composition of Net Assets |
| |||
Capital stock, at par | $ | 96,334 | ||
Additional paid-in capital | 1,019,871,796 | |||
Accumulated loss | (98,606,855 | ) | ||
|
| |||
| $ | 921,361,275 | |||
|
| |||
Net Asset Value Per Share—30 billion shares of capital stock authorized, $.001 par value
| Class | Net Assets | Shares Outstanding | Net Asset Value | |||||||||
| ||||||||||||
| A | $ | 80,833,874 | 8,422,705 | $ | 9.60 | * | ||||||
| ||||||||||||
| C | $ | 6,934,469 | 723,278 | $ | 9.59 | |||||||
| ||||||||||||
| Advisor | $ | 169,410,405 | 17,642,903 | $ | 9.60 | |||||||
| ||||||||||||
| 1 | $ | 445,796,636 | 46,688,406 | $ | 9.55 | |||||||
| ||||||||||||
| 2 | $ | 218,385,891 | 22,856,801 | $ | 9.55 | |||||||
| ||||||||||||
| * | The maximum offering price per share for Class A shares was $9.90 which reflects a sales charge of 3.00%. |
See notes to financial statements.
| 38 | AB MUNICIPAL BOND INFLATION STRATEGY | abfunds.com | |
STATEMENT OF OPERATIONS
Six Months Ended April 30, 2020 (unaudited)
| Investment Income | ||||||||
Interest | $ | 15,281,334 | ||||||
Dividends—Affiliated issuers | 215,654 | $ | 15,496,988 | |||||
|
| |||||||
| Expenses | ||||||||
Advisory fee (see Note B) | 2,554,417 | |||||||
Distribution fee—Class A | 98,227 | |||||||
Distribution fee—Class C | 36,886 | |||||||
Distribution fee—Class 1 | 246,183 | |||||||
Transfer agency—Class A | 16,363 | |||||||
Transfer agency—Class C | 1,570 | |||||||
Transfer agency—Advisor Class | 43,283 | |||||||
Transfer agency—Class 1 | 12,043 | |||||||
Transfer agency—Class 2 | 5,710 | |||||||
Custodian | 92,640 | |||||||
Registration fees | 59,503 | |||||||
Audit and tax | 42,742 | |||||||
Administrative | 40,683 | |||||||
Printing | 22,600 | |||||||
Legal | 19,576 | |||||||
Directors’ fees | 11,705 | |||||||
Miscellaneous | 26,859 | |||||||
|
| |||||||
Total expenses | 3,330,990 | |||||||
Less: expenses waived and reimbursed by the Adviser (see Note B) | (395,110 | ) | ||||||
|
| |||||||
Net expenses | 2,935,880 | |||||||
|
| |||||||
Net investment income | 12,561,108 | |||||||
|
| |||||||
| Realized and Unrealized Loss on Investment Transactions | ||||||||
Net realized loss on: | ||||||||
Investment transactions | (572,597 | ) | ||||||
Swaps | (3,880,972 | ) | ||||||
Net change in unrealized appreciation/depreciation of: | ||||||||
Investments | (35,887,609 | ) | ||||||
Swaps | (30,353,828 | ) | ||||||
|
| |||||||
Net loss on investment transactions | (70,695,006 | ) | ||||||
|
| |||||||
Net Decrease in Net Assets from Operations | $ | (58,133,898 | ) | |||||
|
|
See notes to financial statements.
| abfunds.com | AB MUNICIPAL BOND INFLATION STRATEGY | 39 | |
STATEMENT OF CHANGES IN NET ASSETS
| Six Months Ended April 30, 2020 (unaudited) | Year Ended October 31, 2019 | |||||||
| Increase (Decrease) in Net Assets from Operations | ||||||||
Net investment income | $ | 12,561,108 | $ | 25,207,711 | ||||
Net realized loss on investment transactions | (4,453,569 | ) | (2,507,015 | ) | ||||
Net change in unrealized appreciation/depreciation of investments | (66,241,437 | ) | 23,007,434 | |||||
|
|
|
| |||||
Net increase (decrease) in net assets from operations | (58,133,898 | ) | 45,708,130 | |||||
Distributions to Shareholders | ||||||||
Class A | (880,382 | ) | (1,289,741 | ) | ||||
Class C | (54,305 | ) | (137,912 | ) | ||||
Advisor Class | (2,616,639 | ) | (5,312,312 | ) | ||||
Class 1 | (6,005,134 | ) | (12,623,500 | ) | ||||
Class 2 | (2,962,209 | ) | (6,307,648 | ) | ||||
| Capital Stock Transactions | ||||||||
Net decrease | (12,722,716 | ) | (43,748,072 | ) | ||||
|
|
|
| |||||
Total decrease | (83,375,283 | ) | (23,711,055 | ) | ||||
| Net Assets | ||||||||
Beginning of period | 1,004,736,558 | 1,028,447,613 | ||||||
|
|
|
| |||||
End of period | $ | 921,361,275 | $ | 1,004,736,558 | ||||
|
|
|
| |||||
See notes to financial statements.
| 40 | AB MUNICIPAL BOND INFLATION STRATEGY | abfunds.com | |
NOTES TO FINANCIAL STATEMENTS
April 30, 2020 (unaudited)
NOTE A
Significant Accounting Policies
AB Bond Fund, Inc. (the “Company”) is registered under the Investment Company Act of 1940 as an open-end management investment company. The Company, which is a Maryland corporation, operates as a series company comprised of ten portfolios currently in operation. Each portfolio is considered to be a separate entity for financial reporting and tax purposes. This report relates only to the AB Municipal Bond Inflation Strategy (the “Fund”), a diversified portfolio. The Fund offers Class A, Class C, Advisor Class, Class 1 and Class 2 shares. Class 1 shares are sold only to the private clients of Sanford C. Bernstein & Co. LLC by its registered representatives. Class B, Class R, Class K, Class I and Class T shares have been authorized but currently are not offered. Class A shares are sold with a front-end sales charge of up to 3.0% for purchases not exceeding $500,000. With respect to purchases of $500,000 or more, Class A shares redeemed within one year of purchase may be subject to a contingent deferred sales charge of 1%. Class C shares are subject to a contingent deferred sales charge of 1% on redemptions made within the first year after purchase, and 0% after the first year of purchase. Class C shares will automatically convert to Class A shares ten years after the end of the calendar month of purchase. Advisor Class and Class 2 shares are sold without an initial or contingent deferred sales charge and are not subject to ongoing distribution expenses. Class 1 shares are sold without an initial or contingent deferred sales charge, but are subject to ongoing distribution expenses. All ten classes of shares have identical voting, dividend, liquidation and other rights, except that the classes bear different distribution and transfer agency expenses. Each class has exclusive voting rights with respect to its distribution plan. The financial statements have been prepared in conformity with U.S. generally accepted accounting principles (“U.S. GAAP”) which require management to make certain estimates and assumptions that affect the reported amounts of assets and liabilities in the financial statements and amounts of income and expenses during the reporting period. Actual results could differ from those estimates. The Fund is an investment company under U.S. GAAP and follows the accounting and reporting guidance applicable to investment companies. The following is a summary of significant accounting policies followed by the Fund.
1. Security Valuation
Portfolio securities are valued at their current market value determined on the basis of market quotations or, if market quotations are not readily available or are deemed unreliable, at “fair value” as determined in accordance with procedures established by and under the general supervision of the Company’s Board of Directors (the “Board”).
| abfunds.com | AB MUNICIPAL BOND INFLATION STRATEGY | 41 | |
NOTES TO FINANCIAL STATEMENTS (continued)
In general, the market values of securities which are readily available and deemed reliable are determined as follows: securities listed on a national securities exchange (other than securities listed on the NASDAQ Stock Market, Inc. (“NASDAQ”)) or on a foreign securities exchange are valued at the last sale price at the close of the exchange or foreign securities exchange. If there has been no sale on such day, the securities are valued at the last traded price from the previous day. Securities listed on more than one exchange are valued by reference to the principal exchange on which the securities are traded; securities listed only on NASDAQ are valued in accordance with the NASDAQ Official Closing Price; listed or over the counter (“OTC”) market put or call options are valued at the mid level between the current bid and ask prices. If either a current bid or current ask price is unavailable, AllianceBernstein L.P. (the “Adviser”) will have discretion to determine the best valuation (e.g., last trade price in the case of listed options); open futures are valued using the closing settlement price or, in the absence of such a price, the most recent quoted bid price. If there are no quotations available for the day of valuation, the last available closing settlement price is used; U.S. Government securities and any other debt instruments having 60 days or less remaining until maturity are generally valued at market by an independent pricing vendor, if a market price is available. If a market price is not available, the securities are valued at amortized cost. This methodology is commonly used for short term securities that have an original maturity of 60 days or less, as well as short term securities that had an original term to maturity that exceeded 60 days. In instances when amortized cost is utilized, the Valuation Committee (the “Committee”) must reasonably conclude that the utilization of amortized cost is approximately the same as the fair value of the security. Such factors the Committee will consider include, but are not limited to, an impairment of the creditworthiness of the issuer or material changes in interest rates. Fixed-income securities, including mortgage-backed and asset-backed securities, may be valued on the basis of prices provided by a pricing service or at a price obtained from one or more of the major broker-dealers. In cases where broker-dealer quotes are obtained, the Adviser may establish procedures whereby changes in market yields or spreads are used to adjust, on a daily basis, a recently obtained quoted price on a security. Swaps and other derivatives are valued daily, primarily using independent pricing services, independent pricing models using market inputs, as well as third party broker-dealers or counterparties. Open end mutual funds are valued at the closing net asset value per share, while exchange traded funds are valued at the closing market price per share.
Securities for which market quotations are not readily available (including restricted securities) or are deemed unreliable are valued at fair value as deemed appropriate by the Adviser. Factors considered in making this
| 42 | AB MUNICIPAL BOND INFLATION STRATEGY | abfunds.com | |
NOTES TO FINANCIAL STATEMENTS (continued)
determination may include, but are not limited to, information obtained by contacting the issuer, analysts, analysis of the issuer’s financial statements or other available documents. In addition, the Fund may use fair value pricing for securities primarily traded in non-U.S. markets because most foreign markets close well before the Fund values its securities at 4:00 p.m., Eastern Time. The earlier close of these foreign markets gives rise to the possibility that significant events, including broad market moves, may have occurred in the interim and may materially affect the value of those securities. To account for this, the Fund generally values many of its foreign equity securities using fair value prices based on third party vendor modeling tools to the extent available.
2. Fair Value Measurements
In accordance with U.S. GAAP regarding fair value measurements, fair value is defined as the price that the Fund would receive to sell an asset or pay to transfer a liability in an orderly transaction between market participants at the measurement date. U.S. GAAP establishes a framework for measuring fair value, and a three-level hierarchy for fair value measurements based upon the transparency of inputs to the valuation of an asset or liability (including those valued based on their market values as described in Note A.1 above). Inputs may be observable or unobservable and refer broadly to the assumptions that market participants would use in pricing the asset or liability. Observable inputs reflect the assumptions market participants would use in pricing the asset or liability based on market data obtained from sources independent of the Fund. Unobservable inputs reflect the Fund’s own assumptions about the assumptions that market participants would use in pricing the asset or liability based on the best information available in the circumstances. Each investment is assigned a level based upon the observability of the inputs which are significant to the overall valuation. The three-tier hierarchy of inputs is summarized below.
| • | Level 1—quoted prices in active markets for identical investments |
| • | Level 2—other significant observable inputs (including quoted prices for similar investments, interest rates, prepayment speeds, credit risk, etc.) |
| • | Level 3—significant unobservable inputs (including the Fund’s own assumptions in determining the fair value of investments) |
The fair value of debt instruments, such as bonds, and over-the-counter derivatives is generally based on market price quotations, recently executed market transactions (where observable) or industry recognized modeling techniques and are generally classified as Level 2. Pricing vendor inputs to Level 2 valuations may include quoted prices for similar investments in active markets, interest rates, coupon rates, yield curves, option adjusted spreads, default rates, credit spreads and other unique security
| abfunds.com | AB MUNICIPAL BOND INFLATION STRATEGY | 43 | |
NOTES TO FINANCIAL STATEMENTS (continued)
features in order to estimate the relevant cash flows which is then discounted to calculate fair values. If these inputs are unobservable and significant to the fair value, these investments will be classified as Level 3.
Other fixed income investments, including non-U.S. government and corporate debt, are generally valued using quoted market prices, if available, which are typically impacted by current interest rates, maturity dates and any perceived credit risk of the issuer. Additionally, in the absence of quoted market prices, these inputs are used by pricing vendors to derive a valuation based upon industry or proprietary models which incorporate issuer specific data with relevant yield/spread comparisons with more widely quoted bonds with similar key characteristics. Those investments for which there are observable inputs are classified as Level 2. Where the inputs are not observable, the investments are classified as Level 3.
The following table summarizes the valuation of the Fund’s investments by the above fair value hierarchy levels as of April 30, 2020:
Investments in Securities: | Level 1 | Level 2 | Level 3 | Total | ||||||||||||
Assets: | ||||||||||||||||
Long-Term Municipal Bonds | $ | – 0 | – | $ | 944,377,151 | $ | – 0 | – | $ | 944,377,151 | ||||||
Short-Term Municipal Notes | – 0 | – | 156,799 | – 0 | – | 156,799 | ||||||||||
Governments – Treasuries | – 0 | – | 20,892,969 | – 0 | – | 20,892,969 | ||||||||||
Collateralized Mortgage Obligations | – 0 | – | 1,627,397 | – 0 | – | 1,627,397 | ||||||||||
Investment Companies | 4,817,728 | – 0 | – | – 0 | – | 4,817,728 | ||||||||||
|
|
|
|
|
|
|
| |||||||||
Total Investments in Securities | 4,817,728 | 967,054,316 | – 0 | – | 971,872,044 | |||||||||||
Other Financial Instruments(a): | ||||||||||||||||
Assets: | ||||||||||||||||
Centrally Cleared Inflation (CPI) Swaps | – 0 | – | 556,504 | – 0 | – | 556,504 | (b) | |||||||||
Centrally Cleared Interest Rate Swaps | – 0 | – | 5,275,427 | – 0 | – | 5,275,427 | (b) | |||||||||
Inflation (CPI) Swaps | – 0 | – | 122,137 | – 0 | – | 122,137 | ||||||||||
Liabilities: | ||||||||||||||||
Centrally Cleared Inflation (CPI) Swaps | – 0 | – | (3,675,264 | ) | – 0 | – | (3,675,264 | )(b) | ||||||||
Credit Default Swaps | – 0 | – | (1,295,418 | ) | – 0 | – | (1,295,418 | ) | ||||||||
Inflation (CPI) Swaps | – 0 | – | (94,806,909 | ) | – 0 | – | (94,806,909 | ) | ||||||||
Interest Rate Swaps | – 0 | – | (1,095,352 | ) | – 0 | – | (1,095,352 | ) | ||||||||
|
|
|
|
|
|
|
| |||||||||
Total | $ | 4,817,728 | $ | 872,135,441 | $ | – 0 | – | $ | 876,953,169 | |||||||
|
|
|
|
|
|
|
| |||||||||
| (a) | Other financial instruments are derivative instruments, such as futures, forwards and swaps, which are valued at the unrealized appreciation/(depreciation) on the instrument. Other financial instruments may also include swaps with upfront premiums, options written and swaptions written which are valued at market value. |
| (b) | Only variation margin receivable/(payable) at period end is reported within the statement of assets and liabilities. This amount reflects cumulative unrealized appreciation/(depreciation) on futures and centrally cleared swaps as reported in the portfolio of investments. Where applicable, centrally cleared swaps with upfront premiums are presented here at market value. |
| 44 | AB MUNICIPAL BOND INFLATION STRATEGY | abfunds.com | |
NOTES TO FINANCIAL STATEMENTS (continued)
3. Taxes
It is the Fund’s policy to meet the requirements of the Internal Revenue Code applicable to regulated investment companies and to distribute all of its investment company taxable income and net realized gains, if any, to shareholders. Therefore, no provisions for federal income or excise taxes are required.
In accordance with U.S. GAAP requirements regarding accounting for uncertainties in income taxes, management has analyzed the Fund’s tax positions taken or expected to be taken on federal and state income tax returns for all open tax years (the current and the prior three tax years) and has concluded that no provision for income tax is required in the Fund’s financial statements.
4. Investment Income and Investment Transactions
Dividend income is recorded on the ex-dividend date or as soon as the Fund is informed of the dividend. Interest income is accrued daily. Investment transactions are accounted for on the date the securities are purchased or sold. Investment gains or losses are determined on the identified cost basis. The Fund amortizes premiums and accretes original issue and market discounts as adjustments to interest income.
5. Class Allocations
All income earned and expenses incurred by the Fund are borne on a pro-rata basis by each outstanding class of shares, based on the proportionate interest in the Fund represented by the net assets of such class, except for class specific expenses which are allocated to the respective class. Expenses of the Company are charged proportionately to each fund or based on other appropriate methods. Realized and unrealized gains and losses are allocated among the various share classes based on respective net assets.
6. Dividends and Distributions
Dividends and distributions to shareholders, if any, are recorded on the ex-dividend date. Income dividends and capital gains distributions are determined in accordance with federal tax regulations and may differ from those determined in accordance with U.S. GAAP. To the extent these differences are permanent, such amounts are reclassified within the capital accounts based on their federal tax basis treatment; temporary differences do not require such reclassification.
NOTE B
Advisory Fee and Other Transactions with Affiliates
Under the terms of the investment advisory agreement, the Fund pays the Adviser an advisory fee at an annual rate of .50% of the first $2.5 billion, .45% of the next $2.5 billion and .40% in excess of $5 billion, of the Fund’s
| abfunds.com | AB MUNICIPAL BOND INFLATION STRATEGY | 45 | |
NOTES TO FINANCIAL STATEMENTS (continued)
average daily net assets. The fee is accrued daily and paid monthly. The Adviser has agreed to waive its fees and bear certain expenses to the extent necessary to limit total operating expenses (excluding extraordinary expenses, interest expense, and acquired fund fees and expenses other than the advisory fees of any AB mutual funds in which the Fund may invest) on an annual basis (the “Expense Caps”) to .75%, 1.50%, .50%, .60% and .50% of the daily average net assets for the Class A, Class C, Advisor Class, Class 1 and Class 2 shares, respectively. This fee waiver and/or expense reimbursement agreement will remain in effect until January 31, 2021 and then may be extended by the Adviser for additional one-year terms. For the six months ended April 30, 2020, such reimbursements/waivers amounted to $380,866.
Pursuant to the investment advisory agreement, the Fund may reimburse the Adviser for certain legal and accounting services provided to the Fund by the Adviser. For the six months ended April 30, 2020, the reimbursement for such services amounted to $40,683.
The Fund compensates AllianceBernstein Investor Services, Inc. (“ABIS”), a wholly-owned subsidiary of the Adviser, under a Transfer Agency Agreement for providing personnel and facilities to perform transfer agency services for the Fund. ABIS may make payments to intermediaries that provide omnibus account services, sub-accounting services and/or networking services. Such compensation retained by ABIS amounted to $30,490 for the six months ended April 30, 2020.
AllianceBernstein Investments, Inc. (the “Distributor”), a wholly-owned subsidiary of the Adviser, serves as the distributor of the Fund’s shares. The Distributor has advised the Fund that it has retained front-end sales charges of $0 from the sale of Class A shares and received $80,031 and $31 in contingent deferred sales charges imposed upon redemptions by shareholders of Class A and Class C shares, respectively, for the six months ended April 30, 2020.
The Fund may invest in AB Government Money Market Portfolio (the “Government Money Market Portfolio”) which has a contractual annual advisory fee rate of .20% of the portfolio’s average daily net assets and bears its own expenses. The Adviser has contractually agreed to waive .10% of the advisory fee of Government Money Market Portfolio (resulting in a net advisory fee of .10%) until August 31, 2020. In connection with the investment by the Fund in Government Money Market Portfolio, the Adviser has contractually agreed to waive its advisory fee from the Fund in an amount equal to the Fund’s pro rata share of the effective advisory fee of Government Money Market Portfolio, as borne indirectly by the Fund as an acquired fund fee and expense. For the six months ended April 30, 2020, such waiver amounted to $14,244.
| 46 | AB MUNICIPAL BOND INFLATION STRATEGY | abfunds.com | |
NOTES TO FINANCIAL STATEMENTS (continued)
A summary of the Fund’s transactions in AB mutual funds for the six months ended April 30, 2020 is as follows:
Fund | Market Value 10/31/19 (000) | Purchases at Cost (000) | Sales Proceeds (000) | Market Value 4/30/20 (000) | Dividend Income (000) | |||||||||||||||
Government Money Market Portfolio | $ | 3,714 | $ | 176,239 | $ | 175,135 | $ | 4,818 | $ | 216 | ||||||||||
During the second quarter of 2018, AXA S.A. (“AXA”), a French holding company for the AXA Group, completed the sale of a minority stake in its subsidiary, AXA Equitable Holdings, Inc. (now named Equitable Holdings, Inc.)(“Equitable”), through an initial public offering. Equitable is the holding company for a diverse group of financial services companies, including an approximately 64.9% economic interest in the Adviser and a 100% interest in AllianceBernstein Corporation, the general partner of the Adviser. Since the initial sale, AXA has completed additional offerings, most recently during the fourth quarter of 2019. As a result, AXA currently owns less than 10% of the outstanding shares of common stock of Equitable, and no longer owns a controlling interest in Equitable. AXA previously announced its intention to sell its entire interest in Equitable over time, subject to market conditions and other factors (the “Plan”). Most of AXA’s remaining Equitable shares are to be delivered on redemption of AXA bonds mandatorily exchangeable into Equitable shares and maturing in May 2021. AXA retains sole discretion to determine the timing of any future sales of its remaining shares of Equitable common stock.
Sales under the Plan that were completed on November 13, 2019 resulted in the indirect transfer of a “controlling block” of voting securities of the Adviser (a “Change of Control Event”) and may have been deemed to have been an “assignment” causing a termination of the Fund’s investment advisory and administration agreements. In order to ensure that investment advisory and administration services could continue uninterrupted in the event of a Change of Control Event, the Board previously approved new investment advisory and administration agreements with the Adviser, and shareholders of the Fund subsequently approved the new investment advisory agreement. These agreements became effective on November 13, 2019.
NOTE C
Distribution Services Agreement
The Fund has adopted a Distribution Services Agreement (the “Agreement”) pursuant to Rule 12b-1 under the Investment Company Act of 1940. Under the Agreement, the Fund pays distribution and servicing
| abfunds.com | AB MUNICIPAL BOND INFLATION STRATEGY | 47 | |
NOTES TO FINANCIAL STATEMENTS (continued)
fees to the Distributor at an annual rate of up to .30% of the Fund’s average daily net assets attributable to Class A shares, 1% of the Fund’s average daily net assets attributable to Class C shares and .10% of the Fund’s average daily net assets attributable to Class 1 shares. There are no distribution and servicing fees on the Advisor Class and Class 2 shares. Payments under the Agreement in respect of Class A shares are currently limited to an annual rate of .25% of Class A shares’ average daily net assets. The fees are accrued daily and paid monthly. The Agreement provides that the Distributor will use such payments in their entirety for distribution assistance and promotional activities. Since the commencement of the Fund’s operations, the Distributor has incurred expenses in excess of the distribution costs reimbursed by the Fund in the amount of $428,885 and $1,798,509 for Class C and Class 1 shares, respectively. While such costs may be recovered from the Fund in future periods so long as the Agreement is in effect, the rate of the distribution and servicing fees payable under the Agreement may not be increased without a shareholder vote. In accordance with the Agreement, there is no provision for recovery of unreimbursed distribution costs incurred by the Distributor beyond the current fiscal year for Class A shares. The Agreement also provides that the Adviser may use its own resources to finance the distribution of the Fund’s shares.
NOTE D
Investment Transactions
Purchases and sales of investment securities (excluding short-term investments) for the six months ended April 30, 2020 were as follows:
| Purchases | Sales | |||||||
Investment securities (excluding U.S. government securities)................... | $ | 123,787,912 | $ | 163,616,555 | ||||
U.S. government securities...................... | 5,664,678 | 5,000 | ||||||
The cost of investments for federal income tax purposes was substantially the same as the cost for financial reporting purposes. Accordingly, gross unrealized appreciation and unrealized depreciation are as follows:
Gross unrealized appreciation | $ | 32,270,712 | ||
Gross unrealized depreciation | (110,937,007 | ) | ||
|
| |||
Net unrealized depreciation | $ | (78,666,295 | ) | |
|
|
1. Derivative Financial Instruments
The Fund may use derivatives in an effort to earn income and enhance returns, to replace more traditional direct investments, to obtain exposure to otherwise inaccessible markets (collectively, “investment purposes”), or to hedge or adjust the risk profile of its portfolio.
| 48 | AB MUNICIPAL BOND INFLATION STRATEGY | abfunds.com | |
NOTES TO FINANCIAL STATEMENTS (continued)
The principal type of derivative utilized by the Fund, as well as the methods in which they may be used are:
| • | Swaps |
The Fund may enter into swaps to hedge its exposure to interest rates or credit risk. A swap is an agreement that obligates two parties to exchange a series of cash flows at specified intervals based upon or calculated by reference to changes in specified prices or rates for a specified amount of an underlying asset. The payment flows are usually netted against each other, with the difference being paid by one party to the other. In addition, collateral may be pledged or received by the Fund in accordance with the terms of the respective swaps to provide value and recourse to the Fund or its counterparties in the event of default, bankruptcy or insolvency by one of the parties to the swap.
Risks may arise as a result of the failure of the counterparty to the swap to comply with the terms of the swap. The loss incurred by the failure of a counterparty is generally limited to the net interim payment to be received by the Fund, and/or the termination value at the end of the contract. Therefore, the Fund considers the creditworthiness of each counterparty to a swap in evaluating potential counterparty risk. This risk is mitigated by having a netting arrangement between the Fund and the counterparty and by the posting of collateral by the counterparty to the Fund to cover the Fund’s exposure to the counterparty. Additionally, risks may arise from unanticipated movements in interest rates or in the value of the underlying securities. The Fund accrues for the interim payments on swaps on a daily basis, with the net amount recorded within unrealized appreciation/depreciation of swaps on the statement of assets and liabilities, where applicable. Once the interim payments are settled in cash, the net amount is recorded as realized gain/(loss) on swaps on the statement of operations, in addition to any realized gain/(loss) recorded upon the termination of swaps. Upfront premiums paid or received for OTC swaps are recognized as cost or proceeds on the statement of assets and liabilities and are amortized on a straight line basis over the life of the contract. Amortized upfront premiums are included in net realized gain/(loss) from swaps on the statement of operations. Fluctuations in the value of swaps are recorded as a component of net change in unrealized appreciation/depreciation of swaps on the statement of operations.
Certain standardized swaps, including certain interest rate swaps and credit default swaps, are (or soon will be) subject to mandatory central clearing. Cleared swaps are transacted through futures commission merchants (“FCMs”) that are members of central clearinghouses, with
| abfunds.com | AB MUNICIPAL BOND INFLATION STRATEGY | 49 | |
NOTES TO FINANCIAL STATEMENTS (continued)
the clearinghouse serving as central counterparty, similar to transactions in futures contracts. Centralized clearing will be required for additional categories of swaps on a phased-in basis based on requirements published by the Securities and Exchange Commission and Commodity Futures Trading Commission.
At the time the Fund enters into a centrally cleared swap, the Fund deposits and maintains as collateral an initial margin with the broker, as required by the clearinghouse on which the transaction is effected. Such amount is shown as cash collateral due from broker on the statement of assets and liabilities. Pursuant to the contract, the Fund agrees to receive from or pay to the broker an amount of cash equal to the daily fluctuation in the value of the contract. Such receipts or payments are known as variation margin and are recorded by the Fund as unrealized gains or losses. Risks may arise from the potential inability of a counterparty to meet the terms of the contract. The credit/counterparty risk for centrally cleared swaps is generally less than non-centrally cleared swaps, since the clearinghouse, which is the issuer or counterparty to each centrally cleared swap, has robust risk mitigation standards, including the requirement to provide initial and variation margin. When the contract is closed, the Fund records a realized gain or loss equal to the difference between the value of the contract at the time it was opened and the time it was closed.
Interest Rate Swaps:
The Fund is subject to interest rate risk exposure in the normal course of pursuing its investment objectives. Because the Fund holds fixed rate bonds, the value of these bonds may decrease if interest rates rise. To help hedge against this risk and to maintain its ability to generate income at prevailing market rates, the Fund may enter into interest rate swaps. Interest rate swaps are agreements between two parties to exchange cash flows based on a notional amount. The Fund may elect to pay a fixed rate and receive a floating rate, or, receive a fixed rate and pay a floating rate on a notional amount.
In addition, the Fund may also enter into interest rate swap transactions to preserve a return or spread on a particular investment or portion of its portfolio, or protecting against an increase in the price of securities the Fund anticipates purchasing at a later date. Interest rate swaps involve the exchange by a Fund with another party of their respective commitments to pay or receive interest (e.g., an exchange of floating rate payments for fixed rate payments) computed based on a contractually-based principal (or “notional”) amount. Interest rate swaps are entered into on a net basis (i.e., the two payment streams are netted out, with the Fund receiving or paying, as the case may be, only the net amount of the two payments).
| 50 | AB MUNICIPAL BOND INFLATION STRATEGY | abfunds.com | |
NOTES TO FINANCIAL STATEMENTS (continued)
During the six months ended April 30, 2020, the Fund held interest rate swaps for hedging purposes.
Inflation (CPI) Swaps:
Inflation swap agreements are contracts in which one party agrees to pay the cumulative percentage increase in a price index (the Consumer Price Index with respect to CPI swaps) over the term of the swap (with some lag on the inflation index), and the other pays a compounded fixed rate. Inflation swaps may be used to protect the net asset value, or NAV, of a Fund against an unexpected change in the rate of inflation measured by an inflation index since the value of these agreements is expected to increase if there are unexpected inflation increases.
During the six months ended April 30, 2020, the Fund held inflation (CPI) swaps for hedging purposes.
Credit Default Swaps:
The Fund may enter into credit default swaps, including to manage its exposure to the market or certain sectors of the market, to reduce its risk exposure to defaults by corporate and sovereign issuers held by the Fund, or to create exposure to corporate or sovereign issuers to which it is not otherwise exposed. The Fund may purchase credit protection (“Buy Contract”) or provide credit protection (“Sale Contract”) on the referenced obligation of the credit default swap. During the term of the swap, the Fund receives/(pays) fixed payments from/(to) the respective counterparty, calculated at the agreed upon rate applied to the notional amount. If the Fund is a buyer/(seller) of protection and a credit event occurs, as defined under the terms of the swap, the Fund will either (i) receive from the seller/(pay to the buyer) of protection an amount equal to the notional amount of the swap (the “Maximum Payout Amount”) and deliver/(take delivery of) the referenced obligation or (ii) receive/(pay) a net settlement amount in the form of cash or securities equal to the notional amount of the swap less the recovery value of the referenced obligation. In certain circumstances Maximum Payout Amounts may be partially offset by recovery values of the respective referenced obligations, upfront premium received upon entering into the agreement, or net amounts received from settlement of buy protection credit default swaps entered into by the Fund for the same referenced obligations with the same counterparty.
Credit default swaps may involve greater risks than if a Fund had invested in the referenced obligation directly. Credit default swaps are subject to general market risk, liquidity risk, counterparty risk and credit risk. If the Fund is a buyer of protection and no credit event occurs, it will lose the payments it made to its counterparty. If the
| abfunds.com | AB MUNICIPAL BOND INFLATION STRATEGY | 51 | |
NOTES TO FINANCIAL STATEMENTS (continued)
Fund is a seller of protection and a credit event occurs, the value of the referenced obligation received by the Fund coupled with the periodic payments previously received, may be less than the Maximum Payout Amount it pays to the buyer, resulting in a net loss to the Fund.
Implied credit spreads over U.S. Treasuries of comparable maturity utilized in determining the market value of credit default swaps on issuers as of period end are disclosed in the portfolio of investments. The implied spreads serve as an indicator of the current status of the payment/performance risk and typically reflect the likelihood of default by the issuer of the referenced obligation. The implied credit spread of a particular reference obligation also reflects the cost of buying/selling protection and may reflect upfront payments required to be made to enter into the agreement. Widening credit spreads typically represent a deterioration of the referenced obligation’s credit soundness and greater likelihood of default or other credit event occurring as defined under the terms of the agreement. A credit spread identified as “Defaulted” indicates a credit event has occurred for the referenced obligation.
During the six months ended April 30, 2020, the Fund held credit default swaps for non-hedging purposes.
The Fund typically enters into International Swaps and Derivatives Association, Inc. Master Agreements (“ISDA Master Agreement”) with its OTC derivative contract counterparties in order to, among other things, reduce its credit risk to OTC counterparties. ISDA Master Agreements include provisions for general obligations, representations, collateral and events of default or termination. Under an ISDA Master Agreement, the Fund typically may offset with the OTC counterparty certain derivative financial instruments’ payables and/or receivables with collateral held and/or posted and create one single net payment (close-out netting) in the event of default or termination. In the event of a default by an OTC counterparty, the return of collateral with market value in excess of the Fund’s net liability, held by the defaulting party, may be delayed or denied.
The Fund’s ISDA Master Agreements may contain provisions for early termination of OTC derivative transactions in the event the net assets of the Fund decline below specific levels (“net asset contingent features”). If these levels are triggered, the Fund’s OTC counterparty has the right to terminate such transaction and require the Fund to pay or receive a settlement amount in connection with the terminated transaction. If OTC derivatives were held at period end, please refer to netting arrangements by the OTC counterparty table below for additional details.
| 52 | AB MUNICIPAL BOND INFLATION STRATEGY | abfunds.com | |
NOTES TO FINANCIAL STATEMENTS (continued)
During the six months ended April 30, 2020, the Fund had entered into the following derivatives:
Asset Derivatives | Liability Derivatives | |||||||||||
Derivative Type | Statement of | Fair Value | Statement of | Fair Value | ||||||||
Interest rate contracts | Receivable/Payable for variation margin on centrally cleared swaps | $ | 5,831,931 | * | Receivable/Payable for variation margin on centrally cleared swaps | $ | 3,675,264 | * | ||||
Interest rate contracts | Unrealized depreciation on interest rate swaps | | 1,095,352 | |||||||||
Interest rate contracts | Unrealized appreciation on inflation swaps | | 122,137 | Unrealized depreciation on inflation swaps | | 94,806,909 | ||||||
Credit contracts | Market value on credit default swaps | 1,295,418 | ||||||||||
|
|
|
| |||||||||
Total | $ | 5,954,068 | $ | 100,872,943 | ||||||||
|
|
|
| |||||||||
| * | Only variation margin receivable/payable at period end is reported within the statement of assets and liabilities. |
This amount reflects cumulative unrealized appreciation/(depreciation) on futures and centrally cleared swaps as reported in the portfolio of investments.
Derivative Type | Location of Gain or (Loss) on Derivatives Within Statement of Operations | Realized Gain or (Loss) on Derivatives | Change in Unrealized Appreciation or (Depreciation) | |||||||||
Interest rate contracts | Net realized gain (loss) on swaps; Net change in unrealized appreciation/ depreciation of swaps | $ | (3,946,899) | $ | (29,392,737) | |||||||
Credit contracts | Net realized gain (loss) on swaps; Net change in unrealized appreciation/ depreciation of swaps | 65,927 | (961,091) | |||||||||
|
|
|
| |||||||||
Total | $ | (3,880,972) | $ | (30,353,828) | ||||||||
|
|
|
| |||||||||
| abfunds.com | AB MUNICIPAL BOND INFLATION STRATEGY | 53 | |
NOTES TO FINANCIAL STATEMENTS (continued)
The following table represents the average monthly volume of the Fund’s derivative transactions during the six months ended April 30, 2020:
Interest Rate Swaps: | ||||
Average notional amount | $ | 22,150,000 | ||
Inflation Swaps: | ||||
Average notional amount | $ | 834,628,286 | ||
Centrally Cleared Interest Rate Swaps: | ||||
Average notional amount | $ | 125,574,286 | ||
Centrally Cleared Inflation Swaps: | ||||
Average notional amount | $ | 96,495,714 | ||
Credit Default Swaps: | ||||
Average notional amount of sale contracts | $ | 3,985,000 |
For financial reporting purposes, the Fund does not offset derivative assets and derivative liabilities that are subject to netting arrangements in the statement of assets and liabilities.
All OTC derivatives held at period end were subject to netting arrangements. The following table presents the Fund’s derivative assets and liabilities by OTC counterparty net of amounts available for offset under ISDA Master Agreements (“MA”) and net of the related collateral received/pledged by the Fund as of April 30, 2020. Exchange-traded derivatives and centrally cleared swaps are not subject to netting arrangements and as such are excluded from the table.
Counterparty | Derivative Assets Subject to a MA | Derivatives Available for Offset | Cash Collateral Received* | Security Collateral Received* | Net Amount of Derivative Assets | |||||||||||||||
Bank of America, NA | $ | 76,215 | $ | (76,215 | ) | $ | – 0 | – | $ | – 0 | – | $ | – 0 | – | ||||||
Citibank, NA | 45,922 | (45,922 | ) | – 0 | – | – 0 | – | – 0 | – | |||||||||||
|
|
|
|
|
|
|
|
|
| |||||||||||
Total | $ | 122,137 | ^ | $ | (122,137 | )^ | $ | – 0 | – | $ | – 0 | – | $ | – 0 | – | |||||
|
|
|
|
|
|
|
|
|
| |||||||||||
Counterparty | Derivative Liabilities Subject to a MA | Derivatives Available for Offset | Cash Collateral Pledged* | Security Collateral Pledged* | Net Amount of Derivative Liabilities | |||||||||||||||
Bank of America, NA | $ | 3,931,252 | $ | (76,215 | ) | $ | (3,112,000 | ) | $ | (743,037 | ) | $ | – 0 | – | ||||||
Barclays Bank PLC | 23,966,042 | – 0 | – | – 0 | – | (23,966,042 | ) | – 0 | – | |||||||||||
Citibank, NA | 30,571,046 | (45,922 | ) | (14,610,000 | ) | (15,915,124 | ) | – 0 | – | |||||||||||
Citigroup Global Markets, Inc. | 216,831 | – 0 | – | – 0 | – | – 0 | – | 216,831 | ||||||||||||
| 54 | AB MUNICIPAL BOND INFLATION STRATEGY | abfunds.com | |
NOTES TO FINANCIAL STATEMENTS (continued)
Counterparty | Derivative Liabilities Subject to a MA | Derivatives Available for Offset | Cash Collateral Pledged* | Security Collateral Pledged* | Net Amount of Derivative Liabilities | |||||||||||||||
Credit Suisse International | $ | 803,892 | $ | – 0 | – | $ | (336,000 | ) | $ | (328,864 | ) | $ | 139,028 | |||||||
Deutsche Bank AG | 4,439,152 | – 0 | – | (3,189,717 | ) | (1,249,435 | ) | – 0 | – | |||||||||||
Goldman Sachs International | 274,695 | – 0 | – | (274,695 | ) | – 0 | – | – 0 | – | |||||||||||
JPMorgan Chase Bank, NA | 27,660,704 | – 0 | – | (12,902,000 | ) | (14,758,704 | ) | – 0 | – | |||||||||||
Morgan Stanley Capital Services LLC | 5,334,065 | – 0 | – | (2,408,000 | ) | (2,926,065 | ) | – 0 | – | |||||||||||
|
|
|
|
|
|
|
|
|
| |||||||||||
Total | $ | 97,197,679 | ^ | $ | (122,137 | )^ | $ | (36,832,412 | )^ | $ | (59,887,271 | )^ | $ | 355,859 | ^ | |||||
|
|
|
|
|
|
|
|
|
| |||||||||||
| * | The actual collateral received/pledged may be more than the amount reported due to over-collateralization. |
| ^ | Net amount represents the net receivable/payable that would be due from/to the counterparty in the event of default or termination. The net amount from OTC financial derivative instruments can only be netted across transactions governed under the same master agreement with the same counterparty. |
NOTE E
Capital Stock
Each class consists of 3,000,000,000 authorized shares. Transactions in capital shares for Class A, Class C, Advisor Class, Class 1 and Class 2 were as follows:
| Shares | Amount | |||||||||||||||||||||||
| Six Months Ended April 30, 2020 (unaudited) | Year Ended October 31, 2019 | Six Months Ended April 30, 2020 (unaudited) | Year Ended October 31, 2019 | |||||||||||||||||||||
|
| |||||||||||||||||||||||
| Class A |
| |||||||||||||||||||||||
Shares sold | 5,195,409 | 1,771,451 | $ | 53,388,683 | $ | 18,033,736 | ||||||||||||||||||
| ||||||||||||||||||||||||
Shares issued in reinvestment of dividends | 57,612 | 86,462 | 587,396 | 879,985 | ||||||||||||||||||||
| ||||||||||||||||||||||||
Shares converted from Class C | 37,168 | 133,994 | 370,832 | 1,380,472 | ||||||||||||||||||||
| ||||||||||||||||||||||||
Shares redeemed | (2,174,008 | ) | (4,179,787 | ) | (21,048,064 | ) | (42,207,147 | ) | ||||||||||||||||
| ||||||||||||||||||||||||
Net increase (decrease) | 3,116,181 | (2,187,880 | ) | $ | 33,298,847 | $ | (21,912,954 | ) | ||||||||||||||||
| ||||||||||||||||||||||||
| abfunds.com | AB MUNICIPAL BOND INFLATION STRATEGY | 55 | |
NOTES TO FINANCIAL STATEMENTS (continued)
| Shares | Amount | |||||||||||||||||||||||
| Six Months Ended April 30, 2020 (unaudited) | Year Ended October 31, 2019 | Six Months Ended April 30, 2020 (unaudited) | Year Ended October 31, 2019 | |||||||||||||||||||||
|
| |||||||||||||||||||||||
| Class C |
| |||||||||||||||||||||||
Shares sold | 68,903 | 177,607 | $ | 697,439 | $ | 1,807,733 | ||||||||||||||||||
| ||||||||||||||||||||||||
Shares issued in reinvestment of dividends | 4,318 | 10,536 | 44,010 | 107,230 | ||||||||||||||||||||
| ||||||||||||||||||||||||
Shares converted to Class A | (37,225 | ) | (134,210 | ) | (370,832 | ) | (1,380,472 | ) | ||||||||||||||||
| ||||||||||||||||||||||||
Shares redeemed | (67,534 | ) | (366,478 | ) | (687,043 | ) | (3,715,959 | ) | ||||||||||||||||
| ||||||||||||||||||||||||
Net decrease | (31,538 | ) | (312,545 | ) | $ | (316,426 | ) | $ | (3,181,468 | ) | ||||||||||||||
| ||||||||||||||||||||||||
Advisor Class |
| |||||||||||||||||||||||
Shares sold | 6,992,065 | 9,621,301 | $ | 71,818,763 | $ | 98,239,600 | ||||||||||||||||||
| ||||||||||||||||||||||||
Shares issued in reinvestment of dividends | 190,100 | 371,721 | 1,943,613 | 3,789,340 | ||||||||||||||||||||
| ||||||||||||||||||||||||
Shares redeemed | (9,611,587 | ) | (12,466,466 | ) | (93,134,157 | ) | (126,710,398 | ) | ||||||||||||||||
| ||||||||||||||||||||||||
Net decrease | (2,429,422 | ) | (2,473,444 | ) | $ | (19,371,781 | ) | $ | (24,681,458 | ) | ||||||||||||||
| ||||||||||||||||||||||||
| Class 1 |
| |||||||||||||||||||||||
Shares sold | 3,265,917 | 7,527,585 | $ | 33,050,912 | $ | 76,245,783 | ||||||||||||||||||
| ||||||||||||||||||||||||
Shares issued in reinvestment of dividends | 453,289 | 996,866 | 4,605,617 | 10,112,533 | ||||||||||||||||||||
| ||||||||||||||||||||||||
Shares redeemed | (6,007,432 | ) | (8,166,935 | ) | (58,956,967 | ) | (82,786,584 | ) | ||||||||||||||||
| ||||||||||||||||||||||||
Net increase (decrease) | (2,288,226 | ) | 357,516 | $ | (21,300,438 | ) | $ | 3,571,732 | ||||||||||||||||
| ||||||||||||||||||||||||
| Class 2 |
| |||||||||||||||||||||||
Shares sold | 1,560,608 | 3,121,484 | $ | 15,575,638 | $ | 31,553,791 | ||||||||||||||||||
| ||||||||||||||||||||||||
Shares issued in reinvestment of dividends | 212,950 | 483,312 | 2,164,416 | 4,906,067 | ||||||||||||||||||||
| ||||||||||||||||||||||||
Shares redeemed | (2,298,692 | ) | (3,357,173 | ) | (22,772,972 | ) | (34,003,782 | ) | ||||||||||||||||
| ||||||||||||||||||||||||
Net increase (decrease) | (525,134 | ) | 247,623 | $ | (5,032,918 | ) | $ | 2,456,076 | ||||||||||||||||
| ||||||||||||||||||||||||
NOTE F
Risks Involved in Investing in the Fund
Market Risk—The market value of a security may move up or down, sometimes rapidly and unpredictably. These fluctuations may cause a security to be worth less than the price originally paid for it, or less than it was worth at an earlier time. Market risk may affect a single issuer, industry, sector of the economy or the market as a whole. Global economies and financial markets are increasingly interconnected, which increases the probabilities that conditions in one country or region might adversely impact issuers in a different country or region. Conditions
| 56 | AB MUNICIPAL BOND INFLATION STRATEGY | abfunds.com | |
NOTES TO FINANCIAL STATEMENTS (continued)
affecting the general economy, including political, social, or economic instability at the local, regional, or global level may also affect the market value of a security. Health crises, such as pandemic and epidemic diseases, as well as other incidents that interrupt the expected course of events, such as natural disasters, war or civil disturbance, acts of terrorism, power outages and other unforeseeable and external events, and the public response to or fear of such diseases or events, have and may in the future have an adverse effect on the Fund’s investments and net asset value and can lead to increased market volatility. For example, any preventative or protective actions that governments may take in respect of such diseases or events may result in periods of business disruption, inability to obtain raw materials, supplies and component parts, and reduced or disrupted operations for the Fund’s portfolio companies. The occurrence and pendency of such diseases or events could adversely affect the economies and financial markets either in specific countries or worldwide.
Credit Risk—An issuer or guarantor of a fixed-income security, or the counterparty to a derivatives or other contract, may be unable or unwilling to make timely payments of interest or principal, or to otherwise honor its obligations. The issuer or guarantor may default, causing a loss of the full principal amount of a security and any accrued interest. The degree of risk for a particular security may be reflected in its credit rating. There is the possibility that the credit rating of a fixed-income security may be downgraded after purchase, which may adversely affect the value of the security. Investments in fixed-income securities with lower ratings tend to have a higher probability that an issuer will default or fail to meet its payment obligations.
Municipal Market Risk—This is the risk that special factors may adversely affect the value of municipal securities and have a significant effect on the yield or value of the Fund’s investments in municipal securities. These factors include economic conditions, political or legislative changes, uncertainties related to the tax status of municipal securities, or the rights of investors in these securities. To the extent that the Fund invests more of its assets in a particular state’s municipal securities, the Fund is vulnerable to events adversely affecting that state, including economic, political and regulatory occurrences, court decisions, terrorism and catastrophic natural disasters. The Fund’s investments in certain municipal securities with principal and interest payments that are made from the revenues of a specific project or facility, and not general tax revenues, may have increased risks. Factors affecting the project or facility, such as local business or economic conditions, could have a significant effect on the project’s ability to make payments of principal and interest on these securities.
| abfunds.com | AB MUNICIPAL BOND INFLATION STRATEGY | 57 | |
NOTES TO FINANCIAL STATEMENTS (continued)
Recent tax law changes could have a material impact on the value of municipal securities. In addition, Congress has previously considered making changes to the municipal securities provisions of the Internal Revenue Code that could change the U.S. federal income tax treatment of certain types of municipal securities.
Interest Rate Risk—Changes in interest rates will affect the value of investments in fixed-income securities. When interest rates rise, the value of existing investments in fixed-income securities tends to fall and this decrease in value may not be offset by higher income from new investments. Interest rate risk is generally greater for fixed-income securities with longer maturities or durations.
Duration Risk—Duration is a measure that relates the expected price volatility of a fixed-income security to changes in interest rates. The duration of a fixed-income security may be shorter than or equal to full maturity of a fixed-income security. Fixed-income securities with longer durations have more risk and will decrease in price as interest rates rise.
Inflation Risk—This is the risk that the value of assets or income from investments will be less in the future as inflation decreases the value of money. As inflation increases, the value of the Fund’s assets can decline as can the value of the Fund’s distributions. This risk is significantly greater for fixed-income securities with longer maturities.
Derivatives Risk—The Fund may enter into derivative transactions such as forwards, options, futures and swaps. Derivatives may be illiquid, difficult to price, and leveraged so that small changes may produce disproportionate losses for the Fund, and subject to counterparty risk to a greater degree than more traditional investments. Derivatives may result in significant losses, including losses that are far greater than the value of the derivatives reflected on the statement of assets and liabilities.
Leverage Risk—When the Fund borrows money or otherwise leverages its investments, its performance may be volatile because leverage tends to exaggerate the effect of any increase or decrease in the value of the Fund’s investments. The Fund may create leverage through the use of reverse repurchase arrangements, forward currency exchange contracts, forward commitments, dollar rolls or futures or by borrowing money. The use of other types of derivative instruments by the Fund, such as options and swaps, may also result in a form of leverage. Leverage may result in higher returns to the Fund than if the Fund were not leveraged, but may also adversely affect returns, particularly if the market is declining.
Illiquid Investments Risk—Illiquid investments risk exists when certain investments are or become difficult to purchase or sell. Difficulty in selling
| 58 | AB MUNICIPAL BOND INFLATION STRATEGY | abfunds.com | |
NOTES TO FINANCIAL STATEMENTS (continued)
such investments may result in sales at disadvantageous prices affecting the value of your investment in the Fund. Causes of illiquid investments risk may include low trading volumes, large positions and heavy redemptions of Fund shares. Illiquid investments risk may be higher in a rising interest rate environment, when the value and liquidity of fixed-income securities generally decline.
LIBOR Risk—The Fund may invest in certain debt securities, derivatives or other financial instruments that utilize the London Interbank Offered Rate, or “LIBOR,” as a “benchmark” or “reference rate” for various interest rate calculations. In July 2017, the United Kingdom Financial Conduct Authority, which regulates LIBOR, announced a desire to phase out the use of LIBOR by the end of 2021. Although financial regulators and industry working groups have suggested alternative reference rates, such as European Interbank Offer Rate (“EURIBOR”), Sterling Overnight Interbank Average Rate (“SONIA”) and Secured Overnight Financing Rate (“SOFR”), global consensus on alternative rates is lacking and the process for amending existing contracts or instruments to transition away from LIBOR remains unclear. The elimination of LIBOR or changes to other reference rates or any other changes or reforms to the determination or supervision of reference rates could have an adverse impact on the market for, or value of, any securities or payments linked to those reference rates, which may adversely affect the Fund’s performance and/or net asset value. Uncertainty and risk also remain regarding the willingness and ability of issuers and lenders to include revised provisions in new and existing contracts or instruments. Consequently, the transition away from LIBOR to other reference rates may lead to increased volatility and illiquidity in markets that are tied to LIBOR, fluctuations in values of LIBOR-related investments or investments in issuers that utilize LIBOR, increased difficulty in borrowing or refinancing and diminished effectiveness of hedging strategies, adversely affecting the Fund’s performance. Furthermore, the risks associated with the expected discontinuation of LIBOR and transition may be exacerbated if the work necessary to effect an orderly transition to an alternative reference rate is not completed in a timely manner. Because the usefulness of LIBOR as a benchmark could deteriorate during the transition period, these effects could occur prior to the end of 2021.
Indemnification Risk—In the ordinary course of business, the Fund enters into contracts that contain a variety of indemnifications. The Fund’s maximum exposure under these arrangements is unknown. However, the Fund has not had prior claims or losses pursuant to these indemnification provisions and expects the risk of loss thereunder to be remote. Therefore, the Fund has not accrued any liability in connection with these indemnification provisions.
| abfunds.com | AB MUNICIPAL BOND INFLATION STRATEGY | 59 | |
NOTES TO FINANCIAL STATEMENTS (continued)
Management Risk—The Fund is subject to management risk because it is an actively-managed investment fund. The Adviser will apply its investment techniques and risk analyses in making investment decisions, but there is no guarantee that its techniques will produce the intended results. Some of these techniques may incorporate, or rely upon, quantitative models, but there is no guarantee that these models will generate accurate forecasts, reduce risk or otherwise perform as expected.
NOTE G
Joint Credit Facility
A number of open-end mutual funds managed by the Adviser, including the Fund, participate in a $325 million revolving credit facility (the “Facility”) intended to provide short-term financing, if necessary, subject to certain restrictions in connection with abnormal redemption activity. Commitment fees related to the Facility are paid by the participating funds and are included in miscellaneous expenses in the statement of operations. The Fund did not utilize the Facility during the six months ended April 30, 2020.
NOTE H
Distributions to Shareholders
The tax character of distributions to be paid for the year ending October 31, 2020 will be determined at the end of the current fiscal year. The tax character of distributions paid during the fiscal years ended October 31, 2019 and October 31, 2018 were as follows:
| 2019 | 2018 | |||||||
Distributions paid from: | ||||||||
Ordinary income | $ | 927,242 | $ | 619,937 | ||||
|
|
|
| |||||
Total taxable distributions | 927,242 | 619,937 | ||||||
Tax-exempt distributions | 24,743,871 | 22,001,837 | ||||||
|
|
|
| |||||
Total distributions paid | $ | 25,671,113 | $ | 22,621,774 | ||||
|
|
|
| |||||
As of October 31, 2019, the components of accumulated earnings/(deficit) on a tax basis were as follows:
Accumulated capital and other losses | $ | (15,290,384 | )(a) | |
Unrealized appreciation/(depreciation) | (12,663,904 | )(b) | ||
|
| |||
Total accumulated earnings/(deficit) | $ | (27,954,288 | ) | |
|
|
| (a) | As of October 31, 2019, the Fund had a net capital loss carryforward of $15,290,384. |
| (b) | The difference between book-basis and tax-basis unrealized appreciation/(depreciation) is attributable primarily to the tax treatment of swaps. |
For tax purposes, net realized capital losses may be carried over to offset future capital gains, if any. Funds are permitted to carry forward capital losses for an indefinite period, and such losses will retain their character as either short-term or long-term capital losses. As of October 31, 2019, the
| 60 | AB MUNICIPAL BOND INFLATION STRATEGY | abfunds.com | |
NOTES TO FINANCIAL STATEMENTS (continued)
Fund had a net short-term capital loss carryforward of $2,798,319 and a net long-term capital loss carryforward of $12,492,065 which may be carried forward for an indefinite period.
NOTE I
Recent Accounting Pronouncements
In March 2017, the Financial Accounting Standards Board issued an Accounting Standards Update, ASU 2017-08, Receivables—Nonrefundable Fees and Other Costs (Subtopic 310-20), Premium Amortization on Purchased Callable Debt Securities which amends the amortization period for certain purchased callable debt securities held at a premium, shortening such period to the earliest call date. ASU 2017-08 does not require any accounting change for debt securities held at a discount; the discount continues to be amortized to maturity. ASU 2017-08 is effective for fiscal years, and interim periods within those fiscal years, beginning after December 15, 2018. The Fund has adopted ASU 2017-08, which did not have a material impact on the Fund’s financial position or the results of its operations, and had no impact on the Fund’s net assets.
NOTE J
Subsequent Events
Management has evaluated subsequent events for possible recognition or disclosure in the financial statements through the date the financial statements are issued. Management has determined that there are no material events that would require disclosure in the Fund’s financial statements through this date.
| abfunds.com | AB MUNICIPAL BOND INFLATION STRATEGY | 61 | |
FINANCIAL HIGHLIGHTS
Selected Data For A Share Of Capital Stock Outstanding Throughout Each Period
| Class A | ||||||||||||||||||||||||
Six Months (unaudited) | Year Ended October 31, | |||||||||||||||||||||||
| 2019 | 2018 | 2017 | 2016 | 2015 | ||||||||||||||||||||
|
| |||||||||||||||||||||||
Net asset value, beginning of period | $ 10.24 | $ 10.02 | $ 10.28 | $ 10.29 | $ 10.14 | $ 10.48 | ||||||||||||||||||
|
| |||||||||||||||||||||||
Income From Investment Operations | ||||||||||||||||||||||||
Net investment income(a)(b) | .11 | .24 | .22 | .19 | .18 | .15 | ||||||||||||||||||
Net realized and unrealized gain (loss) on investment transactions | (.64 | ) | .21 | (.26 | ) | (.01 | ) | .16 | (.34 | ) | ||||||||||||||
|
| |||||||||||||||||||||||
Net increase (decrease) in net asset value from operations | (.53 | ) | .45 | (.04 | ) | .18 | .34 | (.19 | ) | |||||||||||||||
|
| |||||||||||||||||||||||
Less: Dividends | ||||||||||||||||||||||||
Dividends from net investment income | (.11 | ) | (.23 | ) | (.22 | ) | (.19 | ) | (.19 | ) | (.15 | ) | ||||||||||||
|
| |||||||||||||||||||||||
Net asset value, end of period | $ 9.60 | $ 10.24 | $ 10.02 | $ 10.28 | $ 10.29 | $ 10.14 | ||||||||||||||||||
|
| |||||||||||||||||||||||
Total Return | ||||||||||||||||||||||||
Total investment return based on net asset value(c) | (5.20 | )% | 4.58 | % | (.42 | )% | 1.75 | % | 3.38 | % | (1.83 | )% | ||||||||||||
Ratios/Supplemental Data | ||||||||||||||||||||||||
Net assets, end of period (000’s omitted) | $80,834 | $54,316 | $75,127 | $58,270 | $37,345 | $41,122 | ||||||||||||||||||
Ratio to average net assets of: | ||||||||||||||||||||||||
Expenses, net of waivers/reimbursements | .75 | %^ | .75 | % | .75 | % | .75 | % | .75 | % | .76 | % | ||||||||||||
Expenses, before waivers/reimbursements | .86 | %^ | .86 | % | .86 | % | .86 | % | .86 | % | .87 | % | ||||||||||||
Net investment income(b) | 2.29 | %^ | 2.32 | % | 2.13 | % | 1.90 | % | 1.78 | % | 1.49 | % | ||||||||||||
Portfolio turnover rate | 12 | % | 12 | % | 15 | % | 9 | % | 9 | % | 17 | % | ||||||||||||
See footnote summary on page 66.
| 62 | AB MUNICIPAL BOND INFLATION STRATEGY | abfunds.com | |
FINANCIAL HIGHLIGHTS (continued)
Selected Data For A Share Of Capital Stock Outstanding Throughout Each Period
| Class C | ||||||||||||||||||||||||
Six Months (unaudited) | Year Ended October 31, | |||||||||||||||||||||||
| 2019 | 2018 | 2017 | 2016 | 2015 | ||||||||||||||||||||
|
| |||||||||||||||||||||||
Net asset value, beginning of period | $ 10.22 | $ 10.01 | $ 10.26 | $ 10.27 | $ 10.12 | $ 10.46 | ||||||||||||||||||
|
| |||||||||||||||||||||||
Income From Investment Operations | ||||||||||||||||||||||||
Net investment income(a)(b) | .08 | .16 | .14 | .12 | .10 | .08 | ||||||||||||||||||
Net realized and unrealized gain (loss) on investment transactions | (.64 | ) | .20 | (.25 | ) | (.02 | ) | .16 | (.35 | ) | ||||||||||||||
|
| |||||||||||||||||||||||
Net increase (decrease) in net asset value from operations | (.56 | ) | .36 | (.11 | ) | .10 | .26 | (.27 | ) | |||||||||||||||
|
| |||||||||||||||||||||||
Less: Dividends | ||||||||||||||||||||||||
Dividends from net investment income | (.07 | ) | (.15 | ) | (.14 | ) | (.11 | ) | (.11 | ) | (.07 | ) | ||||||||||||
|
| |||||||||||||||||||||||
Net asset value, end of period | $ 9.59 | $10.22 | $ 10.01 | $ 10.26 | $ 10.27 | $ 10.12 | ||||||||||||||||||
|
| |||||||||||||||||||||||
Total Return | ||||||||||||||||||||||||
Total investment return based on net asset value(c) | (5.48 | )% | 3.63 | % | (1.09 | )% | .99 | % | 2.61 | % | (2.56 | )% | ||||||||||||
Ratios/Supplemental Data | ||||||||||||||||||||||||
Net assets, end of period (000’s omitted) | $6,934 | $7,717 | $10,681 | $12,693 | $10,805 | $13,154 | ||||||||||||||||||
Ratio to average net assets of: | ||||||||||||||||||||||||
Expenses, net of waivers/reimbursements | 1.50 | %^ | 1.50 | % | 1.50 | % | 1.50 | % | 1.50 | % | 1.50 | % | ||||||||||||
Expenses, before waivers/reimbursements | 1.60 | %^ | 1.61 | % | 1.61 | % | 1.61 | % | 1.61 | % | 1.61 | % | ||||||||||||
Net investment income(b) | 1.53 | %^ | 1.57 | % | 1.37 | % | 1.15 | % | 1.03 | % | .75 | % | ||||||||||||
Portfolio turnover rate | 12 | % | 12 | % | 15 | % | 9 | % | 9 | % | 17 | % | ||||||||||||
See footnote summary on page 66.
| abfunds.com | AB MUNICIPAL BOND INFLATION STRATEGY | 63 | |
FINANCIAL HIGHLIGHTS (continued)
Selected Data For A Share Of Capital Stock Outstanding Throughout Each Period
| Advisor Class | ||||||||||||||||||||||||
Six Months (unaudited) | Year Ended October 31, | |||||||||||||||||||||||
| 2019 | 2018 | 2017 | 2016 | 2015 | ||||||||||||||||||||
|
| |||||||||||||||||||||||
Net asset value, beginning of period | $ 10.24 | $ 10.03 | $ 10.29 | $ 10.30 | $ 10.14 | $ 10.48 | ||||||||||||||||||
|
| |||||||||||||||||||||||
Income From Investment Operations | ||||||||||||||||||||||||
Net investment income(a)(b) | .13 | .26 | .24 | .22 | .21 | .18 | ||||||||||||||||||
Net realized and unrealized gain (loss) on investment transactions | (.64 | ) | .21 | (.26 | ) | (.02 | ) | .17 | (.34 | ) | ||||||||||||||
|
| |||||||||||||||||||||||
Net increase (decrease) in net asset value from operations | (.51 | ) | .47 | (.02 | ) | .20 | .38 | (.16 | ) | |||||||||||||||
|
| |||||||||||||||||||||||
Less: Dividends | ||||||||||||||||||||||||
Dividends from net investment income | (.13 | ) | (.26 | ) | (.24 | ) | (.21 | ) | (.22 | ) | (.18 | ) | ||||||||||||
|
| |||||||||||||||||||||||
Net asset value, end of period | $ 9.60 | $ 10.24 | $ 10.03 | $ 10.29 | $ 10.30 | $ 10.14 | ||||||||||||||||||
|
| |||||||||||||||||||||||
Total Return | ||||||||||||||||||||||||
Total investment return based on net asset value(c) | (5.09 | )% | 4.76 | % | (.17 | )% | 2.00 | % | 3.74 | % | (1.56 | )% | ||||||||||||
Ratios/Supplemental Data | ||||||||||||||||||||||||
Net assets, end of period (000’s omitted) | $169,410 | $205,541 | $226,145 | $199,635 | $152,275 | $171,789 | ||||||||||||||||||
Ratio to average net assets of: | ||||||||||||||||||||||||
Expenses, net of waivers/reimbursements | .50 | %^ | .50 | % | .50 | % | .50 | % | .50 | % | .50 | % | ||||||||||||
Expenses, before waivers/reimbursements | .60 | %^ | .61 | % | .61 | % | .61 | % | .61 | % | .61 | % | ||||||||||||
Net investment income(b) | 2.53 | %^ | 2.57 | % | 2.37 | % | 2.15 | % | 2.03 | % | 1.76 | % | ||||||||||||
Portfolio turnover rate | 12 | % | 12 | % | 15 | % | 9 | % | 9 | % | 17 | % | ||||||||||||
See footnote summary on page 66.
| 64 | AB MUNICIPAL BOND INFLATION STRATEGY | abfunds.com | |
FINANCIAL HIGHLIGHTS (continued)
Selected Data For A Share Of Capital Stock Outstanding Throughout Each Period
| Class 1 | ||||||||||||||||||||||||
Six Months (unaudited) | Year Ended October 31, | |||||||||||||||||||||||
| 2019 | 2018 | 2017 | 2016 | 2015 | ||||||||||||||||||||
|
| |||||||||||||||||||||||
Net asset value, beginning of period | $ 10.19 | $ 9.98 | $ 10.25 | $ 10.26 | $ 10.11 | $ 10.45 | ||||||||||||||||||
|
| |||||||||||||||||||||||
Income From Investment Operations | ||||||||||||||||||||||||
Net investment income(a)(b) | .12 | .25 | .23 | .21 | .20 | .17 | ||||||||||||||||||
Net realized and unrealized gain (loss) on investment transactions | (.64 | ) | .22 | (.26 | ) | (.01 | ) | .16 | (.34 | ) | ||||||||||||||
|
| |||||||||||||||||||||||
Net increase (decrease) in net asset value from operations | (.52 | ) | .47 | (.03 | ) | .20 | .36 | (.17 | ) | |||||||||||||||
|
| |||||||||||||||||||||||
Less: Dividends | ||||||||||||||||||||||||
Dividends from net investment income | (.12 | ) | (.26 | ) | (.24 | ) | (.21 | ) | (.21 | ) | (.17 | ) | ||||||||||||
|
| |||||||||||||||||||||||
Net asset value, end of period | $ 9.55 | $ 10.19 | $ 9.98 | $ 10.25 | $ 10.26 | $ 10.11 | ||||||||||||||||||
|
| |||||||||||||||||||||||
Total Return | ||||||||||||||||||||||||
Total investment return based on net asset value(c) | (5.14 | )% | 4.72 | % | (.32 | )% | 1.94 | % | 3.58 | % | (1.62 | )% | ||||||||||||
Ratios/Supplemental Data | ||||||||||||||||||||||||
Net assets, end of period (000’s omitted) | $445,797 | $498,857 | $485,386 | $424,291 | $333,311 | $386,448 | ||||||||||||||||||
Ratio to average net assets of: | ||||||||||||||||||||||||
Expenses, net of waivers/reimbursements | .60 | %^ | .60 | % | .60 | % | .60 | % | .60 | % | .60 | % | ||||||||||||
Expenses, before waivers/reimbursements | .67 | %^ | .67 | % | .67 | % | .67 | % | .68 | % | .67 | % | ||||||||||||
Net investment income(b) | 2.43 | %^ | 2.47 | % | 2.27 | % | 2.05 | % | 1.93 | % | 1.66 | % | ||||||||||||
Portfolio turnover rate | 12 | % | 12 | % | 15 | % | 9 | % | 9 | % | 17 | % | ||||||||||||
See footnote summary on page 66.
| abfunds.com | AB MUNICIPAL BOND INFLATION STRATEGY | 65 | |
FINANCIAL HIGHLIGHTS (continued)
Selected Data For A Share Of Capital Stock Outstanding Throughout Each Period
| Class 2 | ||||||||||||||||||||||||
Six Months (unaudited) | Year Ended October 31, | |||||||||||||||||||||||
| 2019 | 2018 | 2017 | 2016 | 2015 | ||||||||||||||||||||
|
| |||||||||||||||||||||||
Net asset value, beginning of period | $ 10.19 | $ 9.99 | $ 10.25 | $ 10.26 | $ 10.12 | $ 10.46 | ||||||||||||||||||
|
| |||||||||||||||||||||||
Income From Investment Operations | ||||||||||||||||||||||||
Net investment income(a)(b) | .13 | .26 | .24 | .22 | .21 | .18 | ||||||||||||||||||
Net realized and unrealized gain (loss) on investment transactions | (.64 | ) | .21 | (.25 | ) | (.01 | ) | .15 | (.34 | ) | ||||||||||||||
|
| |||||||||||||||||||||||
Net increase (decrease) in net asset value from operations | (.51 | ) | .47 | (.01 | ) | .21 | .36 | (.16 | ) | |||||||||||||||
|
| |||||||||||||||||||||||
Less: Dividends | ||||||||||||||||||||||||
Dividends from net investment income | (.13 | ) | (.27 | ) | (.25 | ) | (.22 | ) | (.22 | ) | (.18 | ) | ||||||||||||
|
| |||||||||||||||||||||||
Net asset value, end of period | $ 9.55 | $ 10.19 | $ 9.99 | $ 10.25 | $ 10.26 | $ 10.12 | ||||||||||||||||||
|
| |||||||||||||||||||||||
Total Return | ||||||||||||||||||||||||
Total investment return based on net asset value(c) | (5.10 | )% | 4.73 | % | (.12 | )% | 2.04 | % | 3.58 | % | (1.52 | )% | ||||||||||||
Ratios/Supplemental Data | ||||||||||||||||||||||||
Net assets, end of period (000’s omitted) | $218,386 | $238,306 | $231,109 | $213,880 | $170,155 | $176,066 | ||||||||||||||||||
Ratio to average net assets of: | ||||||||||||||||||||||||
Expenses, net of waivers/reimbursements | .50 | %^ | .50 | % | .50 | % | .50 | % | .50 | % | .50 | % | ||||||||||||
Expenses, before waivers/reimbursements | .57 | %^ | .57 | % | .57 | % | .57 | % | .58 | % | .57 | % | ||||||||||||
Net investment income(b) | 2.53 | %^ | 2.57 | % | 2.37 | % | 2.14 | % | 2.03 | % | 1.76 | % | ||||||||||||
Portfolio turnover rate. | 12 | % | 12 | % | 15 | % | 9 | % | 9 | % | 17 | % | ||||||||||||
| (a) | Based on average shares outstanding. |
| (b) | Net of expenses waived/reimbursed by the Adviser. |
| (c) | Total investment return is calculated assuming an initial investment made at the net asset value at the beginning of the period, reinvestment of all dividends and distributions at net asset value during the period, and redemption on the last day of the period. Initial sales charges or contingent deferred sales charges are not reflected in the calculation of total investment return. Total return does not reflect the deduction of taxes that a shareholder would pay on portfolio distributions or the redemption of portfolio shares. Total investment return calculated for a period of less than one year is not annualized. |
| ^ | Annualized. |
See notes to financial statements.
| 66 | AB MUNICIPAL BOND INFLATION STRATEGY | abfunds.com | |
BOARD OF DIRECTORS
Marshall C. Turner, Jr.(1), Chairman Jorge A. Bermudez(1) Michael J. Downey(1) Nancy P. Jacklin(1) | Robert M. Keith, President and Chief Executive Officer Jeanette Loeb(1) Carol C. McMullen(1) Garry L. Moody(1) Earl D. Weiner(1) |
OFFICERS
R.B. “Guy” Davidson III(2),^ Vice President Terrance T. Hults(2), Vice President Matthew J. Norton(2), Vice President Andrew D. Potter(2), Vice President | Emilie D. Wrapp, Secretary Michael B. Reyes, Senior Analyst Joseph J. Mantineo, Treasurer and Chief Financial Officer Phyllis J. Clarke, Controller Vincent S. Noto, Chief Compliance Officer |
Custodian and Accounting Agent State Street Bank and Trust Company State Street Corporation CCB/5 1 Iron Street Boston, MA 02210
Principal Underwriter AllianceBernstein Investments, Inc. 1345 Avenue of the Americas New York, NY 10105
Transfer Agent AllianceBernstein Investor Services, Inc. P.O. Box 786003 San Antonio, TX 78278-6003 Toll-Free (800) 221-5672 | Independent Registered Public Accounting Firm Ernst & Young LLP 5 Times Square New York, NY 10036
Legal Counsel Seward & Kissel LLP One Battery Park Plaza New York, NY 10004 |
| 1 | Member of the Audit Committee, the Governance and Nominating Committee, and the Independent Directors Committee. |
| 2 | The day-to-day management of, and investment decisions for, the Fund’s portfolio are made by the Adviser’s Municipal Bond Investment Team. Messrs. Davidson, Hults, Norton and Potter are the investment professionals with the most significant responsibility for the day-to-day management of the Fund’s portfolio. |
| ^ | Mr. Davidson is expected to retire from the Adviser effective December 30, 2020. |
| abfunds.com | AB MUNICIPAL BOND INFLATION STRATEGY | 67 | |
Operation and Effectiveness of the Fund’s Liquidity Risk Management Program:
In October 2016, the Securities and Exchange Commission (“SEC”) adopted the open-end fund liquidity rule (the “Liquidity Rule”). In June 2018 the SEC adopted a requirement that funds disclose information about the operation and effectiveness of their Liquidity Risk Management Program (“LRMP”) in their reports to shareholders.
One of the requirements of the Liquidity Rule is for the Fund to designate an Administrator of the Fund’s Liquidity Risk Management Program. The Administrator of the Fund’s LRMP is AllianceBernstein L.P., the Fund’s investment adviser (the “Adviser”). The Adviser has delegated the responsibility to its Liquidity Risk Management Committee (the “Committee”). Another requirement of the Liquidity Rule is for the Fund’s Board of Directors (the “Fund Board”) to receive an annual written report from the Administrator of the LRMP, which addresses the operation of the Fund’s LRMP and assesses its adequacy and effectiveness. The Adviser provided the Fund’s Board with such annual report during the first quarter of 2020, which covered the period December 1, 2018 through December 31, 2019 (the “Program Reporting Period”).
The LRMP’s principal objectives include supporting the Fund’s compliance with limits on investments in illiquid assets and mitigating the risk that the Fund will be unable to meet its redemption obligations in a timely manner. Pursuant to the LRMP, the Fund classifies the liquidity of its portfolio investments into one of the four categories defined by the SEC: Highly Liquid, Moderately Liquid, Less Liquid, and Illiquid. These classifications are reported to the SEC on Form N-PORT.
During the Program Reporting Period, the Committee reviewed whether the Fund’s strategy is appropriate for an open-end structure, taking into account any holdings of less liquid and illiquid assets. The Committee also performed an analysis to determine whether the Fund is required to maintain a Highly Liquid Investment Minimum (“HLIM”). If the Fund participated in derivative transactions, the exposure from such transactions were considered in the LRMP. The Committee also incorporated the following information when determining the Fund’s reasonably anticipated trading size for purposes of liquidity monitoring: historical net redemption activity, a Fund’s concentration in an issuer, shareholder concentration, investment performance, total net assets, and distribution channels.
The Adviser informed the Fund Board that the Committee believes the Fund’s LRMP is adequately designed, has been implemented as intended, and has operated effectively since its inception. No material exceptions have been noted since the implementation of the LRMP, and there were no liquidity events that impacted the Fund or its ability to timely meet redemptions during the Program Reporting Period.
| 68 | AB MUNICIPAL BOND INFLATION STRATEGY | abfunds.com | |
Information Regarding the Review and Approval of the Fund’s Advisory Agreement
The disinterested directors (the “directors”) of AB Bond Fund, Inc. (the “Company”) unanimously approved the continuance of the Company’s Advisory Agreement with the Adviser in respect of AB Municipal Bond Inflation Strategy (the “Fund”) at a meeting held on November 4-6, 2019 (the “Meeting”.)*
Prior to approval of the continuance of the Advisory Agreement, the directors had requested from the Adviser, and received and evaluated, extensive materials. They reviewed the proposed continuance of the Advisory Agreement with the Adviser and with experienced counsel who are independent of the Adviser, who advised on the relevant legal standards. The directors also reviewed additional materials, including comparative analytical data prepared by the Senior Analyst for the Fund. The directors also discussed the proposed continuance in private sessions with counsel.
The directors considered their knowledge of the nature and quality of the services provided by the Adviser to the Fund gained from their experience as directors or trustees of most of the registered investment companies advised by the Adviser, their overall confidence in the Adviser’s integrity and competence they have gained from that experience, the Adviser’s initiative in identifying and raising potential issues with the directors and its responsiveness, frankness and attention to concerns raised by the directors in the past, including the Adviser’s willingness to consider and implement organizational and operational changes designed to improve investment results and the services provided to the AB Funds. The directors noted that they have four regular meetings each year, at each of which they review extensive materials and information from the Adviser, including information on the investment performance of the Fund and the underlying fund advised by the Adviser in which the Fund invests.
The directors also considered all factors they believed relevant, including the specific matters discussed below. During the course of their deliberations, the directors evaluated, among other things, the reasonableness of the advisory fee. The directors did not identify any particular information that was all-important or controlling, and different directors may have attributed different weights to the various factors. The directors determined that the selection of the Adviser to manage the Fund and the overall arrangements between the Fund and the Adviser, as provided in the Advisory Agreement, including the advisory fee, were fair and reasonable in light of the services performed, expenses incurred and such other matters as the directors considered relevant in the exercise of their business
| * | Following transactions completed on November 13, 2019 that may have been deemed to have been an “assignment” causing termination of the Fund’s investment advisory agreement, a new investment advisory agreement, having the same terms as the prior one, was entered into by the Fund and the Adviser. |
| abfunds.com | AB MUNICIPAL BOND INFLATION STRATEGY | 69 | |
judgment. The material factors and conclusions that formed the basis for the directors’ determinations included the following:
Nature, Extent and Quality of Services Provided
The directors considered the scope and quality of services provided by the Adviser under the Advisory Agreement, including the quality of the investment research capabilities of the Adviser and the other resources it has dedicated to performing services for the Fund. The directors noted that the Adviser from time to time reviews the Fund’s investment strategies and from time to time proposes changes intended to improve the Fund’s relative or absolute performance for the directors’ consideration. They also noted the professional experience and qualifications of the Fund’s portfolio management team and other senior personnel of the Adviser. The directors also considered that the Advisory Agreement provides that the Fund will reimburse the Adviser for the cost to it of providing certain clerical, accounting, administrative and other services to the Fund by employees of the Adviser or its affiliates. Requests for these reimbursements are made on a quarterly basis and subject to approval by the directors. Reimbursements, to the extent requested and paid, result in a higher rate of total compensation from the Fund to the Adviser than the fee rate stated in the Advisory Agreement. The directors noted that the methodology used to determine the reimbursement amounts had been reviewed by an independent consultant retained by the Fund’s former Senior Officer/Independent Compliance Officer. The quality of administrative and other services, including the Adviser’s role in coordinating the activities of the Fund’s other service providers, also was considered. The directors concluded that, overall, they were satisfied with the nature, extent and quality of services provided to the Fund under the Advisory Agreement.
Costs of Services Provided and Profitability
The directors reviewed a schedule of the revenues and expenses and related notes indicating the profitability of the Fund to the Adviser for calendar years 2017 and 2018 that had been prepared with an expense allocation methodology arrived at in consultation with an independent consultant retained by the Fund’s former Senior Officer/Independent Compliance Officer. The directors noted the assumptions and methods of allocation used by the Adviser in preparing fund-specific profitability data and understood that there are a number of potentially acceptable allocation methodologies for information of this type. The directors noted that the profitability information reflected all revenues and expenses of the Adviser’s relationship with the Fund, including those relating to its subsidiaries that provide transfer agency and distribution services to the Fund. The directors recognized that it is difficult to make comparisons of the profitability of the Advisory Agreement with the profitability of fund advisory contracts for unaffiliated funds because comparative information is not generally publicly available and is affected by numerous factors. The directors focused on the profitability of the Adviser’s relationship with the Fund before taxes and
| 70 | AB MUNICIPAL BOND INFLATION STRATEGY | abfunds.com | |
distribution expenses. The directors concluded that the Adviser’s level of profitability from its relationship with the Fund was not unreasonable.
Fall-Out Benefits
The directors considered the other benefits to the Adviser and its affiliates from their relationships with the Fund and the underlying fund advised by the Adviser in which the Fund invests, including, but not limited to, benefits relating to 12b-1 fees and sales charges received by the Fund’s principal underwriter (which is a wholly owned subsidiary of the Adviser) in respect of certain classes of the Fund’s shares; and transfer agency fees paid by the Fund to a wholly owned subsidiary of the Adviser. The directors recognized that the Adviser’s profitability would be somewhat lower without these benefits. The directors understood that the Adviser also might derive reputational and other benefits from its association with the Fund.
Investment Results
In addition to the information reviewed by the directors in connection with the Meeting, the directors receive detailed performance information for the Fund at each regular Board meeting during the year.
At the Meeting, the directors reviewed performance information prepared by an independent service provider (the “15(c) service provider”), showing the performance of the Class A Shares of the Fund against a group of similar funds (“peer group”) and a larger group of similar funds (“peer universe”), each selected by the 15(c) service provider, and information prepared by the Adviser showing performance of the Class A Shares against a broad-based securities market index, in each case for the 1-, 3- and 5-year periods ended July 31, 2019 and (in the case of comparisons with the broad-based securities market index) for the period from inception. Based on their review, the directors concluded that the Fund’s investment performance was acceptable.
Advisory Fees and Other Expenses
The directors considered the advisory fee rate payable by the Fund to the Adviser and information prepared by the 15(c) service provider concerning advisory fee rates payable by other funds in the same category as the Fund. The directors recognized that it is difficult to make comparisons of advisory fees because there are variations in the services that are included in the fees payable by other funds. The directors compared the Fund’s contractual effective advisory fee rate with a peer group median and noted that it was above the median. The directors took into account the impact on the advisory fee rate of the administrative expense reimbursement paid to the Adviser in the latest fiscal year.
The Adviser informed the directors that there were no institutional products managed by the Adviser that utilize investment strategies similar to those of the Fund.
| abfunds.com | AB MUNICIPAL BOND INFLATION STRATEGY | 71 | |
In connection with their review of the Fund’s advisory fee, the directors also considered the total expense ratio of the Class A shares of the Fund in comparison to a peer group and a peer universe selected by the 15(c) service provider. The Class A expense ratio of the Fund was based on the Fund’s latest fiscal year and the directors considered the Adviser’s expense cap for the Fund. The directors noted that it was likely that the expense ratios of some of the other funds in the Fund’s category were lowered by waivers or reimbursements by those funds’ investment advisers, which in some cases might be voluntary or temporary. The directors view expense ratio information as relevant to their evaluation of the Adviser’s services because the Adviser is responsible for coordinating services provided to the Fund by others. The directors noted that the Fund’s expense ratio was above the medians. After reviewing and discussing the Adviser’s explanations of the reasons for this, the directors concluded that the Fund’s expense ratio was acceptable.
Economies of Scale
The directors noted that the advisory fee schedule for the Fund contains breakpoints that reduce the fee rates on assets above specified levels. The directors took into consideration prior presentations by an independent consultant on economies of scale in the mutual fund industry and for the AB Funds, and presentations from time to time by the Adviser concerning certain of its views on economies of scale. The directors also previously discussed economies of scale with an independent fee consultant. The directors also had requested and received from the Adviser certain updates on economies of scale in advance of the Meeting. The directors believe that economies of scale may be realized (if at all) by the Adviser across a variety of products and services, and not only in respect of a single fund. The directors noted that there is no established methodology for setting breakpoints that give effect to the fund-specific services provided by a fund’s adviser and to the economies of scale that an adviser may realize in its overall mutual fund business or those components of it which directly or indirectly affect a fund’s operations. The directors observed that in the mutual fund industry as a whole, as well as among funds similar to the Fund, there is no uniformity or pattern in the fees and asset levels at which breakpoints (if any) apply. The directors also noted that the advisory agreements for many funds do not have breakpoints at all. Having taken these factors into account, the directors concluded that the Fund’s shareholders would benefit from a sharing of economies of scale in the event the Fund’s net assets exceed a breakpoint in the future.
| 72 | AB MUNICIPAL BOND INFLATION STRATEGY | abfunds.com | |
This page is not part of the Shareholder Report or the Financial Statements.
AB FAMILY OF FUNDS
US EQUITY
CORE
Core Opportunities Fund
FlexFee™ US Thematic Portfolio
Select US Equity Portfolio
GROWTH
Concentrated Growth Fund
Discovery Growth Fund
FlexFee™ Large Cap Growth Portfolio
Growth Fund
Large Cap Growth Fund
Small Cap Growth Portfolio
VALUE
Discovery Value Fund
Equity Income Fund
Relative Value Fund
Small Cap Value Portfolio
Value Fund
INTERNATIONAL/ GLOBAL EQUITY
CORE
FlexFee™ International Strategic Core Portfolio
Global Core Equity Portfolio
International Portfolio
International Strategic Core Portfolio
Sustainable Global Thematic Fund
Tax-Managed International Portfolio
Tax-Managed Wealth Appreciation Strategy
Wealth Appreciation Strategy
INTERNATIONAL/ GLOBAL EQUITY (continued)
GROWTH
Concentrated International Growth Portfolio
FlexFee™ Emerging Markets Growth Portfolio
Sustainable International Thematic Fund
VALUE
All China Equity Portfolio
International Value Fund
FIXED INCOME
MUNICIPAL
High Income Municipal Portfolio
Intermediate California Municipal Portfolio
Intermediate Diversified Municipal Portfolio
Intermediate New York Municipal Portfolio
Municipal Bond Inflation Strategy
Tax-Aware Fixed Income Opportunities Portfolio1
National Portfolio
Arizona Portfolio
California Portfolio
Massachusetts Portfolio
Minnesota Portfolio
New Jersey Portfolio
New York Portfolio
Ohio Portfolio
Pennsylvania Portfolio
Virginia Portfolio
FIXED INCOME (continued)
TAXABLE
Bond Inflation Strategy
FlexFee™ High Yield Portfolio
FlexFee™ International Bond Portfolio
Global Bond Fund
High Income Fund
Income Fund
Intermediate Duration Portfolio
Limited Duration High Income Portfolio
Short Duration Income Portfolio
Short Duration Portfolio
Total Return Bond Portfolio1
ALTERNATIVES
All Market Real Return Portfolio
Global Real Estate Investment Fund
Select US Long/Short Portfolio
Unconstrained Bond Fund
MULTI-ASSET
All Market Income Portfolio
All Market Total Return Portfolio
Conservative Wealth Strategy
Emerging Markets Multi-Asset Portfolio
Global Risk Allocation Fund
Tax-Managed All Market Income Portfolio
CLOSED-END FUNDS
AllianceBernstein Global High Income Fund
AllianceBernstein National Municipal Income Fund
We also offer Government Money Market Portfolio, which serves as the money market fund exchange vehicle for the AB mutual funds. You could lose money by investing in the Fund. Although the Fund seeks to preserve the value of your investment at $1.00 per share, it cannot guarantee it will do so. The Fund may impose a fee upon sale of your shares or may temporarily suspend your ability to sell shares if the Fund’s liquidity falls below required minimums because of market conditions or other factors. An investment in the Fund is not insured or guaranteed by the Federal Deposit Insurance Corporation or any other government agency. The Fund’s sponsor has no legal obligation to provide financial support to the Fund, and you should not expect that the sponsor will provide financial support to the Fund at any time.
Investors should consider the investment objectives, risks, charges and expenses of the Fund carefully before investing. For copies of our prospectus or summary prospectus, which contain this and other information, visit us online at www.abfunds.com or contact your AB representative. Please read the prospectus and/or summary prospectus carefully before investing.
| 1 | Prior to July 12, 2019, Total Return Bond Portfolio was named Intermediate Bond Portfolio; prior to February 5, 2020, Tax-Aware Fixed Income Opportunities Portfolio was named Tax-Aware Fixed Income Portfolio. |
| abfunds.com | AB MUNICIPAL BOND INFLATION STRATEGY | 73 | |
NOTES
| 74 | AB MUNICIPAL BOND INFLATION STRATEGY | abfunds.com | |
NOTES
| abfunds.com | AB MUNICIPAL BOND INFLATION STRATEGY | 75 | |
NOTES
| 76 | AB MUNICIPAL BOND INFLATION STRATEGY | abfunds.com | |
AB MUNICIPAL BOND INFLATION STRATEGY
1345 Avenue of the Americas
New York, NY 10105
800 221 5672
MBIS-0152-0420 
APR 04.30.20

SEMI-ANNUAL REPORT
AB SHORT DURATION INCOME PORTFOLIO

Beginning January 1, 2021, as permitted by new regulations adopted by the Securities and Exchange Commission, the Fund’s annual and semi-annual shareholder reports will no longer be sent by mail, unless you specifically request paper copies of the reports. Instead, the reports will be made available on a website, and you will be notified by mail each time a report is posted and provided with a website address to access the report.
If you already elected to receive shareholder reports electronically, you will not be affected by this change and you need not take any action. You may elect to receive shareholder reports and other communications from the Fund electronically at any time by contacting your financial intermediary (such as a broker-dealer or bank) or, if you are a direct investor, by calling the Fund at (800) 221 5672.
You may elect to receive all future reports in paper form free of charge. If you invest through a financial intermediary, you can contact your financial intermediary to request that you continue to receive paper copies of your shareholder reports; if you invest directly with the Fund, you can call the Fund at (800) 221 5672. Your election to receive reports in paper form will apply to all funds held in your account with your financial intermediary or, if you invest directly, to all AB Mutual Funds you hold.
| Investment Products Offered | • Are Not FDIC Insured • May Lose Value • Are Not Bank Guaranteed | |
Investors should consider the investment objectives, risks, charges and expenses of the Fund carefully before investing. For copies of our prospectus or summary prospectus, which contain this and other information, visit us online at www.abfunds.com or contact your AB representative. Please read the prospectus and/or summary prospectus carefully before investing.
This shareholder report must be preceded or accompanied by the Fund’s prospectus for individuals who are not current shareholders of the Fund.
You may obtain a description of the Fund’s proxy voting policies and procedures, and information regarding how the Fund voted proxies relating to portfolio securities during the most recent 12-month period ended June 30, without charge. Simply visit AB’s website at www.abfunds.com, or go to the Securities and Exchange Commission’s (the “Commission”) website at www.sec.gov, or call AB at (800) 227 4618.
The Fund files its complete schedule of portfolio holdings with the Commission for the first and third quarters of each fiscal year as an exhibit to its reports on Form N-PORT. The Fund’s Form N-PORT reports are available on the Commission’s website at www.sec.gov. The Fund’s Forms N-PORT may also be reviewed and copied at the Commission’s Public Reference Room in Washington, DC; information on the operation of the Public Reference Room may be obtained by calling (800) SEC 0330. AB publishes full portfolio holdings for the Fund monthly at www.abfunds.com.
AllianceBernstein Investments, Inc. (ABI) is the distributor of the AB family of mutual funds. ABI is a member of FINRA and is an affiliate of AllianceBernstein L.P., the Adviser of the funds.
The [A/B] logo is a registered service mark of AllianceBernstein and AllianceBernstein® is a registered service mark used by permission of the owner, AllianceBernstein L.P.
| FROM THE PRESIDENT |  |
Dear Shareholder,
We are pleased to provide this report for AB Short Duration Income Portfolio (the “Fund”). Please review the discussion of Fund performance, the market conditions during the reporting period and the Fund’s investment strategy.
As always, AB strives to keep clients ahead of what’s next by:
| + | Transforming uncommon insights into uncommon knowledge with a global research scope |
| + | Navigating markets with seasoned investment experience and sophisticated solutions |
| + | Providing thoughtful investment insights and actionable ideas |
Whether you’re an individual investor or a multi-billion-dollar institution, we put knowledge and experience to work for you.
AB’s global research organization connects and collaborates across platforms and teams to deliver impactful insights and innovative products. Better insights lead to better opportunities—anywhere in the world.
For additional information about AB’s range of products and shareholder resources, please log on to www.abfunds.com.
Thank you for your investment in the AB Mutual Funds.
Sincerely,

Robert M. Keith
President and Chief Executive Officer, AB Mutual Funds
| abfunds.com | AB SHORT DURATION INCOME PORTFOLIO | 1 | |
SEMI-ANNUAL REPORT
June 15, 2020
This report provides management’s discussion of fund performance for AB Short Duration Income Portfolio for the semi-annual reporting period ended April 30, 2020.
The Fund’s investment objective is to seek high current income consistent with preservation of capital.
NAV RETURNS AS OF APRIL 30, 2020 (unaudited)
| 6 Months | 12 Months | |||||||
| AB SHORT DURATION INCOME PORTFOLIO | ||||||||
| Class A Shares | -5.63% | -2.32% | ||||||
| Class C Shares | -4.48% | -1.61% | ||||||
| Advisor Class Shares1 | -4.27% | -0.82% | ||||||
| Bloomberg Barclays 1-5 Year US Government/Credit Index | 3.21% | 6.28% | ||||||
| 1 | Please note that this share class is for investors purchasing shares through accounts established under certain fee-based programs sponsored and maintained by certain broker-dealers and financial intermediaries, institutional pension plans and/or investment advisory clients of, and certain other persons associated with, the Adviser and its affiliates or the Fund. |
INVESTMENT RESULTS
The table above shows the Fund’s performance compared to its benchmark, the Bloomberg Barclays 1-5 Year US Government/Credit Index, for the six- and 12-month periods ended April 30, 2020.
During the six-month period, all share classes of the Fund underperformed the benchmark, before sales charges. Sector selection was the primary detractor, relative to the benchmark, due to exposure in commercial mortgage-backed securities (“CMBS”), agency risk-sharing transactions and high-yield credit default swaps, which was partially offset by gains in exposure to investment-grade corporate bonds and mortgage pass-through securities. Security selection in high-yield and investment-grade bonds contributed. Country, yield-curve and currency decisions did not have a meaningful impact on performance during the period.
During the 12-month period, all share classes of the Fund underperformed the benchmark, before sales charges. Sector exposure in CMBS, agency risk-sharing transactions and high-yield credit default swaps detracted most, although exposure to mortgage pass-through securities and investment-grade corporate bonds partially offset these losses. Currency decisions, mostly in the Brazilian real, Mexican peso and Australian dollar were a minor detractor, partially offset by gains in the Egyptian pound, Swiss franc and euro. Country and yield-curve positioning in the US, Brazil,
| 2 | AB SHORT DURATION INCOME PORTFOLIO | abfunds.com | |
Canada and Peru contributed to returns, which more than offset exposure to the eurozone. Security selection in high-yield and investment-grade bonds also contributed to performance.
During both periods, the Fund utilized derivatives in the form of futures, interest rate swaps and interest rate swaptions to manage and hedge duration risk and to take active yield-curve positioning. Currency forwards were used to hedge foreign currency exposure and to take active currency risk. Credit default swaps, both single name and index, were used both to take active exposure and to hedge investment-grade and high-yield credit risk. Total return swaps were used to create synthetic high-yield exposure in the Fund. The utilization of government-agency-related To Be Announced mortgage short-term positions was a significant contributor to the Fund’s turnover rate of 174%.
MARKET REVIEW AND INVESTMENT STRATEGY
Global fixed-income market returns were mixed over the six-month period ended April 30, 2020. The UK’s exit from the European Union and a US-China trade truce in January led markets higher until investor sentiment turned decidedly negative in March due to the spread of COVID-19. The US Federal Reserve (the “Fed”) initiated several measures during the period to provide liquidity in short-term repurchase agreements and US Treasuries. Investor uncertainty led to an unprecedented flight to quality as credit spreads on risk assets quickly widened to levels not seen since the 2008–2009 global financial crisis. Markets began to recover in April as governments and central banks initiated over $9 trillion of monetary and fiscal stimulus measures to combat the economic fallout from the virus and governments began to relax social distancing and stay-at-home guidelines.
The Fed lowered interest rates 150 basis points to zero, and most other major central banks followed suit with substantial rate cuts. Longer maturity and higher quality developed-market treasury returns were the best performers, along with investment-grade US corporate bonds that rallied in April on the back of record new issuance. High-yield corporate bond returns were negative as investors retreated from risk assets. Securitized asset results were mixed. Emerging-market returns fell as sharply lower oil prices impacted emerging-market commodity exporters. The US dollar advanced against most developed- and emerging-market currencies. The Swiss franc and the yen, which are also considered safe haven currencies, advanced against the US dollar.
The Fund’s Senior Investment Management Team (the “Team”) continues to pursue high income, while preserving capital by investing primarily in government bonds from both US and non-US issuers as well as corporate bonds, with scope to invest a select amount in below investment-grade bonds. The Team manages the Fund with a core fixed-income strategy through a global, multi-sector approach that seeks an attractive risk/return profile.
| abfunds.com | AB SHORT DURATION INCOME PORTFOLIO | 3 | |
INVESTMENT POLICIES
The Fund pursues its objective by investing, under normal circumstances, primarily in income-producing securities. The Fund also normally invests at least 65% of its total assets in securities of US and foreign governments and their agencies and instrumentalities (including mortgage-backed securities), derivatives related to such securities, and repurchase agreements relating to US government securities. Under normal circumstances, the Fund will maintain a dollar-weighted average duration of less than three years, although it may invest in securities of any duration or maturity.
The Fund may invest in non-government fixed-income securities, including corporate debt securities, non-government mortgage-backed and other asset-backed securities, certificates of deposit and commercial paper. The Fund may invest up to 35% of its net assets in below investment-grade securities (commonly known as “junk bonds”). The Fund’s investments in foreign securities may include both government and corporate securities, and securities of emerging-market countries or of issuers in emerging markets.
The Adviser selects securities for purchase or sale based on its assessment of the securities’ risks and return characteristics as well as the securities’ impact on the overall risks and return characteristics of the Fund. In making this assessment, the Adviser takes into account various factors, including the credit quality and sensitivity to interest rates of the securities under consideration and of the Fund’s other holdings.
The Fund may utilize derivatives, such as options, futures contracts, forwards and swaps. The Fund may, for example, use interest rate futures contracts and swaps to establish exposure to the fixed-income markets or particular fixed-income securities. Derivatives may provide a more efficient and economical exposure to market segments than direct investments, and may also be a more efficient way to alter the Fund’s exposure. The Fund may also enter into transactions such as reverse repurchase agreements that are similar to borrowings for investment purposes. The Fund’s use of derivatives and these borrowing transactions may create aggregate exposure that is substantially in excess of its net assets, effectively leveraging the Fund.
The Adviser may hedge the foreign currency exposure resulting from the Fund’s security positions, and may take long or short positions in currencies, through the use of currency-related derivatives. The Fund is “non-diversified”.
| 4 | AB SHORT DURATION INCOME PORTFOLIO | abfunds.com | |
DISCLOSURES AND RISKS
Benchmark Disclosure
The Bloomberg Barclays 1-5 Year US Government/Credit Index is unmanaged and does not reflect fees and expenses associated with the active management of a mutual fund portfolio. The Bloomberg Barclays 1-5 Year US Government/Credit Index is a broad-based benchmark that measures the nonsecuritized component of the Bloomberg Barclays US Aggregate Index. It includes investment-grade, US dollar-denominated, fixed-rate Treasuries, and government-related and corporate securities that have a remaining maturity of greater than or equal to one year and less than five years. An investor cannot invest directly in an index or average, and their results are not indicative of the performance for any specific investment, including the Fund.
A Word About Risk
Market Risk: The market value of a security may move up or down, sometimes rapidly and unpredictably. These fluctuations may cause a security to be worth less than the price originally paid for it, or less than it was worth at an earlier time. Market risk may affect a single issuer, industry, sector of the economy or the market as a whole. Global economies and financial markets are increasingly interconnected, which increases the probabilities that conditions in one country or region might adversely impact issuers in a different country or region. Conditions affecting the general economy, including political, social, or economic instability at the local, regional, or global level may also affect the market value of a security. Health crises, such as pandemic and epidemic diseases, as well as other incidents that interrupt the expected course of events, such as natural disasters, war or civil disturbance, acts of terrorism, power outages and other unforeseeable and external events, and the public response to or fear of such diseases or events, have and may in the future have an adverse effect on the Fund’s investments and net asset value and can lead to increased market volatility. For example, any preventative or protective actions that governments may take in respect of such diseases or events may result in periods of business disruption, inability to obtain raw materials, supplies and component parts, and reduced or disrupted operations for the Fund’s portfolio companies. The occurrence and pendency of such diseases or events could adversely affect the economies and financial markets either in specific countries or worldwide.
Credit Risk: An issuer or guarantor of a fixed-income security, or the counterparty to a derivatives or other contract, may be unable or unwilling to make timely payments of interest or principal, or to otherwise honor its obligations. The issuer or guarantor may default, causing a loss of the full principal amount of a security and accrued interest. The degree of risk for a particular security may be reflected in its credit rating. There is the possibility that the credit rating of a fixed-income security may be
| abfunds.com | AB SHORT DURATION INCOME PORTFOLIO | 5 | |
DISCLOSURES AND RISKS (continued)
downgraded after purchase, which may adversely affect the value of the security.
Below Investment-Grade Securities Risk: Investments in fixed-income securities with lower ratings (commonly known as “junk bonds”) are subject to a higher probability that an issuer will default or fail to meet its payment obligations. These securities may be subject to greater price volatility due to such factors as specific corporate developments, negative perceptions of the junk bond market generally and less secondary market liquidity.
Interest-Rate Risk: Changes in interest rates will affect the value of investments in fixed-income securities. When interest rates rise, the value of existing investments in fixed-income securities tends to fall and this decrease in value may not be offset by higher income from new investments. Interest-rate risk is generally greater for fixed-income securities with longer maturities or durations.
Duration Risk: Duration is a measure that relates the expected price volatility of a fixed-income security to changes in interest rates. The duration of a fixed-income security may be shorter than or equal to full maturity of a fixed-income security. Fixed-income securities with longer durations have more risk and will decrease in price as interest rates rise.
Inflation Risk: This is the risk that the value of assets or income from investments will be less in the future as inflation decreases the value of money. As inflation increases, the value of the Fund’s assets can decline as can the value of the Fund’s distributions. This risk is significantly greater for fixed-income securities with longer maturities.
Foreign (Non-US) Risk: Investments in securities of non-US issuers may involve more risk than those of US issuers. These securities may fluctuate more widely in price and may be more difficult to trade due to adverse market, economic, political, regulatory or other factors.
Emerging-Market Risk: Investments in emerging-market countries may have more risk because the markets are less developed and less liquid as well as being subject to increased economic, political, regulatory or other uncertainties.
Derivatives Risk: Derivatives may be illiquid, difficult to price, and leveraged so that small changes may produce disproportionate losses for the Fund, and may be subject to counterparty risk to a greater degree than more traditional investments.
| 6 | AB SHORT DURATION INCOME PORTFOLIO | abfunds.com | |
DISCLOSURES AND RISKS (continued)
Leverage Risk: To the extent the Fund uses leveraging techniques, its net asset value (“NAV”) may be more volatile because leverage tends to exaggerate the effect of changes in interest rates and any increase or decrease in the value of the Fund’s investments.
Currency Risk: Fluctuations in currency exchange rates may negatively affect the value of the Fund’s investments or reduce its returns.
Illiquid Investments Risk: Illiquid investments risk exists when certain investments become difficult to purchase or sell. Difficulty in selling such investments may result in sales at disadvantageous prices affecting the value of your investment in the Fund. Causes of illiquid investments risk may include low trading volumes, large positions and heavy redemptions of Fund shares. Illiquid investments risk may be higher in a rising interest-rate environment, when the value and liquidity of fixed-income securities generally decline.
Non-Diversification Risk: The Fund may have more risk because it is “non-diversified”, meaning that it can invest more of its assets in a smaller number of issuers. Accordingly, changes in the value of a single security may have a more significant effect, either negative or positive, on the Fund’s NAV.
Mortgage-Related and/or Other Asset-Backed Securities Risk: Investments in mortgage-related and other asset-backed securities are subject to certain additional risks. The value of these securities may be particularly sensitive to changes in interest rates. These risks include “extension risk”, which is the risk that, in periods of rising interest rates, issuers may delay the payment of principal, and “prepayment risk”, which is the risk that in periods of falling interest rates, issuers may pay principal sooner than expected, exposing the Fund to a lower rate of return upon reinvestment of principal. Mortgage-backed securities offered by non-governmental issuers and other asset-backed securities may be subject to other risks, such as higher rates of default in the mortgages or assets backing the securities or risks associated with the nature and servicing of mortgages or assets backing the securities.
Management Risk: The Fund is subject to management risk because it is an actively managed investment fund. The Adviser will apply its investment techniques and risk analyses in making investment decisions for the Fund, but there is no guarantee that its techniques will produce the intended results. Some of these techniques may incorporate, or rely upon, quantitative models, but there is no guarantee that these models will generate accurate forecasts, reduce risk or otherwise perform as expected.
These risks are fully discussed in the Fund’s prospectus. As with all investments, you may lose money by investing in the Fund.
| abfunds.com | AB SHORT DURATION INCOME PORTFOLIO | 7 | |
DISCLOSURES AND RISKS (continued)
An Important Note About Historical Performance
The investment return and principal value of an investment in the Fund will fluctuate, so that shares, when redeemed, may be worth more or less than their original cost. Performance shown in this report represents past performance and does not guarantee future results. Current performance may be lower or higher than the performance information shown. You may obtain performance information current to the most recent month-end by visiting www.abfunds.com. The Fund has been in operation only for a short period of time, and therefore has a very limited historical performance period. This limited performance period is unlikely to be representative of the performance the Portfolio will achieve over a longer period.
All fees and expenses related to the operation of the Fund have been deducted. NAV returns do not reflect sales charges; if sales charges were reflected, the Fund’s quoted performance would be lower. SEC returns reflect the applicable sales charges for each share class: a 4.25% maximum front-end sales charge for Class A shares and a 1% 1-year contingent deferred sales charge for Class C shares. Returns for the different share classes will vary due to different expenses associated with each class. Performance assumes reinvestment of distributions and does not account for taxes.
| 8 | AB SHORT DURATION INCOME PORTFOLIO | abfunds.com | |
HISTORICAL PERFORMANCE
AVERAGE ANNUAL RETURNS AS OF APRIL 30, 2020 (unaudited)
| NAV Returns | SEC Returns (reflects applicable sales charges) | SEC Yields1 | ||||||||||
| CLASS A SHARES | 0.54% | |||||||||||
| 1 Year | -2.32% | -6.45% | ||||||||||
| Since Inception2 | 0.76% | -2.33% | ||||||||||
| CLASS C SHARES | -0.10% | |||||||||||
| 1 Year | -1.61% | -2.55% | ||||||||||
| Since Inception2 | 1.07% | 1.07% | ||||||||||
| ADVISOR CLASS SHARES3 | 0.86% | |||||||||||
| 1 Year | -0.82% | -0.82% | ||||||||||
| Since Inception2 | 1.93% | 1.93% | ||||||||||
The Fund’s current prospectus fee table shows the Fund’s total annual operating expense ratios as 3.18%, 4.02% and 2.99% for Class A, Class C and Advisor Class shares, respectively, gross of any fee waivers or expense reimbursements. Contractual fee waivers and/or expense reimbursements limit the Fund’s annual operating expense ratios exclusive of acquired fund fees and expenses other than the advisory fees of any AB mutual funds in which the Fund may invest, interest expense, taxes, extraordinary expenses and brokerage commissions and other transaction costs to 0.65%, 1.45% and 0.45% for Class A, Class C and Advisor Class shares, respectively. These waivers/reimbursements may not be terminated before January 31, 2021. Any fees waived and expenses borne by the Adviser may be reimbursed by the Fund until the end of the third fiscal year after the fiscal period in which the fee was waived or the expense was borne, provided that no reimbursement payment will be made that would cause the Fund’s total operating expenses to exceed the applicable expense limitations. Absent reimbursements or waivers, performance would have been lower. The Financial Highlights section of this report sets forth expense ratio data for the current reporting period; the expense ratios shown above may differ from the expense ratios in the Financial Highlights section since they are based on different time periods.
| 1 | SEC yields are calculated based on SEC guidelines for the 30-day period ended April 30, 2020. |
| 2 | Inception date: 12/12/2018. |
| 3 | This share class is offered at NAV to eligible investors and the SEC returns are the same as the NAV returns. Please note that this share class is for investors purchasing shares through accounts established under certain fee-based programs sponsored and maintained by certain broker-dealers and financial intermediaries, institutional pension plans and/or investment advisory clients of and certain other persons associated with, the Adviser and its affiliates or the Fund. |
| abfunds.com | AB SHORT DURATION INCOME PORTFOLIO | 9 | |
HISTORICAL PERFORMANCE (continued)
SEC AVERAGE ANNUAL RETURNS
AS OF THE MOST RECENT CALENDAR QUARTER-END
MARCH 31, 2020 (unaudited)
| SEC Returns (reflects applicable sales charges) | ||||
| CLASS A SHARES | ||||
| 1 Year | -6.48% | |||
| Since Inception1 | -2.90% | |||
| CLASS C SHARES | ||||
| 1 Year | -2.67% | |||
| Since Inception1 | 0.68% | |||
| ADVISOR CLASS SHARES2 | ||||
| 1 Year | -0.84% | |||
| Since Inception1 | 1.61% | |||
| 1 | Inception date: 12/12/2018. |
| 2 | Please note that this share class is for investors purchasing shares through accounts established under certain fee-based programs sponsored and maintained by certain broker-dealers and financial intermediaries, institutional pension plans and/or investment advisory clients of and certain other persons associated with, the Adviser and its affiliates or the Fund. |
| 10 | AB SHORT DURATION INCOME PORTFOLIO | abfunds.com | |
EXPENSE EXAMPLE
(unaudited)
As a shareholder of the Fund, you incur two types of costs: (1) transaction costs, including sales charges (loads) on purchase payments, contingent deferred sales charges on redemptions and (2) ongoing costs, including management fees; distribution (12b-1) fees; and other Fund expenses. This example is intended to help you understand your ongoing costs (in dollars) of investing in the Fund and to compare these costs with the ongoing costs of investing in other mutual funds.
The Example is based on an investment of $1,000 invested at the beginning of the period and held for the entire period as indicated below.
Actual Expenses
The first line of the table below provides information about actual account values and actual expenses. You may use the information in this line, together with the amount you invested, to estimate the expenses that you paid over the period. Simply divide your account value by $1,000 (for example, an $8,600 account value divided by $1,000 = 8.6), then multiply the result by the number in the first line under the heading entitled “Expenses Paid During Period” to estimate the expenses you paid on your account during this period.
Hypothetical Example for Comparison Purposes
The second line of the table below provides information about hypothetical account values and hypothetical expenses based on the Fund’s actual expense ratio and an assumed annual rate of return of 5% before expenses, which is not the Fund’s actual return. The hypothetical account values and expenses may not be used to estimate the actual ending account balance or expenses you paid for the period. You may use this information to compare the ongoing costs of investing in the Fund and other funds by comparing this 5% hypothetical example with the 5% hypothetical examples that appear in the shareholder reports of other funds.
| Beginning Account Value November 1, 2019 | Ending Account Value April 30, 2020 | Expenses Paid During Period* | Annualized Expense Ratio* | |||||||||||||
| Class A | ||||||||||||||||
Actual | $ | 1,000 | $ | 943.70 | $ | 3.48 | 0.72 | % | ||||||||
Hypothetical** | $ | 1,000 | $ | 1,021.28 | $ | 3.62 | 0.72 | % | ||||||||
| Class C | ||||||||||||||||
Actual | $ | 1,000 | $ | 955.20 | $ | 7.34 | 1.51 | % | ||||||||
Hypothetical** | $ | 1,000 | $ | 1,017.35 | $ | 7.57 | 1.51 | % | ||||||||
| Advisor Class | ||||||||||||||||
Actual | $ | 1,000 | $ | 957.30 | $ | 2.68 | 0.55 | % | ||||||||
Hypothetical** | $ | 1,000 | $ | 1,022.13 | $ | 2.77 | 0.55 | % | ||||||||
| * | Expenses are equal to the Fund’s annualized expense ratio multiplied by the average account value over the period, multiplied by 182/366 (to reflect the one-half year period). |
| ** | Assumes 5% annual return before expenses. |
| abfunds.com | AB SHORT DURATION INCOME PORTFOLIO | 11 | |
PORTFOLIO SUMMARY
April 30, 2020 (unaudited)
PORTFOLIO STATISTICS
Net Assets ($mil): $34.4

| 1 | All data are as of April 30, 2020. The Fund’s security type breakdown is expressed as a percentage of total investments and may vary over time. The Fund also enters into derivative transactions, which may be used for hedging or investment purposes (see “Portfolio of Investments” section of the report for additional details). “Other” security type weightings represent 0.1% or less in the following security types: Emerging Markets–Corporate Bonds, Emerging Markets–Sovereigns and Quasi-Sovereigns. |
| 12 | AB SHORT DURATION INCOME PORTFOLIO | abfunds.com | |
PORTFOLIO OF INVESTMENTS
April 30, 2020 (unaudited)
| Principal Amount (000) | U.S. $ Value | |||||||||||
|
| |||||||||||
GOVERNMENTS – TREASURIES – 44.9% | ||||||||||||
Indonesia – 0.3% | ||||||||||||
Indonesia Treasury Bond | IDR | 227,000 | $ | 15,730 | ||||||||
Series FR77 | 168,000 | 11,661 | ||||||||||
Series FR78 | 916,000 | 62,604 | ||||||||||
|
| |||||||||||
| 89,995 | ||||||||||||
|
| |||||||||||
Ireland – 0.9% | ||||||||||||
Ireland Government Bond | EUR | 235 | 295,270 | |||||||||
|
| |||||||||||
Mexico – 0.5% | ||||||||||||
Mexican Bonos | MXN | 3,550 | 158,114 | |||||||||
|
| |||||||||||
Peru – 0.9% | ||||||||||||
Peru Government Bond | PEN | 950 | 323,104 | |||||||||
|
| |||||||||||
United States – 42.3% | ||||||||||||
U.S. Treasury Bonds | U.S.$ | 1,601 | 2,264,197 | |||||||||
U.S. Treasury Notes | 1,424 | 1,447,522 | ||||||||||
1.625%, 10/31/2026-08/15/2029 | 1,830 | 1,970,348 | ||||||||||
2.00%, 05/31/2024 | 2,955 | 3,156,309 | ||||||||||
2.875%, 08/15/2028(b) | 435 | 515,154 | ||||||||||
3.125%, 11/15/2028 | 4,298 | 5,204,488 | ||||||||||
|
| |||||||||||
| 14,558,018 | ||||||||||||
|
| |||||||||||
Total Governments – Treasuries | 15,424,501 | |||||||||||
|
| |||||||||||
MORTGAGE PASS-THROUGHS – 28.8% | ||||||||||||
Agency Fixed Rate 30-Year – 28.8% | ||||||||||||
Government National Mortgage Association | 652 | 694,350 | ||||||||||
Uniform Mortgage-Backed Security | 656 | 706,753 | ||||||||||
Series 2019 | 381 | 401,755 | ||||||||||
3.50%, 05/01/2050, TBA | 7,306 | 7,719,556 | ||||||||||
| abfunds.com | AB SHORT DURATION INCOME PORTFOLIO | 13 | |
PORTFOLIO OF INVESTMENTS (continued)
| Principal Amount (000) | U.S. $ Value | |||||||||||
|
| |||||||||||
5.00%, 05/01/2050, TBA | U.S.$ | 349 | $ | 379,096 | ||||||||
|
| |||||||||||
Total Mortgage Pass-Throughs | 9,901,510 | |||||||||||
|
| |||||||||||
COLLATERALIZED MORTGAGE OBLIGATIONS – 15.4% | ||||||||||||
Risk Share Floating Rate – 14.3% | ||||||||||||
Bellemeade Re Ltd. | 150 | 129,917 | ||||||||||
Series 2019-1A, Class M2 | 152 | 112,914 | ||||||||||
Series 2019-3A, Class M1B | 150 | 130,464 | ||||||||||
Series 2019-4A, Class M2 | 150 | 104,409 | ||||||||||
Connecticut Avenue Securities Trust | 25 | 22,567 | ||||||||||
Series 2019-R03, Class 1M2 | 38 | 34,222 | ||||||||||
Series 2019-R05, Class 1M2 | 33 | 29,833 | ||||||||||
Series 2019-R06, Class 2M2 | 50 | 42,282 | ||||||||||
Series 2020-R02, Class 2M1 | 49 | 47,697 | ||||||||||
Federal Home Loan Mortgage Corp. | 14 | 12,320 | ||||||||||
Series 2019-DNA4, Class M2 | 34 | 28,822 | ||||||||||
Series 2019-HQA1, Class M2 | 18 | 16,370 | ||||||||||
| 14 | AB SHORT DURATION INCOME PORTFOLIO | abfunds.com | |
PORTFOLIO OF INVESTMENTS (continued)
| Principal Amount (000) | U.S. $ Value | |||||||||
|
| |||||||||
Series 2020-DNA1, Class M2 | U.S.$ | 145 | $ | 110,056 | ||||||
Federal Home Loan Mortgage Corp. Structured Agency Credit Risk Debt Notes | 217 | 178,828 | ||||||||
Series 2017-DNA1, Class M2 | 250 | 238,231 | ||||||||
Series 2017-DNA2, Class M2 | 400 | 383,585 | ||||||||
Series 2018-DNA1, Class M2 | 88 | 75,756 | ||||||||
Series 2018-HQA1, Class M2 | 133 | 116,835 | ||||||||
Federal National Mortgage Association Connecticut Avenue Securities | 251 | 197,235 | ||||||||
Series 2015-C02, Class 1M2 | 64 | 51,761 | ||||||||
Series 2015-C02, Class 2M2 | 50 | 42,918 | ||||||||
Series 2015-C03, Class 1M2 | 80 | 59,126 | ||||||||
Series 2015-C04, Class 2M2 | 5 | 4,945 | ||||||||
Series 2016-C01, Class 1M2 | 24 | 24,264 | ||||||||
Series 2016-C04, Class 1M2 | 362 | 355,157 | ||||||||
Series 2016-C05, Class 2M2 | 171 | 168,323 | ||||||||
| abfunds.com | AB SHORT DURATION INCOME PORTFOLIO | 15 | |
PORTFOLIO OF INVESTMENTS (continued)
| Principal Amount (000) | U.S. $ Value | |||||||||
|
| |||||||||
Series 2017-C02, Class 2B1 | U.S.$ | 24 | $ | 17,140 | ||||||
Series 2017-C02, Class 2M2 | 465 | 439,390 | ||||||||
Series 2017-C04, Class 2M2 | 73 | 66,881 | ||||||||
Series 2017-C05, Class 1M2 | 69 | 64,275 | ||||||||
Series 2017-C07, Class 2M2 | 151 | 131,824 | ||||||||
Series 2018-C04, Class 2M2 | 137 | 118,634 | ||||||||
Home Re Ltd. | 60 | 57,214 | ||||||||
Mortgage Insurance-Linked Notes | 160 | 153,437 | ||||||||
Series 2019-1, Class M2 | 150 | 128,413 | ||||||||
Series 2020-1, Class M1A | 150 | 144,032 | ||||||||
Series 2020-1, Class M1B | 150 | 133,346 | ||||||||
Series 2020-1, Class M1C | 150 | 125,429 | ||||||||
Oaktown Re II Ltd. | 49 | 47,537 | ||||||||
Oaktown Re III Ltd. | 150 | 137,368 | ||||||||
| 16 | AB SHORT DURATION INCOME PORTFOLIO | abfunds.com | |
PORTFOLIO OF INVESTMENTS (continued)
| Principal Amount (000) | U.S. $ Value | |||||||||||
|
| |||||||||||
PMT Credit Risk Transfer Trust | U.S.$ | 81 | $ | 61,792 | ||||||||
Radnor Re Ltd. | 122 | 112,680 | ||||||||||
Series 2019-2, Class M1B | 305 | 266,931 | ||||||||||
|
| |||||||||||
| 4,925,160 | ||||||||||||
|
| |||||||||||
Agency Fixed Rate – 0.6% | ||||||||||||
Federal Home Loan Mortgage Corp. REMICs | 141 | 30,240 | ||||||||||
Federal National Mortgage Association REMICs | 464 | 25,064 | ||||||||||
Series 2016-26, Class IO | 319 | 57,639 | ||||||||||
Series 2016-31, Class IO | 401 | 66,726 | ||||||||||
Series 2016-64, Class BI | 52 | 9,183 | ||||||||||
|
| |||||||||||
| 188,852 | ||||||||||||
|
| |||||||||||
Agency Floating Rate – 0.5% | ||||||||||||
Federal Home Loan Mortgage Corp. REMICs | 196 | 38,209 | ||||||||||
Series 4906, Class SA | 190 | 36,907 | ||||||||||
Federal National Mortgage Association REMICs | 297 | 8,572 | ||||||||||
Series 2012-17, Class ES | 168 | 23,913 | ||||||||||
Series 2012-17, Class SE | 100 | 25,433 | ||||||||||
| abfunds.com | AB SHORT DURATION INCOME PORTFOLIO | 17 | |
PORTFOLIO OF INVESTMENTS (continued)
| Principal Amount (000) | U.S. $ Value | |||||||||||
|
| |||||||||||
Series 2019-25, Class SA | U.S.$ | 88 | $ | 18,270 | ||||||||
Series 2019-42, Class SQ | 114 | 17,628 | ||||||||||
|
| |||||||||||
| 168,932 | ||||||||||||
|
| |||||||||||
Total Collateralized Mortgage Obligations | 5,282,944 | |||||||||||
|
| |||||||||||
CORPORATES – INVESTMENT GRADE – 11.6% | ||||||||||||
Industrial – 6.3% | ||||||||||||
Capital Goods – 0.1% | ||||||||||||
General Electric Co. | 28 | 28,507 | ||||||||||
|
| |||||||||||
Communications - Media – 1.0% | ||||||||||||
Charter Communications Operating LLC/Charter Communications Operating Capital | 130 | 136,967 | ||||||||||
Fox Corp. | 3 | 3,183 | ||||||||||
Interpublic Group of Cos., Inc. (The) | 39 | 40,391 | ||||||||||
ViacomCBS, Inc. | 26 | 26,437 | ||||||||||
4.75%, 05/15/2025 | 113 | 120,905 | ||||||||||
|
| |||||||||||
| 327,883 | ||||||||||||
|
| |||||||||||
Consumer Cyclical - Automotive – 1.1% | ||||||||||||
BMW US Capital LLC | 86 | 91,223 | ||||||||||
General Motors Financial Co., Inc. | 75 | 71,168 | ||||||||||
3.70%, 05/09/2023 | 84 | 80,533 | ||||||||||
Hyundai Capital America | 121 | 128,847 | ||||||||||
|
| |||||||||||
| 371,771 | ||||||||||||
|
| |||||||||||
Consumer Cyclical - Entertainment – 0.4% |
| |||||||||||
Carnival Corp. | 117 | 122,218 | ||||||||||
|
| |||||||||||
Consumer Cyclical - Other – 0.0% | ||||||||||||
Marriott International, Inc./MD | 14 | 14,636 | ||||||||||
|
| |||||||||||
| 18 | AB SHORT DURATION INCOME PORTFOLIO | abfunds.com | |
PORTFOLIO OF INVESTMENTS (continued)
| Principal Amount (000) | U.S. $ Value | |||||||||||
|
| |||||||||||
Consumer Cyclical - Restaurants – 0.1% | ||||||||||||
McDonald’s Corp. | U.S.$ | 48 | $ | 52,348 | ||||||||
|
| |||||||||||
Consumer Cyclical - Retailers – 0.5% | ||||||||||||
Nordstrom, Inc. | 5 | 5,342 | ||||||||||
Ross Stores, Inc. | 66 | 72,081 | ||||||||||
TJX Cos., Inc. (The) | 26 | 28,044 | ||||||||||
VF Corp. | 39 | 39,651 | ||||||||||
2.80%, 04/23/2027 | 23 | 23,593 | ||||||||||
|
| |||||||||||
| 168,711 | ||||||||||||
|
| |||||||||||
Consumer Non-Cyclical – 0.5% | ||||||||||||
BAT Capital Corp. | 32 | 35,283 | ||||||||||
Cigna Corp. | 60 | 62,469 | ||||||||||
CVS Health Corp. | 25 | 27,332 | ||||||||||
Sysco Corp. | 25 | 28,034 | ||||||||||
Zimmer Biomet Holdings, Inc. | 32 | 32,109 | ||||||||||
|
| |||||||||||
| 185,227 | ||||||||||||
|
| |||||||||||
Energy – 1.1% | ||||||||||||
BP Capital Markets America, Inc. | 67 | 70,350 | ||||||||||
EOG Resources, Inc. | 21 | 23,381 | ||||||||||
Equinor ASA | 87 | 91,154 | ||||||||||
Marathon Petroleum Corp. | 112 | 112,202 | ||||||||||
ONEOK, Inc. | 17 | 14,728 | ||||||||||
Plains All American Pipeline LP/PAA Finance Corp. | 13 | 11,972 | ||||||||||
4.65%, 10/15/2025 | 27 | 25,523 | ||||||||||
Shell International Finance BV | 32 | 33,016 | ||||||||||
Sunoco Logistics Partners Operations LP | 5 | 4,685 | ||||||||||
|
| |||||||||||
| 387,011 | ||||||||||||
|
| |||||||||||
| abfunds.com | AB SHORT DURATION INCOME PORTFOLIO | 19 | |
PORTFOLIO OF INVESTMENTS (continued)
| Principal Amount (000) | U.S. $ Value | |||||||||||
|
| |||||||||||
Services – 0.3% | ||||||||||||
Booking Holdings, Inc. | U.S.$ | 31 | $ | 32,867 | ||||||||
Expedia Group, Inc. | 29 | 29,638 | ||||||||||
7.00%, 05/01/2025(a) | 57 | 58,233 | ||||||||||
|
| |||||||||||
| 120,738 | ||||||||||||
|
| |||||||||||
Technology – 0.7% | ||||||||||||
Analog Devices, Inc. | 13 | 13,583 | ||||||||||
Broadcom, Inc. | 59 | 65,029 | ||||||||||
Dell International LLC/EMC Corp. | 10 | 10,886 | ||||||||||
KLA Corp. | 61 | 67,877 | ||||||||||
NXP BV/NXP Funding LLC/NXP USA, Inc. | 20 | 20,218 | ||||||||||
VMware, Inc. | 48 | 50,749 | ||||||||||
|
| |||||||||||
| 228,342 | ||||||||||||
|
| |||||||||||
Transportation - Airlines – 0.4% | ||||||||||||
Delta Air Lines, Inc. | 54 | 55,436 | ||||||||||
Southwest Airlines Co. | 35 | 34,749 | ||||||||||
5.25%, 05/04/2025 | 39 | 38,836 | ||||||||||
|
| |||||||||||
| 129,021 | ||||||||||||
|
| |||||||||||
Transportation - Services – 0.1% | ||||||||||||
FedEx Corp. | 21 | 22,515 | ||||||||||
|
| |||||||||||
| 2,158,928 | ||||||||||||
|
| |||||||||||
Financial Institutions – 5.2% | ||||||||||||
Banking – 4.7% | ||||||||||||
AIB Group PLC | 200 | 206,962 | ||||||||||
Ally Financial, Inc. | 34 | 36,241 | ||||||||||
Banco Santander Mexico SA Institucion de Banca Multiple Grupo Financiero Santand | 150 | 153,937 | ||||||||||
Banco Santander SA | 200 | 205,350 | ||||||||||
Bank of America Corp. | 33 | 33,244 | ||||||||||
| 20 | AB SHORT DURATION INCOME PORTFOLIO | abfunds.com | |
PORTFOLIO OF INVESTMENTS (continued)
| Principal Amount (000) | U.S. $ Value | |||||||||||
|
| |||||||||||
Citigroup, Inc. | U.S.$ | 174 | $ | 182,194 | ||||||||
Danske Bank A/S | 200 | 215,264 | ||||||||||
Goldman Sachs Group, Inc. (The) | 16 | 17,061 | ||||||||||
ING Groep NV | 200 | 199,842 | ||||||||||
Morgan Stanley | 125 | 137,653 | ||||||||||
Nationwide Building Society | 200 | 205,160 | ||||||||||
State Street Corp. | 12 | 12,749 | ||||||||||
|
| |||||||||||
| 1,605,657 | ||||||||||||
|
| |||||||||||
Finance – 0.1% | ||||||||||||
Synchrony Financial | 21 | 20,550 | ||||||||||
|
| |||||||||||
Insurance – 0.3% | ||||||||||||
Centene Corp. | 40 | 41,211 | ||||||||||
Voya Financial, Inc. | 63 | 62,197 | ||||||||||
|
| |||||||||||
| 103,408 | ||||||||||||
|
| |||||||||||
REITS – 0.1% | ||||||||||||
Sabra Health Care LP | 11 | 10,688 | ||||||||||
Service Properties Trust | 37 | 31,044 | ||||||||||
4.75%, 10/01/2026 | 18 | 14,768 | ||||||||||
|
| |||||||||||
| 56,500 | ||||||||||||
|
| |||||||||||
| 1,786,115 | ||||||||||||
|
| |||||||||||
Utility – 0.1% | ||||||||||||
Electric – 0.1% | ||||||||||||
NextEra Energy Capital Holdings, Inc. | 25 | 26,620 | ||||||||||
|
| |||||||||||
Total Corporates – Investment Grade | 3,971,663 | |||||||||||
|
| |||||||||||
INFLATION-LINKED SECURITIES – 10.7% | ||||||||||||
United States – 10.7% | ||||||||||||
U.S. Treasury Inflation Index | 2,272 | 2,279,121 | ||||||||||
| abfunds.com | AB SHORT DURATION INCOME PORTFOLIO | 21 | |
PORTFOLIO OF INVESTMENTS (continued)
| Principal Amount (000) | U.S. $ Value | |||||||||||
|
| |||||||||||
0.25%, 01/15/2025 (TIPS) | U.S.$ | 1,347 | $ | 1,380,497 | ||||||||
|
| |||||||||||
Total Inflation-Linked Securities | 3,659,618 | |||||||||||
|
| |||||||||||
COMMERCIAL MORTGAGE-BACKED SECURITIES – 8.0% | ||||||||||||
Non-Agency Fixed Rate CMBS – 6.6% | ||||||||||||
BAMLL Commercial Mortgage Securities Trust | 100 | 86,282 | ||||||||||
Barclays Commercial Mortgage Trust | 998 | 70,046 | ||||||||||
Bbcms Mortgage Trust | 1,534 | 95,693 | ||||||||||
CD Mortgage Trust | 1,786 | 92,252 | ||||||||||
CFCRE Commercial Mortgage Trust | 96 | 5,914 | ||||||||||
Citigroup Commercial Mortgage Trust | 1,102 | 77,793 | ||||||||||
Series 2017-P7, Class XA | 987 | 54,829 | ||||||||||
COMM Mortgage Trust | 100 | 92,283 | ||||||||||
Commercial Mortgage Trust | 100 | 77,840 | ||||||||||
Series 2015-CR27, Class XA | 1,473 | 54,653 | ||||||||||
Series 2016-DC2, Class XA | 3,177 | 137,022 | ||||||||||
CSAIL Commercial Mortgage Trust | 100 | 69,687 | ||||||||||
GS Mortgage Securities Trust | 85 | 55,714 | ||||||||||
Series 2013-GC13, Class D | 100 | 79,633 | ||||||||||
| 22 | AB SHORT DURATION INCOME PORTFOLIO | abfunds.com | |
PORTFOLIO OF INVESTMENTS (continued)
| Principal Amount (000) | U.S. $ Value | |||||||||||
|
| |||||||||||
Series 2014-GC22, Class D | U.S.$ | 40 | $ | 24,112 | ||||||||
Series 2016-GS3, Class XA | 1,515 | 79,586 | ||||||||||
Series 2017-GS5, Class XA | 1,584 | 68,161 | ||||||||||
Series 2017-GS7, Class XA | 3,436 | 200,216 | ||||||||||
JP Morgan Chase Commercial Mortgage Securities Trust | 100 | 51,593 | ||||||||||
Series 2012-LC9, Class G | 100 | 69,596 | ||||||||||
JPMBB Commercial Mortgage Securities Trust | 75 | 58,488 | ||||||||||
Series 2014-C21, Class D | 100 | 75,706 | ||||||||||
UBS Commercial Mortgage Trust | 125 | 97,359 | ||||||||||
Series 2017-C1, Class XA | 1,376 | 106,761 | ||||||||||
Series 2017-C2, Class XA | 928 | 52,234 | ||||||||||
UBS-Barclays Commercial Mortgage Trust | 81 | 46,235 | ||||||||||
Wells Fargo Commercial Mortgage Trust | 938 | 49,212 | ||||||||||
Series 2016-LC24, Class XA | 937 | 59,902 | ||||||||||
Series 2019-C52, Class XA | 996 | 99,491 | ||||||||||
WFRBS Commercial Mortgage Trust | 60 | 51,828 | ||||||||||
Series 2011-C4, Class E | 25 | 15,189 | ||||||||||
|
| |||||||||||
| 2,255,310 | ||||||||||||
|
| |||||||||||
| abfunds.com | AB SHORT DURATION INCOME PORTFOLIO | 23 | |
PORTFOLIO OF INVESTMENTS (continued)
| Principal Amount (000) | U.S. $ Value | |||||||||||
|
| |||||||||||
Non-Agency Floating Rate CMBS – 1.4% | ||||||||||||
BFLD | U.S.$ | 59 | $ | 49,762 | ||||||||
Series 2019-DPLO, Class E | 10 | 8,178 | ||||||||||
CLNY Trust | 120 | 87,802 | ||||||||||
Series 2019-IKPR, Class E | 55 | 37,554 | ||||||||||
Great Wolf Trust | 45 | 35,973 | ||||||||||
Morgan Stanley Capital I Trust | 133 | 101,014 | ||||||||||
Natixis Commercial Mortgage Securities Trust | 100 | 88,411 | ||||||||||
Starwood Retail Property Trust | 89 | 82,798 | ||||||||||
|
| |||||||||||
| 491,492 | ||||||||||||
|
| |||||||||||
Total Commercial Mortgage-Backed Securities | 2,746,802 | |||||||||||
|
| |||||||||||
CORPORATES – NON-INVESTMENT GRADE – 4.6% | ||||||||||||
Industrial – 4.3% | ||||||||||||
Basic – 0.4% | ||||||||||||
Arconic Corp. | 15 | 15,116 | ||||||||||
6.125%, 02/15/2028(a) | 6 | 5,687 | ||||||||||
Cleveland-Cliffs, Inc. | 35 | 34,475 | ||||||||||
Eldorado Gold Corp. | 18 | 19,210 | ||||||||||
| 24 | AB SHORT DURATION INCOME PORTFOLIO | abfunds.com | |
PORTFOLIO OF INVESTMENTS (continued)
| Principal Amount (000) | U.S. $ Value | |||||||||||
|
| |||||||||||
Graphic Packaging International LLC | U.S.$ | 6 | $ | 6,203 | ||||||||
Hecla Mining Co. | 29 | 28,633 | ||||||||||
Kaiser Aluminum Corp. | 11 | 11,195 | ||||||||||
Polyone Corp. | 16 | 16,196 | ||||||||||
|
| |||||||||||
| 136,715 | ||||||||||||
|
| |||||||||||
Capital Goods – 0.4% | ||||||||||||
Bombardier, Inc. | 28 | 18,330 | ||||||||||
Cleaver-Brooks, Inc. | 7 | 5,766 | ||||||||||
Gates Global LLC/Gates Corp. | 23 | 20,933 | ||||||||||
GFL Environmental, Inc. | 2 | 2,080 | ||||||||||
7.00%, 06/01/2026(a) | 7 | 7,368 | ||||||||||
SPX FLOW, Inc. | 35 | 35,616 | ||||||||||
TransDigm, Inc. | 35 | 36,418 | ||||||||||
Triumph Group, Inc. | 8 | 6,109 | ||||||||||
|
| |||||||||||
| 132,620 | ||||||||||||
|
| |||||||||||
Communications - Media – 0.2% | ||||||||||||
Diamond Sports Group LLC/Diamond Sports Finance Co. | 43 | 32,691 | ||||||||||
DISH DBS Corp. | 8 | 7,627 | ||||||||||
Meredith Corp. | 10 | 8,560 | ||||||||||
Univision Communications, Inc. | 6 | 5,459 | ||||||||||
9.50%, 05/01/2025(a) | 16 | 16,294 | ||||||||||
|
| |||||||||||
| 70,631 | ||||||||||||
|
| |||||||||||
Communications - Telecommunications – 0.1% | ||||||||||||
Intelsat Jackson Holdings SA | 34 | 37,748 | ||||||||||
|
| |||||||||||
Consumer Cyclical - Automotive – 0.6% | ||||||||||||
Adient US LLC | 40 | 41,711 | ||||||||||
| abfunds.com | AB SHORT DURATION INCOME PORTFOLIO | 25 | |
PORTFOLIO OF INVESTMENTS (continued)
| Principal Amount (000) | U.S. $ Value | |||||||||||
|
| |||||||||||
Ford Motor Co. | U.S.$ | 90 | $ | 89,914 | ||||||||
9.00%, 04/22/2025 | 27 | 26,286 | ||||||||||
Navistar International Corp. | 15 | 15,739 | ||||||||||
Panther BF Aggregator 2 LP/Panther Finance Co., Inc. | 3 | 3,017 | ||||||||||
8.50%, 05/15/2027(a) | 8 | 6,777 | ||||||||||
Truck Hero, Inc. | 5 | 4,148 | ||||||||||
|
| |||||||||||
| 187,592 | ||||||||||||
|
| |||||||||||
Consumer Cyclical - Entertainment – 0.4% |
| |||||||||||
Cedar Fair LP/Canada’s Wonderland Co./Magnum Management Corp./Millennium Op 5.50%, 05/01/2025(a) | 87 | 87,000 | ||||||||||
SeaWorld Parks & Entertainment, Inc. | 20 | 19,944 | ||||||||||
Six Flags Theme Parks, Inc. | 21 | 21,886 | ||||||||||
Vail Resorts, Inc. | 11 | 11,275 | ||||||||||
Viking Cruises Ltd. | 12 | 8,065 | ||||||||||
|
| |||||||||||
| 148,170 | ||||||||||||
|
| |||||||||||
Consumer Cyclical - Other – 0.2% | ||||||||||||
Adams Homes, Inc. | 13 | 11,961 | ||||||||||
Five Point Operating Co. LP/Five Point Capital Corp. | 10 | 9,667 | ||||||||||
Hilton Domestic Operating Co., Inc. | 7 | 6,994 | ||||||||||
Shea Homes LP/Shea Homes Funding Corp. | 11 | 9,496 | ||||||||||
Taylor Morrison Communities, Inc. | 15 | 13,793 | ||||||||||
|
| |||||||||||
| 51,911 | ||||||||||||
|
| |||||||||||
Consumer Cyclical - Restaurants – 0.2% | ||||||||||||
1011778 BC ULC/New Red Finance, Inc. | 25 | 26,344 | ||||||||||
Yum! Brands, Inc. | 41 | 44,765 | ||||||||||
|
| |||||||||||
| 71,109 | ||||||||||||
|
| |||||||||||
| 26 | AB SHORT DURATION INCOME PORTFOLIO | abfunds.com | |
PORTFOLIO OF INVESTMENTS (continued)
| Principal Amount (000) | U.S. $ Value | |||||||||||
|
| |||||||||||
Consumer Cyclical - Retailers – 0.1% | ||||||||||||
Burlington Coat Factory Warehouse Corp. | U.S.$ | 6 | $ | 6,103 | ||||||||
Rite Aid Corp. | 15 | 14,769 | ||||||||||
Staples, Inc. | 15 | 11,731 | ||||||||||
|
| |||||||||||
| 32,603 | ||||||||||||
|
| |||||||||||
Consumer Non-Cyclical – 0.6% | ||||||||||||
Albertsons Cos., Inc./Safeway, Inc./New Albertsons LP/Albertsons LLC | 21 | 20,787 | ||||||||||
6.625%, 06/15/2024 | 20 | 20,581 | ||||||||||
Avantor, Inc. | 10 | 10,857 | ||||||||||
CHS/Community Health Systems, Inc. | 8 | 7,518 | ||||||||||
6.625%, 02/15/2025(a) | 11 | 10,184 | ||||||||||
LifePoint Health, Inc. | 23 | 21,622 | ||||||||||
6.75%, 04/15/2025(a) | 25 | 25,749 | ||||||||||
Par Pharmaceutical, Inc. | 24 | 24,425 | ||||||||||
RegionalCare Hospital Partners Holdings, Inc./LifePoint Health, Inc. | 7 | 7,486 | ||||||||||
Tenet Healthcare Corp. | 9 | 8,892 | ||||||||||
7.50%, 04/01/2025(a) | 29 | 31,173 | ||||||||||
8.125%, 04/01/2022 | 7 | 7,057 | ||||||||||
|
| |||||||||||
| 196,331 | ||||||||||||
|
| |||||||||||
Energy – 0.5% | ||||||||||||
CITGO Petroleum Corp. | 28 | 26,660 | ||||||||||
EnLink Midstream Partners LP | 5 | 3,141 | ||||||||||
EQT Corp. | 31 | 29,124 | ||||||||||
Genesis Energy LP/Genesis Energy Finance Corp. | 15 | 12,792 | ||||||||||
Nabors Industries Ltd. | 15 | 5,649 | ||||||||||
Occidental Petroleum Corp. | 59 | 50,653 | ||||||||||
| abfunds.com | AB SHORT DURATION INCOME PORTFOLIO | 27 | |
PORTFOLIO OF INVESTMENTS (continued)
| Principal Amount (000) | U.S. $ Value | |||||||||||
|
| |||||||||||
Range Resources Corp. | U.S.$ | 3 | $ | 2,680 | ||||||||
Transocean, Inc. | 23 | 9,150 | ||||||||||
Western Midstream Operating LP | 5 | 4,443 | ||||||||||
4.05%, 02/01/2030 | 20 | 18,250 | ||||||||||
4.75%, 08/15/2028 | 24 | 21,120 | ||||||||||
|
| |||||||||||
| 183,662 | ||||||||||||
|
| |||||||||||
Other Industrial – 0.0% | ||||||||||||
IAA, Inc. | 5 | 4,996 | ||||||||||
|
| |||||||||||
Services – 0.3% | ||||||||||||
Allied Universal Holdco LLC/Allied Universal Finance Corp. | 24 | 24,822 | ||||||||||
APX Group, Inc. | 30 | 25,800 | ||||||||||
Aramark Services, Inc. | 42 | 43,677 | ||||||||||
Sabre GLBL, Inc. | 18 | 19,007 | ||||||||||
|
| |||||||||||
| 113,306 | ||||||||||||
|
| |||||||||||
Technology – 0.3% | ||||||||||||
CDW LLC/CDW Finance Corp. | 14 | 14,057 | ||||||||||
CommScope, Inc. | 20 | 20,000 | ||||||||||
Dell International LLC/EMC Corp. | 36 | 37,445 | ||||||||||
NCR Corp. | 18 | 19,085 | ||||||||||
Presidio Holdings, Inc. | 2 | 1,965 | ||||||||||
8.25%, 02/01/2028(a) | 2 | 1,967 | ||||||||||
Science Applications International Corp. | 4 | 3,927 | ||||||||||
|
| |||||||||||
| 98,446 | ||||||||||||
|
| |||||||||||
Transportation - Services – 0.0% | ||||||||||||
Avis Budget Car Rental LLC/Avis Budget Finance, Inc. | 2 | 1,162 | ||||||||||
XPO Logistics, Inc. | 10 | 10,312 | ||||||||||
|
| |||||||||||
| 11,474 | ||||||||||||
|
| |||||||||||
| 1,477,314 | ||||||||||||
|
| |||||||||||
| 28 | AB SHORT DURATION INCOME PORTFOLIO | abfunds.com | |
PORTFOLIO OF INVESTMENTS (continued)
| Principal Amount (000) | U.S. $ Value | |||||||||||
|
| |||||||||||
Financial Institutions – 0.3% | ||||||||||||
Banking – 0.2% | ||||||||||||
Alliance Data Systems Corp. | U.S.$ | 20 | $ | 14,861 | ||||||||
HSBC Finance Corp. | 61 | 61,693 | ||||||||||
|
| |||||||||||
| 76,554 | ||||||||||||
|
| |||||||||||
Insurance – 0.1% | ||||||||||||
Acrisure LLC/Acrisure Finance, Inc. | 7 | 7,207 | ||||||||||
Polaris Intermediate Corp. | 9 | 7,548 | ||||||||||
|
| |||||||||||
| 14,755 | ||||||||||||
|
| |||||||||||
Other Finance – 0.0% | ||||||||||||
Tempo Acquisition LLC/Tempo Acquisition Finance Corp. | 8 | 7,753 | ||||||||||
|
| |||||||||||
| 99,062 | ||||||||||||
|
| |||||||||||
Utility – 0.0% | ||||||||||||
Electric – 0.0% | ||||||||||||
Calpine Corp. | 8 | 7,800 | ||||||||||
Talen Energy Supply LLC | 5 | 4,948 | ||||||||||
|
| |||||||||||
| 12,748 | ||||||||||||
|
| |||||||||||
Total Corporates – Non-Investment Grade | 1,589,124 | |||||||||||
|
| |||||||||||
COLLATERALIZED LOAN OBLIGATIONS – 1.8% | ||||||||||||
CLO - Floating Rate – 1.8% | ||||||||||||
Ballyrock CLO Ltd. | 250 | 244,107 | ||||||||||
Mariner CLO LLC | 390 | 377,573 | ||||||||||
|
| |||||||||||
Total Collateralized Loan Obligations | 621,680 | |||||||||||
|
| |||||||||||
| abfunds.com | AB SHORT DURATION INCOME PORTFOLIO | 29 | |
PORTFOLIO OF INVESTMENTS (continued)
| Principal Amount (000) | U.S. $ Value | |||||||||||
|
| |||||||||||
GOVERNMENTS – SOVEREIGN AGENCIES – 1.6% | ||||||||||||
Canada – 1.6% | ||||||||||||
Canada Housing Trust No. 1 | CAD | 690 | $ | 563,783 | ||||||||
|
| |||||||||||
ASSET-BACKED SECURITIES – 1.4% | ||||||||||||
Other ABS - Fixed Rate – 0.9% | ||||||||||||
Consumer Loan Underlying Bond Certificate Issuer Trust I | U.S.$ | 13 | 11,306 | |||||||||
Series 2019-HP1, Class B | 100 | 84,815 | ||||||||||
Consumer Loan Underlying Bond CLUB Credit Trust | 100 | 84,126 | ||||||||||
Marlette Funding Trust | 100 | 85,593 | ||||||||||
SoFi Consumer Loan Program Trust | 100 | 58,376 | ||||||||||
|
| |||||||||||
| 324,216 | ||||||||||||
|
| |||||||||||
Autos - Fixed Rate – 0.5% | ||||||||||||
Exeter Automobile Receivables Trust | 115 | 110,251 | ||||||||||
Series 2019-1A, Class E | 40 | 32,609 | ||||||||||
Series 2019-2A, Class E | 15 | 12,539 | ||||||||||
Westlake Automobile Receivables Trust | 14 | 12,316 | ||||||||||
|
| |||||||||||
| 167,715 | ||||||||||||
|
| |||||||||||
Total Asset-Backed Securities | 491,931 | |||||||||||
|
| |||||||||||
BANK LOANS – 1.0% | ||||||||||||
Industrial – 0.8% | ||||||||||||
Basic – 0.0% | ||||||||||||
Arconic Corporation | 4 | 3,960 | ||||||||||
|
| |||||||||||
| 30 | AB SHORT DURATION INCOME PORTFOLIO | abfunds.com | |
PORTFOLIO OF INVESTMENTS (continued)
| Principal Amount (000) | U.S. $ Value | |||||||||||
|
| |||||||||||
Capital Goods – 0.1% | ||||||||||||
BWay Holding Company | U.S.$ | 28 | $ | 23,835 | ||||||||
Honeywell Technologies SARL | 23 | 19,451 | ||||||||||
|
| |||||||||||
| 43,286 | ||||||||||||
|
| |||||||||||
Communications - Media – 0.0% | ||||||||||||
Univision Communications Inc. | 10 | 8,618 | ||||||||||
|
| |||||||||||
Consumer Cyclical - Automotive – 0.1% | ||||||||||||
Navistar, Inc. | 23 | 20,609 | ||||||||||
|
| |||||||||||
Consumer Cyclical - Other – 0.1% | ||||||||||||
Playtika Holding Corp. | 23 | 22,429 | ||||||||||
|
| |||||||||||
Consumer Cyclical - Retailers – 0.1% | ||||||||||||
PetSmart, Inc. | 21 | 20,564 | ||||||||||
|
| |||||||||||
Consumer Non-Cyclical – 0.1% | ||||||||||||
Chobani, LLC (Chobani Idaho, LLC) | 8 | 7,552 | ||||||||||
Froneri International Limited | 8 | 7,351 | ||||||||||
U.S. Renal Care, Inc. | 28 | 26,267 | ||||||||||
|
| |||||||||||
| 41,170 | ||||||||||||
|
| |||||||||||
Energy – 0.0% | ||||||||||||
Chesapeake Energy Corporation | 15 | 5,300 | ||||||||||
|
| |||||||||||
| abfunds.com | AB SHORT DURATION INCOME PORTFOLIO | 31 | |
PORTFOLIO OF INVESTMENTS (continued)
| Principal Amount (000) | U.S. $ Value | |||||||||||
|
| |||||||||||
Other Industrial – 0.0% | ||||||||||||
Rockwood Service Corporation | U.S.$ | 3 | $ | 2,874 | ||||||||
|
| |||||||||||
Services – 0.1% | ||||||||||||
Amentum Government Services Holdings LLC | 3 | 2,858 | ||||||||||
Parexel International Corporation | 13 | 11,424 | ||||||||||
Team Health Holdings, Inc. | 20 | 14,505 | ||||||||||
|
| |||||||||||
| 28,787 | ||||||||||||
|
| |||||||||||
Technology – 0.2% | ||||||||||||
athenahealth, Inc. | 19 | 17,388 | ||||||||||
Avaya Inc. | 18 | 15,889 | ||||||||||
Boxer Parent Company Inc. | 28 | 23,959 | ||||||||||
Pitney Bowes Inc. | 11 | 9,405 | ||||||||||
Presidio Holdings Inc. | 10 | 8,934 | ||||||||||
Solera, LLC (Solera Finance, Inc.) | 23 | 21,647 | ||||||||||
|
| |||||||||||
| 97,222 | ||||||||||||
|
| |||||||||||
Transportation - Airlines – 0.0% | ||||||||||||
Delta Air Lines, Inc. | 10 | 9,946 | ||||||||||
|
| |||||||||||
| 304,765 | ||||||||||||
|
| |||||||||||
Utility – 0.1% | ||||||||||||
Electric – 0.1% | ||||||||||||
Granite Generation LLC | 24 | 22,336 | ||||||||||
| 32 | AB SHORT DURATION INCOME PORTFOLIO | abfunds.com | |
PORTFOLIO OF INVESTMENTS (continued)
| Principal Amount (000) | U.S. $ Value | |||||||||||
|
| |||||||||||
5.200% (LIBOR 3 Month + 3.75%), 11/09/2026(j) | U.S.$ | 4 | $ | 3,953 | ||||||||
|
| |||||||||||
| 26,289 | ||||||||||||
|
| |||||||||||
Financial Institutions – 0.1% | ||||||||||||
Finance – 0.1% | ||||||||||||
Ellie Mae, Inc. | 9 | 8,154 | ||||||||||
Jefferies Finance LLC | 8 | 7,062 | ||||||||||
|
| |||||||||||
| 15,216 | ||||||||||||
|
| |||||||||||
Insurance – 0.0% | ||||||||||||
Sedgwick Claims Management Services, Inc. (Lightning Cayman Merger Sub, Ltd.) | 11 | 10,151 | ||||||||||
|
| |||||||||||
| 25,367 | ||||||||||||
|
| |||||||||||
Total Bank Loans | 356,421 | |||||||||||
|
| |||||||||||
GOVERNMENTS – SOVEREIGN BONDS – 0.6% | ||||||||||||
United Arab Emirates – 0.6% | ||||||||||||
Abu Dhabi Government International Bond | 200 | 205,499 | ||||||||||
|
| |||||||||||
EMERGING MARKETS – TREASURIES – 0.3% | ||||||||||||
Brazil – 0.3% | ||||||||||||
Brazil Notas do Tesouro Nacional Serie F | BRL | 487 | 100,560 | |||||||||
|
| |||||||||||
EMERGING MARKETS – CORPORATE BONDS – 0.2% | ||||||||||||
Industrial – 0.2% | ||||||||||||
Energy – 0.2% | ||||||||||||
Petrobras Global Finance BV | U.S.$ | 65 | 72,280 | |||||||||
|
| |||||||||||
| abfunds.com | AB SHORT DURATION INCOME PORTFOLIO | 33 | |
PORTFOLIO OF INVESTMENTS (continued)
| Principal Amount (000) | U.S. $ Value | |||||||||||
|
| |||||||||||
QUASI-SOVEREIGNS – 0.2% | ||||||||||||
Quasi-Sovereign Bonds – 0.2% | ||||||||||||
Mexico – 0.2% | ||||||||||||
Petroleos Mexicanos | U.S.$ | 53 | $ | 38,388 | ||||||||
6.49%, 01/23/2027(a) | 22 | 17,785 | ||||||||||
|
| |||||||||||
Total Quasi-Sovereigns | 56,173 | |||||||||||
|
| |||||||||||
EMERGING MARKETS – SOVEREIGNS – 0.1% | ||||||||||||
Lebanon – 0.0% | ||||||||||||
Lebanon Government International Bond | 16 | 2,520 | ||||||||||
|
| |||||||||||
Nigeria – 0.1% | ||||||||||||
Nigeria Government International Bond | 40 | 34,913 | ||||||||||
|
| |||||||||||
Total Emerging Markets – Sovereigns | 37,433 | |||||||||||
|
| |||||||||||
| Shares | ||||||||||||
SHORT-TERM INVESTMENTS – 0.5% | ||||||||||||
Investment Companies – 0.5% | ||||||||||||
AB Fixed Income Shares, Inc. – Government Money Market Portfolio – Class AB, 0.35%(n)(o)(p) | 178,453 | 178,453 | ||||||||||
|
| |||||||||||
| Principal Amount (000) | ||||||||||||
Governments – Treasuries – 0.0% | ||||||||||||
Egypt – 0.0% | ||||||||||||
Egypt Treasury Bills | EGP | 200 | 12,329 | |||||||||
|
| |||||||||||
Total Short-Term Investments | 190,782 | |||||||||||
|
| |||||||||||
Total Investments – 131.7% | 45,272,704 | |||||||||||
Other assets less liabilities – (31.7)% | (10,901,622 | ) | ||||||||||
|
| |||||||||||
Net Assets – 100.0% | $ | 34,371,082 | ||||||||||
|
| |||||||||||
| 34 | AB SHORT DURATION INCOME PORTFOLIO | abfunds.com | |
PORTFOLIO OF INVESTMENTS (continued)
FUTURES (see Note D)
| Description | Number of Contracts | Expiration Month | Current Notional | Value and Unrealized Appreciation/ (Depreciation) | ||||||||||||
Purchased Contracts |
| |||||||||||||||
U.S. T-Note 5 Yr (CBT) Futures | 2 | June 2020 | $ | 250,968 | $ | 1,122 | ||||||||||
Sold Contracts | ||||||||||||||||
10 Yr Canadian Bond Futures | 5 | June 2020 | 536,621 | (28,169 | ) | |||||||||||
10 Yr Mini Japan Government Bond Futures | 3 | June 2020 | 427,014 | 5,472 | ||||||||||||
Euro-Bund Futures | 1 | June 2020 | 191,149 | 328 | ||||||||||||
Euro-Schatz Futures | 4 | June 2020 | 492,233 | 632 | ||||||||||||
Long Gilt Futures | 1 | June 2020 | 173,433 | (3,994 | ) | |||||||||||
U.S. 10 Yr Ultra Futures | 1 | June 2020 | 157,031 | (11,048 | ) | |||||||||||
U.S. T-Note 2 Yr (CBT) Futures | 4 | June 2020 | 881,719 | (16,567 | ) | |||||||||||
U.S. T-Note 10 Yr (CBT) Futures | 57 | June 2020 | 7,926,563 | (115,235 | ) | |||||||||||
|
| |||||||||||||||
| $ | (167,459 | ) | ||||||||||||||
|
| |||||||||||||||
FORWARD CURRENCY EXCHANGE CONTRACTS (see Note D)
| Counterparty | Contracts to Deliver (000) | In Exchange For (000) | Settlement Date | Unrealized Appreciation/ (Depreciation) | ||||||||||||||||
Citibank, NA | IDR | 2,514,494 | USD | 166 | 05/05/2020 | $ | (3,145 | ) | ||||||||||||
Citibank, NA | USD | 176 | IDR | 2,514,494 | 05/05/2020 | (6,674 | ) | |||||||||||||
Deutsche Bank AG | BRL | 597 | USD | 119 | 05/05/2020 | 9,593 | ||||||||||||||
Deutsche Bank AG | USD | 110 | BRL | 597 | 05/05/2020 | (221 | ) | |||||||||||||
Deutsche Bank AG | PEN | 1,109 | USD | 314 | 05/13/2020 | (14,463 | ) | |||||||||||||
HSBC Bank USA | IDR | 1,636,951 | USD | 108 | 05/05/2020 | (2,047 | ) | |||||||||||||
HSBC Bank USA | USD | 113 | IDR | 1,636,951 | 05/05/2020 | (3,041 | ) | |||||||||||||
JPMorgan Chase Bank, NA | IDR | 1,412,570 | USD | 93 | 05/05/2020 | (1,767 | ) | |||||||||||||
JPMorgan Chase Bank, NA | USD | 90 | IDR | 1,412,570 | 05/05/2020 | 4,645 | ||||||||||||||
JPMorgan Chase Bank, NA | CAD | 754 | USD | 526 | 05/22/2020 | (16,069 | ) | |||||||||||||
JPMorgan Chase Bank, NA | IDR | 1,412,570 | USD | 88 | 07/23/2020 | (3,421 | ) | |||||||||||||
Standard Chartered Bank | IDR | 5,564,014 | USD | 404 | 05/05/2020 | 29,489 | ||||||||||||||
Standard Chartered Bank | USD | 367 | IDR | 5,564,014 | 05/05/2020 | 6,959 | ||||||||||||||
State Street Bank & Trust Co. | JPY | 2,145 | USD | 20 | 06/05/2020 | (291 | ) | |||||||||||||
State Street Bank & Trust Co. | EUR | 166 | USD | 179 | 06/10/2020 | (2,267 | ) | |||||||||||||
State Street Bank & Trust Co. | MXN | 3,565 | USD | 145 | 06/19/2020 | (1,919 | ) | |||||||||||||
UBS AG | BRL | 597 | USD | 110 | 05/05/2020 | 221 | ||||||||||||||
UBS AG | USD | 106 | BRL | 597 | 05/05/2020 | 3,747 | ||||||||||||||
UBS AG | BRL | 597 | USD | 106 | 06/02/2020 | (3,715 | ) | |||||||||||||
|
| |||||||||||||||||||
| $ | (4,386 | ) | ||||||||||||||||||
|
| |||||||||||||||||||
| abfunds.com | AB SHORT DURATION INCOME PORTFOLIO | 35 | |
PORTFOLIO OF INVESTMENTS (continued)
CENTRALLY CLEARED CREDIT DEFAULT SWAPS (see Note D)
| Description | Fixed Rate (Pay)/ Receive | Payment Frequency | Implied Credit Spread at April 30, 2020 | Notional Amount (000) | Market Value | Upfront Premiums Paid/ (Received) | Unrealized Appreciation/ (Depreciation) | |||||||||||||||||||||||||
Buy Contracts |
| |||||||||||||||||||||||||||||||
CDX-NAHY Series 33, 5 Year Index, 12/20/2024* | 5.00 | % | Quarterly | 6.61 | % | USD | 172 | $ | 9,429 | $ | 10,290 | $ | (861 | ) | ||||||||||||||||||
CDX-NAHY Series 33, 5 Year Index, 12/20/2024* | 5.00 | Quarterly | 6.61 | USD | 143 | 7,532 | 8,367 | (835 | ) | |||||||||||||||||||||||
CDX-NAHY Series 34, 5 Year Index, 06/20/2025* | 5.00 | Quarterly | 6.31 | USD | 67 | 3,237 | 2,570 | 667 | ||||||||||||||||||||||||
Sale Contracts |
| |||||||||||||||||||||||||||||||
CDX-NAHY Series 33, 5 Year Index, 12/20/2024* | 5.00 | Quarterly | 6.61 | USD | 5,268 | (290,266 | ) | 57,291 | (347,557 | ) | ||||||||||||||||||||||
CDX-NAHY Series 34, 5 Year Index, 06/20/2025* | 5.00 | Quarterly | 6.31 | USD | 133 | (6,207 | ) | (6,983 | ) | 776 | ||||||||||||||||||||||
CDX-NAHY Series 34, 5 Year Index, 06/20/2025* | 5.00 | Quarterly | 6.31 | USD | 160 | (7,729 | ) | (8,644 | ) | 915 | ||||||||||||||||||||||
Ford Motor Company, 4.346%, 12/08/2026, 06/20/2024* | 5.00 | Quarterly | 8.99 | USD | 40 | (4,739 | ) | 4,653 | (9,392 | ) | ||||||||||||||||||||||
iTraxx -Xover Series 33, 5 Year Index, 06/20/2025* | 5.00 | Quarterly | 4.91 | EUR | 1,468 | 15,336 | (19,928 | ) | 35,264 | |||||||||||||||||||||||
|
|
|
|
|
| |||||||||||||||||||||||||||
| $ | (273,407 | ) | $ | 47,616 | $ | (321,023 | ) | |||||||||||||||||||||||||
|
|
|
|
|
| |||||||||||||||||||||||||||
| * | Termination date |
| 36 | AB SHORT DURATION INCOME PORTFOLIO | abfunds.com | |
PORTFOLIO OF INVESTMENTS (continued)
CENTRALLY CLEARED INTEREST RATE SWAPS (see Note D)
| Rate Type | ||||||||||||||||||||||||||
Notional (000) | Termination Date | Payments made by the Fund | Payments received by the Fund | Payment Frequency Paid/ Received | Market Value | Upfront Premiums Paid/ (Received) | Unrealized Appreciation/ (Depreciation) | |||||||||||||||||||
| USD | 670 | 05/24/2021 | 2.288% | 3 Month LIBOR | Semi-Annual/ Quarterly | $ | (17,919 | ) | $ | — | $ | (17,919 | ) | |||||||||||||
| CAD | 680 | 05/22/2024 | 3 Month CDOR | 1.985% | Semi-Annual/ Semi-Annual | 24,610 | — | 24,610 | ||||||||||||||||||
| USD | 260 | 05/24/2024 | 2.206% | 3 Month LIBOR | Semi-Annual/ Quarterly | (20,986 | ) | — | (20,986 | ) | ||||||||||||||||
|
|
|
|
|
| |||||||||||||||||||||
| $ | (14,295 | ) | $ | — | $ | (14,295 | ) | |||||||||||||||||||
|
|
|
|
|
| |||||||||||||||||||||
CREDIT DEFAULT SWAPS (see Note D)
| Swap Counterparty & Referenced Obligation | Fixed Rate (Pay)/ Receive | Payment Frequency | Implied Credit Spread at April 30, 2020 | Notional Amount (000) | Market Value | Upfront Premiums Paid/ (Received) | Unrealized Appreciation/ (Depreciation) | |||||||||||||||||||||||||
Sale Contracts |
| |||||||||||||||||||||||||||||||
Citigroup Global Markets, Inc. |
| |||||||||||||||||||||||||||||||
CDX-CMBX.NA.BBB- Series 6, 05/11/2063* | 3.00 | % | Monthly | 20.78 | % | USD | 10 | $ | (3,251 | ) | $ | (2,697 | ) | $ | (554 | ) | ||||||||||||||||
CDX-CMBX.NA.BBB- Series 6, 05/11/2063* | 3.00 | Monthly | 20.78 | USD | 18 | (5,853 | ) | (4,496 | ) | (1,357 | ) | |||||||||||||||||||||
CDX-CMBX.NA.BBB- Series 6, 05/11/2063* | 3.00 | Monthly | 20.78 | USD | 19 | (6,178 | ) | (4,698 | ) | (1,480 | ) | |||||||||||||||||||||
CDX-CMBX.NA.BBB- Series 6, 05/11/2063* | 3.00 | Monthly | 20.78 | USD | 26 | (8,455 | ) | (6,429 | ) | (2,026 | ) | |||||||||||||||||||||
CDX-CMBX.NA.BBB- Series 6, 05/11/2063* | 3.00 | Monthly | 13.94 | USD | 24 | (7,800 | ) | (2,073 | ) | (5,727 | ) | |||||||||||||||||||||
CDX-CMBX.NA.BBB- Series 6, 05/11/2063* | 3.00 | Monthly | 13.94 | USD | 36 | (11,700 | ) | (3,094 | ) | (8,606 | ) | |||||||||||||||||||||
CDX-CMBX.NA.BBB- Series 6, 05/11/2063* | 3.00 | Monthly | 13.94 | USD | 53 | �� | (17,225 | ) | (3,328 | ) | (13,897 | ) | ||||||||||||||||||||
CDX-CMBX.NA.BBB- Series 6, 05/11/2063* | 3.00 | Monthly | 13.94 | USD | 79 | (25,675 | ) | (4,925 | ) | (20,750 | ) | |||||||||||||||||||||
Credit Suisse International | ||||||||||||||||||||||||||||||||
CDX-CMBX.NA.A Series 6, 05/11/2063* | 2.00 | Monthly | 6.85 | USD | 360 | (50,820 | ) | (11,542 | ) | (39,278 | ) | |||||||||||||||||||||
CDX-CMBX.NA.BBB- Series 6, 05/11/2063* | 3.00 | Monthly | 13.94 | USD | 555 | (180,375 | ) | (77,359 | ) | (103,016 | ) | |||||||||||||||||||||
Goldman Sachs International | ||||||||||||||||||||||||||||||||
CDX-CMBX.NA.BBB- Series 6, 05/11/2063* | 3.00 | Monthly | 13.94 | USD | 24 | (7,800 | ) | (2,063 | ) | (5,737 | ) | |||||||||||||||||||||
CDX-CMBX.NA.BBB- Series 6, 05/11/2063* | 3.00 | Monthly | 13.94 | USD | 300 | (97,500 | ) | (65,837 | ) | (31,663 | ) | |||||||||||||||||||||
CDX-CMBX.NA.BBB- Series 6, 05/11/2063* | 3.00 | Monthly | 13.94 | USD | 400 | (130,000 | ) | (50,383 | ) | (79,617 | ) | |||||||||||||||||||||
JPMorgan Securities, LLC | ||||||||||||||||||||||||||||||||
CDX-CMBX.NA.BBB- Series 6, 05/11/2063* | 3.00 | Monthly | 13.94 | USD | 12 | (3,900 | ) | (1,031 | ) | (2,869 | ) | |||||||||||||||||||||
CDX-CMBX.NA.BB Series 6, 05/11/2063* | 5.00 | Monthly | 25.00 | USD | 196 | (100,954 | ) | (38,755 | ) | (62,199 | ) | |||||||||||||||||||||
| abfunds.com | AB SHORT DURATION INCOME PORTFOLIO | 37 | |
PORTFOLIO OF INVESTMENTS (continued)
| Swap Counterparty & Referenced Obligation | Fixed Rate (Pay)/ Receive | Payment Frequency | Implied Credit Spread at April 30, 2020 | Notional Amount (000) | Market Value | Upfront Premiums Paid/ (Received) | Unrealized Appreciation/ (Depreciation) | |||||||||||||||||||||||||
Morgan Stanley Capital Services LLC | ||||||||||||||||||||||||||||||||
CDX-CMBX.NA.BBB- Series 6, 05/11/2063* | 3.00 | % | Monthly | 13.94 | % | USD | 3 | $ | (975 | ) | $ | (185 | ) | $ | (790 | ) | ||||||||||||||||
|
|
|
|
|
| |||||||||||||||||||||||||||
| $ | (658,461 | ) | $ | (278,895 | ) | $ | (379,566 | ) | ||||||||||||||||||||||||
|
|
|
|
|
| |||||||||||||||||||||||||||
| * | Termination date |
TOTAL RETURN SWAPS (see Note D)
| Counterparty & Referenced Obligation | Rate Paid/ Received | Payment Frequency | Current Notional (000) | Maturity Date | Unrealized Appreciation/ (Depreciation) | |||||||||||||||||||
Receive Total Return on Reference Obligation | ||||||||||||||||||||||||
Goldman Sachs International Markit iBoxx USD Contingent Convertible Liquid Developed Markets AT1 Index TRI | | 3 Month LIBOR | | | Quarterly/ Maturity | | USD | 192 | 12/20/2020 | $ | 41,678 | |||||||||||||
REVERSE REPURCHASE AGREEMENTS (see Note D)
| Broker | Interest Rate | Maturity | U.S. $ Value at April 30, 2020 | |||||||||
HSBC Bank USA† | 0.13 | % | — | $ | 1,202,870 | |||||||
| † | The reverse repurchase agreement matures on demand. Interest rate resets daily and the rate shown is the rate in effect on April 30, 2020 |
The type of underlying collateral and the remaining maturity of open reverse repurchase agreements on the statements of assets and liabilities is as follows:
| Overnight and Continuous | Up to 30 Days | 31-90 Days | Greater than 90 Days | Total | ||||||||||||||||
Governments – Treasuries | $ | 1,202,870 | $ | – 0 – | $ | – 0 – | $ | – 0 – | $ | 1,202,870 | ||||||||||
| (a) | Security is exempt from registration under Rule 144A of the Securities Act of 1933. These securities are considered restricted, but liquid and may be resold in transactions exempt from registration, normally to qualified institutional buyers. At April 30, 2020, the aggregate market value of these securities amounted to $8,580,553 or 25.0% of net assets. |
| (b) | Position, or a portion thereof, has been segregated to collateralize reverse repurchase agreements. |
| (c) | Floating Rate Security. Stated interest/floor/ceiling rate was in effect at April 30, 2020. |
| (d) | Security is exempt from registration under Rule 144A of the Securities Act of 1933. These securities, which represent 0.41% of net assets as of April 30, 2020, are considered illiquid and restricted. Additional information regarding such securities follows: |
| 144A/Restricted & Illiquid Securities | Acquisition Date | Cost | Market Value | Percentage of Net Assets | ||||||||||||
BFLD | 10/02/2019 | $ | 9,973 | $ | 8,178 | 0.02 | % | |||||||||
| 38 | AB SHORT DURATION INCOME PORTFOLIO | abfunds.com | |
PORTFOLIO OF INVESTMENTS (continued)
| 144A/Restricted & Illiquid Securities | Acquisition Date | Cost | Market Value | Percentage of Net Assets | ||||||||||||
CLNY Trust | 11/27/2019 | $ | 54,484 | $ | 37,554 | 0.11 | % | |||||||||
Consumer Loan Underlying Bond Certificate Issuer Trust I | 10/09/2019 | 12,584 | 11,306 | 0.03 | % | |||||||||||
GS Mortgage Securities Trust | 09/25/2019 | 39,244 | 24,112 | 0.07 | % | |||||||||||
PMT Credit Risk Transfer Trust | 10/11/2019 | 81,155 | 61,792 | 0.18 | % | |||||||||||
| (e) | IO – Interest Only. |
| (f) | Inverse interest only security. |
| (g) | Securities are perpetual and, thus, do not have a predetermined maturity date. The date shown, if applicable, reflects the next call date. |
| (h) | Pay-In-Kind Payments (PIK). The issuer may pay cash interest and/or interest in additional debt securities. Rates shown are the rates in effect at April 30, 2020. |
| (i) | Security in which significant unobservable inputs (Level 3) were used in determining fair value. |
| (j) | The stated coupon rate represents the greater of the LIBOR or the LIBOR floor rate plus a spread at April 30, 2020. |
| (k) | This position or a portion of this position represents an unsettled loan purchase. The coupon rate will be determined at the time of settlement and will be based upon the London-Interbank Offered Rate ("LIBOR") plus a premium which was determined at the time of purchase. |
| (l) | Non-income producing security. |
| (m) | Defaulted. |
| (n) | Affiliated investments. |
| (o) | To obtain a copy of the fund’s shareholder report, please go to the Securities and Exchange Commission’s website at www.sec.gov, or call AB at (800) 227-4618. |
| (p) | The rate shown represents the 7-day yield as of period end. |
Currency Abbreviations:
BRL – Brazilian Real
CAD – Canadian Dollar
EGP – Egyptian Pound
EUR – Euro
IDR – Indonesian Rupiah
JPY – Japanese Yen
MXN – Mexican Peso
PEN – Peruvian Sol
USD – United States Dollar
Glossary:
ABS – Asset-Backed Securities
CBT – Chicago Board of Trade
CDOR – Canadian Dealer Offered Rate
CDX-CMBX.NA – North American Commercial Mortgage-Backed Index
CDX-NAHY – North American High Yield Credit Default Swap Index
CLO – Collateralized Loan Obligations
CMBS – Commercial Mortgage-Backed Securities
LIBOR – London Interbank Offered Rates
REIT – Real Estate Investment Trust
REMICs – Real Estate Mortgage Investment Conduits
TBA – To Be Announced
TIPS – Treasury Inflation Protected Security
See notes to financial statements.
| abfunds.com | AB SHORT DURATION INCOME PORTFOLIO | 39 | |
STATEMENT OF ASSETS & LIABILITIES
April 30, 2020 (unaudited)
| Assets |
| |||
Investments in securities, at value | ||||
Unaffiliated issuers (cost $45,323,803) | $ | 45,094,251 | ||
Affiliated issuers (cost $178,453) | 178,453 | |||
Cash | 3,041 | |||
Cash collateral due from broker | 902,162 | |||
Foreign currencies, at value (cost $65,683) | 65,490 | |||
Unaffiliated interest and dividends receivable | 253,277 | |||
Unrealized appreciation on forward currency exchange contracts | 54,654 | |||
Unrealized appreciation on total return swaps | 41,678 | |||
Receivable due from Adviser | 15,753 | |||
Receivable for newly entered credit default swaps | 13,917 | |||
Receivable for investment securities sold | 7,263 | |||
Affiliated dividends receivable | 75 | |||
|
| |||
Total assets | 46,630,014 | |||
|
| |||
| Liabilities |
| |||
Payable for investment securities purchased | 10,177,290 | |||
Payable for reverse repurchase agreements | 1,202,870 | |||
Market value on credit default swaps (net premiums received $278,895) | 658,461 | |||
Dividends payable | 87,014 | |||
Unrealized depreciation on forward currency exchange contracts | 59,040 | |||
Payable for variation margin on centrally cleared swaps | 17,974 | |||
Payable for newly entered credit default swaps | 16,822 | |||
Payable for capital stock redeemed | 15,186 | |||
Payable for variation margin on futures | 8,649 | |||
Directors’ fees payable | 4,855 | |||
Transfer Agent fee payable | 907 | |||
Distribution fee payable | 371 | |||
Accrued expenses and other liabilities | 9,493 | |||
|
| |||
Total liabilities | 12,258,932 | |||
|
| |||
Net Assets | $ | 34,371,082 | ||
|
| |||
| Composition of Net Assets |
| |||
Capital stock, at par | $ | 3,589 | ||
Additional paid-in capital | 36,001,651 | |||
Accumulated loss | (1,634,158 | ) | ||
|
| |||
| $ | 34,371,082 | |||
|
| |||
Net Asset Value Per Share—33 billion shares of capital stock authorized, $.001 par value
| Class | Net Assets | Shares Outstanding | Net Asset Value | |||||||||
| ||||||||||||
| A | $ | 156,243 | 16,550 | $ | 9.44 | * | ||||||
| ||||||||||||
| C | $ | 423,396 | 44,182 | $ | 9.58 | |||||||
| ||||||||||||
| Advisor | $ | 33,791,443 | 3,528,215 | $ | 9.58 | |||||||
| ||||||||||||
| * | The maximum offering price per share for Class A shares was $9.86 which reflects a sales charge of 4.25%. |
See notes to financial statements.
| 40 | AB SHORT DURATION INCOME PORTFOLIO | abfunds.com | |
STATEMENT OF OPERATIONS
Six Months Ended April 30, 2020 (unaudited)
| Investment Income | ||||||||
Interest (net of foreign taxes withheld of $1,845) | $ | 166,875 | ||||||
Dividends—Affiliated issuers | 1,758 | $ | 168,633 | |||||
|
| |||||||
| Expenses | ||||||||
Advisory fee (see Note B) | 41,083 | |||||||
Distribution fee—Class A | 50 | |||||||
Distribution fee—Class C | 543 | |||||||
Transfer agency—Class A | 16 | |||||||
Transfer agency—Class C | 34 | |||||||
Transfer agency—Advisor Class | 8,683 | |||||||
Custodian | 49,927 | |||||||
Administrative | 36,348 | |||||||
Audit and tax | 26,749 | |||||||
Registration fees | 19,523 | |||||||
Legal | 18,709 | |||||||
Directors’ fees | 11,276 | |||||||
Printing | 7,459 | |||||||
Amortization of offering expenses | 7,032 | |||||||
Miscellaneous | 3,710 | |||||||
|
| |||||||
Total expenses before interest expense | 231,142 | |||||||
Interest expense | 12,092 | |||||||
|
| |||||||
Total expenses | 243,234 | |||||||
Less: expenses waived and reimbursed by the Adviser (see Note B) | (177,880 | ) | ||||||
|
| |||||||
Net expenses | 65,354 | |||||||
|
| |||||||
Net investment income | 103,279 | |||||||
|
| |||||||
| Realized and Unrealized Gain (Loss) on Investment and Foreign Currency Transactions | ||||||||
Net realized gain (loss) on: | ||||||||
Investment transactions(a) | 369,432 | |||||||
Forward currency exchange contracts | 34,331 | |||||||
Futures | (343,188 | ) | ||||||
Swaps | (278,174 | ) | ||||||
Foreign currency transactions | 44,483 | |||||||
Net change in unrealized appreciation/depreciation of: | ||||||||
Investments(b) | (503,548 | ) | ||||||
Securities sold short | (377 | ) | ||||||
Forward currency exchange contracts | 5,876 | |||||||
Futures | (180,324 | ) | ||||||
Swaps | (741,434 | ) | ||||||
Foreign currency denominated assets and liabilities | (1,266 | ) | ||||||
|
| |||||||
Net loss on investment and foreign currency transactions | (1,594,189 | ) | ||||||
|
| |||||||
Net Decrease in Net Assets from Operations | $ | (1,490,910 | ) | |||||
|
|
| (a) | Net of foreign capital gains taxes of $3,276. |
| (b) | Net of decrease in accrued foreign capital gains taxes of $1,099. |
See notes to financial statements.
| abfunds.com | AB SHORT DURATION INCOME PORTFOLIO | 41 | |
STATEMENT OF CHANGES IN NET ASSETS
| Six Months Ended April 30, 2020 (unaudited) | December 12, 2018(a) to October 31, 2019 | |||||||
| Increase (Decrease) in Net Assets from Operations | ||||||||
Net investment income | $ | 103,279 | $ | 448,633 | ||||
Net realized gain (loss) on investment and foreign currency transactions | (173,116 | ) | 271,185 | |||||
Net change in unrealized appreciation/depreciation of investments and foreign currency denominated assets and liabilities | (1,421,073 | ) | 345,304 | |||||
|
|
|
| |||||
Net increase (decrease) in net assets from operations | (1,490,910 | ) | 1,065,122 | |||||
Distributions to Shareholders |
| |||||||
Class A | (1,090 | ) | (349 | ) | ||||
Class C | (1,816 | ) | (277 | ) | ||||
Advisor Class | (667,492 | ) | (546,416 | ) | ||||
| Capital Stock Transactions |
| |||||||
Net increase | 21,014,310 | 15,000,000 | ||||||
|
|
|
| |||||
Total increase | 18,853,002 | 15,518,080 | ||||||
| Net Assets |
| |||||||
Beginning of period | 15,518,080 | – 0 | – | |||||
|
|
|
| |||||
End of period | $ | 34,371,082 | $ | 15,518,080 | ||||
|
|
|
| |||||
| (a) | Commencement of operations. |
See notes to financial statements.
| 42 | AB SHORT DURATION INCOME PORTFOLIO | abfunds.com | |
NOTES TO FINANCIAL STATEMENTS
April 30, 2020 (unaudited)
NOTE A
Significant Accounting Policies
AB Bond Fund, Inc. (the “Company”) is registered under the Investment Company Act of 1940 as an open-end management investment company. The Company, which is a Maryland corporation, operates as a series company comprised of ten portfolios currently in operation. Each portfolio is considered to be a separate entity for financial reporting and tax purposes. This report relates only to the AB Short Duration Income Portfolio (the “Fund”), a non-diversified portfolio. The Fund commenced operations on December 12, 2018. The Fund has authorized the issuance of Class A, Class B, Class C, Advisor Class, Class R, Class K, Class I, Class Z, Class T, Class 1 and Class 2 shares. Class B, Class R, Class K, Class I, Class Z, Class T, Class 1 and Class 2 shares have not been issued. Class A shares are sold with a front-end sales charge of up to 4.25% for purchases not exceeding $1,000,000. With respect to purchases of $1,000,000 or more, Class A shares redeemed within one year of purchase may be subject to a contingent deferred sales charge of 1%. Class C shares are subject to a contingent deferred sales charge of 1% on redemptions made within the first year after purchase, and 0% after the first year of purchase. Class C shares will automatically convert to Class A shares ten years after the end of the calendar month of purchase. Advisor Class shares are sold without any initial or contingent deferred sales charge and are not subject to ongoing distribution expenses. All eleven classes of shares have identical voting, dividend, liquidation and other rights, except that the classes bear different distribution and transfer agency expenses. Each class has exclusive voting rights with respect to its distribution plan. The financial statements have been prepared in conformity with U.S. generally accepted accounting principles (“U.S. GAAP”) which require management to make certain estimates and assumptions that affect the reported amounts of assets and liabilities in the financial statements and amounts of income and expenses during the reporting period. Actual results could differ from those estimates. The Fund is an investment company under U.S. GAAP and follows the accounting and reporting guidance applicable to investment companies. The following is a summary of significant accounting policies followed by the Fund.
1. Security Valuation
Portfolio securities are valued at their current market value determined on the basis of market quotations or, if market quotations are not readily available or are deemed unreliable, at “fair value” as determined in accordance with procedures established by and under the general supervision of the Company’s Board of Directors (the “Board”).
In general, the market values of securities which are readily available and deemed reliable are determined as follows: securities listed on a national
| abfunds.com | AB SHORT DURATION INCOME PORTFOLIO | 43 | |
NOTES TO FINANCIAL STATEMENTS (continued)
securities exchange (other than securities listed on the NASDAQ Stock Market, Inc. (“NASDAQ”)) or on a foreign securities exchange are valued at the last sale price at the close of the exchange or foreign securities exchange. If there has been no sale on such day, the securities are valued at the last traded price from the previous day. Securities listed on more than one exchange are valued by reference to the principal exchange on which the securities are traded; securities listed only on NASDAQ are valued in accordance with the NASDAQ Official Closing Price; listed or over the counter (“OTC”) market put or call options are valued at the mid level between the current bid and ask prices. If either a current bid or current ask price is unavailable, AllianceBernstein L.P. (the “Adviser”) will have discretion to determine the best valuation (e.g., last trade price in the case of listed options); open futures are valued using the closing settlement price or, in the absence of such a price, the most recent quoted bid price. If there are no quotations available for the day of valuation, the last available closing settlement price is used; U.S. Government securities and any other debt instruments having 60 days or less remaining until maturity are generally valued at market by an independent pricing vendor, if a market price is available. If a market price is not available, the securities are valued at amortized cost. This methodology is commonly used for short term securities that have an original maturity of 60 days or less, as well as short term securities that had an original term to maturity that exceeded 60 days. In instances when amortized cost is utilized, the Valuation Committee (the “Committee”) must reasonably conclude that the utilization of amortized cost is approximately the same as the fair value of the security. Such factors the Committee will consider include, but are not limited to, an impairment of the creditworthiness of the issuer or material changes in interest rates. Fixed-income securities, including mortgage-backed and asset-backed securities, may be valued on the basis of prices provided by a pricing service or at a price obtained from one or more of the major broker-dealers. In cases where broker-dealer quotes are obtained, the Adviser may establish procedures whereby changes in market yields or spreads are used to adjust, on a daily basis, a recently obtained quoted price on a security. Swaps and other derivatives are valued daily, primarily using independent pricing services, independent pricing models using market inputs, as well as third party broker-dealers or counterparties. Open end mutual funds are valued at the closing net asset value per share, while exchange traded funds are valued at the closing market price per share.
Securities for which market quotations are not readily available (including restricted securities) or are deemed unreliable are valued at fair value as deemed appropriate by the Adviser. Factors considered in making this determination may include, but are not limited to, information obtained by contacting the issuer, analysts, analysis of the issuer’s financial statements or other available documents. In addition, the Fund may use fair value pric-
| 44 | AB SHORT DURATION INCOME PORTFOLIO | abfunds.com | |
NOTES TO FINANCIAL STATEMENTS (continued)
ing for securities primarily traded in non-U.S. markets because most foreign markets close well before the Fund values its securities at 4:00 p.m., Eastern Time. The earlier close of these foreign markets gives rise to the possibility that significant events, including broad market moves, may have occurred in the interim and may materially affect the value of those securities. To account for this, the Fund generally values many of its foreign equity securities using fair value prices based on third party vendor modeling tools to the extent available.
2. Fair Value Measurements
In accordance with U.S. GAAP regarding fair value measurements, fair value is defined as the price that the Fund would receive to sell an asset or pay to transfer a liability in an orderly transaction between market participants at the measurement date. U.S. GAAP establishes a framework for measuring fair value, and a three-level hierarchy for fair value measurements based upon the transparency of inputs to the valuation of an asset or liability (including those valued based on their market values as described in Note A.1 above). Inputs may be observable or unobservable and refer broadly to the assumptions that market participants would use in pricing the asset or liability. Observable inputs reflect the assumptions market participants would use in pricing the asset or liability based on market data obtained from sources independent of the Fund. Unobservable inputs reflect the Fund’s own assumptions about the assumptions that market participants would use in pricing the asset or liability based on the best information available in the circumstances. Each investment is assigned a level based upon the observability of the inputs which are significant to the overall valuation. The three-tier hierarchy of inputs is summarized below.
| • | Level 1—quoted prices in active markets for identical investments |
| • | Level 2—other significant observable inputs (including quoted prices for similar investments, interest rates, prepayment speeds, credit risk, etc.) |
| • | Level 3—significant unobservable inputs (including the Fund’s own assumptions in determining the fair value of investments) |
The fair value of debt instruments, such as bonds, and over-the-counter derivatives is generally based on market price quotations, recently executed market transactions (where observable) or industry recognized modeling techniques and are generally classified as Level 2. Pricing vendor inputs to Level 2 valuations may include quoted prices for similar investments in active markets, interest rate curves, coupon rates, currency rates, yield curves, option adjusted spreads, default rates, credit spreads and other unique security features in order to estimate the relevant cash flows which are then discounted to calculate fair values. If these inputs are unobservable and significant to the fair value, these investments will be classified as Level 3.
| abfunds.com | AB SHORT DURATION INCOME PORTFOLIO | 45 | |
NOTES TO FINANCIAL STATEMENTS (continued)
Where readily available market prices or relevant bid prices are not available for certain equity investments, such investments may be valued based on similar publicly traded investments, movements in relevant indices since last available prices or based upon underlying company fundamentals and comparable company data (such as multiples to earnings or other multiples to equity). Where an investment is valued using an observable input, such as another publicly traded security, the investment will be classified as Level 2. If management determines that an adjustment is appropriate based on restrictions on resale, illiquidity or uncertainty, and such adjustment is a significant component of the valuation, the investment will be classified as Level 3. An investment will also be classified as Level 3 where management uses company fundamentals and other significant inputs to determine the valuation.
Options are valued using market-based inputs to models, broker or dealer quotations, or alternative pricing sources with reasonable levels of price transparency, where such inputs and models are available. Alternatively, the values may be obtained through unobservable management determined inputs and/or management’s proprietary models. Where models are used, the selection of a particular model to value an option depends upon the contractual terms of, and specific risks inherent in, the option as well as the availability of pricing information in the market. Valuation models require a variety of inputs, including contractual terms, market prices, measures of volatility and correlations of such inputs. Exchange traded options generally will be classified as Level 2. For options that do not trade on exchange but trade in liquid markets, inputs can generally be verified and model selection does not involve significant management judgment. Options are classified within Level 2 on the fair value hierarchy when all of the significant inputs can be corroborated to market evidence. Otherwise such instruments are classified as Level 3.
Valuations of mortgage-backed or other asset-backed securities, by pricing vendors, are based on both proprietary and industry recognized models and discounted cash flow techniques. Significant inputs to the valuation of these instruments are value of the collateral, the rates and timing of delinquencies, the rates and timing of prepayments, and default and loss expectations, which are driven in part by housing prices for residential mortgages. Significant inputs are determined based on relative value analyses, which incorporate comparisons to instruments with similar collateral and risk profiles, including relevant indices. Mortgage and asset-backed securities for which management has collected current observable data through pricing services are generally categorized within Level 2. Those investments for which current observable data has not been provided are classified as Level 3.
| 46 | AB SHORT DURATION INCOME PORTFOLIO | abfunds.com | |
NOTES TO FINANCIAL STATEMENTS (continued)
Bank loan prices are provided by third party pricing services and consist of a composite of the quotes received by the vendor into a consensus price. Certain bank loans are classified as Level 3, as a significant input used in the fair value measurement of these instruments is the market quotes that are received by the vendor and these inputs are not observable.
Other fixed income investments, including non-U.S. government and corporate debt, are generally valued using quoted market prices, if available, which are typically impacted by current interest rates, maturity dates and any perceived credit risk of the issuer. Additionally, in the absence of quoted market prices, these inputs are used by pricing vendors to derive a valuation based upon industry or proprietary models which incorporate issuer specific data with relevant yield/spread comparisons with more widely quoted bonds with similar key characteristics. Those investments for which there are observable inputs are classified as Level 2. Where the inputs are not observable, the investments are classified as Level 3.
The following table summarizes the valuation of the Fund’s investments by the above fair value hierarchy levels as of April 30, 2020:
Investments in | Level 1 | Level 2 | Level 3 | Total | ||||||||||||
Assets: |
| |||||||||||||||
Governments – Treasuries | $ | – 0 | – | $ | 15,424,501 | $ | – 0 | – | $ | 15,424,501 | ||||||
Mortgage Pass-Throughs | – 0 | – | 9,901,510 | – 0 | – | 9,901,510 | ||||||||||
Collateralized Mortgage Obligations | – 0 | – | 5,282,944 | – 0 | – | 5,282,944 | ||||||||||
Corporates – Investment Grade | – 0 | – | 3,971,663 | – 0 | – | 3,971,663 | ||||||||||
Inflation-Linked Securities | – 0 | – | 3,659,618 | – 0 | – | 3,659,618 | ||||||||||
Commercial Mortgage-Backed Securities | – 0 | – | 2,746,802 | – 0 | – | 2,746,802 | ||||||||||
Corporates – Non-Investment Grade | – 0 | – | 1,589,124 | – 0 | – | 1,589,124 | ||||||||||
Collateralized Loan Obligations | – 0 | – | 621,680 | – 0 | – | 621,680 | ||||||||||
Governments – Sovereign Agencies | – 0 | – | 563,783 | – 0 | – | 563,783 | ||||||||||
Asset-Backed Securities | – 0 | – | 491,931 | – 0 | – | 491,931 | ||||||||||
Bank Loans | – 0 | – | 305,397 | 51,024 | 356,421 | |||||||||||
Governments – Sovereign Bonds | – 0 | – | 205,499 | – 0 | – | 205,499 | ||||||||||
Emerging Markets – Treasuries | – 0 | – | 100,560 | – 0 | – | 100,560 | ||||||||||
Emerging Markets – Corporate Bonds | – 0 | – | 72,280 | – 0 | – | 72,280 | ||||||||||
Quasi-Sovereigns | – 0 | – | 56,173 | – 0 | – | 56,173 | ||||||||||
Emerging Markets – Sovereigns | – 0 | – | 37,433 | – 0 | – | 37,433 | ||||||||||
Short-Term Investments: | ||||||||||||||||
Investment Companies | 178,453 | – 0 | – | – 0 | – | 178,453 | ||||||||||
Governments – Treasuries | – 0 | – | 12,329 | – 0 | – | 12,329 | ||||||||||
|
|
|
|
|
|
|
| |||||||||
Total Investments in Securities | 178,453 | 45,043,227 | 51,024 | 45,272,704 | ||||||||||||
| abfunds.com | AB SHORT DURATION INCOME PORTFOLIO | 47 | |
NOTES TO FINANCIAL STATEMENTS (continued)
Investments in | Level 1 | Level 2 | Level 3 | Total | ||||||||||||
Other Financial Instruments(a): | ||||||||||||||||
Assets: |
| |||||||||||||||
Futures | $ | 7,554 | $ | – 0 | – | $ | – 0 | – | $ | 7,554 | (b) | |||||
Forward Currency Exchange Contracts | – 0 | – | 54,654 | – 0 | – | 54,654 | ||||||||||
Centrally Cleared Credit Default Swaps | – 0 | – | 35,534 | – 0 | – | 35,534 | (b) | |||||||||
Centrally Cleared Interest Rate Swaps | – 0 | – | 24,610 | – 0 | – | 24,610 | (b) | |||||||||
Total Return Swaps | – 0 | – | 41,678 | – 0 | – | 41,678 | ||||||||||
Liabilities: |
| |||||||||||||||
Futures | (175,013 | ) | – 0 | – | – 0 | – | (175,013 | )(b) | ||||||||
Forward Currency Exchange Contracts | – 0 | – | (59,040 | ) | – 0 | – | (59,040 | ) | ||||||||
Centrally Cleared Credit Default Swaps | – 0 | – | (308,941 | ) | – 0 | – | (308,941 | )(b) | ||||||||
Centrally Cleared Interest Rate Swaps | – 0 | – | (38,905 | ) | – 0 | – | (38,905 | )(b) | ||||||||
Credit Default Swaps | – 0 | – | (658,461 | ) | – 0 | – | (658,461 | ) | ||||||||
Reverse Repurchase Agreements | (1,202,870 | ) | – 0 | – | – 0 | – | (1,202,870 | ) | ||||||||
|
|
|
|
|
|
|
| |||||||||
Total | $ | (1,191,876 | ) | $ | 44,134,356 | $ | 51,024 | $ | 42,993,504 | |||||||
|
|
|
|
|
|
|
| |||||||||
| (a) | Other financial instruments are derivative instruments, such as futures, forwards and swaps, which are valued at the unrealized appreciation/(depreciation) on the instrument. Other financial instruments may also include swaps with upfront premiums, options written and swaptions written which are valued at market value. |
| (b) | Only variation margin receivable/(payable) at period end is reported within the statement of assets and liabilities. This amount reflects cumulative unrealized appreciation/(depreciation) on futures and centrally cleared swaps as reported in the portfolio of investments. Where applicable, centrally cleared swaps with upfront premiums are presented here at market value. |
3. Currency Translation
Assets and liabilities denominated in foreign currencies and commitments under forward currency exchange contracts are translated into U.S. dollars at the mean of the quoted bid and ask prices of such currencies against the U.S. dollar. Purchases and sales of portfolio securities are translated into U.S. dollars at the rates of exchange prevailing when such securities were acquired or sold. Income and expenses are translated into U.S. dollars at rates of exchange prevailing when accrued.
Net realized gain or loss on foreign currency transactions represents foreign exchange gains and losses from sales and maturities of foreign fixed income investments, holding of foreign currencies, currency gains or losses realized between the trade and settlement dates on foreign investment transactions, and the difference between the amounts of dividends, interest and foreign withholding taxes recorded on the Fund’s books and the U.S. dollar equivalent amounts actually received or paid. Net unrealized currency gains and losses from valuing foreign currency denominated assets and liabilities at period end exchange rates are reflected as a
| 48 | AB SHORT DURATION INCOME PORTFOLIO | abfunds.com | |
NOTES TO FINANCIAL STATEMENTS (continued)
component of net unrealized appreciation or depreciation of foreign currency denominated assets and liabilities.
4. Taxes
It is the Fund’s policy to meet the requirements of the Internal Revenue Code applicable to regulated investment companies and to distribute all of its investment company taxable income and net realized gains, if any, to shareholders. Therefore, no provisions for federal income or excise taxes are required. The Fund may be subject to taxes imposed by countries in which it invests. Such taxes are generally based on income and/or capital gains earned or repatriated. Taxes are accrued and applied to net investment income, net realized gains and net unrealized appreciation/depreciation as such income and/or gains are earned.
In accordance with U.S. GAAP requirements regarding accounting for uncertainties in income taxes, management has analyzed the Fund’s tax positions taken or expected to be taken on federal and state income tax returns for the current tax year and has concluded that no provision for income tax is required in the Fund’s financial statements.
5. Investment Income and Investment Transactions
Dividend income is recorded on the ex-dividend date or as soon as the Fund is informed of the dividend. Interest income is accrued daily. Investment transactions are accounted for on the date the securities are purchased or sold. Investment gains or losses are determined on the identified cost basis. The Fund amortizes premiums and accretes discounts as adjustments to interest income.
6. Class Allocations
All income earned and expenses incurred by the Fund are borne on a pro-rata basis by each outstanding class of shares, based on the proportionate interest in the Fund represented by the net assets of such class, except for class specific expenses which are allocated to the respective class. Expenses of the Company are charged proportionately to each fund or based on other appropriate methods. Realized and unrealized gains and losses are allocated among the various share classes based on respective net assets.
7. Dividends and Distributions
Dividends and distributions to shareholders, if any, are recorded on the ex-dividend date. Income dividends and capital gains distributions are determined in accordance with federal tax regulations and may differ from those determined in accordance with U.S. GAAP. To the extent these differences are permanent, such amounts are reclassified within the capital accounts based on their federal tax basis treatment; temporary differences do not require such reclassification.
| abfunds.com | AB SHORT DURATION INCOME PORTFOLIO | 49 | |
NOTES TO FINANCIAL STATEMENTS (continued)
8. Repurchase Agreements
It is the Fund’s policy that its custodian or designated subcustodian take control of securities as collateral under repurchase agreements and to determine on a daily basis that the value of such securities are sufficient to cover the value of the repurchase agreements. If the seller defaults and the value of the collateral declines or if bankruptcy proceedings are commenced with respect to the seller of the security, realization of collateral by the Fund may be delayed or limited.
9. Offering Expenses
Offering expenses of $61,122 were deferred and amortized on a straight line basis over a one year period starting from December 12, 2018 (commencement of operations).
NOTE B
Advisory Fee and Other Transactions with Affiliates
Under the terms of the investment advisory agreement, the Fund pays the Adviser an advisory fee at an annual rate of .35% of the first $2.5 billion of the Fund’s average daily net assets and .30% of the excess over $2.5 billion of the Fund’s average daily net assets. The fee is accrued daily and paid monthly. The Adviser has agreed to waive its fees and bear certain expenses to the extent necessary to limit total operating expenses (excluding acquired fund fees and expenses other than the advisory fees of any AB mutual funds in which the Fund may invest, interest expense, taxes, extraordinary expenses, and brokerage commissions and other transaction costs), on an annual basis (the “Expense Caps”) to .65%, 1.45% and .45% of daily average net assets for Class A, Class C, and Advisor Class shares, respectively. For the six months ended April 30, 2020, such reimbursement/waivers amounted to $141,378. The Expense Caps may not be terminated by the Adviser before January 31, 2021. Any fees waived and expenses borne by the Adviser through January 20, 2021 may be reimbursed by Fund until the end of the third fiscal year after the fiscal period in which the fee was waived or the expense was borne; such waivers that are subject to repayment amounted to $265,740 and $141,378 for the year ended October 31, 2019 and the period ended April 30, 2020, respectively. In any case, no reimbursement payment will be made that would cause the Fund’s total annual operating expenses to exceed the Expense Caps’ net fee percentage set forth above.
Pursuant to the investment advisory agreement, the Fund may reimburse the Adviser for certain legal and accounting services provided to the Fund by the Adviser. For the six months ended April 30, 2020, the Adviser voluntarily agreed to waive such fees in the amount of $36,348.
The Fund compensates AllianceBernstein Investor Services, Inc. (“ABIS”), a wholly-owned subsidiary of the Adviser, under a Transfer Agency
| 50 | AB SHORT DURATION INCOME PORTFOLIO | abfunds.com | |
NOTES TO FINANCIAL STATEMENTS (continued)
Agreement for providing personnel and facilities to perform transfer agency services for the Fund. ABIS may make payments to intermediaries that provide omnibus account services, sub-accounting services and/or networking services. Such compensation retained by ABIS amounted to $8,569 for the six months ended April 30, 2020.
AllianceBernstein Investments, Inc. (the “Distributor”), a wholly-owned subsidiary of the Adviser, serves as the distributor of the Fund’s shares. The Distributor has advised the Fund that it has retained front-end sales charges of $0 from the sale of Class A shares and received $0 and $0 in contingent deferred sales charges imposed upon redemptions by shareholders of Class A and Class C shares, respectively, for the six months ended April 30, 2020.
The Fund may invest in AB Government Money Market Portfolio (the “Government Money Market Portfolio”) which has a contractual annual advisory fee rate of .20% of the portfolio’s average daily net assets and bears its own expenses. The Adviser has contractually agreed to waive .10% of the advisory fee of Government Money Market Portfolio (resulting in a net advisory fee of .10%) until August 31, 2020. In connection with the investment by the Fund in Government Money Market Portfolio, the Adviser has contractually agreed to waive its advisory fee from the Fund in an amount equal to the Fund’s pro rata share of the effective advisory fee of Government Money Market Portfolio, as borne indirectly by the Fund as an acquired fund fee and expense. For the six months ended April 30, 2020, such waiver amounted to $154.
A summary of the Fund’s transactions in AB mutual funds for the six months ended April 30, 2020 is as follows:
Fund | Market Value 10/31/19 (000) | Purchases at Cost (000) | Sales Proceeds (000) | Market Value 4/30/20 (000) | Dividend Income (000) | |||||||||||||||
Government Money Market Portfolio | $ | 57 | $ | 22,372 | $ | 22,251 | $ | 178 | $ | 2 | ||||||||||
During the second quarter of 2018, AXA S.A. (“AXA”), a French holding company for the AXA Group, completed the sale of a minority stake in its subsidiary, AXA Equitable Holdings, Inc. (now named Equitable Holdings, Inc.)(“Equitable”), through an initial public offering. Equitable is the holding company for a diverse group of financial services companies, including an approximately 64.9% economic interest in the Adviser and a 100% interest in AllianceBernstein Corporation, the general partner of the Adviser. Since the initial sale, AXA has completed additional offerings, most recently dur-
| abfunds.com | AB SHORT DURATION INCOME PORTFOLIO | 51 | |
NOTES TO FINANCIAL STATEMENTS (continued)
ing the fourth quarter of 2019. As a result, AXA currently owns less than 10% of the outstanding shares of common stock of Equitable, and no longer owns a controlling interest in Equitable. AXA previously announced its intention to sell its entire interest in Equitable over time, subject to market conditions and other factors (the “Plan”). Most of AXA’s remaining Equitable shares are to be delivered on redemption of AXA bonds mandatorily exchangeable into Equitable shares and maturing in May 2021. AXA retains sole discretion to determine the timing of any future sales of its remaining shares of Equitable common stock.
Sales under the Plan that were completed on November 13, 2019 resulted in the indirect transfer of a “controlling block” of voting securities of the Adviser (a “Change of Control Event”) and may have been deemed to have been an “assignment” causing a termination of the Fund’s investment advisory and administration agreements. In order to ensure that investment advisory and administration services could continue uninterrupted in the event of a Change of Control Event, the Board previously approved new investment advisory and administration agreements with the Adviser, and shareholders of the Fund subsequently approved the new investment advisory agreement. These agreements became effective on November 13, 2019.
NOTE C
Distribution Services Agreement
The Fund has adopted a Distribution Services Agreement (the “Agreement”) pursuant to Rule 12b-1 under the Investment Company Act of 1940. Under the Agreement, the Fund pays distribution and servicing fees to the Distributor at an annual rate of up to ..25% of the Fund’s average daily net assets attributable to Class A shares and 1% of the Fund’s average daily net assets attributable to Class C shares. There are no distribution and servicing fees on the Advisor Class shares. Payments under the Agreement in respect of Class A shares are currently limited to an annual rate of .20% of Class A shares’ average daily net assets. The fees are accrued daily and paid monthly. The Agreement provides that the Distributor will use such payments in their entirety for distribution assistance and promotional activities. Since the commencement of the Fund’s operations, the Distributor has incurred expenses in excess of the distribution costs reimbursed by the Fund in the amount of $0 for Class C shares. While such costs may be recovered from the Fund in future periods so long as the Agreement is in effect, the rate of the distribution and servicing fees payable under the Agreement may not be increased without a shareholder vote. In accordance with the Agreement, there is no provision for recovery of unreimbursed distribution costs incurred by the Distributor beyond the current fiscal year for Class A shares. The Agreement also provides that the Adviser may use its own resources to finance the distribution of the Fund’s shares.
| 52 | AB SHORT DURATION INCOME PORTFOLIO | abfunds.com | |
NOTES TO FINANCIAL STATEMENTS (continued)
NOTE D
Investment Transactions
Purchases and sales of investment securities (excluding short-term investments) for the six months ended April 30, 2020 were as follows:
| Purchases | Sales | Securities Sold Short | Covers on Securities Sold Short | |||||||||||||
Investment securities (excluding U.S. government securities) | $ | 10,316,821 | $ | 2,592,302 | $ | – 0 | – | $ | – 0 | – | ||||||
U.S. government securities | 71,099,703 | 52,423,024 | – 0 | – | 781,924 | |||||||||||
The cost of investments for federal income tax purposes was substantially the same as the cost for financial reporting purposes. Accordingly, gross unrealized appreciation and unrealized depreciation are as follows:
Gross unrealized appreciation | $ | 1,514,139 | ||
Gross unrealized depreciation | (2,588,742 | ) | ||
|
| |||
Net unrealized depreciation | $ | (1,074,603 | ) | |
|
|
1. Derivative Financial Instruments
The Fund may use derivatives in an effort to earn income and enhance returns, to replace more traditional direct investments, to obtain exposure to otherwise inaccessible markets (collectively, “investment purposes”), or to hedge or adjust the risk profile of its portfolio.
The principal types of derivatives utilized by the Fund, as well as the methods in which they may be used are:
| • | Futures |
The Fund may buy or sell futures for investment purposes or for the purpose of hedging its portfolio against adverse effects of potential movements in the market. The Fund bears the market risk that arises from changes in the value of these instruments and the imperfect correlation between movements in the price of the futures and movements in the price of the assets, reference rates or indices which they are designed to track. Among other things, the Fund may purchase or sell futures for foreign currencies or options thereon for non-hedging purposes as a means of making direct investment in foreign currencies, as described below under “Currency Transactions”.
At the time the Fund enters into futures, the Fund deposits and maintains as collateral an initial margin with the broker, as required by the exchange on which the transaction is effected. Such amount is shown as cash collateral due from broker on the statement of assets and liabilities. Pursuant to the contract, the Fund agrees to receive from or pay to the broker an amount of cash equal to the daily
| abfunds.com | AB SHORT DURATION INCOME PORTFOLIO | 53 | |
NOTES TO FINANCIAL STATEMENTS (continued)
fluctuation in the value of the contract. Such receipts or payments are known as variation margin and are recorded by the Fund as unrealized gains or losses. Risks may arise from the potential inability of a counterparty to meet the terms of the contract. The credit/counterparty risk for exchange-traded futures is generally less than privately negotiated futures, since the clearinghouse, which is the issuer or counterparty to each exchange-traded future, has robust risk mitigation standards, including the requirement to provide initial and variation margin. When the contract is closed, the Fund records a realized gain or loss equal to the difference between the value of the contract at the time it was opened and the time it was closed.
Use of long futures subjects the Fund to risk of loss in excess of the amounts shown on the statement of assets and liabilities, up to the notional value of the futures. Use of short futures subjects the Fund to unlimited risk of loss. Under some circumstances, futures exchanges may establish daily limits on the amount that the price of futures can vary from the previous day’s settlement price, which could effectively prevent liquidation of unfavorable positions.
During the six months ended April 30, 2020, the Fund held futures for hedging and non-hedging purposes.
| • | Forward Currency Exchange Contracts |
The Fund may enter into forward currency exchange contracts in order to hedge its exposure to changes in foreign currency exchange rates on its foreign portfolio holdings, to hedge certain firm purchase and sale commitments denominated in foreign currencies and for non-hedging purposes as a means of making direct investments in foreign currencies, as described below under “Currency Transactions”.
A forward currency exchange contract is a commitment to purchase or sell a foreign currency at a future date at a negotiated forward rate. The gain or loss arising from the difference between the original contract and the closing of such contract would be included in net realized gain or loss on forward currency exchange contracts. Fluctuations in the value of open forward currency exchange contracts are recorded for financial reporting purposes as unrealized appreciation and/or depreciation by the Fund. Risks may arise from the potential inability of a counterparty to meet the terms of a contract and from unanticipated movements in the value of a foreign currency relative to the U.S. dollar.
During the six months ended April 30, 2020, the Fund held forward currency exchange contracts for hedging and non-hedging purposes.
| 54 | AB SHORT DURATION INCOME PORTFOLIO | abfunds.com | |
NOTES TO FINANCIAL STATEMENTS (continued)
| • | Option Transactions |
For hedging and investment purposes, the Fund may purchase and write (sell) put and call options on U.S. and foreign securities, including government securities, and foreign currencies that are traded on U.S. and foreign securities exchanges and over-the-counter markets. Among other things, the Fund may use options transactions for non-hedging purposes as a means of making direct investments in foreign currencies, as described below under “Currency Transactions” and may use options strategies involving the purchase and/or writing of various combinations of call and/or put options, for hedging and investment purposes.
The risk associated with purchasing an option is that the Fund pays a premium whether or not the option is exercised. Additionally, the Fund bears the risk of loss of the premium and change in market value should the counterparty not perform under the contract. If a put or call option purchased by the Fund were permitted to expire without being sold or exercised, its premium would represent a loss to the Fund. Put and call options purchased are accounted for in the same manner as portfolio securities. The cost of securities acquired through the exercise of call options is increased by premiums paid. The proceeds from securities sold through the exercise of put options are decreased by the premiums paid.
When the Fund writes an option, the premium received by the Fund is recorded as a liability and is subsequently adjusted to the current market value of the option written. The Fund’s maximum payment for written put options equates to the number of shares multiplied by the strike price. In certain circumstances maximum payout amounts may be partially offset by recovery values of the respective referenced assets and upfront premium received upon entering into the contract. Premiums received from written options which expire unexercised are recorded by the Fund on the expiration date as realized gains from options written. The difference between the premium received and the amount paid on effecting a closing purchase transaction, including brokerage commissions, is also treated as a realized gain, or if the premium received is less than the amount paid for the closing purchase transaction, as a realized loss. If a call option is exercised, the premium received is added to the proceeds from the sale of the underlying security or currency in determining whether the Fund has realized a gain or loss. If a put option is exercised, the premium received reduces the cost basis of the security or currency purchased by the Fund. In writing an option, the Fund bears the market risk of an unfavorable change in the price of the security or currency underlying the written option. Exercise of an option written by the Fund could result in the Fund selling or buying a security or currency at a price different from the current market value.
| abfunds.com | AB SHORT DURATION INCOME PORTFOLIO | 55 | |
NOTES TO FINANCIAL STATEMENTS (continued)
The Fund may also invest in options on swap agreements, also called “swaptions”. A swaption is an option that gives the buyer the right, but not the obligation, to enter into a swap on a future date in exchange for paying a market-based “premium”. A receiver swaption gives the owner the right to receive the total return of a specified asset, reference rate, or index. A payer swaption gives the owner the right to pay the total return on a specified asset, reference rate, or index. Swaptions also include options that allow an existing swap to be terminated or extended by one of the counterparties. The Fund’s maximum payment for written put swaptions equates to the notional amount of the underlying swap. In certain circumstances maximum payout amounts may be partially offset by recovery values of the respective referenced assets and upfront premium received upon entering into the contract.
During the six months ended April 30, 2020, the Fund held purchased swaptions for hedging and non-hedging purposes.
| • | Swaps |
The Fund may enter into swaps to hedge its exposure to interest rates, credit risk, equity markets or currencies. The Fund may also enter into swaps for non-hedging purposes as a means of gaining market exposures, making direct investments in foreign currencies, as described below under “Currency Transactions.” A swap is an agreement that obligates two parties to exchange a series of cash flows at specified intervals based upon or calculated by reference to changes in specified prices or rates for a specified amount of an underlying asset. The payment flows are usually netted against each other, with the difference being paid by one party to the other. In addition, collateral may be pledged or received by the Fund in accordance with the terms of the respective swaps to provide value and recourse to the Fund or its counterparties in the event of default, bankruptcy or insolvency by one of the parties to the swap.
Risks may arise as a result of the failure of the counterparty to the swap to comply with the terms of the swap. The loss incurred by the failure of a counterparty is generally limited to the net interim payment to be received by the Fund, and/or the termination value at the end of the contract. Therefore, the Fund considers the creditworthiness of each counterparty to a swap in evaluating potential counterparty risk. This risk is mitigated by having a netting arrangement between the Fund and the counterparty and by the posting of collateral by the counterparty to the Fund to cover the Fund’s exposure to the counterparty. Additionally, risks may arise from unanticipated movements in interest rates or in the value of the underlying securities. The Fund accrues for the interim payments on swaps on a daily basis,
| 56 | AB SHORT DURATION INCOME PORTFOLIO | abfunds.com | |
NOTES TO FINANCIAL STATEMENTS (continued)
with the net amount recorded within unrealized appreciation/depreciation of swaps on the statement of assets and liabilities, where applicable. Once the interim payments are settled in cash, the net amount is recorded as realized gain/(loss) on swaps on the statement of operations, in addition to any realized gain/(loss) recorded upon the termination of swaps. Upfront premiums paid or received for OTC swaps are recognized as cost or proceeds on the statement of assets and liabilities and are amortized on a straight line basis over the life of the contract. Amortized upfront premiums are included in net realized gain/(loss) from swaps on the statement of operations. Fluctuations in the value of swaps are recorded as a component of net change in unrealized appreciation/depreciation of swaps on the statement of operations.
Certain standardized swaps, including certain interest rate swaps and credit default swaps, are (or soon will be) subject to mandatory central clearing. Cleared swaps are transacted through futures commission merchants (“FCMs”) that are members of central clearinghouses, with the clearinghouse serving as central counterparty, similar to transactions in futures contracts. Centralized clearing will be required for additional categories of swaps on a phased-in basis based on requirements published by the Securities and Exchange Commission and Commodity Futures Trading Commission.
At the time the Fund enters into a centrally cleared swap, the Fund deposits and maintains as collateral an initial margin with the broker, as required by the clearinghouse on which the transaction is effected. Such amount is shown as cash collateral due from broker on the statement of assets and liabilities. Pursuant to the contract, the Fund agrees to receive from or pay to the broker an amount of cash equal to the daily fluctuation in the value of the contract. Such receipts or payments are known as variation margin and are recorded by the Fund as unrealized gains or losses. Risks may arise from the potential inability of a counterparty to meet the terms of the contract. The credit/counterparty risk for centrally cleared swaps is generally less than non-centrally cleared swaps, since the clearinghouse, which is the issuer or counterparty to each centrally cleared swap, has robust risk mitigation standards, including the requirement to provide initial and variation margin. When the contract is closed, the Fund records a realized gain or loss equal to the difference between the value of the contract at the time it was opened and the time it was closed.
Interest Rate Swaps:
The Fund is subject to interest rate risk exposure in the normal course of pursuing its investment objectives. Because the Fund holds fixed rate bonds, the value of these bonds may decrease if interest rates
| abfunds.com | AB SHORT DURATION INCOME PORTFOLIO | 57 | |
NOTES TO FINANCIAL STATEMENTS (continued)
rise. To help hedge against this risk and to maintain its ability to generate income at prevailing market rates, the Fund may enter into interest rate swaps. Interest rate swaps are agreements between two parties to exchange cash flows based on a notional amount. The Fund may elect to pay a fixed rate and receive a floating rate, or, receive a fixed rate and pay a floating rate on a notional amount.
In addition, the Fund may also enter into interest rate swap transactions to preserve a return or spread on a particular investment or portion of its portfolio, or protecting against an increase in the price of securities the Fund anticipates purchasing at a later date. Interest rate swaps involve the exchange by a Fund with another party of their respective commitments to pay or receive interest (e.g., an exchange of floating rate payments for fixed rate payments) computed based on a contractually-based principal (or “notional”) amount. Interest rate swaps are entered into on a net basis (i.e., the two payment streams are netted out, with the Fund receiving or paying, as the case may be, only the net amount of the two payments).
During the six months ended April 30, 2020, the Fund held interest rate swaps for hedging and non-hedging purposes.
Credit Default Swaps:
The Fund may enter into credit default swaps, including to manage its exposure to the market or certain sectors of the market, to reduce its risk exposure to defaults by corporate and sovereign issuers held by the Fund, or to create exposure to corporate or sovereign issuers to which it is not otherwise exposed. The Fund may purchase credit protection (“Buy Contract”) or provide credit protection (“Sale Contract”) on the referenced obligation of the credit default swap. During the term of the swap, the Fund receives/(pays) fixed payments from/(to) the respective counterparty, calculated at the agreed upon rate applied to the notional amount. If the Fund is a buyer/(seller) of protection and a credit event occurs, as defined under the terms of the swap, the Fund will either (i) receive from the seller/(pay to the buyer) of protection an amount equal to the notional amount of the swap (the “Maximum Payout Amount”) and deliver/(take delivery of) the referenced obligation or (ii) receive/(pay) a net settlement amount in the form of cash or securities equal to the notional amount of the swap less the recovery value of the referenced obligation. In certain circumstances Maximum Payout Amounts may be partially offset by recovery values of the respective referenced obligations, upfront premium received upon entering into the agreement, or net amounts received from settlement of buy protection credit default swaps entered into by the Fund for the same referenced obligations with the same counterparty.
| 58 | AB SHORT DURATION INCOME PORTFOLIO | abfunds.com | |
NOTES TO FINANCIAL STATEMENTS (continued)
Credit default swaps may involve greater risks than if a Fund had invested in the referenced obligation directly. Credit default swaps are subject to general market risk, liquidity risk, counterparty risk and credit risk. If the Fund is a buyer of protection and no credit event occurs, it will lose the payments it made to its counterparty. If the Fund is a seller of protection and a credit event occurs, the value of the referenced obligation received by the Fund coupled with the periodic payments previously received, may be less than the Maximum Payout Amount it pays to the buyer, resulting in a net loss to the Fund.
Implied credit spreads over U.S. Treasuries of comparable maturity utilized in determining the market value of credit default swaps on issuers as of period end are disclosed in the portfolio of investments. The implied spreads serve as an indicator of the current status of the payment/performance risk and typically reflect the likelihood of default by the issuer of the referenced obligation. The implied credit spread of a particular reference obligation also reflects the cost of buying/selling protection and may reflect upfront payments required to be made to enter into the agreement. Widening credit spreads typically represent a deterioration of the referenced obligation’s credit soundness and greater likelihood of default or other credit event occurring as defined under the terms of the agreement. A credit spread identified as “Defaulted” indicates a credit event has occurred for the referenced obligation.
During the six months ended April 30, 2020, the Fund held credit default swaps for hedging and non-hedging purposes.
Total Return Swaps:
The Fund may enter into total return swaps in order to take a “long” or “short” position with respect to an underlying referenced asset. The Fund is subject to market price volatility of the underlying referenced asset. A total return swap involves commitments to pay interest in exchange for a market linked return based on a notional amount. To the extent that the total return of the security, group of securities or index underlying the transaction exceeds or falls short of the offsetting interest obligation, the Fund will receive a payment from or make a payment to the counterparty.
During the six months ended April 30, 2020, the Fund held total return swaps for hedging and non-hedging purposes.
The Fund typically enters into International Swaps and Derivatives Association, Inc. Master Agreements (“ISDA Master Agreement”) with its OTC derivative contract counterparties in order to, among other things, reduce its credit risk to OTC counterparties. ISDA Master Agreements include provisions for general obligations, representations, collateral and events of default or termination. Under an ISDA Master Agreement, the Fund typi-
| abfunds.com | AB SHORT DURATION INCOME PORTFOLIO | 59 | |
NOTES TO FINANCIAL STATEMENTS (continued)
cally may offset with the OTC counterparty certain derivative financial instruments’ payables and/or receivables with collateral held and/or posted and create one single net payment (close-out netting) in the event of default or termination. In the event of a default by an OTC counterparty, the return of collateral with market value in excess of the Fund’s net liability, held by the defaulting party, may be delayed or denied.
The Fund’s ISDA Master Agreements may contain provisions for early termination of OTC derivative transactions in the event the net assets of the Fund decline below specific levels (“net asset contingent features”). If these levels are triggered, the Fund’s OTC counterparty has the right to terminate such transaction and require the Fund to pay or receive a settlement amount in connection with the terminated transaction. If OTC derivatives were held at period end, please refer to netting arrangements by the OTC counterparty table below for additional details.
During the six months ended April 30, 2020, the Fund had entered into the following derivatives:
Asset Derivatives | Liability Derivatives | |||||||||||
Derivative Type | Statement of | Fair Value | Statement of | Fair Value | ||||||||
Interest rate contracts | Receivable/Payable for variation margin on futures | $ | 7,554 | * | Receivable/Payable for variation margin on futures | $ | 175,013 | * | ||||
Credit contracts | Receivable/Payable for variation margin on centrally cleared swaps | 37,622 | * | Receivable/Payable for variation margin on centrally cleared swaps | 358,645 | * | ||||||
Interest rate contracts | Receivable/Payable for variation margin on centrally cleared swaps | 24,610 | * | Receivable/Payable for variation margin on centrally cleared swaps | 38,905 | * | ||||||
Foreign currency contracts | Unrealized appreciation on forward currency exchange contracts | | 54,654 | Unrealized depreciation on forward currency exchange contracts | | 59,040 | ||||||
Credit contracts | Market value on credit default swaps | 658,461 | ||||||||||
Credit contracts | Unrealized appreciation on total return swaps | 41,678 | ||||||||||
|
|
|
| |||||||||
Total | $ | 166,118 | $ | 1,290,064 | ||||||||
|
|
|
| |||||||||
| * | Only variation margin receivable/payable at period end is reported within the statement of assets and liabilities. This amount reflects cumulative unrealized appreciation/(depreciation) on futures and centrally cleared swaps as reported in the portfolio of investments. |
| 60 | AB SHORT DURATION INCOME PORTFOLIO | abfunds.com | |
NOTES TO FINANCIAL STATEMENTS (continued)
Derivative Type | Location of Gain or (Loss) on Derivatives Within Statement of Operations | Realized Gain or (Loss) on Derivatives | Change in Unrealized Appreciation or (Depreciation) | |||||||
Interest rate contracts | Net realized gain (loss) on futures; Net change in unrealized appreciation/depreciation of futures | $ | (343,188 | ) | $ | (180,324 | ) | |||
Foreign currency contracts | Net realized gain (loss) on forward currency exchange contracts; Net change in unrealized appreciation/depreciation of forward currency exchange contracts |
| 34,331 |
|
| 5,876 |
| |||
Interest rate contracts | Net realized gain (loss) on investment transactions; Net change in unrealized appreciation/depreciation of investments | (3,773 | ) | 0 | ||||||
Interest rate contracts | Net realized gain (loss) on swaps; Net change in unrealized appreciation/depreciation of swaps | (570 | ) | 1,612 | ||||||
Credit contracts | Net realized gain (loss) on swaps; Net change in unrealized appreciation/depreciation of swaps | (277,604 | ) | (743,046 | ) | |||||
|
|
|
| |||||||
Total | $ | (590,804 | ) | $ | (915,882 | ) | ||||
|
|
|
| |||||||
The following table represents the average monthly volume of the Fund’s derivative transactions during the six months ended April 30, 2020:
Futures: | ||||
Average notional amount of buy contracts | $ | 600,499 | (a) | |
Average notional amount of sale contracts | $ | 8,012,437 | ||
Forward Currency Exchange Contracts: | ||||
Average principal amount of buy contracts | $ | 687,272 | ||
Average principal amount of sale contracts | $ | 2,973,925 | ||
Purchased Swaptions: | ||||
Average notional amount | $ | 760,000 | (a) | |
Centrally Cleared Interest Rate Swaps: | ||||
Average notional amount | $ | 1,436,291 | ||
Credit Default Swaps: | ||||
Average notional amount of sale contracts | $ | 1,406,714 | ||
Centrally Cleared Credit Default Swaps: | ||||
Average notional amount of buy contracts | $ | 340,327 | (b) | |
Average notional amount of sale contracts | $ | 3,947,810 | ||
Total Return Swaps: | ||||
Average notional amount | $ | 150,000 | (c) |
| (a) | Positions were open for three months during the period. |
| (b) | Positions were open for two months during the period. |
| (c) | Positions were open for five months during the period. |
| abfunds.com | AB SHORT DURATION INCOME PORTFOLIO | 61 | |
NOTES TO FINANCIAL STATEMENTS (continued)
For financial reporting purposes, the Fund does not offset derivative assets and derivative liabilities that are subject to netting arrangements in the statement of assets and liabilities.
All OTC derivatives held at period end were subject to netting arrangements. The following table presents the Fund’s derivative assets and liabilities by OTC counterparty net of amounts available for offset under ISDA Master Agreements (“MA”) and net of the related collateral received/pledged by the Fund as of April 30, 2020. Exchange-traded derivatives and centrally cleared swaps are not subject to netting arrangements and as such are excluded from the table.
Counterparty | Derivative Assets Subject to a MA | Derivatives Available for Offset | Cash Collateral Received* | Security Collateral Received* | Net Amount of Derivative Assets | |||||||||||||||
Deutsche Bank AG | $ | 9,593 | $ | (9,593 | ) | $ | – 0 | – | $ | –0 | – | $ | – 0 | – | ||||||
Goldman Sachs International | 41,678 | (41,678 | ) | –0 | – | – 0 | – | – 0 | – | |||||||||||
JPMorgan Chase Bank, NA/JPMorgan Securities LLC | 4,645 | (4,645 | ) | –0 | – | – 0 | – | – 0 | – | |||||||||||
Standard Chartered Bank | 36,448 | – 0 | – | –0 | – | – 0 | – | 36,448 | ||||||||||||
UBS AG | 3,968 | (3,715 | ) | – 0 | – | – 0 | – | 253 | ||||||||||||
|
|
|
|
|
|
|
|
|
| |||||||||||
Total | $ | 96,332 | $ | (59,631 | ) | $ | – 0 | – | $ | – 0 | – | $ | 36,701 | ^ | ||||||
|
|
|
|
|
|
|
|
|
| |||||||||||
Counterparty | Derivative Liabilities Subject to a MA | Derivatives Available for Offset | Cash Collateral Pledged* | Security Collateral Pledged* | Net Amount of Derivative Liabilities | |||||||||||||||
Citibank, NA | $ | 9,819 | $ | – 0 | – | $ | – 0 | – | $ | – 0 | – | $ | 9,819 | |||||||
Citigroup Global Markets, Inc. | 86,137 | – 0 | – | – 0 | – | – 0 | – | 86,137 | ||||||||||||
Credit Suisse International | 231,195 | – 0 | – | – 0 | – | – 0 | – | 231,195 | ||||||||||||
Deutsche Bank AG | 14,684 | (9,593 | ) | – 0 | – | – 0 | – | 5,091 | ||||||||||||
Goldman Sachs International | 235,300 | (41,678 | ) | – 0 | – | – 0 | – | 193,622 | ||||||||||||
HSBC Bank USA | 5,088 | – 0 | – | – 0 | – | – 0 | – | 5,088 | ||||||||||||
JPMorgan Chase Bank, NA/JPMorgan Securities LLC | 126,111 | (4,645 | ) | – 0 | – | – 0 | – | 121,466 | ||||||||||||
Morgan Stanley Capital Services LLC | 975 | – 0 | – | – 0 | – | – 0 | – | 975 | ||||||||||||
State Street Bank & Trust Co. | 4,477 | – 0 | – | – 0 | – | – 0 | – | 4,477 | ||||||||||||
UBS AG | 3,715 | (3,715 | ) | – 0 | – | – 0 | – | – 0 | – | |||||||||||
|
|
|
|
|
|
|
|
|
| |||||||||||
Total | $ | 717,501 | $ | (59,631 | ) | $ | – 0 | – | $ | – 0 | – | $ | 657,870 | ^ | ||||||
|
|
|
|
|
|
|
|
|
| |||||||||||
| * | The actual collateral received/pledged may be more than the amount reported due to over-collateralization. |
| ^ | Net amount represents the net receivable/payable that would be due from/to the counterparty in the event of default or termination. The net amount from OTC financial derivative instruments can only be netted across transactions governed under the same master agreement with the same counterparty. |
| 62 | AB SHORT DURATION INCOME PORTFOLIO | abfunds.com | |
NOTES TO FINANCIAL STATEMENTS (continued)
2. Currency Transactions
The Fund may invest in non-U.S. Dollar-denominated securities on a currency hedged or unhedged basis. The Fund may seek investment opportunities by taking long or short positions in currencies through the use of currency-related derivatives, including forward currency exchange contracts, futures and options on futures, swaps, and other options. The Fund may enter into transactions for investment opportunities when it anticipates that a foreign currency will appreciate or depreciate in value but securities denominated in that currency are not held by the Fund and do not present attractive investment opportunities. Such transactions may also be used when the Adviser believes that it may be more efficient than a direct investment in a foreign currency-denominated security. The Fund may also conduct currency exchange contracts on a spot basis (i.e., for cash at the spot rate prevailing in the currency exchange market for buying or selling currencies).
3. Short Sales
The Fund may sell securities short. A short sale is a transaction in which the Fund sells securities it does not own, but has borrowed, in anticipation of a decline in the market price of the securities. The Fund is obligated to replace the borrowed securities at their market price at the time of settlement. The Fund’s obligation to replace the securities borrowed in connection with a short sale will be fully secured by collateral deposited with the broker. The Fund is liable to the buyer for any dividends/interest payable on securities while those securities are in a short position. These dividends/interest are recorded as an expense of the Fund. Short sales by the Fund involve certain risks and special considerations. Possible losses from short sales differ from losses that could be incurred from a purchase of a security because losses from short sales may be unlimited, whereas losses from purchases cannot exceed the total amount invested.
4. TBA and Dollar Rolls
The Fund may invest in TBA mortgage-backed securities. A TBA, or “To Be Announced”, trade represents a contract for the purchase or sale of mortgage-backed securities to be delivered at a future agree-upon date; however, the specific mortgage pool numbers or the number of pools that will be delivered to fulfill the trade obligation or terms of the contract are unknown at the time of the trade. Mortgage pools (including fixed-rate or variable-rate mortgages) guaranteed by the Government National Mortgage Association, or GNMA, the Federal National Mortgage Association, or FNMA, or the Federal Home Loan Mortgage Corporation, or FHLMC, are subsequently allocated to the TBA transactions.
The Fund may enter into certain TBA transactions known as dollar rolls. Dollar rolls involve sales by the Fund of securities for delivery in the current
| abfunds.com | AB SHORT DURATION INCOME PORTFOLIO | 63 | |
NOTES TO FINANCIAL STATEMENTS (continued)
month and the Fund’s simultaneously contracting to repurchase substantially similar (same type and coupon) securities on a specified future date. During the roll period, the Fund forgoes principal and interest paid on the securities. The Fund is compensated by the difference between the current sales price and the lower forward price for the future purchase (often referred to as the “drop”) as well as by the interest earned on the cash proceeds of the initial sale. Dollar rolls involve the risk that the market value of the securities the Fund is obligated to repurchase under the agreement may decline below the repurchase price. Dollar rolls are speculative techniques. For the six months ended April 30, 2020, the Fund earned drop income of $3,260 which is included in interest income in the accompanying statement of operations.
5. Reverse Repurchase Agreements
The Fund may enter into reverse repurchase transactions (“RVP”) in accordance with the terms of a Master Repurchase Agreement (“MRA”), under which the Fund sells securities and agrees to repurchase them at a mutually agreed upon date and price. At the time the Fund enters into a reverse repurchase agreement, it will establish a segregated account with the custodian containing liquid assets having a value comparable to the repurchase price. Under the MRA and other Master Agreements, the Fund is permitted to offset payables and/or receivables with collateral held and/or posted to the counterparty and create one single net payment due to or from the Fund in the event of a default. In the event of a default by a MRA counterparty, the Fund may be considered an unsecured creditor with respect to any excess collateral (collateral with a market value in excess of the repurchase price) held by and/or posted to the counterparty, and as such the return of such excess collateral may be delayed or denied. For the six months ended April 30, 2020, the average amount of reverse repurchase agreements outstanding was $1,568,105 and the daily weighted average interest rate was 1.61%. At April 30, 2020, the Fund had reverse repurchase agreements outstanding in the amount of $1,202,870 as reported on the statement of assets and liabilities.
The following table presents the Fund’s RVP liabilities by counterparty net of the related collateral pledged by the Fund as of April 30, 2020:
Counterparty | RVP Liabilities Subject to a MRA | Securities Collateral Pledged†* | Net Amount of RVP Liabilities | |||||||||
HSBC Bank USA | $ | 1,202,870 | $ | (1,202,870 | ) | $ | – 0 | – | ||||
| † | Including accrued interest. |
| * | The actual collateral pledged may be more than the amount reported due to overcollateralization. |
| 64 | AB SHORT DURATION INCOME PORTFOLIO | abfunds.com | |
NOTES TO FINANCIAL STATEMENTS (continued)
6. Loan Participations and Assignments
The Fund may invest in direct debt instruments which are interests in amounts owed to lenders or lending syndicates by corporate, governmental, or other borrowers, either in the form of participations at the time the loan is originated (“Participations”) or by buying an interest in the loan in the secondary market from a financial institution or institutional investor (“Assignments”). A loan is often administered by a bank or other financial institution (the “Lender”) that acts as agent for all holders. The agent administers the term of the loan as specified in the loan agreement. When investing in Participations, the Fund generally has no right to enforce compliance with the terms of the loan agreement with the borrower. In addition, when investing in Participations, the Fund has the right to receive payments of principal, interest and any fees to which it is entitled only from the Lender and only upon receipt of payments by the Lender from the borrower. As a result, the Fund may be subject to the credit risk of both the borrower and the Lender. When the Fund purchases Assignments from Lenders, it will typically acquire direct rights against the borrower on the loan. These loans may include participations in “bridge loans”, which are loans taken out by borrowers for a short period (typically less than six months) pending arrangement of more permanent financing through, for example, the issuance of bonds, frequently high-yield bonds issued for the purpose of acquisitions. The Fund may also participate in unfunded loan commitments, which are contractual obligations for investing in future Participations, and may receive a commitment fee based on the amount of the commitment. Under these arrangements, the Fund may receive a fixed rate commitment fee and, if and to the extent the borrower borrows under the facility, the Fund may receive an additional funding fee.
Unfunded loan commitments and funded loans are marked to market daily.
During the six months ended April 30, 2020, the Fund had no commitments outstanding and did not receive commitment fees.
| abfunds.com | AB SHORT DURATION INCOME PORTFOLIO | 65 | |
NOTES TO FINANCIAL STATEMENTS (continued)
NOTE E
Capital Stock
Each class consists of 3,000,000,000 authorized shares. Transactions in capital shares for each class were as follows:
| Shares | Amount | |||||||||||||||||||||||
| Six Months Ended April 30, 2020 (unaudited) | December 12, 2018(a) to | Six Months Ended April 30, 2020 (unaudited) | December 12, 2018(a) to October 31, 2019 | |||||||||||||||||||||
|
|
|
|
|
|
|
| |||||||||||||||||
| Class A | ||||||||||||||||||||||||
Shares sold | 26,025 | 1,000 | $ | 255,840 | $ | 10,000 | ||||||||||||||||||
| ||||||||||||||||||||||||
Shares issued in reinvestment of dividends | 29 | – 0 | – | 269 | – 0 | – | ||||||||||||||||||
| ||||||||||||||||||||||||
Shares redeemed | (10,504 | ) | – 0 | – | (103,254 | ) | – 0 | – | ||||||||||||||||
| ||||||||||||||||||||||||
Net increase | 15,550 | 1,000 | $ | 152,855 | $ | 10,000 | ||||||||||||||||||
| ||||||||||||||||||||||||
| Class C | ||||||||||||||||||||||||
Shares sold | 43,026 | 1,000 | $ | 418,235 | $ | 10,000 | ||||||||||||||||||
| ||||||||||||||||||||||||
Shares issued in reinvestment of dividends | 158 | – 0 | – | 1,516 | – 0 | – | ||||||||||||||||||
| ||||||||||||||||||||||||
Shares redeemed | (2 | ) | – 0 | – | (20 | ) | – 0 | – | ||||||||||||||||
| ||||||||||||||||||||||||
Net increase | 43,182 | 1,000 | $ | 419,731 | $ | 10,000 | ||||||||||||||||||
| ||||||||||||||||||||||||
| Advisor Class | ||||||||||||||||||||||||
Shares sold | 2,105,887 | 1,498,000 | $ | 21,161,529 | $ | 14,980,000 | ||||||||||||||||||
| ||||||||||||||||||||||||
Shares issued in reinvestment of dividends | 2,611 | – 0 | – | 25,002 | – 0 | – | ||||||||||||||||||
| ||||||||||||||||||||||||
Shares redeemed | (78,283 | ) | – 0 | – | (744,807 | ) | – 0 | – | ||||||||||||||||
| ||||||||||||||||||||||||
Net increase | 2,030,215 | 1,498,000 | $ | 20,441,724 | $ | 14,980,000 | ||||||||||||||||||
| ||||||||||||||||||||||||
| (a) | Commencement of operations. |
At April 30, 2020, the Adviser owned approximately 69% of the Fund’s outstanding shares. Significant transactions by such shareholder, if any, may impact the Fund’s performance.
NOTE F
Risks Involved in Investing in the Fund
Market Risk—The market value of a security may move up or down, sometimes rapidly and unpredictably. These fluctuations may cause a security to be worth less than the price originally paid for it, or less than it was worth at an earlier time. Market risk may affect a single issuer, industry, sector of the economy or the market as a whole. Global economies and financial markets are increasingly interconnected, which increases the probabilities that conditions in one country or region might adversely impact issuers in a different country or region. Conditions
| 66 | AB SHORT DURATION INCOME PORTFOLIO | abfunds.com | |
NOTES TO FINANCIAL STATEMENTS (continued)
affecting the general economy, including political, social, or economic instability at the local, regional, or global level may also affect the market value of a security. Health crises, such as pandemic and epidemic diseases, as well as other incidents that interrupt the expected course of events, such as natural disasters, war or civil disturbance, acts of terrorism, power outages and other unforeseeable and external events, and the public response to or fear of such diseases or events, have and may in the future have an adverse effect on the Fund’s investments and net asset value and can lead to increased market volatility. For example, any preventative or protective actions that governments may take in respect of such diseases or events may result in periods of business disruption, inability to obtain raw materials, supplies and component parts, and reduced or disrupted operations for the Fund’s portfolio companies. The occurrence and pendency of such diseases or events could adversely affect the economies and financial markets either in specific countries or worldwide.
Credit Risk—An issuer or guarantor of a fixed-income security, or the counterparty to a derivatives or other contract, may be unable or unwilling to make timely payments of interest or principal, or to otherwise honor its obligations. The issuer or guarantor may default, causing a loss of the full principal amount of a security and accrued interest. The degree of risk for a particular security may be reflected in its credit rating. There is the possibility that the credit rating of a fixed-income security may be downgraded after purchase, which may adversely affect the value of the security.
Below Investment Grade Securities Risk—Investments in fixed-income securities with lower ratings (commonly known as “junk bonds”) are subject to a higher probability that an issuer will default or fail to meet its payment obligations. These securities may be subject to greater price volatility due to such factors as specific corporate developments and negative perceptions of the junk bond market generally and may be more difficult to trade than other types of securities.
Interest Rate Risk—Changes in interest rates will affect the value of investments in fixed-income securities. When interest rates rise, the value of existing investments in fixed-income securities tends to fall and this decrease in value may not be offset by higher income from new investments. Interest rate risk is generally greater for fixed-income securities with longer maturities or durations.
Duration Risk—Duration is a measure that relates the expected price volatility of a fixed-income security to changes in interest rates. The duration of a fixed-income security may be shorter than or equal to the full maturity of a fixed-income security. Fixed-income securities with longer durations have more risk and will decrease in price as interest rates rise.
| abfunds.com | AB SHORT DURATION INCOME PORTFOLIO | 67 | |
NOTES TO FINANCIAL STATEMENTS (continued)
Foreign (Non-U.S.) Risk—Investments in securities of non-U.S. issuers may involve more risk than those of U.S. issuers. These securities may fluctuate more widely in price and may be more difficult to trade due to adverse market, economic, political, regulatory or other factors.
Emerging Market Risk—Investments in emerging market countries may have more risk because the markets are less developed and less liquid as well as being subject to increased economic, political, regulatory or other uncertainties.
Derivatives Risk—The Fund may enter into derivative transactions such as forwards, options, futures and swaps. Derivatives may be illiquid, difficult to price, and leveraged so that small changes may produce disproportionate losses for the Fund, and subject to counterparty risk to a greater degree than more traditional investments. Derivatives may result in significant losses, including losses that are far greater than the value of the derivatives reflected on the statement of assets and liabilities.
Leverage Risk—When the Fund borrows money or otherwise leverages its investments, its performance may be volatile because leverage tends to exaggerate the effect of any increase or decrease in the value of the Fund’s investments. The Fund may create leverage through the use of reverse repurchase arrangements, forward currency exchange contracts, forward commitments, dollar rolls or futures or by borrowing money. The use of other types of derivative instruments by the Fund, such as options and swaps, may also result in a form of leverage. Leverage may result in higher returns to the Fund than if the Fund were not leveraged, but may also adversely affectreturns, particularly if the market is declining.
Inflation Risk—This is the risk that the value of assets or income from investments will be less in the future as inflation decreases the value of money. As inflation increases, the value of the Fund’s assets can decline as can the value of the Fund’s distributions. This risk is significantly greater for fixed-income securities with longer maturities.
Currency Risk—Fluctuations in currency exchange rates may negatively affect the value of the Fund’s investments or reduce its returns.
Illiquid Investments Risk—Illiquid investments risk exists when certain investments become difficult to purchase or sell. Difficulty in selling such investments may result in sales at disadvantageous prices affecting the value of your investment in the Fund. Causes of illiquid investments risk may include low trading volumes, large positions and heavy redemptions of Fund shares. Illiquid investments risk may be higher in a rising interest rate environment, when the value and liquidity of fixed-income securities generally decline.
| 68 | AB SHORT DURATION INCOME PORTFOLIO | abfunds.com | |
NOTES TO FINANCIAL STATEMENTS (continued)
Non-Diversification Risk—The Fund may have more risk because it is “non-diversified”, meaning that it can invest more of its assets in a smaller number of issuers. Accordingly, changes in the value of a single security may have a more significant effect, either negative or positive, on the Fund’s net asset value, or NAV.
Mortgage-Related and/or Other Asset-Backed Securities Risk—Investments in mortgage-related and other asset-backed securities are subject to certain additional risks. The value of these securities may be particularly sensitive to changes in interest rates. These risks include “extension risk”, which is the risk that, in periods of rising interest rates, issuers may delay the payment of principal, and “prepayment risk”, which is the risk that in periods of falling interest rates, issuers may pay principal sooner than expected, exposing the Fund to a lower rate of return upon reinvestment of principal. Mortgage-backed securities offered by non-governmental issuers and other asset-backed securities may be subject to other risks, such as higher rates of default in the mortgages or assets backing the securities or risks associated with the nature and servicing of mortgages or assets backing the securities.
LIBOR Risk—The Fund may invest in certain debt securities, derivatives or other financial instruments that utilize the London Interbank Offered Rate, or “LIBOR,” as a “benchmark” or “reference rate” for various interest rate calculations. In July 2017, the United Kingdom Financial Conduct Authority, which regulates LIBOR, announced a desire to phase out the use of LIBOR by the end of 2021. Although financial regulators and industry working groups have suggested alternative reference rates, such as European Interbank Offer Rate (“EURIBOR”), Sterling Overnight Interbank Average Rate (“SONIA”) and Secured Overnight Financing Rate (“SOFR”), global consensus on alternative rates is lacking and the process for amending existing contracts or instruments to transition away from LIBOR remains unclear. The elimination of LIBOR or changes to other reference rates or any other changes or reforms to the determination or supervision of reference rates could have an adverse impact on the market for, or value of, any securities or payments linked to those reference rates, which may adversely affect the Fund’s performance and/or net asset value. Uncertainty and risk also remain regarding the willingness and ability of issuers and lenders to include revised provisions in new and existing contracts or instruments. Consequently, the transition away from LIBOR to other reference rates may lead to increased volatility and illiquidity in markets that are tied to LIBOR, fluctuations in values of LIBOR-related investments or investments in issuers that utilize LIBOR, increased difficulty in borrowing or refinancing and diminished effectiveness of hedging strategies, adversely affecting the Fund’s performance. Furthermore, the risks associated with the expected discontinuation of LIBOR and transition may
| abfunds.com | AB SHORT DURATION INCOME PORTFOLIO | 69 | |
NOTES TO FINANCIAL STATEMENTS (continued)
be exacerbated if the work necessary to effect an orderly transition to an alternative reference rate is not completed in a timely manner. Because the usefulness of LIBOR as a benchmark could deteriorate during the transition period, these effects could occur prior to the end of 2021.
Indemnification Risk—In the ordinary course of business, the Fund enters into contracts that contain a variety of indemnifications. The Fund’s maximum exposure under these arrangements is unknown. However, the Fund has not had prior claims or losses pursuant to these indemnification provisions and expects the risk of loss thereunder to be remote. Therefore, the Fund has not accrued any liability in connection with these indemnification provisions.
Management Risk—The Fund is subject to management risk because it is an actively-managed investment fund. The Adviser will apply its investment techniques and risk analyses in making investment decisions, but there is no guarantee that its techniques will produce the intended results.
NOTE G
Joint Credit Facility
A number of open-end mutual funds managed by the Adviser, including the Fund, participate in a $325 million revolving credit facility (the “Facility”) intended to provide short-term financing, if necessary, subject to certain restrictions in connection with abnormal redemption activity. Commitment fees related to the Facility are paid by the participating funds and are included in miscellaneous expenses in the statement of operations. The Fund did not utilize the Facility during the six months ended April 30, 2020.
NOTE H
Distributions to Shareholders
The tax character of distributions to be paid for the year ending October 31, 2020 will be determined at the end of the current fiscal year. The tax character of distributions paid during the fiscal year ended October 31, 2019 was as follows:
| 2019 | ||||
Distributions paid from: | ||||
Ordinary income | $ | 547,042 | ||
|
| |||
Total taxable distributions paid | $ | 547,042 | ||
|
| |||
| 70 | AB SHORT DURATION INCOME PORTFOLIO | abfunds.com | |
NOTES TO FINANCIAL STATEMENTS (continued)
As of October 31, 2019, the components of accumulated earnings/(deficit) on a tax basis were as follows:
Undistributed ordinary income | $ | 294,461 | ||
Undistributed capital gains | 14,030 | |||
Other losses | (12,072 | )(a) | ||
Unrealized appreciation/(depreciation) | 276,067 | (b) | ||
|
| |||
Total accumulated earnings/(deficit) | $ | 572,486 | (c) | |
|
|
| (a) | As of October 31, 2019, the cumulative deferred loss on straddles was $12,072. |
| (b) | The differences between book-basis and tax-basis unrealized appreciation/(depreciation) are attributable primarily to the recognition for tax purposes of unrealized gains/losses on certain derivative instruments and the tax treatment of swaps. |
| (c) | The differences between book-basis and tax-basis components of accumulated earnings/(deficit) are attributable primarily to the accrual of foreign capital gains tax and dividends payable. |
For tax purposes, net realized capital losses may be carried over to offset future capital gains, if any. Funds are permitted to carry forward capital losses for an indefinite period, and such losses will retain their character as either short-term or long-term capital losses. As of October 31, 2019, the Fund did not have any capital loss carryforwards.
NOTE I
Recent Accounting Pronouncements
In March 2017, the Financial Accounting Standards Board issued an Accounting Standards Update, ASU 2017-08, Receivables—Nonrefundable Fees and Other Costs (Subtopic 310-20), Premium Amortization on Purchased Callable Debt Securities which amends the amortization period for certain purchased callable debt securities held at a premium, shortening such period to the earliest call date. ASU 2017-08 does not require any accounting change for debt securities held at a discount; the discount continues to be amortized to maturity. ASU 2017-08 is effective for fiscal years, and interim periods within those fiscal years, beginning after December 15, 2018. The Fund has adopted ASU 2017-08, which did not have a material impact on the Fund’s financial position or the results of its operations, and had no impact on the Fund’s net assets.
NOTE J
Subsequent Events
Management has evaluated subsequent events for possible recognition or disclosure in the financial statements through the date the financial statements are issued. Management has determined that there are no material events that would require disclosure in the Fund’s financial statements through this date.
| abfunds.com | AB SHORT DURATION INCOME PORTFOLIO | 71 | |
FINANCIAL HIGHLIGHTS
Selected Data For A Share Of Capital Stock Outstanding Throughout Each Period
| Class A | ||||||||
| Six Months Ended April 30, 2020 | December 12, 2018(a) to October 31, 2019 | |||||||
|
| |||||||
Net asset value, beginning of period | $ 10.35 | $ 10.00 | ||||||
|
| |||||||
Income From Investment Operations | ||||||||
Net investment income (loss)(b)(c) | (.05 | ) | .28 | |||||
Net realized and unrealized gain (loss) on investment and foreign currency transactions | (.53 | ) | .42 | |||||
|
| |||||||
Net increase (decrease) in net asset value from operations | (.58 | ) | .70 | |||||
|
| |||||||
Less: Dividends and Distributions | ||||||||
Dividends from net investment income | (.20 | ) | (.35 | ) | ||||
Distributions from net realized gain on investment transactions | (.13 | ) | – 0 | – | ||||
|
| |||||||
Total dividends and distributions | (.33 | ) | (.35 | ) | ||||
|
| |||||||
Net asset value, end of period | $ 9.44 | $ 10.35 | ||||||
|
| |||||||
Total Return | ||||||||
Total investment return based on net asset value(d) | (5.63 | )% | 7.09 | % | ||||
Ratios/Supplemental Data | ||||||||
Net assets, end of period (000’s omitted) | $156 | $10 | ||||||
Ratio to average net assets of: | ||||||||
Expenses, net of waivers/reimbursements(e)^ | .72 | % | .70 | % | ||||
Expenses, before waivers/reimbursements(e)^ | 2.09 | % | 3.18 | % | ||||
Net investment income (loss)(c)^ | (1.12 | )% | 3.14 | % | ||||
Portfolio turnover rate** | 174 | % | 178 | % | ||||
Portfolio turnover rate (including securities sold short)** | 174 | % | 181 | % | ||||
See footnote summary on page 74.
| 72 | AB SHORT DURATION INCOME PORTFOLIO | abfunds.com | |
FINANCIAL HIGHLIGHTS (continued)
Selected Data For A Share Of Capital Stock Outstanding Throughout Each Period
| Class C | ||||||||
| Six Months Ended April 30, 2020 | December 12, 2018(a) to October 31, 2019 | |||||||
|
| |||||||
Net asset value, beginning of period | $ 10.34 | $ 10.00 | ||||||
|
| |||||||
Income From Investment Operations | ||||||||
Net investment income (loss)(b)(c) | (.16 | ) | .21 | |||||
Net realized and unrealized gain (loss) on investment and foreign currency transactions | (.30 | ) | .41 | |||||
|
| |||||||
Net increase (decrease) in net asset value from operations | (.46 | ) | .62 | |||||
|
| |||||||
Less: Dividends and Distributions | ||||||||
Dividends from net investment income | (.17 | ) | (.28 | ) | ||||
Distributions from net realized gain on investment transactions | (.13 | ) | – 0 | – | ||||
|
| |||||||
Total dividends and distributions | (.30 | ) | (.28 | ) | ||||
|
| |||||||
Net asset value, end of period | $ 9.58 | $ 10.34 | ||||||
|
| |||||||
Total Return | ||||||||
Total investment return based on net asset value(d) | (4.48 | )% | 6.23 | % | ||||
Ratios/Supplemental Data | ||||||||
Net assets, end of period (000’s omitted) | $423 | $10 | ||||||
Ratio to average net assets of: | ||||||||
Expenses, net of waivers/reimbursements(e)^ | 1.51 | % | 1.49 | % | ||||
Expenses, before waivers/reimbursements(e)^ | 2.81 | % | 4.02 | % | ||||
Net investment income (loss)(c)^ | (3.44 | )% | 2.34 | % | ||||
Portfolio turnover rate** | 174 | % | 178 | % | ||||
Portfolio turnover rate (including securities sold short)** | 174 | % | 181 | % | ||||
See footnote summary on page 74.
| abfunds.com | AB SHORT DURATION INCOME PORTFOLIO | 73 | |
FINANCIAL HIGHLIGHTS (continued)
Selected Data For A Share Of Capital Stock Outstanding Throughout Each Period
| Advisor Class | ||||||||
| Six Months Ended April 30, 2020 | December 12, 2018(a) to October 31, 2019 | |||||||
|
| |||||||
Net asset value, beginning of period | $ 10.35 | $ 10.00 | ||||||
|
| |||||||
Income From Investment Operations | ||||||||
Net investment income(b)(c) | .04 | .30 | ||||||
Net realized and unrealized gain (loss) on investment and foreign currency transactions | (.47 | ) | .41 | |||||
|
| |||||||
Net increase (decrease) in net asset value from operations | (.43 | ) | .71 | |||||
|
| |||||||
Less: Dividends and Distributions | ||||||||
Dividends from net investment income | (.21 | ) | (.36 | ) | ||||
Distributions from net realized gain on investment transactions | (.13 | ) | – 0 | – | ||||
|
| |||||||
Total dividends and distributions | (.34 | ) | (.36 | ) | ||||
|
| |||||||
Net asset value, end of period | $ 9.58 | $ 10.35 | ||||||
|
| |||||||
Total Return | ||||||||
Total investment return based on net asset value(d) | (4.27 | )% | 7.25 | % | ||||
Ratios/Supplemental Data | ||||||||
Net assets, end of period (000’s omitted) | $33,792 | $15,498 | ||||||
Ratio to average net assets of: | ||||||||
Expenses, net of waivers/reimbursements(e)^ | .55 | % | .49 | % | ||||
Expenses, before waivers/reimbursements(e)^ | 2.07 | % | 2.99 | % | ||||
Net investment income(c)^ | .90 | % | 3.31 | % | ||||
Portfolio turnover rate** | 174 | % | 178 | % | ||||
Portfolio turnover rate (including securities sold short)** | 174 | % | 181 | % | ||||
| (a) | Commencement of operations. |
| (b) | Based on average shares outstanding. |
| (c) | Net of expenses waived/reimbursed by the Adviser. |
| (d) | Total investment return is calculated assuming an initial investment made at the net asset value at the beginning of the period, reinvestment of all dividends and distributions at net asset value during the period, and redemption on the last day of the period. Total return does not reflect the deduction of taxes that a shareholder would pay on fund distributions or the redemption of fund shares. Total investment return calculated for a period of less than one year is not annualized. |
| (e) | The expense ratios presented below exclude interest expense: |
| Six Months Ended April 30, 2020 | Year Ended October 31, 2019 | |||||||
|
| |||||||
Class A | ||||||||
Net of waivers/reimbursements^ | .65 | % | .65 | % | ||||
Before waivers/reimbursements^ | 2.01 | % | 3.13 | % | ||||
Class C | ||||||||
Net of waivers/reimbursements^ | 1.45 | % | 1.45 | % | ||||
Before waivers/reimbursements^ | 2.75 | % | 3.97 | % | ||||
Advisor Class | ||||||||
Net of waivers/reimbursements^ | .45 | % | .45 | % | ||||
Before waivers/reimbursements^ | 1.97 | % | 2.95 | % | ||||
| ** | The Fund accounts for dollar roll transactions as purchases and sales. |
| ^ | Annualized. |
See notes to financial statements.
| 74 | AB SHORT DURATION INCOME PORTFOLIO | abfunds.com | |
BOARD OF DIRECTORS
Marshall C. Turner, Jr.(1), Chairman Jorge A. Bermudez(1) Michael J. Downey(1) Nancy P. Jacklin(1) | Robert M. Keith, President and Chief Executive Officer Jeanette Loeb(1) Carol C. McMullen(1) Garry L. Moody(1) Earl D. Weiner(1) |
OFFICERS
Scott A. DiMaggio(2), Vice President Gershon M. Distenfeld(2), Douglas J. Peebles(2),* Vice President Matthew S. Sheridan(2), Vice President | Emilie D. Wrapp, Secretary Michael B. Reyes, Senior Analyst Joseph J. Mantineo, Treasurer and Chief Financial Officer Phyllis J. Clarke, Controller |
Custodian and Accounting Agent State Street Bank and Trust Company State Street Corporation CCB/5 1 Iron Street Boston, MA 02210
Principal Underwriter AllianceBernstein Investments, Inc. 1345 Avenue of the Americas New York, NY 10105
Transfer Agent AllianceBernstein Investor Services, Inc. P.O. Box 786003 San Antonio, TX 78278-6003 Toll-Free (800) 221-5672 | Independent Registered Public Ernst & Young LLP 5 Times Square New York, NY 10036
Legal Counsel Seward & Kissel LLP One Battery Park Plaza New York, NY 10004 |
| 1 | Member of the Audit Committee, the Governance and Nominating Committee and the Independent Directors Committee. |
| 2 | The day-to-day management of, and investment decisions for, the Fund’s portfolio are made by the Adviser’s Short Duration Income Investment Team. Messrs. DiMaggio, Distenfeld, Peebles and Sheridan are the investment professions with the most significant day-to-day responsibility for the management of the Fund’s portfolio. |
| * | Mr. Peebles is expected to retire from the Adviser effective December 30, 2020. |
| abfunds.com | AB SHORT DURATION INCOME PORTFOLIO | 75 | |
Operation and Effectiveness of the Fund’s Liquidity Risk Management Program:
In October 2016, the Securities and Exchange Commission (“SEC”) adopted the open-end fund liquidity rule (the “Liquidity Rule”). In June 2018 the SEC adopted a requirement that funds disclose information about the operation and effectiveness of their Liquidity Risk Management Program (“LRMP”) in their reports to shareholders.
One of the requirements of the Liquidity Rule is for the Fund to designate an Administrator of the Fund’s Liquidity Risk Management Program. The Administrator of the Fund’s LRMP is AllianceBernstein L.P., the Fund’s investment adviser (the “Adviser”). The Adviser has delegated the responsibility to its Liquidity Risk Management Committee (the “Committee”). Another requirement of the Liquidity Rule is for the Fund’s Board of Directors (the “Fund Board”) to receive an annual written report from the Administrator of the LRMP, which addresses the operation of the Fund’s LRMP and assesses its adequacy and effectiveness. The Adviser provided the Fund’s Board with such annual report during the first quarter of 2020, which covered the period December 1, 2018 through December 31, 2019 (the “Program Reporting Period”).
The LRMP’s principal objectives include supporting the Fund’s compliance with limits on investments in illiquid assets and mitigating the risk that the Fund will be unable to meet its redemption obligations in a timely manner. Pursuant to the LRMP, the Fund classifies the liquidity of its portfolio investments into one of the four categories defined by the SEC: Highly Liquid, Moderately Liquid, Less Liquid, and Illiquid. These classifications are reported to the SEC on Form N-PORT.
During the Program Reporting Period, the Committee reviewed whether the Fund’s strategy is appropriate for an open-end structure, taking into account any holdings of less liquid and illiquid assets. The Committee also performed an analysis to determine whether the Fund is required to maintain a Highly Liquid Investment Minimum (“HLIM”). If the Fund participated in derivative transactions, the exposure from such transactions were considered in the LRMP. The Committee also incorporated the following information when determining the Fund’s reasonably anticipated trading size for purposes of liquidity monitoring: historical net redemption activity, a Fund’s concentration in an issuer, shareholder concentration, investment performance, total net assets, and distribution channels.
The Adviser informed the Fund Board that the Committee believes the Fund’s LRMP is adequately designed, has been implemented as intended, and has operated effectively since its inception. No material exceptions have been noted since the implementation of the LRMP, and there were no liquidity events that impacted the Fund or its ability to timely meet redemptions during the Program Reporting Period.
| 76 | AB SHORT DURATION INCOME PORTFOLIO | abfunds.com | |
Information Regarding the Review and Approval of the Fund’s Advisory Agreement and New Advisory Agreements
The disinterested directors (the “directors”) of AB Bond Fund, Inc. (the “Company”) unanimously approved the Company’s Advisory Agreement with the Adviser in respect of AB Short Duration Income Portfolio (the “Fund”) for an initial two-year period at a meeting held on July 31-August 2, 2018 (the “Meeting”), as well as new Advisory Agreements with the same terms (together with the Advisory Agreement, the “Advisory Agreements”) in connection with the plans of AXA S.A. to sell its remaining interest in AXA Equitable Holdings, Inc. (the indirect holder of a majority of the partnership interests in the Adviser and the indirect parent of AllianceBernstein Corporation, the general partner of the Adviser), subject to market conditions, in one or more transactions that may be deemed to involve an “assignment” of one or more advisory agreements between the Adviser and the Company in respect of the Fund.*
Prior to approval of the Advisory Agreements, the directors had requested from the Adviser, and received and evaluated, extensive materials. They reviewed the proposed Advisory Agreements with the Adviser and with experienced counsel who are independent of the Adviser, who advised on the relevant legal standards. The directors also reviewed additional materials, including materials from an outside consultant, who acted as their independent fee consultant, and comparative analytical data prepared by the Senior Analyst for the Fund. The directors also discussed the proposed approval in private sessions with counsel.
The directors considered their knowledge of the nature and quality of the services to be provided by the Adviser to the Fund gained from their experience as directors or trustees of most of the registered investment companies advised by the Adviser, their overall confidence in the Adviser’s integrity and competence they have gained from that experience, the Adviser’s initiative in identifying and raising potential issues with the directors and its responsiveness, frankness and attention to concerns raised by the directors in the past, including the Adviser’s willingness to consider and implement organizational and operational changes designed to improve investment results and the services provided to the AB Funds. The directors noted that they have four regular meetings each year, at each of which they review extensive materials and information from the Adviser, including information on the investment performance of the AB Funds.
The directors also considered all factors they believed relevant, including the specific matters discussed below. During the course of their deliberations, the directors evaluated, among other things, the reasonableness of the proposed advisory fee. The directors did not identify any particular information that was all-important or controlling, and different directors
| * | Following transactions completed on November 13, 2019 that may have been deemed to have been an “assignment” causing termination of the Fund’s investment advisory agreement, a new investment advisory agreement, having the same terms as the prior one, was entered into by the Fund and the Adviser. |
| abfunds.com | AB SHORT DURATION INCOME PORTFOLIO | 77 | |
may have attributed different weights to the various factors. The directors determined that the selection of the Adviser to manage the Fund and the overall arrangements between the Fund and the Adviser, as provided in the Advisory Agreements, including the proposed advisory fee, were fair and reasonable in light of the services to be performed, expenses to be incurred and such other matters as the directors considered relevant in the exercise of their business judgment. The material factors and conclusions that formed the basis for the directors’ determinations included the following:
Nature, Extent and Quality of Services to be Provided
The directors considered the scope and quality of services to be provided by the Adviser under the Advisory Agreements, including the quality of the investment research capabilities of the Adviser and the other resources it has dedicated to performing services for the AB Funds. They also noted the professional experience and qualifications of the Fund’s portfolio management team and other senior personnel of the Adviser. The directors also considered that the Advisory Agreements provide that the Fund will reimburse the Adviser for the cost to it of providing certain clerical, accounting, administrative and other services to the Fund by employees of the Adviser or its affiliates. Requests for these reimbursements will be subject to the directors’ approval on a quarterly basis and, to the extent requested and paid, result in a higher rate of total compensation from the Fund to the Adviser than the fee rate stated in the Advisory Agreements. The directors noted that the methodology to be used to determine the reimbursement amounts had been reviewed by an independent consultant retained by the Company’s former Senior Officer/Independent Compliance Officer. The quality of administrative and other services, including the Adviser’s role in coordinating the activities of the Fund’s other service providers, also was considered. The directors concluded that, overall, they were satisfied with the nature, extent and quality of services to be provided to the Fund under the Advisory Agreements.
Costs of Services to be Provided and Profitability
Because the Fund had not yet commenced operations, the directors were unable to consider historical information about the profitability of the Fund. However, the Adviser agreed to provide the directors with profitability information in connection with future proposed continuances of the Advisory Agreements. They also considered the costs to be borne by the Adviser in providing services to the Fund and that the Fund was unlikely to be profitable to the Adviser unless it achieves a material level of net assets.
Fall-Out Benefits
The directors considered the other benefits to the Adviser and its affiliates from their proposed relationships with the Fund, including, but not limited to, benefits relating to 12b-1 fees and sales charges to be received by the Fund’s principal underwriter (which is a wholly owned subsidiary of the Adviser) in respect of certain classes of the Fund’s shares; and transfer
| 78 | AB SHORT DURATION INCOME PORTFOLIO | abfunds.com | |
agency fees to be paid by the Fund to a wholly owned subsidiary of the Adviser. The directors recognized that the Adviser’s future profitability would be somewhat lower without these benefits. The directors understood that the Adviser also might derive reputational and other benefits from its association with the Fund.
Investment Results
Since the Fund had not yet commenced operations, no performance or other historical information for the Fund was available. Based on the Adviser’s written and oral presentations regarding the proposed management of the Fund and their general knowledge and confidence in the Adviser’s expertise in managing mutual funds, the directors concluded that they were satisfied that the Adviser was capable of providing high quality Fund management services to the Fund.
Advisory Fees and Other Expenses
The directors considered the proposed advisory fee rate payable by the Fund to the Adviser and information prepared by an independent service provider (the “15(c) service provider”), concerning advisory fee rates payable by other funds in the same category as the Fund, based on the Fund’s projected net assets of $250 million. The directors recognized that it is difficult to make comparisons of advisory fees because there are variations in the services that are included in the fees paid by other funds. The directors considered the Fund’s proposed contractual effective advisory fee rate against a peer group median.
The directors recognized that the Adviser’s total compensation from the Fund pursuant to the Advisory Agreements would be increased by amounts paid pursuant to the expense reimbursement provision in the Advisory Agreements, and that the impact of such expense reimbursement would depend on the size of the Fund and the extent to which the Adviser requests reimbursements pursuant to this provision.
The directors also considered the Adviser’s fee schedule for other clients pursuing a similar investment style. For this purpose, they reviewed the relevant advisory fee information from the Adviser’s Form ADV and in a report from the Fund’s Senior Analyst and noted the differences between the Fund’s proposed fee schedule, on the one hand, and the Adviser’s institutional fee schedule, on the other. The directors noted that the Adviser may, in some cases, agree to fee rates with large institutional clients that are lower than those reviewed by the directors and that they had previously discussed with the Adviser its policies in respect of such arrangements. The directors also discussed these matters with their independent fee consultant.
The Adviser reviewed with the directors the significantly greater scope of the services it will provide to the Fund relative to institutional clients. In this
| abfunds.com | AB SHORT DURATION INCOME PORTFOLIO | 79 | |
regard, the Adviser noted, among other things, that, compared to institutional accounts, the Fund (i) demands considerably more portfolio management, research and trading resources due to significantly higher daily cash flows; (ii) has more tax and regulatory restrictions and compliance obligations; (iii) must prepare and file or distribute regulatory and other communications about fund operations; and (iv) must provide shareholder servicing to retail investors. The Adviser also reviewed the greater legal risks presented by the large and changing population of Fund shareholders who may assert claims against the Adviser in individual or class actions, and the greater entrepreneurial risk in offering new fund products, which require substantial investment to launch, may not succeed, and generally must be priced to compete with larger, more established funds resulting in lack of profitability to the Adviser until a new fund achieves scale. In light of the substantial differences in services rendered by the Adviser to institutional clients as compared to the Fund, the directors considered these fee comparisons inapt and did not place significant weight on them in their deliberations.
The directors noted that the Fund may invest in shares of exchange-traded funds (“ETFs”), subject to the restrictions and limitations of the Investment Company Act of 1940 as these may be varied as a result of exemptive orders issued by the SEC. The directors also noted that ETFs pay advisory fees pursuant to their advisory contracts. The directors concluded, based on the Adviser’s explanation of how it may use ETFs when they are the most cost-effective way to obtain desired exposures, in some cases pending purchases of underlying securities, that the proposed advisory fee would be for services in addition to, rather than duplicative of, the services provided under the advisory contracts of the ETFs.
The directors also considered the projected total expense ratio of the Class A shares of the Fund in comparison to a group of similar funds (“peer group”) and a larger group of similar funds (“peer universe”) selected by the 15(c) service provider. The directors also considered the Adviser’s proposed expense cap for the Fund for a one year period. The directors noted that it was likely that the expense ratios of some of the other funds in the Fund’s category were lowered by waivers or reimbursements by those funds’ investment advisers, which in some cases might be voluntary or temporary. The directors view the projected expense ratio information as relevant to their evaluation of the Adviser’s services because the Adviser is responsible for coordinating services provided to the Fund by others. Based on their review, the directors concluded that the Fund’s projected expense ratio was acceptable.
Economies of Scale
The directors noted that the proposed advisory fee schedule for the Fund contains a breakpoint that reduces the fee rate on assets above a specified level. The directors took into consideration prior presentations by an independent consultant on economies of scale in the mutual fund industry
| 80 | AB SHORT DURATION INCOME PORTFOLIO | abfunds.com | |
and for the AB Funds, and by the Adviser concerning certain of its views on economies of scale. The directors also had requested and received from the Adviser certain updates on economies of scale in advance of the Meeting. The directors believe that economies of scale may be realized (if at all) by the Adviser across a variety of products and services, and not only in respect of a single fund. The directors noted that there is no established methodology for setting breakpoints that give effect to the fund-specific services provided by a fund’s adviser and to the economies of scale that an adviser may realize in its overall mutual fund business or those components of it which directly or indirectly affect a fund’s operations. The directors observed that in the mutual fund industry as a whole, as well as among funds similar to the Fund, there is no uniformity or pattern in the fees and asset levels at which breakpoints (if any) apply. The directors also noted that the advisory agreements for many funds do not have breakpoints at all. Having taken these factors into account, the directors concluded that the Fund’s shareholders would benefit from a sharing of economies of scale in the event the Fund’s net assets exceed the breakpoint in the future.
| abfunds.com | AB SHORT DURATION INCOME PORTFOLIO | 81 | |
This page is not part of the Shareholder Report or the Financial Statements.
AB FAMILY OF FUNDS
US EQUITY
CORE
Core Opportunities Fund
FlexFee™ US Thematic Portfolio
Select US Equity Portfolio
GROWTH
Concentrated Growth Fund
Discovery Growth Fund
FlexFee™ Large Cap Growth Portfolio
Growth Fund
Large Cap Growth Fund
Small Cap Growth Portfolio
VALUE
Discovery Value Fund
Equity Income Fund
Relative Value Fund
Small Cap Value Portfolio
Value Fund
INTERNATIONAL/ GLOBAL EQUITY
CORE
FlexFee™ International Strategic Core Portfolio
Global Core Equity Portfolio
International Portfolio
International Strategic Core Portfolio
Sustainable Global Thematic Fund
Tax-Managed International Portfolio
Tax-Managed Wealth Appreciation Strategy
Wealth Appreciation Strategy
INTERNATIONAL/ GLOBAL EQUITY (continued)
GROWTH
Concentrated International Growth Portfolio
FlexFee™ Emerging Markets Growth Portfolio
Sustainable International Thematic Fund
VALUE
All China Equity Portfolio
International Value Fund
FIXED INCOME
MUNICIPAL
High Income Municipal Portfolio
Intermediate California Municipal Portfolio
Intermediate Diversified Municipal Portfolio
Intermediate New York Municipal Portfolio
Municipal Bond Inflation Strategy
Tax-Aware Fixed Income Opportunities Portfolio1
National Portfolio
Arizona Portfolio
California Portfolio
Massachusetts Portfolio
Minnesota Portfolio
New Jersey Portfolio
New York Portfolio
Ohio Portfolio
Pennsylvania Portfolio
Virginia Portfolio
FIXED INCOME (continued)
TAXABLE
Bond Inflation Strategy
FlexFee™ High Yield Portfolio
FlexFee™ International Bond Portfolio
Global Bond Fund
High Income Fund
Income Fund
Intermediate Duration Portfolio
Limited Duration High Income Portfolio
Short Duration Income Portfolio
Short Duration Portfolio
Total Return Bond Portfolio1
ALTERNATIVES
All Market Real Return Portfolio
Global Real Estate Investment Fund
Select US Long/Short Portfolio
Unconstrained Bond Fund
MULTI-ASSET
All Market Income Portfolio
All Market Total Return Portfolio
Conservative Wealth Strategy
Emerging Markets Multi-Asset Portfolio
Global Risk Allocation Fund
Tax-Managed All Market Income Portfolio
CLOSED-END FUNDS
AllianceBernstein Global High Income Fund
AllianceBernstein National Municipal Income Fund
We also offer Government Money Market Portfolio, which serves as the money market fund exchange vehicle for the AB mutual funds. You could lose money by investing in the Fund. Although the Fund seeks to preserve the value of your investment at $1.00 per share, it cannot guarantee it will do so. The Fund may impose a fee upon sale of your shares or may temporarily suspend your ability to sell shares if the Fund’s liquidity falls below required minimums because of market conditions or other factors. An investment in the Fund is not insured or guaranteed by the Federal Deposit Insurance Corporation or any other government agency. The Fund’s sponsor has no legal obligation to provide financial support to the Fund, and you should not expect that the sponsor will provide financial support to the Fund at any time.
Investors should consider the investment objectives, risks, charges and expenses of the Fund carefully before investing. For copies of our prospectus or summary prospectus, which contain this and other information, visit us online at www.abfunds.com or contact your AB representative. Please read the prospectus and/or summary prospectus carefully before investing.
| 1 | Prior to July 12, 2019, Total Return Bond Portfolio was named Intermediate Bond Portfolio; prior to February 5, 2020, Tax-Aware Fixed Income Opportunities Portfolio was named Tax-Aware Fixed Income Portfolio. |
| 82 | AB SHORT DURATION INCOME PORTFOLIO | abfunds.com | |
NOTES
| abfunds.com | AB SHORT DURATION INCOME PORTFOLIO | 83 | |
NOTES
| 84 | AB SHORT DURATION INCOME PORTFOLIO | abfunds.com | |
AB SHORT DURATION INCOME PORTFOLIO
1345 Avenue of the Americas
New York, NY 10105
800 221 5672
SDI-0152-0420 
APR 04.30.20

SEMI-ANNUAL REPORT
AB TAX-AWARE FIXED INCOME OPPORTUNITIES PORTFOLIO

Beginning January 1, 2021, as permitted by new regulations adopted by the Securities and Exchange Commission, the Fund’s annual and semi-annual shareholder reports will no longer be sent by mail, unless you specifically request paper copies of the reports. Instead, the reports will be made available on a website, and you will be notified by mail each time a report is posted and provided with a website address to access the report.
If you already elected to receive shareholder reports electronically, you will not be affected by this change and you need not take any action. You may elect to receive shareholder reports and other communications from the Fund electronically at any time by contacting your financial intermediary (such as a broker-dealer or bank) or, if you are a direct investor, by calling the Fund at (800) 221 5672.
You may elect to receive all future reports in paper form free of charge. If you invest through a financial intermediary, you can contact your financial intermediary to request that you continue to receive paper copies of your shareholder reports; if you invest directly with the Fund, you can call the Fund at (800) 221 5672. Your election to receive reports in paper form will apply to all funds held in your account with your financial intermediary or, if you invest directly, to all AB Mutual Funds you hold.
| Investment Products Offered | • Are Not FDIC Insured • May Lose Value • Are Not Bank Guaranteed | |
Investors should consider the investment objectives, risks, charges and expenses of the Fund carefully before investing. For copies of our prospectus or summary prospectus, which contain this and other information, visit us online at www.abfunds.com or contact your AB representative. Please read the prospectus and/or summary prospectus carefully before investing.
This shareholder report must be preceded or accompanied by the Fund’s prospectus for individuals who are not current shareholders of the Fund.
You may obtain a description of the Fund’s proxy voting policies and procedures, and information regarding how the Fund voted proxies relating to portfolio securities during the most recent 12-month period ended June 30, without charge. Simply visit AB’s website at www.abfunds.com, or go to the Securities and Exchange Commission’s (the “Commission”) website at www.sec.gov, or call AB at (800) 227 4618.
The Fund files its complete schedule of portfolio holdings with the Commission for the first and third quarters of each fiscal year as an exhibit to its reports on Form N-PORT. The Fund’s Form N-PORT reports are available on the Commission’s website at www.sec.gov. The Fund’s Forms N-PORT may also be reviewed and copied at the Commission’s Public Reference Room in Washington, DC; information on the operation of the Public Reference Room may be obtained by calling (800) SEC 0330. AB publishes full portfolio holdings for the Fund monthly at www.abfunds.com.
AllianceBernstein Investments, Inc. (ABI) is the distributor of the AB family of mutual funds. ABI is a member of FINRA and is an affiliate of AllianceBernstein L.P., the Adviser of the funds.
The [A/B] logo is a registered service mark of AllianceBernstein and AllianceBernstein® is a registered service mark used by permission of the owner, AllianceBernstein L.P.
| FROM THE PRESIDENT |  |
Dear Shareholder,
We are pleased to provide this report for AB Tax-Aware Fixed Income Opportunities Portfolio (the “Fund”). Please review the discussion of Fund performance, the market conditions during the reporting period and the Fund’s investment strategy.
As always, AB strives to keep clients ahead of what’s next by:
| + | Transforming uncommon insights into uncommon knowledge with a global research scope |
| + | Navigating markets with seasoned investment experience and sophisticated solutions |
| + | Providing thoughtful investment insights and actionable ideas |
Whether you’re an individual investor or a multi-billion-dollar institution, we put knowledge and experience to work for you.
AB’s global research organization connects and collaborates across platforms and teams to deliver impactful insights and innovative products. Better insights lead to better opportunities—anywhere in the world.
For additional information about AB’s range of products and shareholder resources, please log on to www.abfunds.com.
Thank you for your investment in the AB Mutual Funds.
Sincerely,

Robert M. Keith
President and Chief Executive Officer, AB Mutual Funds
| abfunds.com | AB TAX-AWARE FIXED INCOME OPPORTUNITIES PORTFOLIO | 1 | |
SEMI-ANNUAL REPORT
June 16, 2020
This report provides management’s discussion of fund performance for AB Tax-Aware Fixed Income Opportunities Portfolio for the semi-annual reporting period ended April 30, 2020. Prior to February 5, 2020, the Fund was named AB Tax-Aware Fixed Income Portfolio.
The investment objective of the Fund is to seek to maximize after-tax return and income.
NAV RETURNS AS OF APRIL 30, 2020 (unaudited)
| 6 Months | 12 Months | |||||||
| AB TAX-AWARE FIXED INCOME OPPORTUNITIES PORTFOLIO | ||||||||
| Class A Shares | -10.02% | -7.15% | ||||||
| Class C Shares | -10.36% | -7.85% | ||||||
| Advisor Class Shares1 | -9.91% | -6.92% | ||||||
| Bloomberg Barclays Municipal Bond Index | -1.33% | 2.16% | ||||||
| 1 | Please note that this share class is for investors purchasing shares through accounts established under certain fee-based programs sponsored and maintained by certain broker-dealers and financial intermediaries, institutional pension plans and/or investment advisory clients of, and certain other persons associated with, the Adviser and its affiliates or the Fund. |
INVESTMENT RESULTS
The table above shows the Fund’s performance compared to its benchmark, the Bloomberg Barclays Municipal Bond Index, for the six- and 12-month periods ended April 30, 2020.
All share classes of the Fund underperformed the benchmark during both periods, before sales charges. For both periods, credit positioning detracted, relative to the benchmark, as credit spreads widened in a flight to quality. Overweights to the securitized sector and consumer price index (“CPI”) swaps also detracted. Positioning in corporate credit default index swaps contributed, as did overweights to Treasuries and interest rate swaps.
The Fund utilized derivatives in the form of CPI swaps for hedging purposes, which detracted from absolute performance for both periods. Credit default swaps were utilized for hedging and investment purposes and detracted over both periods. Interest rate swaps were utilized for hedging purposes and added to performance over both periods.
MARKET REVIEW AND INVESTMENT STRATEGY
Themes of strong demand, light supply and supportive credit fundamentals were prominent until the last couple months of the six-month
| 2 | AB TAX-AWARE FIXED INCOME OPPORTUNITIES PORTFOLIO | abfunds.com | |
period ended April 30, 2020. In March, these themes sharply reversed and volatility spiked dramatically. The novel coronavirus pandemic quickly led to the increase in market volatility and to a sharp economic contraction. In this environment, investors fled to cash from nearly every other type of investment, and stocks and bonds fell dramatically. The municipal bond market was not spared; after 60 consecutive weeks of inflows, municipal bond funds had record outflows. Municipals had shown strong absolute and relative performance prior to March, with yields declining 0.8% to over 1%, depending on the maturity since April of 2019. In March, open-end funds had to sell vast quantities of bonds to meet shareholder redemptions, and this selling contributed to yields rising over 2% in less than two weeks. The municipal market did recover toward the end of March and into April as investor demand returned following the actions taken by the US Federal Reserve to address market liquidity and the passing of the Coronavirus Aid, Relief, and Economic Security Act, which included direct aid to municipalities. As a result, after the large moves during both periods, yields for high-grade municipal bonds ended lower for the 12-month period by 0.3% to 0.7%, with yields for shorter-maturity bonds declining more; for the six-month period, longer-maturity municipal yields were higher by about 0.15% and shorter-maturity bonds declined by about 0.3%. Over both the six- and 12-month periods, the additional yield provided by more credit-sensitive bonds increased.
The Fund’s Senior Investment Management Team (the “Team”) continues to seek investments in attractive after-tax returns such as municipal and taxable fixed-income and selective below investment-grade bonds. The Team seeks to manage interest-rate exposure by focusing on lower-rated municipal and corporate bonds.
The Fund may purchase municipal securities that are insured under policies issued by certain insurance companies. Historically, insured municipal securities typically received a higher credit rating, which meant that the issuer of the securities paid a lower interest rate. As a result of declines in the credit quality and associated downgrades of most bond insurers, insurance has less value than it did in the past. The market now values insured municipal securities primarily based on the credit quality of the issuer of the security with little value given to the insurance feature. In purchasing such insured securities, the Adviser evaluates the risk and return of municipal securities through its own research. If an insurance company’s rating is downgraded or the company becomes insolvent, the prices of municipal securities insured by the insurance company may decline. As of April 30, 2020, the Fund’s percentages of investments in municipal bonds that are insured and in insured municipal bonds that have been pre-refunded or escrowed to maturity were 3.57% and 0.00%, respectively.
| abfunds.com | AB TAX-AWARE FIXED INCOME OPPORTUNITIES PORTFOLIO | 3 | |
INVESTMENT POLICIES
The Fund pursues its objective by investing principally in a national portfolio of both municipal and taxable fixed-income securities. The Fund invests, under normal circumstances, at least 80% of its net assets in fixed-income securities. The Fund also invests, under normal circumstances, at least 65% of its total assets in municipal securities that pay interest that is exempt from federal income tax. These securities may pay interest that is subject to the federal alternative minimum tax for certain taxpayers. The income earned and distributed to shareholders on non-municipal securities would not be exempt from federal income tax. The Fund may invest in fixed-income securities rated below investment-grade (commonly known as “junk bonds”), although such securities are not expected to be the Fund’s primary focus.
The Adviser selects securities for the Fund based on a variety of factors, including credit quality, maturity, diversification benefits, and the relative expected after-tax returns of taxable and municipal securities (considering federal tax rates and without regard to state and local income taxes). As the objective is to increase the after-tax return of the Fund, an investor in the Fund may incur a tax liability that will generally be greater than the same investor would have in a fund investing exclusively in municipal securities, and that will be higher if the investor is in a higher tax bracket. In addition, the tax implications of the Fund’s trading activity, such as realizing taxable gains, are considered in making purchase and sale decisions for the Fund. The Fund may invest in fixed-income securities of any maturity from short- to long-term.
The Fund may also invest in forward commitments, zero-coupon municipal securities and variable, floating and inverse floating-rate municipal securities.
The Fund may use derivatives, such as swaps, options, futures contracts and forwards, to achieve its investment strategies. For example, the Fund may enter into tender option bonds and credit default and interest rate swaps relating to municipal and taxable fixed-income securities or securities indices. Derivatives may provide more efficient and economical exposure to fixed-income securities markets than direct investments.
| 4 | AB TAX-AWARE FIXED INCOME OPPORTUNITIES PORTFOLIO | abfunds.com | |
DISCLOSURES AND RISKS
Benchmark Disclosure
The Bloomberg Barclays Municipal Bond Index is unmanaged and does not reflect fees and expenses associated with the active management of a mutual fund portfolio. The Bloomberg Barclays Municipal Bond Index represents the performance of the long-term tax-exempt bond market consisting of investment-grade bonds. An investor cannot invest directly in an index, and its results are not indicative of the performance for any specific investment, including the Fund.
A Word About Risk
Market Risk: The market value of a security may move up or down, sometimes rapidly and unpredictably. These fluctuations may cause a security to be worth less than the price originally paid for it, or less than it was worth at an earlier time. Market risk may affect a single issuer, industry, sector of the economy or the market as a whole. Global economies and financial markets are increasingly interconnected, which increases the probabilities that conditions in one country or region might adversely impact issuers in a different country or region. Conditions affecting the general economy, including political, social, or economic instability at the local, regional, or global level may also affect the market value of a security. Health crises, such as pandemic and epidemic diseases, as well as other incidents that interrupt the expected course of events, such as natural disasters, war or civil disturbance, acts of terrorism, power outages and other unforeseeable and external events, and the public response to or fear of such diseases or events, have and may in the future have an adverse effect on the Fund’s investments and net asset value and can lead to increased market volatility. For example, any preventative or protective actions that governments may take in respect of such diseases or events may result in periods of business disruption, inability to obtain raw materials, supplies and component parts, and reduced or disrupted operations for the Fund’s portfolio companies. The occurrence and pendency of such diseases or events could adversely affect the economies and financial markets either in specific countries or worldwide.
Credit Risk: An issuer or guarantor of a fixed-income security, or the counterparty to a derivatives or other contract, may be unable or unwilling to make timely payments of interest or principal, or to otherwise honor its obligations. The issuer or guarantor may default, causing a loss of the full principal amount of a security and accrued interest. The degree of risk for a particular security may be reflected in its credit rating. There is the possibility that the credit rating of a fixed-income security may be downgraded after purchase, which may adversely affect the value of the security.
| abfunds.com | AB TAX-AWARE FIXED INCOME OPPORTUNITIES PORTFOLIO | 5 | |
DISCLOSURES AND RISKS (continued)
Below Investment-Grade Securities Risk: Investments in fixed-income securities with lower ratings (commonly known as “junk bonds”) are subject to a higher probability that an issuer will default or fail to meet its payment obligations. These securities may be subject to greater price volatility due to such factors as specific municipal or corporate developments and negative performance of the junk bond market generally and may be more difficult to trade than other types of securities.
Municipal Market Risk: This is the risk that special factors may adversely affect the value of municipal securities and have a significant effect on the yield or value of the Fund’s investments in municipal securities. These factors include economic conditions, political or legislative changes, uncertainties related to the tax status of municipal securities, or the rights of investors in these securities. To the extent that the Fund invests more of its assets in a particular state’s municipal securities, the Fund may be vulnerable to events adversely affecting that state, including economic, political and regulatory occurrences, court decisions, terrorism and catastrophic natural disasters, such as hurricanes or earthquakes. The Fund’s investments in certain municipal securities with principal and interest payments that are made from the revenues of a specific project or facility, and not general tax revenues, may have increased risks. Factors affecting the project or facility, such as local business or economic conditions, could have a significant effect on the project’s ability to make payments of principal and interest on these securities.
Congress has previously considered making changes to the municipal securities provisions of the Internal Revenue Code that could change the US federal income tax treatment of certain types of municipal securities.
The Fund may invest in the municipal securities of Puerto Rico or other US territories and their governmental agencies and municipalities, which are exempt from federal, state, and, where applicable, local income taxes. These municipal securities may have more risks than those of other US issuers of municipal securities. Like many US states and municipalities, Puerto Rico experienced a significant downturn during the recent recession. Puerto Rico’s downturn was particularly severe, and Puerto Rico continues to face a very challenging economic and fiscal environment. If the general economic situation in Puerto Rico continues to persist or worsens, the volatility and credit quality of Puerto Rican municipal securities could continue to be adversely affected, and the market for such securities may experience continued volatility.
Tax Risk: From time to time, the US government and the US Congress consider changes in federal tax law that could limit or eliminate the federal tax exemption for municipal bond income, which would in effect reduce the income received by shareholders from the Fund by increasing taxes on
| 6 | AB TAX-AWARE FIXED INCOME OPPORTUNITIES PORTFOLIO | abfunds.com | |
DISCLOSURES AND RISKS (continued)
that income. In such event, the Fund’s net asset value (“NAV”) could also decline as yields on municipal bonds, which are typically lower than those on taxable bonds, would be expected to increase to approximately the yield of comparable taxable bonds. Actions or anticipated actions affecting the tax-exempt status of municipal bonds could also result in significant shareholder redemptions of Fund shares as investors anticipate adverse effects on the Fund or seek higher yields to offset the potential loss of the tax deduction. As a result, the Fund would be required to maintain higher levels of cash to meet the redemptions, which would negatively affect the Fund’s yield.
Interest-Rate Risk: Changes in interest rates will affect the value of investments in fixed-income securities. When interest rates rise, the value of existing investments in fixed-income securities tends to fall and this decrease in value may not be offset by higher income from new investments. Interest-rate risk is generally greater for fixed-income securities with longer maturities or durations.
Duration Risk: Duration is a measure that relates the expected price volatility of a fixed-income security to changes in interest rates. The duration of a fixed-income security may be shorter than or equal to full maturity of a fixed-income security. Fixed-income securities with longer durations have more risk and will decrease in price as interest rates rise.
Inflation Risk: This is the risk that the value of assets or income from investments will be less in the future as inflation decreases the value of money. As inflation increases, the value of the Fund’s assets can decline as can the value of the Fund’s distributions. This risk is significantly greater for fixed-income securities with longer maturities.
Illiquid Investments Risk: Illiquid investments risk exists when certain investments become difficult to purchase or sell. Difficulty in selling such investments may result in sales at disadvantageous prices affecting the value of your investment in the Fund. Causes of illiquid investments risk may include low trading volumes and large positions. Municipal securities may have more illiquid investments risk than other fixed-income securities because they trade less frequently and the market for municipal securities is generally smaller than many other markets.
Leverage Risk: To the extent the Fund uses leveraging techniques, its NAV may be more volatile because leverage tends to exaggerate the effect of changes in interest rates and any increase or decrease in the value of the Fund’s investments.
| abfunds.com | AB TAX-AWARE FIXED INCOME OPPORTUNITIES PORTFOLIO | 7 | |
DISCLOSURES AND RISKS (continued)
Derivatives Risk: Derivatives may be difficult to price or unwind and leveraged so that small changes may produce disproportionate losses for the Fund. Derivatives, especially over-the-counter derivatives, are also subject to counterparty risk.
Management Risk: The Fund is subject to management risk because it is an actively managed investment fund. The Adviser will apply its investment techniques and risk analyses in making investment decisions, but there is no guarantee that its techniques will produce the intended results. Some of these techniques may incorporate, or rely upon, quantitative models, but there is no guarantee that these models will generate accurate forecasts, reduce risk or otherwise perform as expected.
These and other risks are more fully discussed in the Fund’s prospectus. As with all investments, you may lose money by investing in the Fund.
An Important Note About Historical Performance
The investment return and principal value of an investment in the Fund will fluctuate, so that shares, when redeemed, may be worth more or less than their original cost. Performance shown in this report represents past performance and does not guarantee future results. Current performance may be lower or higher than the performance information shown. You may obtain performance information current to the most recent month-end by visiting www.abfunds.com.
All fees and expenses related to the operation of the Fund have been deducted. NAV returns do not reflect sales charges; if sales charges were reflected, the Fund’s quoted performance would be lower. SEC returns and the Fund’s returns shown in the line graphs reflect the applicable sales charges for each share class: a 3% maximum front-end sales charge for Class A shares and a 1% 1-year contingent deferred sales charge for Class C shares. Returns for the different share classes will vary due to their different expenses associated with each class. Performance assumes reinvestment of distributions and does not account for taxes.
| 8 | AB TAX-AWARE FIXED INCOME OPPORTUNITIES PORTFOLIO | abfunds.com | |
HISTORICAL PERFORMANCE
AVERAGE ANNUAL RETURNS AS OF APRIL 30, 2020 (unaudited)
| NAV Returns | SEC Returns (reflects applicable sales charges) | |||||||
| CLASS A SHARES | ||||||||
| 1 Year | -7.15% | -9.96% | ||||||
| 5 Years | 1.00% | 0.38% | ||||||
| Since Inception1 | 1.92% | 1.44% | ||||||
| CLASS C SHARES | ||||||||
| 1 Year | -7.85% | -8.75% | ||||||
| 5 Years | 0.23% | 0.23% | ||||||
| Since Inception1 | 1.17% | 1.17% | ||||||
| ADVISOR CLASS SHARES2 | ||||||||
| 1 Year | -6.92% | -6.92% | ||||||
| 5 Years | 1.24% | 1.24% | ||||||
| Since Inception1 | 2.19% | 2.19% | ||||||
The Fund’s current prospectus fee table shows the Fund’s total annual operating expense ratios as 1.30%, 2.06% and 1.05% for Class A, Class C and Advisor Class shares, respectively, gross of any fee waivers or expense reimbursements. Contractual fee waivers and/or expense reimbursements limit the Fund’s annual operating expense ratios exclusive of expenses associated with securities sold short, acquired fund fees and expenses other than the advisory fees of any AB mutual funds in which the Fund may invest, interest expense, taxes, extraordinary expenses, brokerage commissions and other transaction costs to 0.75%, 1.50% and 0.50% for Class A, Class C and Advisor Class shares, respectively. These waivers/reimbursements may not be terminated prior to January 31, 2021, and may be extended by the Adviser for additional one-year terms. Absent reimbursements or waivers, performance would have been lower. The Financial Highlights section of this report sets forth expense ratio data for the current reporting period; the expense ratios shown above may differ from the expense ratios in the Financial Highlights section since they are based on different time periods.
| 1 | Inception date: 12/11/2013. |
| 2 | This share class is offered at NAV to eligible investors and the SEC returns are the same as the NAV returns. Please note that this share class is for investors purchasing shares through accounts established under certain fee-based programs sponsored and maintained by certain broker-dealers and financial intermediaries, institutional pension plans and/or investment advisory clients of, and certain other persons associated with, the Adviser and its affiliates or the Fund. |
| abfunds.com | AB TAX-AWARE FIXED INCOME OPPORTUNITIES PORTFOLIO | 9 | |
HISTORICAL PERFORMANCE (continued)
SEC AVERAGE ANNUAL RETURNS
AS OF THE MOST RECENT CALENDAR QUARTER-END
MARCH 31, 2020 (unaudited)
SEC Returns (reflects applicable | ||||
| CLASS A SHARES | ||||
| 1 Year | -6.83% | |||
| 5 Years | 0.85% | |||
| Since Inception1 | 1.91% | |||
| CLASS C SHARES | ||||
| 1 Year | -5.56% | |||
| 5 Years | 0.71% | |||
| Since Inception1 | 1.65% | |||
| ADVISOR CLASS SHARES2 | ||||
| 1 Year | -3.67% | |||
| 5 Years | 1.72% | |||
| Since Inception1 | 2.67% | |||
| 1 | Inception date: 12/11/2013. |
| 2 | Please note that this share class is for investors purchasing shares through accounts established under certain fee-based programs sponsored and maintained by certain broker-dealers and financial intermediaries, institutional pension plans and/or investment advisory clients of, and certain other persons associated with, the Adviser and its affiliates or the Fund. |
| 10 | AB TAX-AWARE FIXED INCOME OPPORTUNITIES PORTFOLIO | abfunds.com | |
EXPENSE EXAMPLE
(unaudited)
As a shareholder of the Fund, you incur two types of costs: (1) transaction costs, including sales charges (loads) on purchase payments, contingent deferred sales charges on redemptions and (2) ongoing costs, including management fees; distribution (12b-1) fees; and other Fund expenses. This example is intended to help you understand your ongoing costs (in dollars) of investing in the Fund and to compare these costs with the ongoing costs of investing in other mutual funds.
The Example is based on an investment of $1,000 invested at the beginning of the period and held for the entire period as indicated below.
Actual Expenses
The table below provides information about actual account values and actual expenses. You may use the information, together with the amount you invested, to estimate the expenses that you paid over the period. Simply divide your account value by $1,000 (for example, an $8,600 account value divided by $1,000 = 8.6), then multiply the result by the number under the heading entitled “Expenses Paid During Period” to estimate the expenses you paid on your account during this period.
Hypothetical Example for Comparison Purposes
The table below also provides information about hypothetical account values and hypothetical expenses based on the Fund’s actual expense ratio and an assumed annual rate of return of 5% before expenses, which is not the Fund’s actual return. The hypothetical account values and expenses may not be used to estimate the actual ending account balance or expenses you paid for the period. You may use this information to compare the ongoing costs of investing in the Fund and other funds by comparing this 5% hypothetical example with the 5% hypothetical examples that appear in the shareholder reports of other funds.
Please note that the expenses shown in the table are meant to highlight your ongoing costs only and do not reflect any transactional costs, such as sales charges (loads), or contingent deferred sales charges on redemptions. Therefore, the hypothetical example is useful in comparing ongoing costs only, and will not help you determine the relative total costs of owning different funds. In addition, if these transactional costs were included, your costs would have been higher.
| abfunds.com | AB TAX-AWARE FIXED INCOME OPPORTUNITIES PORTFOLIO | 11 | |
EXPENSE EXAMPLE (continued)
| Beginning Account Value November 1, 2019 | Ending Account Value April 30, 2020 | Expenses Paid During Period* | Annualized Expense Ratio* | |||||||||||||
| Class A | ||||||||||||||||
Actual | $ | 1,000 | $ | 899.80 | $ | 3.54 | 0.75 | % | ||||||||
Hypothetical** | $ | 1,000 | $ | 1,021.13 | $ | 3.77 | 0.75 | % | ||||||||
| Class C | ||||||||||||||||
Actual | $ | 1,000 | $ | 896.40 | $ | 7.07 | 1.50 | % | ||||||||
Hypothetical** | $ | 1,000 | $ | 1,017.40 | $ | 7.52 | 1.50 | % | ||||||||
| Advisor Class |
| |||||||||||||||
Actual | $ | 1,000 | $ | 900.90 | $ | 2.36 | 0.50 | % | ||||||||
Hypothetical** | $ | 1,000 | $ | 1,022.38 | $ | 2.51 | 0.50 | % | ||||||||
| * | Expenses are equal to the classes’ annualized expense ratios, multiplied by the average account value over the period, multiplied by 182/366 (to reflect the one-half year period). |
| ** | Assumes 5% annual return before expenses. |
| 12 | AB TAX-AWARE FIXED INCOME OPPORTUNITIES PORTFOLIO | abfunds.com | |
PORTFOLIO SUMMARY
APRIL 30, 2020 (unaudited)
PORTFOLIO STATISTICS
Net Assets ($mil): $75.7
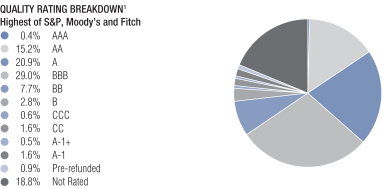
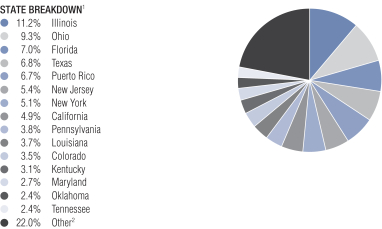
| 1 | All data are as of April 30, 2020. The Fund’s quality rating and state breakdowns are expressed as a percentage of the Fund’s total investments in municipal securities and may vary over time. The quality ratings are determined by using the S&P Global Ratings (“S&P”), Moody’s Investors Services, Inc. (“Moody’s”) and Fitch Ratings, Ltd. (“Fitch”). The Fund considers the credit ratings issued by S&P, Moody’s and Fitch and uses the highest rating issued by the agencies. These ratings are a measure of the quality and safety of a bond or portfolio, based on the issuer’s financial condition. AAA is the highest (best) and D is the lowest (worst). If applicable, the Pre-refunded category includes bonds which are secured by U.S. Government securities and therefore are deemed high-quality investment-grade by the Adviser. If applicable, Not Applicable (N/A) includes non-creditworthy investments, such as equities, currency contracts, futures and options. If applicable, the Not Rated category includes bonds that are not rated by a nationally recognized statistical rating organization. The Adviser evaluates the creditworthiness of non-rated securities based on a number of factors including, but not limited to, cash flows, enterprise value and economic environment. |
| 2 | “Other” represents less than 2.4% in 25 different states, American Samoa and District of Columbia. |
| abfunds.com | AB TAX-AWARE FIXED INCOME OPPORTUNITIES PORTFOLIO | 13 | |
PORTFOLIO OF INVESTMENTS
April 30, 2020 (unaudited)
| Principal Amount (000) | U.S. $ Value | |||||||
| ||||||||
MUNICIPAL OBLIGATIONS – 89.8% |
| |||||||
Long-Term Municipal Bonds – 88.3% |
| |||||||
Alabama – 0.9% |
| |||||||
County of Jefferson AL Sewer Revenue | $ | 110 | $ | 125,409 | ||||
Tuscaloosa County Industrial Development Authority | 595 | 588,592 | ||||||
|
| |||||||
| 714,001 | ||||||||
|
| |||||||
American Samoa – 0.2% |
| |||||||
American Samoa Economic Development Authority | 135 | 154,937 | ||||||
|
| |||||||
Arizona – 0.7% |
| |||||||
Arizona Industrial Development Authority | 203 | 192,231 | ||||||
Arizona Industrial Development Authority | 100 | 75,871 | ||||||
Industrial Development Authority of the City of Phoenix (The) | 100 | 102,249 | ||||||
Salt Verde Financial Corp. | 100 | 121,768 | ||||||
|
| |||||||
| 492,119 | ||||||||
|
| |||||||
California – 4.4% |
| |||||||
Alameda Corridor Transportation Authority | 175 | 185,661 | ||||||
California Health Facilities Financing Authority | 850 | 968,328 | ||||||
California Housing Finance | 159 | 153,080 | ||||||
| 14 | AB TAX-AWARE FIXED INCOME OPPORTUNITIES PORTFOLIO | abfunds.com | |
PORTFOLIO OF INVESTMENTS (continued)
| Principal Amount (000) | U.S. $ Value | |||||||
| ||||||||
California Municipal Finance Authority | $ | 250 | $ | 262,530 | ||||
California Pollution Control Financing Authority | 250 | 253,967 | ||||||
California Statewide Communities Development Authority | 250 | 253,223 | ||||||
Golden State Tobacco Securitization Corp. | 1,305 | 1,268,369 | ||||||
|
| |||||||
| 3,345,158 | ||||||||
|
| |||||||
Colorado – 3.2% |
| |||||||
City & County of Denver CO | 615 | 605,541 | ||||||
Colorado Health Facilities Authority | 540 | 576,067 | ||||||
Colorado Health Facilities Authority | 200 | 222,576 | ||||||
Copper Ridge Metropolitan District | 500 | 437,715 | ||||||
Vauxmont Metropolitan District AGM | 380 | 436,388 | ||||||
5.00%, 12/01/2050(b) | 100 | 114,161 | ||||||
|
| |||||||
| 2,392,448 | ||||||||
|
| |||||||
Connecticut – 1.0% |
| |||||||
City of New Haven CT | 615 | 678,493 | ||||||
State of Connecticut | 100 | 100,899 | ||||||
|
| |||||||
| 779,392 | ||||||||
|
| |||||||
| abfunds.com | AB TAX-AWARE FIXED INCOME OPPORTUNITIES PORTFOLIO | 15 | |
PORTFOLIO OF INVESTMENTS (continued)
| Principal Amount (000) | U.S. $ Value | |||||||
| ||||||||
District of Columbia – 1.2% |
| |||||||
District of Columbia | $ | 400 | $ | 400,000 | ||||
2.28%, 08/01/2038(c) | 425 | 425,000 | ||||||
District of Columbia | 100 | 103,839 | ||||||
|
| |||||||
| 928,839 | ||||||||
|
| |||||||
Florida – 6.3% |
| |||||||
Bexley Community Development District | 100 | 96,013 | ||||||
Brevard County School District | 290 | 339,796 | ||||||
Capital Trust Agency, Inc. | 100 | 85,560 | ||||||
Capital Trust Agency, Inc. | 110 | 111,779 | ||||||
Citizens Property Insurance Corp. | 310 | 327,097 | ||||||
County of Miami-Dade FL | 780 | 894,028 | ||||||
County of Miami-Dade FL Aviation Revenue | 265 | 294,606 | ||||||
County of Osceola FL Transportation Revenue | 230 | 134,649 | ||||||
North Broward Hospital District | 270 | 290,729 | ||||||
Pinellas County Industrial Development Authority | 505 | 470,195 | ||||||
School District of Broward County/FL | 365 | 433,255 | ||||||
| 16 | AB TAX-AWARE FIXED INCOME OPPORTUNITIES PORTFOLIO | abfunds.com | |
PORTFOLIO OF INVESTMENTS (continued)
| Principal Amount (000) | U.S. $ Value | |||||||
| ||||||||
Town of Davie FL | $ | 655 | $ | 685,942 | ||||
Village Community Development District No. | 635 | 582,136 | ||||||
|
| |||||||
| 4,745,785 | ||||||||
|
| |||||||
Georgia – 1.6% |
| |||||||
City of Atlanta GA Department of Aviation | 310 | 326,275 | ||||||
Main Street Natural Gas, Inc. | 760 | 802,826 | ||||||
Municipal Electric Authority of Georgia | 100 | 107,392 | ||||||
|
| |||||||
| 1,236,493 | ||||||||
|
| |||||||
Guam – 0.3% |
| |||||||
Territory of Guam 5.00%, 11/15/2031 | 240 | 223,123 | ||||||
|
| |||||||
Illinois – 10.1% |
| |||||||
Chicago Board of Education | 325 | 326,862 | ||||||
Series 2012A | 240 | 223,891 | ||||||
Series 2019A | 200 | 200,635 | ||||||
Series 2019B | 100 | 97,998 | ||||||
Chicago O’Hare International Airport | 335 | 359,013 | ||||||
Series 2017B | 725 | 807,962 | ||||||
Illinois Finance Authority | 100 | 91,628 | ||||||
Illinois Finance Authority | 85 | 57,928 | ||||||
Series 2016C | 15 | 150 | ||||||
Illinois Finance Authority | 100 | 86,639 | ||||||
| abfunds.com | AB TAX-AWARE FIXED INCOME OPPORTUNITIES PORTFOLIO | 17 | |
PORTFOLIO OF INVESTMENTS (continued)
| Principal Amount (000) | U.S. $ Value | |||||||
| ||||||||
Illinois Finance Authority | $ | 250 | $ | 268,755 | ||||
Illinois Municipal Electric Agency | 465 | 495,774 | ||||||
Metropolitan Pier & Exposition Authority | 640 | 581,536 | ||||||
Series 2015B | 600 | 553,578 | ||||||
State of Illinois | 270 | 271,185 | ||||||
Series 2016 | 375 | 372,353 | ||||||
Series 2017D | 930 | 901,806 | ||||||
Series 2018A | 1,000 | 969,170 | ||||||
Series 2019B | 1,000 | 956,180 | ||||||
|
| |||||||
| 7,623,043 | ||||||||
|
| |||||||
Indiana – 0.8% |
| |||||||
Indiana Finance Authority | 190 | 192,177 | ||||||
Indiana Finance Authority | 100 | 102,901 | ||||||
Indiana Finance Authority | 350 | 281,372 | ||||||
|
| |||||||
| 576,450 | ||||||||
|
| |||||||
Iowa – 0.4% |
| |||||||
Iowa Finance Authority | 325 | 298,434 | ||||||
|
| |||||||
Kentucky – 2.8% |
| |||||||
City of Ashland KY | 385 | 397,778 | ||||||
| 18 | AB TAX-AWARE FIXED INCOME OPPORTUNITIES PORTFOLIO | abfunds.com | |
PORTFOLIO OF INVESTMENTS (continued)
| Principal Amount (000) | U.S. $ Value | |||||||
| ||||||||
Kentucky Economic Development Finance Authority | $ | 175 | $ | 188,984 | ||||
Kentucky Economic Development Finance Authority | 160 | 158,914 | ||||||
Kentucky Economic Development Finance Authority | 65 | 58,462 | ||||||
Kentucky Economic Development Finance Authority | 425 | 455,647 | ||||||
Kentucky Public Energy Authority | 600 | 629,448 | ||||||
Louisville/Jefferson County Metropolitan Government | 225 | 250,792 | ||||||
|
| |||||||
| 2,140,025 | ||||||||
|
| |||||||
Louisiana – 3.3% |
| |||||||
City of New Orleans LA Water System Revenue | 100 | 113,006 | ||||||
Louisiana Local Government Environmental Facilities & Community Development Auth | 675 | 755,230 | ||||||
Louisiana Public Facilities Authority | 250 | 2 | ||||||
Louisiana Public Facilities Authority | 1,335 | 1,408,065 | ||||||
| abfunds.com | AB TAX-AWARE FIXED INCOME OPPORTUNITIES PORTFOLIO | 19 | |
PORTFOLIO OF INVESTMENTS (continued)
| Principal Amount (000) | U.S. $ Value | |||||||
| ||||||||
New Orleans Aviation Board | $ | 215 | $ | 235,720 | ||||
|
| |||||||
| 2,512,023 | ||||||||
|
| |||||||
Maine – 0.4% |
| |||||||
Finance Authority of Maine | 100 | 103,923 | ||||||
Maine Health & Higher Educational Facilities Authority | 165 | 172,438 | ||||||
|
| |||||||
| 276,361 | ||||||||
|
| |||||||
Maryland – 2.4% |
| |||||||
City of Baltimore MD | 120 | 103,534 | ||||||
City of Baltimore MD | 150 | 144,201 | ||||||
Maryland Economic Development Corp. | 1,000 | 1,031,560 | ||||||
Maryland Economic Development Corp. | 600 | 565,278 | ||||||
|
| |||||||
| 1,844,573 | ||||||||
|
| |||||||
Massachusetts – 1.3% |
| |||||||
Massachusetts Development Finance Agency | 620 | 621,668 | ||||||
Massachusetts Development Finance Agency | 325 | 268,430 | ||||||
Series 2017A | 140 | 102,589 | ||||||
|
| |||||||
| 992,687 | ||||||||
|
| |||||||
Michigan – 0.6% |
| |||||||
City of Detroit MI | 75 | 72,314 | ||||||
| 20 | AB TAX-AWARE FIXED INCOME OPPORTUNITIES PORTFOLIO | abfunds.com | |
PORTFOLIO OF INVESTMENTS (continued)
| Principal Amount (000) | U.S. $ Value | |||||||
| ||||||||
City of Detroit MI Sewage Disposal System Revenue | $ | 115 | $ | 124,046 | ||||
Michigan Finance Authority | 235 | 254,559 | ||||||
|
| |||||||
| 450,919 | ||||||||
|
| |||||||
Minnesota – 0.4% |
| |||||||
City of Minneapolis MN/St. Paul Housing & Redevelopment Authority | 200 | 200,000 | ||||||
City of Wayzata MN | 105 | 101,853 | ||||||
|
| |||||||
| 301,853 | ||||||||
|
| |||||||
Mississippi – 0.3% |
| |||||||
Mississippi Hospital Equipment & Facilities Authority | 250 | 261,817 | ||||||
|
| |||||||
Missouri – 0.2% |
| |||||||
Kansas City Industrial Development Authority | 190 | 155,815 | ||||||
|
| |||||||
Nebraska – 0.1% |
| |||||||
Central Plains Energy Project | 100 | 106,052 | ||||||
|
| |||||||
New Hampshire – 0.4% |
| |||||||
New Hampshire Business Finance Authority | 215 | 205,683 | ||||||
New Hampshire Health and Education Facilities Authority Act | 115 | 121,193 | ||||||
|
| |||||||
| 326,876 | ||||||||
|
| |||||||
| abfunds.com | AB TAX-AWARE FIXED INCOME OPPORTUNITIES PORTFOLIO | 21 | |
PORTFOLIO OF INVESTMENTS (continued)
| Principal Amount (000) | U.S. $ Value | |||||||
| ||||||||
New Jersey – 4.9% |
| |||||||
New Jersey Economic Development Authority | $ | 200 | $ | 202,978 | ||||
New Jersey Economic Development Authority | 210 | 207,845 | ||||||
New Jersey Educational Facilities Authority | 100 | 106,102 | ||||||
New Jersey Health Care Facilities Financing Authority | 280 | 312,497 | ||||||
New Jersey Transportation Trust Fund Authority | 550 | 590,420 | ||||||
New Jersey Transportation Trust Fund Authority | 240 | 240,446 | ||||||
Series 2018A | 340 | 342,499 | ||||||
New Jersey Turnpike Authority | 540 | 631,098 | ||||||
Tobacco Settlement Financing Corp. | 1,045 | 1,050,570 | ||||||
|
| |||||||
| 3,684,455 | ||||||||
|
| |||||||
New York – 4.6% |
| |||||||
Metropolitan Transportation Authority | 315 | 354,331 | ||||||
Monroe County Industrial Development Corp./NY | 550 | 473,874 | ||||||
| 22 | AB TAX-AWARE FIXED INCOME OPPORTUNITIES PORTFOLIO | abfunds.com | |
PORTFOLIO OF INVESTMENTS (continued)
| Principal Amount (000) | U.S. $ Value | |||||||
| ||||||||
New York City Transitional Finance Authority Building Aid Revenue | $ | 865 | $ | 1,035,526 | ||||
New York State Dormitory Authority | 200 | 220,102 | ||||||
New York State Dormitory Authority | 425 | 478,240 | ||||||
New York State Thruway Authority | 365 | 390,576 | ||||||
New York Transportation Development Corp. | 275 | 269,032 | ||||||
New York Transportation Development Corp. | 150 | 153,035 | ||||||
Ulster County Capital Resource Corp. | 120 | 101,418 | ||||||
|
| |||||||
| 3,476,134 | ||||||||
|
| |||||||
North Carolina – 0.7% |
| |||||||
North Carolina Turnpike Authority | 500 | 534,200 | ||||||
|
| |||||||
North Dakota – 0.1% |
| |||||||
County of Grand Forks ND | 100 | 75,640 | ||||||
|
| |||||||
Ohio – 8.3% |
| |||||||
Buckeye Tobacco Settlement Financing Authority | 1,000 | 998,980 | ||||||
Series 2020B | 3,045 | 2,710,080 | ||||||
City of Akron OH | 445 | 479,314 | ||||||
| abfunds.com | AB TAX-AWARE FIXED INCOME OPPORTUNITIES PORTFOLIO | 23 | |
PORTFOLIO OF INVESTMENTS (continued)
| Principal Amount (000) | U.S. $ Value | |||||||
| ||||||||
City of Chillicothe/OH | $ | 175 | $ | 189,807 | ||||
County of Cuyahoga/OH | 365 | 391,481 | ||||||
County of Cuyahoga/OH | 205 | 209,159 | ||||||
County of Marion OH | 100 | 78,982 | ||||||
County of Montgomery OH | 100 | 55,767 | ||||||
Dayton-Montgomery County Port Authority | 100 | 82,634 | ||||||
Ohio Air Quality Development Authority | 145 | 145,363 | ||||||
Ohio Air Quality Development Authority | 100 | 100,750 | ||||||
Ohio Air Quality Development Authority | 580 | 531,593 | ||||||
Ohio Air Quality Development Authority | 185 | 180,123 | ||||||
Ohio Water Development Authority Water Pollution Control Loan Fund | 140 | 141,050 | ||||||
|
| |||||||
| 6,295,083 | ||||||||
|
| |||||||
Oklahoma – 2.2% |
| |||||||
Norman Regional Hospital Authority | 505 | 453,813 | ||||||
| 24 | AB TAX-AWARE FIXED INCOME OPPORTUNITIES PORTFOLIO | abfunds.com | |
PORTFOLIO OF INVESTMENTS (continued)
| Principal Amount (000) | U.S. $ Value | |||||||
| ||||||||
Oklahoma Development Finance Authority | $ | 1,180 | $ | 1,206,161 | ||||
|
| |||||||
| 1,659,974 | ||||||||
|
| |||||||
Pennsylvania – 3.5% |
| |||||||
Beaver County Industrial Development Authority | 130 | 130,975 | ||||||
Lancaster County Hospital Authority/PA | 100 | 92,300 | ||||||
Moon Industrial Development Authority | 100 | 93,927 | ||||||
Pennsylvania Economic Development Financing Authority | 510 | 372,820 | ||||||
Pennsylvania Economic Development Financing Authority | 100 | 101,812 | ||||||
Pennsylvania Turnpike Commission | 200 | 224,778 | ||||||
School District of Philadelphia (The) | 1,350 | 1,592,852 | ||||||
|
| |||||||
| 2,609,464 | ||||||||
|
| |||||||
Puerto Rico – 6.0% |
| |||||||
Commonwealth of Puerto Rico | 30 | 19,763 | ||||||
Series 2011A | 40 | 25,800 | ||||||
Series 2012A | 100 | 63,500 | ||||||
Series 2014A | 135 | 78,300 | ||||||
GDB Debt Recovery Authority of Puerto Rico | 151 | 92,338 | ||||||
| abfunds.com | AB TAX-AWARE FIXED INCOME OPPORTUNITIES PORTFOLIO | 25 | |
PORTFOLIO OF INVESTMENTS (continued)
| Principal Amount (000) | U.S. $ Value | |||||||
| ||||||||
Puerto Rico Commonwealth Aqueduct & Sewer Authority | $ | 175 | $ | 173,687 | ||||
6.125%, 07/01/2024 | 145 | 148,262 | ||||||
Series 2012A | 215 | 209,650 | ||||||
5.125%, 07/01/2037 | 25 | 23,625 | ||||||
5.25%, 07/01/2029-07/01/2042 | 200 | 191,500 | ||||||
5.50%, 07/01/2028 | 75 | 75,000 | ||||||
5.75%, 07/01/2037 | 50 | 49,250 | ||||||
6.00%, 07/01/2047 | 50 | 49,375 | ||||||
Puerto Rico Electric Power Authority | 85 | 50,469 | ||||||
5.00%, 07/01/2037(d)(e) | 245 | 145,469 | ||||||
Series 2010A | 15 | 8,906 | ||||||
Series 2010C | 25 | 14,844 | ||||||
Series 2010D | 15 | 8,906 | ||||||
Series 2010X | 150 | 89,062 | ||||||
Series 2010Z | 40 | 23,750 | ||||||
Series 2012A | 50 | 29,688 | ||||||
5.00%, 07/01/2042(d)(e) | 10 | 5,938 | ||||||
AGM Series 2007V | 375 | 403,755 | ||||||
NATL Series 2007V | 100 | 100,498 | ||||||
Puerto Rico Highway & Transportation Authority | 125 | 131,125 | ||||||
AGC Series 2007N | 110 | 116,864 | ||||||
NATL Series 2007N | 100 | 100,909 | ||||||
Puerto Rico Industrial Tourist Educational Medical & Environmental Control Facilities Financing Auth | 390 | 402,675 | ||||||
| 26 | AB TAX-AWARE FIXED INCOME OPPORTUNITIES PORTFOLIO | abfunds.com | |
PORTFOLIO OF INVESTMENTS (continued)
| Principal Amount (000) | U.S. $ Value | |||||||
| ||||||||
Puerto Rico Sales Tax Financing Corp. Sales Tax Revenue | $ | 2,154 | $ | 525,380 | ||||
Series 2019A | 440 | 392,928 | ||||||
5.00%, 07/01/2058 | 867 | 812,440 | ||||||
|
| |||||||
| 4,563,656 | ||||||||
|
| |||||||
South Carolina – 1.1% |
| |||||||
South Carolina Public Service Authority | 220 | 228,268 | ||||||
Series 2014C | 325 | 339,043 | ||||||
Series 2016A | 265 | 284,424 | ||||||
|
| |||||||
| 851,735 | ||||||||
|
| |||||||
Tennessee – 2.1% |
| |||||||
Bristol Industrial Development Board | 370 | 319,380 | ||||||
Chattanooga Health Educational & Housing Facility Board | 130 | 129,928 | ||||||
5.00%, 08/01/2044-08/01/2049 | 740 | 788,197 | ||||||
Metropolitan Government Nashville & Davidson County Health & Educational Facilities Board | 135 | 75,285 | ||||||
Metropolitan Government Nashville & Davidson County Health & Educational Facilities Board | 215 | 236,896 | ||||||
|
| |||||||
| 1,549,686 | ||||||||
|
| |||||||
Texas – 6.1% |
| |||||||
Austin Convention Enterprises, Inc. | 500 | 459,960 | ||||||
| abfunds.com | AB TAX-AWARE FIXED INCOME OPPORTUNITIES PORTFOLIO | 27 | |
PORTFOLIO OF INVESTMENTS (continued)
| Principal Amount (000) | U.S. $ Value | |||||||
| ||||||||
Central Texas Regional Mobility Authority | $ | 100 | $ | 103,472 | ||||
City of Houston TX | 260 | 254,158 | ||||||
Series 2015 5.00%, 09/01/2031 | 160 | 156,405 | ||||||
Dallas Area Rapid Transit | 580 | 676,408 | ||||||
Dallas County Flood Control District No. 1 | 100 | 103,976 | ||||||
Love Field Airport Modernization Corp. | 500 | 525,770 | ||||||
Mission Economic Development Corp. | 450 | 446,242 | ||||||
New Hope Cultural Education Facilities Finance Corp. | 100 | 85,217 | ||||||
North Texas Tollway Authority | 250 | 277,022 | ||||||
Port Beaumont Navigation District | 100 | 73,977 | ||||||
Tarrant County Cultural Education Facilities Finance Corp. | 150 | 133,242 | ||||||
Tarrant County Cultural Education Facilities Finance Corp. | 675 | 605,077 | ||||||
| 28 | AB TAX-AWARE FIXED INCOME OPPORTUNITIES PORTFOLIO | abfunds.com | |
PORTFOLIO OF INVESTMENTS (continued)
| Principal Amount (000) | U.S. $ Value | |||||||
| ||||||||
Tarrant County Cultural Education Facilities Finance Corp. | $ | 456 | $ | 355,749 | ||||
Tarrant County Cultural Education Facilities Finance Corp. | 100 | 98,197 | ||||||
Texas Private Activity Bond Surface Transportation Corp. | 235 | 245,159 | ||||||
|
| |||||||
| 4,600,031 | ||||||||
|
| |||||||
Virginia – 0.7% |
| |||||||
Federal Home Loan Mortgage Corp. | 375 | 388,837 | ||||||
Tobacco Settlement Financing Corp./VA | 165 | 155,630 | ||||||
|
| |||||||
| 544,467 | ||||||||
|
| |||||||
Washington – 2.0% |
| |||||||
Pend Oreille County Public Utility District No. 1 Box Canyon | 280 | 314,899 | ||||||
Port of Seattle WA | 510 | 552,463 | ||||||
State of Washington | 200 | 242,508 | ||||||
Washington Health Care Facilities Authority | 205 | 218,692 | ||||||
Washington State Housing Finance Commission | 100 | 100,740 | ||||||
Washington State Housing Finance Commission | 100 | 104,379 | ||||||
|
| |||||||
| 1,533,681 | ||||||||
|
| |||||||
| abfunds.com | AB TAX-AWARE FIXED INCOME OPPORTUNITIES PORTFOLIO | 29 | |
PORTFOLIO OF INVESTMENTS (continued)
| Principal Amount (000) | U.S. $ Value | |||||||
| ||||||||
West Virginia – 0.9% |
| |||||||
Tobacco Settlement Finance Authority | $ | 700 | $ | 669,634 | ||||
|
| |||||||
Wisconsin – 1.8% |
| |||||||
UMA Education, Inc. | 330 | 366,092 | ||||||
Wisconsin Health & Educational Facilities Authority | 100 | 82,514 | ||||||
Wisconsin Public Finance Authority | 350 | 301,133 | ||||||
Wisconsin Public Finance Authority | 100 | 91,126 | ||||||
Wisconsin Public Finance Authority | 130 | 130,225 | ||||||
Wisconsin Public Finance Authority | 125 | 119,705 | ||||||
Wisconsin Public Finance Authority | 260 | 260,190 | ||||||
|
| |||||||
| 1,350,985 | ||||||||
|
| |||||||
Total Long-Term Municipal Bonds | 66,878,048 | |||||||
|
| |||||||
Short-Term Municipal Notes – 1.5% |
| |||||||
Vermont – 1.5% |
| |||||||
Vermont Educational & Health Buildings Financing Agency | 1,100 | 1,100,000 | ||||||
|
| |||||||
Total Municipal Obligations | 67,978,048 | |||||||
|
| |||||||
| 30 | AB TAX-AWARE FIXED INCOME OPPORTUNITIES PORTFOLIO | abfunds.com | |
PORTFOLIO OF INVESTMENTS (continued)
| Principal Amount (000) | U.S. $ Value | |||||||
| ||||||||
GOVERNMENTS - TREASURIES – 3.4% |
| |||||||
United States – 3.4% |
| |||||||
U.S. Treasury Notes | $ | 2,400 | $ | 2,599,125 | ||||
|
| |||||||
COLLATERALIZED MORTGAGE OBLIGATIONS – 3.0% | ||||||||
Risk Share Floating Rate – 3.0% |
| |||||||
Bellemeade Re Ltd. | 150 | 143,148 | ||||||
Series 2019-3A, Class M1B | 252 | 218,746 | ||||||
Federal Home Loan Mortgage Corp. | 196 | 146,738 | ||||||
Series 2016-DNA4, Class M3 | 270 | 260,926 | ||||||
Series 2019-DNA3, Class M2 | 49 | 42,188 | ||||||
Federal National Mortgage Association Connecticut Avenue Securities | 451 | 354,707 | ||||||
Series 2014-C03, Class 2M2 | 147 | 113,466 | ||||||
Series 2016-C01, Class 1M2 | 100 | 102,938 | ||||||
Series 2016-C02, Class 1M2 | 369 | 375,190 | ||||||
Series 2017-C01, Class 1M2 | 242 | 232,435 | ||||||
Series 2017-C04, Class 2M2 | 280 | 256,531 | ||||||
|
| |||||||
Total Collateralized Mortgage Obligations | 2,247,013 | |||||||
|
| |||||||
| abfunds.com | AB TAX-AWARE FIXED INCOME OPPORTUNITIES PORTFOLIO | 31 | |
PORTFOLIO OF INVESTMENTS (continued)
| Principal Amount (000) | U.S. $ Value | |||||||
| ||||||||
CORPORATES - NON-INVESTMENT GRADE – 1.1% |
| |||||||
Financial Institutions – 0.6% |
| |||||||
Insurance – 0.6% |
| |||||||
Centene Corp. | $ | 232 | $ | 242,700 | ||||
Polaris Intermediate Corp. | 300 | 251,619 | ||||||
|
| |||||||
| 494,319 | ||||||||
|
| |||||||
Industrial – 0.5% |
| |||||||
Communications - Telecommunications – 0.2% |
| |||||||
Intelsat Jackson Holdings SA | 275 | 149,641 | ||||||
|
| |||||||
Consumer Cyclical - Automotive – 0.3% |
| |||||||
Ford Motor Credit Co. LLC | 200 | 199,080 | ||||||
|
| |||||||
| 348,721 | ||||||||
|
| |||||||
Total Corporates – Non-Investment Grade | 843,040 | |||||||
|
| |||||||
COMMERCIAL MORTGAGE-BACKED SECURITIES – 0.7% |
| |||||||
Non-Agency Fixed Rate CMBS – 0.0% |
| |||||||
Citigroup Commercial Mortgage Trust | 2 | 1,660 | ||||||
|
| |||||||
Non-Agency Floating Rate CMBS – 0.7% |
| |||||||
BAMLL Commercial Mortgage Securities Trust | 250 | 241,265 | ||||||
DBWF Mortgage Trust | 275 | 254,491 | ||||||
|
| |||||||
| 495,756 | ||||||||
|
| |||||||
Total Commercial Mortgage-Backed Securities | 497,416 | |||||||
|
| |||||||
ASSET-BACKED SECURITIES – 0.6% | ||||||||
Credit Cards - Fixed Rate – 0.4% | ||||||||
World Financial Network Credit Card Master Trust | 335 | 335,760 | ||||||
|
| |||||||
| 32 | AB TAX-AWARE FIXED INCOME OPPORTUNITIES PORTFOLIO | abfunds.com | |
PORTFOLIO OF INVESTMENTS (continued)
| Principal Amount (000) | U.S. $ Value | |||||||
| ||||||||
Other ABS - Fixed Rate – 0.2% | ||||||||
SoFi Consumer Loan Program Trust | $ | 157 | $ | 154,655 | ||||
|
| |||||||
Total Asset-Backed Securities | 490,415 | |||||||
|
| |||||||
COLLATERALIZED LOAN OBLIGATIONS – 0.3% |
| |||||||
CLO - Floating Rate – 0.3% | ||||||||
THL Credit Wind River CLO Ltd. | 250 | 236,449 | ||||||
|
| |||||||
| Shares | ||||||||
SHORT-TERM INVESTMENTS – 0.1% |
| |||||||
Investment Companies – 0.1% |
| |||||||
AB Fixed Income Shares, Inc. - Government Money Market Portfolio - Class AB, 0.35%(k)(l)(m) | 88,082 | 88,082 | ||||||
|
| |||||||
Total Investments – 99.0% | 74,979,588 | |||||||
Other assets less liabilities – 1.0% | 743,032 | |||||||
|
| |||||||
Net Assets – 100.0% | $ | 75,722,620 | ||||||
|
| |||||||
CENTRALLY CLEARED CREDIT DEFAULT SWAPS (see Note D)
| Description | Fixed Rate (Pay) Receive | Payment Frequency | Implied Credit Spread at April 30, 2020 | Notional Amount (000) | Market Value | Upfront Premiums Paid (Received) | Unrealized Appreciation/ (Depreciation) | |||||||||||||||||||
Buy Contracts |
| |||||||||||||||||||||||||
CDX-NAIG Series 34, 5 Year Index, 06/20/2025* | (1.00 | )% | Quarterly | 0.88 | % | USD 2,000 | $ | (14,271 | ) | $ | 4,282 | $ | (18,553 | ) | ||||||||||||
| * | Termination date |
| abfunds.com | AB TAX-AWARE FIXED INCOME OPPORTUNITIES PORTFOLIO | 33 | |
PORTFOLIO OF INVESTMENTS (continued)
CENTRALLY CLEARED INFLATION (CPI) SWAPS (see Note D)
| Rate Type | ||||||||||||||||||||||||||
| Notional Amount (000) | Termination Date | Payments made by the Fund | Payments received by the Fund | Payment Frequency Paid/ Received | Market Value | Upfront Premiums Paid (Received) | Unrealized Appreciation/ (Depreciation) | |||||||||||||||||||
| USD 3,950 | 08/09/2024 | 1.690 | % | CPI# | Maturity | $ | (159,394 | ) | $ | — | $ | (159,394 | ) | |||||||||||||
| USD 7,330 | 01/15/2025 | 1.671 | % | CPI# | Maturity | (295,983 | ) | — | (295,983 | ) | ||||||||||||||||
| USD 6,724 | 01/15/2025 | 1.673 | % | CPI# | Maturity | (283,252 | ) | — | (283,252 | ) | ||||||||||||||||
| USD 5,000 | 01/15/2025 | 1.516 | % | CPI# | Maturity | (169,133 | ) | — | (169,133 | ) | ||||||||||||||||
| USD 3,006 | 01/15/2025 | 1.637 | % | CPI# | Maturity | (120,886 | ) | — | (120,886 | ) | ||||||||||||||||
| USD 1,110 | 01/15/2028 | 1.230 | % | CPI# | Maturity | (4,187 | ) | — | (4,187 | ) | ||||||||||||||||
| USD 650 | 01/15/2028 | 0.735 | % | CPI# | Maturity | 24,491 | — | 24,491 | ||||||||||||||||||
|
|
|
|
|
| |||||||||||||||||||||
| $ | (1,008,344 | ) | $ | — | $ | (1,008,344 | ) | |||||||||||||||||||
|
|
|
|
|
| |||||||||||||||||||||
| # | Variable interest rate based on the rate of inflation as determined by the Consumer Price Index (CPI). |
CENTRALLY CLEARED INTEREST RATE SWAPS (see Note D)
| Rate Type | ||||||||||||||||||||||||||||||
| Notional Amount (000) | Termination Date | Payments made by the Fund | Payments received by the Fund | Payment Frequency Paid/ Received | Market Value | Upfront Premiums Paid (Received) | Unrealized Appreciation/ (Depreciation) | |||||||||||||||||||||||
| USD | 8,270 | 12/11/2021 | | 3 Month LIBOR | | 2.868% | Quarterly/Semi-Annual | $ | 422,655 | $ | — | $ | 422,655 | |||||||||||||||||
| USD | 3,350 | 01/07/2022 | | 3 Month LIBOR | | 2.488% | Quarterly/Semi-Annual | 141,277 | — | 141,277 | ||||||||||||||||||||
| USD | 7,720 | 04/01/2022 | | 3 Month LIBOR | | 1.863% | Quarterly/Semi-Annual | 221,923 | — | 221,923 | ||||||||||||||||||||
| USD | 1,195 | 02/05/2025 | | 3 Month LIBOR | | 1.361% | Quarterly/Semi-Annual | 54,113 | — | 54,113 | ||||||||||||||||||||
| USD | 2,685 | 02/06/2025 | | 3 Month LIBOR | | 1.419% | Quarterly/Semi-Annual | 129,281 | — | 129,281 | ||||||||||||||||||||
| USD | 2,020 | 02/07/2030 | | 3 Month LIBOR | | 1.624% | Quarterly/Semi-Annual | 193,552 | — | 193,552 | ||||||||||||||||||||
| USD | 1,200 | 04/01/2039 | 0.780% | | 3 Month LIBOR | | Semi-Annual/Quarterly | 1,817 | (48 | ) | 1,865 | |||||||||||||||||||
| USD | 1,100 | 04/01/2039 | 0.932% | | 3 Month LIBOR | | Semi-Annual/Quarterly | (27,731 | ) | — | (27,731 | ) | ||||||||||||||||||
| USD | 1,000 | 04/01/2039 | 0.774% | | 3 Month LIBOR | | Semi-Annual/Quarterly | 3,927 | — | 3,927 | ||||||||||||||||||||
| USD | 5,500 | 04/01/2044 | | 3 Month LIBOR | | 2.013% | Quarterly/Semi-Annual | 1,494,103 | — | 1,494,103 | ||||||||||||||||||||
| USD | 4,200 | 04/01/2054 | 1.583% | | 3 Month LIBOR | | Semi-Annual/Quarterly | (994,167 | ) | — | (994,167 | ) | ||||||||||||||||||
|
|
|
|
|
| |||||||||||||||||||||||||
| $ | 1,640,750 | $ | (48 | ) | $ | 1,640,798 | ||||||||||||||||||||||||
|
|
|
|
|
| |||||||||||||||||||||||||
| 34 | AB TAX-AWARE FIXED INCOME OPPORTUNITIES PORTFOLIO | abfunds.com | |
PORTFOLIO OF INVESTMENTS (continued)
CREDIT DEFAULT SWAPS (see Note D)
| Swap Counterparty & Referenced Obligation | Fixed Rate (Pay) Receive | Payment Frequency | Implied Credit Spread at April 30, 2020 | Notional Amount (000) | Market Value | Upfront Premiums Paid (Received) | Unrealized Appreciation/ (Depreciation) | |||||||||||||||||||||||||
Sale Contracts | ||||||||||||||||||||||||||||||||
Citigroup Global Markets, Inc. |
| |||||||||||||||||||||||||||||||
CDX-CMBX.NA.BBB- Series 6, 05/11/2063* | 3.00 | % | Monthly | 13.94 | % | USD | 1,000 | $ | (325,083 | ) | $ | (130,048 | ) | $ | (195,035 | ) | ||||||||||||||||
CDX-CMBX.NA.BBB- Series 6, 05/11/2063* | 3.00 | Monthly | 13.94 | USD | 515 | (167,375 | ) | (60,966 | ) | (106,409 | ) | |||||||||||||||||||||
CDX-CMBX.NA.BBB- Series 6, 05/11/2063* | 3.00 | Monthly | 13.94 | USD | 17 | (5,526 | ) | (1,683 | ) | (3,843 | ) | |||||||||||||||||||||
Credit Suisse International |
| |||||||||||||||||||||||||||||||
CDX-CMBX.NA.BBB- Series 6, 05/11/2063* | 3.00 | Monthly | 13.94 | USD | 1,000 | (325,083 | ) | (132,313 | ) | (192,770 | ) | |||||||||||||||||||||
CDX-CMBX.NA.BBB- Series 6, 05/11/2063* | 3.00 | Monthly | 13.94 | USD | 114 | (37,050 | ) | (11,405 | ) | (25,645 | ) | |||||||||||||||||||||
CDX-CMBX.NA.BBB- Series 6, 05/11/2063* | 3.00 | Monthly | 13.94 | USD | 171 | (55,589 | ) | (16,668 | ) | (38,921 | ) | |||||||||||||||||||||
CDX-CMBX.NA.BBB- Series 6, 05/11/2063* | 3.00 | Monthly | 13.94 | USD | 9 | (2,926 | ) | (899 | ) | (2,027 | ) | |||||||||||||||||||||
Goldman Sachs International |
| |||||||||||||||||||||||||||||||
CDX-CMBX.NA.BBB- Series 6, 05/11/2063* | 3.00 | Monthly | 13.94 | USD | 750 | (243,750 | ) | (71,902 | ) | (171,848 | ) | |||||||||||||||||||||
CDX-CMBX.NA.BBB- Series 6, 05/11/2063* | 3.00 | Monthly | 13.94 | USD | 149 | (48,437 | ) | (14,097 | ) | (34,340 | ) | |||||||||||||||||||||
JPMorgan Chase Bank, NA |
| |||||||||||||||||||||||||||||||
CDX-CMBX.NA.A Series 6, 05/11/2063* | 2.00 | Monthly | 6.85 | USD | 2,750 | (388,514 | ) | 45,268 | (433,782 | ) | ||||||||||||||||||||||
|
|
|
|
|
| |||||||||||||||||||||||||||
| $ | (1,599,333 | ) | $ | (394,713 | ) | $ | (1,204,620 | ) | ||||||||||||||||||||||||
|
|
|
|
|
| |||||||||||||||||||||||||||
| * | Termination date |
INFLATION (CPI) SWAPS (see Note D)
| Rate Type | ||||||||||||||||||||||||||||||
| Swap Counterparty | Notional Amount (000) | Termination Date | Payments made by the Fund | Payments received by the Fund | Payment Frequency Paid/ Received | Market Value | Upfront Premiums Paid (Received) | Unrealized Appreciation/ (Depreciation) | ||||||||||||||||||||||
Citibank, NA | USD | 3,600 | 10/29/2021 | 2.125% | CPI# | Maturity | $ | (144,031 | ) | $ | — | $ | (144,031 | ) | ||||||||||||||||
JPMorgan Chase Bank, NA | USD | 2,500 | 07/15/2022 | 1.775% | CPI# | Maturity | (83,232 | ) | — | (83,232 | ) | |||||||||||||||||||
JPMorgan Chase Bank, NA | USD | 2,000 | 07/15/2025 | 2.087% | CPI# | Maturity | (139,428 | ) | — | (139,428 | ) | |||||||||||||||||||
|
|
|
|
|
| |||||||||||||||||||||||||
| $ | (366,691 | ) | $ | — | $ | (366,691 | ) | |||||||||||||||||||||||
|
|
|
|
|
| |||||||||||||||||||||||||
| # | Variable interest rate based on the rate of inflation as determined by the Consumer Price Index (CPI). |
| abfunds.com | AB TAX-AWARE FIXED INCOME OPPORTUNITIES PORTFOLIO | 35 | |
PORTFOLIO OF INVESTMENTS (continued)
INTEREST RATE SWAPS (see Note D)
| Rate Type | ||||||||||||||||||||||||||||||
| Swap Counterparty | Notional Amount (000) | Termination Date | Payments made by the Fund | Payments received by the Fund | Payment Frequency Paid/ Received | Market Value | Upfront Premiums Paid (Received) | Unrealized Appreciation/ (Depreciation) | ||||||||||||||||||||||
Citibank, NA | USD | 2,220 | 10/09/2029 | 1.120% | SIFMA* | Quarterly/ Quarterly | $ | (109,192 | ) | $ | — | $ | (109,192 | ) | ||||||||||||||||
Citibank, NA | USD | 2,220 | 10/09/2029 | 1.125% | SIFMA* | Quarterly/ Quarterly | (110,340 | ) | — | (110,340 | ) | |||||||||||||||||||
|
|
|
|
|
| |||||||||||||||||||||||||
| $ | (219,532 | ) | $ | — | $ | (219,532 | ) | |||||||||||||||||||||||
|
|
|
|
|
| |||||||||||||||||||||||||
| * | Variable interest rate based on the Securities Industry & Financial Markets Association (SIFMA) Municipal Swap Index. |
| (a) | Security is exempt from registration under Rule 144A of the Securities Act of 1933. These securities are considered restricted, but liquid and may be resold in transactions exempt from registration, normally to qualified institutional buyers. At April 30, 2020, the aggregate market value of these securities amounted to $7,228,008 or 9.5% of net assets. |
| (b) | When-Issued or delayed delivery security. |
| (c) | An auction rate security whose interest rate resets at each auction date. Auctions are typically held every week or month. The rate shown is as of April 30, 2020 and the aggregate market value of these securities amounted to $1,025,000 or 1.35% of net assets. |
| (d) | Defaulted. |
| (e) | Non-income producing security. |
| (f) | Illiquid security. |
| (g) | Restricted and illiquid security. |
| Restricted & Illiquid Securities | Acquisition Date | Cost | Market Value | Percentage of Net Assets | ||||||||||||
Louisiana Public Facilities Authority (Louisiana Pellets, Inc.) Series 2014A | ||||||||||||||||
7,50%, 07/01/2023 | 07/31/2014 | $ | 173,773 | $ | 2 | 0.00 | % | |||||||||
| (h) | Security is exempt from registration under Rule 144A of the Securities Act of 1933. These securities, which represent 0.81% of net assets as of April 30, 2020, are considered illiquid and restricted. Additional information regarding such securities follows: |
| 144A/Restricted & Illiquid Securities | Acquisition Date | Cost | Market Value | Percentage of Net Assets | ||||||||||||
BAMLL Commercial Mortgage Securities Trust | ||||||||||||||||
1.814%, 11/15/2033 | 12/04/2017 | $ | 250,000 | $ | 241,265 | 0.32 | % | |||||||||
Massachusetts Development Finance Agency (Zero Waste Solutions LLC) Series 2017 | ||||||||||||||||
8.00%, 12/01/2022 | 12/07/2017 | 291,895 | 268,430 | 0.35 | % | |||||||||||
Massachusetts Development Finance Agency (Zero Waste Solutions LLC) Series 2017A | ||||||||||||||||
7.75%, 12/01/2044 | 12/07/2017 | 140,000 | 102,589 | 0.14 | % | |||||||||||
| (i) | Floating Rate Security. Stated interest/floor/ceiling rate was in effect at April 30, 2020. |
| 36 | AB TAX-AWARE FIXED INCOME OPPORTUNITIES PORTFOLIO | abfunds.com | |
PORTFOLIO OF INVESTMENTS (continued)
| (j) | Pay-In-Kind Payments (PIK). The issuer may pay cash interest and/or interest in additional debt securities. Rates shown are the rates in effect at April 30, 2020. |
| (k) | Affiliated investments. |
| (l) | The rate shown represents the 7-day yield as of period end. |
| (m) | To obtain a copy of the fund’s shareholder report, please go to the Securities and Exchange Commission’s website at www.sec.gov, or call AB at (800) 227-4618. |
As of April 30, 2020, the Fund’s percentages of investments in municipal bonds that are insured and in insured municipal bonds that have been pre-refunded or escrowed to maturity are 3.6% and 0.0%, respectively.
Glossary:
ABS – Asset-Backed Securities
AGC – Assured Guaranty Corporation
AGM – Assured Guaranty Municipal
CDX-CMBX.NA – North American Commercial Mortgage-Backed Index
CDX-NAIG – North American Investment Grade Credit Default Swap Index
CLO – Collateralized Loan Obligations
CMBS – Commercial Mortgage-Backed Securities
COP – Certificate of Participation
ETM – Escrowed to Maturity
LIBOR – London Interbank Offered Rates
NATL – National Interstate Corporation
See notes to financial statements.
| abfunds.com | AB TAX-AWARE FIXED INCOME OPPORTUNITIES PORTFOLIO | 37 | |
STATEMENT OF ASSETS & LIABILITIES
April 30, 2020 (unaudited)
| Assets |
| |||
Investments in securities, at value | ||||
Unaffiliated issuers (cost $79,825,937) | $ | 74,891,506 | ||
Affiliated issuers (cost $88,082) | 88,082 | |||
Cash | 3,359 | |||
Cash collateral due from broker | 3,371,658 | |||
Interest receivable | 985,580 | |||
Receivable for capital stock sold | 525,339 | |||
Affiliated dividends receivable | 721 | |||
Receivable for variation margin on centrally cleared swaps | 500 | |||
|
| |||
Total assets | 79,866,745 | |||
|
| |||
| Liabilities |
| |||
Market value on credit default swaps (net premiums received $394,713) | 1,599,333 | |||
Payable for capital stock redeemed | 1,388,881 | |||
Payable for investment securities purchased | 506,644 | |||
Unrealized depreciation on inflation swaps | 366,691 | |||
Unrealized depreciation on interest rate swaps | 219,532 | |||
Distribution fee payable | 4,787 | |||
Directors’ fees payable | 3,978 | |||
Advisory fee payable | 3,038 | |||
Dividends payable | 1,825 | |||
Transfer Agent fee payable | 1,262 | |||
Accrued expenses and other liabilities | 48,154 | |||
|
| |||
Total liabilities | 4,144,125 | |||
|
| |||
Net Assets | $ | 75,722,620 | ||
|
| |||
| Composition of Net Assets |
| |||
Capital stock, at par | $ | 7,695 | ||
Additional paid-in capital | 83,526,262 | |||
Accumulated loss | (7,811,337 | ) | ||
|
| |||
| $ | 75,722,620 | |||
|
| |||
Net Asset Value Per Share—21 billion shares of capital stock authorized, $.001 par value
| Class | Net Assets | Shares Outstanding | Net Asset Value | |||||||||
| ||||||||||||
| A | $ | 18,197,376 | 1,849,308 | $ | 9.84 | * | ||||||
| ||||||||||||
| C | $ | 1,538,668 | 156,366 | $ | 9.84 | |||||||
| ||||||||||||
| Advisor | $ | 55,986,576 | 5,689,119 | $ | 9.84 | |||||||
| ||||||||||||
| * | The maximum offering price per share for Class A shares was $10.14 which reflects a sales charge of 3.00%. |
See notes to financial statements.
| 38 | AB TAX-AWARE FIXED INCOME OPPORTUNITIES PORTFOLIO | abfunds.com | |
STATEMENT OF OPERATIONS
Six Months Ended April 30, 2020 (unaudited)
| Investment Income | ||||||||
Interest | $ | 1,474,099 | ||||||
Dividends | ||||||||
Affiliated issuers | 19,578 | |||||||
Unaffiliated issuers | 9,712 | $ | 1,503,389 | |||||
|
| |||||||
| Expenses | ||||||||
Advisory fee (see Note B) | 205,217 | |||||||
Distribution fee—Class A | 18,458 | |||||||
Distribution fee—Class C | 8,413 | |||||||
Transfer agency—Class A | 2,970 | |||||||
Transfer agency—Class C | 343 | |||||||
Transfer agency—Advisor Class | 14,570 | |||||||
Custodian | 49,429 | |||||||
Administrative | 40,177 | |||||||
Registration fees | 29,554 | |||||||
Audit and tax | 28,409 | |||||||
Legal | 19,158 | |||||||
Directors’ fees | 11,609 | |||||||
Printing | 10,483 | |||||||
Miscellaneous | 5,833 | |||||||
|
| |||||||
Total expenses | 444,623 | |||||||
Less: expenses waived and reimbursed by the Adviser (see Note B) | (189,331 | ) | ||||||
|
| |||||||
Net expenses | 255,292 | |||||||
|
| |||||||
Net investment income | 1,248,097 | |||||||
|
| |||||||
| Realized and Unrealized Loss on Investment Transactions | ||||||||
Net realized loss on: | ||||||||
Investment transactions | (439,708 | ) | ||||||
Swaps | (179,989 | ) | ||||||
Net change in unrealized appreciation/depreciation of: | ||||||||
Investments(a) | (8,461,613 | ) | ||||||
Swaps | (2,007,102 | ) | ||||||
|
| |||||||
Net loss on investment transactions | (11,088,412 | ) | ||||||
|
| |||||||
Net Decrease in Net Assets from Operations | $ | (9,840,315 | ) | |||||
|
|
| (a) | Net of increase in accrued foreign capital gains taxes of $456. |
See notes to financial statements.
| abfunds.com | AB TAX-AWARE FIXED INCOME OPPORTUNITIES PORTFOLIO | 39 | |
STATEMENT OF CHANGES IN NET ASSETS
| Six Months Ended April 30, 2020 (unaudited) | Year Ended October 31, 2019 | |||||||
| Increase (Decrease) in Net Assets from Operations | ||||||||
Net investment income | $ | 1,248,097 | $ | 2,028,913 | ||||
Net realized loss on investment transactions | (619,697 | ) | (480,905 | ) | ||||
Net change in unrealized appreciation/depreciation of investments | (10,468,715 | ) | 4,204,994 | |||||
|
|
|
| |||||
Net increase (decrease) in net assets from operations | (9,840,315 | ) | 5,753,002 | |||||
Distributions to Shareholders |
| |||||||
Class A | (208,176 | ) | (220,518 | ) | ||||
Class C | (17,239 | ) | (24,277 | ) | ||||
Advisor Class | (1,114,776 | ) | (1,854,885 | ) | ||||
| Capital Stock Transactions | ||||||||
Net increase | 6,256,573 | 13,126,054 | ||||||
|
|
|
| |||||
Total increase (decrease) | (4,923,933 | ) | 16,779,376 | |||||
| Net Assets | ||||||||
Beginning of period | 80,646,553 | 63,867,177 | ||||||
|
|
|
| |||||
End of period | $ | 75,722,620 | $ | 80,646,553 | ||||
|
|
|
| |||||
See notes to financial statements.
| 40 | AB TAX-AWARE FIXED INCOME OPPORTUNITIES PORTFOLIO | abfunds.com | |
NOTES TO FINANCIAL STATEMENTS
April 30, 2020 (unaudited)
NOTE A
Significant Accounting Policies
AB Bond Fund, Inc. (the “Company”) is registered under the Investment Company Act of 1940 as an open-end management investment company. The Company, which is a Maryland corporation, operates as a series company comprised of ten portfolios currently in operation. Each portfolio is considered to be a separate entity for financial reporting and tax purposes. This report relates only to the AB Tax-Aware Fixed Income Opportunities Portfolio (the “Fund”) (formerly known as AB Tax-Aware Fixed Income Portfolio), a diversified portfolio. The Fund has authorized the issuance of Class A, Class B, Class C, Advisor Class, Class T, Class 1 and Class 2 shares. Class B, Class T, Class 1 and Class 2 shares have not been issued. Class A shares are sold with a front-end sales charge of up to 3.0% for purchases not exceeding $500,000. With respect to purchases of $500,000 or more, Class A shares redeemed within one year of purchase may be subject to a contingent deferred sales charge of 1%. Class C shares are subject to a contingent deferred sales charge of 1% on redemptions made within the first year after purchase, and 0% after the first year of purchase. Class C shares will automatically convert to Class A shares ten years after the end of the calendar month of purchase. Advisor Class shares are sold without any initial or contingent deferred sales charge and are not subject to ongoing distribution expenses. All seven classes of shares have identical voting, dividend, liquidation and other rights, except that the classes bear different distribution and transfer agency expenses. Each class has exclusive voting rights with respect to its distribution plan. The financial statements have been prepared in conformity with U.S. generally accepted accounting principles (“U.S. GAAP”) which require management to make certain estimates and assumptions that affect the reported amounts of assets and liabilities in the financial statements and amounts of income and expenses during the reporting period. Actual results could differ from those estimates. The Fund is an investment company under U.S. GAAP and follows the accounting and reporting guidance applicable to investment companies. The following is a summary of significant accounting policies followed by the Fund.
1. Security Valuation
Portfolio securities are valued at their current market value determined on the basis of market quotations or, if market quotations are not readily available or are deemed unreliable, at “fair value” as determined in accordance with procedures established by and under the general supervision of the Company’s Board of Directors (the “Board”).
In general, the market values of securities which are readily available and deemed reliable are determined as follows: securities listed on a national securities exchange (other than securities listed on the NASDAQ Stock
| abfunds.com | AB TAX-AWARE FIXED INCOME OPPORTUNITIES PORTFOLIO | 41 | |
NOTES TO FINANCIAL STATEMENTS (continued)
Market, Inc. (“NASDAQ”)) or on a foreign securities exchange are valued at the last sale price at the close of the exchange or foreign securities exchange. If there has been no sale on such day, the securities are valued at the last traded price from the previous day. Securities listed on more than one exchange are valued by reference to the principal exchange on which the securities are traded; securities listed only on NASDAQ are valued in accordance with the NASDAQ Official Closing Price; listed or over the counter (“OTC”) market put or call options are valued at the mid level between the current bid and ask prices. If either a current bid or current ask price is unavailable, AllianceBernstein L.P. (the “Adviser”) will have discretion to determine the best valuation (e.g., last trade price in the case of listed options); open futures are valued using the closing settlement price or, in the absence of such a price, the most recent quoted bid price. If there are no quotations available for the day of valuation, the last available closing settlement price is used; U.S. Government securities and any other debt instruments having 60 days or less remaining until maturity are generally valued at market by an independent pricing vendor, if a market price is available. If a market price is not available, the securities are valued at amortized cost. This methodology is commonly used for short term securities that have an original maturity of 60 days or less, as well as short term securities that had an original term to maturity that exceeded 60 days. In instances when amortized cost is utilized, the Valuation Committee (the “Committee”) must reasonably conclude that the utilization of amortized cost is approximately the same as the fair value of the security. Such factors the Committee will consider include, but are not limited to, an impairment of the creditworthiness of the issuer or material changes in interest rates. Fixed-income securities, including mortgage-backed and asset-backed securities, may be valued on the basis of prices provided by a pricing service or at a price obtained from one or more of the major broker-dealers. In cases where broker-dealer quotes are obtained, the Adviser may establish procedures whereby changes in market yields or spreads are used to adjust, on a daily basis, a recently obtained quoted price on a security. Swaps and other derivatives are valued daily, primarily using independent pricing services, independent pricing models using market inputs, as well as third party broker-dealers or counterparties. Open end mutual funds are valued at the closing net asset value per share, while exchange traded funds are valued at the closing market price per share.
Securities for which market quotations are not readily available (including restricted securities) or are deemed unreliable are valued at fair value as deemed appropriate by the Adviser. Factors considered in making this determination may include, but are not limited to, information obtained by contacting the issuer, analysts, analysis of the issuer’s financial statements or other available documents. In addition, the Fund may use fair value pricing for securities primarily traded in non-U.S. markets because most foreign markets close well before the Fund values its securities at 4:00 p.m.,
| 42 | AB TAX-AWARE FIXED INCOME OPPORTUNITIES PORTFOLIO | abfunds.com | |
NOTES TO FINANCIAL STATEMENTS (continued)
Eastern Time. The earlier close of these foreign markets gives rise to the possibility that significant events, including broad market moves, may have occurred in the interim and may materially affect the value of those securities. To account for this, the Fund generally values many of its foreign equity securities using fair value prices based on third party vendor modeling tools to the extent available.
2. Fair Value Measurements
In accordance with U.S. GAAP regarding fair value measurements, fair value is defined as the price that the Fund would receive to sell an asset or pay to transfer a liability in an orderly transaction between market participants at the measurement date. U.S. GAAP establishes a framework for measuring fair value, and a three-level hierarchy for fair value measurements based upon the transparency of inputs to the valuation of an asset or liability (including those valued based on their market values as described in Note A.1 above). Inputs may be observable or unobservable and refer broadly to the assumptions that market participants would use in pricing the asset or liability. Observable inputs reflect the assumptions market participants would use in pricing the asset or liability based on market data obtained from sources independent of the Fund. Unobservable inputs reflect the Fund’s own assumptions about the assumptions that market participants would use in pricing the asset or liability based on the best information available in the circumstances. Each investment is assigned a level based upon the observability of the inputs which are significant to the overall valuation. The three-tier hierarchy of inputs is summarized below.
| • | Level 1—quoted prices in active markets for identical investments |
| • | Level 2—other significant observable inputs (including quoted prices for similar investments, interest rates, prepayment speeds, credit risk, etc.) |
| • | Level 3—significant unobservable inputs (including the Fund’s own assumptions in determining the fair value of investments) |
The fair value of debt instruments, such as bonds, and over-the-counter derivatives is generally based on market price quotations, recently executed market transactions (where observable) or industry recognized modeling techniques and are generally classified as Level 2. Pricing vendor inputs to Level 2 valuations may include quoted prices for similar investments in active markets, interest rate curves, coupon rates, currency rates, yield curves, option adjusted spreads, default rates, credit spreads and other unique security features in order to estimate the relevant cash flows which are then discounted to calculate fair values. If these inputs are unobservable and significant to the fair value, these investments will be classified as Level 3.
Valuations of mortgage-backed or other asset-backed securities, by pricing vendors, are based on both proprietary and industry recognized models and
| abfunds.com | AB TAX-AWARE FIXED INCOME OPPORTUNITIES PORTFOLIO | 43 | |
NOTES TO FINANCIAL STATEMENTS (continued)
discounted cash flow techniques. Significant inputs to the valuation of these instruments are value of the collateral, the rates and timing of delinquencies, the rates and timing of prepayments, and default and loss expectations, which are driven in part by housing prices for residential mortgages. Significant inputs are determined based on relative value analyses, which incorporate comparisons to instruments with similar collateral and risk profiles, including relevant indices. Mortgage and asset-backed securities for which management has collected current observable data through pricing services are generally categorized within Level 2. Those investments for which current observable data has not been provided are classified as Level 3.
Other fixed income investments, including non-U.S. government and corporate debt, are generally valued using quoted market prices, if available, which are typically impacted by current interest rates, maturity dates and any perceived credit risk of the issuer. Additionally, in the absence of quoted market prices, these inputs are used by pricing vendors to derive a valuation based upon industry or proprietary models which incorporate issuer specific data with relevant yield/spread comparisons with more widely quoted bonds with similar key characteristics. Those investments for which there are observable inputs are classified as Level 2. Where the inputs are not observable, the investments are classified as Level 3.
The following table summarizes the valuation of the Fund’s investments by the above fair value hierarchy levels as of April 30, 2020:
Investments in Securities: | Level 1 | Level 2 | Level 3 | Total | ||||||||||||
Assets: | ||||||||||||||||
Long-Term Municipal Bonds | $ | – 0 | – | $ | 66,878,048 | $ | – 0 | – | $ | 66,878,048 | ||||||
Short-Term Municipal Notes | – 0 | – | 1,100,000 | – 0 | – | 1,100,000 | ||||||||||
Governments – Treasuries | – 0 | – | 2,599,125 | – 0 | – | 2,599,125 | ||||||||||
Collateralized Mortgage Obligations | – 0 | – | 2,247,013 | – 0 | – | 2,247,013 | ||||||||||
Corporates – Non-Investment Grade | – 0 | – | 843,040 | – 0 | – | 843,040 | ||||||||||
Commercial Mortgage-Backed Securities | – 0 | – | 497,416 | – 0 | – | 497,416 | ||||||||||
Asset-Backed Securities | – 0 | – | 490,415 | – 0 | – | 490,415 | ||||||||||
Collateralized Loan Obligations | – 0 | – | 236,449 | – 0 | – | 236,449 | ||||||||||
Short-Term Investments | 88,082 | – 0 | – | – 0 | – | 88,082 | ||||||||||
|
|
|
|
|
|
|
| |||||||||
Total Investments in Securities | 88,082 | 74,891,506 | – 0 | – | 74,979,588 | |||||||||||
Other Financial Instruments(a): | ||||||||||||||||
Assets: | ||||||||||||||||
Centrally Cleared Inflation (CPI) Swaps | – 0 | – | 24,491 | – 0 | – | 24,491 | (b) | |||||||||
Centrally Cleared Interest Rate Swaps | – 0 | – | 2,662,648 | – 0 | – | 2,662,648 | (b) | |||||||||
Liabilities: | ||||||||||||||||
Centrally Cleared Credit Default Swaps | – 0 | – | (14,271 | ) | – 0 | – | (14,271 | )(b) | ||||||||
Centrally Cleared Inflation (CPI) Swaps | – 0 | – | (1,032,835 | ) | – 0 | – | (1,032,835 | )(b) | ||||||||
Centrally Cleared Interest Rate Swaps | – 0 | – | (1,021,898 | ) | – 0 | – | (1,021,898 | )(b) | ||||||||
Credit Default Swaps | – 0 | – | (1,599,333 | ) | – 0 | – | (1,599,333 | ) | ||||||||
Inflation (CPI) Swaps | – 0 | – | (366,691 | ) | – 0 | – | (366,691 | ) | ||||||||
Interest Rate Swaps | – 0 | – | (219,532 | ) | – 0 | – | (219,532 | ) | ||||||||
|
|
|
|
|
|
|
| |||||||||
Total | $ | 88,082 | $ | 73,324,085 | $ | – 0 | – | $ | 73,412,167 | (c) | ||||||
|
|
|
|
|
|
|
| |||||||||
| 44 | AB TAX-AWARE FIXED INCOME OPPORTUNITIES PORTFOLIO | abfunds.com | |
NOTES TO FINANCIAL STATEMENTS (continued)
| (a) | Other financial instruments are derivative instruments, such as futures, forwards and swaps, which are valued at the unrealized appreciation/(depreciation) on the instrument. Other financial instruments may also include swaps with upfront premiums, options written and swaptions written which are valued at market value. |
| (b) | Only variation margin receivable/(payable) at period end is reported within the statement of assets and liabilities. This amount reflects cumulative unrealized appreciation/(depreciation) on futures and centrally cleared swaps as reported in the portfolio of investments. Where applicable, centrally cleared swaps with upfront premiums are presented here at market value. |
| (c) | Amounts of $174,344 and $248,011 for Asset-Backed Securities and Collateralized Loan Obligations, respectively, were transferred out of Level 3 into Level 2 as improved transparency of price inputs received from pricing vendors has increased the observability during the reporting period. |
3. Currency Translation
Assets and liabilities denominated in foreign currencies and commitments under forward currency exchange contracts are translated into U.S. dollars at the mean of the quoted bid and ask prices of such currencies against the U.S. dollar. Purchases and sales of portfolio securities are translated into U.S. dollars at the rates of exchange prevailing when such securities were acquired or sold. Income and expenses are translated into U.S. dollars at rates of exchange prevailing when accrued.
Net realized gain or loss on foreign currency transactions represents foreign exchange gains and losses from sales and maturities of foreign fixed income investments, holding of foreign currencies, currency gains or losses realized between the trade and settlement dates on foreign investment transactions, and the difference between the amounts of dividends, interest and foreign withholding taxes recorded on the Fund’s books and the U.S. dollar equivalent amounts actually received or paid. Net unrealized currency gains and losses from valuing foreign currency denominated assets and liabilities at period end exchange rates are reflected as a component of net unrealized appreciation or depreciation of foreign currency denominated assets and liabilities.
4. Taxes
It is the Fund’s policy to meet the requirements of the Internal Revenue Code applicable to regulated investment companies and to distribute all of its investment company taxable income and net realized gains, if any, to shareholders. Therefore, no provisions for federal income or excise taxes are required. The Fund may be subject to taxes imposed by countries in which it invests. Such taxes are generally based on income and/or capital gains earned or repatriated. Taxes are accrued and applied to net investment income, net realized gains and net unrealized appreciation/depreciation as such income and/or gains are earned.
In accordance with U.S. GAAP requirements regarding accounting for uncertainties in income taxes, management has analyzed the Fund’s tax positions taken or expected to be taken on federal and state income tax
| abfunds.com | AB TAX-AWARE FIXED INCOME OPPORTUNITIES PORTFOLIO | 45 | |
NOTES TO FINANCIAL STATEMENTS (continued)
returns for all open tax years (the current and the prior three tax years) and has concluded that no provision for income tax is required in the Fund’s financial statements.
5. Investment Income and Investment Transactions
Dividend income is recorded on the ex-dividend date or as soon as the Fund is informed of the dividend. Interest income is accrued daily. Investment transactions are accounted for on the date the securities are purchased or sold. Investment gains or losses are determined on the identified cost basis. The Fund amortizes premiums and accretes discounts as adjustments to interest income.
6. Class Allocations
All income earned and expenses incurred by the Fund are borne on a pro-rata basis by each outstanding class of shares, based on the proportionate interest in the Fund represented by the net assets of such class, except for class specific expenses which are allocated to the respective class. Expenses of the Company are charged proportionately to each fund or based on other appropriate methods. Realized and unrealized gains and losses are allocated among the various share classes based on respective net assets.
7. Dividends and Distributions
Dividends and distributions to shareholders, if any, are recorded on the ex-dividend date. Income dividends and capital gains distributions are determined in accordance with federal tax regulations and may differ from those determined in accordance with U.S. GAAP. To the extent these differences are permanent, such amounts are reclassified within the capital accounts based on their federal tax basis treatment; temporary differences do not require such reclassification.
NOTE B
Advisory Fee and Other Transactions with Affiliates
Under the terms of the investment advisory agreement, the Fund pays the Adviser an advisory fee at an annual rate of .45% of the first $2.5 billion, .40% of the excess over $2.5 billion up to $5 billion and .35% in excess of $5 billion of the Fund’s average daily net assets. The Adviser has agreed to waive its fees and bear certain expenses to the extent necessary to limit total operating expenses (excluding expenses associated with securities sold short, acquired fund fees and expenses other than the advisory fees of any AB mutual funds in which the Fund may invest, interest expense, taxes, extraordinary expenses, and brokerage commissions and other transaction costs), on an annual basis (the “Expense Caps”) to .75%, 1.50% and .50%, of average daily net assets for Class A, Class C and Advisor Class shares, respectively. For the six months ended April 30,
| 46 | AB TAX-AWARE FIXED INCOME OPPORTUNITIES PORTFOLIO | abfunds.com | |
NOTES TO FINANCIAL STATEMENTS (continued)
2020, such reimbursements/waivers amounted to $147,784. The Expense Caps may not be terminated before January 31, 2021.
Pursuant to the investment advisory agreement, the Fund may reimburse the Adviser for certain legal and accounting services provided to the Fund by the Adviser. For the six months ended April 30, 2020, the Adviser voluntarily agreed to waive such fees in the amount of $40,177.
The Fund compensates AllianceBernstein Investor Services, Inc. (“ABIS”), a wholly-owned subsidiary of the Adviser, under a Transfer Agency Agreement for providing personnel and facilities to perform transfer agency services for the Fund. ABIS may make payments to intermediaries that provide omnibus account services, sub-accounting services and/or networking services. Such compensation retained by ABIS amounted to $9,144 for the six months ended April 30, 2020.
AllianceBernstein Investments, Inc. (the “Distributor”), a wholly-owned subsidiary of the Adviser, serves as the distributor of the Fund’s shares. The Distributor has advised the Fund that it has retained front-end sales charges of $37 from the sale of Class A shares and received $297 in contingent deferred sales charges imposed upon redemptions by shareholders of Class C shares, for the six months ended April 30, 2020.
The Fund may invest in AB Government Money Market Portfolio (the “Government Money Market Portfolio”) which has a contractual annual advisory fee rate of .20% of the portfolio’s average daily net assets and bears its own expenses. The Adviser has contractually agreed to waive ..10% of the advisory fee of Government Money Market Portfolio (resulting in a net advisory fee of .10%) until August 31, 2020. In connection with the investment by the Fund in Government Money Market Portfolio, the Adviser has contractually agreed to waive its advisory fee from the Fund in an amount equal to the Fund’s pro rata share of the effective advisory fee of Government Money Market Portfolio, as borne indirectly by the Fund as an acquired fund fee and expense. For the six months ended April 30, 2020, such waiver amounted to $1,370.
A summary of the Fund’s transactions in AB mutual funds for the six months ended April 30, 2020 is as follows:
Fund | Market Value 10/31/19 (000) | Purchases at Cost (000) | Sales Proceeds (000) | Market Value 4/30/20 (000) | Dividend Income (000) | |||||||||||||||
Government Money Market Portfolio | $ | – 0 | – | $ | 46,946 | $ | 46,858 | $ | 88 | $ | 20 | |||||||||
| abfunds.com | AB TAX-AWARE FIXED INCOME OPPORTUNITIES PORTFOLIO | 47 | |
NOTES TO FINANCIAL STATEMENTS (continued)
During the second quarter of 2018, AXA S.A. (“AXA”), a French holding company for the AXA Group, completed the sale of a minority stake in its subsidiary, AXA Equitable Holdings, Inc. (now named Equitable Holdings, Inc.) (“Equitable”), through an initial public offering. Equitable is the holding company for a diverse group of financial services companies, including an approximately 64.9% economic interest in the Adviser and a 100% interest in AllianceBernstein Corporation, the general partner of the Adviser. Since the initial sale, AXA has completed additional offerings, most recently during the fourth quarter of 2019. As a result, AXA currently owns less than 10% of the outstanding shares of common stock of Equitable, and no longer owns a controlling interest in Equitable. AXA previously announced its intention to sell its entire interest in Equitable over time, subject to market conditions and other factors (the “Plan”). Most of AXA’s remaining Equitable shares are to be delivered on redemption of AXA bonds mandatorily exchangeable into Equitable shares and maturing in May 2021. AXA retains sole discretion to determine the timing of any future sales of its remaining shares of Equitable common stock.
Sales under the Plan that were completed on November 13, 2019 resulted in the indirect transfer of a “controlling block” of voting securities of the Adviser (a “Change of Control Event”) and may have been deemed to have been an “assignment” causing a termination of the Fund’s investment advisory and administration agreements. In order to ensure that investment advisory and administration services could continue uninterrupted in the event of a Change of Control Event, the Board previously approved new investment advisory and administration agreements with the Adviser, and shareholders of the Funds subsequently approved the new investment advisory agreement. These agreements became effective on November 13, 2019.
NOTE C
Distribution Services Agreement
The Fund has adopted a Distribution Services Agreement (the “Agreement”) pursuant to Rule 12b-1 under the Investment Company Act of 1940. Under the Agreement, the Fund pays distribution and servicing fees to the Distributor at an annual rate of up to 0.30% of the Fund’s average daily net assets attributable to Class A shares and 1% of the Fund’s average daily net assets attributable to Class C shares. The fees are accrued daily and paid monthly. The Agreement provides that the Distributor will use such payments in their entirety for distribution assistance and promotional activities. Since the commencement of the Fund’s operations, the Distributor has incurred expenses in excess of the distribution costs reimbursed by the Fund in the amount of $17,309 for Class C shares. While such costs may be recovered from the Fund in future periods so long as the Agreement is in effect, the rate of the distribution and servicing fees payable under the
| 48 | AB TAX-AWARE FIXED INCOME OPPORTUNITIES PORTFOLIO | abfunds.com | |
NOTES TO FINANCIAL STATEMENTS (continued)
Agreement may not be increased without a shareholder vote. In accordance with the Agreement, there is no provision for recovery of unreimbursed distribution costs incurred by the Distributor beyond the current fiscal year for Class A shares. The Agreement also provides that the Adviser may use its own resources to finance the distribution of the Fund’s shares.
NOTE D
Investment Transactions
Purchases and sales of investment securities (excluding short-term investments) for the six months ended April 30, 2020 were as follows:
| Purchases | Sales | |||||||
Investment securities (excluding U.S. government securities) | $ | 33,581,296 | $ | 29,561,841 | ||||
U.S. government securities | 8,195,369 | 9,444,182 | ||||||
The cost of investments for federal income tax purposes was substantially the same as the cost for financial reporting purposes. Accordingly, gross unrealized appreciation and unrealized depreciation are as follows:
Gross unrealized appreciation | $ | 3,613,246 | ||
Gross unrealized depreciation | (9,724,619 | ) | ||
|
| |||
Net unrealized depreciation | $ | (6,111,373 | ) | |
|
|
1. Derivative Financial Instruments
The Fund may use derivatives in an effort to earn income and enhance returns, to replace more traditional direct investments, to obtain exposure to otherwise inaccessible markets (collectively, “investment purposes”), or to hedge or adjust the risk profile of its portfolio.
The principal types of derivatives utilized by the Fund, as well as the methods in which they may be used are:
| • | Swaps |
The Fund may enter into swaps to hedge its exposure to interest rates or credit risk. A swap is an agreement that obligates two parties to exchange a series of cash flows at specified intervals based upon or calculated by reference to changes in specified prices or rates for a specified amount of an underlying asset. The payment flows are usually netted against each other, with the difference being paid by one party to the other. In addition, collateral may be pledged or received by the Fund in accordance with the terms of the respective swaps to provide value and recourse to the Fund or its counterparties in the event of default, bankruptcy or insolvency by one of the parties to the swap.
| abfunds.com | AB TAX-AWARE FIXED INCOME OPPORTUNITIES PORTFOLIO | 49 | |
NOTES TO FINANCIAL STATEMENTS (continued)
Risks may arise as a result of the failure of the counterparty to the swap to comply with the terms of the swap. The loss incurred by the failure of a counterparty is generally limited to the net interim payment to be received by the Fund, and/or the termination value at the end of the contract. Therefore, the Fund considers the creditworthiness of each counterparty to a swap in evaluating potential counterparty risk. This risk is mitigated by having a netting arrangement between the Fund and the counterparty and by the posting of collateral by the counterparty to the Fund to cover the Fund’s exposure to the counterparty. Additionally, risks may arise from unanticipated movements in interest rates or in the value of the underlying securities. The Fund accrues for the interim payments on swaps on a daily basis, with the net amount recorded within unrealized appreciation/depreciation of swaps on the statement of assets and liabilities, where applicable. Once the interim payments are settled in cash, the net amount is recorded as realized gain/(loss) on swaps on the statement of operations, in addition to any realized gain/(loss) recorded upon the termination of swaps. Upfront premiums paid or received for OTC swaps are recognized as cost or proceeds on the statement of assets and liabilities and are amortized on a straight line basis over the life of the contract. Amortized upfront premiums are included in net realized gain/(loss) from swaps on the statement of operations. Fluctuations in the value of swaps are recorded as a component of net change in unrealized appreciation/depreciation of swaps on the statement of operations.
Certain standardized swaps, including certain interest rate swaps and credit default swaps, are (or soon will be) subject to mandatory central clearing. Cleared swaps are transacted through futures commission merchants (“FCMs”) that are members of central clearinghouses, with the clearinghouse serving as central counterparty, similar to transactions in futures contracts. Centralized clearing will be required for additional categories of swaps on a phased-in basis based on requirements published by the Securities and Exchange Commission and Commodity Futures Trading Commission.
At the time the Fund enters into a centrally cleared swap, the Fund deposits and maintains as collateral an initial margin with the broker, as required by the clearinghouse on which the transaction is effected. Such amount is shown as cash collateral due from broker on the statement of assets and liabilities. Pursuant to the contract, the Fund agrees to receive from or pay to the broker an amount of cash equal to the daily fluctuation in the value of the contract. Such receipts or payments are known as variation margin and are recorded by the Fund as unrealized gains or losses. Risks may arise from the potential inability of a counterparty to meet the terms of the contract. The
| 50 | AB TAX-AWARE FIXED INCOME OPPORTUNITIES PORTFOLIO | abfunds.com | |
NOTES TO FINANCIAL STATEMENTS (continued)
credit/counterparty risk for centrally cleared swaps is generally less than non-centrally cleared swaps, since the clearinghouse, which is the issuer or counterparty to each centrally cleared swap, has robust risk mitigation standards, including the requirement to provide initial and variation margin. When the contract is closed, the Fund records a realized gain or loss equal to the difference between the value of the contract at the time it was opened and the time it was closed.
Interest Rate Swaps:
The Fund is subject to interest rate risk exposure in the normal course of pursuing its investment objectives. Because the Fund holds fixed rate bonds, the value of these bonds may decrease if interest rates rise. To help hedge against this risk and to maintain its ability to generate income at prevailing market rates, the Fund may enter into interest rate swaps. Interest rate swaps are agreements between two parties to exchange cash flows based on a notional amount. The Fund may elect to pay a fixed rate and receive a floating rate, or, receive a fixed rate and pay a floating rate on a notional amount.
In addition, the Fund may also enter into interest rate swap transactions to preserve a return or spread on a particular investment or portion of its portfolio, or protecting against an increase in the price of securities the Fund anticipates purchasing at a later date. Interest rate swaps involve the exchange by a Fund with another party of their respective commitments to pay or receive interest (e.g., an exchange of floating rate payments for fixed rate payments) computed based on a contractually-based principal (or “notional”) amount. Interest rate swaps are entered into on a net basis (i.e., the two payment streams are netted out, with the Fund receiving or paying, as the case may be, only the net amount of the two payments).
During the six months ended April 30, 2020, the Fund held interest rate swaps for hedging purposes.
Inflation (CPI) Swaps:
Inflation swap agreements are contracts in which one party agrees to pay the cumulative percentage increase in a price index (the Consumer Price Index with respect to CPI swaps) over the term of the swap (with some lag on the inflation index), and the other pays a compounded fixed rate. Inflation swaps may be used to protect the net asset value, or NAV, of a Fund against an unexpected change in the rate of inflation measured by an inflation index since the value of these agreements is expected to increase if there are unexpected inflation increases.
During the six months ended April 30, 2020, the Fund held inflation (CPI) swaps for hedging purposes.
| abfunds.com | AB TAX-AWARE FIXED INCOME OPPORTUNITIES PORTFOLIO | 51 | |
NOTES TO FINANCIAL STATEMENTS (continued)
Credit Default Swaps:
The Fund may enter into credit default swaps, including to manage its exposure to the market or certain sectors of the market, to reduce its risk exposure to defaults by corporate and sovereign issuers held by the Fund, or to create exposure to corporate or sovereign issuers to which it is not otherwise exposed. The Fund may purchase credit protection (“Buy Contract”) or provide credit protection (“Sale Contract”) on the referenced obligation of the credit default swap. During the term of the swap, the Fund receives/(pays) fixed payments from/(to) the respective counterparty, calculated at the agreed upon rate applied to the notional amount. If the Fund is a buyer/(seller) of protection and a credit event occurs, as defined under the terms of the swap, the Fund will either (i) receive from the seller/(pay to the buyer) of protection an amount equal to the notional amount of the swap (the “Maximum Payout Amount”) and deliver/(take delivery of) the referenced obligation or (ii) receive/(pay) a net settlement amount in the form of cash or securities equal to the notional amount of the swap less the recovery value of the referenced obligation. In certain circumstances Maximum Payout Amounts may be partially offset by recovery values of the respective referenced obligations, upfront premium received upon entering into the agreement, or net amounts received from settlement of buy protection credit default swaps entered into by the Fund for the same referenced obligations with the same counterparty.
Credit default swaps may involve greater risks than if a Fund had invested in the referenced obligation directly. Credit default swaps are subject to general market risk, liquidity risk, counterparty risk and credit risk. If the Fund is a buyer of protection and no credit event occurs, it will lose the payments it made to its counterparty. If the Fund is a seller of protection and a credit event occurs, the value of the referenced obligation received by the Fund coupled with the periodic payments previously received, may be less than the Maximum Payout Amount it pays to the buyer, resulting in a net loss to the Fund.
Implied credit spreads over U.S. Treasuries of comparable maturity utilized in determining the market value of credit default swaps on issuers as of period end are disclosed in the portfolio of investments. The implied spreads serve as an indicator of the current status of the payment/performance risk and typically reflect the likelihood of default by the issuer of the referenced obligation. The implied credit spread of a particular reference obligation also reflects the cost of buying/selling protection and may reflect upfront payments required to be made to enter into the agreement. Widening credit spreads typically represent a deterioration of the referenced obligation’s credit soundness and
| 52 | AB TAX-AWARE FIXED INCOME OPPORTUNITIES PORTFOLIO | abfunds.com | |
NOTES TO FINANCIAL STATEMENTS (continued)
greater likelihood of default or other credit event occurring as defined under the terms of the agreement. A credit spread identified as “Defaulted” indicates a credit event has occurred for the referenced obligation.
During the six months ended April 30, 2020, the Fund held credit default swaps for non-hedging purposes.
The Fund typically enters into International Swaps and Derivatives Association, Inc. Master Agreements (“ISDA Master Agreement”) with its OTC derivative contract counterparties in order to, among other things, reduce its credit risk to OTC counterparties. ISDA Master Agreements include provisions for general obligations, representations, collateral and events of default or termination. Under an ISDA Master Agreement, the Fund typically may offset with the OTC counterparty certain derivative financial instruments’ payables and/or receivables with collateral held and/or posted and create one single net payment (close-out netting) in the event of default or termination. In the event of a default by an OTC counterparty, the return of collateral with market value in excess of the Fund’s net liability, held by the defaulting party, may be delayed or denied.
The Fund’s ISDA Master Agreements may contain provisions for early termination of OTC derivative transactions in the event the net assets of the Fund decline below specific levels (“net asset contingent features”). If these levels are triggered, the Fund’s OTC counterparty has the right to terminate such transaction and require the Fund to pay or receive a settlement amount in connection with the terminated transaction. If OTC derivatives were held at period end, please refer to netting arrangements by the OTC counterparty table below for additional details.
| abfunds.com | AB TAX-AWARE FIXED INCOME OPPORTUNITIES PORTFOLIO | 53 | |
NOTES TO FINANCIAL STATEMENTS (continued)
During the six months ended April 30, 2020, the Fund had entered into the following derivatives:
Asset Derivatives | Liability Derivatives | |||||||||||
Derivative Type | Statement of | Fair Value | Statement of | Fair Value | ||||||||
Credit contracts | Receivable/Payable for variation margin on centrally cleared swaps | $ | 18,553 | * | ||||||||
Interest rate contracts | Receivable/Payable for variation margin on centrally cleared swaps | $ | 2,687,187 | * | Receivable/Payable for variation margin on centrally cleared swaps |
| 2,054,733 | * | ||||
Interest rate contracts | Unrealized depreciation on interest rate swaps | | 219,532 | |||||||||
Interest rate contracts | Unrealized depreciation on inflation swaps | | 366,691 | |||||||||
Credit contracts | Market value on credit default swaps | 1,599,333 | ||||||||||
|
|
|
| |||||||||
Total | $ | 2,687,187 | $ | 4,258,842 | ||||||||
|
|
|
| |||||||||
| * | Only variation margin receivable/payable at period end is reported within the statement of assets and liabilities. This amount reflects cumulative unrealized appreciation/(depreciation) on futures and centrally cleared swaps as reported in the portfolio of investments. |
Derivative Type | Location of | Realized Gain or (Loss) on Derivatives | Change in Unrealized Appreciation or (Depreciation) | |||||||
Interest rate contracts | Net realized gain (loss) on swaps; Net change in unrealized appreciation/depreciation of swaps | $ | (355,836 | ) | $ | (699,695 | ) | |||
Credit contracts | Net realized gain (loss) on swaps; Net change in unrealized appreciation/depreciation of swaps | 175,847 | (1,307,407) | |||||||
|
|
|
| |||||||
Total | $ | (179,989 | ) | $ | (2,007,102 | ) | ||||
|
|
|
| |||||||
| 54 | AB TAX-AWARE FIXED INCOME OPPORTUNITIES PORTFOLIO | abfunds.com | |
NOTES TO FINANCIAL STATEMENTS (continued)
The following table represents the average monthly volume of the Fund’s derivative transactions during the six months ended April 30, 2020:
Interest Rate Swaps: | ||||
Average notional amount | $ | 4,440,000 | ||
Inflation Swaps: | ||||
Average notional amount | $ | 10,820,143 | ||
Centrally Cleared Interest Rate Swaps: | ||||
Average notional amount | $ | 38,460,000 | ||
Centrally Cleared Inflation Swaps: | ||||
Average notional amount | $ | 19,831,429 | ||
Credit Default Swaps: | ||||
Average notional amount of sale contracts | $ | 5,296,429 | ||
Centrally Cleared Credit Default Swaps: | ||||
Average notional amount of buy contracts | $ | 3,816,636 |
For financial reporting purposes, the Fund does not offset derivative assets and derivative liabilities that are subject to netting arrangements in the statement of assets and liabilities.
All OTC derivatives held at period end were subject to netting arrangements. The following table presents the Fund’s derivative assets and liabilities by OTC counterparty net of amounts available for offset under ISDA Master Agreements (“MA”) and net of the related collateral received/pledged by the Fund as of April 30, 2020. Exchange-traded derivatives and centrally cleared swaps are not subject to netting arrangements and as such are excluded from the table.
Counterparty | Derivative Liabilities Subject to a MA | Derivatives Available for Offset | Cash Collateral Pledged* | Security Collateral Pledged* | Net Amount of Derivative Liabilities | |||||||||||||||
Citibank, NA | $ | 363,563 | $ | – 0 | – | $ | – 0 | – | $ | – 0 | – | $ | 363,563 | |||||||
Citigroup Global Markets, Inc. | 497,984 | – 0 | – | – 0 | – | – 0 | – | 497,984 | ||||||||||||
Credit Suisse International | 420,648 | – 0 | – | – 0 | – | – 0 | – | 420,648 | ||||||||||||
Goldman Sachs International | 292,187 | – 0 | – | – 0 | – | – 0 | – | 292,187 | ||||||||||||
JPMorgan Chase Bank, NA | 611,174 | – 0 | – | – 0 | – | – 0 | – | 611,174 | ||||||||||||
|
|
|
|
|
|
|
|
|
| |||||||||||
Total | $ | 2,185,556 | $ | – 0 | – | $ | – 0 | – | $ | – 0 | – | $ | 2,185,556 | ^ | ||||||
|
|
|
|
|
|
|
|
|
| |||||||||||
| * | The actual collateral received/pledged may be more than the amount reported due to over-collateralization. |
| ^ | Net amount represents the net receivable/payable that would be due from/to the counterparty in the event of default or termination. The net amount from OTC financial derivative instruments can only be netted across transactions governed under the same master agreement with the same counterparty. |
| abfunds.com | AB TAX-AWARE FIXED INCOME OPPORTUNITIES PORTFOLIO | 55 | |
NOTES TO FINANCIAL STATEMENTS (continued)
NOTE E
Capital Stock
Each class consists of 3,000,000,000 authorized shares. Transactions in capital shares for each class were as follows:
| Shares | Amount | |||||||||||||||||||||||
| Six Months Ended April 30, 2020 (unaudited) | Year Ended October 31, 2019 | Six Months Ended April 30, 2020 (unaudited) | Year Ended October 31, 2019 | |||||||||||||||||||||
|
| |||||||||||||||||||||||
| Class A | ||||||||||||||||||||||||
Shares sold | 952,629 | 640,376 | $ | 10,112,567 | $ | 7,042,277 | ||||||||||||||||||
| ||||||||||||||||||||||||
Shares issued in reinvestment of dividends | 9,050 | 8,294 | 97,104 | 90,705 | ||||||||||||||||||||
| ||||||||||||||||||||||||
Shares converted from Class C | 14,957 | 0 | (a) | 151,511 | 1 | |||||||||||||||||||
| ||||||||||||||||||||||||
Shares redeemed | (203,349 | ) | (114,410 | ) | (2,048,075 | ) | (1,235,112 | ) | ||||||||||||||||
| ||||||||||||||||||||||||
Net increase | 773,287 | 534,260 | $ | 8,313,107 | $ | 5,897,871 | ||||||||||||||||||
| ||||||||||||||||||||||||
| Class C | ||||||||||||||||||||||||
Shares sold | 41,148 | 70,443 | $ | 465,143 | $ | 764,808 | ||||||||||||||||||
| ||||||||||||||||||||||||
Shares issued in reinvestment of dividends | 1,144 | 1,618 | 12,257 | 17,669 | ||||||||||||||||||||
| ||||||||||||||||||||||||
Shares converted to Class A | (14,957 | ) | 0 | (a) | (151,511 | ) | (1 | ) | ||||||||||||||||
| ||||||||||||||||||||||||
Shares redeemed | (14,847 | ) | (1,705 | ) | (150,747 | ) | (18,666 | ) | ||||||||||||||||
| ||||||||||||||||||||||||
Net increase | 12,488 | 70,356 | $ | 175,142 | $ | 763,810 | ||||||||||||||||||
| ||||||||||||||||||||||||
| Advisor Class | ||||||||||||||||||||||||
Shares sold | 4,785,248 | 4,278,940 | $ | 51,810,714 | $ | 46,722,768 | ||||||||||||||||||
| ||||||||||||||||||||||||
Shares issued in reinvestment of dividends | 42,502 | 68,832 | 459,515 | 750,101 | ||||||||||||||||||||
| ||||||||||||||||||||||||
Shares redeemed | (5,190,801 | ) | (3,786,542 | ) | (54,501,905 | ) | (41,008,496) | |||||||||||||||||
| ||||||||||||||||||||||||
Net increase (decrease) | (363,051 | ) | 561,230 | $ | (2,231,676 | ) | $ | 6,464,373 | ||||||||||||||||
| ||||||||||||||||||||||||
| (a) | Amount is less than one share. |
NOTE F
Risks Involved in Investing in the Fund
Market Risk—The market value of a security may move up or down, sometimes rapidly and unpredictably. These fluctuations may cause a security to be worth less than the price originally paid for it, or less than it was worth at an earlier time. Market risk may affect a single issuer, industry, sector of the economy or the market as a whole. Global economies and financial markets are increasingly interconnected, which increases the probabilities that conditions in one country or region might
| 56 | AB TAX-AWARE FIXED INCOME OPPORTUNITIES PORTFOLIO | abfunds.com | |
NOTES TO FINANCIAL STATEMENTS (continued)
adversely impact issuers in a different country or region. Conditions affecting the general economy, including political, social, or economic instability at the local, regional, or global level may also affect the market value of a security. Health crises, such as pandemic and epidemic diseases, as well as other incidents that interrupt the expected course of events, such as natural disasters, war or civil disturbance, acts of terrorism, power outages and other unforeseeable and external events, and the public response to or fear of such diseases or events, have and may in the future have an adverse effect on the Fund’s investments and net asset value and can lead to increased market volatility. For example, any preventative or protective actions that governments may take in respect of such diseases or events may result in periods of business disruption, inability to obtain raw materials, supplies and component parts, and reduced or disrupted operations for the Fund’s portfolio companies. The occurrence and pendency of such diseases or events could adversely affect the economies and financial markets either in specific countries or worldwide.
Credit Risk—An issuer or guarantor of a fixed-income security, or the counterparty to a derivatives or other contract, may be unable or unwilling to make timely payments of interest or principal, or to otherwise honor its obligations. The issuer or guarantor may default, causing a loss of the full principal amount of a security and any accrued interest. The degree of risk for a particular security may be reflected in its credit rating. There is the possibility that the credit rating of a fixed-income security may be downgraded after purchase, which may adversely affect the value of the security.
Below Investment Grade Securities Risk—Investments in fixed-income securities with lower ratings (commonly known as “junk bonds”) are subject to a higher probability that an issuer will default or fail to meet its payment obligations. These securities may be subject to greater price volatility due to such factors as specific municipal or corporate developments and negative performance of the junk bond market generally and may be more difficult to trade than other types of securities.
Municipal Market Risk—This is the risk that special factors may adversely affect the value of municipal securities and have a significant effect on the yield or value of the Fund’s investments in municipal securities. These factors include economic conditions, political or legislative changes, uncertainties related to the tax status of municipal securities, or the rights of investors in these securities. To the extent that the Fund invests more of its assets in a particular state’s municipal securities, the Fund may be vulnerable to events adversely affecting that state, including economic, political and regulatory occurrences, court decisions, terrorism and catastrophic natural disasters, such as hurricanes or earthquakes. The Fund’s investments in certain municipal securities with principal and
| abfunds.com | AB TAX-AWARE FIXED INCOME OPPORTUNITIES PORTFOLIO | 57 | |
NOTES TO FINANCIAL STATEMENTS (continued)
interest payments that are made from the revenues of a specific project or facility, and not general tax revenues, may have increased risks. Factors affecting the project or facility, such as local business or economic conditions, could have a significant effect on the project’s ability to make payments of principal and interest on these securities.
Congress has previously considered making changes to the municipal securities provisions of the Internal Revenue Code that could change the U.S. federal income tax treatment of certain types of municipal securities
The Fund may invest in the municipal securities of Puerto Rico or other U.S. territories and their governmental agencies and municipalities, which are exempt from federal, state, and, where applicable, local income taxes. These municipal securities may have more risks than those of other U.S. issuers of municipal securities. Like many U.S. states and municipalities, Puerto Rico experienced a significant downturn during the recent recession. Puerto Rico’s downturn was particularly severe, and Puerto Rico continues to face a very challenging economic and fiscal environment. If the general economic situation in Puerto Rico continues to persist or worsens, the volatility and credit quality of Puerto Rican municipal securities could continue to be adversely affected, and the market for such securities may experience continued volatility.
Tax Risk—From time to time, the U.S. Government and the U.S. Congress consider changes in federal tax law that could limit or eliminate the federal tax exemption for municipal bond income, which would in effect reduce the income received by shareholders from the Fund by increasing taxes on that income. In such event, the Fund’s NAV could also decline as yields on municipal bonds, which are typically lower than those on taxable bonds, would be expected to increase to approximately the yield of comparable taxable bonds. Actions or anticipated actions affecting the tax exempt status of municipal bonds could also result in significant shareholder redemptions of Fund shares as investors anticipate adverse effects on the Fund or seek higher yields to offset the potential loss of the tax deduction. As a result, the Fund would be required to maintain higher levels of cash to meet the redemptions, which would negatively affect the Fund’s yield.
Interest Rate Risk—Changes in interest rates will affect the value of investments in fixed-income securities. When interest rates rise, the value of existing investments in fixed-income securities tends to fall and this decrease in value may not be offset by higher income from new investments. Interest rate risk is generally greater for fixed-income securities with longer maturities or durations.
| 58 | AB TAX-AWARE FIXED INCOME OPPORTUNITIES PORTFOLIO | abfunds.com | |
NOTES TO FINANCIAL STATEMENTS (continued)
Duration Risk—Duration is a measure that relates the expected price volatility of a fixed-income security to changes in interest rates. The duration of a fixed-income security may be shorter than or equal to full maturity of a fixed-income security. Fixed-income securities with longer durations have more risk and will decrease in price as interest rates rise.
Inflation Risk—This is the risk that the value of assets or income from investments will be less in the future as inflation decreases the value of money. As inflation increases, the value of the Fund’s assets can decline as can the value of the Fund’s distributions. This risk is significantly greater for fixed-income securities with longer maturities.
Illiquid Investments Risk—Illiquid investments risk exists when certain investments become difficult to purchase or sell. Difficulty in selling such investments may result in sales at disadvantageous prices affecting the value of your investment in the Fund. Causes of illiquid investments risk may include low trading volumes and large positions. Municipal securities may have more illiquid investments risk than other fixed-income securities because they trade less frequently and the market for municipal securities is generally smaller than many other markets.
Leverage Risk—When the Fund borrows money or otherwise leverages its investments, its performance may be volatile because leverage tends to exaggerate the effect of any increase or decrease in the value of the Fund’s investments. The Fund may create leverage through the use of reverse repurchase arrangements, forward currency exchange contracts, forward commitments, dollar rolls or futures or by borrowing money. The use of other types of derivative instruments by the Fund, such as options and swaps, may also result in a form of leverage. Leverage may result in higher returns to the Fund than if the Fund were not leveraged, but may also adversely affect returns, particularly if the market is declining.
Derivatives Risk—The Fund may enter into derivative transactions such as forwards, options, futures and swaps. Derivatives may be illiquid, difficult to price, and leveraged so that small changes may produce disproportionate losses for the Fund, and subject to counterparty risk to a greater degree than more traditional investments. Derivatives may result in significant losses, including losses that are far greater than the value of the derivatives reflected on the statement of assets and liabilities.
LIBOR Risk—The Fund may invest in certain debt securities, derivatives or other financial instruments that utilize the London Interbank Offered Rate, or “LIBOR,” as a “benchmark” or “reference rate” for various interest rate calculations. In July 2017, the United Kingdom Financial Conduct Authority, which regulates LIBOR, announced a desire to phase out the
| abfunds.com | AB TAX-AWARE FIXED INCOME OPPORTUNITIES PORTFOLIO | 59 | |
NOTES TO FINANCIAL STATEMENTS (continued)
use of LIBOR by the end of 2021. Although financial regulators and industry working groups have suggested alternative reference rates, such as European Interbank Offer Rate (“EURIBOR”), Sterling Overnight Interbank Average Rate (“SONIA”) and Secured Overnight Financing Rate (“SOFR”), global consensus on alternative rates is lacking and the process for amending existing contracts or instruments to transition away from LIBOR remains unclear. The elimination of LIBOR or changes to other reference rates or any other changes or reforms to the determination or supervision of reference rates could have an adverse impact on the market for, or value of, any securities or payments linked to those reference rates, which may adversely affect the Fund’s performance and/or net asset value. Uncertainty and risk also remain regarding the willingness and ability of issuers and lenders to include revised provisions in new and existing contracts or instruments. Consequently, the transition away from LIBOR to other reference rates may lead to increased volatility and illiquidity in markets that are tied to LIBOR, fluctuations in values of LIBOR-related investments or investments in issuers that utilize LIBOR, increased difficulty in borrowing or refinancing and diminished effectiveness of hedging strategies, adversely affecting the Fund’s performance. Furthermore, the risks associated with the expected discontinuation of LIBOR and transition may be exacerbated if the work necessary to effect an orderly transition to an alternative reference rate is not completed in a timely manner. Because the usefulness of LIBOR as a benchmark could deteriorate during the transition period, these effects could occur prior to the end of 2021.
Indemnification Risk—In the ordinary course of business, the Fund enters into contracts that contain a variety of indemnifications. The Fund’s maximum exposure under these arrangements is unknown. However, the Fund has not had prior claims or losses pursuant to these indemnification provisions and expects the risk of loss thereunder to be remote. Therefore, the Fund has not accrued any liability in connection with these indemnification provisions.
Management Risk—The Fund is subject to management risk because it is an actively-managed investment fund. The Adviser will apply its investment techniques and risk analyses in making investment decisions, but there is no guarantee that its techniques will produce the intended results.
NOTE G
Joint Credit Facility
A number of open-end mutual funds managed by the Adviser, including the Fund, participate in a $325 million revolving credit facility (the “Facility”) intended to provide short-term financing, if necessary, subject to certain restrictions in connection with abnormal redemption activity. Commitment fees related to the Facility are paid by the participating funds and are
| 60 | AB TAX-AWARE FIXED INCOME OPPORTUNITIES PORTFOLIO | abfunds.com | |
NOTES TO FINANCIAL STATEMENTS (continued)
included in miscellaneous expenses in the statement of operations. The Fund did not utilize the Facility during the six months ended April 30, 2020.
NOTE H
Distributions to Shareholders
The tax character of distributions to be paid for the year ending October 31, 2020 will be determined at the end of the current fiscal year. The tax character of distributions paid during the fiscal years ended October 31, 2019 and October 31, 2018 were as follows:
| 2019 | 2018 | |||||||
Distributions paid from: | ||||||||
Ordinary income | $ | 563,591 | $ | 251,841 | ||||
|
|
|
| |||||
Total taxable distributions | 563,591 | 251,841 | ||||||
Tax-exempt distributions | 1,536,089 | 1,537,119 | ||||||
|
|
|
| |||||
Total distributions paid | $ | 2,099,680 | $ | 1,788,960 | ||||
|
|
|
| |||||
As of October 31, 2019, the components of accumulated earnings/(deficit) on a tax basis were as follows:
Undistributed tax-exempt income | $ | 120,828 | ||
Accumulated capital and other losses | (915,603 | )(a) | ||
Unrealized appreciation/(depreciation) | 4,165,702 | (b) | ||
|
| |||
Total accumulated earnings/(deficit) | $ | 3,370,927 | (c) | |
|
|
| (a) | As of October 31, 2019, the Fund had a net capital loss carryforward of $915,603 |
| (b) | The differences between book-basis and tax-basis unrealized appreciation/(depreciation) are attributable primarily to the tax treatment of swaps and the tax deferral of losses on wash sales. |
| (c) | The differences between book-basis and tax-basis components of accumulated earnings/(deficit) is attributable primarily to the dividends payable. |
For tax purposes, net realized capital losses may be carried over to offset future capital gains, if any. Funds are permitted to carry forward capital losses for an indefinite period, and such losses will retain their character as either short-term or long-term capital losses. As of October 31, 2019, the Fund had a net short-term capital loss carryforward of $915,603, which may be carried forward for an indefinite period.
NOTE I
Recent Accounting Pronouncements
In March 2017, the Financial Accounting Standards Board issued an Accounting Standards Update, ASU 2017-08, Receivables—Nonrefundable Fees and Other Costs (Subtopic 310-20), Premium Amortization on Purchased Callable Debt Securities which amends the amortization period for certain purchased callable debt securities held at a premium, shortening such period to the earliest call date. ASU 2017-08 does not require any accounting change for debt securities held at a
| abfunds.com | AB TAX-AWARE FIXED INCOME OPPORTUNITIES PORTFOLIO | 61 | |
NOTES TO FINANCIAL STATEMENTS (continued)
discount; the discount continues to be amortized to maturity. ASU 2017-08 is effective for fiscal years, and interim periods within those fiscal years, beginning after December 15, 2018. The Fund has adopted ASU 2017-08, which did not have a material impact on the Fund’s financial position or the results of its operations, and had no impact on the Fund’s net assets.
NOTE J
Subsequent Events
Management has evaluated subsequent events for possible recognition or disclosure in the financial statements through the date the financial statements are issued. Management has determined that there are no material events that would require disclosure in the Fund’s financial statements through this date.
| 62 | AB TAX-AWARE FIXED INCOME OPPORTUNITIES PORTFOLIO | abfunds.com | |
FINANCIAL HIGHLIGHTS
Selected Data For A Share Of Capital Stock Outstanding Throughout Each Period
| Class A | ||||||||||||||||||||||||
| Six Months Ended April 30, 2020 | Year Ended October 31, | |||||||||||||||||||||||
| (unaudited) | 2019 | 2018 | 2017 | 2016 | 2015 | |||||||||||||||||||
|
| |||||||||||||||||||||||
Net asset value, beginning of period | $ 11.09 | $ 10.46 | $ 10.77 | $ 10.87 | $ 10.59 | $ 10.51 | ||||||||||||||||||
|
| |||||||||||||||||||||||
Income From Investment Operations | ||||||||||||||||||||||||
Net investment income(a)(b) | .14 | .30 | .24 | .21 | .22 | .18 | ||||||||||||||||||
Net realized and unrealized gain (loss) on investment transactions | (1.24 | ) | .65 | (.30 | ) | (.10 | )‡ | .28 | .09 | |||||||||||||||
|
| |||||||||||||||||||||||
Net increase (decrease) in net asset value from operations | (1.10 | ) | .95 | (.06 | ) | .11 | .50 | .27 | ||||||||||||||||
|
| |||||||||||||||||||||||
Less: Dividends and Distributions | ||||||||||||||||||||||||
Dividends from net investment income | (.15 | ) | (.32 | ) | (.25 | ) | (.21 | ) | (.22 | ) | (.18 | ) | ||||||||||||
Distributions from net realized gain on investment transactions | – 0 – | – 0 – | – 0 – | – 0 – | – 0 – | (.01 | ) | |||||||||||||||||
|
| |||||||||||||||||||||||
Total dividends and distributions | (.15 | ) | (.32 | ) | (.25 | ) | (.21 | ) | (.22 | ) | (.19 | ) | ||||||||||||
|
| |||||||||||||||||||||||
Net asset value, end of period | $ 9.84 | $ 11.09 | $ 10.46 | $ 10.77 | $ 10.87 | $ 10.59 | ||||||||||||||||||
|
| |||||||||||||||||||||||
Total Return | ||||||||||||||||||||||||
Total investment return based on net asset value(c) | (10.02 | )% | 9.15 | % | (.55 | )% | 1.09 | % | 4.69 | % | 2.64 | % | ||||||||||||
Ratios/Supplemental Data | ||||||||||||||||||||||||
Net assets, end of period (000’s omitted) | $18,197 | $11,932 | $5,666 | $8,065 | $6,385 | $4,783 | ||||||||||||||||||
Ratio to average net assets of: | ||||||||||||||||||||||||
Expenses, net of waivers/reimbursements(d)(e) | .75 | %^ | .76 | % | .75 | % | .75 | % | .80 | % | .81 | % | ||||||||||||
Expenses, before waivers/reimbursements(d)(e) | 1.18 | %^ | 1.30 | % | 1.27 | % | 1.40 | % | 1.72 | % | 2.19 | % | ||||||||||||
Net investment income(b) | 2.59 | %^ | 2.78 | % | 2.26 | % | 2.01 | % | 1.98 | % | 1.75 | % | ||||||||||||
Portfolio turnover rate | 45 | % | 52 | % | 68 | % | 34 | % | 36 | % | 35 | % | ||||||||||||
| See | footnote summary on page 66. |
| abfunds.com | AB TAX-AWARE FIXED INCOME OPPORTUNITIES PORTFOLIO | 63 | |
FINANCIAL HIGHLIGHTS (continued)
Selected Data For A Share Of Capital Stock Outstanding Throughout Each Period
| Class C | ||||||||||||||||||||||||
| Six Months Ended April 30, 2020 | Year Ended October 31, | |||||||||||||||||||||||
| (unaudited) | 2019 | 2018 | 2017 | 2016 | 2015 | |||||||||||||||||||
|
| |||||||||||||||||||||||
Net asset value, beginning of period | $ 11.09 | $ 10.46 | $ 10.77 | $ 10.87 | $ 10.59 | $ 10.52 | ||||||||||||||||||
|
| |||||||||||||||||||||||
Income From Investment Operations | ||||||||||||||||||||||||
Net investment income(a)(b) | .10 | .22 | .16 | .13 | .13 | .10 | ||||||||||||||||||
Net realized and unrealized gain (loss) on investment transactions | (1.24 | ) | .65 | (.30 | ) | (.10 | )‡ | .28 | .09 | |||||||||||||||
|
| |||||||||||||||||||||||
Net increase (decrease) in net asset value from operations | (1.14 | ) | .87 | (.14 | ) | .03 | .41 | .19 | ||||||||||||||||
|
| |||||||||||||||||||||||
Less: Dividends and Distributions | ||||||||||||||||||||||||
Dividends from net investment income | (.11 | ) | (.24 | ) | (.17 | ) | (.13 | ) | (.13 | ) | (.11 | ) | ||||||||||||
Distributions from net realized gain on investment transactions | – 0 – | – 0 – | – 0 – | – 0 – | – 0 – | (.01 | ) | |||||||||||||||||
|
| |||||||||||||||||||||||
Total dividends and distributions | (.11 | ) | (.24 | ) | (.17 | ) | (.13 | ) | (.13 | ) | (.12 | ) | ||||||||||||
|
| |||||||||||||||||||||||
Net asset value, end of period | $ 9.84 | $ 11.09 | $ 10.46 | $ 10.77 | $ 10.87 | $ 10.59 | ||||||||||||||||||
|
| |||||||||||||||||||||||
Total Return | ||||||||||||||||||||||||
Total investment return based on net asset value(c) | (10.36 | )% | 8.33 | % | (1.29 | )% | .33 | % | 3.91 | % | 1.78 | % | ||||||||||||
Ratios/Supplemental Data | ||||||||||||||||||||||||
Net assets, end of period (000’s omitted) | $1,539 | $1,596 | $769 | $1,056 | $2,022 | $1,518 | ||||||||||||||||||
Ratio to average net assets of: | ||||||||||||||||||||||||
Expenses, net of waivers/reimbursements(d)(e) | 1.50 | %^ | 1.51 | % | 1.50 | % | 1.50 | % | 1.55 | % | 1.55 | % | ||||||||||||
Expenses, before waivers/reimbursements(d)(e) | 1.92 | %^ | 2.06 | % | 2.02 | % | 2.18 | % | 2.47 | % | 2.85 | % | ||||||||||||
Net investment income(b) | 1.83 | %^ | 2.05 | % | 1.52 | % | 1.25 | % | 1.23 | % | .99 | % | ||||||||||||
Portfolio turnover rate | 45 | % | 52 | % | 68 | % | 34 | % | 36 | % | 35 | % | ||||||||||||
| See | footnote summary on page 66. |
| 64 | AB TAX-AWARE FIXED INCOME OPPORTUNITIES PORTFOLIO | abfunds.com | |
FINANCIAL HIGHLIGHTS (continued)
Selected Data For A Share Of Capital Stock Outstanding Throughout Each Period
| Advisor Class | ||||||||||||||||||||||||
Six Months (unaudited) | Year Ended October 31, | |||||||||||||||||||||||
| 2019 | 2018 | 2017 | 2016 | 2015 | ||||||||||||||||||||
|
|
| ||||||||||||||||||||||
Net asset value, beginning of period | $ 11.09 | $ 10.46 | $ 10.77 | $ 10.87 | $ 10.59 | $ 10.52 | ||||||||||||||||||
|
| |||||||||||||||||||||||
Income From Investment Operations | ||||||||||||||||||||||||
Net investment income(a)(b) | �� | .15 | .33 | .27 | .24 | .24 | .21 | |||||||||||||||||
Net realized and unrealized gain (loss) on investment transactions | (1.24 | ) | .64 | (.30 | ) | (.10 | )‡ | .28 | .08 | |||||||||||||||
|
| |||||||||||||||||||||||
Net increase (decrease) in net asset value from operations | (1.09 | ) | .97 | (.03 | ) | .14 | .52 | .29 | ||||||||||||||||
|
| |||||||||||||||||||||||
Less: Dividends and Distributions | ||||||||||||||||||||||||
Dividends from net investment income | (.16 | ) | (.34 | ) | (.28 | ) | (.24 | ) | (.24 | ) | (.21 | ) | ||||||||||||
Distributions from net realized gain on investment transactions | – 0 – | – 0 – | – 0 – | – 0 – | – 0 – | (.01 | ) | |||||||||||||||||
|
| |||||||||||||||||||||||
Total dividends and distributions | (.16 | ) | (.34 | ) | (.28 | ) | (.24 | ) | (.24 | ) | (.22 | ) | ||||||||||||
|
| |||||||||||||||||||||||
Net asset value, end of period | $ 9.84 | $ 11.09 | $ 10.46 | $ 10.77 | $ 10.87 | $ 10.59 | ||||||||||||||||||
|
| |||||||||||||||||||||||
Total Return | ||||||||||||||||||||||||
Total investment return based on net asset value(c) | (9.91 | ) % | 9.42 | % | (.30 | ) % | 1.34 | % | 4.96 | % | 2.81 | % | ||||||||||||
Ratios/Supplemental Data | ||||||||||||||||||||||||
Net assets, end of period (000’s omitted) | $ 55,987 | $ 67,119 | $ 57,432 | $ 59,782 | $ 33,667 | $ 26,333 | ||||||||||||||||||
Ratio to average net assets of: | ||||||||||||||||||||||||
Expenses, net of waivers/reimbursements(d)(e) | .50 | %^ | .51 | % | .50 | % | .50 | % | .55 | % | .55 | % | ||||||||||||
Expenses, before waivers/reimbursements(d)(e) | .91 | %^ | 1.05 | % | 1.02 | % | 1.15 | % | 1.47 | % | 1.92 | % | ||||||||||||
Net investment income(b) | 2.79 | %^ | 3.04 | % | 2.52 | % | 2.26 | % | 2.24 | % | 1.99 | % | ||||||||||||
Portfolio turnover rate | 45 | % | 52 | % | 68 | % | 34 | % | 36 | % | 35 | % | ||||||||||||
| See | footnote summary on page 66. |
| abfunds.com | AB TAX-AWARE FIXED INCOME OPPORTUNITIES PORTFOLIO | 65 | |
FINANCIAL HIGHLIGHTS (continued)
Selected Data For A Share Of Capital Stock Outstanding Throughout Each Period
| (a) | Based on average shares outstanding. |
| (b) | Net of expenses waived/reimbursed by the Adviser. |
| (c) | Total investment return is calculated assuming an initial investment made at the net asset value at the beginning of the period, reinvestment of all dividends and distributions at net asset value during the period, and redemption on the last day of the period. Initial sales charges or contingent deferred sales charges are not reflected in the calculation of total investment return. Total return does not reflect the deduction of taxes that a shareholder would pay on fund distributions or the redemption of fund shares. Total investment return calculated for a period of less than one year is not annualized. |
| (d) | In connection with the Fund’s investments in affiliated underlying portfolios, the Fund incurs no direct expenses, but bears proportionate shares of the fees and expenses (i.e., operating, administrative and investment advisory fees) of the affiliated underlying portfolios. The Adviser has contractually agreed to waive its fees from the Fund in an amount equal to the Fund’s pro rata share of certain acquired fund fees and expenses, and for the year ended October 31, 2017, such waiver amounted to .01%. |
| (e) | The expense ratios presented below exclude interest expense: |
Six Months (unaudited) | Year Ended October 31, | |||||||||||||||||||
| 2019 | 2018 | 2017 | 2016 | |||||||||||||||||
|
| |||||||||||||||||||
Class A | ||||||||||||||||||||
Net of waivers/reimbursements | .75 | % | .75 | % | .75 | % | .75 | % | .80 | % | ||||||||||
Before waivers/reimbursements | 1.18 | % | 1.29 | % | 1.27 | % | 1.40 | % | 1.72 | % | ||||||||||
Class C | ||||||||||||||||||||
Net of waivers/reimbursements | 1.50 | % | 1.50 | % | 1.50 | % | 1.50 | % | 1.55 | % | ||||||||||
Before waivers/reimbursements | 1.92 | % | 2.04 | % | 2.02 | % | 2.18 | % | 2.47 | % | ||||||||||
Advisor Class | ||||||||||||||||||||
Net of waivers/reimbursements | .50 | % | .50 | % | .50 | % | .50 | % | .55 | % | ||||||||||
Before waivers/reimbursements | .91 | % | 1.04 | % | 1.02 | % | 1.15 | % | 1.47 | % | ||||||||||
| ‡ | Due to timing of sales and repurchase of capital shares, the net realized and unrealized gain (loss) per share is not in accordance with the Fund’s change in net realized and unrealized gain (loss) on investment transactions for the period. |
| ^ | Annualized. |
See notes to financial statements.
| 66 | AB TAX-AWARE FIXED INCOME OPPORTUNITIES PORTFOLIO | abfunds.com | |
BOARD OF DIRECTORS
Marshall C. Turner, Jr.(1), Jorge A. Bermudez(1) Michael J. Downey(1) Nancy P. Jacklin(1) | Robert M. Keith, President and Chief Executive Officer Jeanette Loeb(1) Carol C. McMullen(1) Garry L. Moody(1) Earl D. Weiner(1) |
OFFICERS
R.B. “Guy” Davidson III(2),^ Vice President Terrance T. Hults(2), Vice President Shawn E. Keegan(2), Vice President Matthew J. Norton(2), Vice President Andrew D. Potter(2), Vice President | Emilie D. Wrapp, Secretary Michael B. Reyes, Senior Analyst Joseph J. Mantineo, Treasurer and Chief Financial Officer Phyllis J. Clarke, Controller Vincent S. Noto, Chief Compliance Officer |
Custodian and Accounting Agent State Street Bank and Trust Company State Street Corporation CCB/5 1 Iron Street Boston, MA 02210
Principal Underwriter AllianceBernstein Investments, Inc. 1345 Avenue of the Americas New York, NY 10105
Transfer Agent AllianceBernstein Investor Services, Inc. P.O. Box 786003 San Antonio, TX 78278-6003 Toll-Free (800) 221-5672 | Independent Registered Public Accounting Firm Ernst & Young LLP 5 Times Square New York, NY 10036
Legal Counsel Seward & Kissel LLP One Battery Park Plaza New York, NY 10004 |
| 1 | Member of the Audit Committee, the Governance and Nominating Committee, and the Independent Directors Committee. |
| 2 | The day-to-day management of, and investment decisions for, the Fund’s portfolio are made by the Adviser’s Tax-Aware Investment Team. Messrs. Davidson, Hults, Keegan, Norton and Potter are the investment professionals with the most significant responsibility for the day-to-day management of the Fund’s portfolio. |
| ^ | Mr. Davidson is expected to retire from the Adviser effective December 30, 2020. |
| abfunds.com | AB TAX-AWARE FIXED INCOME OPPORTUNITIES PORTFOLIO | 67 | |
Operation and Effectiveness of the Fund’s Liquidity Risk Management Program:
In October 2016, the Securities and Exchange Commission (“SEC”) adopted the open-end fund liquidity rule (the “Liquidity Rule”). In June 2018 the SEC adopted a requirement that funds disclose information about the operation and effectiveness of their Liquidity Risk Management Program (“LRMP”) in their reports to shareholders.
One of the requirements of the Liquidity Rule is for the Fund to designate an Administrator of the Fund’s Liquidity Risk Management Program. The Administrator of the Fund’s LRMP is AllianceBernstein L.P., the Fund’s investment adviser (the “Adviser”). The Adviser has delegated the responsibility to its Liquidity Risk Management Committee (the “Committee”). Another requirement of the Liquidity Rule is for the Fund’s Board of Directors (the “Fund Board”) to receive an annual written report from the Administrator of the LRMP, which addresses the operation of the Fund’s LRMP and assesses its adequacy and effectiveness. The Adviser provided the Fund’s Board with such annual report during the first quarter of 2020, which covered the period December 1, 2018 through December 31, 2019 (the “Program Reporting Period”).
The LRMP’s principal objectives include supporting the Fund’s compliance with limits on investments in illiquid assets and mitigating the risk that the Fund will be unable to meet its redemption obligations in a timely manner. Pursuant to the LRMP, the Fund classifies the liquidity of its portfolio investments into one of the four categories defined by the SEC: Highly Liquid, Moderately Liquid, Less Liquid, and Illiquid. These classifications are reported to the SEC on Form N-PORT.
During the Program Reporting Period, the Committee reviewed whether the Fund’s strategy is appropriate for an open-end structure, taking into account any holdings of less liquid and illiquid assets. The Committee also performed an analysis to determine whether the Fund is required to maintain a Highly Liquid Investment Minimum (“HLIM”). If the Fund participated in derivative transactions, the exposure from such transactions were considered in the LRMP. The Committee also incorporated the following information when determining the Fund’s reasonably anticipated trading size for purposes of liquidity monitoring: historical net redemption activity, a Fund’s concentration in an issuer, shareholder concentration, investment performance, total net assets, and distribution channels.
The Adviser informed the Fund Board that the Committee believes the Fund’s LRMP is adequately designed, has been implemented as intended, and has operated effectively since its inception. No material exceptions have been noted since the implementation of the LRMP, and there were no liquidity events that impacted the Fund or its ability to timely meet redemptions during the Program Reporting Period.
| 68 | AB TAX-AWARE FIXED INCOME OPPORTUNITIES PORTFOLIO | abfunds.com | |
Information Regarding the Review and Approval of the Fund’s Advisory Agreement
The disinterested directors (the “directors”) of AB Bond Fund, Inc. (the “Company”) unanimously approved the continuance of the Company’s Advisory Agreement with the Adviser in respect of AB Tax-Aware Fixed Income Portfolio (the “Fund”) at a meeting held on November 4-6, 2019 (the “Meeting”.)*
Prior to approval of the continuance of the Advisory Agreement, the directors had requested from the Adviser, and received and evaluated, extensive materials. They reviewed the proposed continuance of the Advisory Agreement with the Adviser and with experienced counsel who are independent of the Adviser, who advised on the relevant legal standards. The directors also reviewed additional materials, including comparative analytical data prepared by the Senior Analyst for the Fund. The directors also discussed the proposed continuance in private sessions with counsel.
The directors considered their knowledge of the nature and quality of the services provided by the Adviser to the Fund gained from their experience as directors or trustees of most of the registered investment companies advised by the Adviser, their overall confidence in the Adviser’s integrity and competence they have gained from that experience, the Adviser’s initiative in identifying and raising potential issues with the directors and its responsiveness, frankness and attention to concerns raised by the directors in the past, including the Adviser’s willingness to consider and implement organizational and operational changes designed to improve investment results and the services provided to the AB Funds. The directors noted that they have four regular meetings each year, at each of which they review extensive materials and information from the Adviser, including information on the investment performance of the Fund and the underlying fund advised by the Adviser in which the Fund invests.
The directors also considered all factors they believed relevant, including the specific matters discussed below. During the course of their deliberations, the directors evaluated, among other things, the reasonableness of the advisory fee. The directors did not identify any particular information that was all-important or controlling, and different directors may have attributed different weights to the various factors. The directors determined that the selection of the Adviser to manage the Fund and the overall arrangements between the Fund and the Adviser, as provided in the Advisory Agreement, including the advisory fee, were fair and reasonable in light of the services performed, expenses incurred and such other matters
| * | Following transactions completed on November 13, 2019 that may have been deemed to have been an “assignment” causing termination of the Fund’s investment advisory agreement, a new investment advisory agreement, having the same terms as the prior one, was entered into by the Fund and the Adviser. |
| abfunds.com | AB TAX-AWARE FIXED INCOME OPPORTUNITIES PORTFOLIO | 69 | |
as the directors considered relevant in the exercise of their business judgment. The material factors and conclusions that formed the basis for the directors’ determinations included the following:
Nature, Extent and Quality of Services Provided
The directors considered the scope and quality of services provided by the Adviser under the Advisory Agreement, including the quality of the investment research capabilities of the Adviser and the other resources it has dedicated to performing services for the Fund. The directors noted that the Adviser from time to time reviews the Fund’s investment strategies and from time to time proposes changes intended to improve the Fund’s relative or absolute performance for the directors’ consideration. They also noted the professional experience and qualifications of the Fund’s portfolio management team and other senior personnel of the Adviser. The directors also considered that the Advisory Agreement provides that the Fund will reimburse the Adviser for the cost to it of providing certain clerical, accounting, administrative and other services to the Fund by employees of the Adviser or its affiliates. Requests for these reimbursements are made on a quarterly basis and subject to approval by the directors. The Adviser did not request any reimbursements from the Fund in the Fund’s latest fiscal year. The quality of administrative and other services, including the Adviser’s role in coordinating the activities of the Fund’s other service providers, also was considered. The directors concluded that, overall, they were satisfied with the nature, extent and quality of services provided to the Fund under the Advisory Agreement.
Costs of Services Provided and Profitability
The directors reviewed a schedule of the revenues and expenses and related notes indicating the profitability of the Fund to the Adviser for calendar years 2017 and 2018 that had been prepared with an expense allocation methodology arrived at in consultation with an independent consultant retained by the Fund’s former Senior Officer/Independent Compliance Officer. The directors noted the assumptions and methods of allocation used by the Adviser in preparing fund-specific profitability data and understood that there are a number of potentially acceptable allocation methodologies for information of this type. The directors noted that the profitability information reflected all revenues and expenses of the Adviser’s relationship with the Fund, including those relating to its subsidiaries that provide transfer agency and distribution services to the Fund. The directors recognized that it is difficult to make comparisons of the profitability of the Advisory Agreement with the profitability of fund advisory contracts for unaffiliated funds because comparative information is not generally publicly available and is affected by numerous factors. The directors focused on the profitability of the Adviser’s relationship with the Fund before taxes and distribution expenses. The directors noted that the Fund was not profitable to the Adviser in the periods reviewed.
| 70 | AB TAX-AWARE FIXED INCOME OPPORTUNITIES PORTFOLIO | abfunds.com | |
Fall-Out Benefits
The directors considered the other benefits to the Adviser and its affiliates from their relationships with the Fund and the underlying fund advised by the Adviser in which the Fund invests, including, but not limited to, benefits relating to 12b-1 fees and sales charges received by the Fund’s principal underwriter (which is a wholly owned subsidiary of the Adviser) in respect of certain classes of the Fund’s shares; and transfer agency fees paid by the Fund to a wholly owned subsidiary of the Adviser. The directors recognized that the Fund’s unprofitability to the Adviser would be exacerbated without these benefits. The directors understood that the Adviser also might derive reputational and other benefits from its association with the Fund.
Investment Results
In addition to the information reviewed by the directors in connection with the Meeting, the directors receive detailed performance information for the Fund at each regular Board meeting during the year.
At the Meeting, the directors reviewed performance information prepared by an independent service provider (the “15(c) service provider”), showing the performance of the Class A Shares of the Fund against a group of similar funds (“peer group”) and a larger group of similar funds (“peer universe”), each selected by the 15(c) service provider, and information prepared by the Adviser showing performance of the Class A Shares against a broad-based securities market index, in each case for the 1-, 3- and 5-year periods ended July 31, 2019 and (in the case of comparisons with the broad-based securities market index) for the period from inception. Based on their review, the directors concluded that the Fund’s investment performance was acceptable.
Advisory Fees and Other Expenses
The directors considered the advisory fee rate payable by the Fund to the Adviser and information prepared by the 15(c) service provider concerning advisory fee rates payable by other funds in the same category as the Fund. The directors recognized that it is difficult to make comparisons of advisory fees because there are variations in the services that are included in the fees payable by other funds. The directors compared the Fund’s contractual effective advisory fee rate with a peer group median.
The Adviser informed the directors that there were no institutional products managed by the Adviser that utilize investment strategies similar to those of the Fund.
The directors noted that the Fund invests in shares of exchange-traded funds (“ETFs”), subject to the restrictions and limitations of the Investment Company Act of 1940 as these may be varied as a result of exemptive orders issued by the SEC. The directors also noted that ETFs pay advisory
| abfunds.com | AB TAX-AWARE FIXED INCOME OPPORTUNITIES PORTFOLIO | 71 | |
fees pursuant to their advisory contracts, and that the Adviser had provided, and they had reviewed, information about the expense ratios of the relevant ETFs . The directors concluded, based on the Adviser’s explanation of how it uses ETFs when they are the most cost-effective way to obtain desired exposures, in some cases pending purchases of underlying securities, that the advisory fee for the Fund is for services that are in addition to, rather than duplicative of, the services provided under the advisory contracts of the ETFs.
In connection with their review of the Fund’s advisory fee, the directors also considered the total expense ratio of the Class A shares of the Fund in comparison to a peer group and a peer universe selected by the 15(c) service provider. The Class A expense ratio of the Fund was based on the Fund’s latest fiscal year and the directors considered the Adviser’s expense cap for the Fund. The directors noted that it was likely that the expense ratios of some of the other funds in the Fund’s category were lowered by waivers or reimbursements by those funds’ investment advisers, which in some cases might be voluntary or temporary. The directors view expense ratio information as relevant to their evaluation of the Adviser’s services because the Adviser is responsible for coordinating services provided to the Fund by others. Based on their review, the directors concluded that the Fund’s expense ratio was acceptable.
Economies of Scale
The directors noted that the advisory fee schedule for the Fund contains breakpoints that reduce the fee rates on assets above specified levels. The directors took into consideration prior presentations by an independent consultant on economies of scale in the mutual fund industry and for the AB Funds, and presentations from time to time by the Adviser concerning certain of its views on economies of scale. The directors also previously discussed economies of scale with an independent fee consultant. The directors also had requested and received from the Adviser certain updates on economies of scale in advance of the Meeting. The directors believe that economies of scale may be realized (if at all) by the Adviser across a variety of products and services, and not only in respect of a single fund. The directors noted that there is no established methodology for setting breakpoints that give effect to the fund-specific services provided by a fund’s adviser and to the economies of scale that an adviser may realize in its overall mutual fund business or those components of it which directly or indirectly affect a fund’s operations. The directors observed that in the mutual fund industry as a whole, as well as among funds similar to the Fund, there is no uniformity or pattern in the fees and asset levels at which breakpoints (if any) apply. The directors also noted that the advisory agreements for many funds do not have breakpoints at all. Having taken these factors into account, the directors concluded that the Fund’s shareholders would benefit from a sharing of economies of scale in the event the Fund’s net assets exceed a breakpoint in the future.
| 72 | AB TAX-AWARE FIXED INCOME OPPORTUNITIES PORTFOLIO | abfunds.com | |
This page is not part of the Shareholder Report or the Financial Statements.
AB FAMILY OF FUNDS
US EQUITY
CORE
Core Opportunities Fund
FlexFee™ US Thematic Portfolio
Select US Equity Portfolio
GROWTH
Concentrated Growth Fund
Discovery Growth Fund
FlexFee™ Large Cap Growth Portfolio
Growth Fund
Large Cap Growth Fund
Small Cap Growth Portfolio
VALUE
Discovery Value Fund
Equity Income Fund
Relative Value Fund
Small Cap Value Portfolio
Value Fund
INTERNATIONAL/ GLOBAL EQUITY
CORE
FlexFee™ International Strategic Core Portfolio
Global Core Equity Portfolio
International Portfolio
International Strategic Core Portfolio
Sustainable Global Thematic Fund
Tax-Managed International Portfolio
Tax-Managed Wealth Appreciation Strategy
Wealth Appreciation Strategy
INTERNATIONAL/ GLOBAL EQUITY (continued)
GROWTH
Concentrated International Growth Portfolio
FlexFee™ Emerging Markets Growth Portfolio
Sustainable International Thematic Fund
VALUE
All China Equity Portfolio
International Value Fund
FIXED INCOME
MUNICIPAL
High Income Municipal Portfolio
Intermediate California Municipal Portfolio
Intermediate Diversified Municipal Portfolio
Intermediate New York Municipal Portfolio
Municipal Bond Inflation Strategy
Tax-Aware Fixed Income Opportunities Portfolio1
National Portfolio
Arizona Portfolio
California Portfolio
Massachusetts Portfolio
Minnesota Portfolio
New Jersey Portfolio
New York Portfolio
Ohio Portfolio
Pennsylvania Portfolio
Virginia Portfolio
FIXED INCOME (continued)
TAXABLE
Bond Inflation Strategy
FlexFee™ High Yield Portfolio
FlexFee™ International Bond Portfolio
Global Bond Fund
High Income Fund
Income Fund
Intermediate Duration Portfolio
Limited Duration High Income Portfolio
Short Duration Income Portfolio
Short Duration Portfolio
Total Return Bond Portfolio1
ALTERNATIVES
All Market Real Return Portfolio
Global Real Estate Investment Fund
Select US Long/Short Portfolio
Unconstrained Bond Fund
MULTI-ASSET
All Market Income Portfolio
All Market Total Return Portfolio
Conservative Wealth Strategy
Emerging Markets Multi-Asset Portfolio
Global Risk Allocation Fund
Tax-Managed All Market Income Portfolio
CLOSED-END FUNDS
AllianceBernstein Global High Income Fund
AllianceBernstein National Municipal Income Fund
We also offer Government Money Market Portfolio, which serves as the money market fund exchange vehicle for the AB mutual funds. You could lose money by investing in the Fund. Although the Fund seeks to preserve the value of your investment at $1.00 per share, it cannot guarantee it will do so. The Fund may impose a fee upon sale of your shares or may temporarily suspend your ability to sell shares if the Fund’s liquidity falls below required minimums because of market conditions or other factors. An investment in the Fund is not insured or guaranteed by the Federal Deposit Insurance Corporation or any other government agency. The Fund’s sponsor has no legal obligation to provide financial support to the Fund, and you should not expect that the sponsor will provide financial support to the Fund at any time.
Investors should consider the investment objectives, risks, charges and expenses of the Fund carefully before investing. For copies of our prospectus or summary prospectus, which contain this and other information, visit us online at www.abfunds.com or contact your AB representative. Please read the prospectus and/or summary prospectus carefully before investing.
| 1 | Prior to July 12, 2019, Total Return Bond Portfolio was named Intermediate Bond Portfolio; prior to February 5, 2020, Tax-Aware Fixed Income Opportunities Portfolio was named Tax-Aware Fixed Income Portfolio. |
| abfunds.com | AB TAX-AWARE FIXED INCOME OPPORTUNITIES PORTFOLIO | 73 | |
NOTES
| 74 | AB TAX-AWARE FIXED INCOME OPPORTUNITIES PORTFOLIO | abfunds.com | |
NOTES
| abfunds.com | AB TAX-AWARE FIXED INCOME OPPORTUNITIES PORTFOLIO | 75 | |
NOTES
| 76 | AB TAX-AWARE FIXED INCOME OPPORTUNITIES PORTFOLIO | abfunds.com | |
AB TAX-AWARE FIXED INCOME OPPORTUNITIES PORTFOLIO
1345 Avenue of the Americas
New York, NY 10105
800 221 5672
TAFIO-0152-0420 
| ITEM 2. | CODE OF ETHICS. |
Not applicable when filing a semi-annual report to shareholders.
| ITEM 3. | AUDIT COMMITTEE FINANCIAL EXPERT. |
Not applicable when filing a semi-annual report to shareholders.
| ITEM 4. | PRINCIPAL ACCOUNTANT FEES AND SERVICES. |
Not applicable when filing a semi-annual report to shareholders.
| ITEM 5. | AUDIT COMMITTEE OF LISTED REGISTRANTS. |
Not applicable to the registrant.
| ITEM 6. | INVESTMENTS. |
Please see Schedule of Investments contained in the Report to Shareholders included under Item 1 of this Form N-CSR.
| ITEM 7. | DISCLOSURE OF PROXY VOTING POLICIES AND PROCEDURES FOR CLOSED-END MANAGEMENT INVESTMENT COMPANIES. |
Not applicable to the registrant.
| ITEM 8. | PORTFOLIO MANAGERS OF CLOSED-END MANAGEMENT INVESTMENT COMPANIES. |
Not applicable to the registrant.
| ITEM 9. | PURCHASES OF EQUITY SECURITIES BY CLOSED-END MANAGEMENT INVESTMENT COMPANY AND AFFILIATED PURCHASERS. |
Not applicable to the registrant.
| ITEM 10. | SUBMISSION OF MATTERS TO A VOTE OF SECURITY HOLDERS. |
There have been no material changes to the procedures by which shareholders may recommend nominees to the Fund’s Board of Directors since the Fund last provided disclosure in response to this item.
| ITEM 11. | CONTROLS AND PROCEDURES. |
(a) The registrant’s principal executive officer and principal financial officer have concluded that the registrant’s disclosure controls and procedures (as defined in Rule 30a-2(c) under the Investment Company Act of 1940, as amended) are effective at the reasonable assurance level based on their evaluation of these controls and procedures as of a date within 90 days of the filing date of this document.
(b) There were no changes in the registrant’s internal controls over financial reporting that occurred during the second fiscal quarter of the period that has materially affected, or is reasonably likely to materially affect, the registrant’s internal control over financial reporting.
| ITEM 12. | DISCLOSURE OF SECURITIES LENDING ACTIVITIES FOR CLOSED-END MANAGEMENT INVESTMENT COMPANIES. |
Not applicable to the registrant.
| ITEM 13. | EXHIBITS. |
The following exhibits are attached to this Form N-CSR:
SIGNATURES
Pursuant to the requirements of the Securities Exchange Act of 1934 and the Investment Company Act of 1940, the registrant has duly caused this report to be signed on its behalf by the undersigned, thereunto duly authorized.
(Registrant): AB Bond Fund, Inc.
| By: | /s/ Robert M. Keith | |
| Robert M. Keith | ||
| President |
Date: June 26, 2020
Pursuant to the requirements of the Securities Exchange Act of 1934 and the Investment Company Act of 1940, this report has been signed below by the following persons on behalf of the registrant and in the capacities and on the dates indicated.
| By: | /s/ Robert M. Keith | |
| Robert M. Keith | ||
| President |
Date: June 26, 2020
| By: | /s/ Joseph J. Mantineo | |
| Joseph J. Mantineo | ||
| Treasurer and Chief Financial Officer |
Date: June 26, 2020