Net income $1.0B, down $1.2B from a year ago; Total company adjusted pre-tax profit $1.4B, down $1.7B Earnings per share $0.24, down $0.31 from a year ago; adjusted earnings per share $0.26, down $0.26 2016 Guidance: Ford continues to expect total company adjusted pre-tax profit to be about $10.2 billion Global market share of 7.5 percent, down one-tenth of a percentage point from a year ago Ford Credit delivered best quarterly profit since 2011 Automotive segment operating cash flow $(2.0)B, down $4.8B from a year ago Automotive segment pre-tax profit $1.1B, down $1.7B Automotive segment operating margin 3.3 percent Strong cash and liquidity including Automotive cash of $24.3B; cash net of debt $11.2B and total liquidity $35.2B Launched first all-new F-Series Super Duty in 18 years, as well as the flagship Lincoln Continental; on track for 12 global product launches in 2016 Europe delivered $138M pre-tax profit, sixth profitable quarter in a row and best 3Q since 2007 Ford remains Europe’s best-selling commercial vehicle brand Asia Pacific delivered a record 3Q pre-tax profit of $131M, up $109M from a year ago Ford surpassed 1 million sales in Asia Pacific following record August sales Ford Smart Mobility LLC invested in Zoomcar, the car- sharing leader in India Distributed $600M to shareholders in a regular quarterly dividend Global Lincoln sales up 17 percent from a year ago Year-to-date, net income $5.4B, down 2 percent, and adjusted pre-tax profit $8.2B, up $53M 2 0 1 6 T H I R D Q U A R T E R F I N A N C I A L R E S U LT S Ford Motor Company 3Q October 27, 2016 ”This quarter, we delivered key elements of our growth plan by fortifying our core business with the launch of the all-new Super Duty pickup, transforming Lincoln with the new Continental and investing in emerging opportunities with the acquisition of the Chariot crowd-sourced shuttle service. Importantly, we remain on track to deliver one of our best profit years ever.” Mark Fields, President & CEO Ford Delivers Third Quarter $1.0B Net Income; $1.4B Adjusted Pre-Tax Profit Net Income Adjusted Pre-Tax Profit (Non-GAAP) Revenue Wholesales Automotive Segment Operating Margin Automotive Segment Operating Cash Flow 3Q 2016 $1.0B $1.4B $35.9B 1,530K 3.3% $(2.0)B B/(W) 3Q 2015 $(1.2)B $(1.7)B $(2.2)B (66)K (4.4) ppts $(4.8)B H I G H L I G H T S * P R O D U C T S & S E R V I C E S With its first-ever major redesign, the 2017 Ford F-Series Super Duty – America’s best-selling heavy-duty pickup truck – further raises the bar with a new high-strength, military- grade, aluminum-alloy body . With multiple new chassis, powertrain and technology features, it is the toughest, smartest, most capable Super Duty ever. 2017 Ford F-Series Super Duty 2017 Lincoln Continental Chariot Shuttle Ford Fusion Hybrid Autonomous Vehicle Lincoln marked the return of its flagship nameplate with the all-new Continental that provides an elegant, effortlessly powerful and serene experience. Technologies include the innovative E-Latch door systems, Lincoln’s Perfect Position seats and a host of rear seat amenities. Ford Smart Mobility LLC acquired Chariot, a San Francisco-based crowd-sourced shuttle service that serves as the foundation to grow Ford’s dynamic shuttle services globally. The service will provide affordable and convenient transportation to at least five additional markets in the next 18 months. Ford announced its intention to offer a high-volume, fully autonomous SAE level 4-capable vehicle in commercial operation in 2021 in a ride-hailing or ride- sharing service. Ford also is investing in or collaborating with four startups to enhance its autonomous vehicle development and doubling its Silicon Valley team and Palo Alto campus. *See endnote on page 4. For news releases, related materials and high-resolution photos and video, visit www.media.ford.com. Follow at www.facebook.com/ford, www.twitter.com/ford or www.youtube.com/fordvideo1 │ NEWS www.facebook.com/ford www.twitter.com/ford

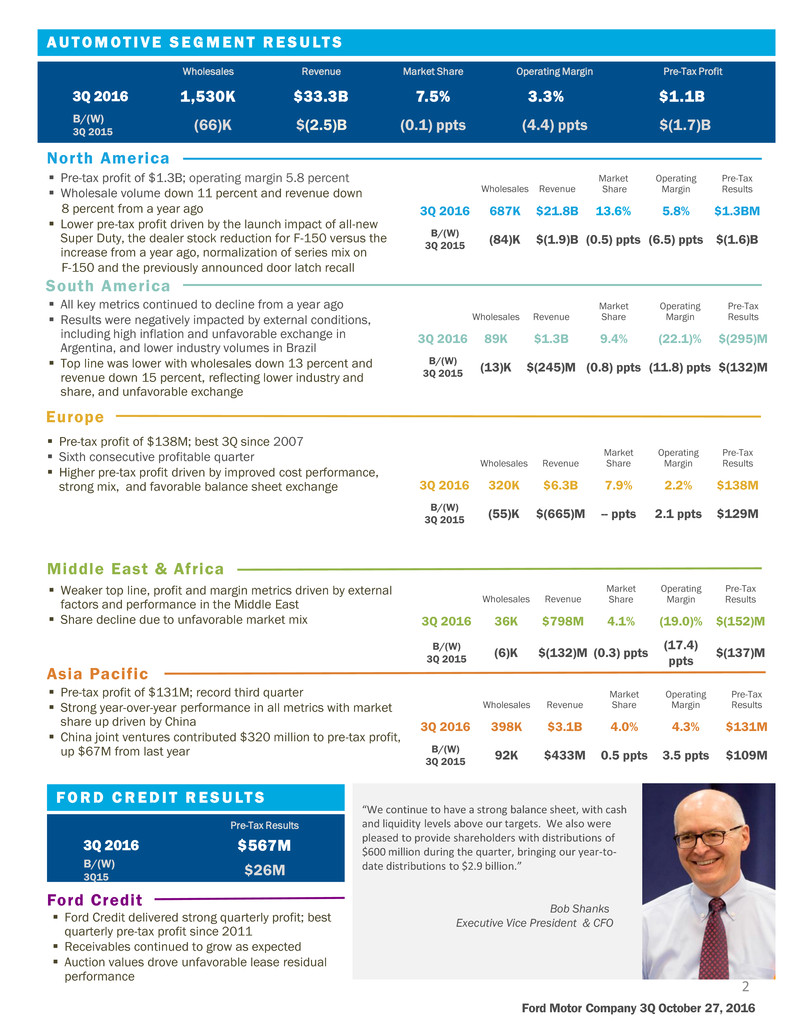
A U T O M O T I V E S E G M E N T R E S U LT S Pre-tax profit of $1.3B; operating margin 5.8 percent Wholesale volume down 11 percent and revenue down 8 percent from a year ago Lower pre-tax profit driven by the launch impact of all-new Super Duty, the dealer stock reduction for F-150 versus the increase from a year ago, normalization of series mix on F-150 and the previously announced door latch recall North America Wholesales Revenue Market Share Operating Margin Pre-Tax Results 3Q 2016 687K $21.8B 13.6% 5.8% $1.3BM B/(W) 3Q 2015 (84)K $(1.9)B (0.5) ppts (6.5) ppts $(1.6)B All key metrics continued to decline from a year ago Results were negatively impacted by external conditions, including high inflation and unfavorable exchange in Argentina, and lower industry volumes in Brazil Top line was lower with wholesales down 13 percent and revenue down 15 percent, reflecting lower industry and share, and unfavorable exchange South America Wholesales Revenue Market Share Operating Margin Pre-Tax Results 3Q 2016 89K $1.3B 9.4% (22.1)% $(295)M B/(W) 3Q 2015 (13)K $(245)M (0.8) ppts (11.8) ppts $(132)M Pre-tax profit of $138M; best 3Q since 2007 Sixth consecutive profitable quarter Higher pre-tax profit driven by improved cost performance, strong mix, and favorable balance sheet exchange Europe Wholesales Revenue Market Share Operating Margin Pre-Tax Results 3Q 2016 320K $6.3B 7.9% 2.2% $138M B/(W) 3Q 2015 (55)K $(665)M -- ppts 2.1 ppts $129M Weaker top line, profit and margin metrics driven by external factors and performance in the Middle East Share decline due to unfavorable market mix Middle East & Africa Wholesales Revenue Market Share Operating Margin Pre-Tax Results 3Q 2016 36K $798M 4.1% (19.0)% $(152)M B/(W) 3Q 2015 (6)K $(132)M (0.3) ppts (17.4) ppts $(137)M Pre-tax profit of $131M; record third quarter Strong year-over-year performance in all metrics with market share up driven by China China joint ventures contributed $320 million to pre-tax profit, up $67M from last year Asia Pacific Wholesales Revenue Market Share Operating Margin Pre-Tax Results 3Q 2016 398K $3.1B 4.0% 4.3% $131M B/(W) 3Q 2015 92K $433M 0.5 ppts 3.5 ppts $109M F O R D C R E D I T R E S U LT S Ford Credit delivered strong quarterly profit; best quarterly pre-tax profit since 2011 Receivables continued to grow as expected Auction values drove unfavorable lease residual performance Ford Credit “We continue to have a strong balance sheet, with cash and liquidity levels above our targets. We also were pleased to provide shareholders with distributions of $600 million during the quarter, bringing our year-to- date distributions to $2.9 billion.” Bob Shanks Executive Vice President & CFO Wholesales Revenue Market Share Operating Margin Pre-Tax Profit 3Q 2016 1,530K $33.3B 7.5% 3.3% $1.1B B/(W) 3Q 2015 (66)K $(2.5)B (0.1) ppts (4.4) ppts $(1.7)B Pre-Tax Results 3Q 2016 $567M B/(W) 3Q15 $26M Ford Motor Company 3Q October 27, 2016 2

R I S K F A C T O R S Statements included or incorporated by reference herein may constitute "forward-looking statements" within the meaning of the Private Securities Litigation Reform Act of 1995. Forward-looking statements are based on expectations, forecasts, and assumptions by our management and involve a number of risks, uncertainties, and other factors that could cause actual results to differ materially from those stated, including, without limitation: Decline in industry sales volume, particularly in the United States, Europe, or China due to financial crisis, recession, geopolitical events, or other factors; Decline in Ford's market share or failure to achieve growth; Lower-than-anticipated market acceptance of Ford's new or existing products or services; Market shift away from sales of larger, more profitable vehicles beyond Ford's current planning assumption, particularly in the United States; An increase in or continued volatility of fuel prices, or reduced availability of fuel; Continued or increased price competition resulting from industry excess capacity, currency fluctuations, or other factors; Fluctuations in foreign currency exchange rates, commodity prices, and interest rates; Adverse effects resulting from economic, geopolitical, or other events; Economic distress of suppliers that may require Ford to provide substantial financial support or take other measures to ensure supplies of components or materials and could increase costs, affect liquidity, or cause production constraints or disruptions; Work stoppages at Ford or supplier facilities or other limitations on production (whether as a result of labor disputes, natural or man- made disasters, tight credit markets or other financial distress, production constraints or difficulties, or other factors); Single-source supply of components or materials; Labor or other constraints on Ford's ability to maintain competitive cost structure; Substantial pension and postretirement health care and life insurance liabilities impairing our liquidity or financial condition; Worse-than-assumed economic and demographic experience for postretirement benefit plans (e.g., discount rates or investment returns); Restriction on use of tax attributes from tax law "ownership change”; The discovery of defects in vehicles resulting in delays in new model launches, recall campaigns, or increased warranty costs; Increased safety, emissions, fuel economy, or other regulations resulting in higher costs, cash expenditures, and / or sales restrictions; Unusual or significant litigation, governmental investigations, or adverse publicity arising out of alleged defects in products, perceived environmental impacts, or otherwise; A change in requirements under long-term supply arrangements committing Ford to purchase minimum or fixed quantities of certain parts, or to pay a minimum amount to the seller ("take-or-pay" contracts); Adverse effects on results from a decrease in or cessation or clawback of government incentives related to investments; Inherent limitations of internal controls impacting financial statements and safeguarding of assets; Cybersecurity risks to operational systems, security systems, or infrastructure owned by Ford, Ford Credit, or a third-party vendor or supplier; Failure of financial institutions to fulfill commitments under committed credit and liquidity facilities; Inability of Ford Credit to access debt, securitization, or derivative markets around the world at competitive rates or in sufficient amounts, due to credit rating downgrades, market volatility, market disruption, regulatory requirements, or other factors; Higher-than-expected credit losses, lower-than-anticipated residual values, or higher-than-expected return volumes for leased vehicles; Increased competition from banks, financial institutions, or other third parties seeking to increase their share of financing Ford vehicles; and New or increased credit regulations, consumer or data protection regulations or other regulations resulting in higher costs and / or additional financing restrictions. We cannot be certain that any expectation, forecast, or assumption made in preparing forward-looking statements will prove accurate, or that any projection will be realized. It is to be expected that there may be differences between projected and actual results. Our forward- looking statements speak only as of the date of their initial issuance, and we do not undertake any obligation to update or revise publicly any forward-looking statement, whether as a result of new information, future events, or otherwise. For additional discussion, see "Item 1A. Risk Factors" in our Annual Report on Form 10-K for the year ended December 31, 2015, as updated by subsequent Quarterly Reports on Form 10-Q and Current Reports on Form 8-K. Ford Motor Company 3Q October 27, 2016 3

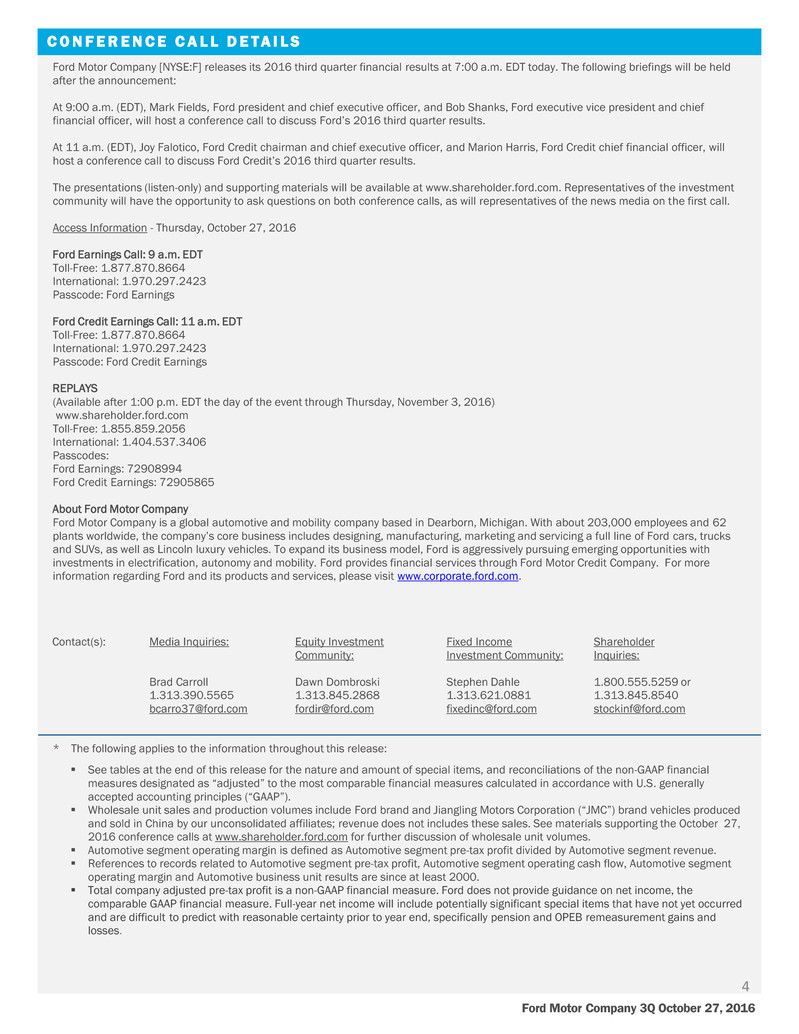
Ford Motor Company [NYSE:F] releases its 2016 third quarter financial results at 7:00 a.m. EDT today. The following briefings will be held after the announcement: At 9:00 a.m. (EDT), Mark Fields, Ford president and chief executive officer, and Bob Shanks, Ford executive vice president and chief financial officer, will host a conference call to discuss Ford’s 2016 third quarter results. At 11 a.m. (EDT), Joy Falotico, Ford Credit chairman and chief executive officer, and Marion Harris, Ford Credit chief financial officer, will host a conference call to discuss Ford Credit’s 2016 third quarter results. The presentations (listen-only) and supporting materials will be available at www.shareholder.ford.com. Representatives of the investment community will have the opportunity to ask questions on both conference calls, as will representatives of the news media on the first call. Access Information - Thursday, October 27, 2016 Ford Earnings Call: 9 a.m. EDT Toll-Free: 1.877.870.8664 International: 1.970.297.2423 Passcode: Ford Earnings Ford Credit Earnings Call: 11 a.m. EDT Toll-Free: 1.877.870.8664 International: 1.970.297.2423 Passcode: Ford Credit Earnings REPLAYS (Available after 1:00 p.m. EDT the day of the event through Thursday, November 3, 2016) www.shareholder.ford.com Toll-Free: 1.855.859.2056 International: 1.404.537.3406 Passcodes: Ford Earnings: 72908994 Ford Credit Earnings: 72905865 About Ford Motor Company Ford Motor Company is a global automotive and mobility company based in Dearborn, Michigan. With about 203,000 employees and 62 plants worldwide, the company’s core business includes designing, manufacturing, marketing and servicing a full line of Ford cars, trucks and SUVs, as well as Lincoln luxury vehicles. To expand its business model, Ford is aggressively pursuing emerging opportunities with investments in electrification, autonomy and mobility. Ford provides financial services through Ford Motor Credit Company. For more information regarding Ford and its products and services, please visit www.corporate.ford.com. * The following applies to the information throughout this release: See tables at the end of this release for the nature and amount of special items, and reconciliations of the non-GAAP financial measures designated as “adjusted” to the most comparable financial measures calculated in accordance with U.S. generally accepted accounting principles (“GAAP”). Wholesale unit sales and production volumes include Ford brand and Jiangling Motors Corporation (“JMC”) brand vehicles produced and sold in China by our unconsolidated affiliates; revenue does not includes these sales. See materials supporting the October 27, 2016 conference calls at www.shareholder.ford.com for further discussion of wholesale unit volumes. Automotive segment operating margin is defined as Automotive segment pre-tax profit divided by Automotive segment revenue. References to records related to Automotive segment pre-tax profit, Automotive segment operating cash flow, Automotive segment operating margin and Automotive business unit results are since at least 2000. Total company adjusted pre-tax profit is a non-GAAP financial measure. Ford does not provide guidance on net income, the comparable GAAP financial measure. Full-year net income will include potentially significant special items that have not yet occurred and are difficult to predict with reasonable certainty prior to year end, specifically pension and OPEB remeasurement gains and losses. C O N F E R E N C E C A L L D E TA I L S Contact(s): Media Inquiries: Equity Investment Fixed Income Shareholder Brad Carroll Community: Dawn Dombroski Investment Community: Stephen Dahle Inquiries: 1.800.555.5259 or 1.313.390.5565 1.313.845.2868 1.313.621.0881 1.313.845.8540 bcarro37@ford.com fordir@ford.com fixedinc@ford.com stockinf@ford.com Ford Motor Company 3Q October 27, 2016 4

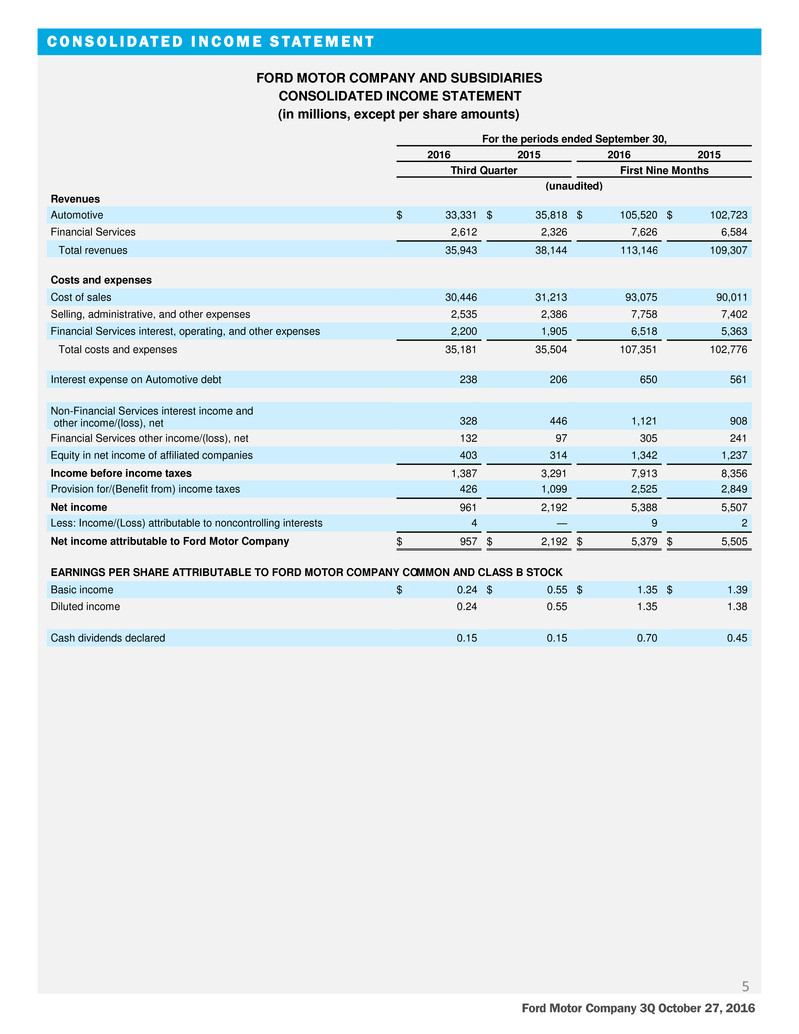
C O N S O L I D AT E D I N C O M E S T AT E M E N T Ford Motor Company 3Q October 27, 2016 5 FORD MOTOR COMPANY AND SUBSIDIARIES CONSOLIDATED INCOME STATEMENT (in millions, except per share amounts) For the periods ended September 30, 2016 2015 2016 2015 Third Quarter First Nine Months (unaudited) Revenues Automotive $ 33,331 $ 35,818 $ 105,520 $ 102,723 Financial Services 2,612 2,326 7,626 6,584 Total revenues 35,943 38,144 113,146 109,307 Costs and expenses Cost of sales 30,446 31,213 93,075 90,011 Selling, administrative, and other expenses 2,535 2,386 7,758 7,402 Financial Services interest, operating, and other expenses 2,200 1,905 6,518 5,363 Total costs and expenses 35,181 35,504 107,351 102,776 Interest expense on Automotive debt 238 206 650 561 Non-Financial Services interest income and other income/(loss), net 328 446 1,121 908 Financial Services other income/(loss), net 132 97 305 241 Equity in net income of affiliated companies 403 314 1,342 1,237 Income before income taxes 1,387 3,291 7,913 8,356 Provision for/(Benefit from) income taxes 426 1,099 2,525 2,849 Net income 961 2,192 5,388 5,507 Less: Income/(Loss) attributable to noncontrolling interests 4 — 9 2 Net income attributable to Ford Motor Company $ 957 $ 2,192 $ 5,379 $ 5,505 EARNINGS PER SHARE ATTRIBUTABLE TO FORD MOTOR COMPANY COMMON AND CLASS B STOCK Basic income $ 0.24 $ 0.55 $ 1.35 $ 1.39 Diluted income 0.24 0.55 1.35 1.38 Cash dividends declared 0.15 0.15 0.70 0.45

C O N S O L I D AT E D B A L A N C E S H E E T Ford Motor Company 3Q October 27, 2016 6 FORD MOTOR COMPANY AND SUBSIDIARIES CONSOLIDATED BALANCE SHEET (in millions) September 30, 2016 December 31, 2015 (unaudited) ASSETS Cash and cash equivalents $ 13,340 $ 14,272 Marketable securities 20,825 20,904 Financial Services finance receivables, net 45,550 45,137 Trade and other receivables, less allowances of $359 and $372 10,029 11,042 Inventories 10,219 8,319 Other assets 3,552 2,913 Total current assets 103,515 102,587 Financial Services finance receivables, net 49,614 45,554 Net investment in operating leases 29,196 27,093 Net property 32,257 30,163 Equity in net assets of affiliated companies 3,795 3,224 Deferred income taxes 9,475 11,509 Other assets 7,111 4,795 Total assets $ 234,963 $ 224,925 LIABILITIES Payables $ 22,384 $ 20,272 Other liabilities and deferred revenue 19,531 19,089 Automotive debt payable within one year 2,472 1,779 Financial Services debt payable within one year 44,801 41,196 Total current liabilities 89,188 82,336 Other liabilities and deferred revenue 23,652 23,457 Automotive long-term debt 10,675 11,060 Financial Services long-term debt 79,276 78,819 Deferred income taxes 577 502 Total liabilities 203,368 196,174 Redeemable noncontrolling interest 96 94 EQUITY Common Stock, par value $.01 per share (3,976 million shares issued of 6 billion authorized) 40 40 Class B Stock, par value $.01 per share (71 million shares issued of 530 million authorized) 1 1 Capital in excess of par value of stock 21,598 21,421 Retained earnings 17,013 14,414 Accumulated other comprehensive income/(loss) (6,046 ) (6,257 ) Treasury stock (1,122 ) (977 ) Total equity attributable to Ford Motor Company 31,484 28,642 Equity attributable to noncontrolling interests 15 15 Total equity 31,499 28,657 Total liabilities and equity $ 234,963 $ 224,925

C O N S O L I D AT E D S T AT E M E N T O F C A S H F L O W S Ford Motor Company 3Q October 27, 2016 7 FORD MOTOR COMPANY AND SUBSIDIARIES CONDENSED CONSOLIDATED STATEMENT OF CASH FLOWS (in millions) For the periods ended September 30, 2016 2015 First Nine Months (unaudited) Cash flows from operating activities Net cash provided by/(used in) operating activities $ 16,994 $ 14,078 Cash flows from investing activities Capital spending (4,912 ) (5,358 ) Acquisitions of finance receivables and operating leases (43,746 ) (43,762 ) Collections of finance receivables and operating leases 30,254 28,632 Purchases of equity and debt securities (22,049 ) (29,493 ) Sales and maturities of equity and debt securities 22,022 32,874 Settlements of derivatives 330 26 Other 43 417 Net cash provided by/(used in) investing activities (18,058 ) (16,664 ) Cash flows from financing activities Cash dividends (2,780 ) (1,785 ) Purchases of Common Stock (145 ) (129 ) Net changes in short-term debt 1,200 844 Proceeds from issuance of other debt 31,956 35,876 Principal payments on other debt (30,019 ) (27,366 ) Other (44 ) (303 ) Net cash provided by/(used in) financing activities 168 7,137 Effect of exchange rate changes on cash and cash equivalents (36 ) (622 ) Net increase/(decrease) in cash and cash equivalents $ (932 ) $ 3,929 Cash and cash equivalents at January 1 $ 14,272 $ 10,757 Net increase/(decrease) in cash and cash equivalents (932 ) 3,929 Cash and cash equivalents at September 30 $ 13,340 $ 14,686

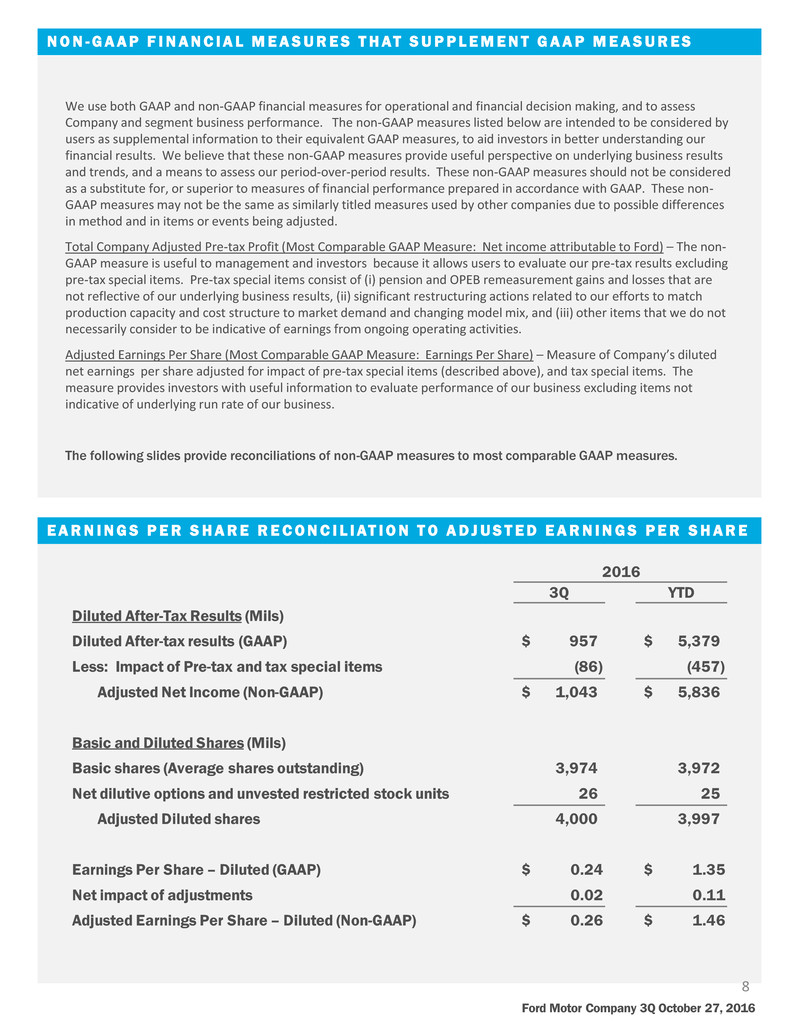
N O N - G A A P F I N A N C I A L M E A S U R E S T H AT S U P P L E M E N T G A A P M E A S U R E S Ford Motor Company 3Q October 27, 2016 We use both GAAP and non-GAAP financial measures for operational and financial decision making, and to assess Company and segment business performance. The non-GAAP measures listed below are intended to be considered by users as supplemental information to their equivalent GAAP measures, to aid investors in better understanding our financial results. We believe that these non-GAAP measures provide useful perspective on underlying business results and trends, and a means to assess our period-over-period results. These non-GAAP measures should not be considered as a substitute for, or superior to measures of financial performance prepared in accordance with GAAP. These non- GAAP measures may not be the same as similarly titled measures used by other companies due to possible differences in method and in items or events being adjusted. Total Company Adjusted Pre-tax Profit (Most Comparable GAAP Measure: Net income attributable to Ford) – The non- GAAP measure is useful to management and investors because it allows users to evaluate our pre-tax results excluding pre-tax special items. Pre-tax special items consist of (i) pension and OPEB remeasurement gains and losses that are not reflective of our underlying business results, (ii) significant restructuring actions related to our efforts to match production capacity and cost structure to market demand and changing model mix, and (iii) other items that we do not necessarily consider to be indicative of earnings from ongoing operating activities. Adjusted Earnings Per Share (Most Comparable GAAP Measure: Earnings Per Share) – Measure of Company’s diluted net earnings per share adjusted for impact of pre-tax special items (described above), and tax special items. The measure provides investors with useful information to evaluate performance of our business excluding items not indicative of underlying run rate of our business. The following slides provide reconciliations of non-GAAP measures to most comparable GAAP measures. 8 E A R N I N G S P E R S H A R E R E C O N C I L I AT I O N T O A D J U S T E D E A R N I N G S P E R S H A R E 2016 3Q YTD Diluted After-Tax Results (Mils) Diluted After-tax results (GAAP) $ 957 $ 5,379 Less: Impact of Pre-tax and tax special items (86) (457) Adjusted Net Income (Non-GAAP) $ 1,043 $ 5,836 Ba i an Diluted Shares (Mils) Ba ic shares (Average shares outstanding) 3,974 3,972 N t dilut ve op ions and unvested restricted stock units 26 25 Adjusted Diluted shares 4,000 3,997 Earnings Per Share – Diluted (GAAP) $ 0.24 $ 1.35 Net impact of adjustments 0.02 0.11 Adjusted Earnings Per Share – Diluted (Non-GAAP) $ 0.26 $ 1.46

N E T I N C O M E R E C O N C I L I AT I O N T O A D J U S T E D P R E - TA X P R O F I T T O TA L C O M PA N Y S P E C I A L I T E M S Ford Motor Company 3Q October 27, 2016 9 (Mils) 3Q YTD Memo: 2015 2016 2015 2016 FY 2015 Net income / (loss) attributable to Ford (GAAP) $ 2,192 $ 957 $ 5,505 $ 5,379 $ 7,373 Income / (Loss) attributable to non-controlling interests -- 4 2 9 (2) Net income $ 2,192 $ 961 $ 5,507 $ 5,388 $ 7,371 Less: (Provision for) / Benefit from income taxes (1,099) (426) (2,849) (2,525) (2,881) Income before income taxes $ 3,291 $ 1,387 $ 8,356 $ 7,913 $ 10,252 Less: Special items pre-tax 166 (26) 166 (330) (548) Adjusted pre-tax profit / (loss) (Non-GAAP) $ 3,125 $ 1,413 $ 8,190 $ 8,243 $ 10,800 , except amounts per share data) 3Q YTD : 2015 2016 2015 2016 Pre-tax Special Items Separation-related actions $ -- $ (17) $ -- $ (293) $ -- Japan / Indonesia market closure -- (9) -- (26) -- Nemak IPO 166 -- 166 -- 150 Pension & OPEB remeasurement gains / (losses) -- -- -- (11) (698) Total Pre-tax special items $ 166 $ (26) $ 166 $ (330) $ (548) Tax Special Items Net tax effect of Pre-tax special items $ (58) $ 9 $ (58) $ 116 $ 205 Tax expense of entity restructurings -- (69) -- (243) -- Total tax special items $ (58) $ (60) $ (58) $ (127) $ 205 Memo: Special items impact on earnings per share $ 0.03 $ (0.02) $ 0.03 $ (0.11) $ (0.09)


