Free signup for more
- Track your favorite companies
- Receive email alerts for new filings
- Personalized dashboard of news and more
- Access all data and search results
Filing tables
Filing exhibits
- 8-K Current report
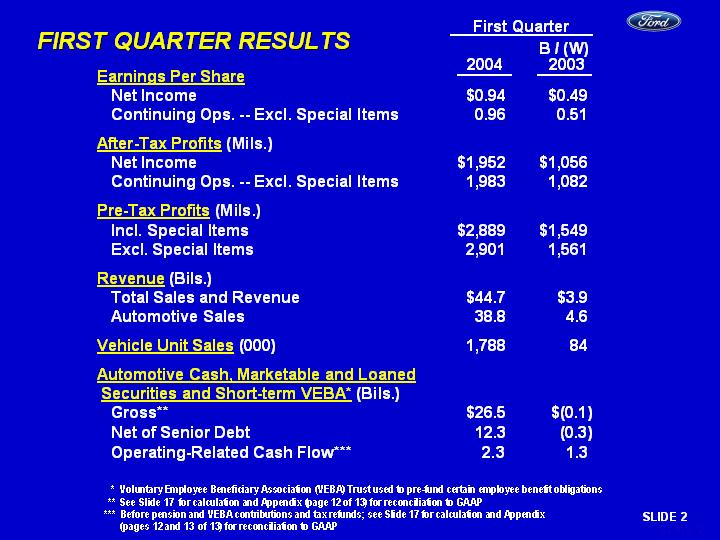
- 99.1 News Release, Dated April 21, 2004
- 99.2 Sector Statement of Income
- 99.3 Consolidated Statement of Income
- 99.4 Sector Balance Sheet
- 99.5 Consolidated Balance Sheet
- 99.6 Condensed Sector Statement of Cash Flows
- 99.7 Condensed Consolidated Statement of Cash Flows
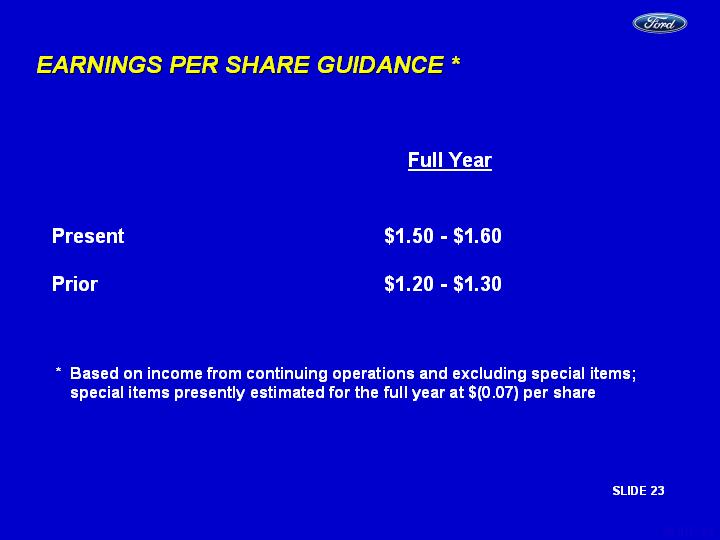
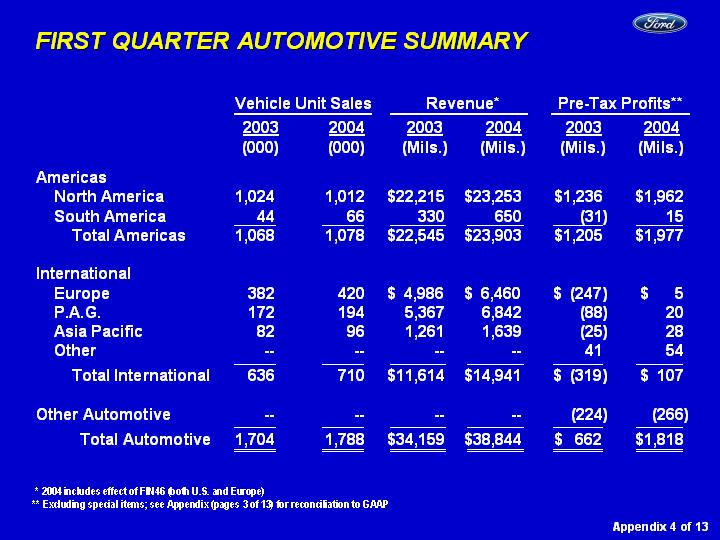
- 99.8 Investment Community Presentation
- 99.9 Fixed Income Presentation
F similar filings
Filing view
External links