Exhibit 99.2

| FIRST QUARTER 2005 EARNINGS REVIEW APRIL 20, 2005 |
SLIDE 1
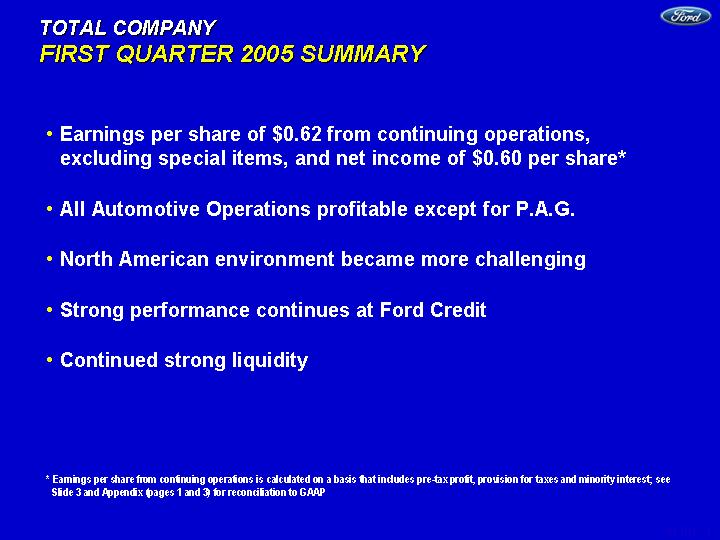
| TOTAL COMPANY FIRST QUARTER 2005 SUMMARY Earnings per share of $0.62 from continuing operations, excluding special items, and net income of $0.60 per share* All Automotive Operations profitable except for P.A.G. North American environment became more challenging Strong performance continues at Ford Credit Continued strong liquidity * Earnings per share from continuing operations is calculated on a basis that includes pre-tax profit, provision for taxes and minority interest; see Slide 3 and Appendix (pages 1 and 3) for reconciliation to GAAP |
SLIDE 2
| Earnings Per Share Net Income $ 0.60 $(0.34 ) Continuing Ops. -- Excl. Special Items 0.62 (0.33 ) After-Tax Profits (Mils.) Net Income $1,212 $(740 ) Continuing Ops. -- Excl. Special Items 1,260 (707 ) Memo: Tax Rate 21.1 % (8.1 ) Pts. Pre-Tax Profits (Mils.) Incl. Special Items $1,549 $(1,314 ) Excl. Special Items 1,655 (1,220 ) Revenue (Bils.) Total Sales and Revenue $45.1 $0.4 Automotive Sales 39.3 0.5 Vehicle Unit Sales (000) 1,716 (72 ) Automotive Cash, Marketable and Loaned Securities and Short-term VEBA* (Bils.) Gross** $22.9 $(3.6 ) Net of Total Debt 4.9 (2.3 ) Operating-Related Cash Flow*** 0.8 (1.6 ) TOTAL COMPANY FIRST QUARTER RESULTS 2005 O / (U) 2004 First Quarter * Voluntary Employee Beneficiary Association (VEBA) Trust used to pre-fund certain employee benefit obligations ** See Appendix (page 14) for reconciliation to GAAP *** Before pension and long-term VEBA contributions and tax refunds; see Slide 14 for calculation and Appendix (pages 14 and 15) for reconciliation to GAAP SLIDE 2 |
SLIDE 3
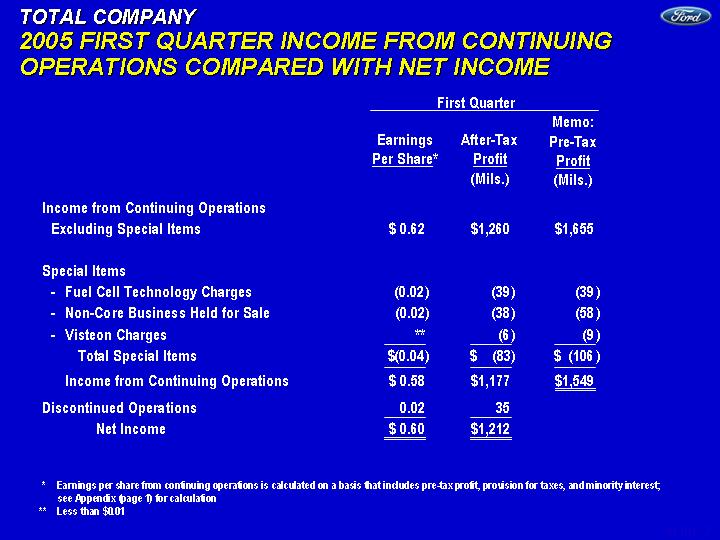
| TOTAL COMPANY 2005 FIRST QUARTER INCOME FROM CONTINUING OPERATIONS COMPARED WITH NET INCOME Memo: Pre-Tax Profit (Mils.) First Quarter Earnings Per Share* Income from Continuing Operations Excluding Special Items $ 0.62 $1,260 $1,655 Special Items - Fuel Cell Technology Charges (0.02 ) (39 ) (39 ) - Non-Core Business Held for Sale (0.02 ) (38 ) (58 ) - Visteon Charges ** (6 ) (9 ) Total Special Items $(0.04 ) $ (83 ) $ (106 ) Income from Continuing Operations $ 0.58 $1,177 $1,549 Discontinued Operations 0.02 35 Net Income $ 0.60 $1,212 After-Tax Profit (Mils.) * Earnings per share from continuing operations is calculated on a basis that includes pre-tax profit, provision for taxes, and minority interest; see Appendix (page 1) for calculation ** Less than $0.01 |
SLIDE 4
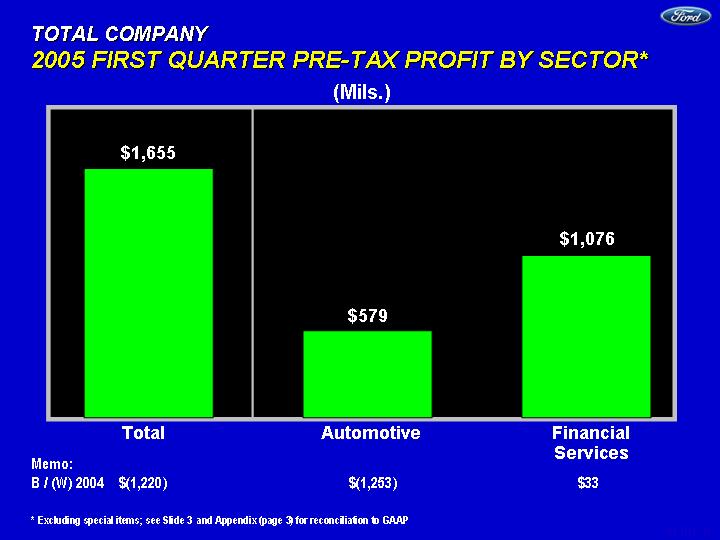
| TOTAL COMPANY 2005 FIRST QUARTER PRE-TAX PROFIT BY SECTOR* * Excluding special items; see Slide 3 and Appendix (page 3) for reconciliation to GAAP Financial Services Automotive Memo: B / (W) 2004 $(1,220) $(1,253) $33 (Mils.) Total Total Auto Fin Svcs 2Q 1655 579 1076 $1,655 $1,076 $579 |
SLIDE 5
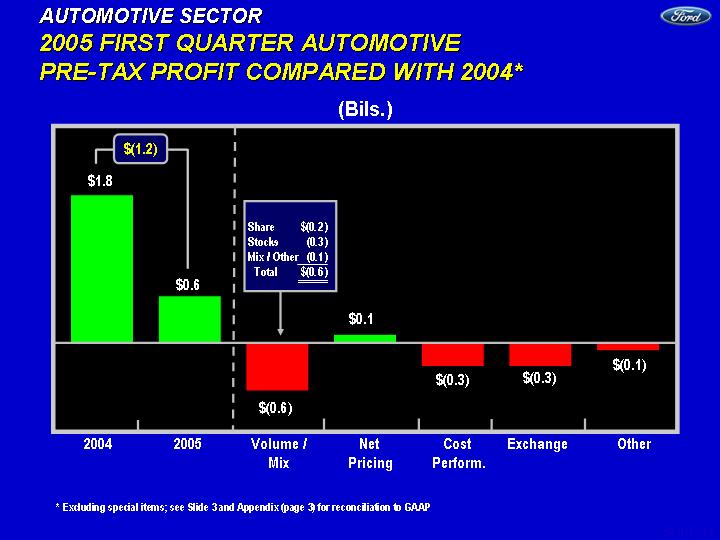
| * Excluding special items; see Slide 3 and Appendix (page 3) for reconciliation to GAAP AUTOMOTIVE SECTOR 2005 FIRST QUARTER AUTOMOTIVE PRE-TAX PROFIT COMPARED WITH 2004* (Bils.) 2204 2005 Volume Revenue Cost Exchange Other 1.831 0.579 -0.6 0.1 -0.3 -0.3 -0.1 $0.1 $(0.6) Net Pricing Cost Perform. $(0.3) Volume / Mix 2005 $0.6 Other 2004 $1.8 $(0.3) Exchange $(0.1) $(1.2) Share $(0.2 ) Stocks (0.3 ) Mix / Other (0.1 ) Total $(0.6 ) |
SLIDE 6
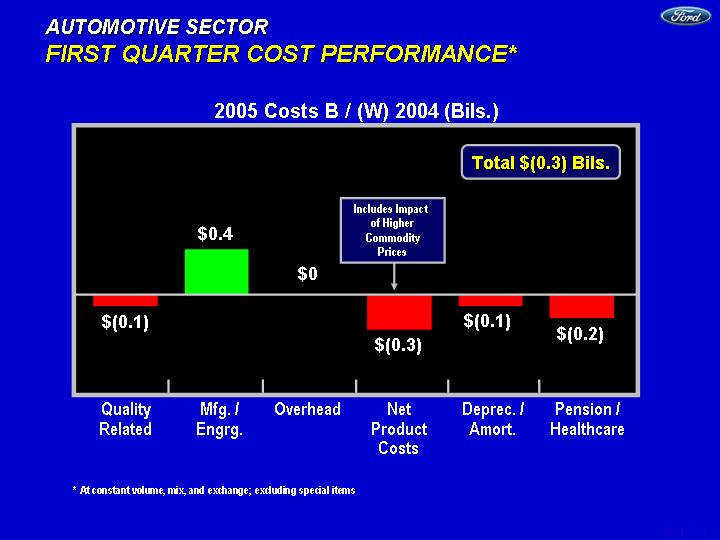
| AUTOMOTIVE SECTOR FIRST QUARTER COST PERFORMANCE* Quality Mfg. Eng Overhead Net Product D&A Pension -0.1 0.4 0 -0.3 -0.1 -0.2 2005 Costs B / (W) 2004 (Bils.) Net Product Costs Quality Related Pension / Healthcare Deprec. / Amort. Mfg. / Engrg. Overhead * At constant volume, mix, and exchange; excluding special items Total $(0.3) Bils. $(0.1) $0 $(0.3) $(0.2) $(0.1) $0.4 Includes Impact of Higher Commodity Prices |
SLIDE 7
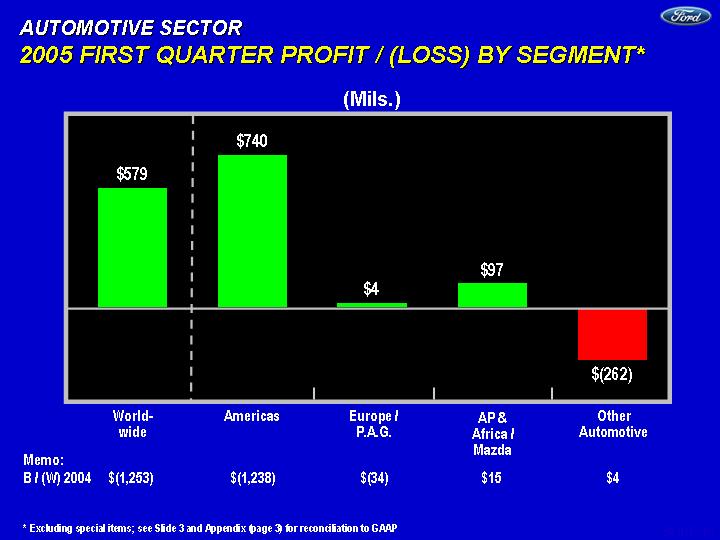
| AUTOMOTIVE SECTOR 2005 FIRST QUARTER PROFIT / (LOSS) BY SEGMENT* Memo: B / (W) 2004 $(1,253) $(1,238) $(34) $15 $4 * Excluding special items; see Slide 3 and Appendix (page 3) for reconciliation to GAAP World- wide Other Automotive WW Americas Europe/PAG AP/Africa Other 2Q 579 740 20 120 -262 Americas $579 $(262) $740 $4 Europe / P.A.G. AP & Africa / Mazda $97 (Mils.) |
SLIDE 8
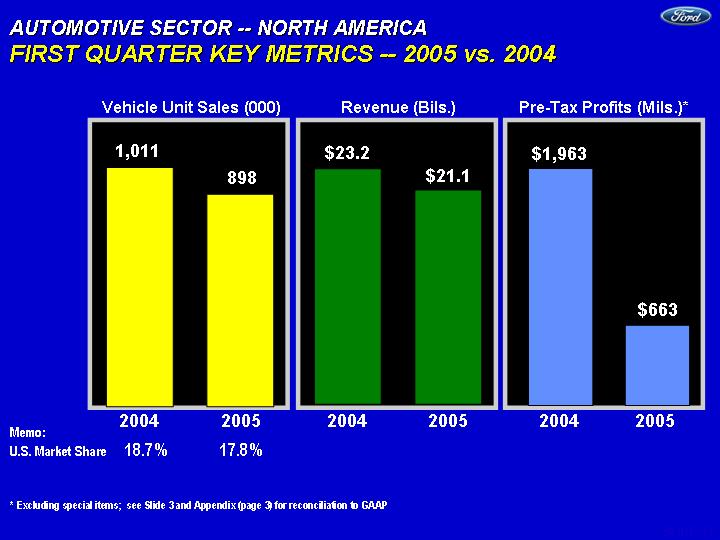
| AUTOMOTIVE SECTOR -- NORTH AMERICA FIRST QUARTER KEY METRICS -- 2005 vs. 2004 2003 2004 Revenue 23.2 21.1 $21.1 $23.2 Revenue (Bils.) 2003 2004 Vehicle Unit Sales 1011 898 898 1,011 Vehicle Unit Sales (000) 2003 2004 PBT 1962 663 $1,963 Pre-Tax Profits (Mils.)* Memo: U.S. Market Share 18.7 % 17.8 % * Excluding special items; see Slide 3 and Appendix (page 3) for reconciliation to GAAP $663 2005 2004 2005 2004 2005 2004 |
SLIDE 9
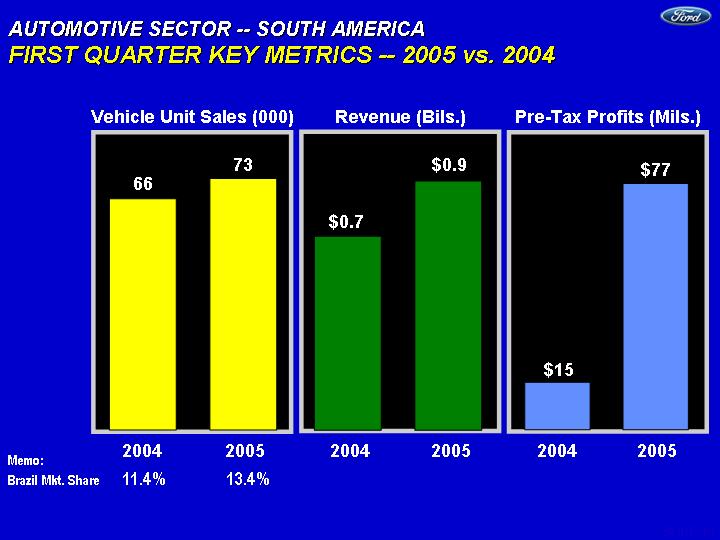
| AUTOMOTIVE SECTOR -- SOUTH AMERICA FIRST QUARTER KEY METRICS -- 2005 vs. 2004 2004 2005 0.7 0.9 $0.9 $0.7 Revenue (Bils.) 2004 2005 Vehicle Unit Sales 66 72 73 66 Vehicle Unit Sales (000) 2004 2005 PBT 15 71 Pre-Tax Profits (Mils.) Memo: Brazil Mkt. Share 11.4 % 13.4 % 2005 2004 2005 2004 2005 2004 2004 2005 0.7 0.9 2003 2004 East 15 77 $15 $77 |
SLIDE 10
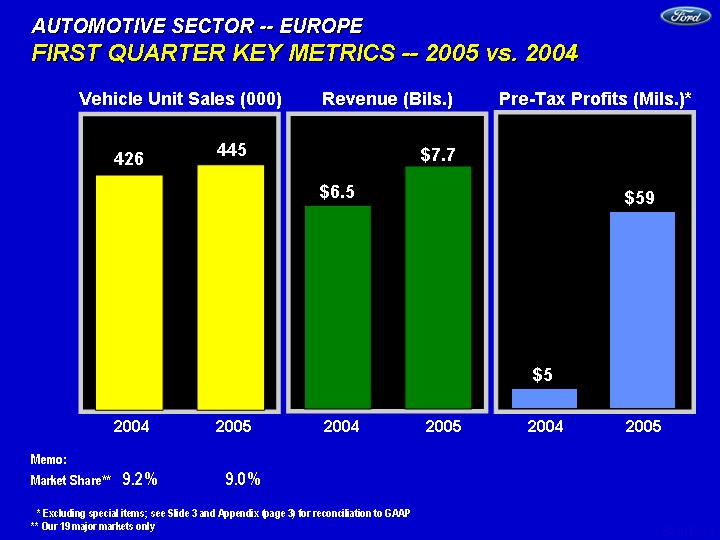
| AUTOMOTIVE SECTOR -- EUROPE FIRST QUARTER KEY METRICS -- 2005 vs. 2004 1st Qtr 2nd Qtr East 6.459 7.7 2005 2004 $7.7 $6.5 Revenue (Bils.) 2003 2004 426 445 2005 2004 445 426 Vehicle Unit Sales (000) 2003 2004 East 6 59 $5 2005 2004 Pre-Tax Profits (Mils.)* Memo: Market Share** 9.2 % 9.0 % * Excluding special items; see Slide 3 and Appendix (page 3) for reconciliation to GAAP ** Our 19 major markets only $59 |
SLIDE 11
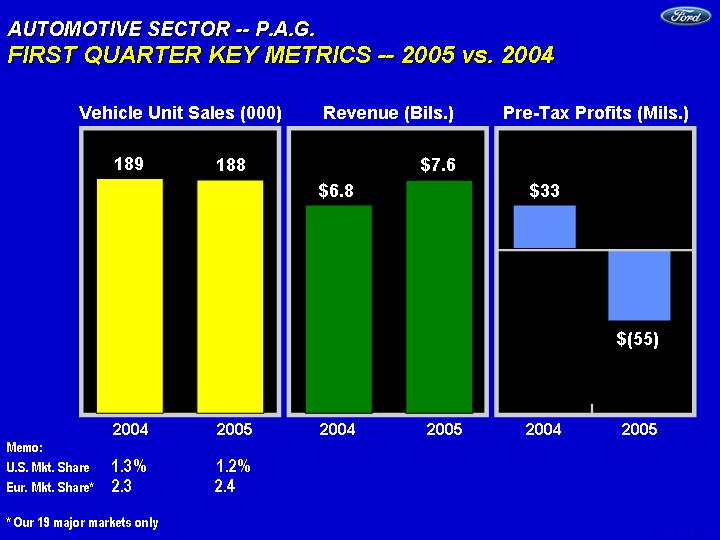
| AUTOMOTIVE SECTOR -- P.A.G. FIRST QUARTER KEY METRICS -- 2005 vs. 2004 1st Qtr 1st Qtr East 6.8 7.6 2005 2004 $7.6 $6.8 Revenue (Bils.) 2003 2004 189 188 2005 2004 188 189 Vehicle Unit Sales (000) 2003 2004 East 33 -55 $33 2005 2004 Pre-Tax Profits (Mils.) $(55) Memo: U.S. Mkt. Share 1.3 % 1.2% Eur. Mkt. Share* 2.3 2.4 * Our 19 major markets only |
SLIDE 12
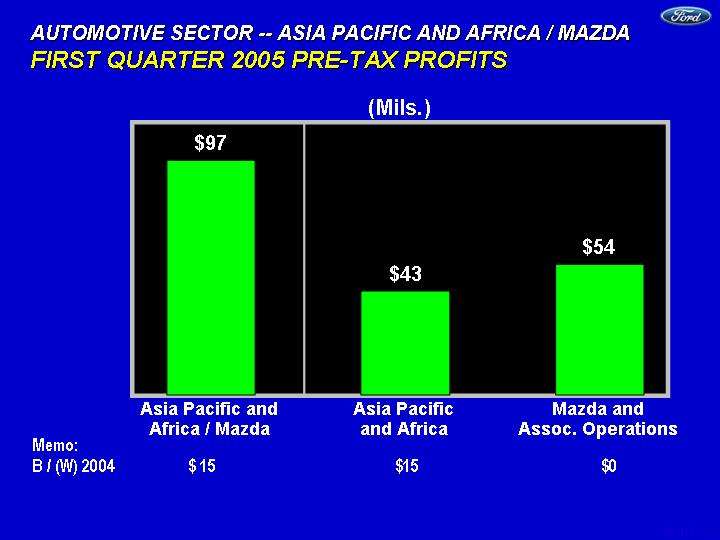
| AUTOMOTIVE SECTOR -- ASIA PACIFIC AND AFRICA / MAZDA FIRST QUARTER 2005 PRE-TAX PROFITS Memo: B / (W) 2004 $ 15 $15 $0 (Mils.) Asia Pacific and Africa / Mazda Asia Pacific and Africa Mazda and Assoc. Operations AP and A/M AP & Af Mazda & 1Q 97 43 54 $97 $54 $43 |
SLIDE 13
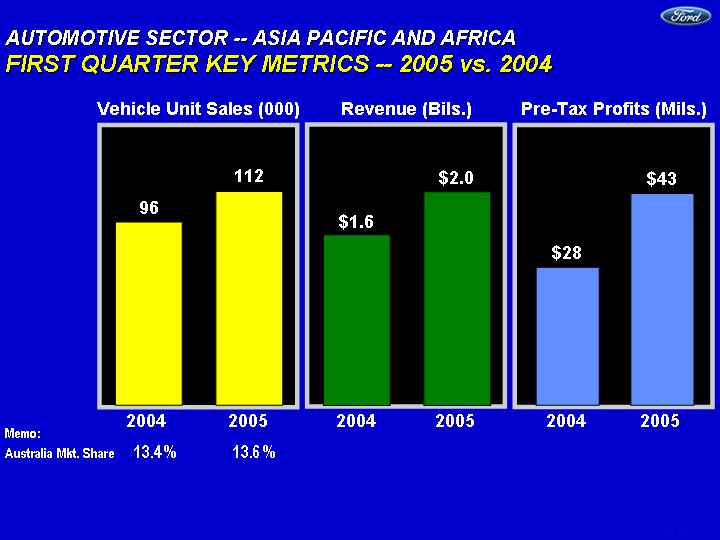
| AUTOMOTIVE SECTOR -- ASIA PACIFIC AND AFRICA FIRST QUARTER KEY METRICS -- 2005 vs. 2004 2003 2004 Revenue 1.6 2 2005 2004 $2.0 $1.6 Revenue (Bils.) 2003 2004 Vehicle Unit Sales 96 112 2005 2004 112 96 Vehicle Unit Sales (000) 2002 2003 PBT 3 25 2005 2004 Pre-Tax Profits (Mils.) 1st Qtr 2nd Qtr East 28 43 $43 $28 Memo: Australia Mkt. Share 13.4 % 13.6 % |
SLIDE 14
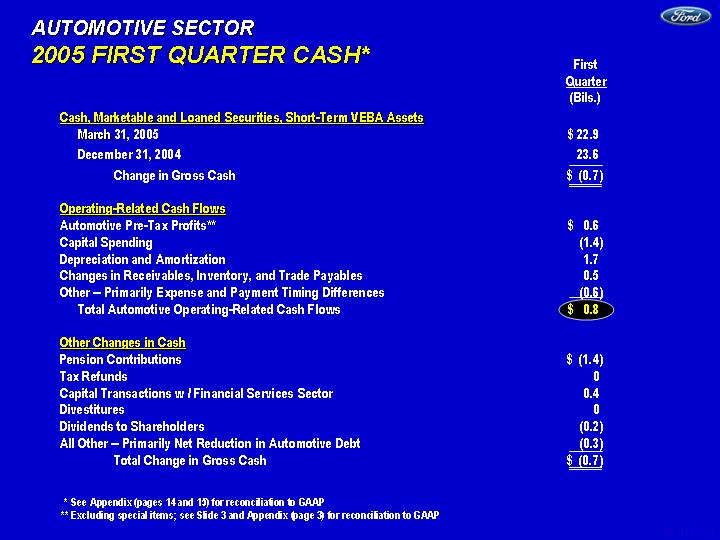
| AUTOMOTIVE SECTOR 2005 FIRST QUARTER CASH* First Quarter (Bils.) Cash, Marketable and Loaned Securities, Short-Term VEBA Assets March 31, 2005 $ 22.9 December 31, 2004 23.6 Change in Gross Cash $ (0.7 ) Operating-Related Cash Flows Automotive Pre-Tax Profits** $ 0.6 Capital Spending (1.4 ) Depreciation and Amortization 1.7 Changes in Receivables, Inventory, and Trade Payables 0.5 Other -- Primarily Expense and Payment Timing Differences (0.6 ) Total Automotive Operating-Related Cash Flows $ 0.8 Other Changes in Cash Pension Contributions $ (1.4 ) Tax Refunds 0 Capital Transactions w / Financial Services Sector 0.4 Divestitures 0 Dividends to Shareholders (0.2 ) All Other -- Primarily Net Reduction in Automotive Debt (0.3 ) Total Change in Gross Cash $ (0.7 ) * See Appendix (pages 14 and 15) for reconciliation to GAAP ** Excluding special items; see Slide 3 and Appendix (page 3) for reconciliation to GAAP |
SLIDE 15
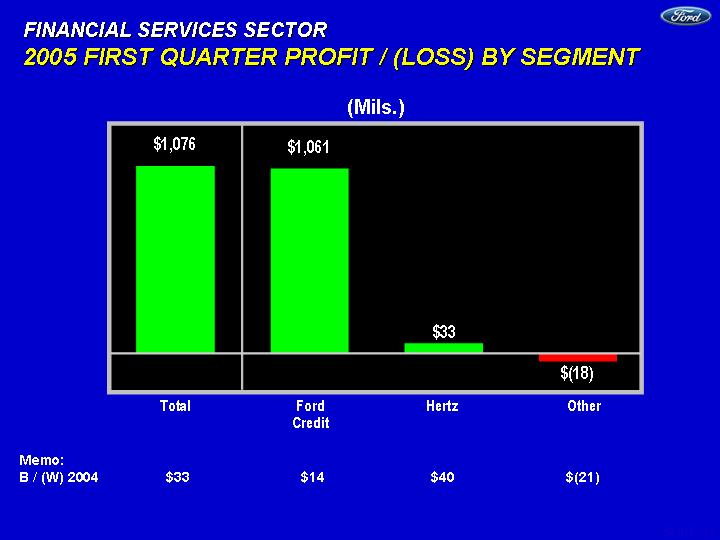
| FINANCIAL SERVICES SECTOR 2005 FIRST QUARTER PROFIT / (LOSS) BY SEGMENT Memo: B / (W) 2004 $33 $14 $40 $(21) Total Credit Hertz Other 1076 1061 63 -48 (Mils.) $1,076 Total Hertz Ford Credit Other $1,061 $33 $(18) |
SLIDE 16
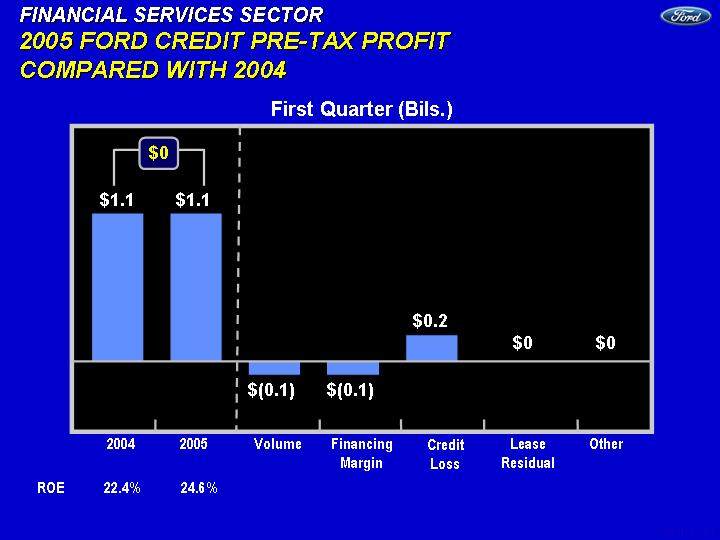
| FINANCIAL SERVICES SECTOR 2005 FORD CREDIT PRE-TAX PROFIT COMPARED WITH 2004 Credit Loss First Quarter (Bils.) Financing Margin Lease Residual Volume 2005 Other 2004 2004 2005 Volume Financing Credit Lease Other East 1.1 1.1 -0.1 -0.1 0.2 0 0 $1.1 $1.1 $0 $(0.1) $(0.1) $0 $0 $0.2 ROE 22.4% 24.6% |
SLIDE 17
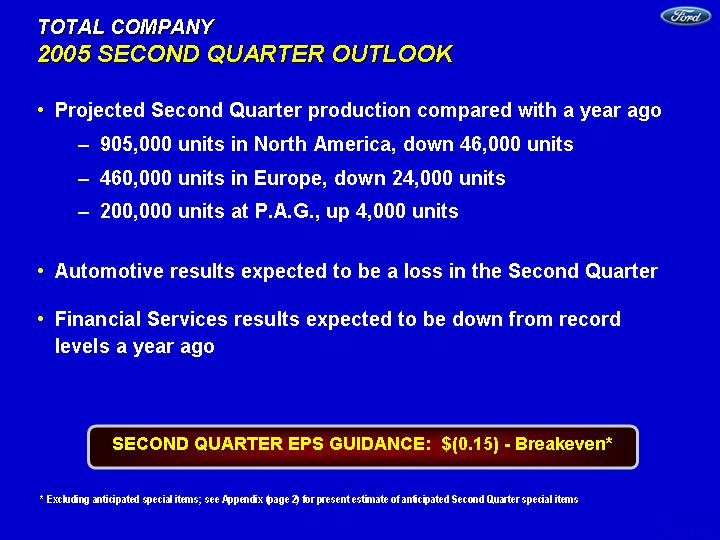
| TOTAL COMPANY 2005 SECOND QUARTER OUTLOOK Projected Second Quarter production compared with a year ago 905,000 units in North America, down 46,000 units 460,000 units in Europe, down 24,000 units 200,000 units at P.A.G., up 4,000 units Automotive results expected to be a loss in the Second Quarter Financial Services results expected to be down from record levels a year ago SECOND QUARTER EPS GUIDANCE: $(0.15) - Breakeven* * Excluding anticipated special items; see Appendix (page 2) for present estimate of anticipated Second Quarter special items |
SLIDE 18
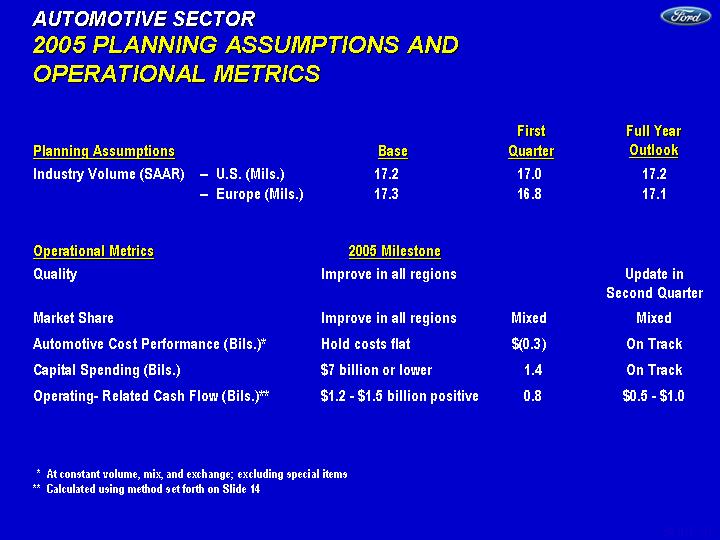
| AUTOMOTIVE SECTOR 2005 PLANNING ASSUMPTIONS AND OPERATIONAL METRICS Planning Assumptions Industry Volume (SAAR) -- U.S. (Mils.) 17.2 17.0 17.2 -- Europe (Mils.) 17.3 16.8 17.1 Operational Metrics Quality Improve in all regions Update in Second Quarter Market Share Improve in all regions Mixed Mixed Automotive Cost Performance (Bils.)* Hold costs flat $(0.3 ) On Track Capital Spending (Bils.) $7 billion or lower 1.4 On Track Operating- Related Cash Flow (Bils.)** $1.2 - $1.5 billion positive 0.8 $0.5 - $1.0 * At constant volume, mix, and exchange; excluding special items ** Calculated using method set forth on Slide 14 Base First Quarter Full Year Outlook 2005 Milestone |
SLIDE 19
| TOTAL COMPANY 2005 FINANCIAL MILESTONES* Americas North America $1.4 - $1.7 Worse South America 0.1 - 0.2 On Track Europe / P.A.G. Europe 0.1 - 0.2 Low End P.A.G. 0.3 - 0.6 Low End Asia Pacific and Africa / Mazda 0.1 - 0.2 On Track Total Automotive $1.5 - $2.0 Worse Financial Services 3.5 - 3.7 Better Total Company $5.0 - $5.7 Worse Milestones (Bils.) Full Year Outlook FULL YEAR EPS GUIDANCE: $1.25 - $1.50* * Excluding special items; see Appendix (page 2) for present estimate of anticipated full-year 2005 special items SLIDE 39 |
SLIDE 20
| SAFE HARBOR Greater price competition resulting from currency fluctuations, industry overcapacity or other factors; A significant decline in industry sales, particularly in the U.S. or Europe, resulting from slowing economic growth, geo-political events or other factors; Lower-than-anticipated market acceptance of new or existing products; Economic distress of suppliers that may require us to provide financial support or take other measures to ensure supplies of materials; Work stoppages at Ford or supplier facilities or other interruptions of supplies; The discovery of defects in vehicles resulting in delays in new model launches, recall campaigns or increased warranty costs; Increased safety, emissions, fuel economy or other regulation resulting in higher costs and/or sales restrictions; Unusual or significant litigation or governmental investigations arising out of alleged defects in our products or otherwise; Worse-than-assumed economic and demographic experience for our post-retirement benefit plans (e.g., investment returns, interest rates, health care cost trends, benefit improvements); Currency or commodity price fluctuations, including rising steel prices; Change in interest rates; A market shift from truck sales in the U.S.; Economic difficulties in any significant market; Higher prices for or reduced availability of fuel; Labor or other constraints on our ability to restructure our business; A change in our requirements under long-term supply arrangements pursuant to which we are obligated to purchase minimum quantities or a fixed percentage of output or pay minimum amounts; Credit rating downgrades; Inability to access debt or securitization markets around the world at competitive rates or in sufficient amounts; Higher-than-expected credit losses; Lower-than-anticipated residual values for leased vehicles; Increased price competition in the rental car industry and/or a general decline in business or leisure travel due to terrorist attacks, acts of war, epidemic diseases or measures taken by governments in response thereto that negatively affect the travel industry; and Our inability to implement the Revitalization Plan. Statements included herein may constitute "forward looking statements" within the meaning of the Private Securities Litigation Reform Act of 1995. These statements involve a number of risks, uncertainties, and other factors that could cause actual results to differ materially from those stated, including, without limitation: |

| APPENDIX |
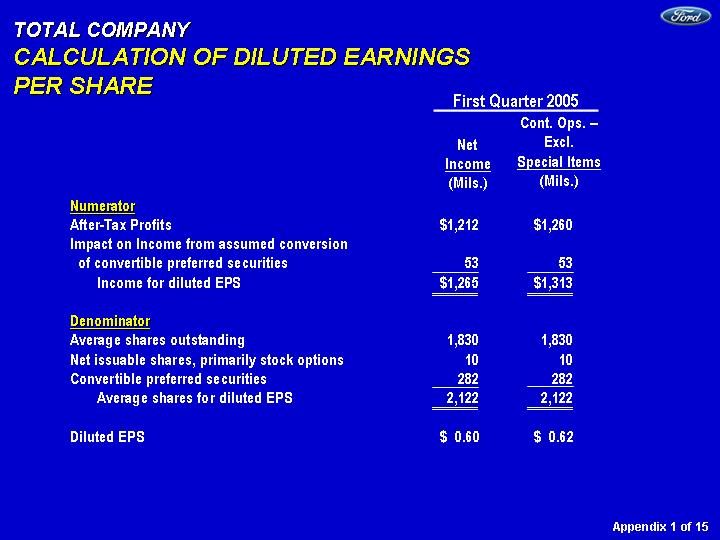
| TOTAL COMPANY CALCULATION OF DILUTED EARNINGS PER SHARE Net Income (Mils.) Numerator After-Tax Profits $1,212 $1,260 Impact on Income from assumed conversion of convertible preferred securities 53 53 Income for diluted EPS $1,265 $1,313 Denominator Average shares outstanding 1,830 1,830 Net issuable shares, primarily stock options 10 10 Convertible preferred securities 282 282 Average shares for diluted EPS 2,122 2,122 Diluted EPS $ 0.60 $ 0.62 Appendix 1 of 15 Cont. Ops. -- Excl. Special Items (Mils.) First Quarter 2005 |
| TOTAL COMPANY 2005 SECOND QUARTER AND FULL YEAR GUIDANCE - SPECIAL ITEMS AND DISCONTINUED OPERATIONS Pre-Tax Profit (Mils.) Second Quarter Earnings Per Share* Special Items - P.A.G. Improvement Plan $(55 ) $ (36 ) $(0.02 ) $(110 ) $(72 ) $(0.03 ) - Fuel Cell Technology Charges (70 ) (70 ) (0.04 ) (109 ) (109 ) (0.05 ) - Non-Core Business Held for Sale 0 0 0 (58 ) (38 ) (0.02 ) - Visteon Charges (80 ) (52 ) (0.03 ) TBD TBD TBD - Salaried Reductions** (90 ) (59 ) (0.03 ) (90 ) (59 ) (0.03 ) Total Special Items $(295 ) $(217 ) $(0.12 ) $(367 ) $(278 ) $(0.13 ) Discontinued Operations 0 0 35 0.02 Effect of Special Items and $(217 ) $(0.12 ) $(243 ) $(0.11 ) Discontinued Operations After-Tax Profit (Mils.) * Earnings per share from continuing operations is calculated on a basis that includes pre-tax profit, provision for taxes, and minority interest; see Appendix (page 1) for calculation ** Relates to our Automotive North America business unit and Ford Credit Appendix 2 of 15 Pre-Tax Profit (Mils.) Full Year Earnings Per Share* After-Tax Profit (Mils.) |

| TOTAL COMPANY 2004 - 2005 FIRST QUARTER PRE-TAX RESULTS* North America $1,963 $ 557 $ 0 $(106 ) $1,963 $ 663 South America 15 77 0 0 15 77 Total Americas $1,978 $ 634 $ 0 $(106 ) $1,978 $ 740 Europe $ (24 ) $ 59 $ (29 )** $ 0 $ 5 $ 59 P.A.G. 33 (55 ) 0 0 33 (55 ) Total Europe / P.A.G. $ 9 $ 4 $ (29 ) $ 0 $ 38 $ 4 Asia Pacific and Africa $ 28 $ 43 $ 0 $ 0 $ 28 $ 43 Mazda & Assoc. Operations 54 54 0 0 54 54 Total AP and Africa / Mazda $ 82 $ 97 $ 0 $ 0 $ 82 $ 97 Other Automotive (249 ) (262 ) 17 *** 0 (266 ) (262 ) Total Automotive $1,820 $ 473 $ (12 ) $(106 ) $1,832 $ 579 Financial Services 1,043 1,076 0 0 1,043 1,076 Total Company $2,863 $1,549 $ (12 ) $(106 ) $2,875 $1,655 * From continuing operations ** Ford Europe Improvement Plan *** Related to prior divestiture of non-core business 2004 (Mils.) 2005 (Mils.) Pre-Tax Profits (Incl. Special Items) Special Items Pre-Tax Profits (Excl. Special Items) 2004 (Mils.) 2005 (Mils.) 2004 (Mils.) 2005 (Mils.) Appendix 3 of 15 |
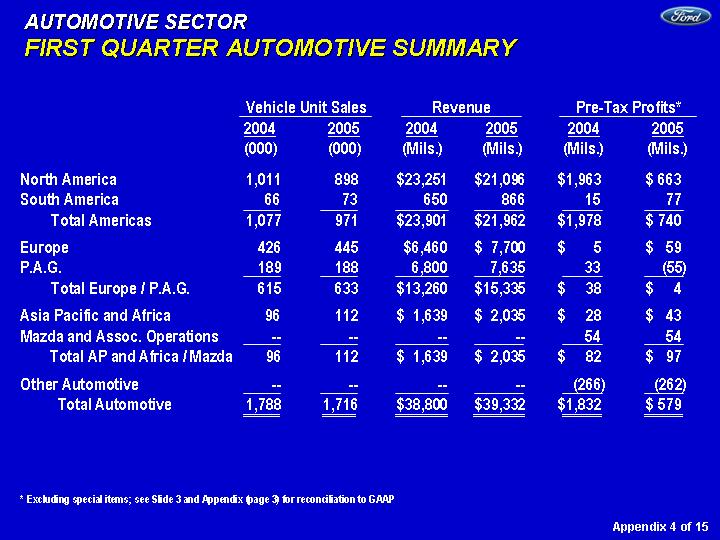
| AUTOMOTIVE SECTOR FIRST QUARTER AUTOMOTIVE SUMMARY Appendix 4 of 15 * Excluding special items; see Slide 3 and Appendix (page 3) for reconciliation to GAAP North America 1,011 898 $23,251 $21,096 $1,963 $ 663 South America 66 73 650 866 15 77 Total Americas 1,077 971 $23,901 $21,962 $1,978 $ 740 Europe 426 445 $6,460 $ 7,700 $ 5 $ 59 P.A.G. 189 188 6,800 7,635 33 (55 ) Total Europe / P.A.G. 615 633 $13,260 $15,335 $ 38 $ 4 Asia Pacific and Africa 96 112 $ 1,639 $ 2,035 $ 28 $ 43 Mazda and Assoc. Operations -- -- -- -- 54 54 Total AP and Africa / Mazda 96 112 $ 1,639 $ 2,035 $ 82 $ 97 Other Automotive -- -- -- -- (266 ) (262 ) Total Automotive 1,788 1,716 $38,800 $39,332 $1,832 $ 579 2004 (000) 2005 (000) Vehicle Unit Sales Revenue Pre-Tax Profits* 2004 (Mils.) 2005 (Mils.) 2004 (Mils.) 2005 (Mils.) |
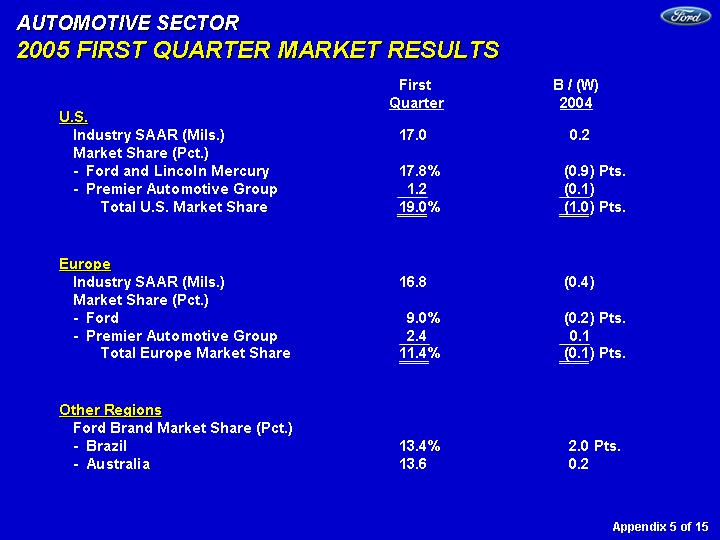
| AUTOMOTIVE SECTOR 2005 FIRST QUARTER MARKET RESULTS U.S. Industry SAAR (Mils.) 17.0 0.2 Market Share (Pct.) - Ford and Lincoln Mercury 17.8 % (0.9 ) Pts. - Premier Automotive Group 1.2 (0.1 ) Total U.S. Market Share 19.0 % (1.0 ) Pts. Europe Industry SAAR (Mils.) 16.8 (0.4 ) Market Share (Pct.) - Ford 9.0 % (0.2 ) Pts. - Premier Automotive Group 2.4 0.1 Total Europe Market Share 11.4 % (0.1 ) Pts. Other Regions Ford Brand Market Share (Pct.) - Brazil 13.4 % 2.0 Pts. - Australia 13.6 0.2 First Quarter B / (W) 2004 Appendix 5 of 15 |
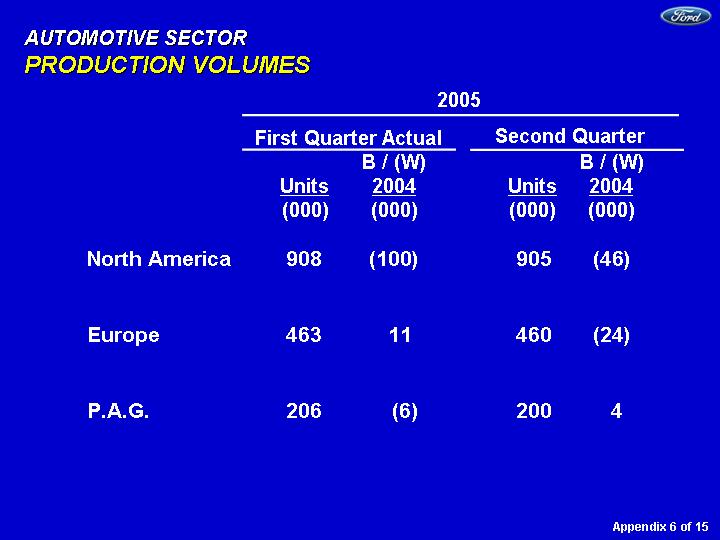
| AUTOMOTIVE SECTOR PRODUCTION VOLUMES Appendix 6 of 15 North America 908 (100 ) 905 (46 ) Europe 463 11 460 (24 ) P.A.G. 206 (6 ) 200 4 Units (000) B / (W) 2004 (000) First Quarter Actual 2005 Units (000) B / (W) 2004 (000) Second Quarter |
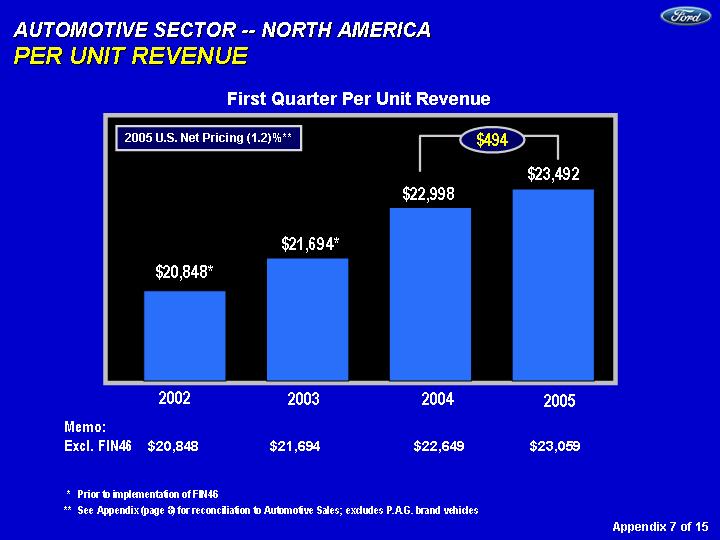
| * Prior to implementation of FIN46 ** See Appendix (page 8) for reconciliation to Automotive Sales; excludes P.A.G. brand vehicles 2002 2003 2004 2005 Net Rev 20848 21694 22998 23492 2002 2003 2004 $21,694* $20,848* First Quarter Per Unit Revenue $22,998 Memo: Excl. FIN46 $20,848 $21,694 $22,649 $23,059 2005 U.S. Net Pricing (1.2)%** AUTOMOTIVE SECTOR -- NORTH AMERICA PER UNIT REVENUE $23,492 2005 $494 Appendix 7 of 15 |
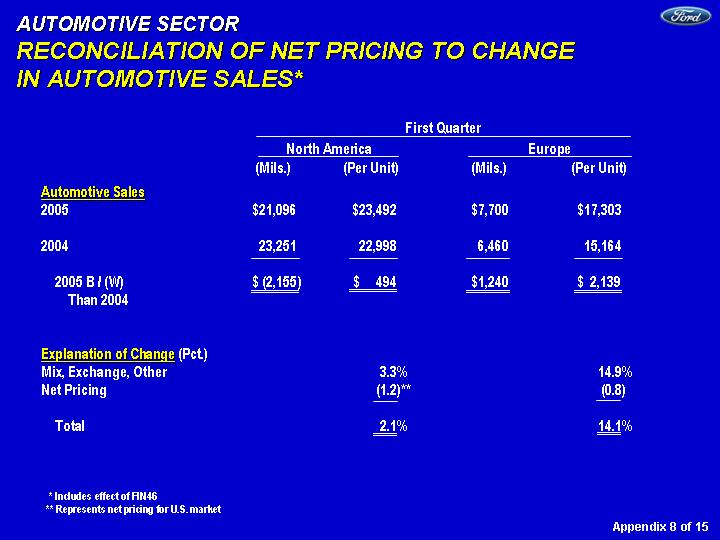
| AUTOMOTIVE SECTOR RECONCILIATION OF NET PRICING TO CHANGE IN AUTOMOTIVE SALES* Automotive Sales 2005 $21,096 $23,492 $7,700 $17,303 2004 23,251 22,998 6,460 15,164 2005 B / (W) $ (2,155 ) $ 494 $1,240 $ 2,139 Than 2004 Explanation of Change (Pct.) Mix, Exchange, Other 3.3 % 14.9 % Net Pricing (1.2 )** (0.8 ) Total 2.1 % 14.1 % North America (Mils.) (Per Unit) First Quarter Europe (Per Unit) (Mils.) Appendix 8 of 15 * Includes effect of FIN46 ** Represents net pricing for U.S. market |
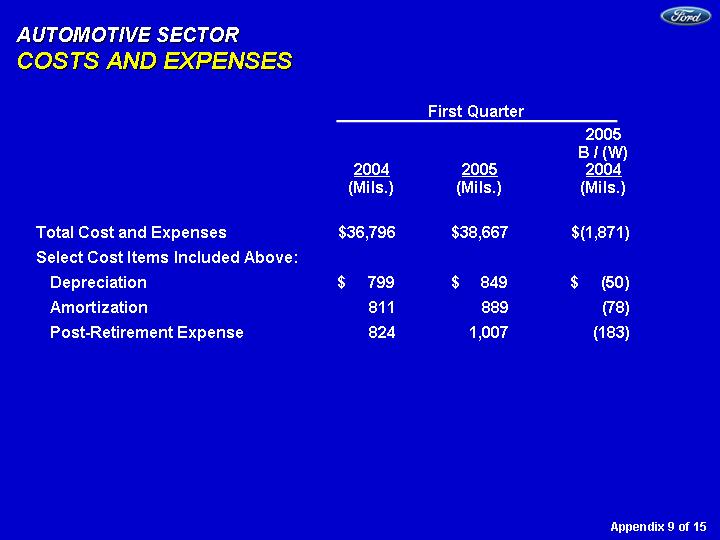
| AUTOMOTIVE SECTOR COSTS AND EXPENSES Total Cost and Expenses $36,796 $38,667 $(1,871 ) Select Cost Items Included Above: Depreciation $ 799 $ 849 $ (50 ) Amortization 811 889 (78 ) Post-Retirement Expense 824 1,007 (183 ) 2004 (Mils.) 2005 (Mils.) 2005 B / (W) 2004 (Mils.) First Quarter Appendix 9 of 15 |
| FINANCIAL SERVICES SECTOR FORD CREDIT RESULTS AND METRICS - FIRST QUARTER Receivables (Bils.) On-Balance Sheet $127 $125 Securitized Off-Balance Sheet 46 40 Managed $173 $165 Charge-Offs (Mils.) On-Balance Sheet $315 $181 Managed 429 229 Loss-to-Receivables Ratio On-Balance Sheet 0.97% 0.56% Managed - U.S. Retail and Lease 1.46 0.72 - Worldwide Total 0.98 0.55 Allow. for Credit Losses Worldwide Amount (Bils.) $2.8 $2.2 Pct. Of EOP Receivables 2.19 % 1.74% Leverage (To 1) Financial Statement 11.6 11.4 Managed 12.8 13.0 Dividend (Bils.) $0.9 $0.5 2004 2005 Key Metrics* Net Income (Mils.) $688 $710 ROE 22.4 % 24.6% 2003 2004 East 1047 1061 4Q 594 839 Pre-Tax Profits (Mils.) 1st Qtr. 2004 1st Qtr. 2005 $1,047 $1,061 First Quarter * See Appendix (pages 11 - 13) for calculation, definitions and reconciliation to GAAP $14 Appendix 10 of 15 |

| FINANCIAL SERVICES SECTOR FORD CREDIT KEY METRIC DEFINITIONS In addition to evaluating Ford Credit's financial performance on a GAAP financial statement basis, Ford Credit management also uses other criteria, some of which were previously disclosed in this presentation and are defined below. Information about the impact of on-balance sheet securitization is also included below : Managed Receivables -- receivables reported on Ford Credit's balance sheet and receivables Ford Credit sold in off-balance-sheet securitizations and continues to service Serviced Receivables -- includes managed receivables and receivables Ford Credit sold in whole-loan sale transactions (i.e., receivables for which Ford Credit has no continuing exposure or risk of loss) Charge-offs on Managed Receivables -- charge-offs associated with receivables reported on Ford Credit's balance sheet plus charge-offs associated with receivables Ford Credit sold in off-balance sheet securitizations and continues to service Impact of On-Balance Sheet Securitization - finance receivables (retail and wholesale) and investments in operating leases reported on Ford Credit's balance sheet include assets transferred in securitizations that do not quality for accounting sale treatment. These assets have been legally transferred to Ford Credit sponsored special purpose entities and are available only to pay the obligations of the special purpose entities and are not available to pay the obligations of Ford Credit or the claims of Ford Credit's creditors. Debt reported on Ford Credit's balance sheet includes debt issued by these special purpose entities to securitization investors which is payable out of collections on the assets supporting the securitizations and is not the legal obligation of Ford Credit or its other subsidiaries Appendix 11 of 15 |
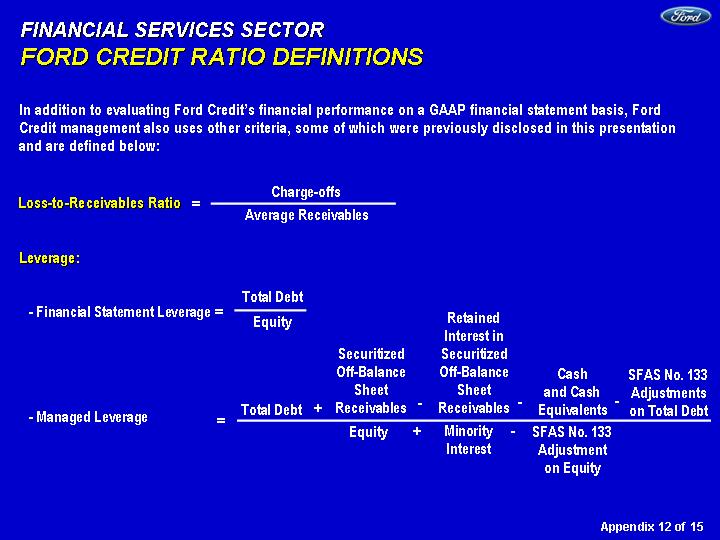
| FINANCIAL SERVICES SECTOR FORD CREDIT RATIO DEFINITIONS In addition to evaluating Ford Credit's financial performance on a GAAP financial statement basis, Ford Credit management also uses other criteria, some of which were previously disclosed in this presentation and are defined below: Leverage: Total Debt - - Financial Statement Leverage = Equity Total Debt Securitized Off-Balance Sheet Receivables Cash and Cash Equivalents SFAS No. 133 Adjustments on Total Debt Equity Minority Interest SFAS No. 133 Adjustment on Equity - - Managed Leverage + - - - - - - = + - - Retained Interest in Securitized Off-Balance Sheet Receivables Charge-offs = Average Receivables Loss-to-Receivables Ratio Appendix 12 of 15 |
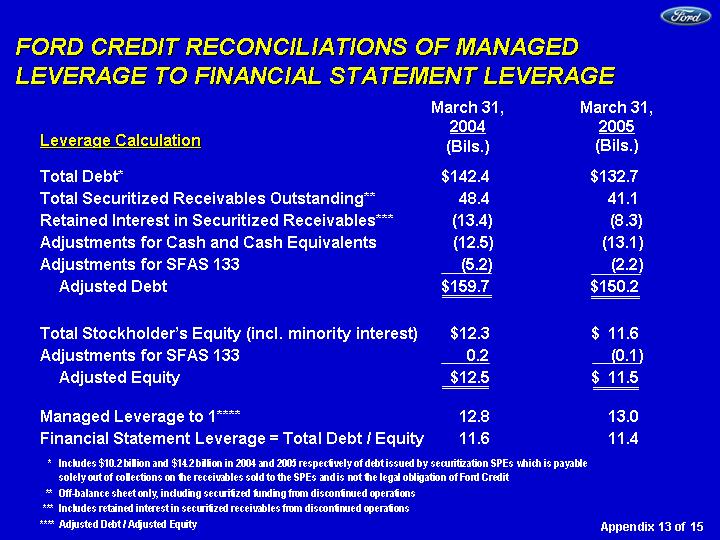
| FORD CREDIT RECONCILIATIONS OF MANAGED LEVERAGE TO FINANCIAL STATEMENT LEVERAGE Total Debt* $142.4 $132.7 Total Securitized Receivables Outstanding** 48.4 41.1 Retained Interest in Securitized Receivables*** (13.4) (8.3) Adjustments for Cash and Cash Equivalents (12.5) (13.1 ) Adjustments for SFAS 133 (5.2) (2.2 ) Adjusted Debt $159.7 $150.2 Total Stockholder's Equity (incl. minority interest) $12.3 $ 11.6 Adjustments for SFAS 133 0.2 (0.1 ) Adjusted Equity $12.5 $ 11.5 Managed Leverage to 1**** 12.8 13.0 Financial Statement Leverage = Total Debt / Equity 11.6 11.4 * Includes $10.2 billion and $14.2 billion in 2004 and 2005 respectively of debt issued by securitization SPEs which is payable solely out of collections on the receivables sold to the SPEs and is not the legal obligation of Ford Credit ** Off-balance sheet only, including securitized funding from discontinued operations *** Includes retained interest in securitized receivables from discontinued operations **** Adjusted Debt / Adjusted Equity March 31, 2005 (Bils.) Leverage Calculation Appendix 13 of 15 March 31, 2004 (Bils.) |
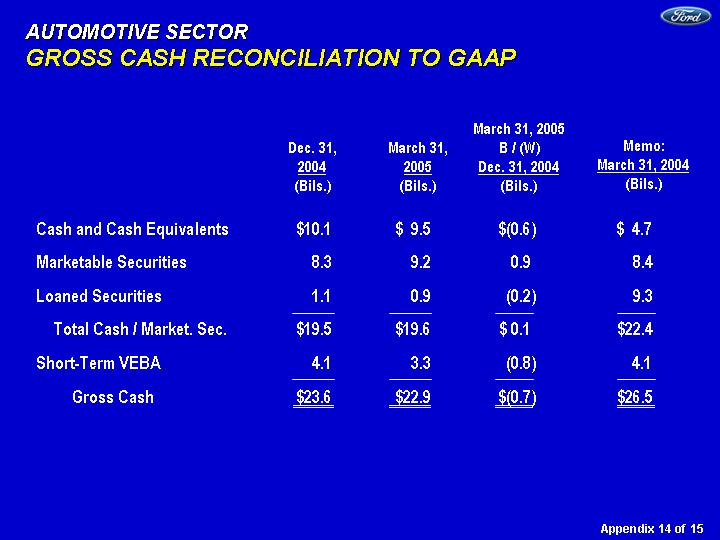
| AUTOMOTIVE SECTOR GROSS CASH RECONCILIATION TO GAAP Cash and Cash Equivalents $10.1 $ 9.5 $(0.6 ) $ 4.7 Marketable Securities 8.3 9.2 0.9 8.4 Loaned Securities 1.1 0.9 (0.2 ) 9.3 Total Cash / Market. Sec. $19.5 $19.6 $ 0.1 $22.4 Short-Term VEBA 4.1 3.3 (0.8 ) 4.1 Gross Cash $23.6 $22.9 $(0.7 ) $26.5 March 31, 2005 B / (W) Dec. 31, 2004 (Bils.) March 31, 2005 (Bils.) Dec. 31, 2004 (Bils.) Appendix 14 of 15 Memo: March 31, 2004 (Bils.) |

| AUTOMOTIVE SECTOR GAAP RECONCILIATION OF OPERATING-RELATED CASH FLOWS Cash Flows from Operating Activities before Securities Trading $ 2.4 $(0.2 ) Items Included in Operating-Related Cash Flows Capital Expenditures $(1.4 ) $(0.2 ) Net Transactions Between Automotive and Financial Services Sectors (0.7 ) (0.6 ) Exclusion of ST VEBA Cash Flows - Net (Drawdown) / Top-Up (0.8 ) (0.8 ) Other (0.1 ) 0 Total Reconciling Items $(3.0 ) $(1.6 ) Total Automotive Operating-Related Cash Flows $(0.6 ) $(1.8 ) Pension Contributions 1.4 0.2 Tax Refunds 0 0 Total Auto. Op.-Related Cash Flows $ 0.8 $(1.6 ) (Excl. Contrib. and Tax Refunds) * Net transactions with Automotive / Financial Services line from Sector Cash Flows statement First Qtr. (Bils.) 2005 B / (W) Than 2004 (Bils.) Appendix 15 of 15 |
