
November 29, 2006
SECURED FINANCING
PRESENTATION

Alan Mulally
President and CEO
SLIDE 1

•
Sales and Revenue -- About 6.8 million unit sales and $150 billion of Automotive revenue in 2005
•
Valuable Brands -- Ford, Lincoln, Mercury, Volvo, Jaguar, Land Rover, Ford Credit
•
Global Reach -- Manufacture on six continents, with distribution in over 200 markets
FORD MOTOR COMPANY
SUBSTANTIAL RESOURCES
SLIDE 2

Industry
•
Increasingly competitive, changing consumer preferences, and excess capacity
•
Rising health care and commodity costs
•
Fragile supply base in North America
Ford
•
Market share declining in North America, stable in Europe and South America, growing in Asia, and stable / growing for Ford’s premium brands (P.A.G.)
•
Manufacturing capacity exceeds demand
•
Cost structure not competitive
•
Business units not well integrated; complexity level high
DEALING WITH OUR REALITY
PRESENT SITUATION
SLIDE 3

•
Operate as one company
–
Leverage global assets
–
Integrate regional business units
–
Accelerate product development efforts -- increase scale and efficient designs
•
North America is top priority
–
Home market drives profitability
–
New products to stabilize share
–
Align capacity with demand
•
Working together
DEVELOPING A BETTER PLAN
OPPORTUNITIES GOING FORWARD
SLIDE 4

KEY INVESTMENT HIGHLIGHTS
•
Dealing with our reality
–
Identifying opportunities to enhance our business model
•
Accelerating actions to improve our cost structure
–
Personnel reductions
–
Capacity reductions
–
Supply base restructuring
•
Continue to invest in new products
–
Leveraging our global product development and production systems
–
Developing more new products to deliver profitable growth
•
Building substantial liquidity to
–
Execute the plan
–
Provide cushion for unexpected events
TRANSFORMING THE COMPANY
SLIDE 5

Don Leclair
Chief Financial Officer
SLIDE 6

OVERVIEW
•
Present Results
•
Key Elements of Plan
–
North America Automotive
–
International Automotive
–
Ford Credit
•
Outlook
SLIDE 7
* Excludes special items; see Appendix (pages 1 and 2) for reconciliation to GAAP
Memo:
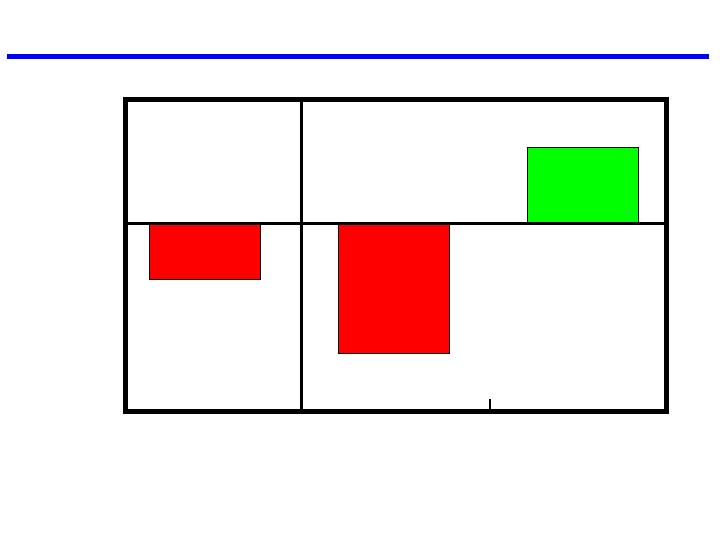
Net Income $(6,988) $(7,992) $1,004
Financial
Services
Automotive
(Mils.)
Total
$(1,208)
$1,550
$(2,758)
TOTAL COMPANY
2006 FIRST NINE MONTHS PRE-TAX PROFIT / (LOSS) BY SECTOR*
SLIDE 8
* Excludes special items; see Appendix (pages 1 and 2) for reconciliation to GAAP
Other
Auto.
North
America
Europe
Asia Pacific
& Africa
(Mils.)
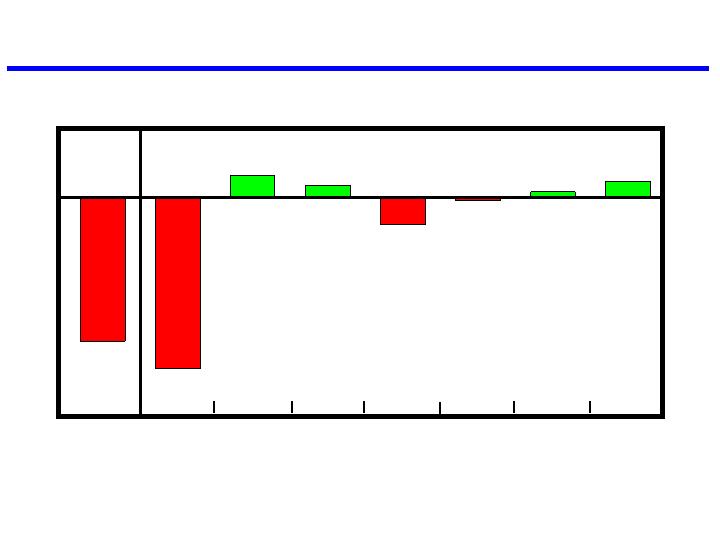
$(2,758)
$306
$(3,287)
P.A.G.
South
America
$(518)
$117
Mazda &
Assoc.
Operations
$(50)
Total
Automotive
$237
$437
AUTOMOTIVE SECTOR
2006 FIRST NINE MONTHS PROFIT / (LOSS) BY SEGMENT*
SLIDE 9
* Excludes special items; see Appendix (pages 1 and 2) for reconciliation to GAAP
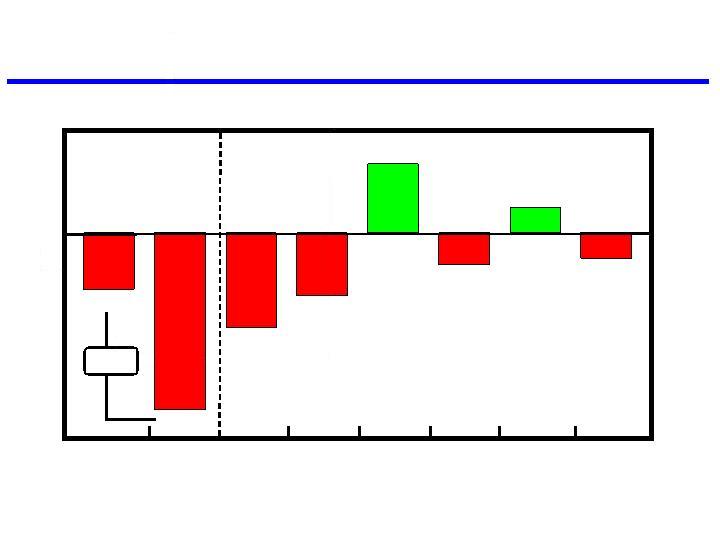
(Bils.)
$(1.5)
2005
Net
Pricing
Cost
Changes
$1.1
Volume /
Mix
2006
$(2.8)
Other
$(0.4)
$(1.9)
$(0.9)
$(0.5)
Exchange
$(1.0)
Interest
$0.4
AUTOMOTIVE SECTOR
2006 FIRST NINE MONTHS AUTOMOTIVE PRE-TAX PROFIT
COMPARED WITH 2005*
SLIDE 10
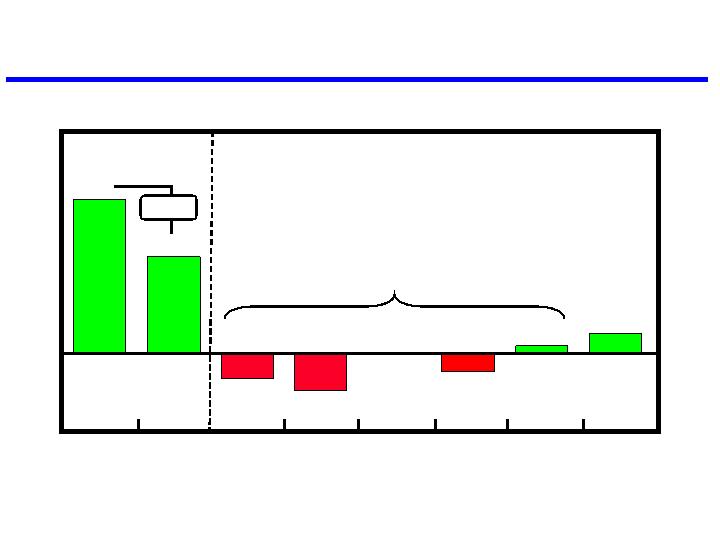
(Bils.)
$(0.6)
$(0.4)
Financing
Margin
Lease
Residual
$0
Volume
2006
$(0.3)
SFAS 133
2005
Credit
Loss
$1.5
$2.4
Other
$0.1
$0.3
$(1.2)
FINANCIAL SERVICES SECTOR
2006 FIRST NINE MONTHS FORD CREDIT PRE-TAX PROFIT
COMPARED WITH 2005*
$(0.9)
* Excludes special items; see Appendix (pages 1 and 2) for reconciliation to GAAP
SLIDE 11
OVERVIEW
•
Present Results
•
Key Elements of Plan
–
North America Automotive
–
International Automotive
–
Ford Credit
•
Outlook
SLIDE 12

AUTOMOTIVE SECTOR -- FORD NORTH AMERICA
KEY ELEMENTS OF PLAN
•
Restructuring
–
Rationalize capacity
–
Salaried-related and hourly personnel reductions
–
Sell / close Automotive Component Holdings plants
•
Competitive costs
–
Achieve competitive levels of engineering and investment
efficiency
–
Leverage global resources and assets (i.e., greater product commonality) and enable greater supplier efficiencies
–
Competitive manufacturing footprint
•
Rebuild the brand strength and reputation
–
Customer focused, exciting products
–
Competitive quality
SLIDE 13

AUTOMOTIVE SECTOR -- FORD NORTH AMERICA
SIXTEEN NEW / MAJOR PRODUCT ACTIONS BY END OF 2008
2006
2007
2008
Expedition Navigator L “Fairlane”
Expedition EL F-Series Super Duty MKS (new Lincoln sedan)
Navigator Escape F-150
Edge Mariner Fusion
MKX Focus Milan
MKZ
SLIDE 14

Ford Edge
Lincoln MKX
AUTOMOTIVE SECTOR -- FORD NORTH AMERICA
These photos cannot be guaranteed to be product correct.
SLIDE 15
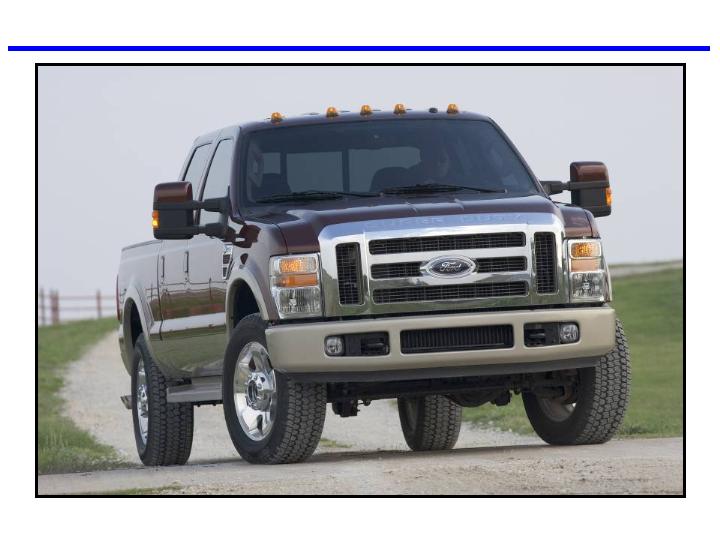
AUTOMOTIVE SECTOR -- FORD NORTH AMERICA
These photos cannot be guaranteed to be product correct.
2008 F-250 Super Duty
SLIDE 16

AUTOMOTIVE SECTOR -- FORD NORTH AMERICA
These photos cannot be guaranteed to be product correct.
“Fairlane” Concept
SLIDE 17
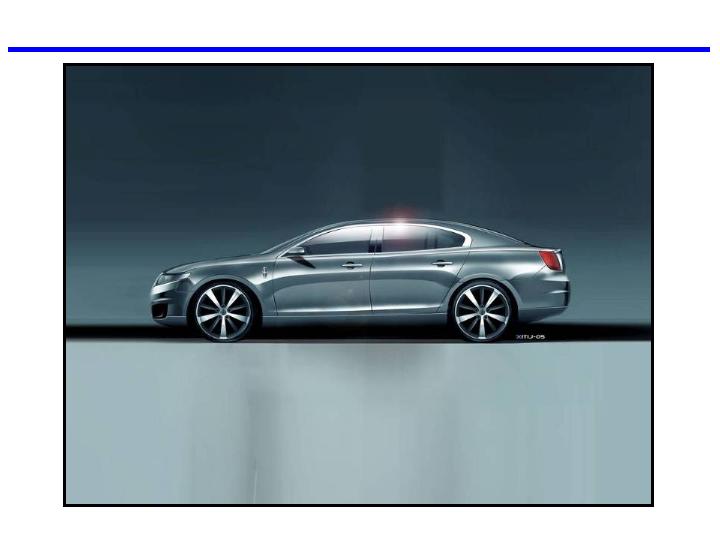
AUTOMOTIVE SECTOR -- FORD NORTH AMERICA
These photos cannot be guaranteed to be product correct.
Lincoln MKS
SLIDE 18
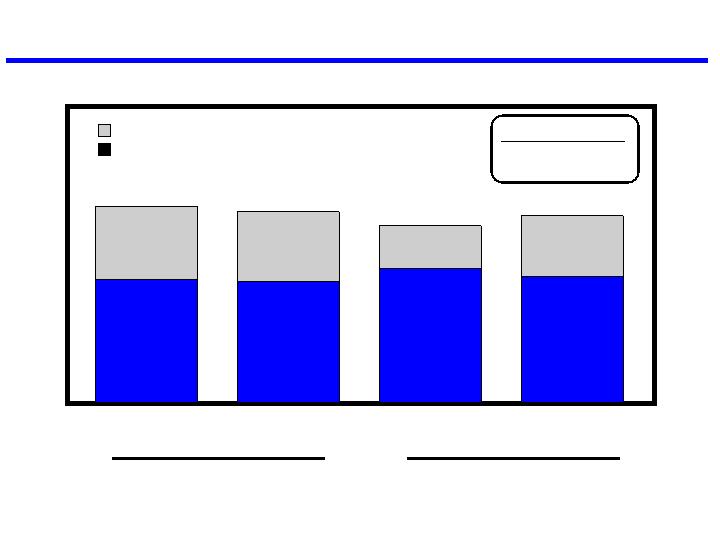
17.2%
15.5%
Second
Quarter
Third
Quarter
Fleet
Retail
16.7%
6.1%
6.4%
3.8%
10.8%
11.7%
10.6%
2008 Target
Total Share: 14-15%
Fleet Share: Lower
* Ford and Lincoln Mercury
16.4%
5.4%
11.0%
First Nine
Months
2006
AUTOMOTIVE SECTOR -- FORD NORTH AMERICA
U.S. MARKET SHARE*
First
Quarter
SLIDE 19
Salaried Equivalent Positions
December 31,
2005
September 30,
2006
Hourly ACH Employees
42,500
38,500
85,600
55,000 – 60,000
Hourly (Excluding ACH)
13,900
12,200
AUTOMOTIVE SECTOR -- FORD NORTH AMERICA
PERSONNEL REDUCTIONS FROM YEAR-END 2005
December 31,
2005
2008
Target
September 30,
2006
28,500
79,300
December 31,
2005
2008
Target
September 30,
2006
2008
Target
Redeploy /
Separate
Reduction
From
12/31/2005
14,000
25,000 – 30,000
Redeploy /
Separate
SLIDE 20

(Millions - Annualized)
Maximum Installed Capacity
Manned Straight-Time Capacity
Fourth Quarter
2005
Fourth Quarter
2006
2008 Targets
AUTOMOTIVE SECTOR -- FORD NORTH AMERICA
ASSEMBLY CAPACITY
Installed 84%
Manned 100
2008
Utilization
SLIDE 21

AUTOMOTIVE SECTOR -- FORD NORTH AMERICA
AUTOMOTIVE PRE-TAX PROFIT -- 2009 COMPARED WITH 2006
* Excluding special items; see Appendix (pages 1 and 2)
2006
2008
2009
(Bils.)
$0
Loss*
Profit
Cost
Reductions
Non-Repeat
of 2006
Dealer Inventory
Reductions
Cost
Reductions
Loss
~ $4.0
+
2006 - 2008
Cost Improvement
2006 ~ $1.0
2007 - 2008 ~ 4.0
Total $5.0
Other
Market
Factors
Market
Factors
-
-
SLIDE 22
OVERVIEW
•
Present Results
•
Key Elements of Plan
–
North America Automotive
–
International Automotive
–
Ford Credit
•
Outlook
SLIDE 23

Financial Results - Profitable with three year trend of improving results
Market Share - Stable in Western Europe
- Growth in Central and Eastern Europe
Product - Increasing use of global platforms
Manufacturing - Continuing to migrate to lower-cost areas
AUTOMOTIVE SECTOR
FORD EUROPE
SLIDE 24

Volvo
Financial Results - - 2006 challenging year; reflects end of several old models prior to major new
product introductions
Market Share - - Product-driven improvements expected
Product - More common platforms, shared across brands
Manufacturing - Reducing structure; improving efficiency
Jaguar / Land Rover
Financial Results - Working to return Jaguar to profitability and continued improvement in
Land Rover
Market Share - - Declining at Jaguar, consistent with planned brand repositioning
- Improving at Land Rover, reflecting new products
Product - New Freelander / LR2 based on global platform
Manufacturing - Reduced structure through consolidation
AUTOMOTIVE SECTOR
PREMIER AUTOMOTIVE GROUP
SLIDE 25

Asia Pacific and Mazda
Financial Results - 2006 difficult; reflects segment shifts in Australia and industry weakness in
Taiwan
- Mazda continues to perform well
Market Share - Strong growth in China and India
Product - More common platforms
- Continued introduction of new products
Manufacturing - Plan to rationalize product development, manufacturing operations, and
supply base
South America Performing well on all fronts
AUTOMOTIVE SECTOR
REST OF WORLD
SLIDE 26
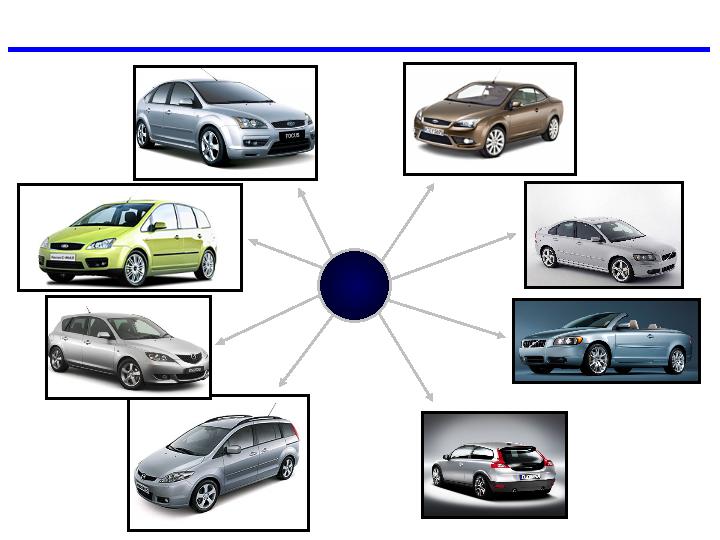
Global Focus
Focus Coupe / Cabriolet
Volvo C70
C-MAX
Mazda5 Hatchback
Volvo C30
INCREASED APPLICATION OF COMMON PLATFORMS
AUTOMOTIVE SECTOR -- INTERNATIONAL OPERATIONS
Mazda3 Hatchback
C
Volvo S40
SLIDE 27

CD
Ford Mondeo
Ford Galaxy
Ford S-MAX
Land Rover LR2
INCREASED APPLICATION OF COMMON PLATFORMS
AUTOMOTIVE SECTOR – INTERNATIONAL OPERATIONS
Volvo S80
Next-Gen Volvo V70 / XC70
Next –Gen Volvo S60
SLIDE 28

OVERVIEW
•
Present Results
•
Key Elements of Plan
–
North America Automotive
–
International Automotive
–
Ford Credit
•
Outlook
SLIDE 29
Receivables (Bils.)
On-Balance Sheet $114 $135
Securitized Off-Balance Sheet 35 13
Managed $149 $148
Charge-Offs (Mils.)
On-Balance Sheet $493 $334
Managed 609 399
Loss-to-Receivables Ratio
On-Balance Sheet 0.53% 0.33%
Managed
- U.S. Retail and Lease 0.75 0.50
- Worldwide Total 0.50 0.36
Allowance for Credit Losses
Worldwide Amount (Bils.) $ 1.8 $ 1.3
Percentage Of EOP Receivables 1.52% 0.93%
Leverage (To 1)
Financial Statement 10.6 11.4
Managed 12.5 11.4
Dividend (Bils.) $ 2.6 $ 1.0
2005
2006
Key Metrics**
Net Income (Mils.) $1,599 $1,004
ROE 17.7% 11.8%
* Excludes special items; see Appendix (pages 1 and 2) for reconciliation to GAAP
Pre-Tax Profits (Mils.)*
2005
2006
$2,441
$1,547
Nine Months
**See Appendix (pages 3-5) for calculation, definitions and
reconciliation to GAAP
FINANCIAL SERVICES SECTOR
FORD CREDIT RESULTS AND METRICS -- 2006 FIRST NINE MONTHS
$(894)
SLIDE 30

Operating
•
Ford Credit is a key part of Ford Motor Company’s strategy
•
Continuing to improve on operating excellence
-
Consolidating field and customer operations to improve process efficiencies, reduce costs, and provide flexibility
-
Receivables are high quality; portfolio continues to perform well
Funding
•
Ford Credit plan consistent with Ford Motor Company strategy
-
Reduce managed receivables
-
Suspend dividend to Ford Motor Company beginning in 2007
-
Increase equity in Ford Credit as earnings are retained to support funding
•
Maintain strong and diverse funding sources
-
Keep large cash balance and substantial committed capacity
-
Continue to add committed asset-backed funding capacity and capabilities
beyond present needs (including outside U.S.)
-
Participate in whole-loan market
-
Issue unsecured term debt when it makes sense
-
Participate in various alternative business arrangements
FINANCIAL SERVICES SECTOR
FORD CREDIT STRATEGY
Continue to add committed asset-backed funding capacity and capabilities beyond present needs (including outside U.S.)
Participate in various alternative business arrangements
-
Participate in whole-loan market
Issue unsecured term debt when it makes sense
-
-
-
SLIDE 31

OVERVIEW
•
Present Results
•
Key Elements of Plan
–
North America Automotive
–
International Automotive
–
Ford Credit
•
Outlook
SLIDE 32
(Bils.)
2006
2007
2008
2009
2010
$0
TOTAL COMPANY
PROJECTED CORPORATE EARNINGS BEFORE TAXES*
Total
Automotive
Total
Company
* Excluding special items; see Appendix (pages 1 and 2) for 2006 year-to-date reconciliation to GAAP
SLIDE 33
(Bils.)
2006
2007
2008
2009
2010
$0
-
Adverse product mix
in Ford N.A.
-
Market share in N.A.
-
Dealer inventory adj.
-
Commodity costs
-
Currency exchange
+
Reduce low-margin business
(e.g., daily rental)
-
Lower N.A. production in 1H
+
Growth in volume outside U.S.
+
Structural cost reductions
-
Commodity costs
+
Volume and mix stabilized in N.A.
+
Growth in volume continues outside U.S.
+
Further product cost improvement:
»
Supply base restructuring
»
Product complexity reducing
»
Manufacturing / supply “footprint”
improving around world
AUTOMOTIVE SECTOR
PROJECTED AUTOMOTIVE EARNINGS BEFORE INTEREST AND TAXES*
* Excluding special items; see Appendix (pages 1 and 2) for 2006 year-to-date reconciliation to GAAP
+
Favorable
-
Unfavorable
SLIDE 34
AUTOMOTIVE SECTOR
PRESENT LIQUIDITY
$6
Auto. Credit Lines
~$(3)
Operating Cash Flow**
* Cash and cash equivalents, marketable and loaned securities, and short-term VEBA assets. See Appendix (page 6) for September 30
reconciliation to GAAP
** Includes affect of dealer inventory reductions
$12
New Liquidity
$24
Automotive
Gross Cash *
$30
(Bils.)
$20
Automotive
Gross Cash*
$10
Funded New Debt
$8
Auto. Credit Lines
$38
September 30, 2006
2006 Fourth Quarter Sources and Uses
Year-End 2006
Cash Restructuring Costs
~ $(1)
SLIDE 35
AUTOMOTIVE SECTOR
FORD PLANS TO MAINTAIN SUBSTANTIAL ON-GOING LIQUIDITY
$10
Funded New Debt
~$(7)
Cash
Restructuring Costs
~$(10)
Operating-Related
Cash Outflow
~$4
Long-Term VEBA,
Divestitures & Other
Liquidity for operating
needs and a cushion
for recession and
other unexpected events
for recession and
other unexpected events
$20
Automotive
Gross Cash*
$8
Auto. Credit Lines
$38
~$25
$8
Auto. Credit Lines
$17
Automotive
Gross Cash*
Year-End 2006
Sources and Uses
Year-End 2009
(Bils.)
* Cash and cash equivalents, marketable and loaned securities, and short-term VEBA assets
SLIDE 36

•
Large global enterprise with well known brands
•
Plan to restore Automotive profitability and operating cash flow by 2009
•
Substantial liquidity resources to support the plan
•
New credit facilities are secured by a substantial portion of Automotive assets (including equity in foreign subsidiaries and Ford Credit)
KEY CREDIT STRENGTHS
SLIDE 37

Ann Marie Petach
Vice President and Treasurer
SLIDE 38

Backup
Secured Bank Revolver $ 8 2011
New Funding
Secured Term Loan B $ 7 2013
Unsecured Capital Markets Transactions* 3 TBD
New Funding $10ü
Total Facilities $ 18
* May include unsecured convertible debt securities
Amount
(Bils.)
Maturity
TRANSACTION OVERVIEW
SLIDE 39
$38
At December 31, 2006 (Bils.)
$8
Auto. Credit Lines
$30
Automotive
Gross Cash*
Liquidity
Debt
Liquidity Net
of Debt
$13
Unsecured
Debt
$5
Unsecured
Subordinated Debt**
$7
Funded New Secured
$28
$10
Assumes $8 Billion Revolver and
$10 Billion Funded New Debt --
Total $18 Billion
Total $18 Billion
* Cash and cash equivalents, marketable and loaned securities, and short-term VEBA assets
** Related to Convertible Trust Preferred securities
$3 -- Funded New Unsecured
PRO FORMA AUTOMOTIVE LIQUIDITY
SLIDE 40
$27.7
December 31, 2006 (Bils.)
0-5
Years
6-10
Years
11-15
Years
16-20
Years
21-25
Years
26-30
Years
31-50
Years
►
50
Years
$10.0
$0.5
$0.7
$5.7
$5.5***
$3.1*
$1.7
$0.5
$7.0
New
Secured
Term
Loan B
$3.0
New
Unsecured
Debt**
PRO FORMA AUTOMOTIVE DEBT MATURITIES
* 2007 maturities total $1 billion
** May include unsecured convertible debt
*** Includes Convertible Trust Preferred securities
SLIDE 41
U.S. Receivables $ 0.3 75% $ 0.2
U.S. Inventory 3.3 60 2.0
Pledge of Intercompany Notes 7.8 N/A 4.6
Pledge of Equity in Ford Credit and
Certain Foreign Subsidiaries 11.9 75 9.0
U.S. PP&E Subject to Bond Indenture Limitation 6.8 N/A 3.2
Other U.S. Machinery and Equipment 3.9 40 1.6
Intellectual Property & U.S. Trademarks** 7.9 N/A 2.5
Eligible Value / Borrowing Base $41.9 $23.1
Memo:
Secured Debt Coverage with Revolver Unfunded*** 4.93 2.71
Secured Debt Coverage with Revolver Funded*** 2.54 1.40
* Based on formula set forth in credit documentation and not necessarily indicative of fair market value, which
could be materially higher or lower
could be materially higher or lower
** Value reflects independent third party valuation of trademarks only
*** Includes $1.5 billion of potential non-loan exposure
Eligible
Value*
(Bils.)
Advance
Rate
Borrowing
Base
(Bils.)
COLLATERAL AND BORROWING BASE OVERVIEW
SLIDE 42
S&P
Issuer Rating B Negative
Secured Facility TBA TBA
Senior Unsecured Debt CCC+
Moody’s
Issuer Rating B3 Negative
Secured Facility Ba3 Negative
Senior Unsecured Debt Caa1 Negative
Fitch
Issuer Rating B Negative
Secured Facility TBA TBA
Senior Unsecured Debt B Negative
Rating
Outlook
CREDIT RATINGS -- FORD
SLIDE 43

KEY TERMS -- SENIOR SECURED CREDIT FACILITIES
Borrower: Guarantors: Facility: Security: Purpose: | Ford Motor Company Substantially all existing and future, direct and indirect, material domestic subsidiaries other than Ford Motor Credit Company Tranche Amount Maturity Bank Revolver $8 billion 5 years Term Loan B $7 billion 7 years - U.S. Account Receivables and Inventory - U.S. Plant, Property, and Equipment (subject to debt indenture limitations) - 100% pledge of the stock of primary U.S. subsidiaries (including Ford Credit) - 66% to 100% pledge of the stock of first tier foreign subsidiaries - Certain intercompany notes from foreign subsidiaries and U.S. intellectual property and trademarks General corporate purposes |
SLIDE 44

KEY TERMS -- SENIOR SECURED CREDIT FACILITIES
Facility Fee: Pricing: Term Loan Amortization: Term Loan Optional Redemption: Non-loan Exposure: Incremental Facilities: Borrowing Base: | 50 basis points per annum Market based 1% per annum with balance due at maturity Non-callable for 2 years. Thereafter, callable as a percentage of par value as follows: Year 3 (102%), Year 4 (101%), thereafter 100% Up to $1.5 billion of non-loan exposure of extending lenders and other non-lenders permitted on pari passu basis • Up to $2 billion pari passu first lien facilities or notes • Up to $4 billion of second lien debt Minimum 1.0x coverage |
SLIDE 45

TRANSACTION TIMETABLE
Lenders’ Meeting and Conference Call November 29
Final Commitments on Loans Due
from Lenders December 7
Closing and Funding December 15
Timing Plan
SLIDE 46
QUESTIONS AND ANSWERS
SLIDE 47

•
Continued decline in market share;
•
Continued or increased price competition resulting from industry overcapacity, currency fluctuations or other factors;
•
A market shift (or an increase in or acceleration of market shift) away from sales of trucks or sport utility vehicles, or from sales of other more profitable vehicles in the United States;
A significant decline in industry sales, particularly in the United States or Europe, resulting from slowing economic growth, geo-political events (e.g., an escalation or expansion of armed conflict in or beyond the Middle East) or other factors;
•
•
Lower-than-anticipated market acceptance of new or existing products;
•
Continued or increased high prices for or reduced availability of fuel;
•
Currency or commodity price fluctuations;
•
Adverse effects from the bankruptcy or insolvency of, change in ownership or control of, or alliances entered into by a major competitor;
•
Economic distress of suppliers that has in the past and may in the future require us to provide financial support or take other measures to ensure supplies of components or materials;
•
Work stoppages at Ford or supplier facilities or other interruptions of supplies;
•
Single-source supply of components or materials;
•
Labor or other constraints on our ability to restructure our business;
•
Worse-than-assumed economic and demographic experience for our postretirement benefit plans (e.g., discount rates, investment returns, and health care cost trends);
•
The discovery of defects in vehicles resulting in delays in new model launches, recall campaigns or increased warranty costs;
•
Increased safety, emissions, fuel economy or other (e.g., pension funding) regulation resulting in higher costs, cash expenditures, and/or sales restrictions;
•
Unusual or significant litigation or governmental investigations arising out of alleged defects in our products or otherwise;
•
A change in our requirements for parts or materials where we have entered into long-term supply arrangements that commit us to purchase minimum or fixed quantities of certain parts or materials, or to pay a minimum amount to the seller ("take-or-pay contracts");
•
Inability to access debt or securitization markets around the world at competitive rates or in sufficient amounts due to additional credit rating downgrades, unfavorable capital market conditions, insufficient collateral, greater-than-expected negative operating-related cash flow or otherwise;
•
Higher-than-expected credit losses;
•
Increased competition from banks or other financial institutions seeking to increase their share of financing Ford vehicles;
•
Changes in interest rates;
•
Collection and servicing problems related to finance receivables and net investment in operating leases;
•
Lower-than-anticipated residual values or higher-than-expected return volumes for leased vehicles;
•
New or increased credit, consumer or data protection or other regulations resulting in higher costs and/or additional financing restrictions; and
•
Inability to implement the Way Forward plan.
Statements included or incorporated by reference herein may constitute “forward-looking statements” within the meaning of the Private Securities
Litigation Reform Act of 1995. Forward-looking statements are based on expectations, forecasts and assumptions by our management and involve a number of risks, uncertainties, and other factors that could cause actual results to differ materially from those stated, including, without limitation:
We cannot be certain that any expectation, forecast or assumption made by management in preparing these forward-looking statements will prove accurate, or that any projection will be realized. It is to be expected that there may be differences between projected and actual results. Our forward-looking statements speak only as of the date of their initial issuance, and we do not undertake any obligation to update or revise publicly any forward-looking statement,
whether as a result of new information, future events or otherwise.
whether as a result of new information, future events or otherwise.
SAFE HARBOR
SLIDE 48

APPENDIX

North America $(2,004) $ (9,955) $(736) $(6,668) $(1,268) $(3,287)
South America 268 547 0 110 268 437
Total Americas $(1,736) $ (9,408) $(736) $(6,558) $(1,000) $(2,850)
Europe $ 0 $ 193 $ (49) $ (44) $ 49 $ 237
P.A.G. (217) (2,208) (66) (1,690) (151) (518)
Total Europe / P.A.G. $ (217) $ (2,015) $ (115) $ (1,734) $ (102) $ (281)
Asia Pacific and Africa $ 114 $ (50) $ 14 $ 0 $ 100 $ (50)
Mazda & Assoc. Operations 223 254 0 137 223 117
Total AP and Africa / Mazda $ 337 $ 204 $ 14 $ 137 $ 323 $ 67
Total International $ 120 $ (1,811) $(101) $(1,597) $ 221 $ (214)
Other Automotive 41 306 146 0 (105) 306
Total Automotive $(1,575) $(10,913) $(691) $(8,155) $ (884) $(2,758)
Financial Services 2,912 1,550 84 0 2,828 1,550
Total Company $ 1,337 $ (9,363) $ (607) $(8,155) $ 1,944 $(1,208)
Pre-Tax Profits
(Incl. Special Items)
Special Items
Pre-Tax Profits
(Excl. Special Items)
2006
(Mils.)
2006
(Mils.)
2005
(Mils.)
2005
(Mils.)
2005
(Mils.)
2006
(Mils.)
TOTAL COMPANY
2005 – 2006 FIRST NINE MONTHS PRE-TAX RESULTS*
* From continuing operations
Appendix 1 of 6

Americas
Jobs Bank / Employee Separation $ (2.5) $ (2.5)
Fixed Asset Impairment -- North America (2.2) (2.2)
Pension / OPEB Curtailment Charges (1.3) (2.4) - (1.9)
Additional North America Personnel Reductions (0.4) (1.5) - (1.1)
Facility-Related U.S. Plant Idling Costs (0.3) (0.3)
South American Legal Settlement 0.1 0.1
Total Americas $ (6.6) $ (8.8) - (7.9)
International
Fixed Asset Impairment -- Jaguar / Land Rover $ (1.6) $ (1.6)
European Personnel Reductions (0.1) (0.6) - (0.5)
Asia Pacific and Africa Personnel Actions - - (0.1)
Mazda Pension Adjustment 0.1 0.1
Total International $ (1.6) $ (2.2) - (2.1)
Total Special Items $ (8.2) $ (11.0) - (10.0)
Full Year
Projection
(Bils.)
First
Nine Months
(Bils.)
TOTAL COMPANY
2006 PRE-TAX SPECIAL ITEMS
Memo: 2006 Cash Impact $ (1.0) $ (1.5)
Appendix 2 of 6

FORD CREDIT KEY METRIC DEFINITIONS
In addition to evaluating Ford Credit’s financial performance on a GAAP financial statement basis, Ford Credit management also uses other criteria, some of which were previously disclosed in this presentation and are defined below. Information about the impact of on-balance sheet securitization is also included below:
Managed Receivables -- receivables reported on Ford Credit’s balance sheet and receivables Ford Credit sold in off-balance-sheet securitizations and continues to service
Serviced Receivables -- includes managed receivables and receivables Ford Credit sold in whole-loan sale transactions (i.e., receivables for which Ford Credit has no continuing exposure or risk of loss)
Charge-offs on Managed Receivables -- charge-offs associated with receivables reported on Ford Credit’s balance sheet plus charge-offs associated with receivables Ford Credit sold in off-balance sheet securitizations and continues to service
Impact of On-Balance Sheet Securitization -- finance receivables (retail and wholesale) and investments in operating leases reported on Ford Credit’s balance sheet include assets transferred in securitizations that do not qualify for accounting sale treatment. These assets have been legally transferred to Ford Credit sponsored special purpose entities and are available only to pay the obligations of the special purpose entities and are not available to pay the other obligations of Ford Credit or the claims of Ford Credit’s other creditors. Debt reported on Ford Credit’s balance sheet includes debt issued by these special purpose entities to securitization investors which is payable out of collections on the assets supporting the securitizations and is not the legal obligation of Ford Credit or its other subsidiaries
Appendix 3 of 6

FORD CREDIT RATIO DEFINITIONS
In addition to evaluating Ford Credit’s financial performance on a GAAP financial statement basis, Ford Credit management also uses other criteria, some of which were previously disclosed in this presentation and are defined below:
Leverage:
Total Debt
- Financial Statement Leverage
=
Equity
Total Debt
Securitized
Off-Balance
Sheet
Receivables
Cash, Cash
Equivalents &
Marketable
Securities*
Fair Value
Hedge Acctg.
Adjustments
Adjustments
on Total Debt
Equity
Minority
Interest
Fair Value
Hedge Acctg.
Adjustment
on Equity
- Managed Leverage
+
-
-
-
=
+
-
Retained
Interest in
Securitized
Off-Balance
Sheet
Receivables
Charge-offs
=
Average Receivables
Loss-to-Receivables Ratio
* Excluding marketable securities related to insurance activities
Appendix 4 of 6

FORD CREDIT RECONCILIATIONS OF MANAGED
LEVERAGE TO FINANCIAL STATEMENT LEVERAGE
Total Debt* $120.4 $134.5
Securitized Off-Balance Sheet Receivables Outstanding 35.0 12.9
Retained Interest in Securitized Off-Balance Sheet Receivables (4.4) (1.1)
Adjustments for Cash, Cash Equivalents and Marketable Securities** (19.0) (17.4)
Fair Value Hedge Accounting Adjustments (0.8) (0.2)
Total Adjusted Debt $131.2 $ 128.7
Total Stockholder’s Equity (incl. minority interest) $ 11.4 $ 11.8
Fair Value Hedge Accounting Adjustments (0.9) (0.5)
Total Adjusted Equity $ 10.5 $ 11.3
Managed Leverage (to 1) 12.5 11.4
Financial Statement Leverage (to 1) 10.6 11.4
*Includes $23.9 billion and $55.9 billion on September 30, 2005 and September 30, 2006 respectively of debt issued by securitization SPEs
which is payable solely out of collections on the receivables sold to the SPEs and is not the legal obligation of Ford Credit
** Excluding marketable securities related to insurance activities
Sep. 30,
2006
(Bils.)
Leverage Calculation
Sep. 30,
2005
(Bils.)
Appendix 5 of 6

AUTOMOTIVE SECTOR
GROSS CASH RECONCILIATION TO GAAP
Cash and Cash Equivalents $13.4 $13.5 $ 0.1 $ 9.1
Marketable Securities 6.9 7.8 0.9 7.9
Loaned Securities 3.4 0.6 (2.8) 0.6
Total $23.7 $21.9 $(1.8) $17.6
Short-Term VEBA 1.4 1.7 0.3 2.0
Gross Cash $25.1 $23.6 $(1.5) $19.6
Sept. 30, 2006
B / (W)
Dec. 31, 2005
(Bils.)
Sept. 30,
2006
(Bils.)
Dec. 31,
2005
(Bils.)
Memo:
Sept. 30, 2005
(Bils.)
Appendix 6 of 6