
Ford Motor Credit Company
ANNUAL REPORT
ON FORM 10-K
for the year ended
December 31, 2005
Filed pursuant to Section 13 or 15(d)
of the Securities Exchange Act of 1934
TABLE OF CONTENTS
UNITED STATES
SECURITIES AND EXCHANGE COMMISSION
Washington, D.C. 20549
FORM 10-K
| | | |
| (Mark One) | | |
| [X] | | Annual Report Pursuant to Section 13 or 15(d) of the Securities Exchange Act of 1934 |
| | | For the fiscal year ended December 31, 2005 |
| | | OR |
| o | | Transition Report Pursuant to Section 13 or 15(d) of the Securities Exchange Act of 1934 |
| | | For the transition period from
to |
| | | Commission file number 1-6368 |
Ford Motor Credit Company
(Exact name of registrant as specified in its charter)
| | | |
| Delaware | | 38-1612444 |
| (State of incorporation) | | (I.R.S. employer identification no.) |
| |
One American Road, Dearborn, Michigan | | 48126 |
| (Address of principal executive offices) | | (Zip code) |
Registrant’s telephone number, including area code (313) 322-3000
Securities registered pursuant to Section 12(b) of the Act:
| | | |
| Title of each class | | Name of each Exchange on which registered |
| |
|
| 6 3/8% Notes due November 5, 2008 | | New York Stock Exchange |
| 7 3/8% Notes due October 15, 2031 | | New York Stock Exchange |
| 7.60% Notes due March 1, 2032 | | New York Stock Exchange |
Securities registered pursuant to Section 12(g) of the Act: None.
Indicate by check mark if the registrant is a well-known seasoned issuer, as defined in Rule 405 of the Securities Act. þ Yes o No
Indicate by check mark if the registrant is not required to file reports pursuant to Section 13 or Section 15(d) of the Act. o Yes þ No
Indicate by check mark whether the registrant (1) has filed all reports required to be filed by Section 13 or 15(d) of the Securities Exchange Act of 1934 during the preceding 12 months (or for such shorter period that the registrant was required to file such reports), and (2) has been subject to such filing requirements for the past 90 days. þ
Indicate by check mark if disclosure of delinquent filers pursuant to Item 405 of Regulation S-K is not contained herein, and will not be contained, to the best of Registrant’s knowledge, in definitive proxy or information statements incorporated by reference in Part III of this Form 10-K or any amendment to this Form 10-K. þ Yes o No
Indicate by check mark whether the registrant is a large accelerated filer, an accelerated filer, or a non-accelerated filer. See definition of “accelerated filer and large accelerated filer” in Rule 12b-2 of the Exchange Act.
| | |
| Large accelerated filer o | Accelerated filer o | Non-accelerated filer þ |
Indicate by check mark whether the registrant is a shell company (as defined in Rule 12b-2 of the Act). o Yes þ No
As of February 24, 2006, the registrant had outstanding 250,000 shares of Common Stock. No voting stock of the registrant is held by non-affiliates of the registrant.
REDUCED DISCLOSURE FORMAT
The registrant meets the conditions set forth in General Instruction I(1)(a) and (b) of Form 10-K and is therefore filing this Form with the reduced disclosure format.
EXHIBIT INDEX APPEARS AT PAGE 52
PART I
Overview
Ford Motor Credit Company (referred to herein as “Ford Credit”, the “Company”, “we”, “our” or “us”) was incorporated in Delaware in 1959. We are an indirect, wholly owned subsidiary of Ford Motor Company (“Ford”). Our principal executive offices are located at One American Road, Dearborn, Michigan 48126, and our telephone number is (313) 322-3000.
Our annual reports on Form 10-K and quarterly reports on Form 10-Q filed with the Securities and Exchange Commission (“SEC”) pursuant to Section 13(a) or 15(d) of the Securities Exchange Act are available free of charge through our website located atwww.fordcredit.com/investorcenter/. These reports and our current reports on Form 8-K can be found on the SEC’s website located atwww.sec.gov.
Products and Services. We offer a wide variety of automotive financing products to and through automotive dealers throughout the world. Our primary financing products fall into three categories:
| | |
| | • | Retail financing — purchasing retail installment sale contracts and retail lease contracts from dealers, and offering financing to commercial customers, primarily vehicle leasing companies and fleet purchasers, to lease or purchase vehicle fleets; |
| |
| | • | Wholesale financing — making loans to dealers to finance the purchase of vehicle inventory, also known as floorplan financing; and |
| |
| | • | Other financing — making loans to dealers for working capital, improvements to dealership facilities, and to purchase and finance dealership real estate. |
We also service the finance receivables and leases we originate and purchase, make loans to Ford affiliates, purchase certain receivables of Ford and its subsidiaries and provide insurance services related to our financing programs.
We earn our revenue primarily from:
| | |
| | • | Payments made under retail installment sale contracts and retail leases that we purchase, including interest supplements and other support payments from Ford on special-rate retail financing programs; |
| |
| | • | Investment and other income related to sold receivables; and |
| |
| | • | Payments made under wholesale and other dealer loan financing programs. |
Geographic Scope of Operations and Segment Information. We conduct our financing operations directly and through our subsidiaries and affiliates. We offer substantially similar products and services throughout many different regions, subject to local legal restrictions and market conditions. We divide our business segments based on geographic regions: Ford Credit North America (“North America segment”) and Ford Financial International (“International segment”). The North America segment includes our operations in the United States and Canada. The International segment includes our operations in all other countries in which we do business directly and indirectly. Additional financial information regarding our operations by business segments and operations by geographic regions are shown in Note 16 of our Notes to the Financial Statements.
North America Segment
We do business in all 50 states of the United States and in all provinces in Canada. Our United States operations accounted for 67% and 68% of our total managed receivables at year-end 2005 and 2004, respectively, and our Canadian operations accounted for about 8% and 7% of our total
| |
| ITEM 1. | BUSINESS (Continued) |
managed receivables in 2005 and 2004, respectively. Managed receivables include receivables sold in off-balance sheet securitizations and exclude receivables sold in whole-loan sale transactions. For a discussion of how we review our business performance, including on a managed basis, see the “Overview” section in Item 7.
In the United States and Canada, under the Ford Credit brand name, we provide financing services to and through dealers of Ford, Lincoln and Mercury brand vehicles and non-Ford vehicles also sold by these dealers and their affiliates. We provide similar financial services under the Jaguar, Land Rover, Mazda and Volvo brand names to and through Jaguar, Land Rover, Mazda, Volvo and Aston Martin dealers, respectively.
International Segment
Our International segment includes operations in three main regions: Europe, Asia-Pacific and Latin America. Our Europe region is our largest international operation, accounting for 18% and 19% of our total managed receivables at year-end 2005 and 2004, respectively. Within the International segment, our Europe region accounted for 74% and 77%, respectively, of our managed receivables at year-end 2005 and 2004, respectively. Most of our European operations are managed through a United Kingdom-based subsidiary, FCE Bank plc (“FCE”), which operates in the United Kingdom and operates branches in 15 other European countries. In addition, FCE has subsidiaries in the United Kingdom, Finland, Hungary, Poland and the Czech Republic that provide wholesale, leasing and retail vehicle financing. In our largest European markets, Germany and the United Kingdom, FCE offers most of our products and services under the Ford Credit/ Bank, Volvo Car Finance, Land Rover Financial Services, Jaguar Financial Services and Mazda Credit/ Bank brands. FCE generates most of our European revenue and contract volume from Ford Credit/ Bank brand products and services. FCE, through our Worldwide Trade Financing division, provides financing to dealers in countries where typically there is no established local Ford presence. In addition, other private label operations and outsourcing arrangements are in place in several markets in Central and Eastern Europe. We also offer financing in Germany and Sweden for Volvo brand vehicles through Volvo Auto Finanz Service Deutschland GmbH and Volvo Finans, a joint venture with Swedish Volvo dealers. We also have joint ventures in South Africa and Saudi Arabia that provide wholesale, leasing and retail vehicle financing.
In the Asia-Pacific region, we operate in Australia, Japan, Taiwan, Thailand, New Zealand and China. The China Banking Regulatory Commission approved our final application to provide auto financing in China during the second quarter of 2005. We have joint ventures with local financial institutions and other third parties in Indonesia and the Philippines. In the Latin America region, we operate in Mexico, Puerto Rico, Brazil, Venezuela, Chile and Argentina.
Competition
The automotive financing business is highly competitive. Our principal competitors for retail and wholesale financing are:
| | | |
| Retail | | Wholesale |
| |
|
• Banks
• Independent finance companies
• Credit unions and savings and loan associations
• Leasing companies
• Other automobile manufacturers’ affiliated finance companies | | • Banks
• Other automobile manufacturers’ affiliated finance companies |
We compete mainly on the basis of service and financing rates. A key foundation of our service is providing broad and consistent purchasing policies for retail installment sale and lease contracts and consistent support for dealer financing requirements across economic cycles. Through these policies we have built strong relationships with Ford’s dealer network that enhance our
2
| |
| ITEM 1. | BUSINESS (Continued) |
competitiveness. Our ability to provide competitive financing rates depends on effectively and efficiently originating, purchasing and servicing our receivables, and accessing the capital markets. We routinely monitor the capital markets and develop funding alternatives to maximize our competitive position. The ability to tailor our financing services to support Ford’s vehicle production and marketing plans gives us a competitive advantage in providing financing to Ford dealers and their customers. In addition, our size allows us to take advantage of economies of scale in both purchasing and servicing our receivables and leases.
No single company is a dominant force in the industry. Some of our bank competitors have developed credit aggregation systems that permit dealers to send, through a single standard system, retail credit applications to multiple finance sources to evaluate financing options offered by these finance sources. This process has resulted in greater competition based on financing rates. We, along with other automobile manufacturers’ affiliated finance companies, formed a joint venture in 2002, RouteOne LLC (“RouteOne”), that developed a similar credit application management system. RouteOne operates a web-based system that enables dealers and their finance sources, including automobile manufacturers’ affiliated finance companies, banks, and other financial institutions, to exchange credit application and decision information online.
Seasonal Variations
As a finance company, we own and manage a large portfolio of finance receivables and operating leases that are generated throughout the year and are collected over a number of years, primarily in fixed monthly payments. As a result, our overall financing revenues do not exhibit seasonal variations. However, throughout the automotive financing industry, charge-offs are typically higher in the first and fourth quarters of the year due to competing financial demands on customers.
Dependence on Ford
The predominant share of our business consists of financing Ford vehicles and supporting Ford dealers. Any extended reduction or suspension of Ford’s production or sale of vehicles due to a decline in consumer demand, work stoppage, governmental action, negative publicity or other event, or significant changes to marketing programs sponsored by Ford, would have an adverse effect on our business. Additional information about Ford’s business, operations, production, sales and risks can be found in Ford’s Annual Report on Form 10-K for the year ended December 31, 2005 (“Ford’s 2005 10-K Report”), filed separately with the SEC and included as an exhibit to this report (without financial statements and exhibits).
Ford has sponsored special-rate financing programs available only through us. Similar programs may be offered in the future. Under these programs, Ford makes interest supplements or other support payments to us. These programs increase our financing volume and share of financing sales of Ford vehicles. For further discussion regarding interest supplements and other support costs earned from affiliated companies, see Note 15 of our Notes to the Financial Statements.
Retail Financing
Overview and Purchasing Process
We provide financing services to retail customers through automotive dealers that have established relationships with us. Our primary business consists of purchasing retail installment sale and lease contracts for new and used vehicles mainly from dealers of Ford vehicles. We report in our financial statements the receivables from customers under installment sale contracts and certain leases with fleet customers as finance receivables. We report in our financial statements most of our retail leases as net investment in operating leases with the capitalized cost of the vehicles recorded as depreciable assets.
3
| |
| ITEM 1. | BUSINESS (Continued) |
In general, we purchase from dealers retail installment sale contracts and lease contracts that meet our credit standards. These contracts primarily relate to the purchase or lease of new vehicles, but some are for used vehicles. Dealers typically submit customer applications electronically to one of our branch offices. Some of the applications are automatically evaluated and either approved or rejected based on our origination scorecard and credit policy criteria. In other cases, our credit analysts evaluate applications using our written guidelines.
Retail Installment Sale Contracts
The amount we pay for a retail installment sale contract is based on a negotiated vehicle purchase price agreed to between the dealer and the retail customer, plus any additional products, such as insurance and extended service plans, that are included in the contract, less any vehicle trade-in allowance or down payment from the customer applied to the purchase price. The net purchase price owed by the customer typically is paid over a specified number of months with interest at a fixed rate negotiated between the dealer and the retail customer. The dealer may retain a portion of the finance charge.
We offer a variety of retail installment sale financing products. In the United States, retail installment sale contract terms for new Ford, Lincoln and Mercury brand vehicles range primarily from 12 to 72 months. The average original term of our retail installment sale contracts was 57 months in the United States in 2005, compared with 58 months in 2004.
Some of our retail installment sale contracts have non-uniform payment periods and payment amounts to accommodate special cash flow situations. We also offer a retail balloon product under which the retail customer may finance their vehicle with an installment sale contract with a series of monthly payments followed by paying the amount remaining in a single balloon payment. The customer can satisfy the balloon payment obligation by payment in full of the amount owed, by refinancing the amount owed, or by returning the vehicle to us and paying additional charges for mileage and excess wear and use, if any. We sell vehicles returned to us to other Ford and non-Ford dealers through the same auction process that we use for repossessed vehicles. Customers who choose our retail balloon product may also qualify for special-rate financing offers from Ford.
We hold a security interest in the vehicles purchased through retail installment sale contracts. This security interest provides us certain rights and protections. As a result, if our collection efforts fail to bring a delinquent customer’s payments current, we generally can repossess the customer’s vehicle, after satisfying local legal requirements, and sell it at auction. The customer typically remains liable for any deficiency between net auction proceeds and the defaulted contract obligations, including any repossession-related expenses. We require retail customers to carry fire, theft and collision insurance on financed vehicles.
Retail Lease Plans
We offer leasing plans to retail customers through our dealers. Our highest volume retail-leasing plan is called Red Carpet Lease, which is offered in the United States and Canada through dealers of Ford, Lincoln and Mercury brands. We offer similar lease plans through dealers of other Ford brands (Jaguar, Land Rover, Mazda, Volvo and Aston Martin). Under these plans, dealers originate the leases and offer them to us for purchase. Upon our purchase of a lease, we take ownership of the lease and title to the leased vehicle from the dealer. After we purchase a lease from a dealer, that dealer generally has no further obligation to us in connection with the lease. The customer is responsible for properly maintaining the vehicle and is obligated to pay for excess wear and use as well as excess mileage, if any. At the end of the lease, the customer has the option to purchase the vehicle for the customer purchase option price specified in the lease contract, or return the vehicle to the dealer. If the customer returns the vehicle to the dealer, the dealer may buy the vehicle from us
4
| |
| ITEM 1. | BUSINESS (Continued) |
or return it to us. We sell vehicles returned to us to other Ford and non-Ford dealers through the same auction process that we use for repossessed vehicles.
The amount we pay to a dealer for a retail lease, also called the acquisition cost, is based on the negotiated vehicle price agreed to by the dealer and the retail customer plus any additional products, such as insurance and extended service plans, that are included in the contract, less any vehicle trade-in allowance or down payment from the customer. The customer makes monthly lease payments based on the acquisition cost less the contractual residual value of the vehicle, plus lease charges. Some of our lease programs, such as our Red Carpet Lease Advance Payment Plan, provide certain pricing advantages to customers who make all or some monthly payments at lease inception or purchase refundable higher mileage allowances. We require lease customers to carry fire, theft, liability and collision insurance on leased vehicles. In the case of a contract default and repossession, the customer typically remains liable for any deficiency between net auction proceeds and the defaulted contract obligations, including any repossession-related expenses.
In the United States, retail operating lease terms for new Ford, Lincoln and Mercury brand vehicles range primarily from 12 to 48 months. In 2005, the average original lease term was 31 months compared with 34 months in 2004.
Other Vehicle Financing
We also offer vehicle-financing programs to commercial customers including leasing companies, daily rental companies, government entities and fleet customers. These financings include both lease plans and installment purchase plans and are generally for terms of 12 to 84 months. The financing obligations are collateralized by perfected security interests on financed vehicles in almost all instances and, where appropriate, an assignment of rentals under any related leases. At the end of the finance term, a lease customer may be required to pay us any shortfall between the fair market value and the specified end of term value of the vehicle. If the fair market value of the vehicle at the end of the finance term exceeds the specified end of term value, we may pay the lease customer the excess amount. These financings are included in retail finance receivables and net investment in operating leases in our financial statements.
Wholesale Financing
We offer a wholesale financing program for qualifying dealers to finance new and used vehicles held in inventory. We generally finance the vehicle’s wholesale invoice price for new vehicles and up to 100% of the dealer’s purchase price for used vehicles. Dealers generally pay a floating interest rate on wholesale loans based on the prime rate. In the United States in 2005, the average wholesale receivable was outstanding for 90 days, excluding the time the vehicle was in transit from the assembly plant to the dealership. Our wholesale financing program includes financing of large multi-brand national dealer groups that are some of our largest wholesale customers based on the amount financed.
When a dealer uses our wholesale financing program to purchase vehicles we obtain a security interest in the vehicles and, in many instances, other assets of the dealer. Our subsidiary, The American Road Insurance Company (“TARIC”), generally provides insurance for vehicle damage and theft of vehicles held in dealer inventory that are financed by us.
Other Financing
We make loans to dealers for improvements to dealership facilities, working capital and the purchase and financing of dealership real estate. These loans are included in other finance receivables in our financial statements. These loans typically are secured by mortgages on real
5
| |
| ITEM 1. | BUSINESS (Continued) |
estate, security interests in other dealership assets and sometimes personal guarantees from the individual owners of the dealership.
We also purchase certain receivables generated by divisions and affiliates of Ford, primarily in connection with the delivery of vehicle inventories from Ford, the sale of parts and accessories by Ford to dealers and the purchase of other receivables generated by Ford. These receivables are included in net finance receivables in our financial statements.
Marketing and Special Programs
We actively market our financing products and services to automotive dealers and customers. Through personal sales contacts, targeted advertisements in trade publications, participation in dealer-focused conventions and organizations and support from manufacturers, we seek to demonstrate to dealers the value of entering into a business relationship with us. Our marketing strategy is based on our belief that we can better assist dealers in achieving their sales, financial and customer satisfaction goals by being a stable, committed finance source with knowledgeable automotive and financial professionals offering personal attention and interaction. We demonstrate our commitment to dealer relationships with a variety of materials, measurements and analyses showing the advantages of a full range of automotive financing products that allows consistent and predictable single source financing. From time to time, we promote increased dealer transactions through incentives, bonuses, contests and selected program and rate adjustments.
We promote our retail financing products primarily through pre-approved credit offers to prospective customers, point-of-sale information, ongoing communications and contacts with existing customers. Our communications to these customers promote the advantages of our financing products, the availability of special plans and programs and the benefits of affiliated products, such as extended warranties, service plans, insurance coverage gap protection and excess wear and use waivers. We also emphasize the quality of our customer service and the ease of making payments and transacting business with us. For example, through our web site located atwww.fordcredit.com, a customer can make inquiries, review an account balance, examine current incentives, schedule an electronic payment or qualify for a pre-approved credit offer.
We also market our non-consumer financial services described above in “Other Vehicle Financing” with a specialized group of employees who make direct sales calls on dealers, and, often at the request of such dealers, on potential high-volume commercial customers. This group also uses various materials to explain our flexible programs and services specifically directed at the needs of commercial and fleet vehicle customers.
Servicing
General. After we purchase retail installment sale contracts and leases from dealers and other customers, we manage the receivables during their contract terms. This management process is called servicing. We service the finance receivables and leases we originate and purchase. Our servicing duties include the following:
| | |
| | • | applying monthly payments from customers, |
| |
| | • | contacting delinquent customers for payment, |
| |
| | • | maintaining the security interest in the financed vehicle, |
| |
| | • | monitoring insurance coverage for lease vehicles in certain states, |
| |
| | • | providing billing statements to customers, |
| |
| | • | responding to customer inquiries, |
6
| |
| ITEM 1. | BUSINESS (Continued) |
| | |
| | • | releasing security interests on paid-off finance contracts, |
| |
| | • | arranging for the repossession of vehicles, and |
| |
| | • | selling repossessed and returned vehicles at auction. |
Customer Payment Operations. In the United States and Canada, customers are directed in their monthly billing statements to mail payments to a bank for deposit in a lockbox account. Customers may also make payments through electronic payment services, a direct debit program or a telephonic payment system.
Servicing Activities — Consumer Credit. We design our collection strategies and procedures to keep accounts current and to collect on delinquent accounts. We employ a combination of proprietary and non-proprietary tools to assess the probability and severity of default for all of our receivables and leases and implement our collection efforts based on our determination of the credit risk associated with each customer. As each customer develops a payment history, we use an internally developed behavioral scoring model to assist in determining the best collection strategies. Based on data from this scoring model, we group contracts by risk category for collection. Our centralized collection operations are supported by auto-dialing technology and proprietary collection and workflow operating systems. Our United States systems also employ a web-based network of outside contractors who support the repossession process. Through our auto-dialer program and our monitoring and call log systems, we target our efforts on contacting customers about missed payments and developing satisfactory solutions to bring accounts current.
Outsourced Operations. We engage vendors to perform many of our servicing processes. These processes include applying monthly payments from customers, monitoring the perfection of security interests in financed vehicles, monitoring insurance coverage on lease vehicles in certain states, imaging of contracts and electronic data file maintenance, generation of retail and lease billing statements, telephonic payment systems for retail customers, the handling of some inbound customer service calls and the recovery of deficiencies for selected accounts.
Payment Extensions. We frequently offer payment extensions to customers who have encountered temporary financial difficulty that limits their ability to pay as contracted. A payment extension allows the customer to extend the term of the contract, usually by paying a fee that is calculated in a manner specified by law. Following a payment extension, the customer’s account is no longer delinquent. Before agreeing to a payment extension, the service representative reviews the customer’s payment history, current financial situation and assesses the customer’s desire and capacity to make future payments. The service representative decides whether the proposed payment extension complies with our policies and guidelines. Service center managers review, and generally must approve, payment extensions outside these guidelines.
Repossessions and Auctions. We view repossession of a financed or leased vehicle as a final step that we undertake only after all other collection efforts have failed. We usually sell repossessed vehicles at auction and apply the proceeds to the amount owed on the customer’s account. At our National Recovery Center, we continue to attempt collection of any deficient amounts until the account is paid in full, we obtain mutually satisfactory payment arrangements with the debtor or we determine that the account is uncollectible.
Ford’s Vehicle Remarketing Department, in conjunction with our regional service centers and our National Recovery Center, manages the sale of repossessed vehicles and returned leased vehicles. Repossessed vehicles are reported in other assets on our balance sheet at values that approximate expected net auction proceeds. We inspect and recondition the vehicle to maximize the net auction value of the vehicle. Vehicles are then offered for sale through open auctions, in which any licensed dealer can participate, and closed auctions, in which only Ford, Lincoln and Mercury dealers may participate.
7
| |
| ITEM 1. | BUSINESS (Continued) |
Wholesale and Commercial. We require dealers to submit monthly financial statements that we monitor for potential credit deterioration. We assign an evaluation rating to each dealer and we perform physical audits of vehicle inventory periodically, with more frequent audits for higher risk dealers. We monitor dealer inventory financing payoffs daily to detect deviations from typical repayment patterns and take appropriate actions. Within the United States and Canada, we provide services to fleet purchasers, leasing companies, daily rental companies and other commercial customers. We generally review our exposure under these credit arrangements at least annually. In our international markets, this business is managed within the head office of the local market area.
Insurance
We conduct insurance operations primarily through TARIC and its subsidiaries in the United States and Canada and through various other insurance subsidiaries outside the United States and Canada. TARIC offers a variety of products and services, including:
| | |
| | • | Extended service plan contracts, mainly through Ford dealers for new and used vehicles, |
| |
| | • | Physical damage insurance covering vehicles at dealers’ locations and vehicles in-transit between final assembly plants and dealers’ locations, and |
| |
| | • | Physical damage/liability coverage on Ford dealer daily rental vehicles. |
We also offer various Ford branded insurance products throughout the world underwritten by non-affiliated insurance companies from which we receive fee income but the underwriting risk remains with the non-affiliated insurance companies. In addition, TARIC provides to Ford and its subsidiaries various types of surety bonds, including bonds generally required as part of any appeals of litigation, financial guarantee bonds and self-insurance workers’ compensation bonds. Our insurance business generated approximately 1% of our total revenues in 2005 and 2004.
Employee Relations
At December 31, 2005, we had approximately 14,000 full-time employees. Most of our employees are salaried, and most are not represented by a union. We consider employee relations to be satisfactory.
Governmental Regulations
As a finance company, we are highly regulated by the governmental authorities in the locations where we operate.
United States
Within the United States, our operations are subject to regulation, supervision and licensing under various federal, state and local laws and regulations.
Federal Regulation. We are subject to extensive federal regulation, including the Truth-in-Lending Act, the Equal Credit Opportunity Act and the Fair Credit Reporting Act. These laws require us to provide certain disclosures to prospective purchasers and lessees in consumer retail and lease financing transactions and prohibit discriminatory credit practices. The principal disclosures required under the Truth-in-Lending Act for retail finance transactions include the terms of repayment, the amount financed, the total finance charge and the annual percentage rate. For retail lease transactions, we are required to disclose the amount due at lease inception, the terms for payment, and information about lease charges, insurance, excess mileage, wear and use charges and liability on early termination. The Equal Credit Opportunity Act prohibits creditors from discriminating against credit applicants and customers on a variety of factors, including race, color, sex, age or marital status. Pursuant to the Equal Credit Opportunity Act, creditors are required to make certain
8
| |
| ITEM 1. | BUSINESS (Continued) |
disclosures regarding consumer rights and advise consumers whose credit applications are not approved of the reasons for being denied. In addition, any of the credit scoring systems we use during the application process or other processes must comply with the requirements for such systems under the Equal Credit Opportunity Act. The Fair Credit Reporting Act requires us to provide certain information to consumers whose credit applications are not approved on the basis of a consumer credit report obtained from a national credit bureau and sets forth requirements related to identity theft, privacy and enhanced accuracy in credit reporting content. We are also subject to the Servicemember’s Civil Relief Act that prohibits us from charging interest in excess of 6% on transactions with customers who subsequently enter into full-time service with the military and limits our ability to collect future payments from lease customers who terminate their lease early. In addition, we are subject to other federal regulation, including the Gramm-Leach-Bliley Act, that requires us to maintain confidentiality and safeguard certain consumer data in our possession and to communicate periodically with consumers on privacy matters.
State Regulation — Licensing. In most states, a consumer credit regulatory agency regulates and enforces laws relating to finance companies. Rules and regulations generally provide for licensing of finance companies, limitations on the amount, duration and charges, including interest rates, that can be included in finance contracts, requirements as to the form and content of finance contracts and other documentation, and restrictions on collection practices and creditors’ rights. We must renew these licenses periodically. Moreover, several states have laws that limit interest rates on consumer financing. In periods of high interest rates, these rate limitations could have an adverse effect on our operations if we were unable to purchase retail installment sale contracts with finance charges that reflect our increased costs. In certain states, we are subject to periodic examination by state regulatory authorities.
State Regulation — Repossessions. To mitigate our credit losses, sometimes we repossess a financed or leased vehicle. Repossessions are subject to prescribed legal procedures, including peaceful repossession, one or more customer notifications, a prescribed waiting period prior to disposition of the repossessed vehicle and return of personal items to the customer. Some states provide the customer with reinstatement rights that require us to return a repossessed vehicle to the customer in certain circumstances. Our ability to repossess and sell a repossessed vehicle is restricted if a customer declares bankruptcy.
International
In some countries outside the United States, some of our subsidiaries, including FCE, are regulated banking institutions and are required, among other things, to maintain minimum capital reserves. FCE is authorized as a deposit taking business and insurance intermediary under the Financial Services and Markets Act of 2000 and is regulated by the U.K. Financial Services Authority (“FSA”). FCE also holds a standard license under the U.K. Consumer Credit Act of 1974. Since 1993, FCE has obtained authorizations from the Bank of England (which role is now undertaken by the FSA) pursuant to the Second Banking Consolidation Directive entitling it to operate branches in 15 other European countries. In many other locations where we operate, governmental authorities require us to obtain licenses to conduct our business.
Regulatory Compliance Status
We believe that we maintain all material licenses and permits required for our current operations and are in substantial compliance with all laws and regulations applicable to us and our operations. Failure to satisfy those legal and regulatory requirements could have a material adverse effect on our operations, financial condition and liquidity. Further, the adoption of new laws or regulations, or the revision of existing laws and regulations, could have a material adverse effect on our operations, financial condition and liquidity.
9
| |
| ITEM 1. | BUSINESS (Continued) |
We actively monitor proposed changes to relevant legal and regulatory requirements in order to maintain our compliance. Through our governmental relations efforts, we also attempt to participate in the legislative and administrative rule-making process on regulatory initiatives that impact finance companies. Our ongoing compliance efforts have not had a material adverse effect on our operations, financial condition or liquidity.
Transactions with Ford and Affiliates
We have a profit maintenance agreement with Ford that requires Ford to maintain our consolidated income before income taxes and net income at specified minimum levels. In addition, we have an agreement to maintain a minimum control interest in FCE and to maintain FCE’s net worth above a minimum level. No payments were made under either of these agreements during the 2003 through 2005 periods.
We formally documented our long-standing business practices with Ford in an agreement dated October 18, 2001, a copy of which was filed with the SEC on that date and is incorporated by reference herein as an exhibit. The principal terms of this agreement include the following:
| | |
| | • | Any extension of credit from us to Ford or any of Ford’s automotive affiliates will be on arm’s length terms and will be enforced by us in a commercially reasonable manner; |
| |
| | • | We will not be required to guarantee the indebtedness of, make any investments in, or purchase any real property or manufacturing equipment classified as an automotive asset from Ford or any of Ford’s automotive affiliates; |
| |
| | • | We and Ford agree to maintain our stockholder’s equity at a commercially reasonable level to support the amount, quality and mix of our assets taking into account general business conditions affecting us; |
| |
| | • | We will not be required by Ford or any of Ford’s automotive affiliates to accept credit or residual risk beyond what we would be willing to accept acting in a prudent and commercially reasonable manner (taking into consideration any interest rate supplements or residual value support payments, guarantees, or other subsidies that are provided to us by Ford or any of Ford’s automotive affiliates); and |
| |
| | • | We and Ford are separate, legally distinct companies, and we will continue to maintain separate books and accounts. We will prevent our assets from being commingled with Ford’s assets, and hold ourselves out as a separate and distinct company from Ford and Ford’s automotive affiliates. |
More information about transactions between us and Ford and other affiliates is contained in Note 15 of our Notes to the Financial Statements, “Business — Overview”, “Business — Retail Financing”, “Business — Other Financing” and the description of Ford’s business in Exhibit 99.
ITEM 1A. RISK FACTORS
The following are the most significant risk factors applicable to us:
Inability to Access Debt or Securitization Markets Around the World at Competitive Rates or in Sufficient Amounts Due to Additional Credit Rating Downgrades or Otherwise — Recent lowering of our credit ratings has increased our borrowing costs and has caused our access to the unsecured debt markets to become more restricted. In response, we have increased our use of securitization and other sources of liquidity. Over time, and particularly in the event of any further credit rating downgrades or a significant decline in the demand for the types of securities we offer, we may need to reduce the amount of receivables we purchase. A significant reduction in the amount of our
10
ITEM 1A. RISK FACTORS (Continued)
purchased receivables would significantly reduce our ongoing profits and could adversely affect our ability to support the sale of Ford vehicles.
Higher-Than-Expected Credit Losses — Credit risk is the possibility of loss from a customer’s or dealer’s failure to make payments according to contract terms. Credit risk (which is heavily dependent upon economic factors, including unemployment, consumer debt service burden, personal income growth, dealer profitability and used car prices) has a significant impact on our business. The level of credit losses we may experience could exceed our expectations.
Increased Competition from Banks or Other Financial Institutions Seeking to Increase Their Share of Financing Ford Vehicles — No single company is a dominant force in the automotive finance industry. Some of our bank competitors in the United States have developed credit aggregation systems that permit dealers to send, through a single standard system, retail credit applications to multiple finance sources to evaluate financing options offered by these finance sources. This process has resulted in greater competition based on financing rates. In addition, we are facing increased competition from banks on wholesale financing for Ford dealers. Competition from such competitors may increase, which could adversely affect our profitability and the volume of our business.
Changes in Interest Rates — We are exposed to interest rate risk, and the particular market to which we are most exposed is U.S. dollar LIBOR. Our interest rate risk exposure results principally from “re-pricing risk,” or differences in the re-pricing characteristics of assets and liabilities. Any inability to adequately control this exposure could adversely affect our business.
Collection and Servicing Problems Related to Our Finance Receivables and Net Investment in Operating Leases — After we purchase retail installment sale contracts and leases from dealers and other customers, we manage or service the receivables. Any disruption of our servicing activity, due to inability to access or accurately maintain our customer account records or otherwise, could have a significant negative impact on our ability to collect on those receivables and/or satisfy our customers.
Lower-Than-Anticipated Residual Values or Higher-Than-Expected Return Volumes for Leased Vehicles — We project expected residual values (including residual value support payments from Ford) of the vehicles we lease. Actual proceeds realized by us upon the sale of returned leased vehicles at lease termination may be lower than the amount projected, which reduces the profitability of the lease transaction to us. Among the factors that can affect the value of returned lease vehicles are the volume of vehicles returned, economic conditions and the quality or perceived quality, safety or reliability of the vehicles. All of these, alone or in combination, have the potential to adversely affect our profitability.
New or Increased Credit, Consumer or Data Protection, or Other Regulations Resulting in Higher Costs and/or Additional Financing Restrictions — As a finance company, we are highly regulated by governmental authorities in the locations where we operate. In the United States, our operations are subject to regulation, supervision and licensing under various federal, state and local laws and regulations, including the federal Truth-in-Lending Act, Equal Credit Opportunity Act and Fair Credit Reporting Act. In some countries outside the United States, our subsidiaries are regulated banking institutions and are required, among other things, to maintain minimum capital reserves. In many other locations, governmental authorities require companies to have licenses in order to conduct financing businesses. Efforts to comply with these laws and regulations impose significant costs on us, and affect the conduct of our business. Additional regulation could add significant cost or operational constraints that might impair the profitability of our business.
Changes in Ford’s Marketing Programs That De-Emphasize Financing Incentives, Which Could Result in a Decline in Our Share of Financing of Ford Vehicles — The predominant share of our business consists of financing Ford vehicles and supporting Ford dealers. For many years, Ford has sponsored special rate financing programs available only through us. Under these programs, Ford
11
ITEM 1A. RISK FACTORS (Continued)
makes interest supplements or other support payments to us. These programs increase our financing volume and share of financing sales of Ford vehicles. If Ford were to adopt marketing strategies in the future that de-emphasized such programs in favor of other incentives, such as a recent program in the United States that lowered vehicle purchase prices to those available to Ford employees, our financing volume could be reduced.
| |
| ITEM 1B. | UNRESOLVED STAFF COMMENTS |
We have no unresolved SEC staff comments to report.
We own our world headquarters in Dearborn, Michigan. We lease our corporate offices in Brentwood, England from an affiliate of Ford. Most of our automotive finance branches and service centers are located in leased properties. The continued use of any of these leased properties is not material to our operations. At December 31, 2005, our total future rental commitment under leases of real property was $162 million.
We operate in the United States through about 81 dealer automotive financing branches and seven regional service centers. We do business in all provinces in Canada through seven dealer automotive financing branches and two regional service centers.
Our North American regional service centers are located in:
| | | | | |
| United States: | | Colorado Springs, Colorado
Tampa, Florida
Baltimore, Maryland
Henderson, Nevada | | Greenville, South Carolina
Nashville, Tennessee
Irving, Texas |
| Canada: | | Edmonton, Alberta | | Ottawa, Ontario |
Each of these service centers generally services customers located in their region, but all of our North American service centers are electronically linked and workload can be allocated across service centers.
We also have four specialty service centers in North America that focus on specific servicing activities:
| | |
| | • | Customer Service Center — Omaha, Nebraska; |
| |
| | • | Volvo Customer Service Center — Richardson, Texas; |
| |
| | • | National Bankruptcy Service Center — Livonia, Michigan; and |
| |
| | • | National Recovery Center — Mesa, Arizona. |
In Europe, we have dealer and customer servicing activities in St. Albans, England to support our U.K. operations and customers, and in Cologne, Germany to support our German operations and customers. In smaller countries, we provide servicing through our local branches.
| |
| ITEM 3. | LEGAL PROCEEDINGS |
We are subject to legal actions, governmental investigations and other proceedings and claims relating to state and federal laws concerning finance and insurance, employment-related matters, personal injury matters, investor matters, financial reporting matters and other contractual relationships. Some of these matters are class actions or are seeking class action status. Some of these matters may involve claims for compensatory, punitive or treble damages and attorneys’ fees
12
ITEM 3. LEGAL PROCEEDINGS (Continued)
in very large amounts, or request other relief which, if granted, would require very large expenditures. Our significant pending matters are summarized below:
Fair Lending Class Actions. The plaintiffs inJones v. Ford Motor Credit Company, a class action pending in federal court in New York, allege that our pricing practices discriminate against African-Americans. In the fourth quarter of 2005, we and the plaintiffs submitted a proposed settlement agreement to the court. The court has preliminarily approved the settlement. Final approval is subject to a fairness hearing scheduled for May 31, 2006. The plaintiffs inBorlay v. PRIMUS(formerly referred to asClaybrook v. PRIMUS) have made similar allegations concerning PRIMUS accounts. The trial inBorlay has been completed, but the court has not issued a ruling. A hearing is scheduled for March 9, 2006.
Litigation is subject to many uncertainties and the outcome is not predictable. It is reasonably possible that these matters could be decided unfavorably to us. Although the amount of liability at December 31, 2005 with respect to these litigation matters cannot be ascertained, we believe that any resulting liability should not materially affect our operations, financial condition and liquidity.
In addition, any litigation, investigation, proceeding or claim against Ford that results in Ford incurring significant liability, expenditures or costs could also have a material adverse affect on our operations, financial condition and liquidity. For a discussion of pending significant cases against Ford, see Item 3 in Ford’s 2005 10-K Report.
PART II
| |
| ITEM 5. | MARKET FOR REGISTRANT’S COMMON EQUITY, RELATED STOCKHOLDER MATTERS AND ISSUER PURCHASES OF EQUITY SECURITIES |
At December 31, 2005, all shares of our common stock were owned by Ford Holdings, LLC, a wholly owned subsidiary of Ford. We did not issue or sell any equity securities during 2005, and there is no market for our stock. We paid cash dividends of $2.75 billion and $4.3 billion in 2005 and 2004, respectively. For a discussion of our dividend policy, see the “Leverage” section in Item 7.
13
| |
| ITEM 6. | SELECTED FINANCIAL DATA |
FORD MOTOR CREDIT COMPANY AND SUBSIDIARIES
FIVE-YEAR SUMMARY OF SELECTED FINANCIAL DATA
| | | | | | | | | | | | | | | | | | | | | | |
| | 2005 | | | 2004 | | | 2003 | | | 2002 | | | 2001 | |
| |
| | |
| | |
| | |
| | |
| |
Selected Income Statement | | (in millions) |
| Total revenue | | $ | 16,644 | | | $ | 17,882 | | | $ | 20,090 | | | $ | 22,438 | | | $ | 24,428 | |
| Depreciation on vehicles subject to operating leases | | | 4,430 | | | | 4,909 | | | | 7,009 | | | | 8,435 | | | | 8,397 | |
| Interest expense | | | 5,842 | | | | 5,333 | | | | 5,831 | | | | 6,929 | | | | 8,922 | |
| Total financing margin and revenue | | | 6,372 | | | | 7,640 | | | | 7,250 | | | | 7,074 | | | | 7,109 | |
| Provision for credit losses | | | 166 | | | | 900 | | | | 1,888 | | | | 2,749 | | | | 3,199 | |
| Income from continuing operations before income taxes | | | 3,861 | | | | 4,431 | | | | 2,956 | | | | 1,979 | | | | 1,493 | |
| Income from continuing operations | | | 2,451 | | | | 2,781 | | | | 1,820 | | | | 1,241 | | | | 829 | |
| Net income | | | 2,492 | | | | 2,862 | | | | 1,817 | | | | 1,234 | | | | 839 | |
| Memo: Cash dividends paid | | $ | 2,750 | | | $ | 4,300 | | | $ | 3,700 | | | $ | 1,150 | | | $ | 400 | |
Selected Balance Sheet | | (in billions) |
| Finance receivables, net | | $ | 109.9 | | | $ | 110.8 | | | $ | 105.3 | | | $ | 90.0 | | | $ | 103.2 | |
| Net investment in operating leases | | | 22.2 | | | | 21.9 | | | | 23.2 | | | | 31.3 | | | | 37.2 | |
| | |
| | |
| | |
| | |
| | |
| |
| | Total net finance receivables and operating leases | | $ | 132.1 | | | $ | 132.7 | | | $ | 128.5 | | | $ | 121.3 | | | $ | 140.4 | |
| | |
| | |
| | |
| | |
| | |
| |
| Allowance for credit losses | | $ | 1.6 | | | $ | 2.4 | | | $ | 2.9 | | | $ | 3.0 | | | $ | 2.6 | |
| Total assets | | | 162.2 | | | | 172.6 | | | | 179.1 | | | | 170.4 | | | | 173.1 | |
| Total managed receivables (a) | | | 150.1 | | | | 168.3 | | | | 175.4 | | | | 191.4 | | | | 199.1 | |
| Short-term debt | | $ | 31.8 | | | $ | 31.8 | | | $ | 24.7 | | | $ | 16.2 | | | $ | 22.6 | |
| Long-term debt | | | 102.7 | | | | 112.5 | | | | 125.0 | | | | 124.1 | | | | 123.2 | |
| | |
| | |
| | |
| | |
| | |
| |
| | Total debt | | $ | 134.5 | | | $ | 144.3 | | | $ | 149.7 | | | $ | 140.3 | | | $ | 145.8 | |
| | |
| | |
| | |
| | |
| | |
| |
| Stockholder’s equity | | $ | 10.7 | | | $ | 11.5 | | | $ | 12.5 | | | $ | 13.6 | | | $ | 12.0 | |
| |
| (a) | Managed receivables include receivables sold in off-balance sheet securitizations and exclude receivables sold in whole-loan sale transactions. For a discussion of how we review our business performance, including on a managed basis, see the “Overview” section in Item 7. |
14
| |
| ITEM 7. | MANAGEMENT’S DISCUSSION AND ANALYSIS OF FINANCIAL CONDITION AND RESULTS OF OPERATIONS |
Overview
Generation of Revenue, Income and Cash
Our primary focus is to profitably support the sale of Ford vehicles. The principal factors that influence our earnings are the amount and mix of finance receivables and net investment in operating leases and financing margins. The performance of these receivables and leases over time, mainly through the impact of credit losses and variations in the residual value of leased vehicles, also affects our earnings.
The amount of our finance receivables and net investment in operating leases depends on many factors, including:
| | |
| | • | the volume of new and used vehicle sales and leases, |
| |
| | • | the extent to which we purchase retail installment sale and lease contracts and the extent to which we provide wholesale financing, |
| |
| | • | the sales price of the vehicles financed, |
| |
| | • | the level of dealer inventories, |
| |
| | • | Ford-sponsored special financing programs available exclusively through us, and |
| |
| | • | the availability of cost-effective funding for the purchase of retail installment sale and lease contracts and to provide wholesale financing. |
For finance receivables, financing margin equals the difference between revenue earned on finance receivables and the cost of borrowed funds. For operating leases, financing margin equals revenue earned on operating leases, less depreciation expense and the cost of borrowed funds. Interest rates earned on most receivables and rental charges on operating leases generally are fixed at the time the contracts are originated. On some receivables, primarily wholesale financing, we charge interest at a floating rate that varies with changes in short-term interest rates.
Business Performance
We review our business performance from several perspectives, including:
| | |
| | • | On-balance sheet basis — includes the receivables we own and receivables sold for legal purposes that remain on our balance sheet, |
| |
| | • | Securitized off-balance sheet basis — includes receivables sold in securitization transactions that are not reflected on our balance sheet, |
| |
| | • | Managed basis — includes on-balance sheet and securitized off-balance sheet receivables that we continue to service, and |
| |
| | • | Serviced basis — includes managed receivables and receivables sold in whole-loan sale transactions where we retain no interest in the sold receivables, but which we continue to service. |
We analyze our financial performance primarily on an on-balance sheet and managed basis. We retain interests in receivables sold in off-balance sheet securitizations and, with respect to subordinated retained interests, we have credit risk. As a result, we evaluate credit losses, receivables and leverage on a managed basis as well as on an on-balance sheet basis. In contrast, we do not have the same financial interest in the performance of receivables sold in whole-loan sale transactions, and as a result, we generally review the performance of our serviced portfolio only to evaluate the effectiveness of our origination and collection activities. To evaluate the performance of
15
| |
| ITEM 7. | MANAGEMENT’S DISCUSSION AND ANALYSIS OF FINANCIAL CONDITION AND RESULTS OF OPERATIONS (Continued) |
these activities, we monitor a number of measures, such as repossession statistics, losses on repossessions and the number of bankruptcy filings.
We measure the performance of our North America segment and our International segment primarily on an income before income taxes basis, after excluding the impact to earnings from hedge ineffectiveness, and other related fair value accounting adjustments, because our risk management activities are carried out on a centralized basis at the corporate level, with only certain elements allocated to our two segments. For further discussion regarding our segments, see Note 16 of our Notes to the Financial Statements.
Trends and Strategies
Origination: Buy it Right, Price it Right — Our primary focus is to profitably support the sale of Ford vehicles. We will continue to work closely with our brand partners in 2006 to create value for our dealers and customers by seeking opportunities to go into the marketplace together, maximizing our unique position as Ford’s financing company. In 2006, the work to integrate our sales platform of full service branches that support our Ford, Lincoln, Mercury, Jaguar, Land Rover, Mazda, Volvo and Aston Martin brands will be completed. Risk management is also key to our continued value and profitability. We have extensive risk experience and large sample sizes, enabling us to develop proprietary scoring models which outperform generic scoring models. Our focus is on providing new tools and actionable information to dealers and leveraging and strengthening global risk skills internally. Through these efforts, we will continue to optimize profitability as well as generate incremental vehicle sales for Ford.
Servicing: Operate Efficiently, Collect Effectively, Enhance Owner Loyalty — We have been successfully transforming our global business since 2000 and that process will continue in 2006. Our service centers are driving efficiency globally by increasing the commonality of our business processes and information technology platforms. In North America, for example, we enhanced our collection modeling capabilities to allow for more focused collection activity on high-risk accounts and refined a risk-based staffing model to ensure collection resources are aligned with portfolio risk. On a global basis, we are focused on driving cost reductions in proportion to the overall size of our business while improving customer service and owner loyalty.
Funding: Fund it Efficiently, Manage Risk — Our funding strategy is to maintain liquidity and access to diverse funding sources that are cost effective. In recent years, lower credit ratings generally have resulted in higher borrowing costs and reduced access to capital markets. Our credit ratings are closely associated with the credit ratings of Ford, which have been lowered in the last several years. These lower credit ratings are primarily a reflection of concerns regarding Ford’s automotive cash flow and profitability, declining market share, excess industry capacity, industry pricing pressure and rising health care costs. As our credit ratings have declined, asset-backed funding programs have become more cost effective compared with unsecured funding programs, and allow us access to a broader investor base. We plan to meet the significant portion of our funding requirements through securitizations in 2006.
Results of Operations
As discussed in Note 1 of our Notes to the Financial Statements, certain prior year amounts were reclassified to conform to current year presentation.
16
| |
| ITEM 7. | MANAGEMENT’S DISCUSSION AND ANALYSIS OF FINANCIAL CONDITION AND RESULTS OF OPERATIONS (Continued) |
Full Year 2005 Compared with Full Year 2004
In 2005, net income was down $370 million compared with a year ago. Our income from continuing operations before income taxes was down $570 million. The decrease in earnings primarily reflected higher borrowing costs and the impact of lower retail receivable levels, offset partially by improved credit loss performance. Results of our operations by business segment for 2005 and 2004 are shown below:
| | | | | | | | | | | | | | | |
| | |
| | Full Year | |
| |
| |
| | | | 2005 | |
| | | | Over/(Under) | |
| | 2005 | | | 2004 | | | 2004 | |
| |
| | |
| | |
| |
| | |
| | (in millions) | |
| Income from continuing operations before income taxes | | | | | | | | | | | | |
| | North America segment | | $ | 2,984 | | | $ | 3,371 | | | $ | (387 | ) |
| | International segment | | | 951 | | | | 778 | | | | 173 | |
| | Unallocated risk management | | | (74 | ) | | | 282 | | | | (356 | ) |
| | |
| | |
| | |
| |
| | | Income from continuing operations before income taxes | | | 3,861 | | | | 4,431 | | | | (570 | ) |
| Provision for income taxes and minority interests | | | (1,410 | ) | | | (1,650 | ) | | | 240 | |
| Income/(Loss) from discontinued operations | | | 41 | | | | 81 | | | | (40 | ) |
| | |
| | |
| | |
| |
| | | Total net income | | $ | 2,492 | | | $ | 2,862 | | | $ | (370 | ) |
| | |
| | |
| | |
| |
The decrease in North America segment earnings primarily reflected the same causal factors described above.
The increase in International segment income primarily reflected a gain on sale of compensation bonds in Argentina, improved credit loss performance and the non-recurrence of impairment of certain unconsolidated investments in our Asia-Pacific region, offset partially by the impact of higher borrowing costs. The compensation bonds were issued by the Argentine government in late 2001 and were intended to compensate entities for government-mandated devaluation of the peso undertaken to provide debt relief to consumers.
The decrease in unallocated risk management income reflected unfavorable market valuation of derivative instruments and associated exposures.
Full Year 2004 Compared with Full Year 2003
In 2004, earnings were up $1,045 million compared with 2003. Income from continuing operations before income taxes was up $1,475 million compared with 2003. The increase in earnings primarily reflected improved credit loss performance and improved leasing results. Results of our operations by business segment for 2004 and 2003 are shown below:
| | | | | | | | | | | | | | | |
| | |
| | Full Year | |
| |
| |
| | | | 2004 | |
| | | | Over/(Under) | |
| | 2004 | | | 2003 | | | 2003 | |
| |
| | |
| | |
| |
| | |
| | (in millions) | |
| Income from continuing operations before income taxes | | | | | | | | | | | | |
| | North America segment | | $ | 3,371 | | | $ | 1,997 | | | $ | 1,374 | |
| | International segment | | | 778 | | | | 660 | | | | 118 | |
| | Unallocated risk management | | | 282 | | | | 299 | | | | (17 | ) |
| | |
| | |
| | |
| |
| | | Income from continuing operations before income taxes | | | 4,431 | | | | 2,956 | | | | 1,475 | |
| Provision for income taxes and minority interests | | | (1,650 | ) | | | (1,136 | ) | | | (514 | ) |
| Income/(Loss) from discontinued operations | | | 81 | | | | (3 | ) | | | 84 | |
| | |
| | |
| | |
| |
| | | Total net income | | $ | 2,862 | | | $ | 1,817 | | | $ | 1,045 | |
| | |
| | |
| | |
| |
17
| |
| ITEM 7. | MANAGEMENT’S DISCUSSION AND ANALYSIS OF FINANCIAL CONDITION AND RESULTS OF OPERATIONS (Continued) |
North America segment income in 2004 was up $1,374 million compared with 2003. This increase primarily reflected improved credit loss performance and improved leasing results, offset partially by lower income related to sales of receivables. The improved credit loss performance primarily resulted from fewer repossessions and a lower average loss per repossession. The improvement in leasing results primarily reflected higher used vehicle prices and a reduction in the percentage of vehicles returned to us at lease termination. The lower income related to sales of receivables primarily reflected lower sales of receivables and the impact of lower outstanding off-balance sheet receivables.
International segment income in 2004 was up $118 million compared with 2003. This increase is more than explained by favorable exchange (weaker dollar) in Europe and Asia-Pacific, improved operating costs in Europe, and the sale of the full-service leasing portfolios in the United Kingdom, Italy, Switzerland and Spain.
The decrease in unallocated risk management income reflected the less favorable market valuation of derivative instruments and associated exposures.
Placement Volume and Financing Share
Total worldwide financing contract placement volumes for new and used vehicles are shown below:
| | | | | | | | | | | | | | | | |
| | |
| | Full Year | |
| |
| |
| | 2005 | | | 2004 | | | 2003 | |
| |
| | |
| | |
| |
| | |
| | (in thousands) | |
North America segment | | | | | | | | | | | | |
| | United States | | | 1,498 | | | | 1,842 | | | | 1,883 | |
| | Canada | | | 169 | | | | 172 | | | | 197 | |
| | |
| | |
| | |
| |
| | | Total North America segment | | | 1,667 | | | | 2,014 | | | | 2,080 | |
International segment | | | | | | | | | | | | |
| | Europe | | | 734 | | | | 782 | | | | 836 | |
| | Other international | | | 276 | | | | 271 | | | | 279 | |
| | |
| | |
| | |
| |
| | | Total International segment | | | 1,010 | | | | 1,053 | | | | 1,115 | |
| | |
| | |
| | |
| |
| | | | Total contract placement volume | | | 2,677 | | | | 3,067 | | | | 3,195 | |
| | |
| | |
| | |
| |
Shown below are our financing shares of new Ford, Lincoln and Mercury brand vehicles sold by dealers in the United States and Ford brand vehicles sold by dealers in Europe. Also shown below are our wholesale financing shares of new Ford, Lincoln and Mercury brand vehicles acquired by dealers in the United States, excluding fleet, and of new Ford brand vehicles acquired by dealers in Europe:
| | | | | | | | | | | | | | | |
| | |
| | Full Year | |
| |
| |
| | 2005 | | | 2004 | | | 2003 | |
| |
| | |
| | |
| |
United States | | | | | | | | | | | | |
| | Financing share — Ford, Lincoln and Mercury | | | | | | | | | | | | |
| | | Retail installment and lease | | | 37 | % | | | 45 | % | | | 39 | % |
| | | Wholesale | | | 81 | | | | 84 | | | | 85 | |
Europe | | | | | | | | | | | | |
| | Financing share — Ford | | | | | | | | | | | | |
| | | Retail installment and lease | | | 28 | % | | | 29 | % | | | 31 | % |
| | | Wholesale | | | 96 | | | | 97 | | | | 97 | |
18
| |
| ITEM 7. | MANAGEMENT’S DISCUSSION AND ANALYSIS OF FINANCIAL CONDITION AND RESULTS OF OPERATIONS (Continued) |
North America Segment. In 2005, our total contract placement volumes were 1.7 million, down 347,000 contracts from a year ago. This decline, as well as the decline in retail financing share, primarily reflected the impact of Ford’s marketing program that offered employee pricing to all customers (the “Family Plan”) during the third quarter. During this period, the Family Plan replaced Ford’s traditional automotive marketing programs that emphasized the use of our financing.
Financial Condition
Finance Receivables and Operating Leases
Our operating results are impacted significantly by the level of our receivables, which are shown below:
| | | | | | | | | | | | | | | | |
| | |
| | December 31, | |
| |
| |
| | 2005 | | | 2004 | | | 2003 | |
| |
| | |
| | |
| |
| | |
| | (in billions) | |
Receivables | | | | | | | | | | | | |
| | On-Balance Sheet
(including on-balance sheet securitizations) | | | | | | | | | | | | |
| | Finance receivables | | | | | | | | | | | | |
| | | Retail installment | | $ | 65.7 | | | $ | 81.7 | | | $ | 77.0 | |
| | | Wholesale | | | 39.6 | | | | 23.8 | | | | 22.4 | |
| | | Other | | | 4.6 | | | | 5.3 | | | | 5.9 | |
| | |
| | |
| | |
| |
| | | | Total finance receivables, net | | | 109.9 | | | | 110.8 | | | | 105.3 | |
| | Net investment in operating leases | | | 22.2 | | | | 21.9 | | | | 23.2 | |
| | |
| | |
| | |
| |
| | | | Total on-balance sheet(a) | | $ | 132.1 | | | $ | 132.7 | | | $ | 128.5 | |
| | |
| | |
| | |
| |
| | Memo: Allowance for credit losses included above | | $ | 1.6 | | | $ | 2.4 | | | $ | 2.9 | |
| | Securitized Off-Balance Sheet | | | | | | | | | | | | |
| | Finance receivables | | | | | | | | | | | | |
| | | Retail installment | | $ | 18.0 | | | $ | 16.7 | | | $ | 26.6 | |
| | | Wholesale | | | — | | | | 18.9 | | | | 20.3 | |
| | | Other | | | — | | | | — | | | | — | |
| | |
| | |
| | |
| |
| | | | Total finance receivables, net | | | 18.0 | | | | 35.6 | | | | 46.9 | |
| | Net investment in operating leases | | | — | | | | — | | | | — | |
| | |
| | |
| | |
| |
| | | | Total securitized off-balance sheet | | $ | 18.0 | | | $ | 35.6 | | | $ | 46.9 | |
| | |
| | |
| | |
| |
| | Managed | | | | | | | | | | | | |
| | Finance receivables | | | | | | | | | | | | |
| | | Retail installment | | $ | 83.7 | | | $ | 98.4 | | | $ | 103.6 | |
| | | Wholesale | | | 39.6 | | | | 42.7 | | | | 42.7 | |
| | | Other | | | 4.6 | | | | 5.3 | | | | 5.9 | |
| | |
| | |
| | |
| |
| | | | Total finance receivables, net | | | 127.9 | | | | 146.4 | | | | 152.2 | |
| | Net investment in operating leases | | | 22.2 | | | | 21.9 | | | | 23.2 | |
| | |
| | |
| | |
| |
| | | | Total managed | | $ | 150.1 | | | $ | 168.3 | | | $ | 175.4 | |
| | |
| | |
| | |
| |
| | Serviced | | $ | 153.0 | | | $ | 172.3 | | | $ | 182.7 | |
| | |
| | (a) | At December 31, 2005 and December 31, 2004, finance receivables of $44.7 billion and $16.9 billion, respectively, have been sold for legal purposes to consolidated securitization special purpose entities (“SPEs”). In addition, at December 31, 2005 and December 31, 2004, interests in operating leases and the related vehicles of $6.5 billion and $2.5 billion, respectively, have been transferred for legal purposes to consolidated securitization SPEs. These receivables and interests in operating leases and the related vehicles are available only for repayment of debt issued by those entities, and to pay other securitization investors and other participants; they are not available to pay our other obligations or the claims of our other creditors. |
19
| |
| ITEM 7. | MANAGEMENT’S DISCUSSION AND ANALYSIS OF FINANCIAL CONDITION AND RESULTS OF OPERATIONS (Continued) |
On-Balance Sheet Receivables. On-balance sheet receivables decreased from year-end 2004 primarily reflecting lower retail contract placement volumes. The decrease was largely offset by the accounting consolidation of our wholesale securitization program as a result of certain changes made to the program in the fourth quarter of 2005, which caused the receivables previously sold by us in this program to be reported on-balance sheet.
Securitized Off-Balance Sheet Receivables. The decline in our securitized off-balance sheet receivables primarily reflected the accounting consolidation discussed above.
Managed and serviced receivables decreased from year-end 2004 primarily reflecting lower retail contract placement volumes.
Credit Risk
Credit risk is the possibility of loss from a customer’s or dealer’s failure to make payments according to contract terms. Credit risk has a significant impact on our business. We actively manage the credit risk of our consumer and non-consumer portfolios to balance our level of risk and return. The allowance for credit losses reflected on our balance sheet is our estimate of the credit losses for receivables and leases that are impaired as of the date of our balance sheet.
20
| |
| ITEM 7. | MANAGEMENT’S DISCUSSION AND ANALYSIS OF FINANCIAL CONDITION AND RESULTS OF OPERATIONS (Continued) |
Credit Loss Metrics
Worldwide
The following table shows worldwide credit losses net of recoveries (“charge-offs”) for the various categories of financing during the periods indicated. The loss-to-receivables ratios, which equal charge-offs divided by the average amount of receivables outstanding for the period, are shown below for our on-balance sheet and managed portfolios.
| | | | | | | | | | | | | | | | |
| | |
| | Full Year | |
| |
| |
| | 2005 | | | 2004 | | | 2003 | |
| |
| | |
| | |
| |
| | |
| | (in millions) | |
Charge-offs | | | | | | | | | | | | |
| | On-Balance Sheet | | | | | | | | | | | | |
| | | Retail installment and lease | | $ | 681 | | | $ | 1,281 | | | $ | 1,737 | |
| | | Wholesale | | | 23 | | | | 43 | | | | 148 | |
| | | Other | | | 2 | | | | 3 | | | | 6 | |
| | |
| | |
| | |
| |
| | | | Total on-balance sheet | | $ | 706 | | | $ | 1,327 | | | $ | 1,891 | |
| | |
| | |
| | |
| |
| | Reacquired Receivables (retail) (a) | | $ | 22 | | | $ | 74 | | | $ | 92 | |
| | Securitized Off-Balance Sheet | | | | | | | | | | | | |
| | | Retail installment and lease | | $ | 127 | | | $ | 244 | | | $ | 551 | |
| | | Wholesale | | | — | | | | — | | | | — | |
| | | Other | | | — | | | | — | | | | — | |
| | |
| | |
| | |
| |
| | | | Total securitized off-balance sheet | | $ | 127 | | | $ | 244 | | | $ | 551 | |
| | |
| | |
| | |
| |
| | Managed | | | | | | | | | | | | |
| | | Retail installment and lease | | $ | 830 | | | $ | 1,599 | | | $ | 2,380 | |
| | | Wholesale | | | 23 | | | | 43 | | | | 148 | |
| | | Other | | | 2 | | | | 3 | | | | 6 | |
| | |
| | |
| | |
| |
| | | | Total managed | | $ | 855 | | | $ | 1,645 | | | $ | 2,534 | |
| | |
| | |
| | |
| |
Loss-to-Receivables Ratios | | | | | | | | | | | | |
| | On-Balance Sheet | | | | | | | | | | | | |
| | | Retail installment and lease | | | 0.72 | % | | | 1.25 | % | | | 1.73 | % |
| | | Wholesale | | | 0.09 | | | | 0.20 | | | | 0.78 | |
| | | | Total including other | | | 0.57 | % | | | 1.02 | % | | | 1.51 | % |
| | Managed | | | | | | | | | | | | |
| | | Retail installment and lease | | | 0.73 | % | | | 1.29 | % | | | 1.74 | % |
| | | Wholesale | | | 0.06 | | | | 0.10 | | | | 0.37 | |
| | | | Total including other | | | 0.54 | % | | | 0.96 | % | | | 1.39 | % |
| | |
| | (a) | Reacquired receivables reflect the amount of receivables that resulted from the accounting consolidation of our FCAR Owner Trust retail securitization program (“FCAR”) in the second quarter of 2003. |
Most of our charge-offs are related to retail installment sale and lease contracts. Charge-offs depend on the number of vehicle repossessions, the unpaid balance outstanding at the time of repossession, the net resale price of repossessed vehicles and other losses associated with impaired accounts and unrecoverable vehicles. We also incur credit losses on our wholesale loans, but default rates for these receivables historically have been substantially lower than those for retail installment sale and lease contracts.
Charge-offs and loss-to-receivables ratios for our on-balance sheet, securitized off-balance sheet and managed portfolios declined from a year ago, primarily reflecting fewer repossessions and a lower average loss per repossession. These improvements resulted from a higher quality retail
21
| |
| ITEM 7. | MANAGEMENT’S DISCUSSION AND ANALYSIS OF FINANCIAL CONDITION AND RESULTS OF OPERATIONS (Continued) |
installment and lease portfolio, higher used vehicle prices and enhancements to our collection practices. Lower levels of retail installment receivables also contributed to reduced charge-offs.
Ford, Lincoln and Mercury Brand Retail Installment and Operating Lease
The following table shows the credit loss metrics for our Ford, Lincoln and Mercury brand U.S. retail installment sale and lease portfolio. This portfolio was approximately 61% of our worldwide-managed portfolio of retail installment receivables and net investment in operating leases at December 31, 2005. Trends and causal factors are consistent with the worldwide results described in the preceding section.
| | | | | | | | | | | | | | |
| | |
| | Full Year | |
| |
| |
| | 2005 | | | 2004 | | | 2003 | |
| |
| | |
| | |
| |
On-Balance Sheet | | | | | | | | | | | | |
| | Charge-offs (in millions) | | $ | 433 | | | $ | 803 | | | $ | 1,067 | |
| | Loss-to-receivables ratios | | | 0.79 | % | | | 1.32 | % | | | 1.82 | % |
Managed | | | | | | | | | | | | |
| | Charge-offs (in millions) | | $ | 551 | | | $ | 1,032 | | | $ | 1,583 | |
| | Loss-to-receivables ratios | | | 0.81 | % | | | 1.38 | % | | | 1.87 | % |
Other Metrics — Serviced | | | | | | | | | | | | |
| | Repossessions (in thousands) | | | 109 | | | | 165 | | | | 200 | |
| | Repossession ratios(a) | | | 2.30 | % | | | 3.02 | % | | | 3.27 | % |
| | Average loss per repossession | | $ | 6,100 | | | $ | 6,600 | | | $ | 7,350 | |
| | New bankruptcy filings (in thousands) | | | 84 | | | | 85 | | | | 107 | |
| | Over-60 day delinquency ratio(b) | | | 0.15 | % | | | 0.18 | % | | | 0.35 | % |
| | |
| | (a) | Repossessions as a percent of the average number of accounts outstanding during the periods. |
| |
| | (b) | Delinquencies are expressed as a percent of the end-of-period accounts outstanding for non-bankrupt accounts. |
Allowance for Credit Losses
Our allowance for credit losses and our allowance for credit losses as a percentage of end-of-period net receivables for our on-balance sheet portfolio are shown below. A description of our allowance setting process is provided below in “Critical Accounting Estimates — Allowance for Credit Losses.”
| | | | | | | | | | | | | | | |
| | |
| | December 31, | |
| |
| |
| | 2005 | | | 2004 | | | 2003 | |
| |
| | |
| | |
| |
| | |
| | (in billions) | |
Allowance for Credit Losses | | | | | | | | | | | | |
| | Retail installment and lease | | $ | 1.5 | | | $ | 2.3 | | | $ | 2.7 | |
| | Wholesale | | | 0.1 | | | | 0.1 | | | | 0.1 | |
| | Other | | | 0.0 | | | | 0.0 | | | | 0.1 | |
| | |
| | |
| | |
| |
| | | Total allowance for credit losses | | $ | 1.6 | | | $ | 2.4 | | | $ | 2.9 | |
| | |
| | |
| | |
| |
As a Percentage of End-of-Period Receivables | | | | | | | | | | | | |
| | Retail installment and lease | | | 1.63 | % | | | 2.14 | % | | | 2.62 | % |
| | Wholesale | | | 0.24 | | | | 0.55 | | | | 0.71 | |
| | Other | | | 0.77 | | | | 0.74 | | | | 0.96 | |
| | | Total | | | 1.19 | % | | | 1.80 | % | | | 2.21 | % |
22
| |
| ITEM 7. | MANAGEMENT’S DISCUSSION AND ANALYSIS OF FINANCIAL CONDITION AND RESULTS OF OPERATIONS (Continued) |
Our allowance for credit losses decreased $800 million from year-end 2004, primarily reflecting improved charge-off performance and the effect of lower retail receivable levels.
Residual Risk
We are exposed to residual risk on operating leases and similar balloon payment products where the customer may return the financed vehicle to us. Residual risk is the possibility that the amount we obtain from returned vehicles will be less than our estimate of the expected residual value for the vehicle. Residual risk on operating leases is discussed in more detail below in “Critical Accounting Estimates — Accumulated Depreciation on Vehicles Subject to Operating Leases.”
Retail Operating Lease Experience
We use various statistics to monitor our residual risk:
| | |
| | • | Placement volume measures the number of leases we purchase in a given period; |
| |
| | • | Termination volume measures the number of vehicles for which the lease has ended in the given period; and |
| |
| | • | Return volume reflects the number of vehicles returned to us by customers at lease end. |
The following table shows operating lease placement, termination and return volumes for our North America segment, which accounted for 96% of our total investment in operating leases at December 31, 2005:
| | | | | | | | | | | | | |
| | |
| | Full Year | |
| |
| |
| | 2005 | | | 2004 | | | 2003 | |
| |
| | |
| | |
| |
| | |
| | (in thousands) | |
| Placements | | | 348 | | | | 343 | | | | 274 | |
| Terminations | | | 425 | | | | 458 | | | | 654 | |
| Returns | | | 286 | | | | 308 | | | | 449 | |
In 2005, placement volumes were up 5,000 units compared with the same period a year ago. Termination and return volumes decreased 33,000 units and 22,000 units, respectively, compared with a year ago, primarily reflecting lower placement volumes in 2002 and 2003.
The following table shows the disposal channels we use to sell vehicles returned to us at lease termination:
| | | | | | | | | | | | | |
| | |
| | Full Year | |
| |
| |
| | 2005 | | | 2004 | | | 2003 | |
| |
| | |
| | |
| |
| Auctions | | | 83 | % | | | 90 | % | | | 98 | % |
| Other Channels | | | 17 | | | | 10 | | | | 2 | |
The increase in the percentage of vehicles disposed through other channels primarily reflected increased Volvo, Jaguar and Land Rover brand U.S. dealer participation in remarketing programs.
23
| |
| ITEM 7. | MANAGEMENT’S DISCUSSION AND ANALYSIS OF FINANCIAL CONDITION AND RESULTS OF OPERATIONS (Continued) |
Credit Ratings
Our short- and long-term debt is rated by four credit rating agencies designated as nationally recognized statistical rating organizations (“NRSROs”) by the Securities and Exchange Commission:
| | |
| | • | Dominion Bond Rating Service Limited (“DBRS”); |
| |
| | • | Fitch, Inc. (“Fitch”); |
| |
| | • | Moody’s Investors Service, Inc. (“Moody’s”); and |
| |
| | • | Standard & Poor’s Rating Services, a division of McGraw-Hill Companies, Inc. (“S&P”). |
In several markets, locally recognized rating agencies also rate us. A credit rating reflects an assessment by the rating agency of the credit risk associated with particular securities we issue, based on information provided by Ford, other sources and us. Credit ratings are not recommendations to buy, sell or hold securities and are subject to revision or withdrawal at any time by the assigning rating agency. Each rating agency may have different criteria for evaluating company risk and, therefore, ratings should be evaluated independently for each rating agency. Lower credit ratings generally result in higher borrowing costs and reduced access to capital markets. Our credit ratings from all of the NRSROs are closely associated with their opinions on Ford. Our lower ratings over the past several years are primarily a reflection of those opinions, including concerns regarding Ford’s automotive cash flow and profitability, declining market share, excess industry capacity, industry pricing pressure and rising health care costs.
In December 2005, Fitch lowered our long-term rating to BB+ from BBB-, lowered our short-term rating to B from F2 and maintained our outlook at Negative. In January 2006, S&P lowered our long-term rating to BB- from BB+, lowered our short-term debt rating to B-2 from B-1 and maintained our outlook at Negative. In January 2006, Moody’s lowered our long-term rating to Ba2 from Baa3, lowered our short-term rating to Not Prime (NP) from P3 and maintained our outlook at Negative. In January 2006, DBRS lowered our long-term rating to BB from BBB (low), lowered our short-term rating to R-3 (high) from R-2 (low) and maintained our trend at Negative. The following chart summarizes our credit ratings and the outlook assigned by the NRSROs since April 2003:
| | | | | | | | | | | | | | | | | | | | | | | | | | | | | | | | | | | | | | | | | | | | | | | | | |
|
| |
| | | | | | | | |
| | DBRS | | | Fitch | | | Moody’s | | | S&P | |
|
| |
| | Long- | | | Short- | | | | | Long- | | | Short- | | | | | Long- | | | Short- | | | | | Long- | | | Short- | | | |
| Date | | Term | | | Term | | | Trend | | | Term | | | Term | | | Outlook | | | Term | | | Term | | | Outlook | | | Term | | | Term | | | Outlook | |
|
| |
| Apr. 2003 | | | BBB (high) | | | | R-1 (low) | | | | Stable | | | | BBB+ | | | | F2 | | | | Negative | | | | A3 | | | | P-2 | | | | Negative | | | | BBB | | | | A-2 | | | | Negative | |
|
| Nov. 2003 | | | BBB (high) | | | | R-1 (low) | | | | Stable | | | | BBB+ | | | | F2 | | | | Negative | | | | A3 | | | | P-2 | | | | Negative | | | | BBB- | | | | A-3 | | | | Stable | |
|
| May 2004 | | | BBB (high) | | | | R-1 (low) | | | | Stable | | | | BBB+ | | | | F2 | | | | Stable | | | | A3 | | | | P-2 | | | | Negative | | | | BBB- | | | | A-3 | | | | Stable | |
|
| Apr. 2005 | | | BBB (high) | | | | R-2 (high) | | | | Negative | | | | BBB+ | | | | F2 | | | | Negative | | | | A3 | | | | P-2 | | | | Negative | | | | BBB- | | | | A-3 | | | | Negative | |
|
| May 2005 | | | BBB (high) | | | | R-2 (high) | | | | Negative | | | | BBB | | | | F2 | | | | Negative | | | | Baa2 | | | | P-2 | | | | Negative | | | | BB+ | | | | B-1 | | | | Negative | |
|
| June 2005 | | | BBB (high) | | | | R-2 (high) | | | | Negative | | | | BBB | | | | F2 | | | | Negative | | | | Baa2 | | | | P-2 | | | | Negative | | | | BB+ | | | | B-1 | | | | Negative | |
|
| July 2005 | | | BBB (high) | | | | R-2 (high) | | | | Negative | | | | BBB- | | | | F2 | | | | Negative | | | | Baa2 | | | | P-2 | | | | Negative | | | | BB+ | | | | B-1 | | | | Negative | |
|
| Aug. 2005 | | | BBB | | | | R-2 (middle) | | | | Negative | | | | BBB- | | | | F2 | | | | Negative | | | | Baa3 | | | | P-3 | | | | Negative | | | | BB+ | | | | B-1 | | | | Negative | |
|
| Oct. 2005 | | | BBB (low) | | | | R-2 (low) | | | | Negative | | | | BBB- | | | | F2 | | | | Negative | | | | Baa3 | | | | P-3 | | | | Negative | | | | BB+ | | | | B-1 | | | Watch Negative |
|
| Dec. 2005 | | | BBB (low) | | | | R-2 (low) | | | | Under Review | | | | BB+ | | | | B | | | | Negative | | | | Baa3 | | | | P-3 | | | | Under Review | | | | BB+ | | | | B-1 | | | Watch Negative |
|
| Jan. 2006 | | | BB | | | | R-3 (high) | | | | Negative | | | | BB+ | | | | B | | | | Negative | | | | Ba2 | | | | NP | | | | Negative | | | | BB- | | | | B-2 | | | | Negative | |
|
24
| |
| ITEM 7. | MANAGEMENT’S DISCUSSION AND ANALYSIS OF FINANCIAL CONDITION AND RESULTS OF OPERATIONS (Continued) |
Funding
Funding Strategy
Our funding strategy is to maintain liquidity and access to diverse funding sources that are cost effective. As a result of lower credit ratings, our unsecured borrowing costs have increased and our access to the unsecured debt markets has become more restricted. In response, we have increased our use of securitization and other asset-backed sources of liquidity, and will continue to expand and diversify our asset-backed funding by asset class, region and channel. In addition, we will continue to participate in the whole-loan market and access the unsecured term debt market opportunistically. Over time, we may also need to reduce further the amount of receivables we purchase. A significant reduction in the amount of purchased receivables would significantly reduce our ongoing profits, and could adversely affect our ability to support the sale of Ford vehicles.
Funding Sources
Our funding sources include sales of receivables in securitizations and other structured financings, unsecured debt issuances, and bank borrowings. Unsecured debt issuance consists of short- and long-term unsecured debt, placed directly by us or through securities dealers or underwriters in the United States and international capital markets, and reaches both retail and institutional investors. During 2005, we continued to meet a significant portion of our funding requirements through securitizations because of their lower relative costs, the stability of the market for asset-backed securities, and the diversity of funding sources that they provide.
We transfer receivables and interests in operating leases and the related vehicles in securitizations and other structured financings to obtain funding. These transfers, which are considered sales for legal purposes, can be structured to provide both short- and long-term funding. For a more complete discussion of securitization and other structured financings, see “Sales of Receivables Transactions” below.
We issue unsecured commercial paper in the United States, Europe and other international markets, with sales mostly to qualified institutional investors. At December 31, 2005, the principal amount outstanding of our unsecured commercial paper was $1.0 billion. Rule 2a-7 under the Investment Company Act of 1940, as amended (“1940 Act”), limits money market mutual funds subject to the 1940 Act to investments only in securities that have received a “1” or “2” rating from at least two NRSROs. In particular, money market mutual funds may hold no more than 5% of their assets in the “Tier-1” securities of any issuer and no more than 1% of their assets in the “Tier-2” securities of any issuer (with no more than 5% of assets permitted in Tier-2 securities from all issuers combined). Tier-1 securities are those receiving a “1” rating from at least two NRSROs; Tier-2 securities are those receiving a “2” rating from at least two NRSROs and not a “1” rating from at least two NRSROs. At present, all of our short-term credit ratings by NRSROs are below the Tier-2 category. As a result, we anticipate a further decline in our unsecured commercial paper balances reflecting decreased investor demand.
We also obtain short-term funding from the sale of floating rate demand notes under a program we named Ford Interest Advantage, and such notes may be redeemed at any time at the option of the holder thereof without restriction. Our policy is to have sufficient cash and cash equivalents, unused committed bank-sponsored asset-backed commercial paper issuer (“conduit”) capacity, securitizable assets, and back-up credit facilities to provide liquidity for all of our short-term funding obligations. At December 31, 2005, the principal amount outstanding of such notes was $6.7 billion. We do not hold reserves to fund the payment of the demand notes or any other short-term funding obligation. FCE also issues certificates of deposit primarily to institutional investors in various markets to obtain short-term funding. At December 31, 2005, the principal amount outstanding of
25
ITEM 7. MANAGEMENT’S DISCUSSION AND ANALYSIS OF FINANCIAL CONDITION AND RESULTS OF OPERATIONS (Continued)
such certificates was about $25 million. Bank borrowings by several of our international affiliates in the ordinary course of business are an additional source of short-term funding. At lower rating levels, we may have less access to bank borrowings.
We issue a variety of long-term debt securities in the United States and international capital markets to both retail and institutional investors. Long-term debt is debt with an original maturity of more than 12 months, and can be either unsecured or asset-backed debt. We use several long-term funding programs, including notes offered with a variety of maturities of two years and longer, and medium-term notes sold through sales agents in smaller amounts in various currencies. We accessed retail investors in the United States through our Continuously Offered Bonds for Retail Accounts program, in Canada through our Term Bonds in Retail Distribution program, and in select European markets through our Continuously Available Retail Securities program (formerly known as Internotes). In 2005, we issued unsecured debt to retail investors at various maturities ranging from eighteen months to 10 years.
Cost of Funding Sources
The cost of both debt and funding in securitizations is based on a margin or spread over a benchmark interest rate. Spreads are typically measured in basis points. Our unsecured commercial paper and floating rate demand notes funding costs are based on spreads over the London Interbank Offered Rate (“LIBOR”), a commonly used benchmark interest rate. Our unsecured long-term debt and securitized funding costs are based on spreads over U.S. Treasury securities of similar maturities, LIBOR or other benchmark rates.
In addition to enhancing our liquidity, one of the main reasons that we have used securitizations as a funding source over the last few years has been that spreads on our securitized funding have been more stable and lower than those on our unsecured term-debt funding. Our unsecured spreads have been very volatile over the last three years, as a result of market perceptions and our lower credit ratings, whereas our securitized funding spreads (which are based on the underlying finance receivables and credit enhancements) have not. Over the last year, our unsecured long-term debt funding spreads have fluctuated between 165 and 660 basis points above comparable U.S. Treasury securities, while our spreads on securitized funding have fluctuated between 42 and 58 basis points above comparable U.S. Treasury securities. The following chart shows our spreads at the end of each quarter, and the average, high and low spreads in 2005, and at each year-end in the 2003 and 2004 periods:
| | | | | | | | | | | | | | | | | | | | | | | | | | | | | | | | | | | | | |
| | |
| | Funding Spreads Compared with 3-Year U.S. Treasury Securities* | |
| |
| |
| | | | |
| | 2005 | | | December 31, | |
| |
| | |
| |
| | Avg. | | | High | | | Low | | | Dec. 31 | | | Sep. 30 | | | Jun. 30 | | | Mar. 31 | | | 2004 | | | 2003 | |
| |
| | |
| | |
| | |
| | |
| | |
| | |
| | |
| | |
| |
| | |
| | (basis points) | |
| Unsecured debt funding | | | 341 | | | | 660 | | | | 165 | | | | 660 | | | | 363 | | | | 350 | | | | 238 | | | | 165 | | | | 186 | |
| Securitized funding | | | 49 | | | | 58 | | | | 42 | | | | 55 | | | | 50 | | | | 52 | | | | 45 | | | | 45 | | | | 53 | |
| | |
| | |
| | |
| | |
| | |
| | |
| | |
| | |
| | |
| |
| Unsecured over/(under) securitized | | | 292 | | | | 602 | | | | 123 | | | | 605 | | | | 313 | | | | 298 | | | | 193 | | | | 120 | | | | 133 | |
| | |
| | |
| | |
| | |
| | |
| | |
| | |
| | |
| | |
| |
| |
| * | The spreads listed are indicative only and do not reflect specific transactions. |
26
| |
| ITEM 7. | MANAGEMENT’S DISCUSSION AND ANALYSIS OF FINANCIAL CONDITION AND RESULTS OF OPERATIONS (Continued) |
Funding Portfolio
Our outstanding debt and securitized off-balance sheet funding was as follows on the dates indicated:
| | | | | | | | | | | | | | | | |
| | |
| | December 31, | |
| |
| |
| | 2005 | | | 2004 | | | 2003 | |
| |
| | |
| | |
| |
| | |
| | (in billions) | |
Debt | | | | | | | | | | | | |
| | Asset-backed commercial paper(a) | | $ | 21.8 | | | $ | 12.6 | | | $ | 9.0 | |
| | Ford Interest Advantage | | | 6.7 | | | | 7.7 | | | | 7.3 | |
| | Commercial paper — unsecured | | | 1.0 | | | | 8.9 | | | | 6.1 | |
| | Other short-term debt | | | 2.3 | | | | 2.6 | | | | 2.3 | |
| | |
| | |
| | |
| |
| | | Total short-term debt | | | 31.8 | | | | 31.8 | | | | 24.7 | |
| | Unsecured long-term debt (including notes payable within one year) | | | 84.7 | | | | 108.6 | | | | 124.7 | |
| | Asset-backed long-term debt (including notes payable within one year)(a) | | | 18.0 | | | | 3.9 | | | | 0.3 | |
| | |
| | |
| | |
| |
| | | | Total debt | | | 134.5 | | | | 144.3 | | | | 149.7 | |
Securitized Off-Balance Sheet Funding | | | | | | | | | | | | |
| | Securitized off-balance sheet portfolio | | | 18.0 | | | | 35.6 | | | | 46.9 | |
| | Retained interest | | | (1.4 | ) | | | (9.2 | ) | | | (12.6 | ) |
| | |
| | |
| | |
| |
| | | Total securitized off-balance sheet funding | | | 16.6 | | | | 26.4 | | | | 34.3 | |
| | |
| | |
| | |
| |
| | | | Total debt plus securitized off-balance sheet funding | | $ | 151.1 | | | $ | 170.7 | | | $ | 184.0 | |
| | |
| | |
| | |
| |
Ratios | | | | | | | | | | | | |
| | Credit lines to total unsecured commercial paper | | | >100 | % | | | 84 | % | | | >100 | % |
| | Credit lines to total unsecured commercial paper | | | | | | | | | | | | |
| | | (including Ford bank lines) | | | >100 | | | | >100 | | | | >100 | |
| | Securitized funding to managed receivables | | | 38 | | | | 26 | | | | 25 | |
| | Short-term debt and notes payable within one year to total debt | | | 43 | | | | 43 | | | | 36 | |
| | Short-term debt and notes payable within one year to total capitalization | | | 40 | | | | 40 | | | | 33 | |
| |
| (a) | Asset-backed debt is issued by consolidated securitization SPEs and is payable out of collections on the finance receivables or interests in operating leases and the related vehicles transferred to the SPEs. This debt is the legal obligation of the related securitization SPEs. |
At December 31, 2005, outstanding unsecured commercial paper was down $7.9 billion from year-end 2004, reflecting decreased investor demand. At December 31, 2005, total debt plus securitized off-balance sheet funding was down $19.6 billion compared with year-end 2004, primarily reflecting repayment of maturing debt and lower funding requirements due to lower asset levels. The increase in asset-backed commercial paper and asset-backed long term debt on our balance sheet and the decrease in securitized off-balance sheet funding primarily reflected the accounting consolidation of our wholesale securitization program as a result of certain changes made to the program in the fourth quarter of 2005, which caused the debt previously issued by the trust to be reported on-balance sheet. Short-term debt and notes payable within one year as a percentage of total debt remained unchanged at 43% from year-end 2004 to year-end 2005, primarily resulting from higher on-balance sheet commercial paper balances offset by lower unsecured commercial paper balances.
During 2005, we realized proceeds of $20.9 billion of public and private long-term debt with maturities of one to ten years, including $9.8 billion of unsecured institutional funding, $1.4 billion of unsecured retail bonds and $9.7 billion in on-balance sheet securitizations. In addition, we realized proceeds of $19.4 billion from public and private sales of receivables in off-balance sheet securitizations and $1.5 billion in a whole-loan sale transaction.
27
| |
| ITEM 7. | MANAGEMENT’S DISCUSSION AND ANALYSIS OF FINANCIAL CONDITION AND RESULTS OF OPERATIONS (Continued) |
Term Funding Plan
The following table shows our term public funding issuances for 2004 and 2005 and our planned issuances for 2006:
| | | | | | | | | | | | | | | |
| | 2006 | | | | | |
| | Forecast | | | 2005 | | | 2004 | |
| |
| | |
| | |
| |
| | |
| | (in billions) | |
Unsecured Term Debt | | | | | | | | | | | | |
| | Institutional | | $ | 0 - 2 | | | $ | 8 | | | $ | 7 | |
| | Retail | | | 0 - 1 | | | | 1 | | | | 5 | |
| | |
| | |
| | |
| |
| | | Total unsecured term debt | | | 0 - 3 | | | | 9 | | | | 12 | |
Term Public Securitization(a) | | | 8 - 12 | | | | 12 | | | | 6 | |
| | |
| | |
| | |
| |
| | | Total term public funding | | $ | 8 - 15 | | | $ | 21 | | | $ | 18 | |
| | |
| | |
| | |
| |
Memo — Not Included Above | | | | | | | | | | | | |
| | Private Transactions(b) | | $ | 25 - 35 | | | $ | 18 | | | $ | 10 | |
| | |
| | (a) | Reflects new issuance and includes funding from discontinued operations in 2004; excludes whole-loan sales and other structured financings. |
| |
| | (b) | Includes private securitizations, other structured financings and whole-loan sales; excludes sales to our on-balance sheet asset- backed commercial paper programs and proceeds from revolving transactions. |
In 2005, we completed about $21 billion of public term funding transactions. We expect our full year 2006-term public funding requirements to be between $8 billion and $15 billion.
Because we expect to continue using private funding sources and further reduce our managed receivables in 2006, our term public funding requirements are lower than the combined amount of maturing debt and amortization of asset-backed securities (about $50 billion). Any whole-loan sale transactions (see “Liquidity” below) could further reduce our funding requirements.
In 2005, we completed about $18 billion of private funding transactions (excludes asset sales to our sponsored commercial paper conduits and proceeds from revolving transactions) in several markets. These transactions include lease, retail and wholesale securitizations executed in private transactions, other structured financings and whole-loan sale transactions. We expect our full year 2006 private transactions to be between $25 billion and $35 billion.
Our funding plan is subject to risks and uncertainties, many of which are beyond our control (see “Liquidity Risks” below).
Liquidity
Maintaining liquidity through access to diverse funding sources has always been a key factor in our funding strategy. We define liquidity as our ability to meet our funding needs, which includes purchasing retail installment sale and lease contracts, funding other financing programs and repaying our debt obligations as they become due, or earlier under certain debt retirement programs. Our policy is to have sufficient cash and cash equivalents, unused conduit capacity, securitizable assets and back-up credit facilities to provide liquidity for all of our short-term funding obligations.
Cash and Cash Equivalents. At December 31, 2005, our cash and cash equivalents totaled $17.9 billion, compared with $12.7 billion at year-end 2004. In the normal course of our funding activities, we may generate more proceeds than are necessary for our immediate funding needs. These excess amounts are maintained primarily as highly liquid investments, which provide liquidity for our short-term funding needs and give us flexibility in the use of our other funding programs. Our cash and cash equivalents include short-term U.S. Treasury bills, federal agency discount notes,
28
| |
| ITEM 7. | MANAGEMENT’S DISCUSSION AND ANALYSIS OF FINANCIAL CONDITION AND RESULTS OF OPERATIONS (Continued) |
highly rated commercial paper, and bank time deposits with investment grade institutions. The average term of these investments is typically less than 60 days. We monitor our cash levels daily and adjust them as necessary to support our short-term liquidity needs. At December 31, 2005, $2.3 billion of our total cash balance was legally isolated, to support our consolidated securitization SPEs, compared with $1.4 billion at year-end 2004.
Conduit Program. We have entered into agreements with several bank-sponsored conduits under which such conduits are contractually committed to purchase from us, at our option, retail receivables for proceeds of up to approximately $16.2 billion. This is an extremely liquid funding source, as we are able to access funds in two days. These agreements have varying maturity dates between June 22, 2006 and October 26, 2006 and, in the past, have been renewed on an annual basis. Our ability to access these conduits is subject to our having a sufficient amount of securitizable assets. As of December 31, 2005, approximately $5.5 billion of these conduit commitments were in use. These agreements do not contain restrictive financial covenants (for example, debt-to-equity limitations or minimum net worth requirements) or material adverse change clauses that would relieve the conduit of its obligation to purchase receivables. However, they do contain provisions that could terminate the unused portion of the purchase commitments if the performance of the sold receivables deteriorates beyond specified levels. Based on our experience and knowledge as servicer of the securitized assets, we do not expect any commitments to be terminated due to these performance requirements. None of these arrangements may be terminated based on a change in our credit rating.
Whole-Loan Sale Transactions. We have a program to sell retail installment sale contracts in transactions where we retain no interest and thus no exposure to the sold assets. These transactions, which we refer to as “whole-loan sale transactions,” provide liquidity by enabling us to reduce our managed receivables and our need for funding to support those receivables. Whole-loan sale transactions totaled $11.8 billion in the 2002 through 2005 period. In 2005, we sold approximately $1.5 billion of receivables in a whole-loan sale transaction. Total outstanding receivables sold in whole-loan transactions at December 31, 2005 were $2.9 billion.
Back-up Credit Facilities
Our back-up credit facilities were as follows on the dates indicated:
| | | | | | | | | | | | | | | |
| | |
| | December 31, | |
| |
| |
| | 2005 | | | 2004 | | | 2003 | |
| |
| | |
| | |
| |
| | |
| | (in billions) | |
Back-up Credit Facilities | | | | | | | | | | | | |
| | Ford Credit bank lines | | $ | 3.8 | | | $ | 4.4 | | | $ | 4.4 | |
| | FCE bank lines | | | 2.4 | | | | 3.2 | | | | 3.5 | |
| | Ford bank lines (available at Ford’s option) | | | 6.5 | | | | 6.9 | | | | 6.8 | |
| | Asset-backed commercial paper lines | | | 18.7 | | | | 18.0 | | | | 18.6 | |
| | |
| | |
| | |
| |
| | | Total back-up facilities | | | 31.4 | | | | 32.5 | | | | 33.3 | |
| | Utilized amounts | | | (1.1 | ) | | | (1.0 | ) | | | (1.2 | ) |
| | |
| | |
| | |
| |
| | | Total available back-up facilities | | $ | 30.3 | | | $ | 31.5 | | | $ | 32.1 | |
| | |
| | |
| | |
| |
At December 31, 2005, we and our majority owned subsidiaries had $6.2 billion of contractually committed credit facilities with financial institutions, of which $5.1 billion were available for use. Of the lines available for use, 36% are committed through June 30, 2010. Of the $6.2 billion, about $3.8 billion constitute Ford Credit facilities ($3.2 billion global and about $600 million non-global) and $2.4 billion are FCE facilities ($2.3 billion global and about $100 million non-global). Our global credit facilities may be used, at our option, by any of our direct or indirect majority owned subsidiaries. We
29
ITEM 7. MANAGEMENT’S DISCUSSION AND ANALYSIS OF FINANCIAL CONDITION AND RESULTS OF OPERATIONS (Continued)
or FCE, as the case may be, will guarantee any such borrowings. All of the global credit facilities have substantially identical contract terms (other than commitment amounts) and are free of material adverse change clauses, restrictive financial covenants (for example, debt-to-equity limitations and minimum net worth requirements) and credit rating triggers that could limit our ability to borrow.
At Ford’s option, Ford’s global lines of credit of $6.5 billion may be used by any of its direct or indirect, majority owned subsidiaries on a guaranteed basis. Ford also has the ability to transfer, on a non-guaranteed basis, $2.2 billion of such credit lines to us and approximately $500 million to FCE.
In addition, at December 31, 2005, banks provided $18.7 billion of contractually committed liquidity facilities exclusively to support our two on-balance sheet asset-backed commercial paper programs; $18.2 billion supported our FCAR program and $500 million supported our Motown NotesSM wholesale securitization program (“Motown Notes”). The FCAR and Motown Notes programs must be supported by liquidity facilities equal to at least 100% and 5%, respectively, of their face amount. At December 31, 2005, $17.7 billion of FCAR’s bank credit facilities were available to support FCAR’s asset-backed commercial paper or subordinated debt. The remaining $500 million of available credit lines could be accessed for additional funding if FCAR issued additional subordinated debt. Utilization of these facilities is subject to conditions specific to each program and our having a sufficient amount of securitizable assets. At December 31, 2005, the outstanding balances were $15.3 billion for the FCAR program and $6.5 billion for the Motown Notes program.
Liquidity Risks
Despite our diverse sources of liquidity, our ability to maintain our liquidity may be affected by the following factors:
| | |
| | • | Our credit ratings, |
| |
| | • | Disruption of financial markets, |
| |
| | • | Market capacity for Ford- and Ford Credit-sponsored investments, |
| |
| | • | General demand for the type of securities we offer, |
| |
| | • | Our ability to sell receivables, |
| |
| | • | Performance of receivables in our previous receivables sale transactions, |
| |
| | • | Accounting and regulatory changes, and |
| |
| | • | Our ability to maintain back-up credit facilities. |
Sales of Receivables Transactions
Overview
We sell receivables in securitizations and other structured financings and in whole-loan sale transactions. Some of these arrangements satisfy accounting sale treatment and are not reflected on our balance sheet in the same way as debt funding, but could have an effect on our financial condition, operating results and liquidity. The remainder of these arrangements do not satisfy the requirements for accounting sale treatment and the sold receivables and associated debt remain on our balance sheet.
The securitization process involves the sale of securities that are backed by a pool of receivables. The cash flows on the underlying receivables are used to pay principal and interest on
30
| |
| ITEM 7. | MANAGEMENT’S DISCUSSION AND ANALYSIS OF FINANCIAL CONDITION AND RESULTS OF OPERATIONS (Continued) |
the debt securities and to pay other transaction participants and expenses. Because of the similarity between securitizations and structured financings, we include structured financings and refer to them as securitizations in our analysis of off-balance sheet arrangements and elsewhere in this report.
We have participated in the securitization market since 1988. Automobile finance receivables are one of the largest classes of securitized assets and we are regularly one of the largest securitizers of automobile finance receivables. We securitize our receivables because the highly liquid and efficient market for securitization of financial assets provides us with a lower cost source of funding compared with unsecured debt given our present credit ratings, the market for asset-backed securities is stable, and it diversifies our funding among different markets and investors.
Our securitization programs are diversified among asset classes and markets. We securitize retail installment sale contracts, wholesale receivables, and interests in operating leases and the related vehicles. We participate in securitization markets in North America, Europe and Asia, using assets originated in the United States, Canada, the United Kingdom, Germany, Spain, Italy, France, Japan, Australia and Mexico.
We also sell pools of retail installment sale contracts in whole-loan sale transactions. Unlike our securitizations, in whole-loan sale transactions we do not retain any interests in the sold receivables and do not have any risk of loss related to the sold receivables. We continue to service the receivables sold in whole-loan sale transactions.
Use of Special Purpose Entities
Securitization involves the sale of a pool of receivables to an SPE, typically a trust. The SPE issues interest-bearing securities, commonly called asset-backed securities, that are backed by the sold receivables. The SPE uses proceeds from the sale of these securities to pay the purchase price for the sold receivables. The SPE has limited purposes and may only purchase the receivables, issue asset-backed securities and make payments on the securities. The SPE has a limited duration and generally is dissolved when investors holding the asset-backed securities have been paid all amounts owed to them. Our use of SPEs in our securitizations is consistent with conventional practices in the securitization industry. The sale to the SPE achieves isolation of the sold receivables for the benefit of securitization investors and protects them from the claims of our creditors. The use of SPEs combined with the structure of these transactions means that the payment of the asset-backed securities is based on the creditworthiness of the underlying finance receivables and any enhancements (as discussed below), and not our own creditworthiness. As a result, the senior asset-backed securities issued by the SPEs generally receive the highest short-term credit ratings and among the highest long-term credit ratings from the credit rating agencies that rate them, and are sold to securitization investors at cost-effective pricing.
We sponsor the SPEs used in all of our securitization programs with the exception of bank-sponsored conduits. None of our officers, directors or employees holds any equity interests in our SPEs or receives any direct or indirect compensation from the SPEs. These SPEs do not own our stock or stock of any of our affiliates.
Typical U.S. Retail Securitization Structure
Our typical U.S. retail securitization is a two-step transaction. We sell a pool of our retail installment sale contracts to a wholly owned, bankruptcy-remote special purpose subsidiary that establishes a separate SPE, usually a trust, and transfers the receivables to the SPE in exchange for the proceeds from securities issued by the SPE. The securities issued by the trust, usually notes of various maturities and interest rates, are paid by the SPE from collections on the pool of receivables it owns. These securities are usually structured into senior and subordinated classes.
31
| |
| ITEM 7. | MANAGEMENT’S DISCUSSION AND ANALYSIS OF FINANCIAL CONDITION AND RESULTS OF OPERATIONS (Continued) |
The senior classes have priority over the subordinated classes in receiving collections from the sold receivables. The receivables acquired by the SPE and the asset-backed securities issued by the SPE are assets and obligations of the SPE.
The following simplified diagram shows our typical U.S. retail securitization transaction:
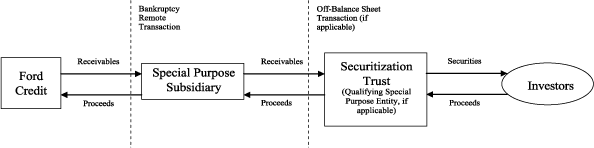
We select receivables at random for our securitization transactions using selection criteria designed for the specific transaction. For securitizations of retail installment sale contracts, the selection criteria are based on factors such as contract term, payment schedule, interest rate, financing program and the type of financed vehicle. In general, the criteria also require receivables to be active and in good standing. In our retail transactions, we typically exclude receivables where the obligor is having a credit problem that is evidenced by delinquency of more than 30-days, bankruptcy or payment extensions.
We provide various forms of credit enhancements to reduce the risk of loss for senior classes of securities. Credit enhancements include over-collateralization (when the principal balance of receivables owned by the SPE exceeds the principal amount of asset-backed securities issued by the SPE), segregated cash reserve funds, subordinated securities and excess spread (when interest collections on the receivables owned by the SPE exceed interest payments on the asset-backed securities issued by the SPE). We also provide payment enhancements that increase the likelihood of the timely payment of interest and the payment of principal at maturity. Payment enhancements include yield supplement arrangements, interest rate swaps, liquidity facilities and certain cash deposits.
We retain interests in receivables sold through securitizations. The retained interests may include senior and subordinated securities issued by the SPE, restricted cash held for the benefit of the SPE (for example, a reserve fund) and residual interests in securitization transactions. Income from residual interests in securitization transactions represents the right to receive collections on the sold finance receivables in excess of amounts needed by the SPE to pay interest and principal to investors, servicing fees and other required payments. Retained interests are subordinated and serve as credit enhancements for the more senior securities issued by the SPE to help ensure that adequate funds will be available to pay investors that hold senior securities. Our ability to realize the carrying amount of our retained interests depends on actual credit losses and prepayment speeds on the sold receivables. We retain credit risk in securitizations. Our retained interests include the most subordinated interests in the SPE, which are the first to absorb credit losses on the sold receivables. Our securitizations are structured to protect the holders of the senior asset-backed securities such that, based on past experience, any credit losses in the pool of sold receivables would likely be limited to our retained interests.
The SPE engages us as servicer to collect and service the sold receivables for a servicing fee. Our servicing duties include collecting payments on receivables and preparing monthly investor reports on the performance of the sold receivables that are used by the trustee to distribute monthly
32
| |
| ITEM 7. | MANAGEMENT’S DISCUSSION AND ANALYSIS OF FINANCIAL CONDITION AND RESULTS OF OPERATIONS (Continued) |
interest and/or principal payments to investors. While servicing the sold receivables for the SPE, we apply the same servicing policies and procedures that we apply to our owned receivables and maintain our normal relationship with our financing customers.
Securitization Programs
We sell retail installment contracts, wholesale receivables and interest in operating leases and the related vehicles through a variety of on- and off-balance sheet securitization programs, using amortizing and revolving structures. These programs are targeted to many different investors in both public and private transactions in capital markets worldwide and include:
| | |
| | • | Retail Securitization — We sell pools of retail installment sale contracts to SPEs that issue securities, most of which are sold to investors in public offerings or private transactions. |
| |
| | • | FCAR — We use a special purpose trust, FCAR, as a source of funds for our operations. FCAR’s activities are limited to issuing asset-backed commercial paper and other securities, borrowing from banks and buying highly-rated asset-backed securities issued by securitization SPEs sponsored by us. As of December 31, 2005, FCAR held only asset-backed securities backed by retail installment sale contracts. |
| |
| | • | Conduits — We sell pools of retail installment sale contracts to bank-sponsored asset-backed commercial paper issuers that are SPEs of the sponsoring bank. |
| |
| | • | Wholesale Securitization and Motown Notes Program — We sell wholesale finance receivables from specified dealer accounts to an SPE that issues term notes that are sold to investors in public offerings and extendible asset-backed commercial paper, called Motown Notes, that are sold to qualified institutional buyers in private transactions. |
| |
| | • | Lease Securitization — We sponsor securitization SPEs that have issued notes backed by interests in operating leases and the related vehicles held in titling SPEs. |
| |
| | • | Other Structured Financings — Our Mexican subsidiary sells pools of retail installment sale contracts to large financial institutions where we retain subordinated interests in the sold receivables. |
In the United States, we are generally able to access the securitization markets in two days, in the case of our unutilized capacity in conduits and our Motown Notes program, and in two to three weeks, in the case of repeat transactions in our retail and wholesale securitization programs. New programs and new transaction structures typically require substantial development time before coming to market.
Our Continuing Obligations
We generally have no obligation to repurchase or replace any receivable sold to an SPE that subsequently becomes delinquent in payment or otherwise is in default. Investors holding securities issued by an SPE have no recourse to us or our other assets for credit losses on the sold receivables and have no right to require us to repurchase the securities. We do not guarantee any asset-backed securities and have no obligation to provide liquidity or make monetary contributions or contributions of additional receivables to our SPEs either due to the performance of the sold receivables or the credit rating of our short-term or long-term debt. However, as the seller and servicer of the finance receivables to the SPE, we are obligated to provide certain kinds of support to our securitizations, which are customary in the securitization industry. These obligations consist of indemnifications, receivable repurchase obligations on receivables that do not meet eligibility criteria or that have been materially modified, the mandatory sale of additional receivables in revolving
33
| |
| ITEM 7. | MANAGEMENT’S DISCUSSION AND ANALYSIS OF FINANCIAL CONDITION AND RESULTS OF OPERATIONS (Continued) |
transactions and in some cases servicer advances of interest shortfalls. See Note 7 of our Notes to the Financial Statements for more information about these repurchases.
Risks to Continued Funding under Securitization Programs
The following securitization programs contain structural features that could prevent us from using these sources of funding in certain circumstances:
| | |
| | • | FCAR — If credit losses or delinquencies in our portfolio of retail, wholesale or lease receivables exceed specified levels, FCAR is not permitted to purchase additional asset-backed securities of the affected type for so long as such levels are exceeded. FCAR is permitted to purchase only highly-rated asset-backed securities, and if the credit enhancement on any asset-backed security purchased by FCAR is reduced to zero, FCAR may not purchase any additional asset-backed securities and would wind down its operations. |
| |
| | • | Conduits — If credit losses or delinquencies on the pool of sold receivables held by a conduit exceed specified levels, or if the level of over-collateralization for such pool decreases below a specified level, we will be unable to sell additional pools of receivables to that conduit. |
| |
| | • | Wholesale Securitization and Motown Notes Program — If the payment rates on wholesale receivables are lower than specified levels, the SPE will be unable to issue additional securities and any existing securities would begin to amortize. |
Based on our experience, we do not expect that any of these features will have a material adverse impact on our ability to use securitization to fund our operations.
In addition to the specific transaction-related structural features discussed above, our ability to sell receivables in any of our securitization programs may be affected by the following factors:
| | |
| | • | Amount and credit quality of receivables available to sell — Lower overall receivables levels or a higher proportion of non-performing receivables could decrease the amount of receivables available to securitize. |
| |
| | • | Performance of receivables in our previous receivables sales — If receivables in our existing securitization transactions deteriorate significantly, we may not be able to access the market, particularly in public transactions where receivables performance is publicly available and/or the costs to securitize may increase. |
| |
| | • | General demand for the type of receivables supporting the asset-backed securities — Investor desire for securities with different risk and/or yield characteristics could result in reduced demand for these types of investments. |
| |
| | • | Market capacity for us and our sponsored investments — Investors may reach exposure limits and/or wish to diversify away from our risk. |
| |
| | • | Accounting and regulatory changes — Such changes may result in temporary disruption or termination of one or more of our present programs which may or may not be able to be restructured or replaced. |
| |
| | • | Our credit rating — Our rating may impact investors’ acceptance of our asset-backed securities. |
| |
| | • | Availability of liquidity facilities — Our ability to maintain back-up liquidity facilities for any programs that require them. |
If as a result of any of these or other factors the cost of securitized funding were to increase significantly or funding through securitizations were no longer available to us, it would have a
34
| |
| ITEM 7. | MANAGEMENT’S DISCUSSION AND ANALYSIS OF FINANCIAL CONDITION AND RESULTS OF OPERATIONS (Continued) |
material adverse impact on our financial condition, results of operations or liquidity. However, given the diversity of our securitization programs, it is not likely that these risk factors would impact all programs simultaneously. In addition, new structures could be developed, recognizing that substantial time is required for the development, launch and market acceptance of new programs.
On-Balance Sheet Arrangements
Some of our securitization programs described above do not satisfy the requirements for accounting sale treatment and, therefore, the sold assets and associated debt are included in our financial statements. Assets that have been sold or transferred to securitization SPEs are only available to repay the debt issued by the securitization SPEs and to pay other securitization investors and other participants. These assets are not available to pay our other obligations or the claims of our other creditors. The debt issued by these securitization SPEs is payable out of collections on these assets. This debt is the legal obligation of the securitization SPEs and is not the legal obligation of Ford Credit or its other subsidiaries. The following securitization programs are on-balance sheet arrangements:
| | |
| | • | Certain Retail Securitizations |
| |
| | • | Wholesale Securitizations |
| |
| | • | Lease Securitizations |
Off-Balance Sheet Arrangements
The remainder of our securitization programs described above satisfy the requirements for accounting sale treatment and, therefore, the sold receivables and associated debt are removed from our financial statements. However, these off-balance sheet arrangements could have an effect on our financial condition, operating results and liquidity in the same manner as our on-balance sheet arrangements, as described above in Use of Special Purpose Entities, Our Continuing Obligations and the Risks to Continued Funding. The following securitization programs are off-balance sheet arrangements:
| | |
| | • | Certain Retail Securitizations |
| |
| | • | Conduits |
| |
| | • | Certain Other Structured Financings — Retail transactions in Mexico. |
35
| |
| ITEM 7. | MANAGEMENT’S DISCUSSION AND ANALYSIS OF FINANCIAL CONDITION AND RESULTS OF OPERATIONS (Continued) |
Off-Balance Sheet Sales of Receivables Activity
The following table illustrates our worldwide receivable sales activity in off-balance sheet securitizations and whole-loan sale transactions for the periods indicated:
| | | | | | | | | | | | | | | | | |
| | |
| | Full Year | |
| |
| |
| | 2005 | | | 2004 | | | 2003 | |
| |
| | |
| | |
| |
| | |
| | (in billions) | |
| North America segment | | | | | | | | | | | | |
| | Public retail | | $ | 9.7 | | | $ | 1.7 | | | $ | 5.7 | |
| | Conduit | | | 3.8 | | | | 1.8 | | | | 1.8 | |
| | Motown Notes program | | | 1.4 | | | | 1.0 | | | | 1.0 | |
| | Public wholesale | | | 2.3 | | | | 3.0 | | | | — | |
| | Canada and other | | | — | | | | 0.8 | | | | 1.3 | |
| | |
| | |
| | |
| |
| | | | Total North America segment | | | 17.2 | | | | 8.3 | | | | 9.8 | |
| International segment | | | | | | | | | | | | |
| | Europe | | | | | | | | | | | | |
| | | Public | | | 0.8 | | | | 1.3 | | | | 2.4 | |
| | | Conduit | | | 0.5 | | | | 0.3 | | | | 0.2 | |
| | |
| | |
| | |
| |
| | | | Total Europe | | | 1.3 | | | | 1.6 | | | | 2.6 | |
| | Asia-Pacific | | | 0.4 | | | | 0.4 | | | | 0.9 | |
| | Latin America | | | 0.5 | | | | — | | | | 0.6 | |
| | |
| | |
| | |
| |
| | | | Total International segment | | | 2.2 | | | | 2.0 | | | | 4.1 | |
| | |
| | |
| | |
| |
| | | | | Net proceeds | | | 19.4 | | | | 10.3 | | | | 13.9 | |
| | Whole-loan sales | | | 1.5 | | | | — | | | | 5.4 | |
| | |
| | |
| | |
| |
| | | | | Total net proceeds | | | 20.9 | | | | 10.3 | | | | 19.3 | |
| Retained interest and other | | | (2.8 | ) | | | (3.4 | ) | | | — | |
| | |
| | |
| | |
| |
| | | | | Total receivables sold | | | 18.1 | | | | 6.9 | | | | 19.3 | |
| Prior period sold receivables, net of paydown activity | | | 2.8 | | | | 32.7 | | | | 34.9 | |
| | |
| | |
| | |
| |
| | | | | Total sold receivables outstanding at the end of the relevant period | | | 20.9 | | | | 39.6 | | | | 54.2 | |
| Memo: | | | | | | | | | | | | |
| Less: Receivables outstanding in whole-loan sale transactions | | | (2.9 | ) | | | (4.0 | ) | | | (7.3 | ) |
| | |
| | |
| | |
| |
| | | | | Total securitized off-balance sheet receivables | | $ | 18.0 | | | $ | 35.6 | | | $ | 46.9 | |
| | |
| | |
| | |
| |
At December 31, 2005, total net proceeds from off-balance sheet sales of receivables totaled $20.9 billion, up $10.6 billion compared with a year ago. The increase in net proceeds reflects our increased use of securitization as a source of funding.
The Effect of Off-Balance Sheet Receivables Sales Activity on Financial Reporting
We report the following items inInvestment and other income related to sales of receivableson our income statement:
| | |
| | • | Net gain on sales of finance receivables, |
| |
| | • | Income on interest in sold wholesale receivables and retained securities, |
| |
| | • | Servicing fee income from sold receivables that we continue to service, and |
| |
| | • | Income from residual interest and other income. |
36
| |
| ITEM 7. | MANAGEMENT’S DISCUSSION AND ANALYSIS OF FINANCIAL CONDITION AND RESULTS OF OPERATIONS (Continued) |
The following table summarizes activity related to off-balance sheet sales of receivables reported inInvestment and other income related to sales of receivablesfor the periods indicated:
| | | | | | | | | | | | | | |
| | |
| | Full Year | |
| |
| |
| | 2005 | | | 2004 | | | 2003 | |
| |
| | |
| | |
| |
| | |
| | (in millions) | |
| Net gain on sales of receivables | | $ | 74 | | | $ | 155 | | | $ | 373 | |
| Income on interest in sold wholesale receivables and retained securities | | | 327 | | | | 588 | | | | 679 | |
| Servicing fees | | | 376 | | | | 372 | | | | 618 | |
| Income on residual interest and other | | | 721 | | | | 815 | | | | 941 | |
| | |
| | |
| | |
| |
| | Investment and other income related to sales of receivables | | | 1,498 | | | | 1,930 | | | | 2,611 | |
| Less: Whole-loan income | | | (73 | ) | | | (91 | ) | | | (234 | ) |
| | |
| | |
| | |
| |
| | Income related to off-balance sheet securitizations | | $ | 1,425 | | | $ | 1,839 | | | $ | 2,377 | |
| | |
| | |
| | |
| |
| Memo: | | | | | | | | | | | | |
| | Finance receivables sold (in billions) | | $ | 18.1 | | | $ | 6.9 | | | $ | 19.3 | |
| | Servicing portfolio as of period-end (in billions) | | | 20.9 | | | | 39.6 | | | | 54.2 | |
| | Pre-tax gain per dollar of retail receivables sold | | | 0.4 | % | | | 2.2 | % | | | 1.9 | % |
In 2005, income related to off-balance sheet securitizations declined $414 million compared with 2004. The decline primarily reflected lower wholesale-retained interest in securitized assets and lower gains on sale due to higher interest rates.
Sales of finance receivables through off-balance sheet securitizations have the impact on earnings of recalendarizing and reclassifying net financing margin (financing revenue less interest expense) and credit losses related to the sold receivables, compared with how they would have been reported if we continued to report the sold receivables on our balance sheet and funded them through asset-backed financings. Recalendarization effects occur initially when the gain or loss on the sale of the receivables is recognized in the period the receivables are sold. Over the life of the securitization transactions, we recognize income from residual interest in securitization transactions, interest income from retained securities, servicing fees and other receivable sale income.
Credit losses related to the off-balance sheet securitized receivables are included in our initial and ongoing valuation of our residual interest in securitization transactions (see “Critical Accounting Estimates — Off-Balance Sheet Sales of Receivables in Securitizations and Other Transactions” below for definition) and neither impact theProvision for credit losseson our income statement nor influence our assessment of the adequacy of our allowance for credit losses related to our on-balance sheet receivables.
Over the life of each off-balance sheet securitization transaction, the gain or loss on the sale of the receivables, income from residual interest in securitization transactions, interest income from retained securities, servicing fees and other receivable sale income is equal to the net financing margin and credit losses that would have been reported had we reported the receivables on our balance sheet and funded them through asset-backed financings.
The net impact of off-balance sheet securitizations on our earnings in a given period will vary depending on the amount and type of receivables sold and the timing of the transactions in the current period and the preceding two-to-three-year period, as well as the interest rate environment at the time the finance receivables were originated and securitized.
37
| |
| ITEM 7. | MANAGEMENT’S DISCUSSION AND ANALYSIS OF FINANCIAL CONDITION AND RESULTS OF OPERATIONS (Continued) |
The following table shows, on an analytical basis, the earnings impact of our off-balance sheet securitizations as if we had reported them on-balance sheet and funded them through asset-backed financings for the periods indicated:
| | | | | | | | | | | | | | | | |
| | |
| | Full Year | |
| |
| |
| | 2005 | | | 2004 | | | 2003 | |
| |
| | |
| | |
| |
| | |
| | (in millions) | |
| Financing revenue | | | | | | | | | | | | |
| | Retail revenue | | $ | 1,506 | | | $ | 1,926 | | | $ | 3,371 | |
| | Wholesale revenue | | | 1,006 | | | | 1,097 | | | | 1,080 | |
| | |
| | |
| | |
| |
| | | Total financing revenue | | | 2,512 | | | | 3,023 | | | | 4,451 | |
| Borrowing cost | | | (1,076 | ) | | | (854 | ) | | | (1,443 | ) |
| | |
| | |
| | |
| |
| | | Net financing margin | | | 1,436 | | | | 2,169 | | | | 3,008 | |
| Net credit losses | | | (127 | ) | | | (244 | ) | | | (551 | ) |
| | |
| | |
| | |
| |
| | | | Income before income taxes | | $ | 1,309 | | | $ | 1,925 | | | $ | 2,457 | |
| | |
| | |
| | |
| |
| Memo: | | | | | | | | | | | | |
| Income related to off-balance sheet securitizations | | $ | 1,425 | | | $ | 1,839 | | | $ | 2,377 | |
| Recalendarization impact of off-balance sheet securitizations | | | 116 | | | | (86 | ) | | | (80 | ) |
In 2005, the impact on earnings of reporting the sold receivables as off-balance sheet securitizations was $116 million higher than had these transactions been structured as on-balance sheet securitizations. This difference resulted from recalendarization effects caused by gain-on-sale accounting requirements. This effect will fluctuate as the amount of receivables sold in our off-balance sheet securitizations increases or decreases over time. In a steady state of securitization activity, the difference between reporting securitizations on- or off-balance sheet in a particular year approaches zero. While the difference in earnings impact between on- or off-balance sheet securitizations is minimal, this funding source has provided us with significant borrowing cost savings compared with unsecured debt and funding flexibility in a difficult funding environment for us.
Leverage
We use leverage, or the debt-to-equity ratio, to make various business decisions, including establishing pricing for retail, wholesale and lease financing, and assessing our capital structure. We calculate leverage on a financial statement basis and on a managed basis using the following formulas:
| | | | | | | | | | | | | | | | | | | | | |
Financial
Statement
Leverage | | = | | Total Debt
Equity | | | | | | | | | | | | | | | | |
| |
| | | | | | | | | | | | | Retained | | | | | | | | |
| | | | | | | | | | | | | Interest in | | | | | | | | |
| | | | | | | | | Securitized | | | | Securitized | | | | | | | | Fair Value |
| | | | | | | | | Off-balance | | | | Off-balance | | | | Cash | | | | Hedge Accounting |
| | | | | Total Debt | | + | | Sheet | | - | | Sheet | | - | | and Cash | | - | | Adjustments |
| | | | | | | | | Receivables | | | | Receivables | | | | Equivalents | | | | on Total Debt |
| Managed Leverage | | = | |
|
| |
| | | | | | | | | | | | | | | | | Fair Value | | | | |
| | | | | | | | | | | | | | | | | Hedge Accounting | | | | |
| | | | | | | | | Equity | | + | | Minority | | - | | Adjustment | | | | |
| | | | | | | | | | | | | Interest | | | | on Equity | | | | |
38
| |
| ITEM 7. | MANAGEMENT’S DISCUSSION AND ANALYSIS OF FINANCIAL CONDITION AND RESULTS OF OPERATIONS (Continued) |
The following table shows the calculation of our financial statement leverage (in billions, except for ratios):
| | | | | | | | | | | | | |
| | |
| | December 31, | |
| |
| |
| | 2005 | | | 2004 | | | 2003 | |
| |
| | |
| | |
| |
| Total debt | | $ | 134.5 | | | $ | 144.3 | | | $ | 149.7 | |
| Total stockholder’s equity | | | 10.7 | | | | 11.5 | | | | 12.5 | |
| Financial statement leverage (to 1) | | | 12.5 | | | | 12.6 | | | | 12.0 | |
The following table shows the calculation of our managed leverage (in billions, except for ratios):
| | | | | | | | | | | | | | |
| | |
| | December 31, | |
| |
| |
| | 2005 | | | 2004 | | | 2003 | |
| |
| | |
| | |
| |
| Total debt | | $ | 134.5 | | | $ | 144.3 | | | $ | 149.7 | |
| Securitized off-balance sheet receivables outstanding(a) | | | 18.0 | | | | 37.7 | | | | 49.4 | |
| Retained interest in securitized off-balance sheet receivables(b) | | | (1.4 | ) | | | (9.5 | ) | | | (13.0 | ) |
| Adjustments for cash and cash equivalents | | | (17.9 | ) | | | (12.7 | ) | | | (15.7 | ) |
| Fair value hedge accounting adjustments | | | (1.6 | ) | | | (3.2 | ) | | | (4.7 | ) |
| | |
| | |
| | |
| |
| | Total adjusted debt | | $ | 131.6 | | | $ | 156.6 | | | $ | 165.7 | |
| | |
| | |
| | |
| |
| Total stockholder’s equity (including minority interest) | | $ | 10.7 | | | $ | 11.5 | | | $ | 12.5 | |
| Fair value hedge accounting adjustments | | | (0.0 | ) | | | (0.1 | ) | | | 0.2 | |
| | |
| | |
| | |
| |
| | Total adjusted equity | | $ | 10.7 | | | $ | 11.4 | | | $ | 12.7 | |
| | |
| | |
| | |
| |
| Managed leverage (to 1) | | | 12.3 | | | | 13.7 | | | | 13.0 | |
| | |
| | (a) | Includes securitized funding from discontinued operations in 2003 and 2004 |
| |
| | (b) | Includes retained interest in securitized receivables from discontinued operations in 2003 and 2004 |
We believe that managed leverage is useful to our investors because it reflects the way we manage our business. We retain interests in receivables sold in off-balance sheet securitization transactions and, with respect to subordinated retained interests, are exposed to credit risk. Accordingly, we consider securitization as an alternative source of funding and evaluate charge-offs, receivables and leverage on a managed as well as a financial statement basis. We also deduct cash and cash equivalents because they generally correspond to excess debt beyond the amount required to support our operations. In addition, we add our minority interests to our financial statement equity, because all of the debt of such consolidated entities is included in our total debt. We make fair value hedge accounting adjustments to our assets, debt and equity positions to reflect the impact of interest rate instruments we use in connection with our term-debt issuances and securitizations. The fair value hedge adjustments vary over the term of the underlying debt and securitized funding obligations based on changes in market interest rates. We generally repay our debt obligations as they mature. As a result, we exclude the impact of fair value hedge adjustments on both the numerator and denominator in order to exclude the interim effects of changes in market interest rates. For a discussion of our use of interest rate instruments and other derivatives, see Item 7A. We believe the managed leverage measure provides our investors with meaningful information regarding management’s decision-making processes.
Our managed leverage strategy involves establishing a leverage level that takes into consideration prevailing market conditions and reflects the risk characteristics of our business. At December 31, 2005, our managed leverage was 12.3 to 1, compared with 13.7 to 1 a year ago. We plan to continue to reduce our managed leverage in 2006. In 2005, we paid cash dividends of $2.75 billion.
39
| |
| ITEM 7. | MANAGEMENT’S DISCUSSION AND ANALYSIS OF FINANCIAL CONDITION AND RESULTS OF OPERATIONS (Continued) |
Aggregate Contractual Obligations
We are party to certain contractual obligations involving commitments to make payments to others. Most of these are debt obligations, which are recorded on our balance sheet and disclosed in our Notes to the Financial Statements. In addition, we enter into contracts with suppliers for purchases of certain services, including operating lease commitments. These arrangements may contain minimum levels of service requirements. Our aggregate contractual obligations as of December 31, 2005 are shown below:
| | | | | | | | | | | | | | | | | | | | | | |
| | |
| | Payments Due by Period | |
| |
| |
| | | | 2011 and | |
| | Total | | | 2006 | | | 2007-2008 | | | 2009-2010 | | | Thereafter | |
| |
| | |
| | |
| | |
| | |
| |
| | |
| | (in millions) | |
| Long-term debt obligations(a) | | $ | 102,664 | | | $ | 26,180 | | | $ | 44,016 | | | $ | 19,548 | | | $ | 12,920 | |
| Operating lease obligations | | | 209 | | | | 66 | | | | 97 | | | | 41 | | | | 5 | |
| Purchase obligations | | | 26 | | | | 20 | | | | 4 | | | | 2 | | | | — | |
| | |
| | |
| | |
| | |
| | |
| |
| | Total | | $ | 102,899 | | | $ | 26,266 | | | $ | 44,117 | | | $ | 19,591 | | | $ | 12,925 | |
| | |
| | |
| | |
| | |
| | |
| |
| | |
| | (a) | Principal obligations only |
For additional information on our long-term debt and operating lease obligations, see Notes 10 and 18 of our Notes to the Financial Statements.
Critical Accounting Estimates
We consider an accounting estimate to be critical if:
| | |
| | • | The accounting estimate requires us to make assumptions about matters that were highly uncertain at the time the accounting estimate was made, and |
| |
| | • | Changes in the estimate that are reasonably likely to occur from period to period, or use of different estimates that we reasonably could have used in the current period, would have a material impact on our financial condition or results of operations. |
The accounting estimates that are most important to our business involve:
| | |
| | • | Allowance for credit losses, |
| |
| | • | Accumulated depreciation on vehicles subject to operating leases, and |
| |
| | • | Off-balance sheet sales of receivables in securitizations and other transactions. |
Management has discussed the development and selection of these critical accounting estimates with Ford’s and our audit committees, and these audit committees have reviewed these estimates and disclosures.
Allowance for Credit Losses
The allowance for credit losses is our estimate of the credit losses related to impaired finance receivables and operating leases as of the date of the financial statements. We monitor credit loss performance monthly and we assess the adequacy of our allowance for credit losses quarterly. Because credit losses can vary substantially over time, estimating credit losses requires a number of assumptions about matters that are uncertain. Note 6 of our Notes to the Financial Statements contains additional information regarding our allowance for credit losses.
Nature of Estimates Required. We estimate the credit losses related to impaired finance receivables and operating leases by evaluating several factors including historical credit loss trends,
40
| |
| ITEM 7. | MANAGEMENT’S DISCUSSION AND ANALYSIS OF FINANCIAL CONDITION AND RESULTS OF OPERATIONS (Continued) |
the credit quality of our present portfolio, trends in historical and projected used vehicle values and general economic measures.
Assumptions Used. We make projections of two key assumptions:
| | |
| | • | Frequency — the number of finance receivables and operating lease contracts that we expect will default over a period of time, measured as repossessions; and |
| |
| | • | Loss severity — the expected difference between the amount a customer owes us when we charge off the finance contract and the amount we receive, net of expenses, from selling the repossessed vehicle, including any recoveries from the customer. |
We use these assumptions to assist us in setting our allowance for credit losses.
Sensitivity Analysis. Changes in the assumptions used to derive frequency and severity would affect the allowance for credit losses. For our Ford, Lincoln and Mercury brand U.S. retail and lease portfolio, a 10 basis point increase or decrease in our assessment of the repossession rate, which reflects the number of finance receivables and operating lease contracts that we expect will default over a period of time relative to the average number of contracts outstanding, could increase or decrease our allowance by about $40 million. Similarly, a one percent increase or decrease in loss severity for the same portfolio could increase or decrease our allowance by about $10 million. Changes in our assumptions affect theProvision for credit losseson our income statement and the allowance for credit losses contained withinFinance receivables, neton our balance sheet.
Accumulated Depreciation on Vehicles Subject to Operating Leases
Accumulated depreciation on vehicles subject to operating leases reduces the value of the leased vehicles in our operating lease portfolio from their original acquisition value to their expected residual value at the end of the lease term. See Note 5 of our Notes to the Financial Statements for information on net investment in operating leases, including the amount of accumulated depreciation.
We monitor residual values each month, and we review the adequacy of our accumulated depreciation on a quarterly basis. If we believe that the expected residual values for our vehicles have changed, we revise depreciation to ensure that our net investment in operating leases (equal to our acquisition value of the vehicles less accumulated depreciation) will be adjusted to reflect our revised estimate of the expected residual value at the end of the lease term. Such adjustments to depreciation expense would result in a change in the depreciation rates of the vehicles subject to operating leases, and are recorded on a straight-line basis.
Each lease customer has the option to buy the leased vehicle at the end of the lease or to return the vehicle to the dealer. If the customer returns the vehicle to the dealer, the dealer may buy the vehicle from us or return it to us. Over the last three years, between 280,000 and 450,000 units, or about 68% of Ford Credit’s North America operating lease vehicles have been returned to us.
Nature of Estimates Required. Each operating lease in our portfolio represents a vehicle we own that has been leased to a customer. At the time we purchase a lease, we establish an expected residual value for the vehicle. We estimate the expected residual value by evaluating historical auction values, historical return volumes for our leased vehicles, industry-wide used vehicle prices, our marketing plans and vehicle quality data.
41
| |
| ITEM 7. | MANAGEMENT’S DISCUSSION AND ANALYSIS OF FINANCIAL CONDITION AND RESULTS OF OPERATIONS (Continued) |
Assumptions Used. Our accumulated depreciation on vehicles subject to operating leases is based on our assumptions of:
| | |
| | • | Auction value — the market value of the vehicles when we sell them at the end of the lease, and |
| |
| | • | Return volumes — the number of vehicles that will be returned to us at lease end. |
Sensitivity Analysis. For returned vehicles, we face a risk that the amount we obtain from the vehicle sold at auction will be less than our estimate of the expected residual value for the vehicle. At year-end 2005, if future auction values for operating leases on Ford, Lincoln and Mercury brand vehicles in the United States were to decrease by one percent from our present estimates, the impact would be to increase our depreciation on these vehicles by about $40 million. Similarly, if return volumes for our existing portfolio of operating leases on Ford, Lincoln and Mercury brand vehicles in the United States were to increase by one percent from our present estimates, the impact would be to increase our depreciation on these vehicles by about $5 million. These increases in depreciation would be charged to depreciation expense during the 2006 through 2008 period so that the net investment in operating leases at the end of the lease term for these vehicles is equal to the revised expected residual value. Adjustments to the amount of accumulated depreciation on operating leases will be reflected on our balance sheet asNet investment in operating leasesand on the income statement inDepreciation on vehicles subject to operating leases.
Off-Balance Sheet Sales of Receivables in Securitizations and Other Transactions
In a securitization transaction, we sell finance receivables to an SPE in exchange for the proceeds from the sale of securities backed by the receivables that the SPE sells to investors. For off-balance sheet securitizations, we are required to recognize a gain or loss on the sale of receivables in the period the sale occurs. We also record our retained interests in these securitizations as assets on our balance sheet at fair value. These retained interests include residual interests in securitization transactions, which represent our right to receive collections on sold receivables in excess of amounts needed to pay principal and interest payments to investors, servicing fees and other required amounts. Retained interests may also include senior and subordinated securities and restricted cash held for the benefit of the SPE.
Nature of Estimates Required. In determining the gain or loss on each sale of finance receivables and the amount of our retained interests, we allocate the carrying amount of the sold receivables between the portion sold and the portion retained based on their relative fair value at the date of sale.
Assumptions Used. The most significant factors affecting the fair value of assets retained related to the sale of receivables through securitizations that requires us to make estimates and judgments are:
| | |
| | • | Expected credit losses over the life of the sold receivables, called lifetime credit losses; |
| |
| | • | Prepayments of sold receivables occurring earlier than scheduled maturities, called prepayment speeds; and |
| |
| | • | Discount rates used to estimate the present value of residual interest in securitization transactions. |
To estimate expected lifetime credit losses on the sold receivables, we use statistical models that divide receivables into segments by credit risk quality, contractual term and whether the vehicle financed is new or used. We make estimates based on our historical experience and other factors
42
| |
| ITEM 7. | MANAGEMENT’S DISCUSSION AND ANALYSIS OF FINANCIAL CONDITION AND RESULTS OF OPERATIONS (Continued) |
regarding prepayment speeds and discount rates. These estimates are made separately for each securitization transaction.
We evaluate the fair value of our retained interests on a quarterly basis and adjust the estimated market value as necessary. These fair value adjustments are reflected, net of tax, as a separate component of other comprehensive income included in stockholder’s equity. The fair value analysis for our residual interest in securitization transactions largely depends on updating our estimate of lifetime credit losses and prepayment speeds. If we determine, based on this updated information, these retained interests are other than temporarily impaired, we would record fair value adjustments in earnings and not stockholder’s equity. The fair value of senior and subordinated securities we retain is based on quoted market prices of securities with similar characteristics. The recorded amount of our restricted cash retained interest normally does not have to be adjusted.
Sensitivity Analysis. The fair value of the residual interest in securitization transactions is sensitive to variation in our assumptions of lifetime credit losses, estimated prepayments and discount rates. Note 7 of our Notes to the Financial Statements identifies the sensitivity of this asset to changes in each of these assumptions. Changes in these assumptions will also result in a similar change in the gain or loss recorded in the time period the related receivables are sold.
Accounting Standards Issued But Not Yet Adopted
In May 2005, the Financial Accounting Standards Board (“FASB”) issued Statement of Financial Accounting Standards No. 154 (“SFAS 154”),Accounting Changes and Error Corrections — a replacement of APB Opinion No. 20 and FASB Statement No. 3. This statement changes the requirements for accounting and reporting of a voluntary change in accounting principle and changes required by an accounting pronouncement when the specific transition provisions are absent. This statement requires retrospective application to prior periods’ financial statements of changes in accounting principle. If it is impracticable to determine either the period-specific effects or the cumulative effect of the change, this statement requires that the new accounting principle be adopted prospectively from the earliest practicable date. SFAS 154 is effective in fiscal years beginning after December 15, 2005. We do not expect any impact on our financial position or results of operations.
Outlook
In 2006, we expect our earnings to be lower than our earnings in 2005 primarily resulting from the impact of lower receivable levels and the impact of higher interest rates. At year-end 2006, we anticipate managed receivables to be in the range of $140 to $145 billion.
Cautionary Statement Regarding Forward Looking Statements
Statements included or incorporated by reference herein may constitute “forward-looking statements” within the meaning of the Private Securities Litigation Reform Act of 1995. Forward-looking statements are based on expectations, forecasts and assumptions by our management and involve a number of risks, uncertainties, and other factors that could cause actual results to differ materially from those stated, including, without limitation, those set forth in Item 1A.
We cannot be certain that any expectations, forecasts or assumptions made by management in preparing these forward-looking statements will prove accurate, or that any projections will be realized. It is to be expected that there may be differences between projected and actual results. Our forward-looking statements speak only as of the date of their initial issuance, and we do not undertake any obligation to update or revise publicly any forward-looking statements, whether as a result of new information, future events or otherwise.
43
| |
| ITEM 7A. | QUANTITATIVE AND QUALITATIVE DISCLOSURES ABOUT MARKET RISK |
Overview
We are exposed to a variety of risks in the normal course of our business. The extent to which we effectively identify, assess, monitor and manage these risks is critical to our financial condition and profitability. The principal types of risk to our business include:
| | |
| | • | Market risk — the possibility that changes in interest and currency exchange rates will adversely impact our income; |
| |
| | • | Counterparty risk — the possibility that a counterparty may default on a derivative contract or cash deposit; |
| |
| | • | Credit risk — the possibility of loss from a customer’s failure to make payments according to contract terms; |
| |
| | • | Residual risk — the possibility that the actual proceeds we receive at lease termination will be lower than our projections or return volumes will be higher than our projections; |
| |
| | • | Liquidity risk — the possibility that we may be unable to meet all of our current and future obligations in a timely manner; and |
| |
| | • | Operating risk — the possibility of fraud by our employees or outside persons, errors relating to transaction processing and systems and actions that could result in compliance deficiencies with regulatory standards or contractual obligations. |
We manage each of these types of risk in the context of its contribution to our overall global risk. We make business decisions on a risk-adjusted basis and price our services consistent with these risks.
Credit, residual and liquidity risks are discussed in Items 1 and 7. A discussion of market risk (including currency and interest rate risk), counterparty risk and operating risk follows.
Market Risk
Given the unpredictability of financial markets, we seek to reduce volatility in our operating results from changes in interest rates and currency exchange rates. We use various financial instruments, commonly referred to as derivatives, to manage market risks. We do not engage in any trading, market-making, or other speculative activities in the derivative markets.
Our strategies to manage market risks are established by the Ford Global Risk Management Committee (“GRMC”). The GRMC is chaired by the Chief Financial Officer of Ford, and includes the Treasurer of Ford and our Chief Financial Officer.
Direct responsibility for the execution of our market risk management strategies resides with Ford’s Treasurer’s Office and is governed by written policies and procedures. Separation of duties is maintained between the strategy and approval of derivative trades, the execution of derivatives trades and the settlement of cash flows. Regular audits are conducted to ensure that appropriate controls are in place and that these controls are effective. In addition, the GRMC and the audit committee of Ford and Ford Credit’s Boards of Directors review our market risk exposures and use of derivatives to manage these exposures.
Currency Exchange Rate Risk
Our policy is to minimize exposure to our operating results from changes in currency exchange rates. To meet funding objectives, we borrow in a variety of currencies, principally U.S. dollars and Euros. We face exposure to currency exchange rates if a mismatch exists between the currency of our receivables and the currency of the debt funding those receivables. When possible, we fund receivables with debt in the same currency, minimizing exposure to exchange rate movements.
44
| |
| ITEM 7A. | QUANTITATIVE AND QUALITATIVE DISCLOSURES ABOUT MARKET RISK (Continued) |
When a different currency is used, we execute the following foreign currency derivatives to convert substantially all of our foreign currency debt obligations to the local country currency of the receivables:
| | |
| | • | Cross-currency swaps — an agreement to convert non-U.S. dollar long-term debt to U.S. dollar denominated payments or non-local market debt to local market debt for our international affiliates; or |
| |
| | • | Foreign currency forwards — an agreement to buy or sell an amount of funds in an agreed currency at a certain time in the future for a certain price. |
As a result of this policy, we believe our market risk exposure relating to changes in currency exchange rates is immaterial. For additional information on our derivatives, see “Derivative Notional Values” and “Derivative Fair Values”, and Notes 1 and 12 of our Notes to the Financial Statements.
Interest Rate Risk
Nature of Exposure
Our primary market risk exposure is interest rate risk, and the particular market to which we are most exposed is U.S. dollar LIBOR. Our interest rate risk exposure results principally from “re-pricing risk” or differences in the re-pricing characteristics of assets and liabilities. An instrument’s re-pricing period is a term used to describe how an interest rate-sensitive instrument responds to changes in interest rates. It refers to the time it takes an instrument’s interest rate to reflect a change in market interest rates. For fixed-rate instruments, the re-pricing period is equal to the maturity of the instrument’s principal, because the principal is considered to re-price only when re-invested in a new instrument. For a floating-rate instrument, the re-pricing period is the period of time before the interest rate adjusts to the market rate. For instance, a floating-rate loan whose interest rate is reset to a market index annually on December 31 would have a re-pricing period of one year on January 1, regardless of the instrument’s maturity.
Re-pricing risk arises when assets and the debt funding those assets have different re-pricing periods, and consequently, respond differently to changes in interest rates. As an example, consider a hypothetical portfolio of fixed-rate assets that is funded with floating-rate debt. If interest rates increase, the interest paid on debt increases while the interest received on assets remains fixed. In this case, the hypothetical portfolio’s pre-tax net interest income is exposed to changes in interest rates because its assets and debt have a re-pricing mismatch.
Our receivables consist primarily of fixed-rate retail installment sale and lease contracts and floating-rate wholesale receivables. Fixed-rate retail installment sale and lease contracts are originated principally with maturities ranging between two and six years and generally require customers to make equal monthly payments over the life of the contract. Wholesale receivables are originated to finance new and used vehicles held in dealers’ inventory and generally require dealers to pay a floating rate.
Funding sources consist primarily of sales of receivables in securitizations and short- and long-term unsecured debt. In the case of unsecured term debt, and in an effort to have funds available throughout business cycles, we may borrow at terms longer than the terms of our assets, with five to ten year maturities. These debt instruments are principally fixed-rate and require fixed and equal interest payments over the life of the instrument and a single principal payment at maturity.
We are exposed to interest rate risk to the extent that a difference exists between the re-pricing profile of our assets and our debt. Specifically, without derivatives, our assets would re-price more quickly than our debt.
45
| |
| ITEM 7A. | QUANTITATIVE AND QUALITATIVE DISCLOSURES ABOUT MARKET RISK (Continued) |
Risk Management Objective
Our interest rate risk management objective is to maximize our financing income while limiting the impact of changes in interest rates. We achieve this objective by setting an established risk tolerance range and staying within the tolerance through the following risk management process.
Risk Management Process
Our risk management process involves a short-term and a long-term evaluation of interest rate risk by considering potential impacts on our pre-tax net interest income as well as the economic value of our portfolio of interest rate-sensitive assets and liabilities (our economic value). Our economic value is a measure of the present value of all future expected cash flows, discounted by market interest rates, and is equal to the present value of our interest rate-sensitive assets minus the present value of our interest rate-sensitive liabilities. Measuring the impact on our economic value is important because it captures the potential long-term effects of changes in interest rates.
The financial instruments used in our interest rate risk management process are called interest rate swaps; interest rate swaps are agreements to convert fixed-rate interest payments to floating or floating-rate interest payments to fixed. Interest rate swaps are a common tool used by financial institutions to manage interest rate risk. For additional information on our derivatives, see “Derivative Notional Values” and “Derivative Fair Values”, and Notes 1 and 12 of our Notes to the Financial Statements.
On a monthly basis, we determine the sensitivity of our economic value to hypothetical changes in interest rates. We then enter into interest rate swaps, effectively converting portions of our floating-rate debt to fixed or our fixed-rate debt to floating, to ensure that the sensitivity of our economic value falls within an established target. As part of our monthly process, we also monitor the sensitivity of our pre-tax net interest income to interest rates by using pre-tax net interest income simulation techniques. These simulations estimate the one-year pre-tax net interest income of our portfolio of interest rate-sensitive assets and liabilities under various interest rate scenarios, including both parallel and non-parallel shifts in the yield curve. These quantifications of interest rate risk are reported monthly to the Treasurer of Ford and our Chief Financial Officer.
The process described above is used to measure and manage the interest rate risk of our operations in the United States, Canada and the United Kingdom, which together represented approximately 80% of our total on-balance sheet finance receivables at December 31, 2005. For our other international affiliates, we use a technique, commonly referred to as “gap analysis,” to measure re-pricing mismatch. This process uses re-pricing schedules that group assets, debt, and swaps into discrete time-bands based on their re-pricing characteristics. We then enter into interest rate swaps, which effectively change the re-pricing profile of our debt, to ensure that any re-pricing mismatch (between assets and liabilities) existing in a particular time-band falls within an established tolerance.
Quantitative Disclosure
As a result of our interest rate risk management process, including derivatives, our debt re-prices faster than our assets. Other things equal, this means that during a period of rising interest rates, the interest rates paid on our debt will increase more rapidly than the interest rates earned on our assets, thereby initially reducing our pre-tax net interest income. Correspondingly, during a period of falling interest rates, we would expect our pre-tax net interest income to initially increase. To provide a quantitative measure of the sensitivity of our pre-tax net interest income to changes in interest rates, we use interest rate scenarios that assume a hypothetical, instantaneous increase or decrease in interest rates of one percentage point across all maturities (a “parallel shift”), as well as
46
| |
| ITEM 7A. | QUANTITATIVE AND QUALITATIVE DISCLOSURES ABOUT MARKET RISK (Continued) |
a base case that assumes that interest rates remain constant at existing levels. These interest rate scenarios are purely hypothetical and do not represent our view of future interest rate movements. The differences in pre-tax net interest income between these scenarios and the base case over a twelve-month period represent an estimate of the sensitivity of our pre-tax net interest income. This sensitivity as of year-end 2005 and 2004 was as follows:
| | | | | | | | | |
| | Pre-Tax Net Interest Income | | | Pre-Tax Net Interest Income | |
| | impact given a one percentage | | | impact given a one percentage | |
| | point instantaneousincrease | | | point instantaneousdecrease | |
| | in interest rates | | | in interest rates | |
| |
| | |
| |
| | |
| | (in millions) | |
| December 31, 2005 | | $ | (40 | ) | | $ | 40 | |
| December 31, 2004 | | | (93 | ) | | | 93 | |
Based on assumptions included in the analysis, our sensitivity to a one-percentage point instantaneous change in interest rates was lower at year-end 2005 than at year-end 2004. This change primarily reflects the result of normal fluctuations within the approved tolerances of our risk management strategy.
The sensitivity analysis presented above assumes a one-percentage point interest rate change to the year-end yield curve that is both instantaneous and parallel. In reality, interest rate changes are rarely instantaneous or parallel and rates could move more or less than the one percentage point assumed in our analysis. As a result, the actual impact to pre-tax net interest income could be higher or lower than the results detailed above.
Additional Model Assumptions
While the sensitivity analysis presented is our best estimate of the impacts of the specified assumed interest rate scenarios, our actual results could differ from those projected. The model we use to conduct this analysis is heavily dependent on assumptions. Embedded in the model are assumptions regarding the reinvestment of maturing asset principal, refinancing of maturing debt, and predicted repayment of retail installment sale and lease contracts ahead of contractual maturity. Our repayment projections ahead of contractual maturity are based on historical experience. If interest rates or other factors change, our actual prepayment experience could be different than projected. In addition, as noted previously, the sensitivity analysis presented assumes interest rate changes are instantaneous, parallel shifts in the yield curve. In reality, changes are rarely instantaneous or parallel. We have presented our sensitivity analysis in this Report on a pre-tax rather than an after-tax basis, to exclude the potentially distorting impact of assumed tax rates.
47
| |
| ITEM 7A. | QUANTITATIVE AND QUALITATIVE DISCLOSURES ABOUT MARKET RISK (Continued) |
Derivative Notional Values
The outstanding notional value of our derivatives at the end of each of the years indicated was as follows:
| | | | | | | | | | | |
| | |
| | December 31, | |
| |
| |
| | 2005 | | | 2004 | |
| |
| | |
| |
| | |
| | (in billions) | |
| Interest rate swaps | | | | | | | | |
| | Pay-fixed, receive-floating | | $ | 30 | | | $ | 34 | |
| | Pay-floating, receive-fixed, excluding securitization swaps | | | 36 | | | | 49 | |
| | Pay-floating, receive-floating (basis), excluding securitization swaps | | | * | | | | * | |
| | Securitization swaps | | | 59 | | | | 52 | |
| | |
| | |
| |
| | | Total interest rate swaps | | $ | 125 | | | $ | 135 | |
| Other Derivatives | | | | | | | | |
| | Cross-currency swaps | | | 16 | | | | 24 | |
| | Foreign currency forwards | | | 9 | | | | 6 | |
| | Interest rate forwards | | | * | | | | 1 | |
| | |
| | |
| |
| | | Total notional value | | $ | 150 | | | $ | 166 | |
| | |
| | |
| |
| | |
| | * | Less than $500 million. |
The derivatives identified above as securitization swaps are interest rate swaps we entered into to facilitate certain of our securitization transactions. Under these swap agreements, we pay a floating-rate interest payment and, depending on the related securitization transaction, receive either a fixed-rate interest payment or a floating rate interest payment with a different market index. The sensitivity analysis presented above includes all derivatives, including our securitization swaps.
At December 31, 2005, our total derivative notional value was $150 billion, approximately $16 billion lower than a year ago. The decline in pay-fixed, receive-floating notionals primarily reflected lower asset levels in 2005. The decline in both the pay-float, receive-fixed and cross-currency swap notionals primarily reflected underlying debt maturities that were not replaced due to lower asset levels in 2005. The increase in securitization swap notional from year-end 2004 to year-end 2005 primarily reflected an increase in securitization transactions during 2005. The increase in foreign currency forwards primarily reflected higher balances on short-term loans among our operations.
Derivative Fair Values
The fair value of net derivative financial instruments (derivative assets less derivative liabilities) as reported on our balance sheet as of December 31, 2005 was $1.9 billion, approximately $4.2 billion lower than a year ago. This decrease primarily reflected weakening of foreign currencies relative to the U.S. dollar, primarily Euro, British Pound and Yen, the maturity of swaps that were in the money, and lower mark-to-market adjustments resulting from interest rate changes. For additional information see Notes 1 and 12 of our Notes to the Financial Statements.
Counterparty Risk
The use of derivatives to manage market risk results in counterparty risk, which is the loss we could incur if a counterparty defaulted on a derivative contract. Ford enters into master agreements with its counterparties that allow netting of certain exposures in order to manage this risk. Exposures primarily relate to derivative contracts used for managing interest rate and foreign currency exchange
48
ITEM 7A. QUANTITATIVE AND QUALITATIVE DISCLOSURES ABOUT MARKET RISK (Continued)
rate risk. We, on a combined basis with Ford, establish exposure limits for each counterparty to minimize risk and provide counterparty diversification.
Our approach to managing counterparty risk is forward-looking and proactive, allowing us to take risk mitigation actions before risks become losses. We establish exposure limits for both net fair value and future potential exposure, based on our overall risk tolerance and ratings-based historical default probabilities. The exposure limits are lower for lower-rated counterparties and for longer-dated exposures. We use a Monte Carlo simulation technique to assess our potential exposure by tenor, defined at 95% confidence level. We monitor and report our exposures to the Treasurer of Ford on a monthly basis.
Substantially all of our counterparty exposures are with counterparties that have long-term credit ratings of single-A or better. Our guideline for counterparty minimum long-term credit ratings is BBB-. Exceptions to these guidelines require prior approval by management.
For additional information on our derivatives, see “Derivative Notional Values” and “Derivative Fair Values”, and Notes 1 and 12 of our Notes to the Financial Statements.
Operating Risk
We operate in many locations and rely on the abilities of our employees and computer systems to process a large number of transactions. Improper employee actions or improper operation of systems could result in financial loss, regulatory action and damage to our reputation, and breech of contractual obligations. To address this risk, we maintain internal control processes that identify transaction authorization requirements, safeguard assets from misuse or theft, and protect the reliability of financial and other data. We also maintain system controls to maintain the accuracy of information about our operations. These controls are designed to manage operating risk throughout our operation.
| |
| ITEM 8. | FINANCIAL STATEMENTS AND SUPPLEMENTARY DATA |
Our Financial Statements, the accompanying Notes and the Report of Independent Registered Public Accounting Firm that are filed as part of this Report are listed under Item 15, “Exhibits and Financial Statement Schedules” and are set forth on pages FC-1 through FC-37 immediately following the signature pages of this Report.
Selected quarterly financial data (unaudited) for us and our consolidated subsidiaries for 2005 and 2004 are disclosed in Note 17 of the Notes to the Financial Statements.
| |
| ITEM 9. | CHANGES IN AND DISAGREEMENTS WITH ACCOUNTANTS ON ACCOUNTING AND FINANCIAL DISCLOSURE |
Not required.
49
| |
| ITEM 9A. | CONTROLS AND PROCEDURES |
Evaluation of Disclosure Controls and Procedures
Michael E. Bannister, our Chief Executive Officer, and David P. Cosper, our Vice Chairman, Chief Financial Officer and Treasurer, have performed an evaluation of the Company’s disclosure controls and procedures, as that term is defined in Rule 13a-15(e) of the Securities Exchange Act of 1934, as amended (the “Exchange Act”), as of December 31, 2005 and each has concluded that such disclosure controls and procedures are effective to ensure that information required to be disclosed in our periodic reports filed under the Exchange Act is recorded, processed, summarized and reported within the time periods specified by the Securities and Exchange Commission’s rules and regulations.
Management’s Report on Internal Control Over Financial Reporting
Our management is responsible for establishing and maintaining adequate internal control over financial reporting, as such term is defined in Exchange Act Rule 13a-15(f). The Company’s internal control system was designed to provide reasonable assurance to the Company’s management and Board of Directors regarding the reliability of financial reporting and the preparation and fair presentation of its published consolidated financial statements.
All internal control systems, no matter how well designed, have inherent limitations. Therefore, even those systems determined to be effective may not prevent or detect misstatements, and can provide only reasonable assurance with respect to financial statement preparation and presentation. Also, projections of any evaluation of effectiveness to future periods are subject to the risk that controls may become inadequate because of changes in conditions, or that the degree of compliance with the policies or procedures may deteriorate.
Under the supervision and with the participation of our management, including our chief executive officer and chief financial officer, the Company conducted an assessment of the effectiveness of its internal control over financial reporting as of December 31, 2005. The assessment was based on criteria established in the frameworkInternal Control — Integrated Framework, issued by the Committee of Sponsoring Organizations of the Treadway Commission. Based on this assessment, management concluded that our internal control over financial reporting was effective as of December 31, 2005. Management’s assessment of the effectiveness of the Company’s internal control over financial reporting as of December 31, 2005 has been audited by PricewaterhouseCoopers LLP (“PwC”), an independent registered public accounting firm, as stated in their report included herein.
Changes in Internal Control Over Financial Reporting
There were no changes in internal control over financial reporting during the fourth quarter of 2005 that have materially affected, or are reasonably likely to materially affect, our internal control over financial reporting.
ITEM 9B. OTHER INFORMATION
None.
50
PART III
| |
| ITEM 14. | PRINCIPAL ACCOUNTING FEES AND SERVICES |
| | | | | | | | | | |
| | |
| | Full Year | |
| |
| |
| Nature of Services | | 2005 | | | 2004 | |
| |
| | |
| |
| | |
| | (in millions) | |
Audit fees — for audit of the annual financial statements included in our annual report on Form 10-K, reviews of the financial statements included in our quarterly reports on Form 10-Q, and audit of our internal control over financial reporting | | $ | 6.9 | | | $ | 7.9 | |
Audit-related fees — for services reasonably related to the performance of the audit or review of our financial statements and internal control over financial reporting, and services related to business acquisitions and divestitures | | | 2.1 | | | | 1.4 | |
Tax fees — for compliance, tax advice and tax planning | | | 1.4 | | | | 1.5 | |
All other fees | | | — | | | | — | |
| | |
| | |
| |
| | Total fees | | $ | 10.4 | | | $ | 10.8 | |
| | |
| | |
| |
Pre-Approval Policies and Procedures
Ford’s audit committee has established pre-approval policies and procedures that govern the engagement of PwC, and the services provided by PwC to Ford Credit are pre-approved in accordance with Ford’s policies and procedures. The policies and procedures are detailed as to the particular services and our audit committee is informed of the services provided to us by PwC, including the audit fee requests for these services that have been submitted to and approved by Ford’s audit committee. The pre-approval policies and procedures do not include delegation of the Ford or Ford Credit audit committees’ responsibilities under the Securities Exchange Act of 1934, as amended, to management.
51
PART IV
| |
| ITEM 15. | EXHIBITS AND FINANCIAL STATEMENT SCHEDULES |
(a) 1.Financial Statements
| |
| | Report of Independent Registered Public Accounting Firm |
| |
| | Ford Motor Credit Company and Subsidiaries |
| |
| | Consolidated Statement of Income for the Years Ended December 31, 2005, 2004 and 2003 |
| |
| | Consolidated Balance Sheet, December 31, 2005 and 2004 |
| |
| | Consolidated Statement of Stockholder’s Equity, December 31, 2005, 2004 and 2003 |
| |
| | Consolidated Statement of Cash Flows from Continuing Operations for the Years Ended December 31, 2005, 2004 and 2003 |
| |
| | Notes to the Financial Statements |
The Consolidated Financial Statements, the Notes to the Financial Statements and the Report of Independent Registered Public Accounting Firm listed above are filed as part of this report and are set forth on pages FC-1 through FC-37 immediately following the signature pages of this report.
(a) 2.Financial Statement Schedules
Schedules have been omitted because the information required to be contained in them is disclosed elsewhere in the Financial Statements or the amounts involved are not sufficient to require submission.
(a) 3.Exhibits
| | | | | |
| Designation | | Description | | Method of Filing |
| |
| |
|
| Exhibit 3-A | | Restated Certificate of Incorporation of Ford Motor Credit Company. | | Filed as Exhibit 3-A to Ford Motor Credit Company Report on Form 10-K for the year ended December 31, 1987 and incorporated herein by reference. File No. 1-6368. |
| Exhibit 3-B | | By-Laws of Ford Motor Credit Company as amended through March 1, 2006. | | Filed with this Report. |
| Exhibit 4-A | | Form of Indenture dated as of February 1, 1985 between Ford Motor Credit Company and Manufacturers Hanover Trust Company relating to Debt Securities. | | Filed as Exhibit 4-A to Ford Motor Credit Company Registration Statement No. 2-95568 and incorporated herein by reference. |
| Exhibit 4-A-1 | | Form of First Supplemental Indenture dated as of April 1, 1986 between Ford Motor Credit Company and Manufacturers Hanover Trust Company supplementing the Indenture designated as Exhibit 4-A. | | Filed as Exhibit 4-B to Ford Motor Credit Company Current Report on Form 8-K dated April 29, 1986 and incorporated herein by reference. File No. 1-6368. |
| Exhibit 4-A-2 | | Form of Second Supplemental Indenture dated as of September 1, 1986 between Ford Motor Credit Company and Manufacturers Hanover Trust Company supplementing the Indenture designated as Exhibit 4-A. | | Filed as Exhibit 4-B to Ford Motor Credit Company Current Report on Form 8-K dated August 28, 1986 and incorporated herein by reference. File No. 1-6368. |
52
ITEM 15. EXHIBITS AND FINANCIAL STATEMENT SCHEDULES (Continued)
| | | | | |
| Designation | | Description | | Method of Filing |
| |
| |
|
| Exhibit 4-A-3 | | Form of Third Supplemental Indenture dated as of March 15, 1987 between Ford Motor Credit Company and Manufacturers Hanover Trust Company supplementing the Indenture designated as Exhibit 4-A. | | Filed as Exhibit 4-E to Ford Motor Credit Company Registration Statement No. 33-12928 and incorporated herein by reference. |
| Exhibit 4-A-4 | | Form of Fourth Supplemental Indenture dated as of April 15, 1988 between Ford Motor Credit Company and Manufacturers Hanover Trust Company supplementing the Indenture designated as Exhibit 4-A. | | Filed as Exhibit 4-F to Post-Effective Amendment No. 1 to Ford Motor Credit Company Registration Statement No. 33-20081 and incorporated herein by reference. |
| Exhibit 4-A-5 | | Form of Fifth Supplemental Indenture dated as of September 1, 1990 between Ford Motor Credit Company and Manufacturers Hanover Trust Company supplementing the Indenture designated as Exhibit 4-A. | | Filed as Exhibit 4-G to Ford Motor Credit Company Registration Statement No. 33-36946 and incorporated herein by reference. |
| Exhibit 4-A-6 | | Form of Sixth Supplemental Indenture dated as of June 1, 1998 between Ford Motor Credit Company and The Chase Manhattan Bank supplementing the Indenture designated as Exhibit 4-A. | | Filed as Exhibit 4.1 to Ford Motor Credit Company Current Report on Form 8-K dated June 15, 1998 and incorporated herein by reference. File No. 1-6368. |
| Exhibit 4-A-7 | | Form of Seventh Supplemental Indenture dated as of January 15, 2002 between Ford Motor Credit Company and JPMorgan Chase Bank supplementing the Indenture. | | Filed as Exhibit 4-I to Amendment No. 1 to Ford Motor Credit Company Registration Statement No. 333-75274 and incorporated herein by reference. |
| Exhibit 4-B | | Indenture dated as of November 1, 1987 between Ford Motor Credit Company and Continental Bank, National Association relating to Debt Securities. | | Filed as Exhibit 4-A to Ford Motor Credit Company Current Report on Form 8-K dated December 10, 1990 and incorporated herein by reference. File No. 1-6368. |
| Exhibit 4-C | | Indenture dated as of August 1, 1994 between Ford Motor Credit Company and First Union National Bank relating to Debt Securities. | | Filed as Exhibit 4-A to Ford Motor Credit Company Registration Statement No. 33-55237. |
| Exhibit 10-A | | Copy of Amended and Restated Profit Maintenance Agreement dated as of January 1, 2002 between Ford Motor Credit Company and Ford Motor Company. | | Filed as Exhibit 10-A to Ford Motor Credit Company Report on Form 10-K for the year ended December 31, 2001 and incorporated herein by reference. File No. 1-6368. |
| Exhibit 10-B | | Copy of Agreement dated as of February 1, 1980 between Ford Motor Company and Ford Motor Credit Company. | | Filed as Exhibit 10-X to Ford Motor Credit Company Report on Form 10-K for the year ended December 31, 1980 and incorporated herein by reference. File No. 1-6368. |
| Exhibit 10-C | | Copy of Agreement dated as of October 18, 2001 between Ford Motor Credit Company and Ford Motor Company. | | Filed as Exhibit 10 to Ford Motor Credit Company Current Report on Form 8-K dated October 18, 2001 and incorporated by reference. File No. 1-6368. |
53
ITEM 15. EXHIBITS AND FINANCIAL STATEMENT SCHEDULES (Continued)
| | | | | |
| Designation | | Description | | Method of Filing |
| |
| |
|
| Exhibit 10-D | | Copy of Amended and Restated Support Agreement as of September 20, 2004 between Ford Motor Credit Company and FCE Bank plc. | | Filed as Exhibit 10 to Ford Motor Credit Company Report on Form 10-Q for the quarter ended September 30, 2004 and incorporated herein by reference. File No. 1-6368. |
| Exhibit 12 | | Ford Motor Credit Company and Subsidiaries Calculation of Ratio of Earnings to Fixed Charges | | Filed with this Report |
| Exhibit 23 | | Consent of Independent Registered Public Accounting Firm | | Filed with this Report |
| Exhibit 24 | | Powers of Attorney | | Filed with this Report |
| Exhibit 31.1 | | Rule 15d-14(a) Certification of CEO | | Filed with this Report |
| Exhibit 31.2 | | Rule 15d-14(a) Certification of CFO | | Filed with this Report |
| Exhibit 32.1 | | Section 1350 Certification of CEO | | Furnished with this Report |
| Exhibit 32.2 | | Section 1350 Certification of CFO | | Furnished with this Report |
| Exhibit 99 | | Parts I, II (other than Item 8) and III of Ford Motor Company’s Annual Report on Form 10-K for the year ended December 31, 2005 | | Incorporated herein by reference to Ford Motor Company’s Annual Report on Form 10-K for the year ended December 31, 2005. File No. 1-3950. |
Instruments defining the rights of holders of certain issues of long-term debt of Ford Credit have not been filed as exhibits to this Report because the authorized principal amount of any one of such issues does not exceed 10% of the total assets of Ford Credit. Ford Credit will furnish a copy of each such instrument to the Commission upon request.
54
SIGNATURES
Pursuant to the requirements of Section 13 or 15(d) of the Securities Exchange Act of 1934, Ford Motor Credit Company has duly caused this Report to be signed on its behalf by the undersigned, thereunto duly authorized.
| |
| | FORD MOTOR CREDIT COMPANY |
| |
| |
|
| | (David P. Cosper) |
| | Vice Chairman, |
| | Chief Financial Officer and Treasurer |
Date: March 1, 2006
Pursuant to the requirements of the Securities Exchange Act of 1934, this Report has been signed below by the following persons on behalf of Ford Credit and in the capacities on the date indicated.
| | | | | | | |
| | | | |
| Signature | | Title | | Date |
| |
| |
|
| |
/s/ MICHAEL E. BANNISTER*
(Michael E. Bannister) | | Director, Chairman of the Board and Chief Executive Officer (principal executive officer) | | March 1, 2006 |
| |
/s/ DAVID P. COSPER*
(David P. Cosper) | | Director, Vice Chairman, Chief Financial Officer and Treasurer (principal financial officer and principal accounting officer) | | March 1, 2006 |
| |
/s/ TERRY D. CHENAULT*
(Terry D. Chenault) | | Director and Executive Vice President — President, Global Operations | | March 1, 2006 |
| |
/s/ JAMES C. GOUIN*
(James C. Gouin) | | Director and Audit Committee Member | | March 1, 2006 |
| |
/s/ DONAT R. LECLAIR*
(Donat R. Leclair, Jr.) | | Director and Audit Committee Chairman | | March 1, 2006 |
| |
/s/ JOHN T. NOONE*
(John T. Noone) | | Director and Executive Vice President — President, Ford Credit International | | March 1, 2006 |
| |
/s/ ANN MARIE PETACH*
(Ann Marie Petach) | | Director and Audit Committee Member | | March 1, 2006 |
| |
/s/ RICHARD C. VAN LEEUWEN*
(Richard C. Van Leeuwen) | | Director and Executive Vice President — Risk Management | | March 1, 2006 |
55
| | | | | | | |
| | | | |
| Signature | | Title | | Date |
| |
| |
|
| |
/s/ A. J. WAGNER*
(A. J. Wagner) | | Director and Executive Vice President — President, Ford Credit North America | | March 1, 2006 |
| |
| *By | | /s/ COREY M. MACGILLIVRAY
(Corey M. MacGillivray) | | Attorney-in-Fact | | March 1, 2006 |
56
REPORT OF INDEPENDENT REGISTERED PUBLIC ACCOUNTING FIRM
To the Board of Directors and Stockholder of
Ford Motor Credit Company:
We have completed integrated audits of Ford Motor Credit Company’s 2005 and 2004 consolidated financial statements and of its internal control over financial reporting as of December 31, 2005, and an audit of its 2003 consolidated financial statements in accordance with the standards of the Public Company Accounting Oversight Board (United States). Our opinions, based on our audits, are presented below.
Consolidated financial statements
In our opinion, the accompanying consolidated balance sheets and the related consolidated statements of income, stockholder’s equity and cash flows present fairly, in all material respects, the financial position of Ford Motor Credit Company and its subsidiaries at December 31, 2005 and December 31, 2004, and the results of their operations and their cash flows for each of the three years in the period ended December 31, 2005 in conformity with accounting principles generally accepted in the United States of America. These financial statements are the responsibility of the Company’s management. Our responsibility is to express an opinion on these financial statements based on our audits. We conducted our audits of these statements in accordance with the standards of the Public Company Accounting Oversight Board (United States). Those standards require that we plan and perform the audit to obtain reasonable assurance about whether the financial statements are free of material misstatement. An audit of financial statements includes examining, on a test basis, evidence supporting the amounts and disclosures in the financial statements, assessing the accounting principles used and significant estimates made by management, and evaluating the overall financial statement presentation. We believe that our audits provide a reasonable basis for our opinion.
Internal control over financial reporting
Also, in our opinion, management’s assessment, included in Management’s Report on Internal Control Over Financial Reporting appearing under Item 9A, that the Company maintained effective internal control over financial reporting as of December 31, 2005 based on criteria established inInternal Control — Integrated Frameworkissued by the Committee of Sponsoring Organizations of the Treadway Commission (COSO), is fairly stated, in all material respects, based on those criteria. Furthermore, in our opinion, the Company maintained, in all material respects, effective internal control over financial reporting as of December 31, 2005, based on criteria established inInternal Control — Integrated Frameworkissued by the COSO. The Company’s management is responsible for maintaining effective internal control over financial reporting and for its assessment of the effectiveness of internal control over financial reporting. Our responsibility is to express opinions on management’s assessment and on the effectiveness of the Company’s internal control over financial reporting based on our audit. We conducted our audit of internal control over financial reporting in accordance with the standards of the Public Company Accounting Oversight Board (United States). Those standards require that we plan and perform the audit to obtain reasonable assurance about whether effective internal control over financial reporting was maintained in all material respects. An audit of internal control over financial reporting includes obtaining an understanding of internal control over financial reporting, evaluating management’s assessment, testing and evaluating the design and operating effectiveness of internal control, and performing such other procedures as we consider necessary in the circumstances. We believe that our audit provides a reasonable basis for our opinions.
A company’s internal control over financial reporting is a process designed to provide reasonable assurance regarding the reliability of financial reporting and the preparation of financial statements for external purposes in accordance with generally accepted accounting principles. A
FC-1
company’s internal control over financial reporting includes those policies and procedures that (i) pertain to the maintenance of records that, in reasonable detail, accurately and fairly reflect the transactions and dispositions of the assets of the company; (ii) provide reasonable assurance that transactions are recorded as necessary to permit preparation of financial statements in accordance with generally accepted accounting principles, and that receipts and expenditures of the company are being made only in accordance with authorizations of management and directors of the company; and (iii) provide reasonable assurance regarding prevention or timely detection of unauthorized acquisition, use, or disposition of the company’s assets that could have a material effect on the financial statements.
Because of its inherent limitations, internal control over financial reporting may not prevent or detect misstatements. Also, projections of any evaluation of effectiveness to future periods are subject to the risk that controls may become inadequate because of changes in conditions, or that the degree of compliance with the policies or procedures may deteriorate.
/s/ PRICEWATERHOUSECOOPERS LLP
Detroit, Michigan
March 1, 2006
FC-2
FORD MOTOR CREDIT COMPANY AND SUBSIDIARIES
CONSOLIDATED STATEMENT OF INCOME
(in millions)
| | | | | | | | | | | | | | | | |
| | |
| | For the Years Ended | |
| | December 31, | |
| |
| |
| | 2005 | | | 2004 | | | 2003 | |
| |
| | |
| | |
| |
| Financing revenue | | | | | | | | | | | | |
| | Operating leases | | $ | 5,304 | | | $ | 5,880 | | | $ | 7,423 | |
| | Retail | | | 4,029 | | | | 4,459 | | | | 4,296 | |
| | Interest supplements and other support costs earned from affiliated companies (Note 15) | | | 3,259 | | | | 3,360 | | | | 3,476 | |
| | Wholesale | | | 1,232 | | | | 796 | | | | 668 | |
| | Other | | | 221 | | | | 200 | | | | 247 | |
| | |
| | |
| | |
| |
| | | | Total financing revenue | | | 14,045 | | | | 14,695 | | | | 16,110 | |
| Depreciation on vehicles subject to operating leases | | | (4,430 | ) | | | (4,909 | ) | | | (7,009 | ) |
| Interest expense | | | (5,842 | ) | | | (5,333 | ) | | | (5,831 | ) |
| | |
| | |
| | |
| |
| | Net financing margin | | | 3,773 | | | | 4,453 | | | | 3,270 | |
| Other revenue | | | | | | | | | | | | |
| | Investment and other income related to sales of receivables (Note 7) | | | 1,498 | | | | 1,930 | | | | 2,611 | |
| | Insurance premiums earned, net (Note 2) | | | 192 | | | | 216 | | | | 232 | |
| | Other income | | | 909 | | | | 1,041 | | | | 1,137 | |
| | |
| | |
| | |
| |
| | | | Total financing margin and other revenue | | | 6,372 | | | | 7,640 | | | | 7,250 | |
| Expenses | | | | | | | | | | | | |
| | Operating expenses | | | 2,185 | | | | 2,142 | | | | 2,195 | |
| | Provision for credit losses (Note 6) | | | 166 | | | | 900 | | | | 1,888 | |
| | Insurance expenses (Note 2) | | | 160 | | | | 167 | | | | 211 | |
| | |
| | |
| | |
| |
| | | Total expenses | | | 2,511 | | | | 3,209 | | | | 4,294 | |
| | |
| | |
| | |
| |
| Income from continuing operations before income taxes | | | 3,861 | | | | 4,431 | | | | 2,956 | |
| Provision for income taxes (Note 11) | | | 1,409 | | | | 1,648 | | | | 1,134 | |
| | |
| | |
| | |
| |
| | Income from continuing operations before minority interests | | | 2,452 | | | | 2,783 | | | | 1,822 | |
| Minority interests in net income of subsidiaries | | | 1 | | | | 2 | | | | 2 | |
| | |
| | |
| | |
| |
| | Income from continuing operations | | | 2,451 | | | | 2,781 | | | | 1,820 | |
| Income from discontinued operations (Note 13) | | | 37 | | | | 81 | | | | 52 | |
| Gain/(loss) on disposal of discontinued operations (Note 13) | | | 4 | | | | — | | | | (55 | ) |
| | |
| | |
| | |
| |
| | Net income | | $ | 2,492 | | | $ | 2,862 | | | $ | 1,817 | |
| | |
| | |
| | |
| |
The accompanying notes are an integral part of the financial statements.
FC-3
FORD MOTOR CREDIT COMPANY AND SUBSIDIARIES
CONSOLIDATED BALANCE SHEET
(in millions)
| | | | | | | | | | | | |
| | |
| | December 31, | |
| |
| |
| | 2005 | | | 2004 | |
| |
| | |
| |
| ASSETS |
| | Cash and cash equivalents (Note 1) | | $ | 17,888 | | | $ | 12,668 | |
| | Investments in securities (Note 3) | | | 720 | | | | 653 | |
| | Finance receivables, net (Note 4) | | | 109,876 | | | | 110,851 | |
| | Net investment in operating leases (Note 5) | | | 22,213 | | | | 21,866 | |
| | Retained interest in securitized assets (Note 7) | | | 1,420 | | | | 9,166 | |
| | Notes and accounts receivable from affiliated companies | | | 1,235 | | | | 1,780 | |
| | Derivative financial instruments (Note 12) | | | 2,547 | | | | 6,930 | |
| | Assets of discontinued operations (Note 13) | | | — | | | | 2,186 | |
| | Other assets (Note 9) | | | 6,256 | | | | 6,521 | |
| | |
| | |
| |
| | | | Total assets | | $ | 162,155 | | | $ | 172,621 | |
| | |
| | |
| |
| |
| LIABILITIES AND STOCKHOLDER’S EQUITY |
| |
| Liabilities | | | | | | | | |
| | Accounts payable | | | | | | | | |
| | | Customer deposits, dealer reserves and other | | $ | 1,890 | | | $ | 1,645 | |
| | | Affiliated companies | | | 794 | | | | 819 | |
| | |
| | |
| |
| | | | Total accounts payable | | | 2,684 | | | | 2,464 | |
| | Debt (Note 10) | | | 134,500 | | | | 144,274 | |
| | Deferred income taxes, net (Note 11) | | | 8,772 | | | | 7,593 | |
| | Derivative financial instruments (Note 12) | | | 680 | | | | 911 | |
| | Liabilities of discontinued operations (Note 13) | | | — | | | | 93 | |
| | Other liabilities and deferred income (Note 9) | | | 4,781 | | | | 5,802 | |
| | |
| | |
| |
| | | | Total liabilities | | | 151,417 | | | | 161,137 | |
| |
| Minority interests in net assets of subsidiaries | | | 3 | | | | 13 | |
| |
| Stockholder’s equity | | | | | | | | |
| | Capital stock, par value $100 a share, 250,000 shares authorized, issued and outstanding | | | 25 | | | | 25 | |
| | Paid-in surplus (contributions by stockholder) | | | 5,117 | | | | 5,117 | |
| | Accumulated other comprehensive income | | | 385 | | | | 855 | |
| | Retained earnings | | | 5,208 | | | | 5,474 | |
| | |
| | |
| |
| | | | Total stockholder’s equity | | | 10,735 | | | | 11,471 | |
| | |
| | |
| |
| | | | Total liabilities and stockholder’s equity | | $ | 162,155 | | | $ | 172,621 | |
| | |
| | |
| |
The accompanying notes are an integral part of the financial statements.
FC-4
FORD MOTOR CREDIT COMPANY AND SUBSIDIARIES
CONSOLIDATED STATEMENT OF STOCKHOLDER’S EQUITY
(in millions)
| | | | | | | | | | | | | | | | | | | | | | | | | | | | | | | |
| | | | | | | | | | |
| | | | | | | | Accumulated Other | | | |
| | | | | | | | Comprehensive Income/(Loss) | | | |
| | | | | | | |
| | | |
| | | | | | | | Unrealized | | | Foreign | | | | | |
| | Capital | | | Paid-in | | | Retained | | | Gain/(Loss) | | | Currency | | | Derivative | | | |
| | Stock | | | Surplus | | | Earnings | | | on Assets | | | Translation | | | Instruments | | | Total | |
| |
| | |
| | |
| | |
| | |
| | |
| | |
| |
Balance at December 31, 2002 | | $ | 25 | | | $ | 5,117 | | | $ | 8,795 | | | $ | 238 | | | $ | (408 | ) | | $ | (217 | ) | | $ | 13,550 | |
| 2003 comprehensive income/(loss) activity: | | | | | | | | | | | | | | | | | | | | | | | | | | | | |
| | Net income | | | — | | | | — | | | | 1,817 | | | | — | | | | — | | | | — | | | | 1,817 | |
| | Change in value of retained interest in securitized assets (net of tax of $24) | | | — | | | | — | | | | — | | | | (39 | ) | | | — | | | | — | | | | (39 | ) |
| | Unrealized gain on marketable securities (net of tax of $6) | | | — | | | | — | | | | — | | | | 10 | | | | — | | | | — | | | | 10 | |
| | Less: reclassification adjustment for gains on marketable securities realized in net income (net of tax of $5) | | | — | | | | — | | | | — | | | | (8 | ) | | | — | | | | — | | | | (8 | ) |
| | Foreign currency translation | | | — | | | | — | | | | — | | | | — | | | | 721 | | | | — | | | | 721 | |
| | Net gain on derivative instruments (net of tax of $135) | | | — | | | | — | | | | — | | | | — | | | | (15 | ) | | | 232 | | | | 217 | |
| | Less: reclassification adjustment for gains on derivative instruments realized in net income (net of tax of $59) | | | — | | | | — | | | | — | | | | — | | | | — | | | | (94 | ) | | | (94 | ) |
| | |
| | |
| | |
| | |
| | |
| | |
| | |
| |
| | | Total comprehensive income/(loss), net of tax | | | — | | | | — | | | | 1,817 | | | | (37 | ) | | | 706 | | | | 138 | | | | 2,624 | |
| Cash dividends paid in 2003 | | | — | | | | — | | | | (3,700 | ) | | | — | | | | — | | | | — | | | | (3,700 | ) |
| | |
| | |
| | |
| | |
| | |
| | |
| | |
| |
Balance at December 31, 2003 | | $ | 25 | | | $ | 5,117 | | | $ | 6,912 | | | $ | 201 | | | $ | 298 | | | $ | (79 | ) | | $ | 12,474 | |
| 2004 comprehensive income/(loss) activity: | | | | | | | | | | | | | | | | | | | | | | | | | | | | |
| | Net income | | | — | | | | — | | | | 2,862 | | | | — | | | | — | | | | — | | | | 2,862 | |
| | Change in value of retained interest in securitized assets (net of tax of $5) | | | — | | | | — | | | | — | | | | (8 | ) | | | — | | | | — | | | | (8 | ) |
| | Unrealized gain on marketable securities (net of tax of $4) | | | — | | | | — | | | | — | | | | 6 | | | | — | | | | — | | | | 6 | |
| | Less: reclassification adjustment for gains on marketable securities realized in net income (net of tax of $2) | | | — | | | | — | | | | — | | | | (3 | ) | | | — | | | | — | | | | (3 | ) |
| | Foreign currency translation | | | — | | | | — | | | | — | | | | — | | | | 360 | | | | — | | | | 360 | |
| | Net gain on derivative instruments (net of tax of $89) | | | — | | | | — | | | | — | | | | — | | | | (9 | ) | | | 160 | | | | 151 | |
| | Less: reclassification adjustment for gains on derivative instruments realized in net income (net of tax of $42) | | | — | | | | — | | | | — | | | | — | | | | — | | | | (71 | ) | | | (71 | ) |
| | |
| | |
| | |
| | |
| | |
| | |
| | |
| |
| | | Total comprehensive income/(loss), net of tax | | | — | | | | — | | | | 2,862 | | | | (5 | ) | | | 351 | | | | 89 | | | | 3,297 | |
| Cash dividends paid in 2004 | | | — | | | | — | | | | (4,300 | ) | | | — | | | | — | | | | — | | | | (4,300 | ) |
| | |
| | |
| | |
| | |
| | |
| | |
| | |
| |
Balance at December 31, 2004 | | $ | 25 | | | $ | 5,117 | | | $ | 5,474 | | | $ | 196 | | | $ | 649 | | | $ | 10 | | | $ | 11,471 | |
| 2005 comprehensive income/(loss) activity: | | | | | | | | | | | | | | | | | | | | | | | | | | | | |
| | Net income | | | — | | | | — | | | | 2,492 | | | | — | | | | — | | | | — | | | | 2,492 | |
| | Change in value of retained interest in securitized assets (net of tax of $19) | | | — | | | | — | | | | — | | | | (32 | ) | | | — | | | | — | | | | (32 | ) |
| | Unrealized loss on marketable securities (net of tax of $5) | | | — | | | | — | | | | — | | | | (7 | ) | | | — | | | | — | | | | (7 | ) |
| | Less: reclassification adjustment for gains on marketable securities realized in net income (net of tax of $1) | | | — | | | | — | | | | — | | | | (2 | ) | | | — | | | | — | | | | (2 | ) |
| | Foreign currency translation | | | — | | | | — | | | | — | | | | — | | | | (466 | ) | | | — | | | | (466 | ) |
| | Net gain on derivative instruments (net of tax of $34) | | | — | | | | — | | | | — | | | | — | | | | — | | | | 59 | | | | 59 | |
| | Less: reclassification adjustment for gains on derivative instruments realized in net income (net of tax of $13) | | | — | | | | — | | | | — | | | | — | | | | — | | | | (22 | ) | | | (22 | ) |
| | |
| | |
| | |
| | |
| | |
| | |
| | |
| |
| | | Total comprehensive income/(loss), net of tax | | | — | | | | — | | | | 2,492 | | | | (41 | ) | | | (466 | ) | | | 37 | | | | 2,022 | |
| Cash dividends paid in 2005 and dividend transfer (a) | | | — | | | | — | | | | (2,758 | ) | | | — | | | | — | | | | — | | | | (2,758 | ) |
| | |
| | |
| | |
| | |
| | |
| | |
| | |
| |
Balance at December 31, 2005 | | $ | 25 | | | $ | 5,117 | | | $ | 5,208 | | | $ | 155 | | | $ | 183 | | | $ | 47 | | | $ | 10,735 | |
| | |
| | |
| | |
| | |
| | |
| | |
| | |
| |
| |
| (a) | Dividends included the transfer of a Ford Credit affiliate to Ford, with a net book value of $8 million; the transfer was completed in the first quarter of 2005. |
The accompanying notes are an integral part of the financial statements.
FC-5
FORD MOTOR CREDIT COMPANY AND SUBSIDIARIES
CONSOLIDATED STATEMENT OF CASH FLOWS
(in millions)
| | | | | | | | | | | | | | | |
| | |
| | For the Years Ended December 31, | |
| |
| |
| | | | |
| | | | (Revised — See Note 1) | |
| | 2005 | | | 2004 | | | 2003 | |
| |
| | |
| | |
| |
Cash flows from operating activities of continuing operations | | | | | | | | | | | | |
| Net income | | $ | 2,492 | | | $ | 2,862 | | | $ | 1,817 | |
| | (Income)/loss related to discontinued operations | | | (41 | ) | | | (81 | ) | | | 3 | |
| | Provision for credit losses | | | 166 | | | | 900 | | | | 1,888 | |
| | Depreciation and amortization | | | 5,003 | | | | 5,350 | | | | 7,418 | |
| | Net gain on sales of finance receivables | | | (74 | ) | | | (155 | ) | | | (373 | ) |
| | Increase in deferred income taxes | | | 1,087 | | | | 1,085 | | | | 816 | |
| | Net change in other assets | | | 1,927 | | | | 3,964 | | | | 1,413 | |
| | Net change in other liabilities | | | (2,647 | ) | | | (892 | ) | | | 1,270 | |
| | All other operating activities | | | (135 | ) | | | (176 | ) | | | (73 | ) |
| | |
| | |
| | |
| |
| | | Net cash provided by operating activities | | | 7,778 | | | | 12,857 | | | | 14,179 | |
| | |
| | |
| | |
| |
Cash flows from investing activities of continuing operations | | | | | | | | | | | | |
| | Purchase of finance receivables (other than wholesale) | | | (38,937 | ) | | | (49,946 | ) | | | (47,851 | ) |
| | Collection of finance receivables (other than wholesale) | | | 38,241 | | | | 41,193 | | | | 30,878 | |
| | Purchase of operating lease vehicles | | | (15,318 | ) | | | (14,345 | ) | | | (12,438 | ) |
| | Liquidation of operating lease vehicles | | | 9,043 | | | | 9,796 | | | | 12,930 | |
| | Net change in wholesale receivables | | | 978 | | | | (1,083 | ) | | | (4,673 | ) |
| | Net change in retained interest in securitized assets | | | 3,392 | | | | (374 | ) | | | 2,033 | |
| | Net change in notes receivable from affiliated companies | | | 343 | | | | (43 | ) | | | 279 | |
| | Proceeds from sales of receivables | | | 20,935 | | | | 10,319 | | | | 19,337 | |
| | Purchases of investment securities | | | (564 | ) | | | (811 | ) | | | (636 | ) |
| | Proceeds from sales and maturities of investment securities | | | 491 | | | | 779 | | | | 698 | |
| | Proceeds from sales of businesses | | | 2,057 | | | | 412 | | | | 1,421 | |
| | Transfer of cash balances upon disposition of discontinued operations | | | (5 | ) | | | (13 | ) | | | — | |
| | All other investing activities | | | (2 | ) | | | (690 | ) | | | 859 | |
| | |
| | |
| | |
| |
| | | Net cash provided by/(used in) investing activities | | | 20,654 | | | | (4,806 | ) | | | 2,837 | |
| | |
| | |
| | |
| |
Cash flows from financing activities of continuing operations | | | | | | | | | | | | |
| | Proceeds from issuance of long-term debt | | | 20,882 | | | | 18,387 | | | | 19,710 | |
| | Principal payments on long-term debt | | | (32,432 | ) | | | (32,483 | ) | | | (25,493 | ) |
| | Change in short-term debt, net | | | (8,541 | ) | | | 7,010 | | | | 946 | |
| | Cash dividends paid | | | (2,750 | ) | | | (4,300 | ) | | | (3,700 | ) |
| | All other financing activities | | | 10 | | | | (57 | ) | | | (63 | ) |
| | |
| | |
| | |
| |
| | | Net cash used in financing activities | | | (22,831 | ) | | | (11,443 | ) | | | (8,600 | ) |
| Effect of exchange rate changes on cash and cash equivalents | | | (386 | ) | | | 349 | | | | 481 | |
| | |
| | |
| | |
| |
| | | Total cash flows from continuing operations | | | 5,215 | | | | (3,043 | ) | | | 8,897 | |
Cash flows from discontinued operations | | | | | | | | | | | | |
| Cash flows from discontinued operations provided by operating activities | | | 71 | | | | 464 | | | | 282 | |
| Cash flows from discontinued operations used in investing activities | | | (66 | ) | | | (457 | ) | | | (276 | ) |
| | |
| | |
| | |
| |
| | | Net increase/(decrease) in cash and cash equivalents | | $ | 5,220 | | | $ | (3,036 | ) | | $ | 8,903 | |
| | |
| | |
| | |
| |
Cash and cash equivalents, beginning of period | | $ | 12,668 | | | $ | 15,698 | | | $ | 6,801 | |
| Cash and cash equivalents of discontinued operations, beginning of period | | | — | | | | 6 | | | | — | |
| Change in cash and cash equivalents | | | 5,220 | | | | (3,036 | ) | | | 8,903 | |
| Less: cash and cash equivalents of discontinued operations, end of period | | | — | | | | — | | | | (6 | ) |
| | |
| | |
| | |
| |
Cash and cash equivalents, end of period | | $ | 17,888 | | | $ | 12,668 | | | $ | 15,698 | |
| | |
| | |
| | |
| |
| Supplementary cash flow information for continuing operations (a) | | | | | | | | | | | | |
| | Interest paid | | $ | 6,129 | | | $ | 6,003 | | | $ | 5,698 | |
| | Income taxes paid | | | 268 | | | | 181 | | | | 164 | |
| | |
| (a) | | Refer to Note 7, servicing portfolio activity, for non-cash supplementary data related to the consolidation of our wholesale securitization program. |
The accompanying notes are an integral part of the financial statements.
FC-6
FORD MOTOR CREDIT COMPANY AND SUBSIDIARIES
NOTES TO THE FINANCIAL STATEMENTS
| |
| NOTE 1. | ACCOUNTING POLICIES |
Principles of Consolidation
The accompanying consolidated financial statements include Ford Motor Credit Company, its controlled domestic and foreign subsidiaries and joint ventures, and consolidated variable interest entities (“VIEs”) in which Ford Motor Credit Company is the primary beneficiary (collectively referred to herein as “Ford Credit”, “we”, “our” or “us”). Affiliates that we do not consolidate, but for which we have significant influence over operating and financial policies, are accounted for using the equity method. We are an indirect, wholly owned subsidiary of Ford Motor Company (“Ford”).
Use of estimates, as determined by management, is required in the preparation of consolidated financial statements in conformity with U.S. generally accepted accounting principles. Because of the inherent uncertainty involved in making estimates, actual results reported in future periods might be based upon amounts that differ from those estimates. The accounting estimates that are most important to our business include the allowance for credit losses, accumulated depreciation on vehicles subject to operating leases, and assumptions related to off-balance sheet sales of receivables in securitizations and other transactions. Certain prior year disclosures have been revised to conform to current year presentation.
Beginning with our year ended December 31, 2005 statement of cash flows, we have changed the presentation of cash flows to separately disclose the operating, investing and financing portions of the cash flows attributable to our discontinued operations. This change is in response to public statements by the staff of the Securities and Exchange Commission concerning classification of discontinued operations within the statement of cash flows. Also, we have revised prior year data in our statement of cash flows related to purchases, collections and liquidation of finance receivables and operating lease vehicles. This revision had no impact on previously reported totals for the investing section of the statement of cash flows.
Nature of Operations
Our primary financing products fall into three categories: retail financing (purchasing retail installment sale contracts and retail lease contracts from dealers, and offering financing to commercial customers, primarily vehicle leasing companies and fleet purchasers, to lease or purchase vehicle fleets); wholesale financing (making loans to dealers to finance the purchase of vehicle inventory, also known as floorplan financing); and other financing (making loans to dealers for working capital, improvements to dealership facilities, and to purchase and finance dealership real estate).
We conduct our financing operations directly or indirectly through our subsidiaries and affiliates. We offer substantially similar products and services throughout many different regions, subject to local legal restrictions and market conditions. Our reportable business segments include Ford Credit North America (“North America segment”) and Ford Financial International (“International segment”). The North America segment includes our operations in the United States and Canada. The International segment includes our operations in all other countries in which we do business directly or indirectly. Additional financial information regarding our operations by business segment and operations by geographic region are shown in Note 16.
The predominant share of our business consists of financing Ford vehicles and supporting Ford dealers. Any extended reduction or suspension of Ford’s production or sale of vehicles due to a decline in consumer demand, work stoppage, governmental action, negative publicity or other event, or significant changes to marketing programs sponsored by Ford, would have an adverse effect on our business.
FC-7
FORD MOTOR CREDIT COMPANY AND SUBSIDIARIES
NOTES TO THE FINANCIAL STATEMENTS — Continued
NOTE 1. ACCOUNTING POLICIES — Continued
The majority of our finance receivables are geographically diversified throughout the North America segment. Outside the North America segment, finance receivables are concentrated in Europe, Asia-Pacific and Latin America.
Revenue Recognition
Revenue from finance receivables including direct financing leases is recognized using the interest method. Certain origination costs on receivables are deferred and amortized, using the interest method, over the term of the related receivable as a reduction in financing revenue. Rental revenue on operating leases is recognized on a straight-line basis over the term of the lease. Initial direct costs related to leases are deferred and amortized over the term of the lease. The accrual of interest on receivables is discontinued at the time a receivable is determined to be uncollectible.
We receive interest supplements and other support payments on certain financing and leasing transactions under agreements with Ford and other affiliates. These payments are collected and recognized as income over the period that the related finance receivables and leases are outstanding.
Sales of Receivables
We sell finance receivables in securitization and whole-loan sale transactions to fund our operations and to maintain liquidity. In many of our securitization transactions, we surrender control over these assets by selling finance receivables to securitization special purpose entities (“SPEs”). Securitization entities are a common, required element of securitization transactions to meet certain legal and transaction requirements that assure that the sold assets have been isolated from our creditors and us. The securitization entities generally issue interest-bearing securities collateralized by future collections on the sold receivables.
We record our off-balance sheet sales of receivables in accordance with Statement of Financial Accounting Standards No. 140,Accounting for Transfers and Servicing of Financial Assets and Extinguishments of Liabilities.To qualify for a sale, the following accounting criteria must be met:
| | |
| | • | Receivables must be isolated from transferor — we transfer the receivables to a bankruptcy-remote SPE. |
| |
| | • | Transfer of receivables to a qualifying SPE or an entity that has the right to pledge or exchange the assets — we generally use a qualifying SPE in our off-balance sheet transactions or we sell the assets to an independent entity. In either case, we do not restrict the transferee from pledging or exchanging the assets. |
| |
| | • | Transferor must not maintain control over the assets — we are not permitted to regain control over the transferred assets or cause the return of specific assets, other than through a “cleanup” call. |
For off-balance sheet sales of receivables, estimated gains or losses are recognized in the period in which the sale occurs. We retain certain interests in receivables sold in securitization transactions. In determining the gain or loss on each sale of finance receivables, the investment in the sold receivables pool is allocated between the portions sold and retained based on their relative fair values at the date of sale. Retained interests may include residual interest in securitization transactions, restricted cash held for the benefit of securitization SPEs and subordinated securities. These interests are recorded at fair value with unrealized gains or losses recorded, net of tax, as a separate component of accumulated other comprehensive income in stockholder’s equity. Residual
FC-8
FORD MOTOR CREDIT COMPANY AND SUBSIDIARIES
NOTES TO THE FINANCIAL STATEMENTS — Continued
NOTE 1. ACCOUNTING POLICIES — Continued
interests in securitization transactions represent the present value of monthly collections on the sold finance receivables in excess of amounts needed by the SPE to pay its obligations, including principal and interest to investors and servicing fees.
We also retain the servicing rights and receive a servicing fee. Since the servicing fee adequately compensates us for retaining the servicing rights, we generally do not establish a servicing asset or liability; the fee is recognized as collected over the remaining term of the related sold finance receivables. Interest supplement payments due from affiliates related to receivables that were sold in securitizations or whole-loan sale transactions are reflected, on a present value basis, as a receivable in other assets on our balance sheet at the time the receivables are sold. Present value accretion is recognized in investment and other income related to sales of receivables.
In whole-loan sale transactions, we sell retail installment sale contracts to a buyer who either retains them or sells them in a subsequent asset-backed securitization. We do not retain any interests in the sold receivables but continue to service such receivables for a fee.
Certain sales of receivables do not qualify for off-balance sheet treatment. As a result, the sold receivables and associated debt remain on our balance sheet and no gain or loss is recorded for these transactions.
Depreciation
Depreciation expense on vehicles subject to operating leases is provided on a straight-line basis in an amount necessary to reduce the leased vehicle to its estimated residual (salvage) value at the end of the lease term. Our policy is to promptly sell returned off-lease vehicles. We evaluate our depreciation policy for leased vehicles on a regular basis taking into consideration various assumptions, such as expected residual values at lease termination (including residual value support payments from Ford) and the estimated number of vehicles that will be returned to us. Adjustments to reflect revised estimates of expected residual values at the end of the lease terms are recorded prospectively on a straight-line basis. Upon disposition of the vehicle, the difference between net book value and actual proceeds (including residual value support payments from Ford) is recorded as an adjustment to depreciation expense. We also monitor our portfolio of vehicles subject to operating leases for impairment indicators.
Cash and Cash Equivalents
Cash and all highly liquid investments with a maturity of three months or less at date of purchase are classified as cash and cash equivalents. Our cash and cash equivalents include short-term United States Treasury bills, federal agency discount notes, A-1/ P-1 (or higher) rated commercial paper, and bank time deposits with investment grade institutions. The book value of cash and cash equivalents approximates fair value because of the short maturities of these instruments.
At December 31, 2005 and 2004, approximately $2.3 billion and $1.4 billion, respectively, of our cash balance was legally isolated, which primarily supported our consolidated securitization SPEs.
Allowance for Credit Losses
The allowance for credit losses is our estimate of the credit losses related to impaired receivables and operating leases at the date of the financial statements. This allowance is based on factors including historical credit loss trends, the credit quality of our present portfolio, trends in
FC-9
FORD MOTOR CREDIT COMPANY AND SUBSIDIARIES
NOTES TO THE FINANCIAL STATEMENTS — Continued
NOTE 1. ACCOUNTING POLICIES — Continued
historical and projected used vehicle values and general economic measures. Additions to the allowance for credit losses are made by recording charges to the provision for credit losses on our income statement. Finance receivables and lease investments are charged to the allowance for credit losses at the earlier of when an account is deemed to be uncollectible or when an account is 120 days delinquent, taking into consideration the financial condition of the borrower or lessee, the value of the collateral, recourse to guarantors and other factors. Recoveries on finance receivables and lease investments previously charged off as uncollectible are credited to the allowance for credit losses.
Derivative Financial Instruments
We operate in many countries, and are exposed to various market risks, including the effects of changes in interest rates and foreign currency exchange rates. Interest rate and currency exposures are monitored and managed by us as an integral part of our overall risk management program, which recognizes the unpredictability of financial markets and seeks to reduce potential adverse effects on our operating results. Risk is reduced in two ways: (1) through the use of funding instruments that have interest and maturity profiles similar to the assets they are funding, and (2) through the use of interest rate and foreign exchange derivatives. Interest rate swaps are used to manage the effects of interest rate fluctuations. Foreign currency exchange agreements, including forward contracts and swaps, are used to manage foreign exchange exposure.
All derivatives are recognized on the balance sheet at fair value, in accordance with Statement of Financial Accounting Standards No. 133 (“SFAS 133”),Accounting for Derivative Instruments and Hedging Activities.We may designate derivatives as a hedge of the fair value of a recognized asset or liability (“fair value” hedge) or of the variability of cash flows to be received or paid related to a recognized asset or liability (“cash flow” hedge). We also enter into derivatives that economically hedge certain of our risks, even though hedge accounting is not allowed by SFAS 133 or is not applied by us.
Changes in the value of a derivative that is designated as a fair value hedge, along with offsetting changes in the fair value of the underlying hedged exposure, are recorded in earnings. Changes in the value of a derivative that is designated as a cash flow hedge are recorded net of tax, to the extent the hedge is effective, as a separate component of accumulated other comprehensive income in stockholder’s equity. The fair value of interest rate swaps is calculated using current market rates for similar instruments with the same remaining maturities. Unrealized gains and losses are netted for individual counterparties where legally permissible.
When the terms of an underlying transaction are modified, or when the underlying hedged item is settled prior to maturity, all changes in the fair value of the derivative instrument are marked-to-market with changes in the fair value included in earnings each period until the instrument matures, unless the derivative is subsequently included in another hedge relationship.
We manage our foreign currency and interest rate counterparty credit risks by establishing limits and monitoring the financial condition of counterparties. The amount of exposure we may have to a single counterparty on a worldwide basis is limited by company policy. In the unlikely event that a counterparty fails to meet the terms of a foreign currency or an interest rate instrument, risk is limited to the fair value of the instrument.
FC-10
FORD MOTOR CREDIT COMPANY AND SUBSIDIARIES
NOTES TO THE FINANCIAL STATEMENTS — Continued
NOTE 1. ACCOUNTING POLICIES — Continued
Foreign Currency Translation
Results of operations and cash flows of our foreign subsidiaries are translated to U.S. dollars at average-period currency exchange rates. Assets and liabilities are translated at end-of-period exchange rates. Translation adjustments are related to foreign subsidiaries using local currency as their functional currency and are reported as a separate component of accumulated other comprehensive income in stockholder’s equity. Gains and losses arising from transactions denominated in a currency other than the functional currency of the subsidiary involved are included in other income.
We conduct insurance underwriting operations primarily through The American Road Insurance Company (“TARIC”) and its subsidiaries. TARIC is our wholly owned subsidiary. TARIC offers a variety of products and services, including physical damage insurance and extended service plan contracts.
Revenue Recognition
Insurance premiums earned are reported net of reinsurance. These premiums are earned over their respective policy periods. Physical damage insurance premiums, including vehicles financed at wholesale by us and our finance subsidiaries, are recognized as income on a monthly basis. Premiums from extended service plan contracts and other contractual liability coverages are earned over the life of the policy based on historical loss experience. Certain costs of acquiring new business are deferred and amortized over the term of the related policies on the same basis on which premiums are earned.
Insurance Expenses and Liabilities
Insurance underwriting losses and expenses are reported as insurance expenses. The components of insurance expenses are as follows for the years ended December 31:
| | | | | | | | | | | | | | |
| | 2005 | | | 2004 | | | 2003 | |
| |
| | |
| | |
| |
| | |
| | (in millions) | |
| Insurance claims | | $ | 140 | | | $ | 138 | | | $ | 163 | |
| Amortization of deferred acquisition costs | | | 12 | | | | 16 | | | | 35 | |
| Claim adjustment expenses | | | 8 | | | | 13 | | | | 13 | |
| | |
| | |
| | |
| |
| | Insurance expenses | | $ | 160 | | | $ | 167 | | | $ | 211 | |
| | |
| | |
| | |
| |
The liability for reported insurance claims and an estimate of unreported insurance claims, based on past experience, was $67 million and $75 million at December 31, 2005 and 2004, respectively, and was included in other liabilities and deferred income.
Reinsurance
TARIC cedes a majority of its automotive service contracts and all of the warranty contract business for a ceding commission. Amounts recoverable from reinsurers on unpaid losses, including incurred but not reported losses, and amounts paid to reinsurers relating to the unexpired portion of reinsurance contracts are reported in other assets. Ceded insurance-related expenses deducted from insurance expenses were $382 million, $436 million and $498 million in 2005, 2004 and 2003, respectively.
FC-11
FORD MOTOR CREDIT COMPANY AND SUBSIDIARIES
NOTES TO THE FINANCIAL STATEMENTS — Continued
NOTE 2. INSURANCE — Continued
The effect of reinsurance on premiums written and earned is as follows:
| | | | | | | | | | | | | | | | | | | | | | | | | | |
| | | | | | |
| | 2005 | | | 2004 | | | 2003 | |
| |
| | |
| | |
| |
| | Written | | | Earned | | | Written | | | Earned | | | Written | | | Earned | |
| |
| | |
| | |
| | |
| | |
| | |
| |
| | |
| | (in millions) | |
| Direct | | $ | 522 | | | $ | 762 | | | $ | 543 | | | $ | 815 | | | $ | 725 | | | $ | 851 | |
| Assumed | | | 29 | | | | 31 | | | | 27 | | | | 39 | | | | 32 | | | | 63 | |
| Ceded | | | (371 | ) | | | (601 | ) | | | (358 | ) | | | (638 | ) | | | (553 | ) | | | (682 | ) |
| | |
| | |
| | |
| | |
| | |
| | |
| |
| | Net premiums | | $ | 180 | | | $ | 192 | | | $ | 212 | | | $ | 216 | | | $ | 204 | | | $ | 232 | |
| | |
| | |
| | |
| | |
| | |
| | |
| |
Commissions on reinsurance ceded are earned on the same basis as related premiums. Reinsurance contracts do not relieve TARIC from its obligations to its policyholders. Failure of reinsurers to honor their obligations could result in losses to TARIC. Therefore, TARIC evaluates the financial condition of its reinsurers and monitors concentrations of credit risk arising from similar geographic regions, activities or economic characteristics of the reinsurers to manage its exposure to significant losses from reinsurance solvencies.
| |
| NOTE 3. | INVESTMENTS IN SECURITIES |
Investments in securities, which substantially relate to our insurance activities, consist of mortgage-backed, corporate debt, U.S. government and agency, equity and other securities. Available-for-sale securities are recorded at fair value with unrealized gains and losses excluded from income and reported, net of tax, as a separate component of accumulated other comprehensive income in stockholder’s equity. Held-to-maturity securities are recorded at amortized cost. The basis of cost used in determining realized gains and losses is specific identification.
The fair value of substantially all securities was determined based on quoted market prices. For securities for which quoted market prices were not available, the estimate of fair value was based on similar types of securities that are traded in the market. Book value approximates fair value for all securities.
Investments in securities at December 31 were as follows:
| | | | | | | | | | | | | | | | | | | |
| | |
| | 2005 | |
| |
| |
| | | | Gross | | | Gross | | | |
| | Amortized | | | Unrealized | | | Unrealized | | | Fair | |
| | Cost | | | Gains | | | Losses | | | Value | |
| |
| | |
| | |
| | |
| |
| | |
| | (in millions) | |
| Available-for-sale securities | | | | | | | | | | | | | | | | |
| | Mortgage-backed | | $ | 282 | | | $ | 1 | | | $ | 4 | | | $ | 279 | |
| | Corporate Debt | | | 183 | | | | 1 | | | | 3 | | | | 181 | |
| | U.S. government and agency | | | 92 | | | | 1 | | | | — | | | | 93 | |
| | Equity | | | 65 | | | | 38 | | | | 1 | | | | 102 | |
| | Other debt securities | | | 38 | | | | — | | | | — | | | | 38 | |
| | Government — non U.S. | | | 20 | | | | — | | | | — | | | | 20 | |
| | Municipal | | | 1 | | | | — | | | | — | | | | 1 | |
| Held-to-maturity securities | | | 6 | | | | — | | | | — | | | | 6 | |
| | |
| | |
| | |
| | |
| |
| | | Total investments in securities | | $ | 687 | | | $ | 41 | | | $ | 8 | | | $ | 720 | |
| | |
| | |
| | |
| | |
| |
FC-12
FORD MOTOR CREDIT COMPANY AND SUBSIDIARIES
NOTES TO THE FINANCIAL STATEMENTS — Continued
NOTE 3. INVESTMENTS IN SECURITIES — Continued
| | | | | | | | | | | | | | | | | | | |
| | |
| | 2004 | |
| |
| |
| | | | Gross | | | Gross | | | |
| | Amortized | | | Unrealized | | | Unrealized | | | Fair | |
| | Cost | | | Gains | | | Losses | | | Value | |
| |
| | |
| | |
| | |
| |
| | |
| | (in millions) | |
| Available-for-sale securities | | | | | | | | | | | | | | | | |
| | Mortgage-backed | | $ | 184 | | | $ | 3 | | | $ | — | | | $ | 187 | |
| | Corporate debt | | | 192 | | | | 3 | | | | 1 | | | | 194 | |
| | U.S. government and agency | | | 101 | | | | 2 | | | | — | | | | 103 | |
| | Equity | | | 49 | | | | 37 | | | | 3 | | | | 83 | |
| | Other debt securities | | | 45 | | | | 1 | | | | — | | | | 46 | |
| | Government — non U.S. | | | 26 | | | | 5 | | | | — | | | | 31 | |
| | Municipal | | | 2 | | | | — | | | | — | | | | 2 | |
| Held-to-maturity securities | | | 7 | | | | — | | | | — | | | | 7 | |
| | |
| | |
| | |
| | |
| |
| | | Total investments in securities | | $ | 606 | | | $ | 51 | | | $ | 4 | | | $ | 653 | |
| | |
| | |
| | |
| | |
| |
The amortized cost and fair value of investments in available-for-sale securities and held-to-maturity securities at December 31, by contractual maturity, were as follows:
| | | | | | | | | | | | | | | | | | |
| | |
| | 2005 | |
| |
| |
| | | | |
| | Available-for-Sale | | | Held-to-Maturity | |
| |
| | |
| |
| | Amortized | | | Fair | | | Amortized | | | Fair | |
| | Cost | | | Value | | | Cost | | | Value | |
| |
| | |
| | |
| | |
| |
| | |
| | (in millions) | |
| Due in one year or less | | $ | 14 | | | $ | 14 | | | $ | 1 | | | $ | 1 | |
| Due after one year through five years | | | 180 | | | | 178 | | | | 3 | | | | 3 | |
| Due after five years through ten years | | | 60 | | | | 59 | | | | — | | | | — | |
| Due after ten years | | | 80 | | | | 82 | | | | 1 | | | | 1 | |
| Mortgage-backed securities | | | 282 | | | | 279 | | | | 1 | | | | 1 | |
| Equity securities | | | 65 | | | | 102 | | | | — | | | | — | |
| | |
| | |
| | |
| | |
| |
| | Total | | $ | 681 | | | $ | 714 | | | $ | 6 | | | $ | 6 | |
| | |
| | |
| | |
| | |
| |
| | | | | | | | | | | | | | | | | | |
| | |
| | 2004 | |
| |
| |
| | | | |
| | Available-for-Sale | | | Held-to-Maturity | |
| |
| | |
| |
| | Amortized | | | Fair | | | Amortized | | | Fair | |
| | Cost | | | Value | | | Cost | | | Value | |
| |
| | |
| | |
| | |
| |
| | |
| | (in millions) | |
| Due in one year or less | | $ | 8 | | | $ | 8 | | | $ | 1 | | | $ | 1 | |
| Due after one year through five years | | | 209 | | | | 210 | | | | 4 | | | | 4 | |
| Due after five years through ten years | | | 79 | | | | 85 | | | | — | | | | — | |
| Due after ten years | | | 70 | | | | 73 | | | | 2 | | | | 2 | |
| Mortgage-backed securities | | | 184 | | | | 187 | | | | — | | | | — | |
| Equity securities | | | 49 | | | | 83 | | | | — | | | | — | |
| | |
| | |
| | |
| | |
| |
| | Total | | $ | 599 | | | $ | 646 | | | $ | 7 | | | $ | 7 | |
| | |
| | |
| | |
| | |
| |
Included in the above contractual maturities are investments on deposit with regulatory authorities (at amortized cost), as required by law, totaling $20 million and $19 million at December 31, 2005 and 2004, respectively.
Proceeds from sales of available-for-sale securities were $482 million, $768 million and $693 million in 2005, 2004 and 2003, respectively. Gross realized gains were $7 million, $9 million and $16 million in 2005, 2004 and 2003, respectively. Gross realized losses were $3 million, $3 million and $2 million in 2005, 2004 and 2003, respectively.
FC-13
FORD MOTOR CREDIT COMPANY AND SUBSIDIARIES
NOTES TO THE FINANCIAL STATEMENTS — Continued
NOTE 3. INVESTMENTS IN SECURITIES — Continued
The fair value of investments in an unrealized loss position at December 31, 2005, aggregated by investment category and length of time that the investments have been in a continuous loss position, are as follows:
| | | | | | | | | | | | | | | | | | | | | | | | | | | |
| | | | | | | | |
| | Less Than | | | 12 Months or | | | |
| | 12 Months | | | Greater | | | Total | |
| |
| | |
| | |
| |
| | | | Gross | | | | | Gross | | | | | Gross | |
| | Fair | | | Unrealized | | | Fair | | | Unrealized | | | Fair | | | Unrealized | |
| | Value | | | Losses | | | Value | | | Losses | | | Value | | | Losses | |
| |
| | |
| | |
| | |
| | |
| | |
| |
| | |
| | (in millions) | |
| Available-for-sale securities | | | | | | | | | | | | | | | | | | | | | | | | |
| | Mortgage-backed | | $ | 139 | | | $ | 3 | | | $ | 33 | | | $ | 1 | | | $ | 172 | | | $ | 4 | |
| | Corporate debt | | | 67 | | | | 1 | | | | 51 | | | | 2 | | | | 118 | | | | 3 | |
| | U.S. government and agency | | | 29 | | | | — | | | | — | | | | — | | | | 29 | | | | — | |
| | Equity | | | 3 | | | | — | | | | 2 | | | | 1 | | | | 5 | | | | 1 | |
| | Other debt securities | | | 9 | | | | — | | | | 23 | | | | — | | | | 32 | | | | — | |
| | Government — non U.S. | | | 9 | | | | — | | | | — | | | | — | | | | 9 | | | | — | |
| | Municipal | | | — | | | | — | | | | 1 | | | | — | | | | 1 | | | | — | |
| | |
| | |
| | |
| | |
| | |
| | |
| |
| | | Total available-for-sale securities | | $ | 256 | | | $ | 4 | | | $ | 110 | | | $ | 4 | | | $ | 366 | | | $ | 8 | |
| | |
| | |
| | |
| | |
| | |
| | |
| |
We utilize a systematic process to evaluate whether unrealized losses related to investments in debt and equity securities are temporary in nature. Factors considered in determining whether a loss is temporary include the length of time and extent to which the fair value has been below cost, the financial condition and near-term prospects of the issuer and our ability and intent to hold the investment for a period of time sufficient to allow for any anticipated recovery. If losses are determined to be other than temporary, the investment carrying amount is considered impaired and adjusted downward to a revised fair value. During 2005, impairments recorded were not material.
| |
| NOTE 4. | FINANCE RECEIVABLES |
Net finance receivables at December 31 were as follows:
| | | | | | | | | | |
| | 2005 | | | 2004 | |
| |
| | |
| |
| | |
| | (in millions) | |
| Retail | | $ | 66,940 | | | $ | 83,719 | |
| Wholesale | | | 39,680 | | | | 23,930 | |
| Other | | | 4,648 | | | | 5,331 | |
| | |
| | |
| |
| | Total finance receivables, net of unearned income (a)(b) | | | 111,268 | | | | 112,980 | |
| Less: Allowance for credit losses | | | (1,392 | ) | | | (2,129 | ) |
| | |
| | |
| |
| | Finance receivables, net | | $ | 109,876 | | | $ | 110,851 | |
| | |
| | |
| |
| Net finance receivables subject to fair value (c) | | $ | 104,669 | | | $ | 103,985 | |
| Fair value | | | 104,190 | | | | 104,195 | |
| | |
| (a) | | At December 31, 2005 and 2004, includes $1.6 billion and $1.8 billion, respectively, of primarily wholesale receivables with entities that are reported as consolidated subsidiaries of Ford. The consolidated subsidiaries include dealerships that are partially owned by Ford and consolidated as VIEs and also certain overseas affiliates. The associated vehicles that are being financed by us are reported as inventory on Ford’s balance sheet. |
| |
| (b) | | At December 31, 2005 and 2004, includes $44.7 billion and $16.9 billion, respectively, of receivables that have been sold for legal purposes to consolidated securitization SPEs and are available only for repayment of debt issued by those entities, and to pay other securitization investors and other participants; they are not available to pay our other obligations or the claims of our other creditors. |
| |
| (c) | | At December 31, 2005 and 2004, excludes $5.2 billion and $6.9 billion, respectively, of certain receivables (primarily direct financing leases) that are not financial instruments. |
FC-14
FORD MOTOR CREDIT COMPANY AND SUBSIDIARIES
NOTES TO THE FINANCIAL STATEMENTS — Continued
NOTE 4. FINANCE RECEIVABLES — Continued
The fair value of finance receivables is generally calculated by discounting future cash flows using an estimated discount rate that reflects the current credit, interest rate and prepayment risks associated with similar types of instruments. For finance receivables with short maturities (generally three months or less), the book value approximates fair value.
At December 31, 2005, finance receivables included $1.6 billion owed by the three customers with the largest receivables balances.
Contractual maturities of total finance receivables outstanding at December 31, 2005, net of unearned income, were as follows:
| | | | | | | | | | | | | | | | | | | | | | |
| | | | | | |
| | Due in Year Ending | | | | | |
| | December 31, | | | | | |
| |
| | | Due After | | | |
| | 2006 | | | 2007 | | | 2008 | | | 2008 | | | Total | |
| |
| | |
| | |
| | |
| | |
| |
| | |
| | (in millions) | |
| Retail | | $ | 32,153 | | | $ | 19,156 | | | $ | 10,192 | | | $ | 5,439 | | | $ | 66,940 | |
| Wholesale | | | 39,061 | | | | 619 | | | | — | | | | — | | | | 39,680 | |
| Other | | | 2,381 | | | | 339 | | | | 369 | | | | 1,559 | | | | 4,648 | |
| | |
| | |
| | |
| | |
| | |
| |
| | Total | | $ | 73,595 | | | $ | 20,114 | | | $ | 10,561 | | | $ | 6,998 | | | $ | 111,268 | |
| | |
| | |
| | |
| | |
| | |
| |
It is our experience that a portion of finance receivables is repaid before contractual maturity dates. The above table, therefore, is not to be regarded as a forecast of future cash collections.
The aggregate finance receivables balances related to accounts past due more than 60 days at December 31 were as follows:
| | | | | | | | | | |
| | 2005 | | | 2004 | |
| |
| | |
| |
| | |
| | (in millions) | |
| Retail | | $ | 487 | | | $ | 500 | |
| Wholesale | | | 148 | | | | 143 | |
| Other | | | 13 | | | | 14 | |
| | |
| | |
| |
| | Total | | $ | 648 | | | $ | 657 | |
| | |
| | |
| |
Investments in direct financing leases, which are included in retail finance receivables, were as follows at December 31:
| | | | | | | | | | |
| | 2005 | | | 2004 | |
| |
| | |
| |
| | |
| | (in millions) | |
| Minimum lease rentals to be received, including origination costs | | $ | 3,232 | | | $ | 4,194 | |
| Estimated residual values | | | 2,417 | | | | 3,381 | |
| Less: Unearned income | | | (475 | ) | | | (677 | ) |
| Less: Allowance for credit losses | | | (56 | ) | | | (78 | ) |
| | |
| | |
| |
| | Net investment in direct financing leases | | $ | 5,118 | | | $ | 6,820 | |
| | |
| | |
| |
Future minimum rentals from direct financing leases for each of the five succeeding years are as follows (in millions): 2006 — $1,448; 2007 — $885; 2008 — $575; 2009 — $248; 2010 — $74; thereafter — $2.
FC-15
FORD MOTOR CREDIT COMPANY AND SUBSIDIARIES
NOTES TO THE FINANCIAL STATEMENTS — Continued
| |
| NOTE 5. | NET INVESTMENT IN OPERATING LEASES |
Net investment in operating leases at December 31 was as follows:
| | | | | | | | | | |
| | 2005 | | | 2004 | |
| |
| | |
| |
| | |
| | (in millions) | |
| Vehicles, at cost, including initial direct costs (a) | | $ | 28,460 | | | $ | 29,756 | |
| Less: Accumulated depreciation | | | (6,053 | ) | | | (7,585 | ) |
| Less: Allowance for credit losses | | | (194 | ) | | | (305 | ) |
| | |
| | |
| |
| | Net investment in operating leases | | $ | 22,213 | | | $ | 21,866 | |
| | |
| | |
| |
| | |
| (a) | | At December 31, 2005 and 2004, includes interests in operating leases and the related vehicles (net of accumulated depreciation) of $6.5 billion and $2.5 billion, respectively, that have been transferred for legal purposes to consolidated securitization SPEs and are available only for repayment of debt issued by those entities, and to pay other securitization investors and other participants; they are not available to pay our other obligations or the claims of our other creditors. |
Future minimum rentals on operating leases are as follows (in millions): 2006 — $3,348; 2007 — $2,952; 2008 — $1,701; 2009 — $369; 2010 — $9.
| |
| NOTE 6. | ALLOWANCE FOR CREDIT LOSSES |
Following is an analysis of the allowance for credit losses related to finance receivables and operating leases for the years ended December 31:
| | | | | | | | | | | | | | | | |
| | 2005 | | | 2004 | | | 2003 | |
| |
| | |
| | |
| |
| | |
| | (in millions) | |
| Balance, beginning of year | | $ | 2,434 | | | $ | 2,908 | | | $ | 2,999 | |
| | Provision for credit losses | | | 166 | | | | 900 | | | | 1,888 | |
| | Deductions | | | | | | | | | | | | |
| | | Charge-offs | | | 1,183 | | | | 1,804 | | | | 2,366 | |
| | | Recoveries | | | (477 | ) | | | (477 | ) | | | (475 | ) |
| | |
| | |
| | |
| |
| | | | Net charge-offs | | | 706 | | | | 1,327 | | | | 1,891 | |
| | Other changes, principally amounts related to finance receivables sold and translation adjustments | | | 308 | | | | 47 | | | | 88 | |
| | |
| | |
| | |
| |
| | | | Net deductions | | | 1,014 | | | | 1,374 | | | | 1,979 | |
| | |
| | |
| | |
| |
| Balance, end of year | | $ | 1,586 | | | $ | 2,434 | | | $ | 2,908 | |
| | |
| | |
| | |
| |
FC-16
FORD MOTOR CREDIT COMPANY AND SUBSIDIARIES
NOTES TO THE FINANCIAL STATEMENTS — Continued
| |
| NOTE 7. | SALES OF RECEIVABLES |
Servicing Portfolio
We retain servicing rights for receivables sold in off-balance sheet securitization and whole-loan sale transactions. The servicing portfolio is summarized in the following table for the years ended December 31:
| | | | | | | | | | | | | | | |
| | Retail | | | Wholesale | | | Total | |
| |
| | |
| | |
| |
| | |
| | (in millions) | |
| Servicing portfolio at December 31, 2003 | | $ | 33,921 | | | $ | 20,249 | | | $ | 54,170 | |
| | 2004 activity | | | | | | | | | | | | |
| | | Receivables sales | | | 6,933 | | | | — | | | | 6,933 | |
| | | Collections | | | (20,185 | ) | | | (1,345 | ) | | | (21,530 | ) |
| | |
| | |
| | |
| |
| Servicing portfolio at December 31, 2004 | | | 20,669 | | | | 18,904 | | | | 39,573 | |
| | 2005 activity | | | | | | | | | | | | |
| | | Receivables sales | | | 18,138 | | | | 1,561 | | | | 19,699 | |
| | | Collections and re-acquired receivables | | | (17,886 | ) | | | (20,465 | ) | | | (38,351 | ) |
| | |
| | |
| | |
| |
| Servicing portfolio at December 31, 2005 | | $ | 20,921 | | | $ | — | | | $ | 20,921 | |
| | |
| | |
| | |
| |
During the fourth quarter of 2005, we consolidated our off-balance sheet wholesale securitization program as a result of certain changes authorized in accordance with the transaction documents. The accounting consolidation did not have an impact on our earnings, back-up credit facilities, unsecured debt programs or other securitization programs. This transaction was primarily non-cash and increased receivables by $17.9 billion and debt by $15.8 billion upon consolidation.
Retained Interest in Securitized Assets
Components of retained interest in off-balance sheet securitized assets at December 31 included the following:
| | | | | | | | | | |
| | 2005 | | | 2004 | |
| |
| | |
| |
| | |
| | (in millions) | |
| Residual interest in securitization transactions | | $ | 1,094 | | | $ | 756 | |
| Restricted cash held for benefit of securitization SPEs | | | 199 | | | | 503 | |
| Subordinated securities | | | 127 | | | | 875 | |
| Interest in sold wholesale receivables and other trust assets | | | — | | | | 6,904 | |
| Senior securities | | | — | | | | 128 | |
| | |
| | |
| |
| | Retained interest in securitized assets | | $ | 1,420 | | | $ | 9,166 | |
| | |
| | |
| |
Investments in subordinated securities and restricted cash are senior to the residual interest in securitization transactions. Retained interests are recorded at fair value. The fair value of subordinated and senior securities is estimated based on market prices. In determining the fair value of residual interest in securitization transactions, we discount the present value of the projected cash flows retained at the transaction discount rate.
FC-17
FORD MOTOR CREDIT COMPANY AND SUBSIDIARIES
NOTES TO THE FINANCIAL STATEMENTS — Continued
NOTE 7. SALES OF RECEIVABLES — Continued
Investment and Other Income
The following table summarizes the activity related to off-balance sheet sales of receivables reported in investment and other income for the years ended December 31:
| | | | | | | | | | | | | | |
| | 2005 | | | 2004 | | | 2003 | |
| |
| | |
| | |
| |
| | |
| | (in millions) | |
| Servicing fees | | $ | 376 | | | $ | 372 | | | $ | 618 | |
| Income on interest in sold wholesale receivables and retained securities | | | 327 | | | | 588 | | | | 679 | |
| Net gain on sale of receivables | | | 74 | | | | 155 | | | | 373 | |
| Income on residual interest and other | | | 721 | | | | 815 | | | | 941 | |
| | |
| | |
| | |
| |
| | Investment and other income related to sales of receivables | | $ | 1,498 | | | $ | 1,930 | | | $ | 2,611 | |
| | |
| | |
| | |
| |
For the year ended December 31, 2005, we utilized certain point-of-sale assumptions in our retail transactions, which included a discount rate of 11.0%, prepayment speeds of 0.9% to 1.5% (which represents expected payments earlier than scheduled maturity dates) and credit losses of 0.1% to 2.3% over the life of sold receivables. The weighted-average life of the underlying assets was 51.9 months. For the year ended December 31, 2004, point-of-sale assumptions in our retail transactions included discount rates of 11.0% to 13.5%, prepayment speeds of 0.8% to 1.5% and credit losses of 0.8% to 2.8% over the life of sold receivables. For the year ended December 31, 2004, the weighted average life of the underlying assets was 50.2 months.
Cash Flow
The following table summarizes the cash flow movements between the transferees and us in our off-balance sheet sales of receivables for the years ended December 31:
| | | | | | | | | | | | | | | |
| | 2005 | | | 2004 | | | 2003 | |
| |
| | |
| | |
| |
| | |
| | (in millions) | |
| Proceeds from sales of receivables | | | | | | | | | | | | |
| | Proceeds from sales of retail receivables | | $ | 15,549 | | | $ | 4,795 | | | $ | 15,761 | |
| | Proceeds from interest in sold wholesale receivables | | | 3,739 | | | | 3,957 | | | | 966 | |
| | Proceeds from revolving-period securitizations | | | 1,349 | | | | 1,567 | | | | 2,610 | |
| | Proceeds from sale of retained notes — retail | | | 298 | | | | — | | | | — | |
| | |
| | |
| | |
| |
| | | Total | | $ | 20,935 | | | $ | 10,319 | | | $ | 19,337 | |
| | |
| | |
| | |
| |
| Cash flows related to net change in retained interest | | | | | | | | | | | | |
| | Interest in sold wholesale receivables | | $ | 2,684 | | | $ | (1,831 | ) | | $ | 1,140 | |
| | Interest in sold retail receivables | | | 708 | | | | 1,457 | | | | 893 | |
| | |
| | |
| | |
| |
| | | Total | | $ | 3,392 | | | $ | (374 | ) | | $ | 2,033 | |
| | |
| | |
| | |
| |
| Servicing fees | | | | | | | | | | | | |
| | Retail | | $ | 260 | | | $ | 260 | | | $ | 409 | |
| | Wholesale | | | 116 | | | | 112 | | | | 209 | |
| | |
| | |
| | |
| |
| | | Total | | $ | 376 | | | $ | 372 | | | $ | 618 | |
| | |
| | |
| | |
| |
| Other cash flows received on interests retained (which are reflected in securitization income) | | | | | | | | | | | | |
| | Wholesale | | $ | 507 | | | $ | 802 | | | $ | 810 | |
| | Retail | | | 276 | | | | 356 | | | | 735 | |
| | |
| | |
| | |
| |
| | | Total | | $ | 783 | | | $ | 1,158 | | | $ | 1,545 | |
| | |
| | |
| | |
| |
| Repurchased retail receivables | | $ | (43 | ) | | $ | (143 | ) | | $ | (193 | ) |
FC-18
FORD MOTOR CREDIT COMPANY AND SUBSIDIARIES
NOTES TO THE FINANCIAL STATEMENTS — Continued
NOTE 7. SALES OF RECEIVABLES — Continued
Other Disclosures
The following table summarizes key assumptions used in estimating cash flows from sold retail receivables and the corresponding sensitivity of the current fair values to 10% and 20% adverse changes:
| | | | | | | | | | | | | |
| | |
| | 2005 | |
| |
| |
| | | | |
| | | | Impact on Fair Value Based | |
| | | | on Adverse Change | |
| | Assumption | | |
| |
| | Percentage | | | 10% Change | | | 20% Change | |
| |
| | |
| | |
| |
| | (annual rate) | | | |
| | | | (in millions) | |
| Cash flow discount rate | | | 11.0% | | | $ | (12) | | | $ | (24) | |
| Estimated net credit loss rate | | | 0.1% - 5.0% | | | | (19) | | | | (38) | |
| Prepayment speed | | | 0.9% - 1.5% | | | | (3) | | | | (6) | |
The effect of a variation in a particular assumption on the fair value of residual interest in securitization transactions was calculated without changing any other assumptions and changes in one factor may result in changes in another.
Outstanding delinquencies over 30 days related to the off-balance sheet securitized portfolio were $386 million and $410 million at December 31, 2005 and 2004, respectively. Credit losses, net of recoveries, were $127 million and $244 million for the years ended December 31, 2005 and 2004, respectively. Expected static pool credit losses related to outstanding securitized retail receivables were 1.55% at December 31, 2005. To calculate the static pool credit losses, actual and projected future credit losses are added together and divided by the original balance of each pool of assets.
On-Balance Sheet Securitization SPEs
At December 31, 2005 and 2004, about $44.7 billion and $16.9 billion, respectively, of finance receivables have been sold for legal purposes to consolidated securitization SPEs. In addition, at December 31, 2005 and 2004, interests in operating leases and the related vehicles of $6.5 billion and $2.5 billion, respectively, have been transferred for legal purposes to consolidated securitization SPEs. These receivables and interests in operating leases and the related vehicles are available only for repayment of debt issued by those entities, and to pay other securitization investors and other participants; they are not available to pay our other obligations or the claims of our other creditors. At December 31, 2005 and 2004, associated debt of $39.8 billion and $16.5 billion, respectively, was issued by the SPEs and included both asset-backed commercial paper and notes payable out of collections on these receivables and interests in operating leases and the related vehicles. This debt is the legal obligation of the SPEs, but for financial statement reporting purposes is reported as debt on our balance sheet.
| |
| NOTE 8. | VARIABLE INTEREST ENTITIES |
We consolidate VIEs in which we are the primary beneficiary in the entity. On-balance sheet securitization SPEs, discussed in Note 7, are considered VIEs.
We have investments in certain joint ventures deemed to be VIEs of which we are not the primary beneficiary. The risks and rewards associated with our interests in these entities are based primarily on ownership percentages. Our maximum exposure (approximately $182 million at December 31, 2005) to any potential losses associated with these VIEs is limited to our equity investments and, where applicable, receivables due from the VIEs.
FC-19
FORD MOTOR CREDIT COMPANY AND SUBSIDIARIES
NOTES TO THE FINANCIAL STATEMENTS — Continued
NOTE 8. VARIABLE INTEREST ENTITIES — Continued
We also sell, under contractually-committed agreements, finance receivables to bank-sponsored asset-backed commercial paper issuers that are SPEs of the sponsor bank; these SPEs are not consolidated by us. In addition, certain of these SPEs hold notes issued by us that are backed by interests in operating leases and the related vehicles, which reduce the commitment of these SPEs to purchase finance receivables. The outstanding balance of finance receivables and notes that have been sold by us to these SPEs was approximately $5.6 billion and $4.6 billion at December 31, 2005 and 2004, respectively.
| |
| NOTE 9. | OTHER ASSETS AND OTHER LIABILITIES AND DEFERRED INCOME |
Other assets at December 31 were as follows:
| | | | | | | | | | |
| | 2005 | | | 2004 | |
| |
| | |
| |
| | |
| | (in millions) | |
| Accrued interest, rents and other non-finance receivables | | $ | 1,777 | | | $ | 1,804 | |
| Unamortized dealer commissions and other assets | | | 1,504 | | | | 1,625 | |
| Investment in used vehicles held for resale, at net realizable value | | | 1,060 | | | | 803 | |
| Prepaid reinsurance premiums and other reinsurance receivables | | | 1,025 | | | | 1,258 | |
| Collateral held for resale, at net realizable value | | | 567 | | | | 654 | |
| Property and equipment, net of accumulated depreciation of $327 in 2005 and $290 in 2004 | | | 323 | | | | 377 | |
| | |
| | |
| |
| | Total other assets | | $ | 6,256 | | | $ | 6,521 | |
| | |
| | |
| |
Other liabilities and deferred income at December 31 were as follows:
| | | | | | | | | | |
| | 2005 | | | 2004 | |
| |
| | |
| |
| | |
| | (in millions) | |
| Interest payable | | $ | 1,642 | | | $ | 2,204 | |
| Deferred income and other liabilities | | | 1,242 | | | | 1,534 | |
| Unearned insurance premiums | | | 1,120 | | | | 1,362 | |
| Retirement plan and postretirement health care and life insurance benefits | | | 777 | | | | 702 | |
| | |
| | |
| |
| | Total other liabilities and deferred income | | $ | 4,781 | | | $ | 5,802 | |
| | |
| | |
| |
FC-20
FORD MOTOR CREDIT COMPANY AND SUBSIDIARIES
NOTES TO THE FINANCIAL STATEMENTS — Continued
| |
| NOTE 10. | DEBT AND BACK-UP CREDIT FACILITIES |
Debt
At December 31, outstanding debt was as follows:
| | | | | | | | | | | | | | | | | | | | | | | | | | | |
| | | | | | |
| | Interest Rates | | | | | |
| |
| | | | | |
| | | | | | | | |
| | Average | | | Weighted- | | | | | |
| | Contractual (a) | | | Average (b) | | | | | |
| |
| | |
| | | | | |
| | 2005 | | | 2004 | | | 2005 | | | 2004 | | | 2005 | | | 2004 | |
| |
| | |
| | |
| | |
| | |
| | |
| |
| | | | | | | | | | |
| | | | | | | | | | (in millions) | |
Short-term debt | | | | | | | | | | | | | | | | | | | | | | | | |
| | Asset-backed commercial paper (c) | | | 4.3 | % | | | 2.1 | % | | | | | | | | | | $ | 21,751 | | | $ | 12,612 | |
| | Ford Interest Advantage (d) | | | 4.9 | % | | | 2.5 | % | | | | | | | | | | | 6,719 | | | | 7,718 | |
| | Commercial paper — unsecured | | | 4.8 | % | | | 2.4 | % | | | | | | | | | | | 1,041 | | | | 8,916 | |
| | Other short-term debt (e) | | | 5.8 | % | | | 4.8 | % | | | | | | | | | | | 2,325 | | | | 2,562 | |
| | | | | | | | | | | | | | |
| | |
| |
| | | Total short-term debt | | | 4.6 | % | | | 2.5 | % | | | 5.0 | % | | | 2.8 | % | | | 31,836 | | | | 31,808 | |
| | | | | | | | | | | | | | |
| | |
| |
Long-term debt | | | | | | | | | | | | | | | | | | | | | | | | |
| | Senior indebtedness | | | | | | | | | | | | | | | | | | | | | | | | |
| Notes payable within one year (f) | | | | | | | | | | | | | | | | | | | 20,823 | | | | 29,449 | |
| Notes payable after one year (g) | | | | | | | | | | | | | | | | | | | 63,879 | | | | 79,233 | |
| Unamortized discount | | | | | | | | | | | | | | | | | | | (62 | ) | | | (61 | ) |
| | Asset-backed debt (h) | | | | | | | | | | | | | | | | | | | | | | | | |
| Notes payable within one year | | | | | | | | | | | | | | | | | | | 5,357 | | | | 624 | |
| Notes payable after one year | | | | | | | | | | | | | | | | | | | 12,667 | | | | 3,221 | |
| | | | | | | | | | | | | | |
| | |
| |
| | | Total long-term debt (i) | | | 5.9 | % | | | 5.8 | % | | | 5.1 | % | | | 4.4 | % | | | 102,664 | | | | 112,466 | |
| | | | | | | | | | | | | | |
| | |
| |
| | | Total debt | | | 5.6 | % | | | 5.0 | % | | | 5.1 | % | | | 4.0 | % | | $ | 134,500 | | | $ | 144,274 | |
| | | | | | | | | | | | | | |
| | |
| |
Estimated fair value of debt | | | | | | | | | | | | | | | | | | | | | | | | |
| | Short-term debt subject to fair value | | | | | | | | | | | | | | | | | | $ | 31,836 | | | $ | 31,808 | |
| | Short-term debt fair value | | | | | | | | | | | | | | | | | | | 31,836 | | | | 31,808 | |
| | Long-term debt subject to fair value (j) | | | | | | | | | | | | | | | | | | | 101,104 | | | | 109,320 | |
| | Long-term debt fair value | | | | | | | | | | | | | | | | | | | 97,884 | | | | 114,662 | |
| | | Total estimated fair value of debt | | | | | | | | | | | | | | | | | | | 129,720 | | | | 146,470 | |
Interest rate characteristics of debt payable after one year(k) | | | | | | | | | | | | | | | | | | | | | | | | |
| | Fixed interest rates | | | | | | | | | | | | | | | | | | $ | 55,515 | | | $ | 65,311 | |
| | Variable interest rates (generally based on LIBOR or other short-term rates) | | | | | | | | | | | | | | | | | | | 20,969 | | | | 17,082 | |
| | | | | | | | | | | | | | |
| | |
| |
| | | Total payable after one year | | | | | | | | | | | | | | | | | | $ | 76,484 | | | $ | 82,393 | |
| | | | | | | | | | | | | | |
| | |
| |
| | |
| (a) | | Fourth quarter average contractual rates exclude the effects of interest rate swap agreements and facility fees. |
| |
| (b) | | Fourth quarter weighted-average rates include the effects of interest rate swap agreements and facility fees. |
| |
| (c) | | Amounts represent asset-backed commercial paper issued by consolidated securitization SPEs and are payable out of collections on the finance receivables. This debt is the legal obligation of the securitization SPEs. |
| |
| (d) | | The Ford Interest Advantage program consists of our floating rate demand notes. |
| |
| (e) | | Includes $52 million and $17 million with affiliated companies at December 31, 2005 and 2004, respectively. |
| |
| (f) | | Includes $77 million with affiliated companies at December 31, 2004. |
| |
| (g) | | Includes $126 million and $32 million with affiliated companies at December 31, 2005 and 2004, respectively. |
| |
| (h) | | Asset-backed debt is issued by consolidated securitization SPEs and is payable out of collections on the finance receivables or interests in operating leases and the related vehicles transferred to the SPEs. This debt is the legal obligation of the securitization SPEs. |
| |
| (i) | | Average contractual and weighted-average interest rates for total long-term debt reflects the rates for both notes payable within one year and notes payable after one year. |
| |
| (j) | | Represents the par value of debt. |
| |
| (k) | | Excludes the effect of interest rate swap agreements. |
FC-21
FORD MOTOR CREDIT COMPANY AND SUBSIDIARIES
NOTES TO THE FINANCIAL STATEMENTS — Continued
NOTE 10. DEBT AND BACK-UP CREDIT FACILITIES — Continued
Debt consists of short-term and long-term unsecured and asset-backed debt, placed directly by us or through securities dealers or underwriters, and bank borrowings. We consider any debt with an original maturity of twelve months or less to be short-term debt. In 2005, we had commercial paper programs in the United States, Europe, Canada and other international markets, and asset-backed commercial paper programs in the United States, with sales mostly to qualified institutional investors. We also obtain short-term funding from the sale of demand notes to retail investors through our floating rate demand notes program. Some of our asset-backed securitization programs issue short-term debt securities that are sold by underwriters to institutional investors. Bank borrowings by several of our international affiliates in the ordinary course of business are an additional source of short-term funding.
We obtain long-term debt funding through the issuance of a variety of debt securities in the United States and international capital markets. Long-term debt is debt with an original maturity of more than twelve months. We use several long-term unsecured funding programs, including notes offered with a variety of maturities of two years and longer, and medium-term notes sold through sales agents in smaller amounts in various currencies. We reach both retail and institutional investors in our long-term unsecured funding programs. In 2005, we accessed retail investors in the United States through our Continuously Offered Bonds for Retail Accounts program, in Canada through our Term Bonds in Retail Distribution program, and in select European markets through our Continuously Available Retail Securities program. We also sponsor a number of asset-backed securitization programs that issue long-term debt securities that are sold to institutional investors in the United States, Europe and Asia-Pacific.
Our Ford Interest Advantage program consists of floating rate demand notes issued and offered by us. The nominal interest rate as of December 31, 2005 ranged from 4.8% to 5.1% depending on the amount invested.
Our overall weighted-average effective interest rate (borrowing cost), including the effect of interest rate swap agreements, was 4.5% and 3.8% for full year 2005 and 2004, respectively.
The average remaining maturities of our commercial paper was 45 days at December 31, 2005 and 36 days at December 31, 2004 for our United States, Canada and Europe programs. Senior notes, including asset backed securitized programs, mature at various dates through 2078 (about $1.4 billion matures between 2031 and 2078). Maturities are as follows (in millions): 2006 — $26,180; 2007 — $26,134; 2008 — $17,882; 2009 — $12,769; 2010 — $6,779; thereafter — $12,920. Certain of these obligations are denominated in currencies other than the currency of the issuing country. Foreign currency swap and forward agreements are used to hedge exposure to changes in exchange rates of these obligations.
The fair value of debt is estimated based upon quoted market prices or current rates for similar debt with the same remaining maturities. For short-term debt, the book value approximates fair value because of the short maturities of these instruments.
Back-Up Credit Facilities
At December 31, 2005, we and our majority-owned subsidiaries had $6.2 billion of contractually committed credit facilities with financial institutions, of which $5.1 billion were available for use. Of the lines available for use, 36% are committed through June 30, 2010. Of the $6.2 billion, about $3.8 billion constitute Ford Credit facilities ($3.2 billion global and $600 million non-global) and $2.4 billion are FCE facilities ($2.3 billion global and $100 million non-global). Our global credit facilities may be used, at our option, by any of our direct or indirect majority-owned subsidiaries. We
FC-22
FORD MOTOR CREDIT COMPANY AND SUBSIDIARIES
NOTES TO THE FINANCIAL STATEMENTS — Continued
NOTE 10. DEBT AND BACK-UP CREDIT FACILITIES — Continued
or FCE, as the case may be, will guarantee any such borrowings. All of the global credit facilities have substantially identical contract terms (other than commitment amounts) and are free of material adverse change clauses and restrictive financial covenants (for example, debt-to-equity limitations and minimum net worth requirements) and credit rating triggers that could limit our ability to borrow.
At Ford’s option, Ford’s global lines of credit of $6.5 billion may be used by any of its direct or indirect majority-owned subsidiaries on a guaranteed basis. Ford also has the ability to transfer, on a non-guaranteed basis, $2.2 billion of such credit lines to us and $500 million to FCE.
Additionally, at December 31, 2005, banks provided $18.7 billion of contractually committed liquidity facilities exclusively to support our two on-balance sheet asset-backed commercial paper programs; $18.2 billion supported our retail securitization program (“FCAR”) and $500 million supported our Motown NotesSM wholesale securitization program (“Motown Notes”). The FCAR and Motown Notes programs must be supported by liquidity facilities equal to at least 100% and 5%, respectively, of their face amount. At December 31, 2005, about $17.7 billion of FCAR’s bank credit facilities were available to support FCAR’s asset-backed commercial paper or subordinated debt. The remaining $500 million of available credit lines could be accessed for additional funding if FCAR issued additional subordinated debt. Utilization of these facilities is subject to conditions specific to each program and our having a sufficient amount of securitizable assets. At December 31, 2005, the outstanding balances were $15.3 billion for the FCAR program and $6.5 billion for the Motown Notes program.
Ford’s consolidated United States federal and state income tax returns include certain of our domestic subsidiaries and us. In accordance with our intercompany tax sharing agreement with Ford, the United States income tax liabilities or credits are allocated to us generally on a separate return basis. The provision for income taxes for the years ended December 31 was estimated as follows:
| | | | | | | | | | | | | | | | |
| | 2005 | | | 2004 | | | 2003 | |
| |
| | |
| | |
| |
| | |
| | (in millions) | |
| Currently payable/(receivable) | | | | | | | | | | | | |
| | United States federal | | $ | — | | | $ | — | | | $ | — | |
| | Foreign | | | 206 | | | | 136 | | | | 198 | |
| | State and local | | | (24 | ) | | | 6 | | | | 21 | |
| | |
| | |
| | |
| |
| | | Total currently payable | | | 182 | | | | 142 | | | | 219 | |
| Deferred tax liability | | | | | | | | | | | | |
| | United States federal | | | 943 | | | | 1,266 | | | | 653 | |
| | Foreign | | | 161 | | | | 157 | | | | 118 | |
| | State and local | | | 123 | | | | 83 | | | | 144 | |
| | |
| | |
| | |
| |
| | | Total deferred | | | 1,227 | | | | 1,506 | | | | 915 | |
| | |
| | |
| | |
| |
| | | | Provision for income taxes | | $ | 1,409 | | | $ | 1,648 | | | $ | 1,134 | |
| | |
| | |
| | |
| |
A reconciliation of the provision for income taxes with the United States statutory tax rate as a percentage of income before income taxes, excluding equity in net income of affiliated companies,
FC-23
FORD MOTOR CREDIT COMPANY AND SUBSIDIARIES
NOTES TO THE FINANCIAL STATEMENTS — Continued
NOTE 11. INCOME TAXES — Continued
minority interest in net income of a joint venture, and discontinued operations, is shown below for the years ended December 31:
| | | | | | | | | | | | | | | |
| | 2005 | | | 2004 | | | 2003 | |
| |
| | |
| | |
| |
| Statutory tax rate | | | 35.0 | % | | | 35.0 | % | | | 35.0 | % |
| Effect of (in percentage points): | | | | | | | | | | | | |
| | State and local income taxes | | | 1.7 | | | | 1.8 | | | | 3.5 | |
| | Investment income not subject to tax or subject to tax at reduced rates | | | (0.1 | ) | | | (0.1 | ) | | | (0.2 | ) |
| | Other | | | (0.1 | ) | | | 0.5 | | | | 0.1 | |
| | |
| | |
| | |
| |
| | | Effective tax rate | | | 36.5 | % | | | 37.2 | % | | | 38.4 | % |
| | |
| | |
| | |
| |
Deferred tax assets and liabilities reflect the estimated tax effect of accumulated temporary differences between assets and liabilities for financial reporting purposes and those amounts as measured by tax laws and regulations. The components of deferred tax assets and liabilities at December 31 were as follows:
| | | | | | | | | | | | |
| | 2005 | | | 2004 | |
| |
| | |
| |
| | |
| | (in millions) | |
| Deferred tax assets | | | | | | | | |
| | Provision for credit losses | | $ | 1,749 | | | $ | 1,934 | |
| | Net operating losses and foreign tax credits | | | 1,095 | | | | 1,725 | |
| | Alternative minimum tax | | | 322 | | | | 336 | |
| | Employee benefit plans | | | 260 | | | | 229 | |
| | Other | | | 205 | | | | 204 | |
| | |
| | |
| |
| | | Total deferred tax assets | | | 3,631 | | | | 4,428 | |
| | |
| | |
| |
| Deferred tax liabilities | | | | | | | | |
| | Leasing transactions | | | 7,736 | | | | 7,913 | |
| | Finance receivables | | | 2,839 | | | | 2,826 | |
| | Sales of receivables | | | 1,204 | | | | 1,016 | |
| | Other | | | 624 | | | | 266 | |
| | |
| | |
| |
| | | Total deferred tax liabilities | | | 12,403 | | | | 12,021 | |
| | |
| | |
| |
| | | | Net deferred income tax liability | | $ | 8,772 | | | $ | 7,593 | |
| | |
| | |
| |
We have an intercompany tax sharing agreement with Ford. Under this agreement, United States income tax liabilities or credits are allocated to us, generally on a separate return basis. In this regard, the deferred tax assets related to net operating losses and foreign tax credits represent amounts primarily due from Ford.
| |
| NOTE 12. | DERIVATIVE FINANCIAL INSTRUMENTS |
SFAS 133 establishes accounting and reporting standards for derivative instruments and requires that all derivatives be recorded at fair value on the balance sheet, including embedded derivatives.
To protect our operations from global market risks, including the effects of changes in foreign currency exchange rates and interest rates, we use various financial instruments, commonly referred to as derivatives. We have elected to apply hedge accounting to a portion of these derivatives. To qualify for hedge accounting treatment, each derivative is designated and documented as a hedge at inception and evaluated for effectiveness throughout the hedge period. Some derivatives either do not qualify for hedge accounting under SFAS 133 or we elect not to apply hedge accounting and
FC-24
FORD MOTOR CREDIT COMPANY AND SUBSIDIARIES
NOTES TO THE FINANCIAL STATEMENTS — Continued
NOTE 12. DERIVATIVE FINANCIAL INSTRUMENTS — Continued
report the mark to fair value in earnings. Regardless of hedge accounting treatment, we only enter into transactions with a high correlation with the underlying risk. Our interest rate risk management objective is to maximize our financing income while limiting the effect of changes in interest rates. We achieve this objective by setting an established risk tolerance range and staying within the tolerance through our risk management process. Our hedging program adheres to a strict risk management policy and the program is reviewed on a regular basis by our management. We do not engage in any trading, market-making or other speculative activities in the derivative markets.
The use of derivatives to manage market risk results in counterparty risk, or the risk of a counterparty defaulting on a derivative contract. We enter into master netting agreements with counterparties that usually allow for netting of certain exposures. We establish exposure limits for each counterparty to minimize risk and provide counterparty diversification. Substantially all our counterparty exposures are with counterparties that have long-term debt ratings of single-A or better.
Nature of Exposure
Currency Exchange Rate Risk
We face exposure to currency exchange rates if a mismatch exists between the currency of our receivables and the currency of the debt funding those receivables. When possible, we fund receivables with debt in the same currency, minimizing exposure to exchange rate movements. When funding is in a different currency, we execute the following foreign currency derivatives to convert substantially all of our foreign currency debt obligations to the currency of the receivables:
| | |
| | • | Cross-currency swaps — an agreement to convert non-U.S. dollar long-term debt to U.S. dollar denominated payments or non-local market debt to local market debt for our international affiliates; or |
| |
| | • | Foreign currency forwards — an agreement to buy or sell an amount of funds in an agreed currency at a certain time in the future for a certain price. |
Interest Rate Risk
Re-pricing risk arises when assets and the related debt have different re-pricing periods and, consequently, respond differently to changes in interest rates. The financial instruments used in our interest rate risk management process are called interest rate swaps.
| | |
| | • | Interest rate swaps — an agreement to convert fixed-rate interest payments to floating or floating-rate interest payments to fixed. |
Net Investment in Foreign Operations
We use foreign currency forward exchange contracts and options to hedge the net assets of certain foreign entities to offset the translation and economic exposures related to our investment in these entities.
Balance Sheet Impact
The fair value of derivatives reflects the price that a third party would be willing to pay or receive in an arm’s length transaction and includes mark-to-market adjustments to reflect the effect of changes in interest rates, accrued interest and, for derivatives with a foreign currency component, a revaluation adjustment. The following table summarizes the estimated net fair value of our derivative
FC-25
FORD MOTOR CREDIT COMPANY AND SUBSIDIARIES
NOTES TO THE FINANCIAL STATEMENTS — Continued
NOTE 12. DERIVATIVE FINANCIAL INSTRUMENTS — Continued
financial instruments at December 31, taking into consideration the effects of legally enforceable netting agreements, which allow us to settle positive and negative positions with the same counterparty on a net basis:
| | | | | | | | | | | | | | | | | | | | | | | | | | |
| | | | |
| | 2005 | | | 2004 | |
| |
| | |
| |
| | | | Fair | | | Fair | | | | | Fair | | | Fair | |
| | | | Value | | | Value | | | | | Value | | | Value | |
| | Notional | | | Assets | | | Liabilities | | | Notional | | | Assets | | | Liabilities | |
| |
| | |
| | |
| | |
| | |
| | |
| |
| | (in billions) | | | | | (in billions) | | | |
| | | | (in millions) | | | | | (in millions) | |
| Interest rate swaps | | $ | 125 | | | $ | 1,657 | | | $ | 96 | | | $ | 135 | | | $ | 3,074 | | | $ | 180 | |
| Foreign currency swaps | | | 16 | | | | 1,089 | | | | 789 | | | | 24 | | | | 4,201 | | | | 816 | |
| Forwards and options (a) | | | 9 | | | | 6 | | | | — | | | | 7 | | | | — | | | | 260 | |
| Impact of netting agreements | | | — | | | | (205 | ) | | | (205 | ) | | | — | | | | (345 | ) | | | (345 | ) |
| | |
| | |
| | |
| | |
| | |
| | |
| |
| | Total derivative financial instruments | | $ | 150 | | | $ | 2,547 | | | $ | 680 | | | $ | 166 | | | $ | 6,930 | | | $ | 911 | |
| | |
| | |
| | |
| | |
| | |
| | |
| |
| | |
| (a) | | Includes internal forward contracts between Ford Credit and an affiliated company. |
Income Statement Impact
Changes in derivative fair values are recognized in current earnings or accumulated other comprehensive income depending on whether the derivative has been designated and qualifies for hedge accounting and, if so, the type of hedge designation.
Cash Flow Hedges
Changes in the fair value of derivatives designated as cash flow hedges, to the extent the hedge is effective, are included in accumulated other comprehensive income, a component of stockholder’s equity, and are reclassified to earnings at the time the associated hedged transaction affects net income. The impact to earnings from hedge ineffectiveness was a loss of $43 million in 2005, a gain of $12 million in 2004 and a gain of $3 million in 2003, which was recorded in other income. In assessing hedge effectiveness for cash flow hedges related to interest rates, we use the variability of cash flows method and exclude accrued interest. Net interest settlements and accruals excluded from the assessment of hedge effectiveness were expenses of $71 million, $354 million and $482 million in 2005, 2004 and 2003, and were recorded in interest expense. While net interest settlements and accruals are excluded from our hedge effectiveness testing, they are included in evaluating our overall risk management objective to maximize our financing income while limiting the effect of changes in interest rates.
We expect to reclassify gains of approximately $56 million ($36 million after tax) from stockholder’s equity to net income during the next twelve months. Events that may cause reclassification of amounts from accumulated other comprehensive income to net income include initiation or discontinuation of cash flow hedge accounting, interest settlements on the associated hedged transaction, and changes in interest rates. Consistent with our comprehensive risk-management practices, neither these nor future reclassifications are anticipated to have a material effect on net income.
Fair Value Hedges
Changes in the fair value of derivatives designated as fair value hedges, along with the changes in the fair value of the underlying hedged exposure, are recognized in income. The impact to
FC-26
FORD MOTOR CREDIT COMPANY AND SUBSIDIARIES
NOTES TO THE FINANCIAL STATEMENTS — Continued
NOTE 12. DERIVATIVE FINANCIAL INSTRUMENTS — Continued
earnings from hedge ineffectiveness was a loss of $1 million in 2005, a gain of $10 million in 2004 and a gain of $255 million in 2003, which was recorded in other income. In assessing hedge effectiveness, we exclude accrued interest on the receive and pay legs of the swap. Net interest settlements and accruals reflecting income of $1.1 billion, $2.1 billion and $1.8 billion in 2005, 2004 and 2003 were recorded as a reduction in interest expense. We also exclude from the assessment of hedge effectiveness foreign exchange adjustments, representing the portion of the derivative’s fair value attributable to the change in foreign currency exchange rates for the reporting period, which were unfavorable adjustments of $365 million in 2005, and favorable adjustments of $384 million in 2004 and $1.3 billion in 2003; these adjustments were recorded in other income. While net interest settlements and accruals and foreign currency adjustments are excluded from our hedge effectiveness testing, they are included in evaluating our overall risk management objective to offset the economic impact of changes in interest rates and foreign currency exchange rates. The adjustments related to foreign currency derivatives reported above were offset by net revaluation impacts on debt denominated in a currency other than the location’s functional currency, which was also recorded in other income.
Net Investment Hedges
We use foreign currency forward exchange contracts and options to hedge the net assets of certain foreign entities to offset the translation and economic exposures related to our investment in these entities. Changes in the value of these derivative instruments are included in accumulated other comprehensive income as a foreign currency translation adjustment. Ineffectiveness, which is recognized in other income, was a loss of $13 million, $29 million and $17 million in 2005, 2004 and 2003, respectively.
Other Derivative Instruments
As previously stated, some derivatives do not qualify for hedge accounting treatment or we elect not to apply hedge accounting (“non-designated”). Both gains and losses related to non-designated derivatives were recorded in other income. The earnings impact primarily related to interest rate swaps, which are included in evaluating our overall risk management objective, and revaluation of foreign currency derivatives, which are offset by the revaluation of foreign denominated debt.
| |
| NOTE 13. | DISPOSITIONS AND OTHER ACTIONS |
Consistent with our strategy to focus on our core business, we completed the disposition of the operations referenced below during 2003 through 2005. We reported these operations as discontinued in accordance with Statement of Financial Accounting Standards No. 144,Accounting for the Impairment or Disposal of Long-lived Assets,for all periods shown.
During the fourth quarter of 2004, we committed to a plan to sell Triad Financial Corporation, our operation in the United States that specialized in automobile retail installment sales contracts with borrowers who generally would not be expected to qualify, based on their credit worthiness, for traditional financing sources such as those provided by commercial banks or automobile manufacturers’ affiliated finance companies. During the second quarter of 2005, we completed the sale of this business and recognized a $4 million after-tax gain on disposal of discontinued operations.
FC-27
FORD MOTOR CREDIT COMPANY AND SUBSIDIARIES
NOTES TO THE FINANCIAL STATEMENTS — Continued
| |
| NOTE 13. | DISPOSITIONS AND OTHER ACTIONS — Continued |
In 2004, we completed the sale of AMI Leasing and Fleet Management Services, our operation in the United States that offered full service car and truck leasing. In 2003, we recognized a $55 million after-tax loss on disposal of discontinued operations. This amount represented the difference between the selling price of these assets, less costs to sell them, and their recorded book value.
In 2003, we completed the sale of Axus, our all-makes vehicle fleet leasing operations in Europe, New Zealand and Australia. In 2002, we recognized a $31 million after-tax loss on disposal of discontinued operations. This amount represented the difference between the selling price of these assets, less costs to sell them, and their recorded book value.
Operating results of our discontinued operations for the years ended December 31 are as follows:
| | | | | | | | | | | | | | |
| | 2005 | | | 2004 | | | 2003 | |
| |
| | |
| | |
| |
| | |
| | (in millions) | |
| Total financing margin and other revenue | | $ | 118 | | | $ | 395 | | | $ | 446 | |
| Income before income taxes | | $ | 59 | | | $ | 138 | | | $ | 83 | |
| Less: Provision for income taxes | | | 22 | | | | 57 | | | | 31 | |
| | |
| | |
| | |
| |
| | Income from discontinued operations | | $ | 37 | | | $ | 81 | | | $ | 52 | |
| | |
| | |
| | |
| |
At December 31, 2004, assets of our discontinued operations totaled $2.2 billion and consisted primarily of net finance receivables of $1.7 billion and retained interest in securitized assets of about $350 million.
In 2004, we announced a plan to create an integrated sales platform in the United States and Canada over the next two years that would support sales activities for Ford Credit and our other business operating units. The plan included the consolidation of regional sales offices and an integration of branch locations. We recognized pre-tax charges related to the plan of $41 million and $11 million in 2005 and 2004, respectively. The costs associated with the sales branch integration were charged to operating expenses. The integration will be completed in 2006.
The table below summarizes the pre-tax charges incurred, the related liability at December 31 and the estimated total costs for the sales branch integration:
| | | | | | |
| | 2005 | |
| |
| |
| | (in millions) | |
| Liability at December 31, 2004 | | $ | 10 | |
| | Accrued in 2005 | | | 41 | |
| | Paid in 2005 | | | (36 | ) |
| | |
| |
| Liability at December 31, 2005 | | $ | 15 | |
| | |
| |
| Estimated total costs | | $ | 61 | |
| |
| Employee Separation Actions |
In 2005, we completed various separation programs for North American and International salaried employees in connection with reorganization and efficiency actions. We recognized pre-tax charges of $36 million in 2005 as a result of these actions (excluding costs for retirement plan and postretirement health care and life insurance benefits).
FC-28
FORD MOTOR CREDIT COMPANY AND SUBSIDIARIES
NOTES TO THE FINANCIAL STATEMENTS — Continued
| |
| NOTE 13. | DISPOSITIONS AND OTHER ACTIONS — Continued |
During the fourth quarter of 2004, management approved a strategy to restructure certain unconsolidated investments in the Asia-Pacific region. As a result, income from continuing operations before income taxes included an asset impairment charge of $40 million.
| |
| NOTE 14. | RETIREMENT BENEFITS AND STOCK OPTIONS |
We are a participating employer in certain retirement, postretirement health care and life insurance and stock option plans that are sponsored by Ford. As described below, Ford allocates costs to us based on the total number of participating or eligible employees at Ford Credit. Further information about these sponsored plans is available in Ford’s Annual Report on Form 10-K for the year ended December 31, 2005, filed separately with the Securities and Exchange Commission (“SEC”).
| |
| Employee Retirement Plans |
Retirement benefits are provided under defined benefit plans for our employees by the Ford General Retirement Plan, for employees in the United States hired on or before December 31, 2003. Effective January 1, 2004, Ford established a defined contribution plan generally covering new salaried United States employees, including our employees, hired on or after that date. Ford Credit employees of certain foreign subsidiaries are covered under other Ford retirement plans. We are a participating employer in these Ford-sponsored retirement plans and costs are allocated to us based on the total number of participating employees at Ford Credit. Benefits under the plans are generally based on an employee’s length of service, salary and contributions. The allocation amount can be impacted by key assumptions (for example, discount rate, expected return on plan assets and average rate of increase in compensation) that Ford uses in determining its retirement plan obligations.
Retirement plan costs allocated to Ford Credit for our employees in the United States participating in the Ford-sponsored plans was $29 million, $18 million and $25 million in 2005, 2004 and 2003, respectively. The amount for 2005 included costs related to the employee separation actions described in Note 13. The allocated cost for 2005, which was charged to operating expense, was equivalent to approximately 2% of Ford’s total retirement plan cost.
| |
| Postretirement Health Care and Life Insurance Benefits |
Postretirement health care benefits are provided under the Ford Salary Health Care Plan, which provides benefits to retired salaried employees in the United States hired before June 1, 2001. In December 2003, Ford announced a new postretirement health care plan for retired salaried employees in the United States hired on or after June 1, 2001. The plan provides for annual company allocations to employee-specific notional accounts to be used to fund postretirement health care. Effective June 1, 2007, for salaried employees in the United States, Ford established a company contribution limit set at 2006 levels for health care benefits. In addition, for salaried employees in the United States hired before January 1, 2004 who retired on or after June 1, 2006, company paid retiree life insurance benefits are limited to $50,000 (employees hired on or after January 1, 2004 do not receive company paid life insurance benefits). Our employees generally may become eligible for these benefits if they retire while working for us; however, benefits and eligibility rules may be modified from time to time.
FC-29
FORD MOTOR CREDIT COMPANY AND SUBSIDIARIES
NOTES TO THE FINANCIAL STATEMENTS — Continued
| |
| NOTE 14. | RETIREMENT BENEFITS AND STOCK OPTIONS — Continued |
Postretirement health care and life insurance costs assigned to Ford Credit for our employees in the United States participating in the Ford-sponsored plans was $46 million, $35 million and $49 million in 2005, 2004 and 2003, respectively. The amount for 2005 included costs related to the employee separation actions described in Note 13. The allocated cost for 2005, which was charged to operating expense, was equivalent to approximately 2% of Ford’s total postretirement health care and life insurance benefits cost.
Certain of our employees have been granted stock options under Ford’s Long-term Incentive Plans. Costs of these stock option plans are allocated to us based on the total number of employees at Ford Credit that are eligible for stock options.
Employee stock option expense allocated to Ford Credit for our employees participating in the Ford-sponsored plans was $8 million, $8 million and $13 million in 2005, 2004 and 2003, respectively. The allocated expense for 2005, which was charged to operating expense, was equivalent to approximately 7% of Ford’s total stock option expense.
FC-30
FORD MOTOR CREDIT COMPANY AND SUBSIDIARIES
NOTES TO THE FINANCIAL STATEMENTS — Continued
| |
| NOTE 15. | TRANSACTIONS WITH AFFILIATED COMPANIES |
Transactions with Ford and affiliated companies occur in the ordinary course of business. In addition to participating in pension and other retirement benefit plans sponsored by Ford (discussed in Note 14), we have a profit maintenance agreement with Ford that requires Ford to maintain our consolidated income before income taxes and net income at specified minimum levels; no payments were made under this agreement during 2003 through 2005. A copy of the formally documented agreement with Ford relating to certain long-standing business practices with Ford was filed with the SEC on October 18, 2001.
The income statement effects for the years ended December 31 of transactions with affiliated companies were as follows (reductions to income from continuing operations before income taxes are presented as negative amounts):
| | | | | | | | | | | | | |
| | 2005 | | | 2004 | | | 2003 | |
| |
| | |
| | |
| |
| | |
| | (in millions) | |
| Interest supplements and other support costs earned from Ford and affiliated companies (a) | | $ | 3,259 | | | $ | 3,360 | | | $ | 3,476 | |
| Earned insurance premiums ceded to a Ford-owned affiliate | | | (550 | ) | | | (590 | ) | | | (643 | ) |
| Residual value support earned from Ford and affiliated companies (b) | | | 374 | | | | 184 | | | | 238 | |
| Payments to Ford for marketing support, advice and services (c) | | | (285 | ) | | | (191 | ) | | | (172 | ) |
| Loss and loss adjustment expenses recovered from a Ford-owned affiliate | | | 279 | | | | 329 | | | | 378 | |
| Interest expense on debt with Ford and affiliated companies | | | (30 | ) | | | (26 | ) | | | (58 | ) |
| Interest income earned on receivables with Ford-owned dealers (d) | | | 14 | | | | 18 | | | | 3 | |
| Interest income earned on notes receivables from Ford and affiliated companies | | | 8 | | | | 11 | | | | 23 | |
| Interest income earned from tax sharing agreement with Ford (e) | | | — | | | | 81 | | | | 89 | |
| | |
| | (a) | We charge Ford for interest supplements and other support costs as they are earned; these payments are recorded in financing revenue. |
| |
| | (b) | An agreement with Ford provides for payments to us for residual value support on certain vehicle contracts; payments received from Ford are primarily included in depreciation on vehicles subject to operating leases. |
| |
| | (c) | We receive technical and administrative advice and services from Ford and its affiliates, occupy office space furnished by Ford and its affiliates, utilize data processing facilities maintained by Ford and receive marketing support from Ford. The costs for these services are charged to operating expenses. |
| |
| | (d) | Certain entities are reported as consolidated subsidiaries of Ford; revenue from providing financing to these entities is included in financing revenue. |
| |
| | (e) | We recorded a deferred tax asset for amounts due from Ford under our intercompany tax sharing agreement with Ford. To the extent interest income is earned by us under this agreement, it is included in other income. |
FC-31
FORD MOTOR CREDIT COMPANY AND SUBSIDIARIES
NOTES TO THE FINANCIAL STATEMENTS — Continued
NOTE 15. TRANSACTIONS WITH AFFILIATED COMPANIES — Continued
Balance Sheet
The balance sheet effects at December 31 of transactions with affiliated companies were as follows:
| | | | | | | | | | |
| | 2005 | | | 2004 | |
| |
| | |
| |
| | |
| | (in millions) | |
| Net finance receivables and operating leases | | | | | | | | |
| | Receivables purchased from certain divisions and affiliates of Ford (a) | | $ | 5,461 | | | $ | 2,997 | |
| | Finance receivables with Ford-owned entities (b) | | | 1,603 | | | | 1,774 | |
| | Net investment in vehicles leased to employees of Ford and affiliated companies (c) | | | 877 | | | | 898 | |
| Other assets/(liabilities) | | | | | | | | |
| | Notes and accounts receivables from Ford and affiliated companies | | | 1,235 | | | | 1,780 | |
| | Vehicles held for resale that were purchased from Ford and affiliated companies (d) | | | 1,060 | | | | 803 | |
| | Income tax receivable from Ford (e) | | | 770 | | | | 1,371 | |
| | Interest supplements due from Ford related to sold receivables (f) | | | 444 | | | | 554 | |
| | Derivative asset/(liability) with Ford | | | 7 | | | | (273 | ) |
| Debt with Ford and affiliated companies | | | (178 | ) | | | (126 | ) |
| | |
| | (a) | We purchase certain receivables generated by divisions and affiliates of Ford, primarily in connection with the delivery of vehicle inventories from Ford, the sale of parts and accessories by Ford to dealers, and the purchase of other receivables generated by Ford. These receivables are included in net finance receivables and include the impact of consolidating our off- balance sheet wholesale securitization program in the fourth quarter of 2005. At December 31, 2005, approximately $1.5 billion of these assets are subject to limited guarantees by Ford. In addition, at December 31, 2005, Ford guaranteed approximately $100 million of our finance receivables related to dealers. |
| |
| | (b) | Primarily wholesale receivables with entities that are reported as consolidated subsidiaries of Ford. The consolidated subsidiaries include dealerships that are partially owned by Ford and consolidated as VIEs and also certain overseas affiliates. These receivables are included in net finance receivables. |
| |
| | (c) | We have entered into a sale-leaseback agreement with Ford for vehicles leased to employees of Ford and its subsidiaries. The investment in these vehicles is included in net investment in operating leases and is guaranteed by Ford. |
| |
| | (d) | We purchase from Ford and affiliated companies certain used vehicles pursuant to its obligation to repurchase such vehicles from daily rental car companies; these vehicles are recorded in other assets. We subsequently sell the used vehicles at auction; any gain or loss on these vehicles reverts to Ford. |
| |
| | (e) | We have an intercompany tax sharing agreement with Ford. Under this agreement, United States income tax liabilities or credits are allocated to us, generally on a separate return basis. |
| |
| | (f) | We record an asset for interest supplements when certain receivables are sold in off-balance sheet securitizations and whole loan sale transactions. These non-finance receivables are reported in other assets. In addition, in the United States and Canada, Ford is obligated pay us approximately $3.0 billion of interest supplements (including supplements related to sold receivables) and approximately $800 million of residual value support over the terms of the related finance contracts. |
Commitments and Contingencies
We provide various types of surety bonds to Ford and provide guarantees to third parties on behalf of Ford. At December 31, 2005, the value of these bonds and guarantees totaled approximately $500 million; Ford counter-guarantees approximately $70 million of these items.
| |
| NOTE 16. | SEGMENT AND GEOGRAPHIC INFORMATION |
Segment Information
We divide our business segments based on geographic regions: the North America Segment (includes operations in the United States and Canada) and the International Segment (includes operations in all other countries). We measure the performance of our segments primarily on an
FC-32
FORD MOTOR CREDIT COMPANY AND SUBSIDIARIES
NOTES TO THE FINANCIAL STATEMENTS — Continued
| |
| NOTE 16. | SEGMENT AND GEOGRAPHIC INFORMATION — Continued |
income from continuing operations before income taxes basis, after excluding the impact to earnings from hedge ineffectiveness, and other adjustments in applying SFAS 133. These adjustments are included in unallocated risk management and excluded in assessing segment performance because our risk management activities are carried out on a centralized basis at the corporate level, with only certain elements allocated to our two segments. The segments are presented on a managed basis (managed basis includes on-balance sheet receivables and securitized off-balance sheet receivables activity), and the effect of off-balance sheet securitizations is included in unallocated/eliminations.
Key operating data for our business segments for the years ended or at December 31 were as follows:
| | | | | | | | | | | | | | | | | | | | | | | | | | |
| | | | | | | | |
| | | | | | Unallocated/Eliminations | | | |
| | | | | |
| | | |
| | North | | | | | Unallocated | | | Effect of | | | | | |
| | America | | | International | | | Risk | | | Sales of | | | | | |
| | Segment | | | Segment | | | Management | | | Receivables | | | Total | | | Total | |
| |
| | |
| | |
| | |
| | |
| | |
| |
| | |
| | (in millions) | |
2005 | | | | | | | | | | | | | | | | | | | | | | | | |
| Revenue | | $ | 13,920 | | | $ | 3,885 | | | $ | (74 | ) | | $ | (1,087 | ) | | $ | (1,161 | ) | | $ | 16,644 | |
| Income | | | | | | | | | | | | | | | | | | | | | | | | |
| | Income from continuing operations before income taxes | | | 2,984 | | | | 951 | | | | (74 | ) | | | — | | | | (74 | ) | | | 3,861 | |
| | Provision for income taxes | | | 1,103 | | | | 333 | | | | (27 | ) | | | — | | | | (27 | ) | | | 1,409 | |
| | Income from continuing operations | | | 1,881 | | | | 618 | | | | (48 | ) | | | — | | | | (48 | ) | �� | | 2,451 | |
| Other disclosures | | | | | | | | | | | | | | | | | | | | | | | | |
| | Depreciation on vehicles subject to operating leases | | | 3,969 | | | | 461 | | | | — | | | | — | | | | — | | | | 4,430 | |
| | Interest expense | | | 5,125 | | | | 1,793 | | | | — | | | | (1,076 | ) | | | (1,076 | ) | | | 5,842 | |
| | Provision for credit losses | | | 97 | | | | 69 | | | | — | | | | — | | | | — | | | | 166 | |
| | Finance receivables (including net investment in operating leases) | | | 113,421 | | | | 36,602 | | | | 71 | | | | (18,005 | ) | | | (17,934 | ) | | | 132,089 | |
| | Total assets | | | 137,987 | | | | 40,682 | | | | 71 | | | | (16,585 | ) | | | (16,514 | ) | | | 162,155 | |
| |
2004 | | | | | | | | | | | | | | | | | | | | | | | | |
| Revenue | | $ | 14,975 | | | $ | 3,809 | | | $ | 282 | | | $ | (1,184 | ) | | $ | (902 | ) | | $ | 17,882 | |
| Income | | | | | | | | | | | | | | | | | | | | | | | | |
| | Income from continuing operations before income taxes | | | 3,371 | | | | 778 | | | | 282 | | | | — | | | | 282 | | | | 4,431 | |
| | Provision for income taxes | | | 1,279 | | | | 272 | | | | 97 | | | | — | | | | 97 | | | | 1,648 | |
| | Income from continuing operations | | | 2,092 | | | | 506 | | | | 183 | | | | — | | | | 183 | | | | 2,781 | |
| Other disclosures | | | | | | | | | | | | | | | | | | | | | | | | |
| | Depreciation on vehicles subject to operating leases | | | 4,427 | | | | 482 | | | | — | | | | — | | | | — | | | | 4,909 | |
| | Interest expense | | | 4,421 | | | | 1,766 | | | | — | | | | (854 | ) | | | (854 | ) | | | 5,333 | |
| | Provision for credit losses | | | 767 | | | | 133 | | | | — | | | | — | | | | — | | | | 900 | |
| | Finance receivables (including net investment in operating leases) | | | 126,151 | | | | 41,892 | | | | 245 | | | | (35,571 | ) | | | (35,326 | ) | | | 132,717 | |
| | Total assets | | | 151,865 | | | | 46,916 | | | | 245 | | | | (26,405 | ) | | | (26,160 | ) | | | 172,621 | |
FC-33
FORD MOTOR CREDIT COMPANY AND SUBSIDIARIES
NOTES TO THE FINANCIAL STATEMENTS — Continued
| |
| NOTE 16. | SEGMENT AND GEOGRAPHIC INFORMATION — Continued |
| | | | | | | | | | | | | | | | | | | | | | | | | | |
| | | | | | | | |
| | | | | | Unallocated/Eliminations | | | |
| | | | | |
| | | |
| | North | | | | | Unallocated | | | Effect of | | | | | |
| | America | | | International | | | Risk | | | Sales of | | | | | |
| | Segment | | | Segment | | | Management | | | Receivables | | | Total | | | Total | |
| |
| | |
| | |
| | |
| | |
| | |
| |
| | |
| | (in millions) | |
| |
2003 | | | | | | | | | | | | | | | | | | | | | | | | |
| Revenue | | $ | 18,107 | | | $ | 3,733 | | | $ | 324 | | | $ | (2,074 | ) | | $ | (1,750 | ) | | $ | 20,090 | |
| Income | | | | | | | | | | | | | | | | | | | | | | | | |
| | Income from continuing operations before income taxes | | | 1,997 | | | | 660 | | | | 299 | | | | — | | | | 299 | | | | 2,956 | |
| | Provision for income taxes | | | 788 | | | | 231 | | | | 115 | | | | — | | | | 115 | | | | 1,134 | |
| | Income from continuing operations | | | 1,209 | | | | 429 | | | | 182 | | | | — | | | | 182 | | | | 1,820 | |
| Other disclosures | | | | | | | | | | | | | | | | | | | | | | | | |
| | Depreciation on vehicles subject to operating leases | | | 6,452 | | | | 557 | | | | — | | | | — | | | | — | | | | 7,009 | |
| | Interest expense | | | 5,567 | | | | 1,682 | | | | 25 | | | | (1,443 | ) | | | (1,418 | ) | | | 5,831 | |
| | Provision for credit losses | | | 1,664 | | | | 224 | | | | — | | | | — | | | | — | | | | 1,888 | |
| | Finance receivables (including net investment in operating leases) | | | 134,378 | | | | 40,489 | | | | 526 | | | | (46,853 | ) | | | (46,327 | ) | | | 128,540 | |
| | Total assets | | | 167,154 | | | | 45,739 | | | | 526 | | | | (34,284 | ) | | | (33,758 | ) | | | 179,135 | |
FC-34
FORD MOTOR CREDIT COMPANY AND SUBSIDIARIES
NOTES TO THE FINANCIAL STATEMENTS — Continued
| |
| NOTE 16. | SEGMENT AND GEOGRAPHIC INFORMATION — Continued |
Total revenue, income from continuing operations before income taxes, income from continuing operations, finance receivables, and assets identifiable with operations in the United States, Europe, and other foreign operations were as follows for the years ended or at December 31:
| | | | | | | | | | | | | | | |
| | 2005 | | | 2004 | | | 2003 | |
| |
| | |
| | |
| |
| | |
| | (in millions) | |
| Revenue | | | | | | | | | | | | |
| | United States operations | | $ | 11,243 | | | $ | 12,313 | | | $ | 15,166 | |
| | European operations | | | 2,571 | | | | 2,659 | | | | 2,444 | |
| | Other foreign operations | | | 2,830 | | | | 2,910 | | | | 2,480 | |
| | |
| | |
| | |
| |
| | | Total revenue | | $ | 16,644 | | | $ | 17,882 | | | $ | 20,090 | |
| | |
| | |
| | |
| |
| Income from continuing operations before income taxes | | | | | | | | | | | | |
| | United States operations | | $ | 2,733 | | | $ | 3,213 | | | $ | 2,102 | |
| | European operations | | | 618 | | | | 555 | | | | 424 | |
| | Other foreign operations | | | 510 | | | | 663 | | | | 430 | |
| | |
| | |
| | |
| |
| | | Total income from continuing operations before income taxes | | $ | 3,861 | | | $ | 4,431 | | | $ | 2,956 | |
| | |
| | |
| | |
| |
| Income from continuing operations | | | | | | | | | | | | |
| | United States operations | | $ | 1,632 | | | $ | 1,914 | | | $ | 1,263 | |
| | European operations | | �� | 452 | | | | 434 | | | | 314 | |
| | Other foreign operations | | | 367 | | | | 433 | | | | 243 | |
| | |
| | |
| | |
| |
| | | Total income from continuing operations | | $ | 2,451 | | | $ | 2,781 | | | $ | 1,820 | |
| | |
| | |
| | |
| |
| Finance receivables (including net investment in operating leases) | | | | | | | | | | | | |
| | United States operations | | $ | 87,073 | | | $ | 82,652 | | | $ | 83,180 | |
| | European operations | | | 25,076 | | | | 29,297 | | | | 27,374 | |
| | Other foreign operations | | | 19,940 | | | | 20,768 | | | | 17,986 | |
| | |
| | |
| | |
| |
| | | Total finance receivables | | $ | 132,089 | | | $ | 132,717 | | | $ | 128,540 | |
| | |
| | |
| | |
| |
| Assets | | | | | | | | | | | | |
| | United States operations | | $ | 112,046 | | | $ | 116,485 | | | $ | 127,435 | |
| | European operations | | | 28,248 | | | | 33,473 | | | | 31,636 | |
| | Other foreign operations | | | 21,861 | | | | 22,663 | | | | 20,064 | |
| | |
| | |
| | |
| |
| | | Total assets | | $ | 162,155 | | | $ | 172,621 | | | $ | 179,135 | |
| | |
| | |
| | |
| |
FC-35
FORD MOTOR CREDIT COMPANY AND SUBSIDIARIES
NOTES TO THE FINANCIAL STATEMENTS — Continued
| |
| NOTE 17. | SELECTED QUARTERLY FINANCIAL DATA (UNAUDITED) |
Selected financial data (unaudited) by calendar quarter were as follows:
| | | | | | | | | | | | | | | | | | | | | |
| | First | | | Second | | | Third | | | Fourth | | | Full | |
| | Quarter | | | Quarter | | | Quarter | | | Quarter | | | Year | |
| |
| | |
| | |
| | |
| | |
| |
| | |
| | (in millions) | |
2005 | | | | | | | | | | | | | | | | | | | | |
| Total revenue | | $ | 4,245 | | | $ | 4,115 | | | $ | 4,156 | | | $ | 4,128 | | | $ | 16,644 | |
| Depreciation on vehicles subject to operating leases | | | 1,077 | | | | 1,095 | | | | 1,125 | | | | 1,133 | | | | 4,430 | |
| Interest expense | | | 1,426 | | | | 1,386 | | | | 1,444 | | | | 1,586 | | | | 5,842 | |
| Total financing margin and other revenue | | | 1,742 | | | | 1,634 | | | | 1,587 | | | | 1,409 | | | | 6,372 | |
| Provision for credit losses | | | 117 | | | | (111 | ) | | | 81 | | | | 79 | | | | 166 | |
| Income from continuing operations | | | 673 | | | | 736 | | | | 577 | | | | 465 | | | | 2,451 | |
| Net income | | | 710 | | | | 740 | | | | 577 | | | | 465 | | | | 2,492 | |
| |
2004 | | | | | | | | | | | | | | | | | | | | |
| Total revenue | | $ | 4,519 | | | $ | 4,586 | | | $ | 4,427 | | | $ | 4,350 | | | $ | 17,882 | |
| Depreciation on vehicles subject to operating leases | | | 1,307 | | | | 1,242 | | | | 1,133 | | | | 1,227 | | | | 4,909 | |
| Interest expense | | | 1,329 | | | | 1,295 | | | | 1,338 | | | | 1,371 | | | | 5,333 | |
| Total financing margin and other revenue | | | 1,883 | | | | 2,049 | | | | 1,956 | | | | 1,752 | | | | 7,640 | |
| Provision for credit losses | | | 282 | | | | 68 | | | | 252 | | | | 298 | | | | 900 | |
| Income from continuing operations | | | 663 | | | | 883 | | | | 711 | | | | 524 | | | | 2,781 | |
| Net income | | | 688 | | | | 897 | | | | 734 | | | | 543 | | | | 2,862 | |
| |
| NOTE 18. | COMMITMENTS AND CONTINGENCIES |
Lease Commitments
At December 31, 2005, we had the following minimum rental commitments under non-cancelable operating leases (in millions): 2006 — $66; 2007 — $53; 2008 — $44; 2009 — $26; 2010 — $15; thereafter — $5. These amounts include rental commitments for certain land, buildings, machinery and equipment. Our rental expense was $79 million in 2005, $93 million in 2004 and $103 million in 2003.
Guarantees and Indemnifications
The fair values of guarantees and indemnifications issued during 2005 and 2004 are recorded in the financial statements and are not material. At December 31, 2005 and 2004, the following guarantees and indemnifications were issued and outstanding:
Guarantees of certain obligations of unconsolidated and other affiliates: In some cases, we have guaranteed debt and other financial obligations of unconsolidated affiliates, including joint ventures and Ford. Expiration dates vary, and guarantees will terminate on payment and/or cancellation of the obligation. A payment would be triggered by failure of the guaranteed party to fulfill its obligation covered by the guarantee. In some circumstances, we are entitled to recover from Ford or an affiliate of Ford amounts paid by us under the guarantee. However, our ability to enforce these rights is sometimes stayed until the guaranteed party is paid in full. The maximum potential payments under these guarantees totaled approximately $254 million in 2005 and $230 million in 2004; approximately $70 million of these values were counter-guaranteed by Ford to us.
Indemnifications: In the ordinary course of business, we execute contracts involving indemnifications standard in the industry and indemnifications specific to a transaction such as debt
FC-36
FORD MOTOR CREDIT COMPANY AND SUBSIDIARIES
NOTES TO THE FINANCIAL STATEMENTS — Continued
| |
| NOTE 18. | COMMITMENTS AND CONTINGENCIES — Continued |
funding, derivatives, sale of receivables and the sale of businesses. These indemnifications might include claims against any of the following: intellectual property and privacy rights; governmental regulations and employment-related issues; dealer, supplier and other commercial contractual relationships; financial status; tax related issues; securities law; and environmental related issues. Performance under these indemnities would generally be triggered by a breach of terms of the contract or by a third-party claim. We regularly evaluate the probability of having to incur costs associated with these indemnifications and have accrued for expected losses that are probable. We are party to numerous indemnifications and many of these indemnities do not limit potential payment; therefore, we are unable to estimate a maximum amount of potential future payments that could result from claims made under these indemnities.
Litigation and Claims
Various legal actions, governmental investigations and proceedings and claims are pending or may be instituted or asserted in the future against us including those relating to state and federal laws concerning finance and insurance, employment-related matters, personal injury matters, investor matters, financial reporting matters and other contractual relationships. Certain of the pending legal actions are, or purport to be, class actions. Some of the foregoing matters involve or may involve compensatory, punitive, or antitrust or other treble damage claims in very large amounts, or other relief, which, if granted, would require very large expenditures.
Litigation is subject to many uncertainties, and the outcome of individual litigated matters is not predictable with assurance. We have established accruals for certain of the matters discussed in the foregoing paragraph where losses are deemed probable and reasonably estimable. It is reasonably possible, however, that some of the matters discussed in the foregoing paragraph for which accruals have not been established could be decided unfavorably to us and could require us to pay damages or make other expenditures in amounts or a range of amounts that cannot be estimated at December 31, 2005. We do not reasonably expect, based on our analysis, that such matters would have a material effect on future financial statements for a particular year, although such an outcome is possible.
Certain subsidiaries are subject to regulatory capital requirements requiring maintenance of certain minimum capital levels that limit the abilities of the subsidiaries to pay dividends.
FC-37