exhibit991investornov

CAPABILITY - ADAPTABILITY - ACCOUNTABILITY FOREST CITY ENTERPRISES INC. INVESTOR UPDATE November 2012 EXHIBIT 99.1

2

INFORMATION RELATED TO FORWARD-LOOKING STATEMENTS Statements made in this presentation that state the Company’s or management's intentions, hopes, beliefs, expectations or predictions of the future are forward-looking statements. It is important to note that the Company's future events and actual results, financial or otherwise, could differ materially from those projected in such forward- looking statements. Additional information concerning factors that could cause future events or actual results to differ materially from those in the forward-looking statements are included in the “Risk Factors” section of the Company's SEC filings, including, but not limited to, the Company's Annual Report and quarterly reports. You are cautioned not to place undue reliance on such forward-looking statements. USE OF NON-GAAP MEASURES We frequently use the non‐GAAP measures of funds from operations (“FFO”), operating funds from operations (“Operating FFO”), implied cap rate, earnings before depreciation, amortization and deferred taxes (“EBDT”), comparable net operating income (“NOI”), and measures based on the pro‐rata consolidation method (“pro‐rata”) to explain operating performance and assist investors in evaluating our business. In addition, we present a schedule of components to assist investors in determining the “net asset value” (“NAV”) of the Company and an implied cap rate, also non-GAAP measures. For a more thorough discussion of FFO, Operating FFO, EBDT, NOI, pro‐rata measures, NAV, and Implied Cap Rate, including how we reconcile these applicable measures to their GAAP counterparts, please refer to the Supplemental Package furnished to the SEC on Form 8‐K on September 4, 2012 and form 8-K furnished to the SEC on November 13, 2012. Copies of our quarterly and annual Supplemental Packages can be found on our website at www.forestcity.net, or on the SEC’s website at www.sec.gov. 3
OUR STRATEGIC THEMES We will leverage our unique and proven capability as an owner, operator and developer of distinctive real estate. We will continue to show adaptability to changing market conditions and stakeholder needs. We will commit to a high level of accountability to ourselves and to all of our stakeholders to drive value creation. 4
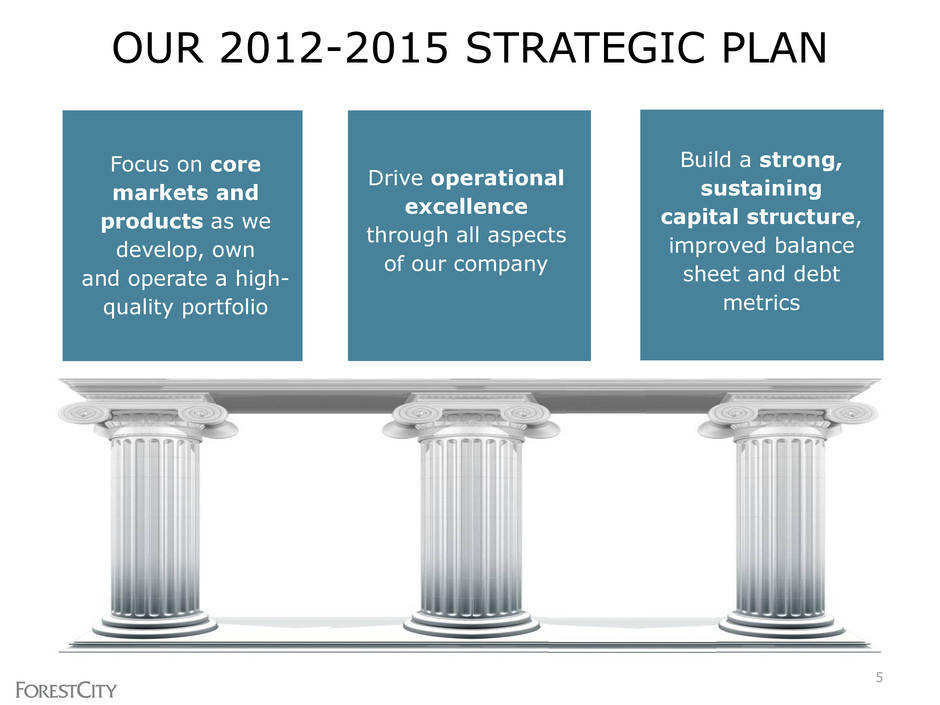
Drive operational excellence through all aspects of our company Focus on core markets and products as we develop, own and operate a high- quality portfolio Build a strong, sustaining capital structure, improved balance sheet and debt metrics OUR 2012-2015 STRATEGIC PLAN 5
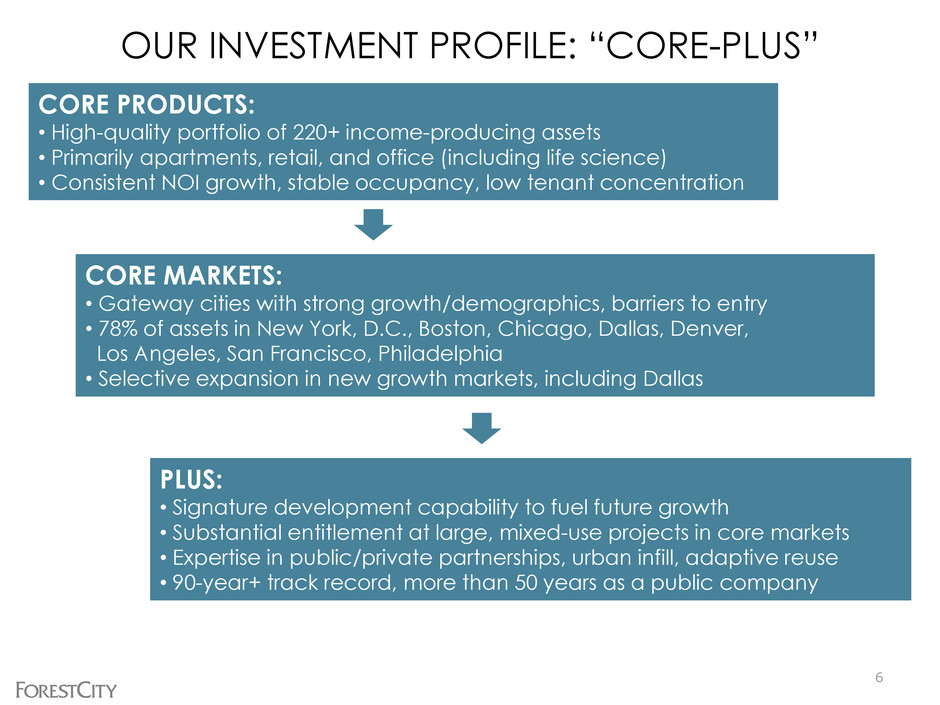
OUR INVESTMENT PROFILE: “CORE-PLUS” 6 CORE PRODUCTS: • High-quality portfolio of 220+ income-producing assets • Primarily apartments, retail, and office (including life science) • Consistent NOI growth, stable occupancy, low tenant concentration CORE MARKETS: • Gateway cities with strong growth/demographics, barriers to entry • 78% of assets in New York, D.C., Boston, Chicago, Dallas, Denver, Los Angeles, San Francisco, Philadelphia • Selective expansion in new growth markets, including Dallas PLUS: • Signature development capability to fuel future growth • Substantial entitlement at large, mixed-use projects in core markets • Expertise in public/private partnerships, urban infill, adaptive reuse • 90-year+ track record, more than 50 years as a public company
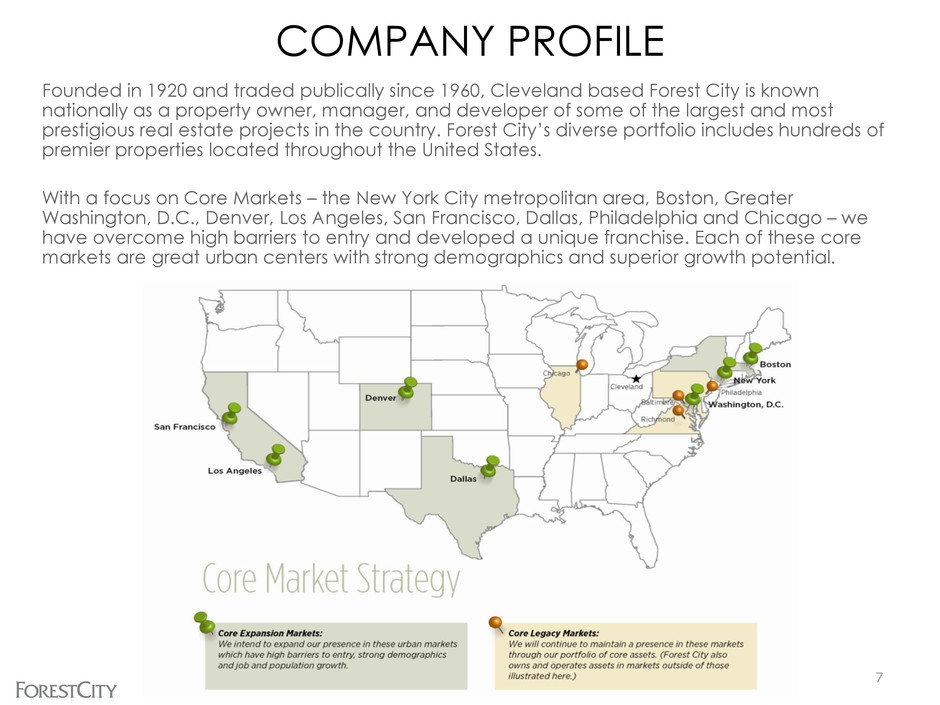
COMPANY PROFILE Founded in 1920 and traded publically since 1960, Cleveland based Forest City is known nationally as a property owner, manager, and developer of some of the largest and most prestigious real estate projects in the country. Forest City’s diverse portfolio includes hundreds of premier properties located throughout the United States. With a focus on Core Markets – the New York City metropolitan area, Boston, Greater Washington, D.C., Denver, Los Angeles, San Francisco, Dallas, Philadelphia and Chicago – we have overcome high barriers to entry and developed a unique franchise. Each of these core markets are great urban centers with strong demographics and superior growth potential. 7
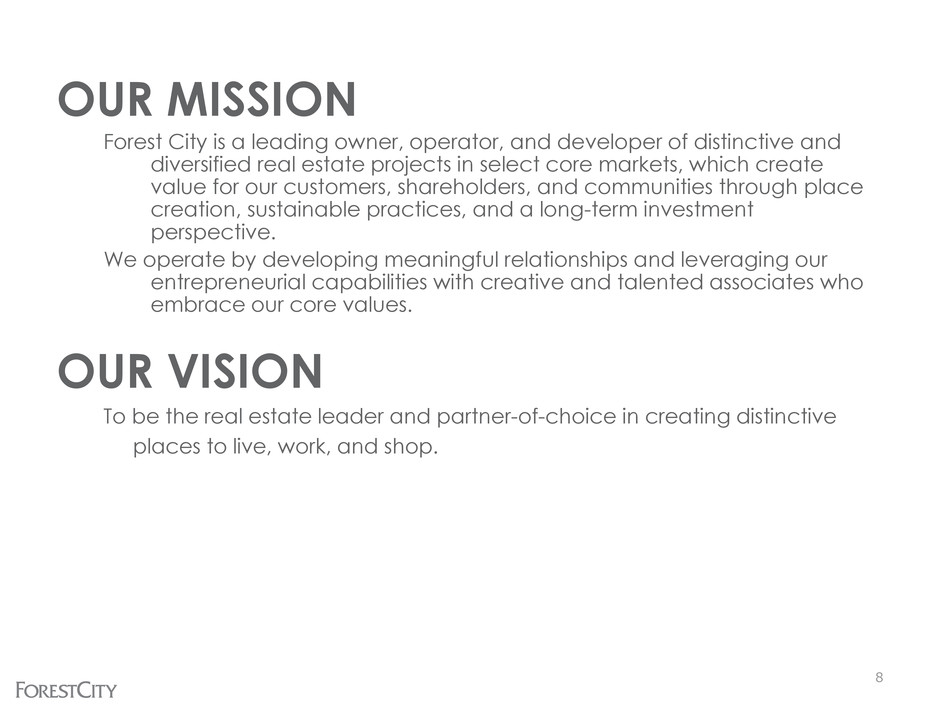
OUR MISSION Forest City is a leading owner, operator, and developer of distinctive and diversified real estate projects in select core markets, which create value for our customers, shareholders, and communities through place creation, sustainable practices, and a long-term investment perspective. We operate by developing meaningful relationships and leveraging our entrepreneurial capabilities with creative and talented associates who embrace our core values. OUR VISION To be the real estate leader and partner-of-choice in creating distinctive places to live, work, and shop. 8
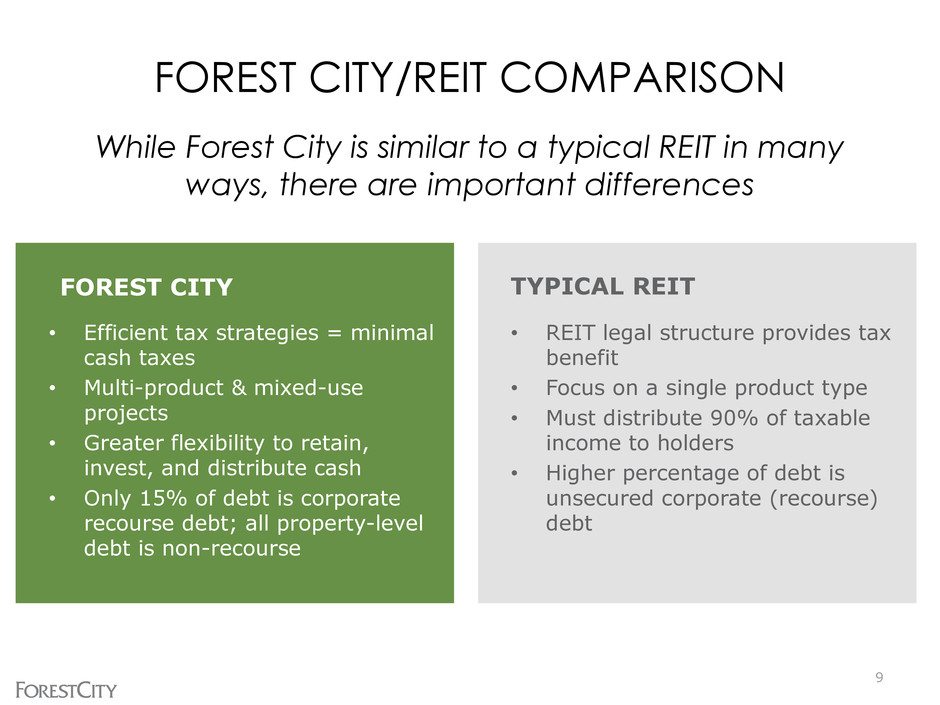
9 • Efficient tax strategies = minimal cash taxes • Multi-product & mixed-use projects • Greater flexibility to retain, invest, and distribute cash • Only 15% of debt is corporate recourse debt; all property-level debt is non-recourse TYPICAL REIT • REIT legal structure provides tax benefit • Focus on a single product type • Must distribute 90% of taxable income to holders • Higher percentage of debt is unsecured corporate (recourse) debt FOREST CITY FOREST CITY/REIT COMPARISON While Forest City is similar to a typical REIT in many ways, there are important differences

10 FCE has achieved a number of significant accomplishments that we believe greatly improve our balance sheet and risk profile. We wanted to provide you with a summary of some of those achievements Successfully Addressed Non-Recourse Debt Maturities, and with improved liquidity, we have opportunistically paid down debt Executed on our plan to sell/JV selected assets generating cash proceeds of over $500M in last 2.5 years; removing $885M in property debt as a result Year Total Maturities (@ 100%) in millions 2009 $1,361 2010 $1,161 2011 $1,562 2012 $1,748 09-12 Avg. $1,459 Year Voluntary Debt Paydowns (@ PR) in millions 2011 $255 Sept YTD 2012 $178 Total $433 Year Major Asset Sales Total Cash Proceeds (in millions) Total Debt Removed (in millions) 2010 MIT $215 $300~ 2011 NY Retail JV $264 $400~ Oct YTD 2012 Gulfstream, White Oak $56 $185~ Proj. Remainder 2012 8 Spruce Street $160~ $275~ Proj. 2013 $100 - $150 $165 -$250 Total $795 - $845 $1,325- $1,410
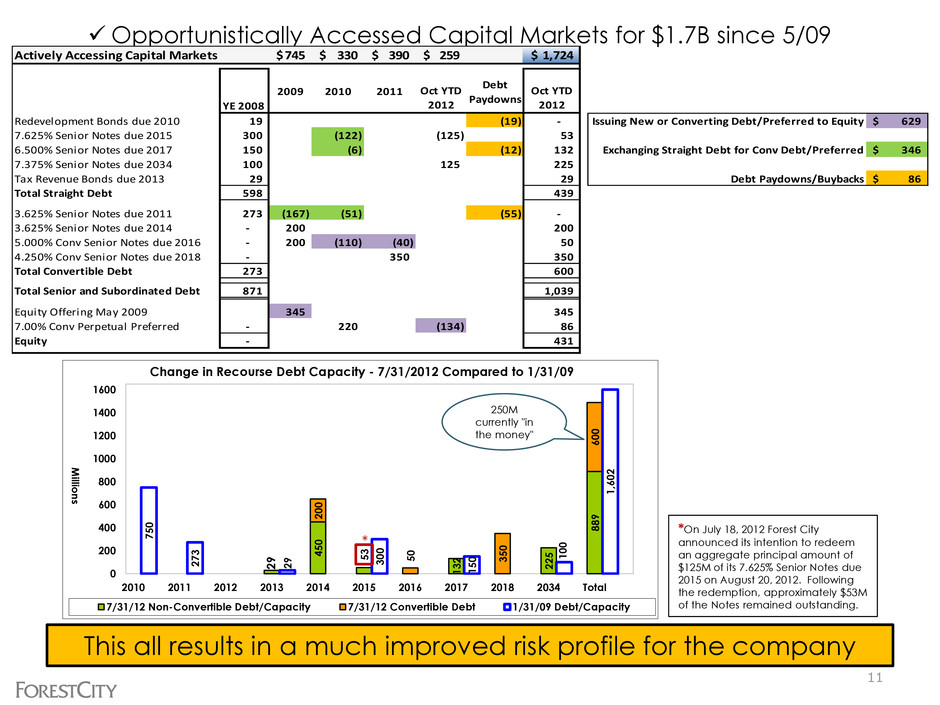
11 Opportunistically Accessed Capital Markets for $1.7B since 5/09 This all results in a much improved risk profile for the company 2 9 45 0 5 3 1 3 2 2 2 5 8 8 9 2 0 0 5 0 3 5 0 6 0 0 7 5 0 2 7 3 2 9 3 0 0 1 5 0 1 0 0 1 ,6 0 2 0 200 400 600 800 1000 1200 1400 1600 2010 2011 2012 2013 2014 2015 2016 2017 2018 2034 Total Mi llion s Change in Recourse Debt Capacity - 7/31/2012 Compared to 1/31/09 7/31/12 Non-Convertible Debt/Capacity 7/31/12 Convertible Debt 1/31/09 Debt/Capacity 250M currently "in the money" * *On July 18, 2012 Forest City announced its intention to redeem an aggregate principal amount of $125M of its 7.625% Senior Notes due 2015 on August 20, 2012. Following the redemption, approximately $53M of the Notes remained outstanding. Actively Accessing Capital Markets 745$ 330$ 390$ 259$ 1,724$ YE 2008 2009 2010 2011 Oct YTD 2012 Debt Paydowns Oct YTD 2012 Redevelopment Bonds due 2010 19 (19) - Issuing New or Converting Debt/Preferred to Equity 629$ 7.625% Senior Notes due 2015 300 (122) (125) 53 6.500% Senior Notes due 2017 150 (6) (12) 132 Exchanging Straight Debt for Conv Debt/Preferred 346$ 7.375% Senior Notes due 2034 100 125 225 Tax Revenue Bonds due 2013 29 29 Debt Paydowns/Buybacks 86$ Total Straight Debt 598 470 439 439 3.625% Senior Notes due 2011 273 (167) (51) (55) - 3.625% Senior Notes due 2014 - 200 200 5.000% Conv Senior Notes due 2016 - 200 (110) (40) 50 4.250% Conv Senior Notes due 2018 - 350 350 Total Conve tible Debt 273 345 600 600 Total Senior and Subordinated Debt 871 815 1,039 1,039 Equity Offering May 2009 345 345 7.00% Conv Perpetual Preferred - 220 (134) 86 Equity - 565 565 431
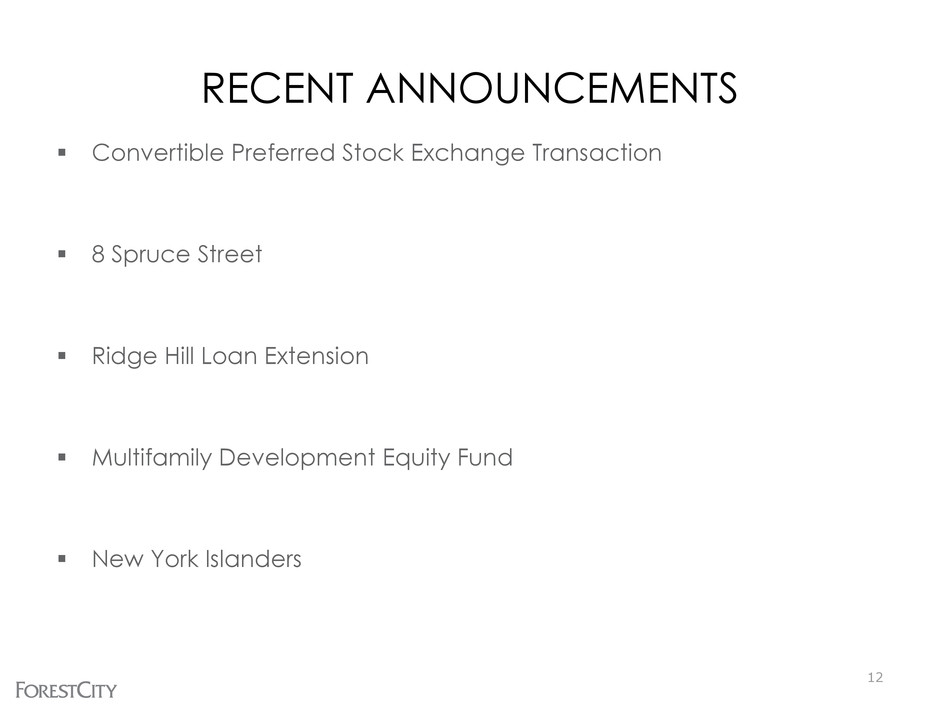
RECENT ANNOUNCEMENTS Convertible Preferred Stock Exchange Transaction 8 Spruce Street Ridge Hill Loan Extension Multifamily Development Equity Fund New York Islanders 12
CONVERTIBLE PREFERRED STOCK EXCHANGE TRANSACTION GOAL: Continue to build a strong, sustaining capital structure, strategically taking advantage of opportunities to de-lever and reduce interest expense and dividend distribution. STATUS: Oct. 16, 2012 we announced privately negotiated exchange agreements whereby we exchanged approximately $133.7 million in aggregate amount of our outstanding cumulative perpetual convertible preferred stock for Class A common stock. IMPACT: Approximately 2.7 million shares of cumulative perpetual convertible preferred stock were exchanged for 8.8 million shares of Class A common stock, plus a cash payment of approximately $13.9 million for dividends payable (through March 15, 2013) and inducement; this will result in a permanent reduction of $9.4 million of fixed charges. The transaction is non-dilutive as the Class A common shares issued have already been included in our “if-converted” share count. 13
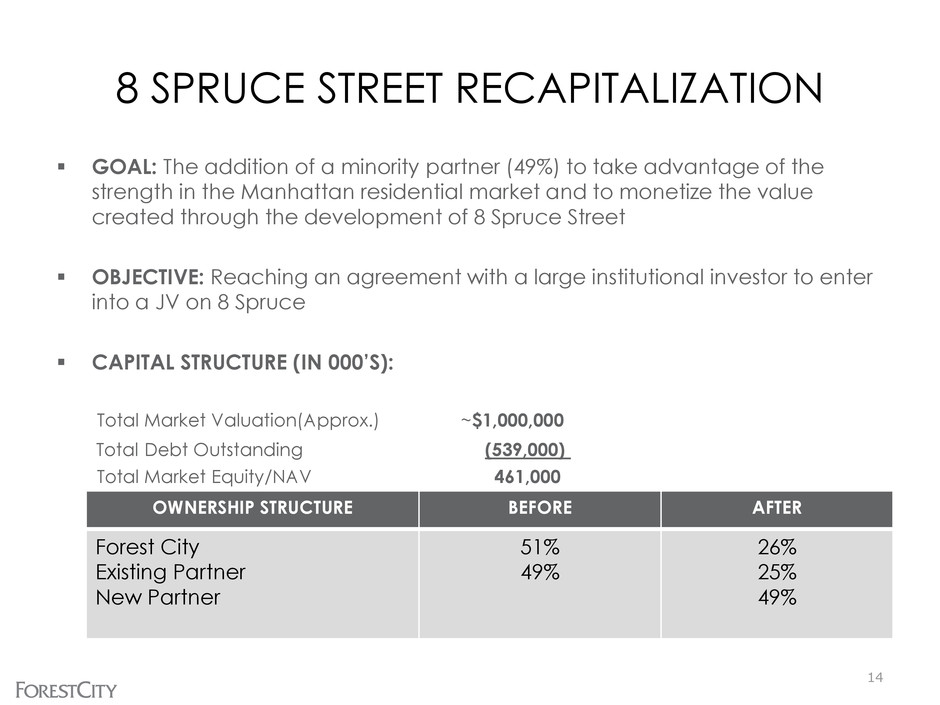
8 SPRUCE STREET RECAPITALIZATION GOAL: The addition of a minority partner (49%) to take advantage of the strength in the Manhattan residential market and to monetize the value created through the development of 8 Spruce Street OBJECTIVE: Reaching an agreement with a large institutional investor to enter into a JV on 8 Spruce CAPITAL STRUCTURE (IN 000’S): Total Market Valuation(Approx.) ~$1,000,000 Total Debt Outstanding (539,000) Total Market Equity/NAV 461,000 14 OWNERSHIP STRUCTURE BEFORE AFTER Forest City Existing Partner New Partner 51% 49% 26% 25% 49%

RIDGE HILL LOAN EXTENSION GOAL: Extend and restructure construction financing with 13-bank lending group to provide time to complete lease-up, stabilize the center and position the asset for permanent financing. STATUS: We have now completed a two-year extension, with an additional one-year option. TERMS: Previous loan commitment of $557 million, of which $497 million was outstanding, is replaced with a $465 million commitment. Forest City paid the loan down by approximately $22 million at closing and will continue making scheduled pay downs over the next ten months until the outstanding loan balance reaches $465 million. OUTCOME: The completion of this recapitalization, which required unanimous consent by all 13 banks, reflects our commitment to the asset and the lenders’ confidence in Forest City. 15
MULTIFAMILY DEVELOPMENT EQUITY FUND GOAL: Secure strategic capital partnerships to activate existing entitlement, accelerate growth, mitigate risk and enhance value creation STATUS: Finalizing a partnership with a large institutional investor for a $400 million equity fund for multifamily development in our core markets, including New York City, Washington, D.C., and San Francisco SELECTION: Forest City chosen by the investor based on development expertise, a visible pipeline of opportunities, as well as engagement in communities where we do business FUNDING: 75% strategic capital partner, 25% Forest City IMPACT: Equity to be paired with project financing for estimated aggregate development investment of $800 million – $1 billion 16
NEW YORK ISLANDERS Announced on October 24, 2012 that the NHL’s New York Islanders have signed a 25-year lease agreement to relocate to the Barclays Center in Brooklyn, New York Expected to commence with the 2015-2016 season The Islanders name and logo are expected to remain unchanged Securing this deal is expected to help us realize the approximately $70M stabilized NOI for the Barclays Center and may even provide an opportunity for additional upside 17 "The Islanders are a major addition to the range of premiere sports and top-tier entertainment choosing to come to Barclays Center. This agreement also spotlights the value created through the development of Barclays Center, which is now even stronger as a two-team arena, as well as the future value-creation potential of the Atlantic Yards project.” - David LaRue, President and CEO
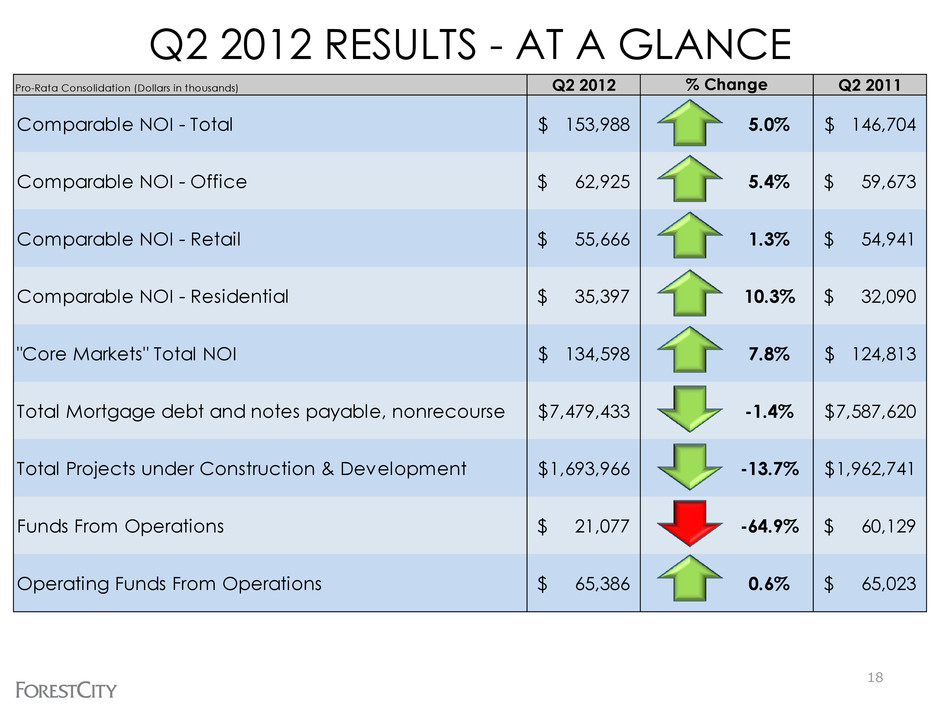
Pro-Rata Consolidation (Dollars in thousands) Q2 2012 Q2 2011 Comparable NOI - Total 153,988$ 5.0% 146,704$ Comparable NOI - Office 62,925$ 5.4% 59,673$ Comparable NOI - Retail 55,666$ 1.3% 54,941$ Comparable NOI - Residential 35,397$ 10.3% 32,090$ "Core Markets" Total NOI 134,598$ 7.8% 124,813$ Total Mortgage debt and notes payable, nonrecourse 7,479,433$ -1.4% 7,587,620$ Total Projects under Construction & Development 1,693,966$ -13.7% 1,962,741$ Funds From Operations 21,077$ -64.9% 60,129$ Operating Funds From Operations 65,386$ 0.6% 65,023$ % Change Q2 2012 RESULTS - AT A GLANCE 18

Q2 2012 Q2 2011 Regional Mall Sales per square foot (PSF) (Rolling 12-month basis) 461.00$ 10.6% 417.00$ 12 Month Regional Mall Leasing Spread PSF (New vs Expiring) 55.37$ 9.5% 50.56$ 12 Month Specialty Retail Centers Leasing Spread PSF (New vs Expiring) 36.85$ 7.7% 34.20$ 12 Month Office Leasing Spread PSF (New vs Expiring) 27.95$ 2.2% 27.36$ Residential Total Comparable Monthly Average Rental Rates 1,194$ 4.8% 1,139$ % Change Q2 2012 RESULTS - AT A GLANCE 19 We are committed to execute on our strategy of operational excellence as evidenced by the following metrics:

BALANCED, DIVERSE NOI SOURCES 20 (1) Includes limited-distribution subsidized senior housing. (2) Includes write-offs of abandoned development projects, non-capitalizable development costs, non-capitalizable marketing/promotional costs associated with Barclays Center and unallocated management and service company overhead, net of tax credit income. (3) Includes Richmond, Virginia. NOI by Product Type: 354,364$ NOI by Market 339,945$ Casino Land Sale 36,484 Casino Land Sale 36,484 The Nets (15,230) Military Housing 14,419 Corporate Activities (26,863) The Nets (15,230) Other (2) (26,689) Corporate Activities (26,863) Grand Total NOI 322,066$ Other (2) (26,689) Grand Total NOI 322,066$ Net Operating Income by Product Type Net Operating Income by Core Market Pro-Rata Consolidation (dollars in thousands) Pro-Rata Consolidation (dollars in thousands) Six Months Ended July 31, 2012 Six Months Ended July 31, 2012 Retail $117,812 33.2% Office $126,349 35.7% Apartments (1) $82,550 23.3% Military Housing $14,419 4.1% Hotels $4,809 1.3% Land $8,425 2.4% New York City $99,031 29.1% Greater Washington, D.C.(1) $34,596 10.2% Los Angeles $31,656 9.3% Boston $22,249 6.5% Greater San Francisco $20,016 5.9% Denver $18,227 5.4% Chicago $16,598 4.9% Philadelphia $12,581 3.7% Dallas $2,254 0.7% Non-Core Markets $59,283 17.4% Regional Malls $23,449 6.9%
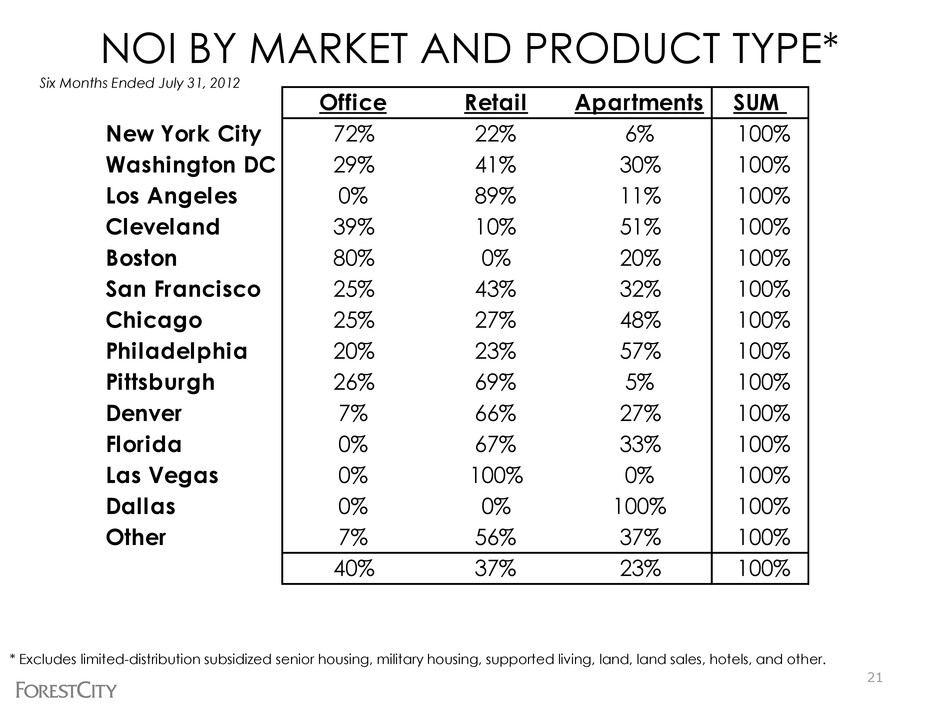
NOI BY MARKET AND PRODUCT TYPE* 21 * Excludes limited-distribution subsidized senior housing, military housing, supported living, land, land sales, hotels, and other. Six Months Ended July 31, 2012 Office Retail Apartments SUM New York City 72% 22% 6% 100% Washington DC 29% 41% 30% 100% Los Angeles 0% 89% 11% 100% Cleveland 39% 10% 51% 100% Boston 80% 0% 20% 100% San Francisco 25% 43% 32% 100% Chicago 25% 27% 48% 100% Philadelphia 20% 23% 57% 100% Pittsburgh 26% 69% 5% 100% Denver 7% 66% 27% 100% Florida 0% 67% 33% 100% Las Vegas 0% 100% 0% 100% Dallas 0% 0% 100% 100% Other 7% 56% 37% 100% 40% 37% 23% 100%
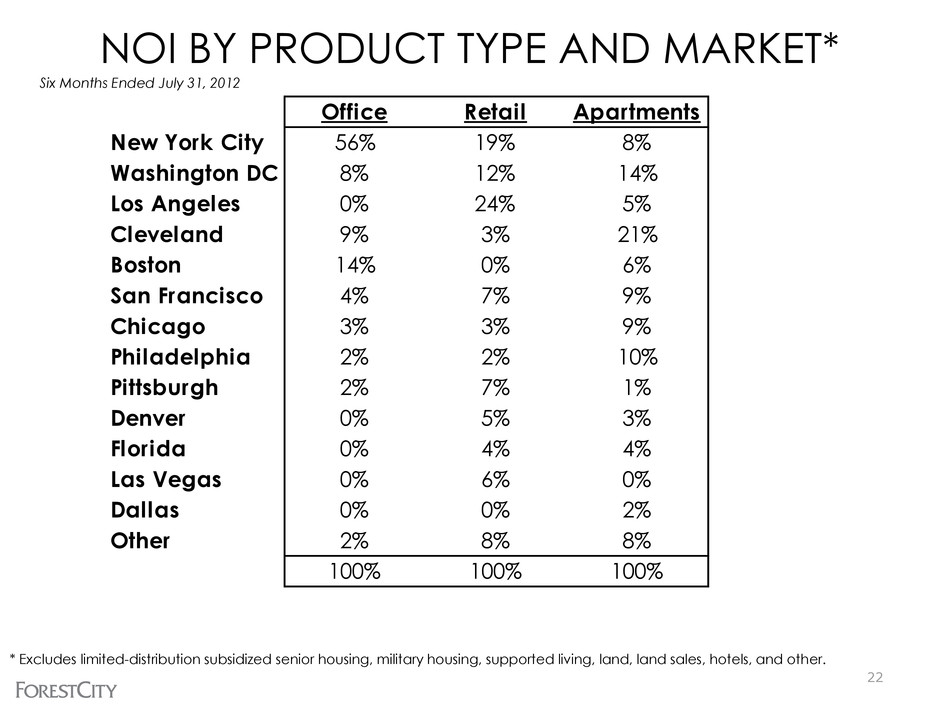
NOI BY PRODUCT TYPE AND MARKET* 22 Six Months Ended July 31, 2012 Office Retail Apartments New York City 56% 19% 8% Washington DC 8% 12% 14% Los Angeles 0% 24% 5% Cleveland 9% 3% 21% Boston 14% 0% 6% San Francisco 4% 7% 9% Chicago 3% 3% 9% Philadelphia 2% 2% 10% Pittsburgh 2% 7% 1% Denver 0% 5% 3% Florida 0% 4% 4% Las Vegas 0% 6% 0% Dallas 0% 0% 2% Other 2% 8% 8% 100% 100% 100% * Excludes limited-distribution subsidized senior housing, military housing, supported living, land, land sales, hotels, and other.
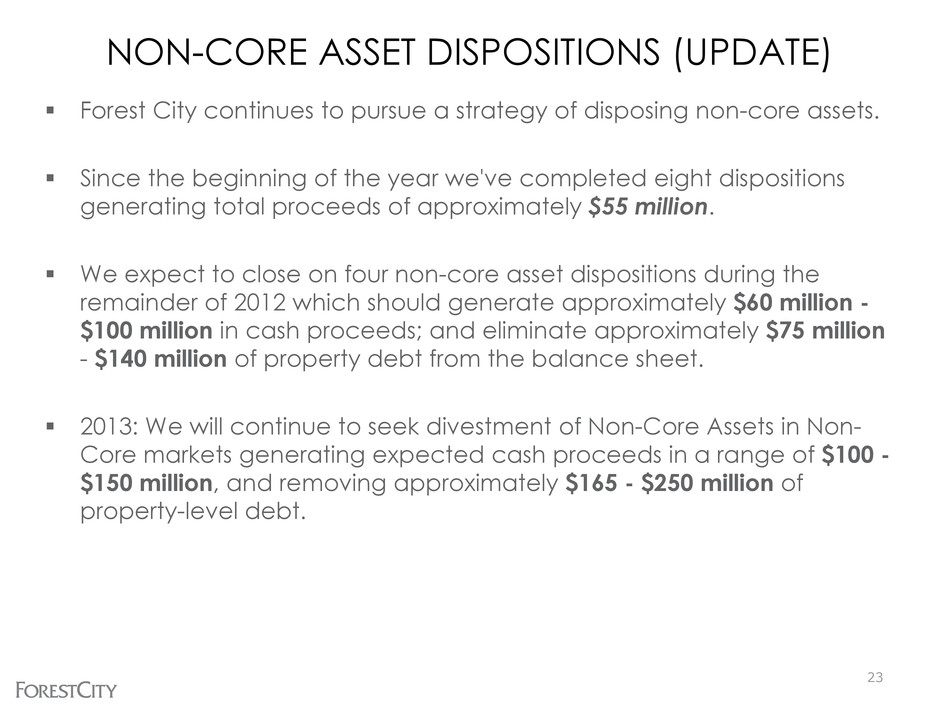
NON-CORE ASSET DISPOSITIONS (UPDATE) Forest City continues to pursue a strategy of disposing non-core assets. Since the beginning of the year we've completed eight dispositions generating total proceeds of approximately $55 million. We expect to close on four non-core asset dispositions during the remainder of 2012 which should generate approximately $60 million - $100 million in cash proceeds; and eliminate approximately $75 million - $140 million of property debt from the balance sheet. 2013: We will continue to seek divestment of Non-Core Assets in Non- Core markets generating expected cash proceeds in a range of $100 - $150 million, and removing approximately $165 - $250 million of property-level debt. 23

ASSET SALES Cash Net Annualized Cap EBDT Year EBDT/ Count Proceeds Sales Price NOI rate Prior to Sale Proceeds Leverage Total (11 Yr + YTD 2012: 2001-2012) 104 1,352,910 3,331,471 219,145 6.6% 102,232 7.6% 59% Total (10 Yr: 2002-2011) 88 1,207,394 2,928,026 191,337 6.5% 90,266 7.5% 59% Total (7 Yr: 2005-2011) 70 1,080,576 2,573,017 163,272 6.3% 76,309 7.1% 58% Total (5 Yr: 2007-2011) 58 720,777 1,860,871 122,134 6.6% 60,632 8.4% 61% 24
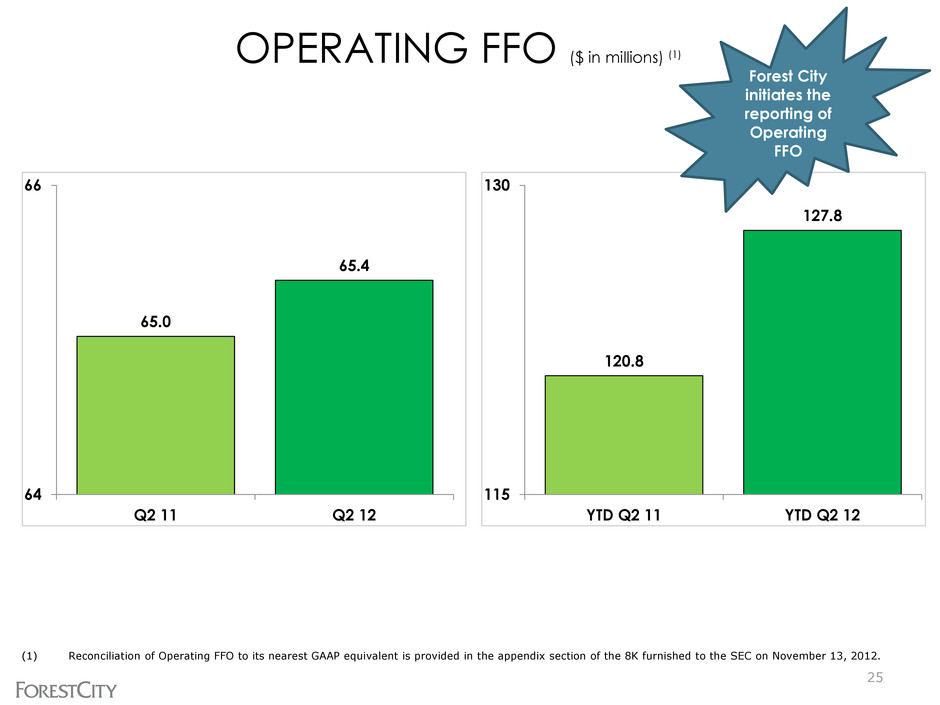
Consistent Operations OPERATING FFO ($ in millions) (1) (1) Reconciliation of Operating FFO to its nearest GAAP equivalent is provided in the appendix section of the 8K furnished to the SEC on November 13, 2012. 25 65.0 65.4 64 66 Q2 11 Q2 12 120.8 127.8 115 130 YTD Q2 11 YTD Q2 12 Forest City initiates the reporting of Operating FFO
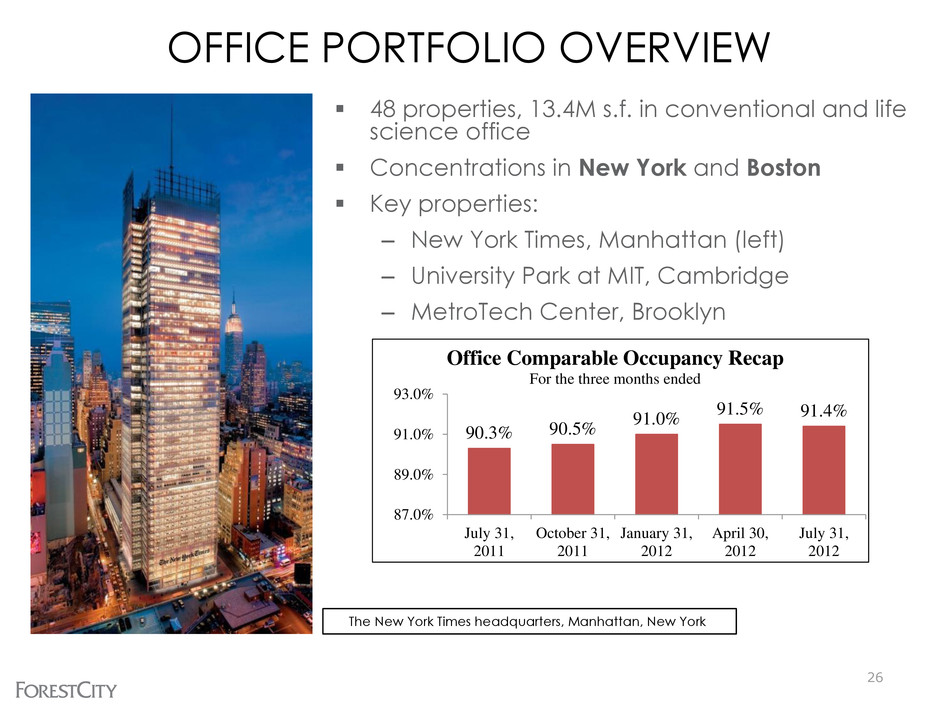
OFFICE PORTFOLIO OVERVIEW 48 properties, 13.4M s.f. in conventional and life science office Concentrations in New York and Boston Key properties: – New York Times, Manhattan (left) – University Park at MIT, Cambridge – MetroTech Center, Brooklyn The New York Times headquarters, Manhattan, New York 90.3% 90.5% 91.0% 91.5% 91.4% 87.0% 89.0% 91.0% 93.0% July 31, 2011 October 31, 2011 January 31, 2012 April 30, 2012 July 31, 2012 Office Comparable Occupancy Recap For the three months ended 26
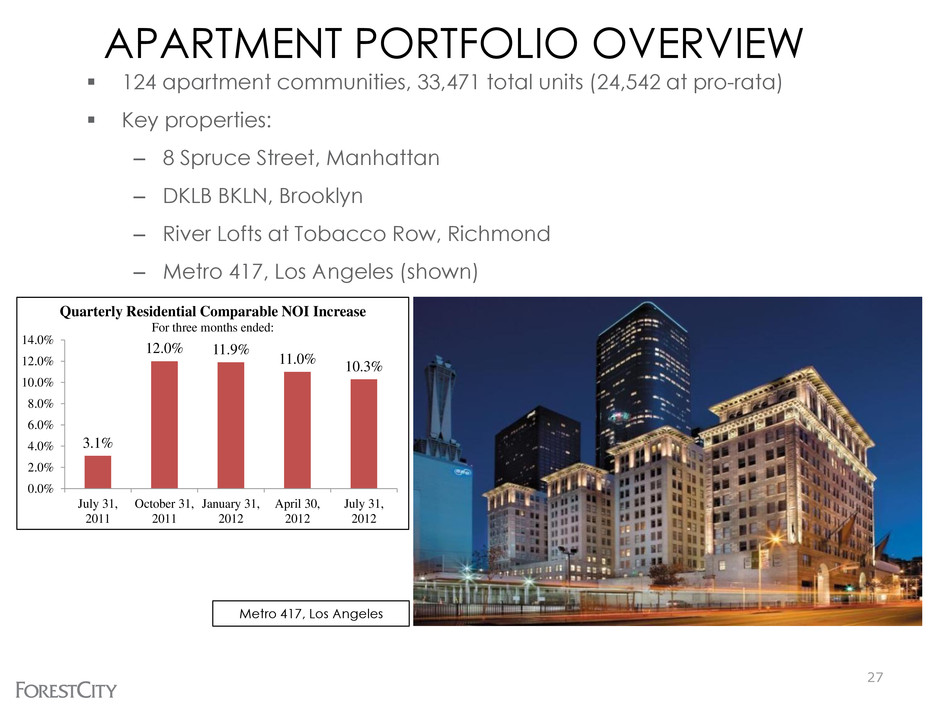
APARTMENT PORTFOLIO OVERVIEW 124 apartment communities, 33,471 total units (24,542 at pro-rata) Key properties: – 8 Spruce Street, Manhattan – DKLB BKLN, Brooklyn – River Lofts at Tobacco Row, Richmond – Metro 417, Los Angeles (shown) Metro 417, Los Angeles 3.1% 12.0% 11.9% 11.0% 10.3% 0.0% 2.0% 4.0% 6.0% 8.0% 10.0% 12.0% 14.0% July 31, 2011 October 31, 2011 January 31, 2012 April 30, 2012 July 31, 2012 Quarterly Residential Comparable NOI Increase For three months ended: 27

RETAIL PORTFOLIO OVERVIEW 44 centers, 24.5M total s.f., 15.1M GLA Enclosed regional malls, open-air lifestyle centers, big-box/power centers, specialty centers Key properties: – 42nd Street, New York – San Francisco Centre/ The Emporium – Short Pump Town Center, Richmond (Shown) – Victoria Gardens, Rancho Cucamonga, CA 28 Short Pump Town Center, Richmond, Virginia (1) All sales data is derived from schedules provided by our tenants and is not subject to the same internal control and verification procedures that are applied to the other data in the Company's supplemental package. In addition, the data is presented on a one-month lag to be consistent with the calendar year end of our tenants. $417 $434 $443 $456 $461 $370 $390 $410 $430 $450 July 31, 2011 October 31, 2011 January 31, 2012 April 30, 2012 July 31, 2012 FCE Regional Mall Sales per Square Foot (1) Rolling 12-month basis for the periods presented
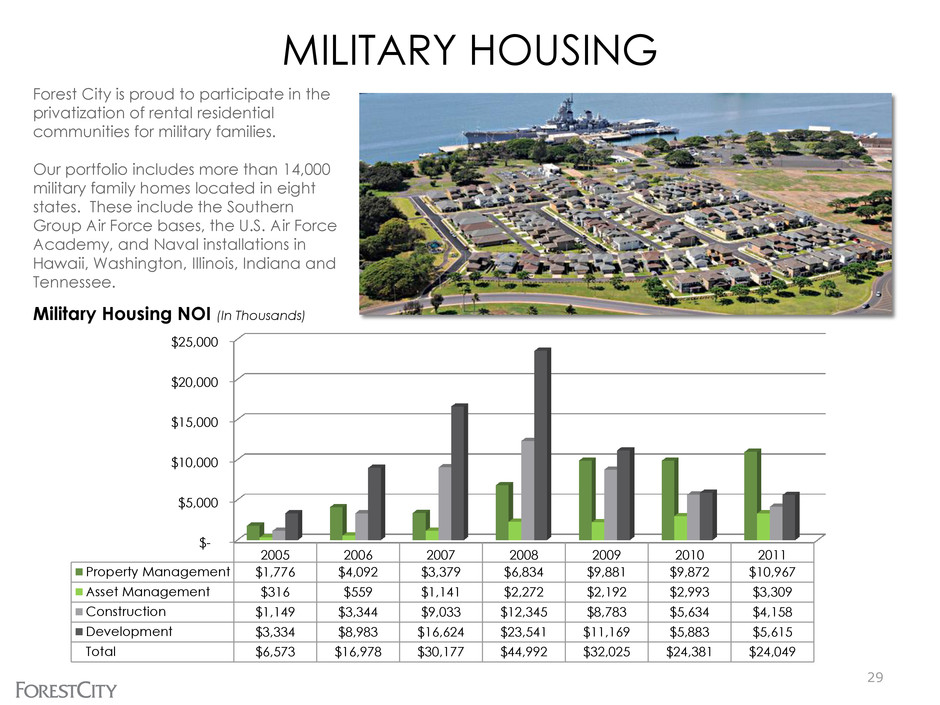
Forest City is proud to participate in the privatization of rental residential communities for military families. Our portfolio includes more than 14,000 military family homes located in eight states. These include the Southern Group Air Force bases, the U.S. Air Force Academy, and Naval installations in Hawaii, Washington, Illinois, Indiana and Tennessee. Military Housing NOI (In Thousands) 29 MILITARY HOUSING $- $5,000 $10,000 $15,000 $20,000 $25,000 2005 2006 2007 2008 2009 2010 2011 Property Management $1,776 $4,092 $3,379 $6,834 $9,881 $9,872 $10,967 Asset Management $316 $559 $1,141 $2,272 $2,192 $2,993 $3,309 Construction $1,149 $3,344 $9,033 $12,345 $8,783 $5,634 $4,158 Development $3,334 $8,983 $16,624 $23,541 $11,169 $5,883 $5,615 Total $6,573 $16,978 $30,177 $44,992 $32,025 $24,381 $24,049
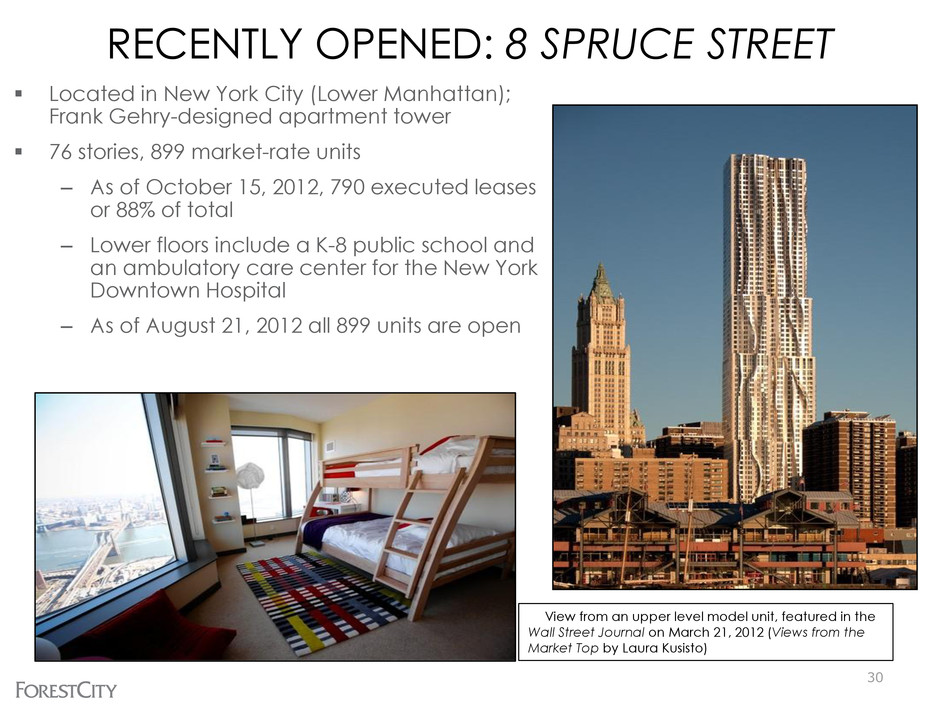
RECENTLY OPENED: 8 SPRUCE STREET Located in New York City (Lower Manhattan); Frank Gehry-designed apartment tower 76 stories, 899 market-rate units – As of October 15, 2012, 790 executed leases or 88% of total – Lower floors include a K-8 public school and an ambulatory care center for the New York Downtown Hospital – As of August 21, 2012 all 899 units are open View from an upper level model unit, featured in the Wall Street Journal on March 21, 2012 (Views from the Market Top by Laura Kusisto) 30

RECENTLY OPENED: WESTCHESTER’S RIDGE HILL Located in Yonkers, NY 1.3M s.f. mixed-use retail project opening in phases (currently 68% leased excluding Parcel L; 60% leased overall) – The second quarter saw the grand opening of its own Apple store, and the beginning development of the much anticipated LEGOLAND, which is expected to open in the spring of 2013 – Some tenants currently open: 31
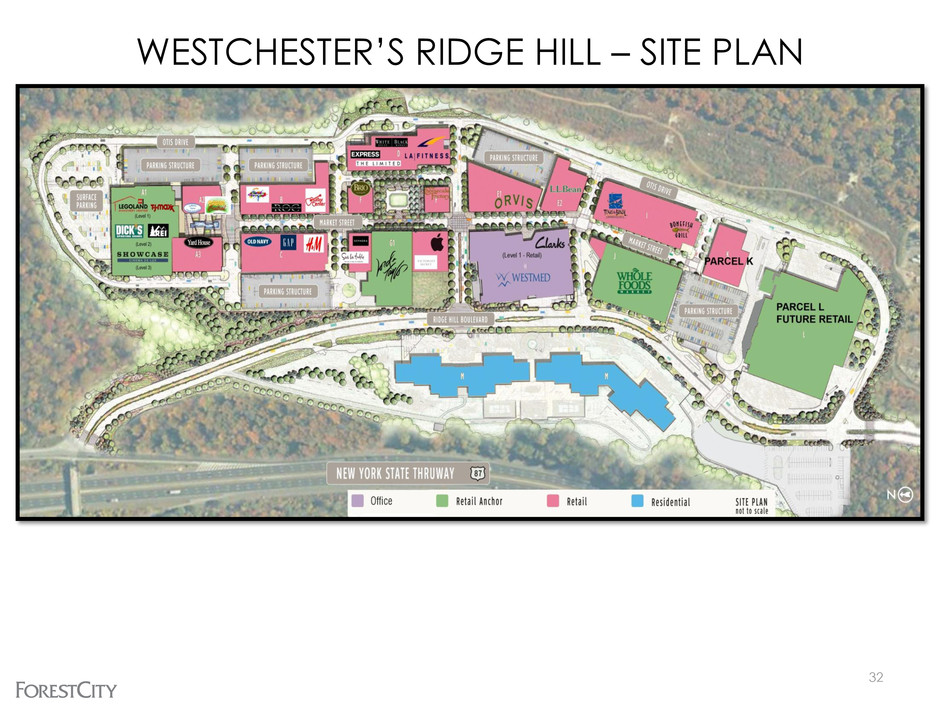
WESTCHESTER’S RIDGE HILL – SITE PLAN 32

Foundry Lofts, the first residential building at The Yards mixed-use project in the Capitol Riverfront District of Washington, D.C. – 170 loft-style apartments in an adaptive–reuse of a former Navy Yard industrial building – Initial move-ins began in December, 2011 with lease commitments for 99% of the units already RECENTLY OPENED: FOUNDRY LOFTS 33
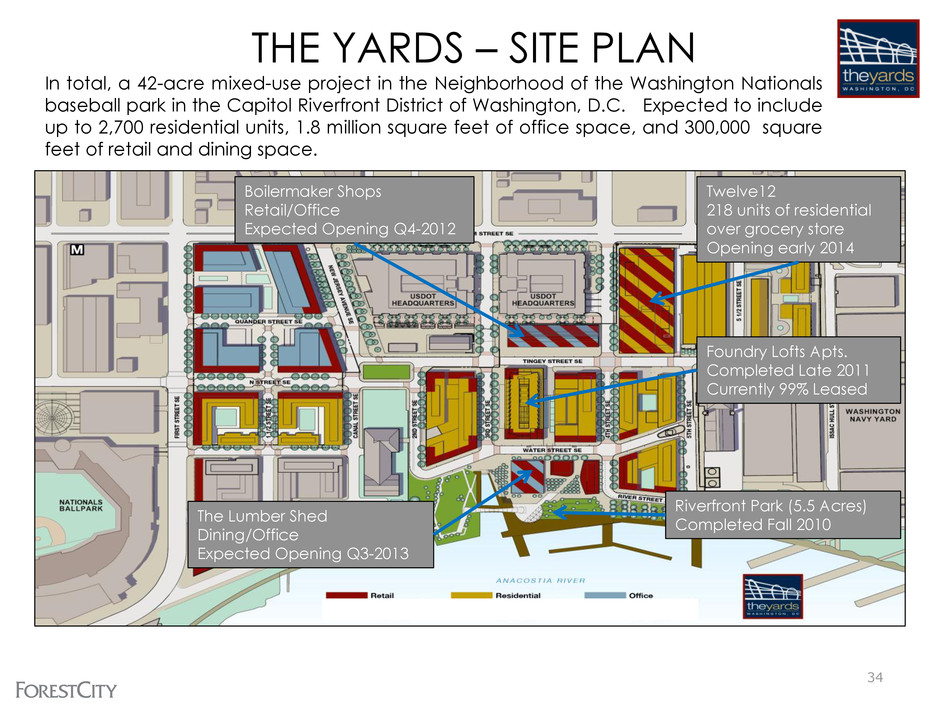
Riverfront Park (5.5 Acres) Completed Fall 2010 Foundry Lofts Apts. Completed Late 2011 Currently 99% Leased Boilermaker Shops Retail/Office Expected Opening Q4-2012 THE YARDS – SITE PLAN In total, a 42-acre mixed-use project in the Neighborhood of the Washington Nationals baseball park in the Capitol Riverfront District of Washington, D.C. Expected to include up to 2,700 residential units, 1.8 million square feet of office space, and 300,000 square feet of retail and dining space. The Lumber Shed Dining/Office Expected Opening Q3-2013 Twelve12 218 units of residential over grocery store Opening early 2014 34
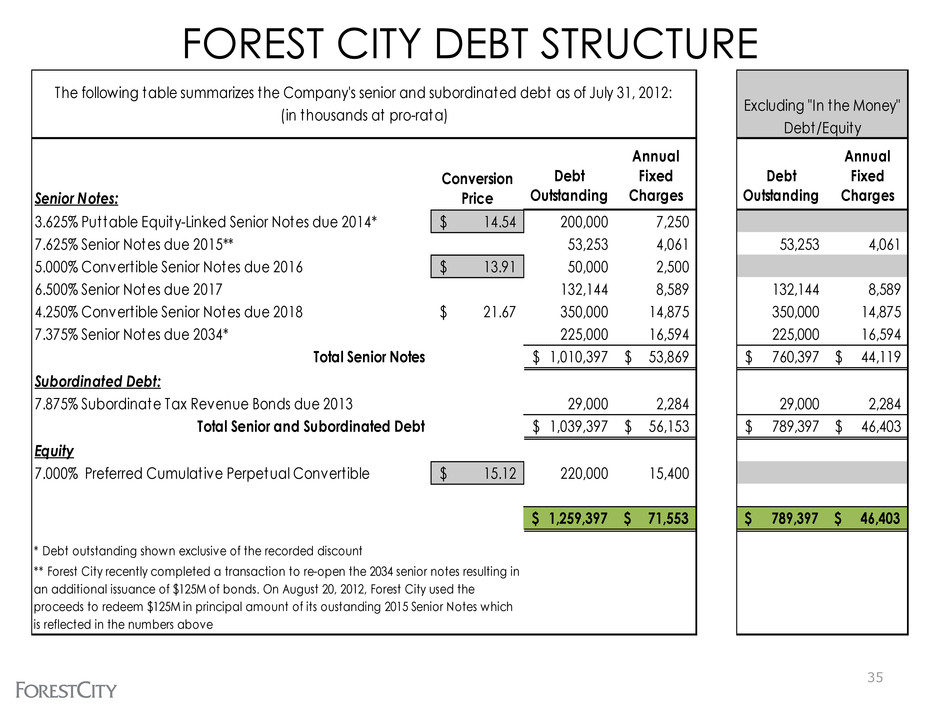
FOREST CITY DEBT STRUCTURE 35 Senior Notes: Debt Outstanding Annual Fixed Charges 3.625% Puttable Equity-Linked Senior Notes due 2014* 14.54$ 200,000 7,250 7.625% Senior Notes due 2015** 53,253 4,061 5.000% Convert ible Senior Notes due 2016 13.91$ 50,000 2,500 6.500% Senior Notes due 2017 132,144 8,589 4.250% Convert ible Senior Notes due 2018 21.67$ 350,000 14,875 7.375% Senior Notes due 2034* 225,000 16,594 Total Senior Notes 1,010,397$ 53,869$ Subordinated Debt: 7.875% Subordinate Tax Revenue Bonds due 2013 29,000 2,284 Total Senior and Subordinated Debt 1,039,397$ 56,153$ Equity 7.000% Preferred Cumulative Perpetual Convert ible 15.12$ 220,000 15,400 1,259,397$ 71,553$ The following table summarizes the Company's senior and subordinated debt as of July 31, 2012: (in thousands at pro-rata) ** Forest City recently completed a transaction to re-open the 2034 senior notes resulting in an additional issuance of $125M of bonds. On August 20, 2012, Forest City used the proceeds to redeem $125M in principal amount of its oustanding 2015 Senior Notes which is reflected in the numbers above * Debt outstanding shown exclusive of the recorded discount Conversion Price Debt Outstanding Annual Fixed Charges 53,253 4,061 132,144 8,589 350,000 14,875 225,000 16,594 760,397$ 44,119$ 29,000 2,284 789,397$ 46,403$ 789,397$ 46,403$ Excluding "In the Money" Debt/Equity
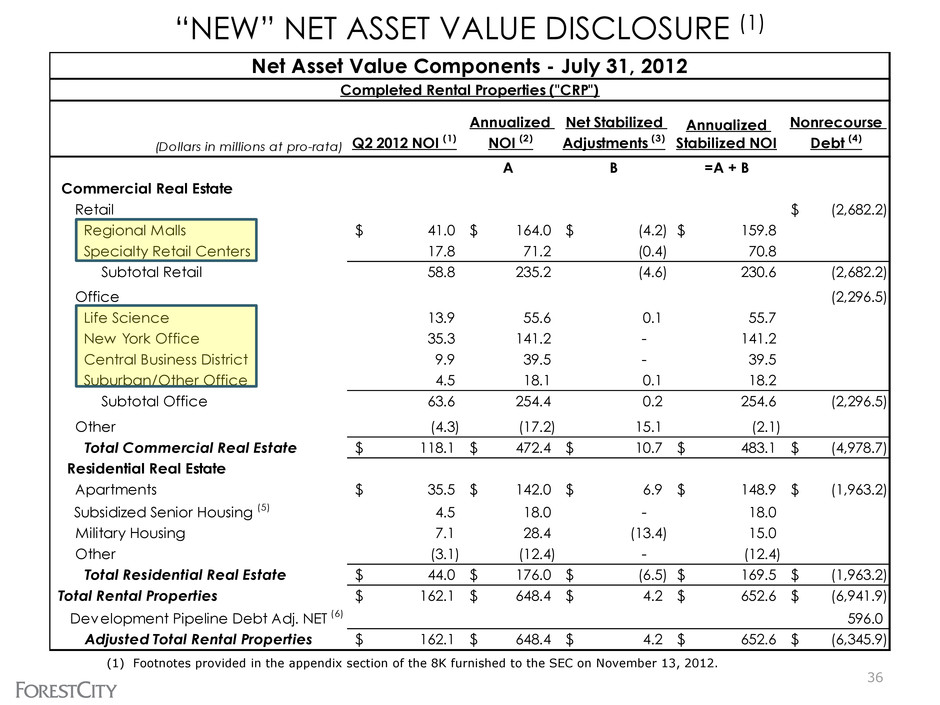
(Dollars in millions at pro-rata) Q2 2012 NOI (1) Annualized NOI (2) Net Stabilized Adjustments (3) Annualized Stabilized NOI Nonrecourse Debt (4) A B =A + B Commercial Real Estate Retail (2,682.2)$ Regional Malls 41.0$ 164.0$ (4.2)$ 159.8$ Specialty Retail Centers 17.8 71.2 (0.4) 70.8 Subtotal Retail 58.8 235.2 (4.6) 230.6 (2,682.2) Office (2,296.5) Life Science 13.9 55.6 0.1 55.7 New York Office 35.3 141.2 - 141.2 Central Business District 9.9 39.5 - 39.5 Suburban/Other Office 4.5 18.1 0.1 18.2 Subtotal Office 63.6 254.4 0.2 254.6 (2,296.5) Other (4.3) (17.2) 15.1 (2.1) Total Commercial Real Estate 118.1$ 472.4$ 10.7$ 483.1$ (4,978.7)$ Residential Real Estate Apartments 35.5$ 142.0$ 6.9$ 148.9$ (1,963.2)$ Subsidized Senior Housing (5) 4.5 18.0 - 18.0 Military Housing 7.1 28.4 (13.4) 15.0 Other (3.1) (12.4) - (12.4) Total Residential Real Estate 44.0$ 176.0$ (6.5)$ 169.5$ (1,963.2)$ Total Rental Properties 162.1$ 648.4$ 4.2$ 652.6$ (6,941.9)$ Development Pipeline Debt Adj. NET (6) 596.0 Adjusted Total Rental Properties 162.1$ 648.4$ 4.2$ 652.6$ (6,345.9)$ Net Asset Value Components - July 31, 2012 Completed Rental Properties ("CRP") “NEW” NET ASSET VALUE DISCLOSURE (1) (1) Footnotes provided in the appendix section of the 8K furnished to the SEC on November 13, 2012. 36
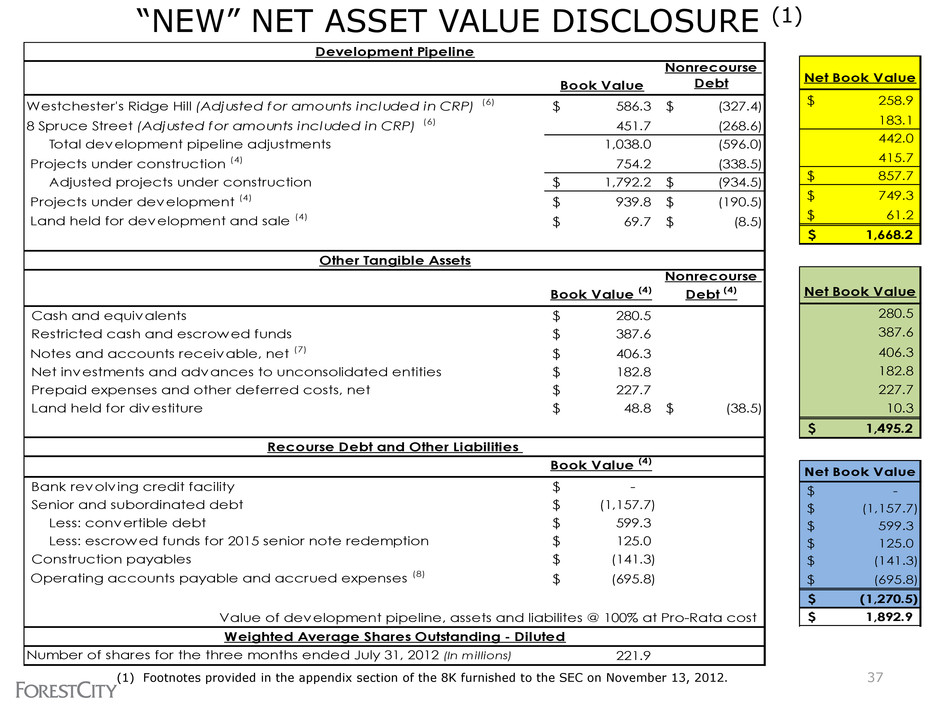
“NEW” NET ASSET VALUE DISCLOSURE (1) (1) Footnotes provided in the appendix section of the 8K furnished to the SEC on November 13, 2012. Book Value Nonrecourse Debt Westchester's Ridge Hill (Adjusted for amounts included in CRP) (6) 586.3$ (327.4)$ 8 Spruce Street (Adjusted for amounts included in CRP) (6) 451.7 (268.6) Total development pipeline adjustments 1,038.0 (596.0) Projects under construction (4) 754.2 (338.5) Adjusted projects under construction 1,792.2$ (934.5)$ Projects under development (4) 939.8$ (190.5)$ Land held for development and sale (4) 69.7$ (8.5)$ Book Value (4) Nonrecourse Debt (4) Cash and equivalents 280.5$ Restricted cash and escrowed funds 387.6$ Notes and accounts receivable, net (7) 406.3$ Net investments and advances to unconsolidated entities 182.8$ Prepaid expenses and other deferred costs, net 227.7$ Land held for divestiture 48.8$ (38.5)$ Book Value (4) Bank revolv ing credit facility -$ Senior and subordinated debt (1,157.7)$ Less: convertible debt 599.3$ Less: escrowed funds for 2015 senior note redemption 125.0$ Construction payables (141.3)$ Operating accounts payable and accrued expenses (8) (695.8)$ Value of development pipeline, assets and liabilites @ 100% at Pro-Rata cost Number of shares for the three months ended July 31, 2012 (In millions) 221.9 Weighted Average Shares Outstanding - Diluted Development Pipeline Other Tangible Assets Recourse Debt and Other Liabilities Net Book Value 258.9$ 183.1 442.0 415.7 857.7$ 749.3$ 61.2$ 1,668.2$ Net Book Value 280.5 387.6 406.3 182.8 227.7 10.3 1,495.2$ 37 Net Book Value -$ (1,157.7)$ 599.3$ 125.0$ (141.3)$ (695.8)$ (1,270.5)$ 1,892.9$
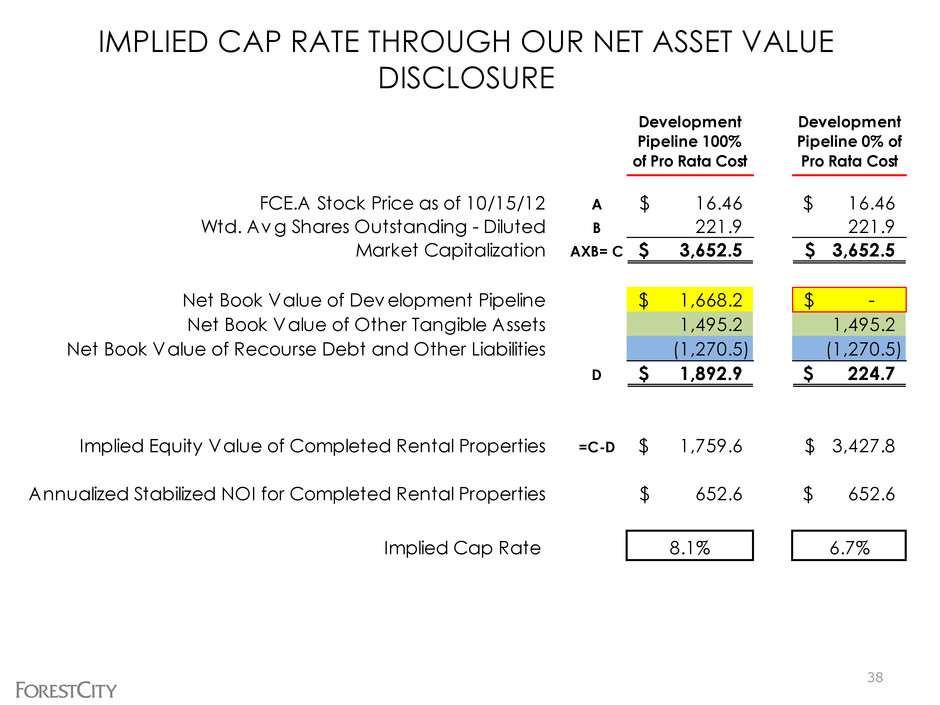
38 IMPLIED CAP RATE THROUGH OUR NET ASSET VALUE DISCLOSURE Development Pipeline 100% of Pro Rata Cost Development Pipeline 0% of Pro Rata Cost FCE.A Stock Price as of 10/15/12 A 16.46$ 16.46$ Wtd. Avg Shares Outstanding - Diluted B 221.9 221.9 Market Capitalization AXB= C 3,652.5$ 3,652.5$ Net Book Value of Development Pipeline 1,668.2$ -$ Net Book Value of Other Tangible Assets 1,495.2 1,495.2 Net Book Value of Recourse Debt and Other Liabilities (1,270.5) (1,270.5) D 1,892.9$ 224.7$ Implied Equity Value of Completed Rental Properties =C-D 1,759.6$ 3,427.8$ Annualized Stabilized NOI for Completed Rental Properties 652.6$ 652.6$ Implied Cap Rate 8.1% 6.7%
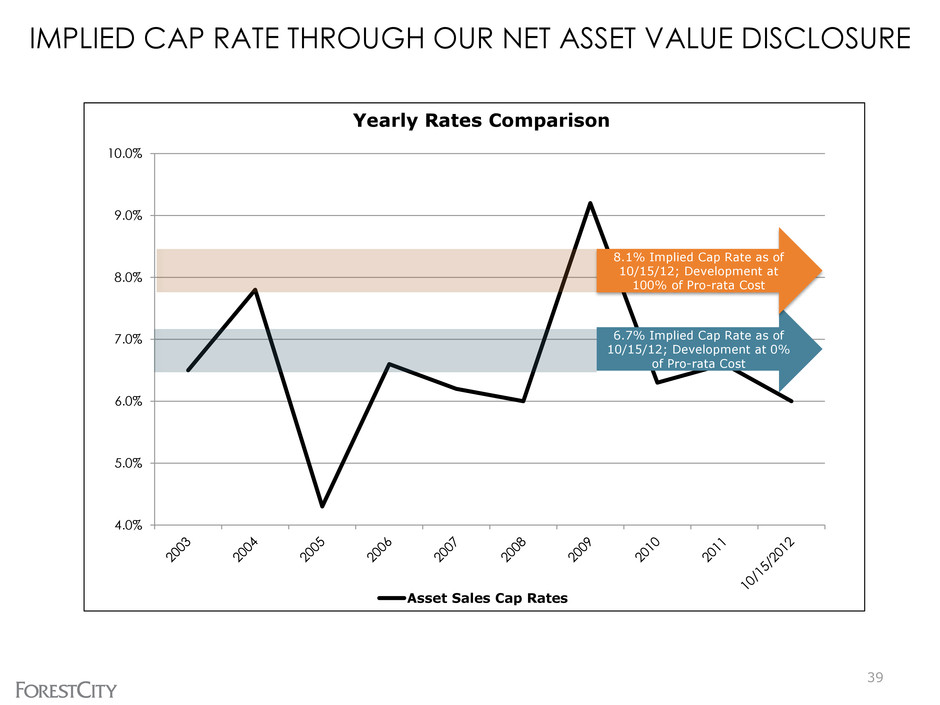
IMPLIED CAP RATE THROUGH OUR NET ASSET VALUE DISCLOSURE 4.0% 5.0% 6.0% 7.0% 8.0% 9.0% 10.0% Yearly Rates Comparison Asset Sales Cap Rates 6.7% Implied Cap Rate as of 10/15/12; Development at 0% of Pro-rata Cost 39 8.1% Implied Cap Rate as of 10/15/12; Development at 100% of Pro-rata Cost

ATLANTIC YARDS OVERVIEW
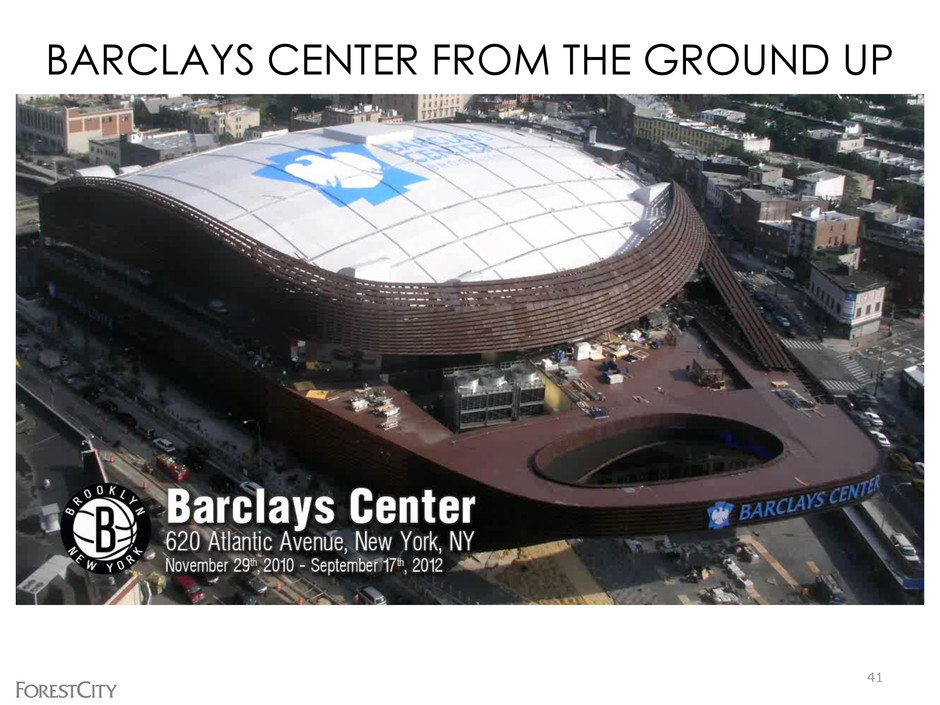
41 BARCLAYS CENTER FROM THE GROUND UP

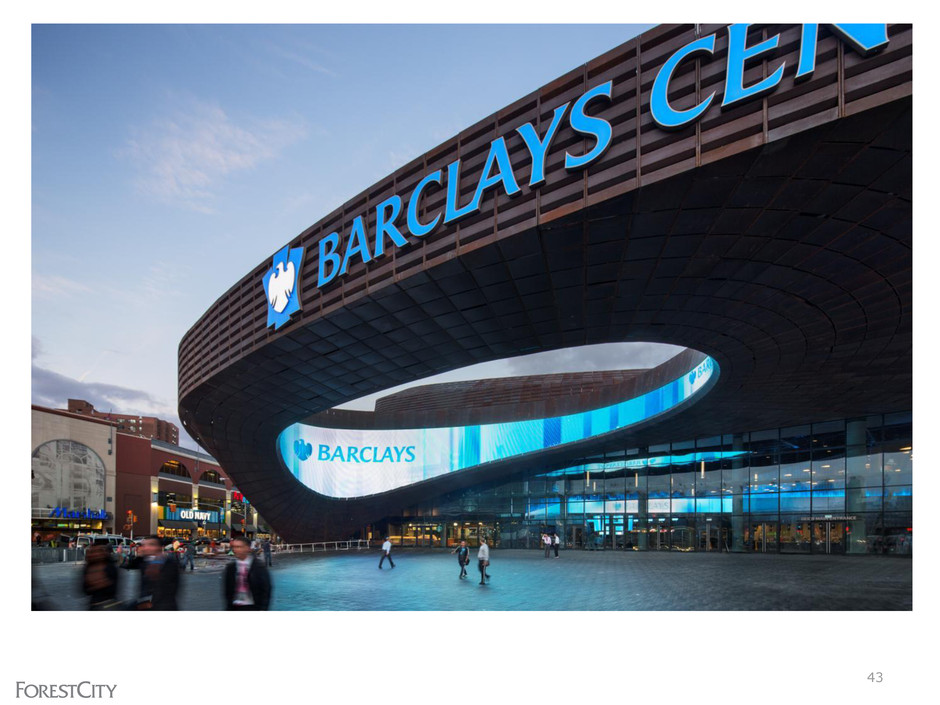
THE COMPLETED PROJECT 42
43

MORE THAN 200,000 VISITORS SO FAR… 44 Getty Images Getty Images

… AND MORE THAN 200 EVENTS BOOKED 45

READY FOR NETS HOME OPENER ON NATIONAL TV 46

BARCLAYS CENTER OWNERSHIP Onexim 45.00% NS&E - Other Investors 20.99% NS&E - Forest City 34.01% 47 55% NS&E Ownership of Barclays Center
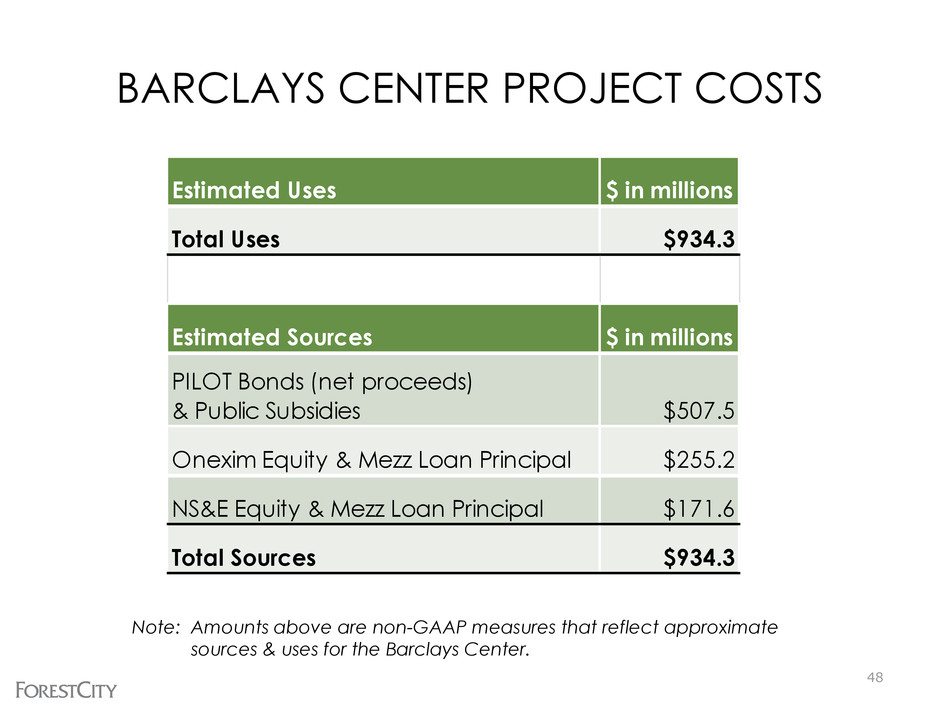
BARCLAYS CENTER PROJECT COSTS 48 Estimated Uses $ in millions Total Uses $934.3 Estimated Sources $ in millions PILOT Bonds (net proceeds) & Public Subsidies $507.5 Onexim Equity & Mezz Loan Principal $255.2 NS&E Equity & Mezz Loan Principal $171.6 Total Sources $934.3 Note: Amounts above are non-GAAP measures that reflect approximate sources & uses for the Barclays Center.

BARCLAYS CENTER ECONOMICS 79% of Contractually Obligated Income (“COI”) closed as of early October; Total COI represents approximately 72% of total revenue Arena’s early years are ramp-up period; NOI expected to stabilize at +/- $70 million PILOT bond payments start at $30.7 million per year Upon opening, NS&E effectively paid off its 55% share of 11% mezz loan 55% of economics flow to Forest City until member loans are repaid – Forest City advanced capital needs for NS&E through member loans – Member loans have priority over NS&E equity 49

BROOKLYN NETS OWNERSHIP Onexim 80.00% NS&E - Other Investors 7.63% NS&E - Forest City 12.37% 50 20% NS&E Ownership of Brooklyn Nets

BROOKLYN NETS 51 2012/13 – Inaugural season in Brooklyn and Barclays Center – Successfully launched new team brand • New apparel has become a fashion statement in Brooklyn and beyond • Team ranks in top five in NBA merchandise sales – On pace to 11,000 full season ticket sales – Team poised to contend in the Eastern Conference; roster highlights include: • Acquiring seven-time all-star Joe Johnson • Re-signing franchise face and three-time all-star Deron Williams, as well as Brook Lopez, Gerald Wallace, and Kris Humphries – No further equity contributions anticipated through FY ending June 2013 As of Sept 27, team economics split 80/20 between Onexim and NS&E – NS&E’s obligation to fund 100% of losses ended with the opening of the Barclays Center – Evaluating economics of team in Brooklyn
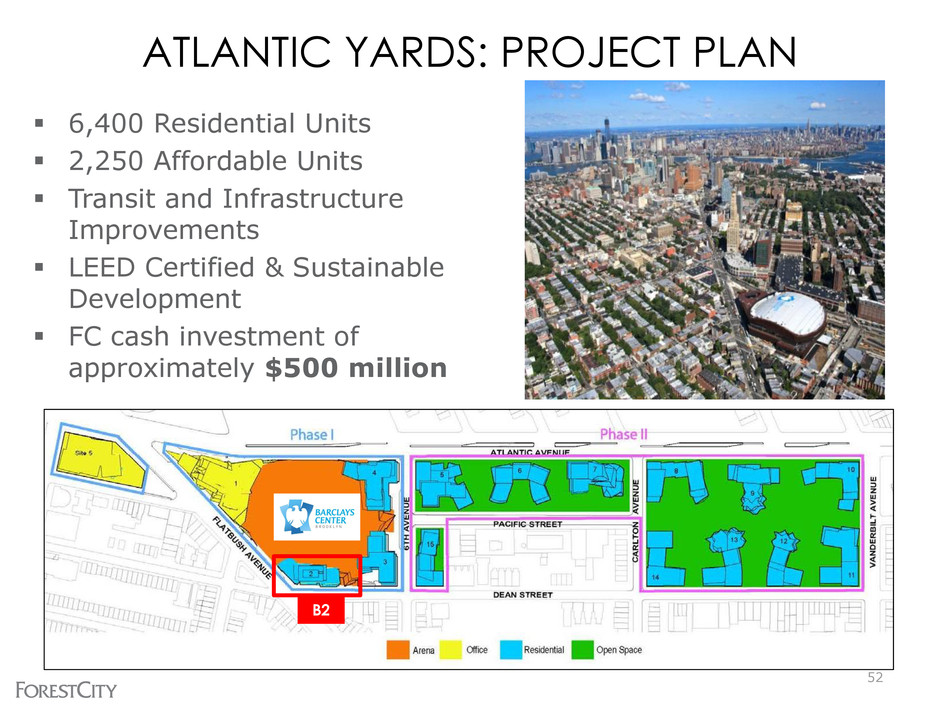
ATLANTIC YARDS: PROJECT PLAN 52 6,400 Residential Units 2,250 Affordable Units Transit and Infrastructure Improvements LEED Certified & Sustainable Development FC cash investment of approximately $500 million B2
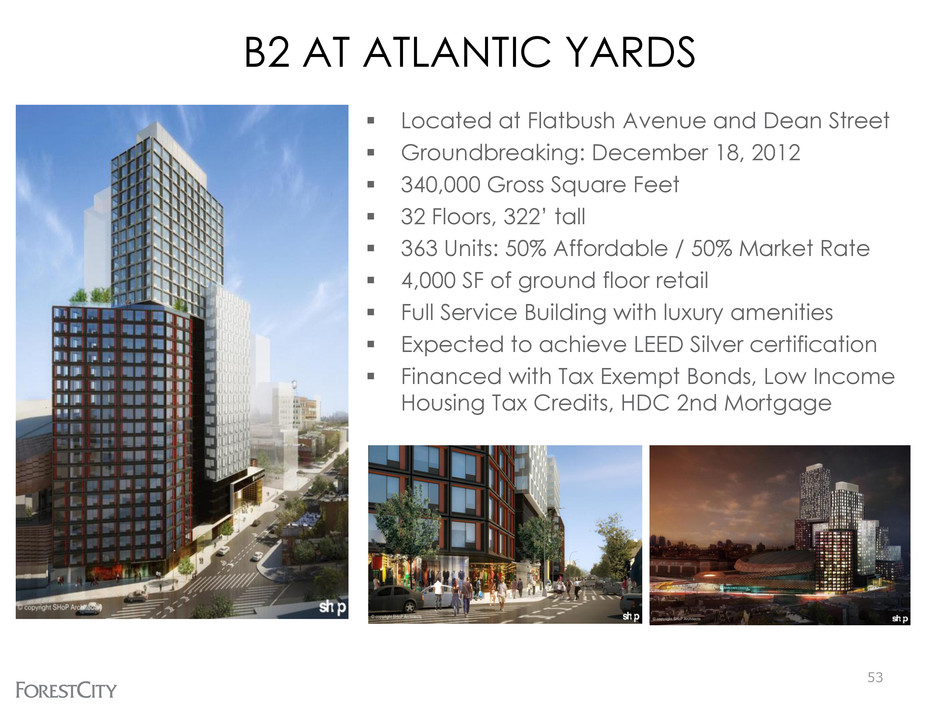
B2 AT ATLANTIC YARDS 53 Located at Flatbush Avenue and Dean Street Groundbreaking: December 18, 2012 340,000 Gross Square Feet 32 Floors, 322’ tall 363 Units: 50% Affordable / 50% Market Rate 4,000 SF of ground floor retail Full Service Building with luxury amenities Expected to achieve LEED Silver certification Financed with Tax Exempt Bonds, Low Income Housing Tax Credits, HDC 2nd Mortgage
Q&A 54
APPENDIX OPERATING FFO DEFINITION RECONCILIATION OF OPERATING FFO TO FFO NET ASSET VALUE COMPONENTS FOOTNOTES RECONCILIATION OF FFO AND EBDT TO NET EARNINGS 55
OPERATING FUNDS FROM OPERATIONS 56 Operating FFO – In addition to reporting FFO, we report Operating FFO as an additional financial measure of our operating performance. We believe it is appropriate to adjust FFO, as defined by NAREIT, for significant non-recurring items driven by transactional activity and factors relating to the financial and real estate markets, rather than factors specific to the on-going operating performance of our properties. We use Operating FFO as an indicator of continuing operating results in planning and executing our business strategy. Operating FFO should not be considered to be an alternative to net earnings computed under GAAP as an indicator of our operating performance. Operating FFO may not be comparable to similarly titled measures used by other companies. Operating FFO is defined as FFO, as defined by NAREIT, adjusted to exclude: i) activity related to our land held for divestiture (including impairment charges); ii) impairment of Land Group projects; iii) write-offs of abandoned development projects; iv) income recognized on state and federal historic and other tax credits; v) gains or losses from the early extinguishment of debt; vi) gains or losses on change in control of interests; vii) the adjustment to recognize rental revenues and rental expense using the straight-line method; viii) other non-recurring items such as income generated from the casino land sale; ix) the Nets pre-tax FFO; and x) income taxes on FFO.
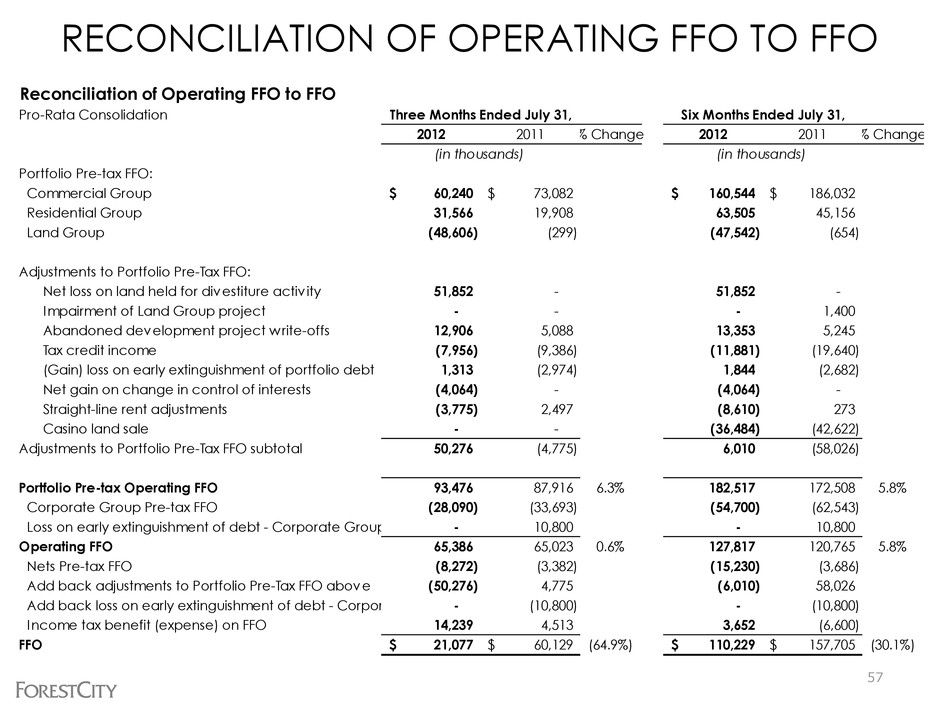
RECONCILIATION OF OPERATING FFO TO FFO 57 Reconciliation of Operating FFO to FFO Pro-Rata Consolidation 2012 2011 % Change 2012 2011 % Change Portfolio Pre-tax FFO: Commercial Group 60,240$ 73,082$ 160,544$ 186,032$ Residential Group 31,566 19,908 63,505 45,156 Land Group (48,606) (299) (47,542) (654) Adjustments to Portfolio Pre-Tax FFO: Net loss on land held for divestiture activ ity 51,852 - 51,852 - Impairment of Land Group project - - - 1,400 Abandoned development project write-offs 12,906 5,088 13,353 5,245 Tax credit income (7,956) (9,386) (11,881) (19,640) (Gain) loss on early extinguishment of portfolio debt 1,313 (2,974) 1,844 (2,682) Net gain on change in control of interests (4,064) - (4,064) - Straight-line rent adjustments (3,775) 2,497 (8,610) 273 Casino land sale - - (36,484) (42,622) Adjustments to Portfolio Pre-Tax FFO subtotal 50,276 (4,775) 6,010 (58,026) Portfolio Pre-tax Operating FFO 93,476 87,916 6.3% 182,517 172,508 5.8% Corporate Group Pre-tax FFO (28,090) (33,693) (54,700) (62,543) Loss on early extinguishment of debt - Corporate Group - 10,800 - 10,800 Operating FFO 65,386 65,023 0.6% 127,817 120,765 5.8% Nets Pre-tax FFO (8,272) (3,382) (15,230) (3,686) Add back adjustments to Portfolio Pre-Tax FFO above (50,276) 4,775 (6,010) 58,026 Add back loss on early extinguishment of debt - Corporate Group - (10,800) - (10,800) Income tax benefit (expense) on FFO 14,239 4,513 3,652 (6,600) FFO 21,077$ 60,129$ (64.9%) 110,229$ 157,705$ (30.1%) Three Months Ended July 31, Six Months Ended July 31, (in thousands) (in thousands)
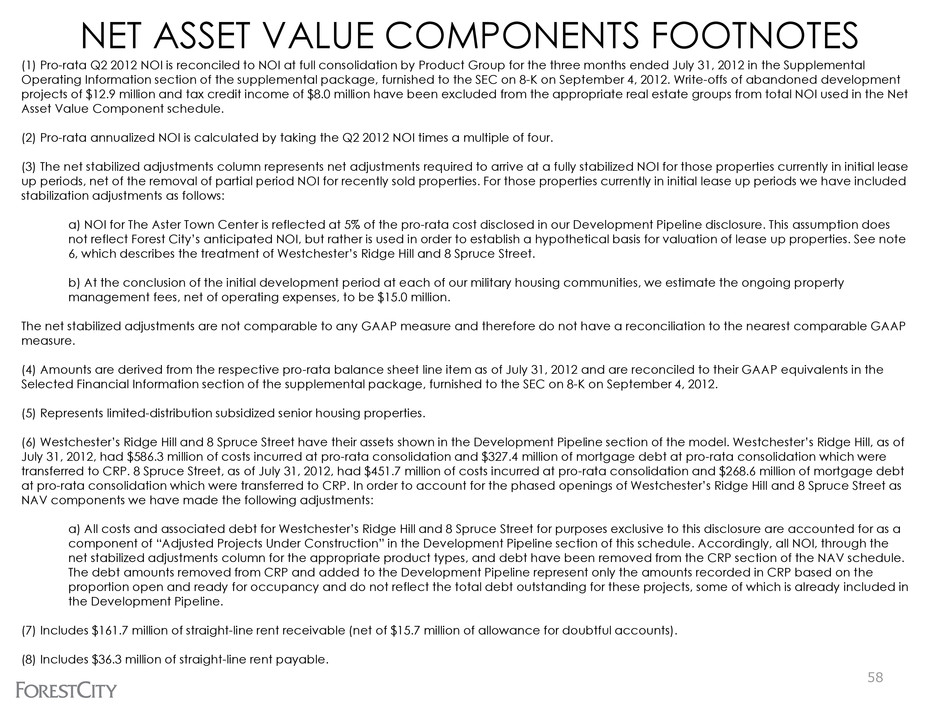
NET ASSET VALUE COMPONENTS FOOTNOTES 58 (1) Pro-rata Q2 2012 NOI is reconciled to NOI at full consolidation by Product Group for the three months ended July 31, 2012 in the Supplemental Operating Information section of the supplemental package, furnished to the SEC on 8-K on September 4, 2012. Write-offs of abandoned development projects of $12.9 million and tax credit income of $8.0 million have been excluded from the appropriate real estate groups from total NOI used in the Net Asset Value Component schedule. (2) Pro-rata annualized NOI is calculated by taking the Q2 2012 NOI times a multiple of four. (3) The net stabilized adjustments column represents net adjustments required to arrive at a fully stabilized NOI for those properties currently in initial lease up periods, net of the removal of partial period NOI for recently sold properties. For those properties currently in initial lease up periods we have included stabilization adjustments as follows: a) NOI for The Aster Town Center is reflected at 5% of the pro-rata cost disclosed in our Development Pipeline disclosure. This assumption does not reflect Forest City’s anticipated NOI, but rather is used in order to establish a hypothetical basis for valuation of lease up properties. See note 6, which describes the treatment of Westchester’s Ridge Hill and 8 Spruce Street. b) At the conclusion of the initial development period at each of our military housing communities, we estimate the ongoing property management fees, net of operating expenses, to be $15.0 million. The net stabilized adjustments are not comparable to any GAAP measure and therefore do not have a reconciliation to the nearest comparable GAAP measure. (4) Amounts are derived from the respective pro-rata balance sheet line item as of July 31, 2012 and are reconciled to their GAAP equivalents in the Selected Financial Information section of the supplemental package, furnished to the SEC on 8-K on September 4, 2012. (5) Represents limited-distribution subsidized senior housing properties. (6) Westchester’s Ridge Hill and 8 Spruce Street have their assets shown in the Development Pipeline section of the model. Westchester’s Ridge Hill, as of July 31, 2012, had $586.3 million of costs incurred at pro-rata consolidation and $327.4 million of mortgage debt at pro-rata consolidation which were transferred to CRP. 8 Spruce Street, as of July 31, 2012, had $451.7 million of costs incurred at pro-rata consolidation and $268.6 million of mortgage debt at pro-rata consolidation which were transferred to CRP. In order to account for the phased openings of Westchester’s Ridge Hill and 8 Spruce Street as NAV components we have made the following adjustments: a) All costs and associated debt for Westchester’s Ridge Hill and 8 Spruce Street for purposes exclusive to this disclosure are accounted for as a component of “Adjusted Projects Under Construction” in the Development Pipeline section of this schedule. Accordingly, all NOI, through the net stabilized adjustments column for the appropriate product types, and debt have been removed from the CRP section of the NAV schedule. The debt amounts removed from CRP and added to the Development Pipeline represent only the amounts recorded in CRP based on the proportion open and ready for occupancy and do not reflect the total debt outstanding for these projects, some of which is already included in the Development Pipeline. (7) Includes $161.7 million of straight-line rent receivable (net of $15.7 million of allowance for doubtful accounts). (8) Includes $36.3 million of straight-line rent payable.

59 RECONCILIATION OF FFO AND EBDT TO NET EARNINGS FFO EBDT FFO EBDT FFO EBDT FFO EBDT Net earnings (loss) attributable to Forest City Enterprises, Inc. (109,574)$ (109,574)$ (26,978)$ (26,978)$ 58,048$ 58,048$ (86,486)$ (86,486)$ Depreciation and Amortization—Real Estate Groups 290,949 290,949 293,869 293,869 286,042 286,042 281,704 281,704 Impairment of depreciable rental properties 19,897 19,897 67,235 67,235 153,237 153,237 54,211 54,211 Gain on disposition of rental properties and partial interests in rental properties (15,636) (15,636) (55,481) (55,481) (273,431) (273,431) (82,028) (82,028) Income tax expense (benefit) adjustments — current and deferred: Gain on disposition of rental properties and partial interests in rental properties 5,679 5,679 21,517 21,517 106,045 106,045 31,812 31,812 Impairment of depreciable rental properties (7,722) (7,722) (26,076) (26,076) (59,856) (59,856) (21,024) (21,024) Straight-line rent adjustments - (358) - (13,242) - (18,160) - (7,208) Net loss on land held for divestiture activity - - - - - - - 153,363 Impairment of Land Group projects - 2,650 - 5,422 - 4,102 - 3,950 Amortization of mortgage procurement costs—Real Estate Groups - 13,788 - 15,583 - 14,341 - 14,670 Preference payment - 3,329 - 2,341 - 2,341 - 1,732 Preferred return on disposition - 939 - - - - - - Allowance for projects under development revision - (6,000) - (6,000) - 1,000 - (1,000) Retrospective adoption of accounting guidance for convertible debt instruments - 1,543 - - - - - - Income tax expense (benefit) adjustments — current and deferred: Deferred income tax expense on operating earnings - 10,235 - 10,598 - 56,235 - 51,699 Remove non-Real Estate deferred taxes for 2008 - 2010 only - 10,242 - 14,421 - (18,478) - - Impairment of Land Group projects - (1,024) - (2,103) - (1,591) - (1,532) Net loss on land held for divestiture activity - - - - - - - (59,479) FFO/EBDT 183,593$ 218,937$ 274,086$ 301,106$ 270,085$ 309,875$ 178,189$ 334,384$ Reconciliation of FFO and EBDT to Net Earnings (Loss) Forest City Enterprises, Inc. (in thousands) January 31, 2010 January 31, 2011 January 31, 2012 Years Ended January 31, 2009
Forest City Enterprises, Inc., is an NYSE-listed national real estate company with $10.7 billion in total assets (7/31/2012) . The Company is principally engaged in the ownership, development, management and acquisition of commercial and residential real estate and land throughout the United States. Founded in 1920 and based in Cleveland, Ohio, Forest City’s diverse portfolio includes hundreds of premier properties located throughout the United States. We are especially active in our Core Markets – New York, Boston, Greater Washington, D.C./Baltimore, Denver, Los Angeles, Greater San Francisco, Dallas, Philadelphia and Chicago – where we have overcome high barriers to entry and developed a unique franchise. These are great urban markets with strong demographics and good growth potential. Investor Relations Contact: Jeff Linton Senior Vice President, Corporate Communication Forest City Enterprises 216-416-3558 jefflinton@forestcity.net


