Exhibit 99.1
Forest City Enterprises, Inc.
Supplemental Package
Three and Nine Months Ended October 31, 2013 and 2012
Forest City Enterprises, Inc. and Subsidiaries
Three and Nine Months Ended October 31, 2013 and 2012
Supplemental Package
NYSE: FCEA, FCEB
Index
| Corporate Description | |
| Selected Financial Information | |
| Consolidated Balance Sheet Information | |
| Consolidated Earnings Information | |
| Net Asset Value Components | |
| Supplemental Operating Information | |
| Occupancy Data | |
| Retail Sales Data | |
| Leasing Summary | |
| Comparable Net Operating Income (NOI) | |
| Comparable NOI Detail | |
| NOI By Product Type | |
| NOI By Core Market | |
| Reconciliation of NOI to Net Earnings (Loss) | |
| Results of Operations | |
| Reconciliation of Operating FFO to FFO | |
| Operating FFO Bridges | |
| Reconciliation of Net Earnings (Loss) to FFO | |
| Retail and Office Lease Expirations | |
| Development Pipeline | |
| Military Housing | |
| Supplemental Financial Information | |
| Common Stock Data/Financial Covenants | |
| Scheduled Maturities Table | |
| Summary of FFO | |
This supplemental package, together with other statements and information publicly disseminated by us, contains “forward-looking statements” within the meaning of Section 27A of the Securities Act of 1933, as amended, and Section 21E of the Securities Exchange Act of 1934, as amended. Such statements reflect management’s current views with respect to financial results related to future events and are based on assumptions and expectations that may not be realized and are inherently subject to risks and uncertainties, many of which cannot be predicted with accuracy and some of which might not even be anticipated. Future events and actual results, financial or otherwise, may differ from the results discussed in the forward-looking statements. Risk factors discussed in Item 1A of our Form 10-K for the year ended January 31, 2013 and other factors that might cause differences, some of which could be material, include, but are not limited to, the impact of current lending and capital market conditions on our liquidity, ability to finance or refinance projects and repay our debt, the impact of the current economic environment on the ownership, development and management of our commercial real estate portfolio, general real estate investment and development risks, using modular construction as a new construction methodology and investing in a facility to produce modular units, vacancies in our properties, further downturns in the housing market, competition, illiquidity of real estate investments, bankruptcy or defaults of tenants, anchor store consolidations or closings, international activities, the impact of terrorist acts, risks of owning and operating an arena, risks associated with an investment in a professional sports team, our substantial debt leverage and the ability to obtain and service debt, the impact of restrictions imposed by our credit facility and senior debt, exposure to hedging agreements, the level and volatility of interest rates, the continued availability of tax-exempt government financing, the impact of credit rating downgrades, effects of uninsured or underinsured losses, effects of a downgrade or failure of our insurance carriers, environmental liabilities, conflicts of interest, risks associated with the sale of tax credits, risks associated with developing and managing properties in partnership with others, the ability to maintain effective internal controls, compliance with governmental regulations, increased legislative and regulatory scrutiny of the financial services industry, changes in federal, state or local tax laws, volatility in the market price of our publicly traded securities, inflation risks, litigation risks, cybersecurity risks and cyber incidents, as well as other risks listed from time to time in our reports filed with the Securities and Exchange Commission. We have no obligation to revise or update any forward-looking statements, other than imposed by law, as a result of future events or new information. Readers are cautioned not to place undue reliance on such forward-looking statements.
1
Forest City Enterprises, Inc. and Subsidiaries
Supplemental Financial and Operating Information
Corporate Description
We principally engage in the ownership, development, management and acquisition of commercial and residential real estate and land throughout the United States. We operate through three strategic business units and have six reportable operating segments. The Commercial Group, our largest strategic business unit, owns, develops, acquires and operates regional malls, specialty/urban retail centers, office and life science buildings and mixed-use projects. Additionally, it operates Barclays Center, a sports and entertainment arena located in Brooklyn, New York, which is being reported as a separate reportable operating segment ("Arena"). The Residential Group owns, develops, acquires and operates residential rental properties, including upscale and middle-market apartments and adaptive re-use developments. Additionally, the Residential Group owns interests in entities that develop and manage military family housing. The Land Development Group acquires and sells both land and developed lots to residential, commercial and industrial customers. It also owns and develops land into master-planned communities and mixed-use projects.
Corporate Activities and The Nets, a member of the National Basketball Association (“NBA”) in which we account for our investment on the equity method of accounting, are the other reportable operating segments.
We have approximately $9.3 billion of consolidated assets in 26 states and the District of Columbia at October 31, 2013. Our core markets include Boston, Chicago, Dallas, Denver, Los Angeles, New York City, Philadelphia, the Greater San Francisco metropolitan area and the Greater Washington D.C. metropolitan area. Our core markets account for approximately 79 percent of the cost of our real estate portfolio at October 31, 2013. We have offices in Albuquerque, Boston, Dallas, Denver, Los Angeles, New York City, San Francisco, Washington, D.C. and our corporate headquarters in Cleveland, Ohio.
Supplemental Financial and Operating Information
We recommend this supplemental package be read in conjunction with our Form 10-Q for the three and nine months ended October 31, 2013. This supplemental package contains certain measures prepared in accordance with generally accepted accounting principles (“GAAP”) under the full consolidation accounting method and certain measures prepared under the pro-rata consolidation method, a non-GAAP measure. We believe the non-GAAP financial measures presented under the pro-rata consolidation method, comparable net operating income (“NOI”), Funds From Operations ("FFO") and Operating FFO are necessary to understand our business and operating results, along with net earnings and other GAAP measures. Our investors can use these non-GAAP measures as supplementary information to evaluate our business. Our non-GAAP measures are not intended to be performance measures that should be regarded as alternatives to, or more meaningful than, our GAAP measures.
Change in Fiscal Year-End
We plan to change our fiscal year end from January 31 to December 31, effective with the period ending December 31, 2013. This will result in an eleven month period ended December 31, 2013 which will be presented on our Form 10-KT expected to be filed in February 2014.
In addition, we plan to file our Supplemental Package for the eleven month period ended December 31, 2013 (‘the 2013 Supplemental Package”) in February 2014. The 2013 Supplemental Package will include disclosures as of and for the eleven month period ended December 31, 2013. In addition, we expect to provide certain disclosures, including the Net Asset Value Components, Comparable NOI, NOI, FFO and Operating FFO in the 2013 Supplemental Package using information for the three months ended December 31, 2013 (“Adjusted Q4 2013” data), which will be consistent with our new calendar year-end. As such, the Adjusted Q4 2013 data will include the results for the one-month period ended October 31, 2013, which is included in the financial results for the three and nine months ended October 31, 2013 included in this Supplemental Package. We feel the Adjusted Q4 2013 data will provide our financial statement users valuable information and is not meant to be indicative of results for the three months ended January 31, 2014 or any subsequent period.
Consolidation Methods
We present certain financial amounts under the pro-rata consolidation method because we believe this information is useful to investors as this method reflects the manner in which we operate our business. In line with industry practice, we have made a large number of investments in which our economic ownership is less than 100% as a means of procuring opportunities and sharing risk. Under the pro-rata consolidation method, we generally present our investments proportionate to our economic share of ownership. Under GAAP, the full consolidation method is used to report partnership assets and liabilities consolidated at 100% if deemed to be under our control or if we are deemed to be the primary beneficiary of the variable interest entity (“VIE”), even if our ownership is not 100%. We provide reconciliations from the full consolidation method to the pro-rata consolidation method throughout our supplemental package. Please refer to our property listing for the detail of our consolidated and unconsolidated properties in our supplemental package for the year ended January 31, 2013.
2
Forest City Enterprises, Inc. and Subsidiaries
Supplemental Financial and Operating Information
FFO
The majority of our peers in the publicly traded real estate industry are Real Estate Investment Trusts ("REITs") and report operations using FFO as defined by the National Association of Real Estate Investment Trusts (“NAREIT”). Although we are not a REIT, we feel it is important to publish this measure to allow for easier comparison of our performance to our peers. The major difference between us and our REIT peers is that we are a taxable entity and any taxable income we generate could result in payment of federal or state income taxes. Our REIT peers typically do not pay federal or state income taxes, but distribute a significant portion of their taxable income to shareholders. Due to our effective tax management policies, we have not historically been a significant payer of income taxes. This has allowed us to retain our internally generated cash flows but has also resulted in large expenses for deferred taxes as required by GAAP.
FFO is defined by NAREIT as net earnings excluding the following items at our proportionate share: i) gain (loss) on disposition of rental properties, divisions and other investments (net of tax); ii) non-cash charges for real estate depreciation and amortization; iii) impairment of depreciable real estate (net of tax); iv) extraordinary items (net of tax); and v) cumulative or retrospective effect of change in accounting principle (net of tax).
Operating FFO
In addition to reporting FFO, we report Operating FFO as an additional measure of our operating performance. We believe it is appropriate to adjust FFO, as defined by NAREIT, for significant items driven by transactional activity and factors relating to the financial and real estate markets, rather than factors specific to the on-going operating performance of our properties. We use Operating FFO as an indicator of continuing operating results in planning and executing our business strategy. Operating FFO should not be considered to be an alternative to net earnings computed under GAAP as an indicator of our operating performance and may not be directly comparable to similarly-titled measures reported by other companies.
Operating FFO is defined as FFO, as defined by NAREIT, adjusted to exclude: i) activity related to our land held for divestiture (including impairment charges); ii) impairment of non-depreciable real estate; iii) write-offs of abandoned development projects; iv) income recognized on state and federal historic and other tax credits; v) gains or losses from extinguishment of debt; vi) change in fair market value of nondesignated hedges; vii) gains or losses on change in control of interests; viii) the adjustment to recognize rental revenues and rental expense using the straight-line method; ix) participation payments to ground lessors on refinancing of our properties; x) other transactional items; xi) the Nets pre-tax FFO; and xii) income taxes on FFO.
In our first year of reporting this measure we included the change in the fair market value of our nondesignated derivatives recorded as interest expense and participation payments to ground lessors on refinancing of our properties in the calculation of Operating FFO. We believe these changes in fair market value and participation payments relate to factors in the financial and real estate markets and are not specific to the ongoing operating performance of our properties. Therefore, during the six months ended July 31, 2013, we modified our definition of Operating FFO to exclude the change in the fair market value of certain nondesignated derivatives and participation payments to ground lessors on refinancing activity. Prior period comparisons were adjusted for comparability purposes.
NOI
NOI, a non-GAAP measure, is defined as revenues (excluding straight-line rent adjustments) less operating expenses (including depreciation and amortization for non-real estate groups) plus interest income, equity in earnings (loss) of unconsolidated entities (excluding gain (loss) on disposition, gain (loss) on land held for divestiture activity and impairment of unconsolidated entities), interest expense, gain (loss) on extinguishment of debt and depreciation and amortization of unconsolidated entities. We believe NOI provides us, as well as our investors, with additional information about our core business operations and, along with earnings, is necessary to understand our business and operating results. NOI may not be directly comparable to similarly-titled measures reported by other companies.
Supplemental Operating Information
The operating information contained in this document includes: occupancy data, retail sales data, leasing summaries, comparable NOI, NOI by product type and core market, reconciliation of NOI to net earnings, results of operations discussion, reconciliation of Operating FFO to FFO, Operating FFO bridges, reconciliation of net earnings (loss) to FFO, retail and office lease expirations, our development pipeline and a summary of our military housing projects. We believe this information gives interested parties a better understanding and more information about our operating performance. The term “comparable,” which is used throughout this document, is generally defined as including stabilized properties that were open and operated in both the three and nine months ended October 31, 2013 and 2012.
We believe occupancy data, retail and office lease expirations, contractual rent, mall sales per square foot, leasing spreads on retail and office properties, and other rental rate information on multi-family properties represent meaningful operating statistics about us.
3
Forest City Enterprises, Inc. and Subsidiaries
Supplemental Financial and Operating Information
Comparable NOI is useful because it measures the performance of the same stabilized properties on a period-to-period basis and is used to assess operating performance and resource allocation of the operating properties within our strategic business units. While property dispositions, acquisitions or other factors can impact net earnings in the short term, we believe comparable NOI gives a more consistent view of the overall performance of our operating portfolio from quarter-to-quarter and year-to-year. A reconciliation of NOI to net earnings, the most comparable financial measure calculated in accordance with GAAP, a reconciliation of NOI to net earnings (loss) for each strategic business unit and a reconciliation from NOI to comparable NOI are included in this supplemental package.
Corporate Headquarters
Forest City Enterprises, Inc.
Terminal Tower
50 Public Square, Suite 1100
Cleveland, Ohio 44113
Annual Report on Form 10-K
A copy of the Annual Report on Form 10-K for the year ended January 31, 2013, as amended on Form 10-K/A on April 30, 2013, filed with the Securities and Exchange Commission, can be found on our website under SEC Filings or may be obtained without charge upon written request to:
Jeffrey B. Linton
Senior Vice President, Corporate Communication
jefflinton@forestcity.net
Website
www.forestcity.net
The information contained on this website is not incorporated herein by reference and does not constitute a part of this supplemental package.
Investor Relations
Robert G. O’Brien
Executive Vice President and Chief Financial Officer
Transfer Agent and Registrar
Wells Fargo
Shareowner Services
P.O. Box 64854
St. Paul, MN 55164-9440
(800) 468-9716
www.shareowneronline.com
NYSE Listings
FCEA - Class A Common Stock ($.33 1/3 par value)
FCEB - Class B Common Stock ($.33 1/3 par value)
Dividend Reinvestment and Stock Purchase Plan
We offer our shareholders the opportunity to purchase additional shares of common stock through the Forest City Enterprises, Inc. Dividend Reinvestment and Stock Purchase Plan (the “Plan”) at 97% of current market value. You may obtain a copy of the Plan prospectus and an enrollment card by contacting Wells Fargo Shareowner Services at (800) 468-9716 or by visiting www.shareowneronline.com.
4
Forest City Enterprises, Inc. and Subsidiaries
Selected Financial Information
Consolidated Balance Sheet Information – October 31, 2013 (Unaudited)
Full Consolidation (GAAP) | Less Noncontrolling Interest | Plus Unconsolidated Investments at Pro-Rata | Pro-Rata Consolidation (Non-GAAP) | |||||||||
| (in thousands) | ||||||||||||
| Assets | ||||||||||||
| Real Estate | ||||||||||||
| Completed rental properties | ||||||||||||
| Residential | $ | 1,780,047 | $ | 21,993 | $ | 1,046,923 | $ | 2,804,977 | ||||
| Commercial | ||||||||||||
| Retail centers | 1,984,308 | — | 1,714,109 | 3,698,417 | ||||||||
| Office buildings | 2,717,022 | 107,179 | 271,985 | 2,881,828 | ||||||||
| Arena | 939,878 | 581,577 | — | 358,301 | ||||||||
| Corporate and other equipment | 11,474 | — | — | 11,474 | ||||||||
| Total completed rental properties | 7,432,729 | 710,749 | 3,033,017 | 9,754,997 | ||||||||
| Projects under construction | ||||||||||||
| Residential | 241,827 | 85,791 | 72,398 | 228,434 | ||||||||
| Commercial | ||||||||||||
| Retail centers | — | — | — | — | ||||||||
| Office buildings | — | — | — | — | ||||||||
| Total projects under construction | 241,827 | 85,791 | 72,398 | 228,434 | ||||||||
| Projects under development | ||||||||||||
| Residential | 859,957 | 188,002 | 6,034 | 677,989 | ||||||||
| Commercial | ||||||||||||
| Retail centers | 49,698 | — | 20,206 | 69,904 | ||||||||
| Office buildings | 121,819 | 17,214 | 12,669 | 117,274 | ||||||||
| Total projects under development | 1,031,474 | 205,216 | 38,909 | 865,167 | ||||||||
| Total projects under construction and development | 1,273,301 | 291,007 | 111,307 | 1,093,601 | ||||||||
| Land held for development and sale | 64,480 | 6,251 | — | 58,229 | ||||||||
| Total Real Estate | 8,770,510 | 1,008,007 | 3,144,324 | 10,906,827 | ||||||||
| Less accumulated depreciation | (1,461,893 | ) | (58,415 | ) | (691,782 | ) | (2,095,260 | ) | ||||
| Real Estate, net | 7,308,617 | 949,592 | 2,452,542 | 8,811,567 | ||||||||
| Cash and equivalents | 217,181 | 32,824 | 64,848 | 249,205 | ||||||||
| Restricted cash and escrowed funds | 392,131 | 80,974 | 85,158 | 396,315 | ||||||||
| Notes and accounts receivable, net | 463,558 | 41,222 | 50,164 | 472,500 | ||||||||
| Investments in and advances to unconsolidated entities | 450,514 | (258,991 | ) | (417,709 | ) | 291,796 | ||||||
| Lease and mortgage procurement costs, net | 201,309 | 19,626 | 91,030 | 272,713 | ||||||||
| Prepaid expenses and other deferred costs, net | 212,603 | 17,520 | 11,593 | 206,676 | ||||||||
| Intangible assets, net | 82,002 | — | 16,236 | 98,238 | ||||||||
| Land held for divestiture | 1,990 | — | 9,761 | 11,751 | ||||||||
| Total Assets | $ | 9,329,905 | $ | 882,767 | $ | 2,363,623 | $ | 10,810,761 | ||||
5
Forest City Enterprises, Inc. and Subsidiaries
Selected Financial Information
Consolidated Balance Sheet Information – October 31, 2013 (Unaudited)
Full Consolidation (GAAP) | Less Noncontrolling Interest | Plus Unconsolidated Investments at Pro-Rata | Pro-Rata Consolidation (Non-GAAP) | |||||||||
| (in thousands) | ||||||||||||
| Liabilities and Equity | ||||||||||||
| Liabilities | ||||||||||||
| Mortgage debt and notes payable, nonrecourse | ||||||||||||
| Completed rental properties | ||||||||||||
| Residential | $ | 1,190,034 | $ | 18,361 | $ | 812,173 | $ | 1,983,846 | ||||
| Commercial | ||||||||||||
| Retail centers | 872,866 | — | 1,362,372 | 2,235,238 | ||||||||
| Office buildings | 1,715,313 | 74,175 | 229,427 | 1,870,565 | ||||||||
| Arena | 446,086 | 302,650 | — | 143,436 | ||||||||
| Total completed rental properties | 4,224,299 | 395,186 | 2,403,972 | 6,233,085 | ||||||||
| Projects under construction | ||||||||||||
| Residential | 124,724 | 33,850 | 24,721 | 115,595 | ||||||||
| Commercial | ||||||||||||
| Retail centers | — | — | — | — | ||||||||
| Office buildings | — | — | — | — | ||||||||
| Total projects under construction | 124,724 | 33,850 | 24,721 | 115,595 | ||||||||
| Projects under development | ||||||||||||
| Residential | 261,218 | 61,167 | — | 200,051 | ||||||||
| Commercial | ||||||||||||
| Retail centers | — | — | 5,000 | 5,000 | ||||||||
| Office buildings | — | — | — | — | ||||||||
| Total projects under development | 261,218 | 61,167 | 5,000 | 205,051 | ||||||||
| Total projects under construction and development | 385,942 | 95,017 | 29,721 | 320,646 | ||||||||
| Land held for development and sale | 29,022 | 2,903 | — | 26,119 | ||||||||
| Total mortgage debt and notes payable, nonrecourse | 4,639,263 | 493,106 | 2,433,693 | 6,579,850 | ||||||||
| Bank revolving credit facility | 74,900 | — | — | 74,900 | ||||||||
| Senior and subordinated debt | 701,112 | — | — | 701,112 | ||||||||
| Construction payables | 139,326 | 42,545 | 17,095 | 113,876 | ||||||||
| Operating accounts payable and accrued expenses | 567,951 | 74,105 | 175,494 | 669,340 | ||||||||
| Accrued derivative liability | 131,626 | 30 | 9,637 | 141,233 | ||||||||
| Total Accounts payable, accrued expenses and other liabilities | 838,903 | 116,680 | 202,226 | 924,449 | ||||||||
| Cash distributions and losses in excess of investments in unconsolidated entities | 276,613 | (28,821 | ) | (281,506 | ) | 23,928 | ||||||
| Deferred income taxes | 560,801 | — | — | 560,801 | ||||||||
| Mortgage debt and notes payable, nonrecourse on land held for divestiture | — | — | 9,210 | 9,210 | ||||||||
| Total Liabilities | 7,091,592 | 580,965 | 2,363,623 | 8,874,250 | ||||||||
| Redeemable Noncontrolling Interest | 174,302 | 174,302 | — | — | ||||||||
| Equity | ||||||||||||
| Shareholders’ Equity | ||||||||||||
| Shareholders’ equity before accumulated other comprehensive loss | 1,834,011 | — | — | 1,834,011 | ||||||||
| Accumulated other comprehensive loss | (83,521 | ) | — | — | (83,521 | ) | ||||||
| Total Shareholders’ Equity | 1,750,490 | — | — | 1,750,490 | ||||||||
| Noncontrolling interest | 313,521 | 127,500 | — | 186,021 | ||||||||
| Total Equity | 2,064,011 | 127,500 | — | 1,936,511 | ||||||||
| Total Liabilities and Equity | $ | 9,329,905 | $ | 882,767 | $ | 2,363,623 | $ | 10,810,761 | ||||
6
Forest City Enterprises, Inc. and Subsidiaries
Selected Financial Information
Consolidated Balance Sheet Information – January 31, 2013 (Unaudited)
Full Consolidation (GAAP) | Less Noncontrolling Interest | Plus Unconsolidated Investments at Pro-Rata | Pro-Rata Consolidation (Non-GAAP) | |||||||||
| (in thousands) | ||||||||||||
| Assets | ||||||||||||
| Real Estate | ||||||||||||
| Completed rental properties | ||||||||||||
| Residential | $ | 1,590,646 | $ | 22,913 | $ | 1,129,662 | $ | 2,697,395 | ||||
| Commercial | ||||||||||||
| Retail centers | 3,189,250 | 44,143 | 1,149,624 | 4,294,731 | ||||||||
| Office buildings | 2,950,188 | 105,482 | 345,407 | 3,190,113 | ||||||||
| Arena | 890,213 | 556,871 | — | 333,342 | ||||||||
| Corporate and other equipment | 11,245 | — | — | 11,245 | ||||||||
| Total completed rental properties | 8,631,542 | 729,409 | 2,624,693 | 10,526,826 | ||||||||
| Projects under construction | ||||||||||||
| Residential | 159,558 | 1,819 | 20,242 | 177,981 | ||||||||
| Commercial | ||||||||||||
| Retail centers | 7,360 | — | — | 7,360 | ||||||||
| Office buildings | — | — | — | — | ||||||||
| Total projects under construction | 166,918 | 1,819 | 20,242 | 185,341 | ||||||||
| Projects under development | ||||||||||||
| Residential | 834,153 | 193,172 | 6,033 | 647,014 | ||||||||
| Commercial | ||||||||||||
| Retail centers | 66,865 | 200 | 3,085 | 69,750 | ||||||||
| Office buildings | 258,767 | 26,179 | 3,804 | 236,392 | ||||||||
| Total projects under development | 1,159,785 | 219,551 | 12,922 | 953,156 | ||||||||
| Total projects under construction and development | 1,326,703 | 221,370 | 33,164 | 1,138,497 | ||||||||
| Land held for development and sale | 65,059 | 6,258 | — | 58,801 | ||||||||
| Total Real Estate | 10,023,304 | 957,037 | 2,657,857 | 11,724,124 | ||||||||
| Less accumulated depreciation | (1,654,632 | ) | (46,207 | ) | (593,490 | ) | (2,201,915 | ) | ||||
| Real Estate, net | 8,368,672 | 910,830 | 2,064,367 | 9,522,209 | ||||||||
| Cash and equivalents | 333,220 | 24,843 | 56,484 | 364,861 | ||||||||
| Restricted cash and escrowed funds | 410,414 | 46,549 | 82,200 | 446,065 | ||||||||
| Notes and accounts receivable, net | 426,200 | 27,686 | 30,010 | 428,524 | ||||||||
| Investments in and advances to unconsolidated entities | 456,628 | (173,869 | ) | (388,942 | ) | 241,555 | ||||||
| Lease and mortgage procurement costs, net | 288,306 | 21,734 | 47,688 | 314,260 | ||||||||
| Prepaid expenses and other deferred costs, net | 240,594 | 18,822 | 9,951 | 231,723 | ||||||||
| Intangible assets, net | 85,692 | 3 | 17,177 | 102,866 | ||||||||
| Land held for divestiture | 2,706 | — | 7,773 | 10,479 | ||||||||
| Total Assets | $ | 10,612,432 | $ | 876,598 | $ | 1,926,708 | $ | 11,662,542 | ||||
7
Forest City Enterprises, Inc. and Subsidiaries
Selected Financial Information
Consolidated Balance Sheet Information – January 31, 2013 (Unaudited)
Full Consolidation (GAAP) | Less Noncontrolling Interest | Plus Unconsolidated Investments at Pro-Rata | Pro-Rata Consolidation (Non-GAAP) | |||||||||
| (in thousands) | ||||||||||||
| Liabilities and Equity | ||||||||||||
| Liabilities | ||||||||||||
| Mortgage debt and notes payable, nonrecourse | ||||||||||||
| Completed rental properties | ||||||||||||
| Residential | $ | 1,001,551 | $ | 17,856 | $ | 876,478 | $ | 1,860,173 | ||||
| Commercial | ||||||||||||
| Retail centers | 1,927,409 | 39,480 | 877,509 | 2,765,438 | ||||||||
| Office buildings | 1,955,868 | 78,931 | 280,847 | 2,157,784 | ||||||||
| Arena | 429,041 | 290,393 | — | 138,648 | ||||||||
| Total completed rental properties | 5,313,869 | 426,660 | 2,034,834 | 6,922,043 | ||||||||
| Projects under construction | ||||||||||||
| Residential | 161,527 | — | — | 161,527 | ||||||||
| Commercial | ||||||||||||
| Retail centers | 2,449 | — | — | 2,449 | ||||||||
| Office buildings | — | — | — | — | ||||||||
| Total projects under construction | 163,976 | — | — | 163,976 | ||||||||
| Projects under development | ||||||||||||
| Residential | 251,814 | 59,537 | — | 192,277 | ||||||||
| Commercial | ||||||||||||
| Retail centers | — | — | — | — | ||||||||
| Office buildings | — | — | — | — | ||||||||
| Total projects under development | 251,814 | 59,537 | — | 192,277 | ||||||||
| Total projects under construction and development | 415,790 | 59,537 | — | 356,253 | ||||||||
| Land held for development and sale | 9,301 | 931 | — | 8,370 | ||||||||
| Total mortgage debt and notes payable, nonrecourse | 5,738,960 | 487,128 | 2,034,834 | 7,286,666 | ||||||||
| Bank revolving credit facility | — | — | — | — | ||||||||
| Senior and subordinated debt | 1,032,969 | — | — | 1,032,969 | ||||||||
| Construction payables | 135,359 | 31,250 | 15,277 | 119,386 | ||||||||
| Operating accounts payable and accrued expenses | 688,415 | 72,922 | 153,670 | 769,163 | ||||||||
| Accrued derivative liability | 155,724 | 150 | 13,352 | 168,926 | ||||||||
| Deferred profit on NY retail joint venture transaction | 114,465 | — | — | 114,465 | ||||||||
| Total Accounts payable, accrued expenses and other liabilities | 1,093,963 | 104,322 | 182,299 | 1,171,940 | ||||||||
| Cash distributions and losses in excess of investments in unconsolidated entities | 292,727 | (29,646 | ) | (299,744 | ) | 22,629 | ||||||
| Deferred income taxes | 474,406 | — | — | 474,406 | ||||||||
| Mortgage debt and notes payable, nonrecourse on land held for divestiture | 1,700 | — | 9,319 | 11,019 | ||||||||
| Total Liabilities | 8,634,725 | 561,804 | 1,926,708 | 9,999,629 | ||||||||
| Redeemable Noncontrolling Interest | 239,136 | 239,136 | — | — | ||||||||
| Equity | ||||||||||||
| Shareholders’ Equity | ||||||||||||
| Shareholders’ equity before accumulated other comprehensive loss | 1,580,095 | — | — | 1,580,095 | ||||||||
| Accumulated other comprehensive loss | (103,203 | ) | — | — | (103,203 | ) | ||||||
| Total Shareholders’ Equity | 1,476,892 | — | — | 1,476,892 | ||||||||
| Noncontrolling interest | 261,679 | 75,658 | — | 186,021 | ||||||||
| Total Equity | 1,738,571 | 75,658 | — | 1,662,913 | ||||||||
| Total Liabilities and Equity | $ | 10,612,432 | $ | 876,598 | $ | 1,926,708 | $ | 11,662,542 | ||||
8
Forest City Enterprises, Inc. and Subsidiaries
Selected Financial Information
Consolidated Earnings Information – Three Months Ended October 31, 2013 (Unaudited)
Full Consolidation (GAAP) | Less Noncontrolling Interest | Plus Unconsolidated Investments at Pro-Rata | Plus Discontinued Operations | Pro-Rata Consolidation (Non-GAAP) | |||||||||||
| (in thousands) | |||||||||||||||
| Revenues from real estate operations | $ | 266,227 | $ | 22,425 | $ | 103,591 | $ | 137 | $ | 347,530 | |||||
| Expenses | |||||||||||||||
| Operating expenses | 210,255 | 13,004 | 47,142 | 434 | 244,827 | ||||||||||
| Depreciation and amortization | 85,100 | 6,010 | 18,620 | — | 97,710 | ||||||||||
| Impairment of real estate | 200,155 | 15,462 | — | — | 184,693 | ||||||||||
| Net gain on land held for divestiture activity | — | — | (186 | ) | — | (186 | ) | ||||||||
| 495,510 | 34,476 | 65,576 | 434 | 527,044 | |||||||||||
| Interest expense | (72,126 | ) | (6,950 | ) | (26,158 | ) | (16 | ) | (91,350 | ) | |||||
| Amortization of mortgage procurement costs | (2,246 | ) | (178 | ) | (770 | ) | — | (2,838 | ) | ||||||
| Loss on extinguishment of debt | (13,096 | ) | — | (50 | ) | — | (13,146 | ) | |||||||
| Interest and other income | 13,881 | 534 | 124 | — | 13,471 | ||||||||||
| Net gain on disposition of full or partial interests in rental properties | 491,160 | — | 34,281 | 1,114 | 526,555 | ||||||||||
| Earnings (loss) before income taxes | 188,290 | (18,645 | ) | 45,442 | 801 | 253,178 | |||||||||
| Income tax expense (benefit) | |||||||||||||||
| Current | 29,151 | — | — | (12,446 | ) | 16,705 | |||||||||
| Deferred | 71,493 | — | — | 12,707 | 84,200 | ||||||||||
| 100,644 | — | — | 261 | 100,905 | |||||||||||
| Earnings (loss) from unconsolidated entities, gross of tax | |||||||||||||||
| Equity in earnings | 46,474 | 162 | (45,256 | ) | — | 1,056 | |||||||||
| Net gain on land held for divestiture activity | 186 | — | (186 | ) | — | — | |||||||||
| 46,660 | 162 | (45,442 | ) | — | 1,056 | ||||||||||
| Earnings (loss) from continuing operations | 134,306 | (18,483 | ) | — | 540 | 153,329 | |||||||||
| Discontinued operations, net of tax: | |||||||||||||||
| Operating earnings (loss) from rental properties | (188 | ) | 3 | — | 191 | — | |||||||||
| Gain on disposition of rental properties | 856 | 125 | — | (731 | ) | — | |||||||||
| 668 | 128 | — | (540 | ) | — | ||||||||||
| Net earnings (loss) | 134,974 | (18,355 | ) | — | — | 153,329 | |||||||||
| Noncontrolling interests | |||||||||||||||
| Loss from continuing operations attributable to noncontrolling interests, gross of tax | 18,483 | 18,483 | — | — | — | ||||||||||
| Earnings from discontinued operations attributable to noncontrolling interests | (128 | ) | (128 | ) | — | — | — | ||||||||
| 18,355 | 18,355 | — | — | — | |||||||||||
| Net earnings attributable to Forest City Enterprises, Inc. | $ | 153,329 | $ | — | $ | — | $ | — | $ | 153,329 | |||||
9
Forest City Enterprises, Inc. and Subsidiaries
Selected Financial Information
Consolidated Earnings Information – Nine Months Ended October 31, 2013 (Unaudited)
Full Consolidation (GAAP) | Less Noncontrolling Interest | Plus Unconsolidated Investments at Pro-Rata | Plus Discontinued Operations | Pro-Rata Consolidation (Non-GAAP) | |||||||||||
| (in thousands) | |||||||||||||||
| Revenues from real estate operations | $ | 853,936 | $ | 67,088 | $ | 303,015 | $ | 20,664 | $ | 1,110,527 | |||||
| Expenses | |||||||||||||||
| Operating expenses | 603,715 | 43,728 | 139,968 | 12,562 | 712,517 | ||||||||||
| Depreciation and amortization | 245,305 | 15,367 | 54,550 | 2,000 | 286,488 | ||||||||||
| Impairment of real estate | 208,210 | 15,462 | — | — | 192,748 | ||||||||||
| Net (gain) loss on land held for divestiture activity | 7,555 | 720 | (867 | ) | — | 5,968 | |||||||||
| 1,064,785 | 75,277 | 193,651 | 14,562 | 1,197,721 | |||||||||||
| Interest expense | (250,100 | ) | (21,361 | ) | (75,431 | ) | (2,777 | ) | (306,947 | ) | |||||
| Amortization of mortgage procurement costs | (7,572 | ) | (530 | ) | (2,334 | ) | (50 | ) | (9,426 | ) | |||||
| Gain (loss) on extinguishment of debt | 6,335 | — | (57 | ) | (36 | ) | 6,242 | ||||||||
| Interest and other income | 37,063 | 1,474 | 365 | 224 | 36,178 | ||||||||||
| Net gain on disposition of full or partial interests in rental properties | 496,092 | — | 32,771 | 38,382 | 567,245 | ||||||||||
| Earnings (loss) before income taxes | 70,969 | (28,606 | ) | 64,678 | 41,845 | 206,098 | |||||||||
| Income tax expense | |||||||||||||||
| Current | 7,681 | — | — | 6,356 | 14,037 | ||||||||||
| Deferred | 60,841 | — | — | 12,950 | 73,791 | ||||||||||
| 68,522 | — | — | 19,306 | 87,828 | |||||||||||
| Net gain on change in control of interests | 2,762 | — | — | — | 2,762 | ||||||||||
| Earnings (loss) from unconsolidated entities, gross of tax | |||||||||||||||
| Equity in earnings (loss) | 59,815 | (644 | ) | (63,811 | ) | — | (3,352 | ) | |||||||
| Net gain on land held for divestiture activity | 867 | — | (867 | ) | — | — | |||||||||
| 60,682 | (644 | ) | (64,678 | ) | — | (3,352 | ) | ||||||||
| Earnings (loss) from continuing operations | 65,891 | (29,250 | ) | — | 22,539 | 117,680 | |||||||||
| Discontinued operations, net of tax: | |||||||||||||||
| Operating earnings from rental properties | 2,137 | 16 | — | (2,121 | ) | — | |||||||||
| Gain on disposition of rental properties | 26,378 | 5,960 | — | (20,418 | ) | — | |||||||||
| 28,515 | 5,976 | — | (22,539 | ) | — | ||||||||||
| Net earnings (loss) | 94,406 | (23,274 | ) | — | — | 117,680 | |||||||||
| Noncontrolling interests | |||||||||||||||
| Loss from continuing operations attributable to noncontrolling interests, gross of tax | 29,250 | 29,250 | — | — | — | ||||||||||
| Earnings from discontinued operations attributable to noncontrolling interests | (5,976 | ) | (5,976 | ) | — | — | — | ||||||||
| 23,274 | 23,274 | — | — | — | |||||||||||
| Net earnings attributable to Forest City Enterprises, Inc. | $ | 117,680 | $ | — | $ | — | $ | — | $ | 117,680 | |||||
| Preferred dividends | (185 | ) | — | — | — | (185 | ) | ||||||||
| Net earnings attributable to Forest City Enterprises, Inc. common shareholders | $ | 117,495 | $ | — | $ | — | $ | — | $ | 117,495 | |||||
10
Forest City Enterprises, Inc. and Subsidiaries
Selected Financial Information
Consolidated Earnings Information – Three Months Ended October 31, 2012 (Unaudited)
Full Consolidation (GAAP) | Less Noncontrolling Interest | Plus Unconsolidated Investments at Pro-Rata | Plus Discontinued Operations | Pro-Rata Consolidation (Non-GAAP) | |||||||||||
| (in thousands) | |||||||||||||||
| Revenues from real estate operations | $ | 272,849 | $ | 20,267 | $ | 99,159 | $ | 20,163 | $ | 371,904 | |||||
| Expenses | |||||||||||||||
| Operating expenses | 175,275 | 14,258 | 43,527 | 10,724 | 215,268 | ||||||||||
| Depreciation and amortization | 55,479 | 2,679 | 19,145 | 2,618 | 74,563 | ||||||||||
| Impairment of real estate | 30,200 | — | — | 164 | 30,364 | ||||||||||
| Net (gain) loss on land held for divestiture activity | (807 | ) | (247 | ) | 283 | — | (277 | ) | |||||||
| 260,147 | 16,690 | 62,955 | 13,506 | 319,918 | |||||||||||
| Interest expense | (66,744 | ) | (4,004 | ) | (25,932 | ) | (2,712 | ) | (91,384 | ) | |||||
| Amortization of mortgage procurement costs | (2,611 | ) | (74 | ) | (773 | ) | (54 | ) | (3,364 | ) | |||||
| Gain (loss) on extinguishment of debt | 8,007 | (415 | ) | — | (192 | ) | 8,230 | ||||||||
| Interest and other income | 10,426 | 493 | 1,688 | (7 | ) | 11,614 | |||||||||
| Gain on disposition of rental properties | — | — | — | 19,299 | 19,299 | ||||||||||
| Earnings (loss) before income taxes | (38,220 | ) | (423 | ) | 11,187 | 22,991 | (3,619 | ) | |||||||
| Income tax expense (benefit) | |||||||||||||||
| Current | (23,804 | ) | — | — | 17,665 | (6,139 | ) | ||||||||
| Deferred | 3,779 | — | — | (7,523 | ) | (3,744 | ) | ||||||||
| (20,025 | ) | — | — | 10,142 | (9,883 | ) | |||||||||
| Earnings (loss) from unconsolidated entities, gross of tax | |||||||||||||||
| Equity in earnings (loss) | 4,189 | 61 | (11,470 | ) | — | (7,342 | ) | ||||||||
| Net loss on land held for divestiture activity | (283 | ) | — | 283 | — | — | |||||||||
| 3,906 | 61 | (11,187 | ) | — | (7,342 | ) | |||||||||
| Earnings (loss) from continuing operations | (14,289 | ) | (362 | ) | — | 12,849 | (1,078 | ) | |||||||
| Discontinued operations, net of tax: | |||||||||||||||
| Operating earnings (loss) from rental properties | 2,153 | (207 | ) | — | (2,360 | ) | — | ||||||||
| Impairment of real estate | (100 | ) | — | — | 100 | — | |||||||||
| Gain on disposition of rental properties | 10,589 | — | — | (10,589 | ) | — | |||||||||
| 12,642 | (207 | ) | — | (12,849 | ) | — | |||||||||
| Net loss | (1,647 | ) | (569 | ) | — | — | (1,078 | ) | |||||||
| Noncontrolling interests | |||||||||||||||
| Loss from continuing operations attributable to noncontrolling interests, gross of tax | 362 | 362 | — | — | — | ||||||||||
| Loss from discontinued operations attributable to noncontrolling interests | 207 | 207 | — | — | — | ||||||||||
| 569 | 569 | — | — | — | |||||||||||
| Net loss attributable to Forest City Enterprises, Inc. | $ | (1,078 | ) | $ | — | $ | — | $ | — | $ | (1,078 | ) | |||
| Preferred dividends and inducements of preferred stock conversion | (17,731 | ) | — | — | — | (17,731 | ) | ||||||||
| Net loss attributable to Forest City Enterprises, Inc. common shareholders | $ | (18,809 | ) | $ | — | $ | — | $ | — | $ | (18,809 | ) | |||
11
Forest City Enterprises, Inc. and Subsidiaries
Selected Financial Information
Consolidated Earnings Information – Nine Months Ended October 31, 2012 (Unaudited)
Full Consolidation (GAAP) | Less Noncontrolling Interest | Plus Unconsolidated Investments at Pro-Rata | Plus Discontinued Operations | Pro-Rata Consolidation (Non-GAAP) | |||||||||||
| (in thousands) | |||||||||||||||
| Revenues from real estate operations | $ | 791,669 | $ | 43,846 | $ | 294,653 | $ | 60,335 | $ | 1,102,811 | |||||
| Expenses | |||||||||||||||
| Operating expenses | 495,692 | 32,137 | 131,015 | 31,369 | 625,939 | ||||||||||
| Depreciation and amortization | 155,714 | 4,640 | 57,992 | 9,603 | 218,669 | ||||||||||
| Impairment of real estate | 30,660 | — | 390 | 4,254 | 35,304 | ||||||||||
| Net (gain) loss on land held for divestiture activity | 5,651 | (3,754 | ) | 42,170 | — | 51,575 | |||||||||
| 687,717 | 33,023 | 231,567 | 45,226 | 931,487 | |||||||||||
| Interest expense | (180,988 | ) | (9,400 | ) | (76,230 | ) | (10,057 | ) | (257,875 | ) | |||||
| Amortization of mortgage procurement costs | (8,674 | ) | (303 | ) | (2,423 | ) | (546 | ) | (11,340 | ) | |||||
| Gain (loss) on extinguishment of debt | 7,288 | (603 | ) | (1,313 | ) | (192 | ) | 6,386 | |||||||
| Interest and other income | 34,504 | 1,448 | 2,186 | 272 | 35,514 | ||||||||||
| Gain on disposition of rental properties | — | — | 16,107 | 27,213 | 43,320 | ||||||||||
| Earnings (loss) before income taxes | (43,918 | ) | 1,965 | 1,413 | 31,799 | (12,671 | ) | ||||||||
| Income tax expense (benefit) | |||||||||||||||
| Current | (50,077 | ) | — | — | 24,758 | (25,319 | ) | ||||||||
| Deferred | 30,189 | — | — | (11,040 | ) | 19,149 | |||||||||
| (19,888 | ) | — | — | 13,718 | (6,170 | ) | |||||||||
| Net gain on change in control of interests | 6,766 | 2,702 | — | — | 4,064 | ||||||||||
| Earnings (loss) from unconsolidated entities, gross of tax | |||||||||||||||
| Equity in earnings (loss), including impairment | 24,237 | 260 | (43,583 | ) | — | (19,606 | ) | ||||||||
| Net loss on land held for divestiture activity | (42,170 | ) | — | 42,170 | — | — | |||||||||
| (17,933 | ) | 260 | (1,413 | ) | — | (19,606 | ) | ||||||||
| Earnings (loss) from continuing operations | (35,197 | ) | 4,927 | — | 18,081 | (22,043 | ) | ||||||||
| Discontinued operations, net of tax: | |||||||||||||||
| Operating earnings from rental properties | 5,805 | 393 | — | (5,412 | ) | — | |||||||||
| Impairment of real estate | (2,604 | ) | — | — | 2,604 | — | |||||||||
| Gain on disposition of rental properties | 16,238 | 965 | — | (15,273 | ) | — | |||||||||
| 19,439 | 1,358 | — | (18,081 | ) | — | ||||||||||
| Net earnings (loss) | (15,758 | ) | 6,285 | — | — | (22,043 | ) | ||||||||
| Noncontrolling interests | |||||||||||||||
| Earnings from continuing operations attributable to noncontrolling interests, gross of tax | (4,927 | ) | (4,927 | ) | — | — | — | ||||||||
| Earnings from discontinued operations attributable to noncontrolling interests | (1,358 | ) | (1,358 | ) | — | — | — | ||||||||
| (6,285 | ) | (6,285 | ) | — | — | — | |||||||||
| Net loss attributable to Forest City Enterprises, Inc. | $ | (22,043 | ) | $ | — | $ | — | $ | — | $ | (22,043 | ) | |||
| Preferred dividends and inducements of preferred stock conversion | (25,431 | ) | — | — | — | (25,431 | ) | ||||||||
| Net loss attributable to Forest City Enterprises, Inc. common shareholders | $ | (47,474 | ) | $ | — | $ | — | $ | — | $ | (47,474 | ) | |||
12
Forest City Enterprises, Inc. and Subsidiaries
Selected Financial Information
Net Asset Value Components – October 31, 2013
The following represents components of our business relevant to calculate Net Asset Value (“NAV”), a non-GAAP measure. There is no directly comparable GAAP financial measure to NAV. We consider NAV to be a useful supplemental measure which assists both management and investors to estimate the fair value of our Company. The calculation of the net asset value involves significant estimates and can be calculated using various methods. Each individual investor must determine the specific methodology, assumptions and estimates to use to arrive at an estimated NAV of the Company.
The components of NAV do not consider the potential changes in rental and fee income streams, or development platform. The components include non-GAAP financial measures, such as NOI and information related to our rental properties business prepared using the pro-rata consolidation method. Although these measures are not presented in accordance with GAAP, investors can use these non-GAAP measures as supplementary information to evaluate our business. The non-GAAP measures presented are not intended to be performance measures that should be regarded as alternatives to, or more meaningful than, our GAAP measures.
| Net Asset Value Components - October 31, 2013 | |||||||||||||||||||
| Completed Rental Properties (“CRP”) | |||||||||||||||||||
| Q3 2013 | Net Stabilized | Stabilized | Annualized | Nonrecourse | |||||||||||||||
| (Dollars in millions at pro-rata) | NOI (1) | Adjustments (2) | NOI | Stabilized NOI (3) | Debt (4) | ||||||||||||||
| Commercial Real Estate | A | B | =A+B | ||||||||||||||||
| Retail | |||||||||||||||||||
| Regional Malls | $ | 39.0 | $ | (0.2 | ) | $ | 38.8 | $ | 155.2 | $ | (1,624.9 | ) | |||||||
| Specialty Retail Centers | 15.2 | 1.5 | 16.7 | 66.8 | (610.3 | ) | |||||||||||||
| Subtotal Retail | $ | 54.2 | $ | 1.3 | $ | 55.5 | $ | 222.0 | $ | (2,235.2 | ) | ||||||||
| Office | |||||||||||||||||||
| Life Science | $ | 13.8 | $ | — | $ | 13.8 | $ | 55.2 | $ | (372.4 | ) | ||||||||
| New York | 30.1 | 3.7 | 33.8 | 135.2 | (1,240.5 | ) | |||||||||||||
| Central Business District | 4.7 | 0.1 | 4.8 | 19.2 | (97.2 | ) | |||||||||||||
| Suburban/Other | 4.1 | — | 4.1 | 16.4 | (160.5 | ) | |||||||||||||
| Subtotal Office | $ | 52.7 | $ | 3.8 | $ | 56.5 | $ | 226.0 | $ | (1,870.6 | ) | ||||||||
| Arena | $ | 5.7 | $ | 3.3 | $ | 9.0 | $ | 35.8 | $ | (143.4 | ) | ||||||||
| Residential Real Estate | |||||||||||||||||||
| Apartments | $ | 37.8 | $ | 3.6 | $ | 41.4 | $ | 165.6 | $ | (1,812.4 | ) | ||||||||
| Subsidized Senior Housing | $ | 3.1 | $ | 1.0 | $ | 4.1 | $ | 16.4 | $ | (117.4 | ) | ||||||||
| Military Housing | $ | 6.8 | $ | (3.0 | ) | $ | 3.8 | $ | 15.0 | $ | (54.0 | ) | |||||||
| Subtotal Rental Properties | $ | 160.3 | $ | 10.0 | $ | 170.3 | $ | 680.8 | $ | (6,233.0 | ) | ||||||||
| Other | (42.3 | ) | 33.5 | (8.8 | ) | (35.0 | ) | — | |||||||||||
| Total Rental Properties | $ | 118.0 | $ | 43.5 | $ | 161.5 | $ | 645.8 | $ | (6,233.0 | ) | ||||||||
| Development Pipeline | Book Value (4) | ||||||||||||||||||
| Projects under construction | $ | 228.4 | $ | (115.6 | ) | ||||||||||||||
Projects under development (5) | $ | 865.2 | $ | (205.1 | ) | ||||||||||||||
| Land held for development and sale | $ | 58.2 | $ | (26.1 | ) | ||||||||||||||
| Other Tangible Assets | |||||||||||||||||||
| Cash and equivalents | $ | 249.2 | |||||||||||||||||
| Restricted cash and escrowed funds | $ | 396.3 | |||||||||||||||||
Notes and accounts receivable, net (6) | $ | 472.5 | |||||||||||||||||
| Net investments and advances to unconsolidated entities | $ | 267.9 | |||||||||||||||||
| Prepaid expenses and other deferred costs, net | $ | 206.7 | |||||||||||||||||
| Land held for divestiture | $ | 11.8 | $ | (9.2 | ) | ||||||||||||||
| Recourse Debt and Other Liabilities | |||||||||||||||||||
| Bank revolving credit facility | $ | (74.9 | ) | ||||||||||||||||
| Senior and subordinated debt | $ | (701.1 | ) | ||||||||||||||||
| Less: convertible debt | $ | 700.0 | |||||||||||||||||
| Construction payables | $ | (113.9 | ) | ||||||||||||||||
Operating accounts payable and accrued expenses (7) | $ | (669.3 | ) | ||||||||||||||||
| Weighted Average Shares Outstanding - Diluted | |||||||||||||||||||
| Number of shares for the three months ended October 31, 2013 (in millions) | 235.4 | ||||||||||||||||||
13
Forest City Enterprises, Inc. and Subsidiaries
Selected Financial Information
Net Asset Value Components – October 31, 2013 (continued)
| (1) | Pro-rata Q3 2013 NOI is reconciled to NOI at full consolidation by Product Group for the three months ended October 31, 2013 in the Supplemental Operating Information section of this supplemental package. |
| (2) | The net stabilized adjustments column represents net adjustments required to arrive at an estimated annualized stabilized NOI for those properties currently in initial lease-up periods, net of the removal of partial period NOI for recently sold properties. The following properties are currently in their initial lease-up periods: |
| Property | Cost at Full Consolidation (GAAP) | Cost at FCE Pro-Rata Share (Non-GAAP) | Lease Commitment % as of November 25, 2013 | ||||
| �� | (in millions) | ||||||
| The Continental | $ | 54.8 | $ | 54.8 | 67% | ||
| 1111 Stratford | $ | 23.5 | $ | 23.5 | 13% | ||
| Aster Conservatory Green (Northfield) | $ | 50.0 | $ | 45.0 | 15% | ||
| The Yards - Boilermaker Shops | $ | 21.9 | $ | 21.9 | 84% | ||
| The Yards - Lumber Shed | $ | 15.7 | $ | 15.7 | 80% | ||
| Westchester's Ridge Hill | $ | 891.1 | $ | 891.1 | 63%/72% | ||
| a) | NOI for The Continental, 1111 Stratford and Aster Conservatory Green (Apartments) and The Yards - Boilermaker Shops and The Yards - Lumber Shed (Specialty Retail Centers) is reflected at 5% of the pro-rata cost disclosed in the table above. This assumption does not reflect Forest City’s anticipated NOI, but rather is used in order to establish a hypothetical basis for valuation of leased-up properties. |
| b) | NOI for Westchester's Ridge Hill is reflected at 4% of the pro-rata cost disclosed in the table above. This assumption does not reflect Forest City’s anticipated NOI, but rather is used in order to establish a hypothetical basis for valuation of leased-up properties. The lease commitment percentage above represents approximately 837,000 square feet of leases that have been signed, representing 63% of the total 1,336,000 square feet after construction is complete. The leased percentage excluding Parcel L is 72%. Parcel L is a self contained pad site at the southern end of the center and has been assumed to be leased in the future predominantly to a single retail tenant in its own phase. Given its location on the end of the site, the lease commitment percentage has been presented both with and without the anticipated square footage for Parcel L in the denominator of Gross Leasable Area. |
| c) | Annual NOI for the Arena is expected to stabilize at approximately $65 million at full consolidation in the 2016 calendar year. Based on the partnership agreement, we expect to receive 55% of the NOI allocation until certain member loans are repaid. Therefore, we have included a stabilization adjustment to the Q3 2013 NOI to arrive at an annual stabilized NOI of $35.8 million. |
In addition, we include stabilization adjustments from quarterly NOI as follows:
| d) | Due to the temporary decline in occupancy at One Pierrepont Plaza, we have included a stabilization adjustment to the Q3 2013 NOI to arrive at the NOI generated for the year ended January 31, 2013, which we believe to be an estimate of ongoing NOI. |
| e) | Due to the fluctuation of NOI as a result of distribution restrictions from our limited-distribution subsidized senior housing properties, we have included a stabilization adjustment to the Q3 2013 NOI to arrive at a stabilized NOI generated for the year ended January 31, 2013, which we believe to be an estimate of ongoing NOI. |
| f) | At the conclusion of the initial development period at each of our military housing communities, we estimate the ongoing property and asset management fees, net of operating expenses, to be $15.0 million. |
| g) | Other excludes write-offs of abandoned development projects of $26.5 million, tax credit income of $6.8 million and certain variable development and operating overhead. |
The net stabilized adjustments are not comparable to any GAAP measure and therefore do not have a reconciliation to the nearest comparable GAAP measure.
| (3) | Pro-rata annualized stabilized NOI is calculated by taking the Q3 2013 stabilized NOI times a multiple of four. |
| (4) | Amounts are derived from the respective pro-rata balance sheet line item as of October 31, 2013 and are reconciled to their GAAP equivalents in the Selected Financial Information section of this supplemental package. |
| (5) | In October 2013, we announced the signing of a non-binding memorandum of understanding with Shanghai-based Greenland Group Co., for a proposed joint venture to develop the Brooklyn Atlantic Yards project in Brooklyn, New York. If we are successful in reaching an agreement with the Greenland Group or another third party investor, there is a risk that we could grant joint control or otherwise lose control of the resulting joint venture. If that were to occur we may be required to deconsolidate the joint venture and its allocation of the site acquisition costs. Upon deconsolidation, our investment balance in the joint venture would be compared to estimated fair value and recorded at the lesser of fair value or book value. If this were to occur, we estimate that an impairment charge would be required ranging from $250 million to $350 million. For more detail see the Development Pipeline included elsewhere in this supplemental package. |
| (6) | Includes $160.6 million of straight-line rent receivable (net of $14.7 million of allowance for doubtful accounts). |
| (7) | Includes $35.1 million of straight-line rent payable. |
14
Forest City Enterprises, Inc. and Subsidiaries
Supplemental Operating Information
Occupancy Data - October 31, 2013 and 2012
Retail and office occupancy data is based on square feet leased at the end of the fiscal quarter. Residential occupancy data represents economic occupancy, which is calculated by dividing the year-to-date gross potential rent less vacancy by gross potential rent.
| Occupancy as of October 31, | ||
Retail (1) | 2013 | 2012 |
| Comparable | 92.4% | 92.0% |
| Total | 89.8% | 89.6% |
| Office | ||
| Comparable | 92.6% | 92.0% |
| Total | 91.0% | 89.0% |
Residential (2) | ||
| Comparable | 94.8% | 94.5% |
| Total | 93.3% | 94.4% |
(1) | Retail occupancy data excludes leases with original terms of one year or less. Inclusive of these amounts, comparable retail occupancy was 94.5% (92.1% in total) as of October 31, 2013 and 94.2% (91.7% in total) as of October 31, 2012. |
| (2) | Excludes military and limited-distribution subsidized senior housing units. |
The graph below provides comparable occupancy data as reported in previous quarters. Prior period amounts may differ from above because the properties that qualify as comparable change from period to period.
Comparable Occupancy Percentage Recap (3)
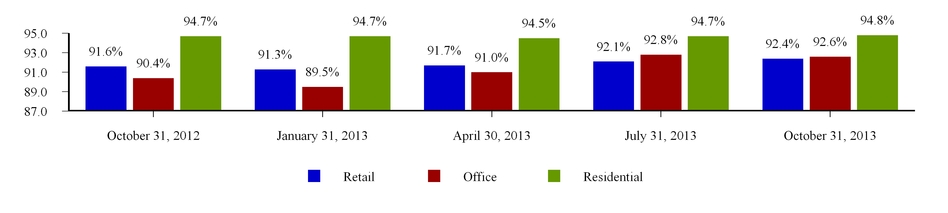
| (3) | Retail occupancy data excludes leases with original terms of one year or less. Inclusive of these amounts, comparable retail occupancy was 93.9%, 93.7%, 93.8%, 94.2% and 94.5% as of October 31, 2012, January 31, 2013, April 31, 2013, July 31, 2013, and October 31, 2013, respectively. |
15
Forest City Enterprises, Inc. and Subsidiaries
Supplemental Operating Information
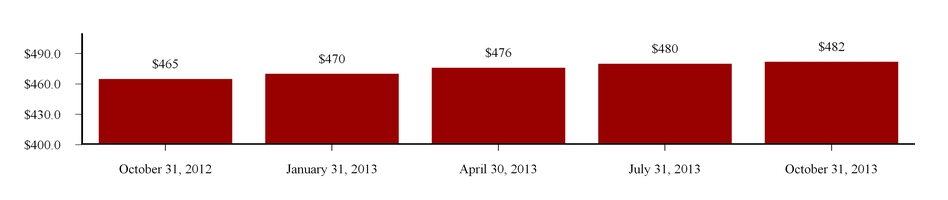
Retail Sales Data
The following graphs provide current and historical retail sales for small shop inline tenants at our regional malls. We believe this data allows investors to better understand the productivity of our small shop inline tenants.
The graph below represents regional mall sales for tenants that were open and operating for the duration of each rolling 12-month period presented. Those tenants that have begun and/or ceased operations in the rolling 12-month periods shown are not included.
FCE Regional Mall Sales per Square Foot (1)
Rolling 12-month basis for periods presented
The graph below represents percentage of tenant sales growth in our comparable regional malls for all comparable tenants. Comparable tenants are those that were open and operating in both the current period and corresponding prior period presented. The tenants included in the graph below may not be the same as those included in the graph above.
Year-to-Date Comparable FCE Regional Mall Sales Growth (1)
Percentage Growth over same period in prior year
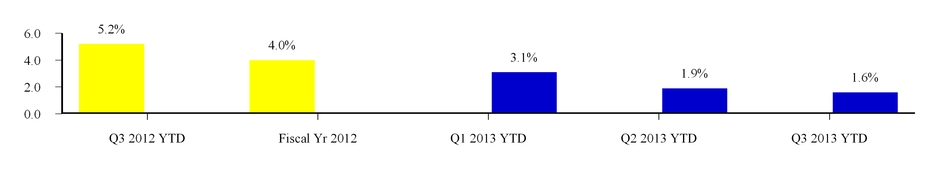
| (1) | All sales data is derived from schedules provided by our tenants and is not subject to the same internal control and verification procedures that are applied to the other data supplied in this supplemental package. In addition, the data is presented on a one-month lag to be consistent with the calendar year end of our tenants. |
16
Forest City Enterprises, Inc. and Subsidiaries
Supplemental Operating Information
Leasing Summary
Retail Centers
The following tables represent those new leases and gross leasable area (“GLA”) signed on the same space in which there was a former tenant and existing tenant renewals.
Regional Malls
| Quarter | Number of Leases Signed | GLA Signed | Contractual Rent Per Square Foot (1)(2) | Prior Rent Per Square Foot (1)(2) | Cash Basis % Change over Prior Rent | ||||||||||||
| 4th Quarter 2012 | 23 | 63,551 | $ | 55.17 | $ | 49.44 | |||||||||||
| 1st Quarter 2013 | 38 | 115,625 | $ | 54.92 | $ | 46.15 | |||||||||||
| 2nd Quarter 2013 | 26 | 70,059 | $ | 61.19 | $ | 52.67 | |||||||||||
| 3rd Quarter 2013 | 39 | 101,994 | $ | 56.90 | $ | 50.47 | |||||||||||
| Total | 126 | 351,229 | $ | 56.79 | $ | 49.30 | 15.2 | % | |||||||||
Specialty Retail Centers
| Quarter | Number of Leases Signed | GLA Signed | Contractual Rent Per Square Foot (1)(2) | Prior Rent Per Square Foot (1)(2) | Cash Basis % Change over Prior Rent | ||||||||||||
| 4th Quarter 2012 | 4 | 7,281 | $ | 43.90 | $ | 48.20 | |||||||||||
| 1st Quarter 2013 | 9 | 51,398 | $ | 42.58 | $ | 35.44 | |||||||||||
| 2nd Quarter 2013 | 3 | 46,194 | $ | 42.03 | $ | 42.12 | |||||||||||
| 3rd Quarter 2013 | 4 | 33,643 | $ | 36.19 | $ | 42.09 | |||||||||||
| Total | 20 | 138,516 | $ | 40.91 | $ | 39.96 | 2.4 | % | |||||||||
Office Buildings
The following table represents all new leases signed compared with terms of all expired leases in our office portfolio over the past 12 months. Changes in rent per square foot between all new and all expired leases are influenced by various factors, including but not limited to non-comparable markets, non-comparable buildings and varying quality of space within those buildings. Depending on the mix of new and expired leases, the percentage change in rent per square foot will vary accordingly.
Office Buildings
| Quarter | Number of Leases Signed | Number of Leases Expired | GLA Signed | GLA Expired | Contractual Rent Per Square Foot (1)(2) | Expiring Rent Per Square Foot (1)(2) | Cash Basis % Change over Prior Rent | ||||||||||||||||
| 4th Quarter 2012 | 17 | 27 | 76,889 | 124,062 | $ | 26.10 | $ | 24.62 | |||||||||||||||
| 1st Quarter 2013 | 32 | 31 | 417,154 | 530,109 | $ | 52.33 | $ | 44.37 | |||||||||||||||
| 2nd Quarter 2013 | 26 | 21 | 343,641 | 140,287 | $ | 33.90 | $ | 30.15 | |||||||||||||||
| 3rd Quarter 2013 | 30 | 17 | 118,040 | 106,986 | $ | 19.07 | $ | 28.15 | |||||||||||||||
| Total | 105 | 96 | 955,724 | 901,444 | $ | 39.61 | $ | 37.51 | 5.6 | % | |||||||||||||
Office Buildings by Product in Core and Non-Core Markets
Number of Leases Signed | Number of Leases Expired | GLA Signed | GLA Expired | Contractual Rent Per Square Foot (1)(2) | Expiring Rent Per Square Foot (1)(2) | Cash Basis % Change over Prior Rent | |||||||||||||||||
| Products: | |||||||||||||||||||||||
| Life Science Office | 8 | 13 | 278,877 | 288,494 | $ | 63.07 | $ | 52.83 | |||||||||||||||
| Other Office | 62 | 45 | 524,022 | 429,818 | $ | 32.67 | $ | 34.56 | |||||||||||||||
| Total Office in Core Markets | 70 | 58 | 802,899 | 718,312 | $ | 43.23 | $ | 41.90 | |||||||||||||||
| Office in Non-Core Markets | 35 | 38 | 152,825 | 183,132 | $ | 19.82 | $ | 20.30 | |||||||||||||||
| Total | 105 | 96 | 955,724 | 901,444 | $ | 39.61 | $ | 37.51 | 5.6 | % | |||||||||||||
| (1) | Retail and Office contractual rent per square foot includes base rent and fixed additional charges for common area maintenance and real estate taxes. Retail contractual rent per square foot also includes fixed additional marketing/promotional charges. |
| (2) | For all new leases, contractual rent per square foot is the new base rate as of rental commencement. For all expiring leases, contractual rent per square foot is the base rate at the time of expiration, plus any applicable escalations. |
17
Forest City Enterprises, Inc. and Subsidiaries
Supplemental Operating Information
Apartment Communities
The following tables present leasing information of our Apartment Communities. Prior period amounts may differ from data as reported in previous quarters since the properties that qualify as comparable change from period to period.
Quarterly Comparison
Monthly Average Residential Rental Rates (2) | Average Residential Occupancy | |||||||||||||||||
| Comparable Apartment | Leasable Units at | Three Months Ended October 31, | Three Months Ended October 31, | |||||||||||||||
Communities (1) | Pro-Rata % (3) | 2013 | 2012 | % Change | 2013 | 2012 | % Change | |||||||||||
| Core Markets | 7,879 | $ | 1,730 | $ | 1,659 | 4.3 | % | 95.5 | % | 95.2 | % | 0.3 | % | |||||
| Non-Core Markets | 8,945 | $ | 958 | $ | 939 | 2.0 | % | 94.3 | % | 94.1 | % | 0.2 | % | |||||
| Total Comparable Apartments | 16,824 | $ | 1,319 | $ | 1,276 | 3.4 | % | 95.1 | % | 94.8 | % | 0.3 | % | |||||
Year-to-Date Comparison
Monthly Average Residential Rental Rates (2) | Economic Residential Occupancy | |||||||||||||||||
| Comparable Apartment | Leasable Units at | Nine Months Ended October 31, | Nine Months Ended October 31, | |||||||||||||||
Communities (1) | Pro-Rata % (3) | 2013 | 2012 | % Change | 2013 | 2012 | % Change | |||||||||||
| Core Markets | 7,709 | $ | 1,692 | $ | 1,619 | 4.5 | % | 95.2 | % | 95.2 | % | — | ||||||
| Non-Core Markets | 8,945 | $ | 954 | $ | 930 | 2.6 | % | 94.2 | % | 93.6 | % | 0.6 | % | |||||
| Total Comparable Apartments | 16,654 | $ | 1,296 | $ | 1,249 | 3.8 | % | 94.8 | % | 94.5 | % | 0.3 | % | |||||
Sequential Quarter Comparison
Monthly Average Residential Rental Rates (2) | Economic Residential Occupancy | |||||||||||||||||
| Leasable | Three Months Ended | Three Months Ended | ||||||||||||||||
| Comparable Apartment | Units | October 31 | July 31, | October 31 | July 31, | |||||||||||||
Communities (1) | Pro-Rata % (3) | 2013 | 2013 | % Change | 2013 | 2013 | % Change | |||||||||||
| Core Markets | 8,190 | $ | 1,808 | $ | 1,774 | 1.9 | % | 95.3 | % | 95.3 | % | — | ||||||
| Non-Core Markets | 9,252 | $ | 952 | $ | 950 | 0.2 | % | 94.3 | % | 94.5 | % | (0.2 | )% | |||||
| Total Comparable Apartments | 17,442 | $ | 1,354 | $ | 1,337 | 1.3 | % | 95.0 | % | 95.0 | % | — | ||||||
| (1) | Includes stabilized apartment communities completely opened and operated in the periods presented. These apartment communities include units leased at affordable apartment rates which provide a discount from average market rental rates. For the three months ended October 31, 2013, 18.9% of leasable units in core markets and 3.5% of leasable units in non-core markets were affordable housing units. Excludes all military and limited-distribution subsidized senior housing units. |
| (2) | Represents gross potential rent less concessions. |
| (3) | Leasable units at pro-rata represent our share of comparable leasable units at the apartment community. |
18
(THIS PAGE INTENTIONALLY LEFT BLANK)
19
Forest City Enterprises, Inc. and Subsidiaries
Supplemental Operating Information
Pro-Rata Comparable NOI (% change over same period prior year)
| Three Months Ended | Nine Months Ended | ||||
| October 31, 2013 | October 31, 2013 | ||||
| Retail | 0.5 | % | 2.2 | % | |
Office (1) | (4.0 | )% | (5.2 | )% | |
| Residential | 5.3 | % | 4.8 | % | |
| Total | (0.1 | )% | (0.1 | )% | |
The tables below provide the percentage change of Comparable NOI as reported in previous quarters. GAAP reconciliations for previous quarters can be found in prior supplemental packages furnished with the Securities and Exchange Commission and available on our website at www.forestcity.net.
| Quarterly Historical Trends | Annual Historical Trends | |||||||||||||||||||||||||
| Three Months Ended | Years Ended | |||||||||||||||||||||||||
| October 31, 2013 | July 31, 2013 | April 30, 2013 | January 31, 2013 | October 31, 2012 | January 31, 2013 | January 31, 2012 | January 31, 2011 | |||||||||||||||||||
| Retail | 0.5 | % | 3.5 | % | 0.5 | % | 2.8 | % | 0.5 | % | Retail | 2.1 | % | 2.6 | % | 2.2 | % | |||||||||
| Office | (4.0 | )% | (4.7 | )% | (6.0 | )% | 1.2 | % | 0.6 | % | Office | 2.1 | % | (2.6 | )% | 2.1 | % | |||||||||
| Residential | 5.3 | % | 7.1 | % | 1.7 | % | 6.4 | % | 6.0 | % | Residential | 7.3 | % | 7.3 | % | 4.3 | % | |||||||||
| Total | (0.1 | )% | 1.1 | % | (1.9 | )% | 3.0 | % | 1.8 | % | Total | 3.2 | % | 1.4 | % | 2.5 | % | |||||||||
| (1) | Primarily due to decreased occupancy at One Pierrepont Plaza. |
20
Forest City Enterprises, Inc. and Subsidiaries
Supplemental Operating Information
Net Operating Income (in thousands) | |||||||||||||||||||||||||||||
| Three Months Ended October 31, 2013 | Three Months Ended October 31, 2012 | % Change | |||||||||||||||||||||||||||
Full Consolidation (GAAP) | Less Noncontrolling Interest | Plus Discontinued Operations | Pro-Rata Consolidation (Non-GAAP) | Full Consolidation (GAAP) | Less Noncontrolling Interest | Plus Discontinued Operations | Pro-Rata Consolidation (Non-GAAP) | Full Consolidation (GAAP) | Pro-Rata Consolidation (Non-GAAP) | ||||||||||||||||||||
| Commercial Group | |||||||||||||||||||||||||||||
| Retail | |||||||||||||||||||||||||||||
| Comparable | $ | 49,249 | $ | 558 | $ | — | $ | 48,691 | $ | 49,071 | $ | 635 | $ | — | $ | 48,436 | 0.4 | % | 0.5 | % | |||||||||
| Total | 54,631 | 417 | — | 54,214 | 62,012 | 2,106 | 590 | 60,496 | |||||||||||||||||||||
| Office Buildings | |||||||||||||||||||||||||||||
| Comparable | 54,961 | 2,288 | — | 52,673 | 56,769 | 1,884 | — | 54,885 | (3.2 | )% | (4.0 | )% | |||||||||||||||||
| Total | 55,288 | 2,331 | (277 | ) | 52,680 | 57,506 | 1,889 | 4,543 | 60,160 | ||||||||||||||||||||
| Hotels | — | — | — | — | 1,340 | — | 2,860 | 4,200 | |||||||||||||||||||||
| Land Sales | (7 | ) | — | — | (7 | ) | 3,703 | — | — | 3,703 | |||||||||||||||||||
Other (1) | (40,113 | ) | (195 | ) | — | (39,918 | ) | 146 | (7 | ) | (163 | ) | (10 | ) | |||||||||||||||
| Total Commercial Group | |||||||||||||||||||||||||||||
| Comparable | 104,210 | 2,846 | — | 101,364 | 105,840 | 2,519 | — | 103,321 | (1.5 | )% | (1.9 | )% | |||||||||||||||||
| Total | 69,799 | 2,553 | (277 | ) | 66,969 | 124,707 | 3,988 | 7,830 | 128,549 | ||||||||||||||||||||
| Arena | 10,757 | 5,083 | — | 5,674 | 1,278 | 802 | — | 476 | |||||||||||||||||||||
| Residential Group | |||||||||||||||||||||||||||||
| Apartments | |||||||||||||||||||||||||||||
| Comparable | 37,884 | 683 | — | 37,201 | 35,933 | 598 | — | 35,335 | 5.4 | % | 5.3 | % | |||||||||||||||||
| Total | 38,941 | 1,138 | — | 37,803 | 37,602 | 817 | 1,356 | 38,141 | |||||||||||||||||||||
| Subsidized Senior Housing | 3,335 | 212 | — | 3,123 | 6,471 | 55 | — | 6,416 | |||||||||||||||||||||
| Military Housing | 7,037 | 256 | — | 6,781 | 6,770 | 285 | — | 6,485 | |||||||||||||||||||||
| Land Sales | 224 | — | — | 224 | — | — | — | — | |||||||||||||||||||||
Other (1) | (2,526 | ) | 56 | — | (2,582 | ) | (1,723 | ) | 131 | 154 | (1,700 | ) | |||||||||||||||||
| Total Residential Group | |||||||||||||||||||||||||||||
| Comparable | 37,884 | 683 | — | 37,201 | 35,933 | 598 | — | 35,335 | 5.4 | % | 5.3 | % | |||||||||||||||||
| Total | 47,011 | 1,662 | — | 45,349 | 49,120 | 1,288 | 1,510 | 49,342 | |||||||||||||||||||||
| Total Rental Properties | |||||||||||||||||||||||||||||
| Comparable | 142,094 | 3,529 | — | 138,565 | 141,773 | 3,117 | — | 138,656 | 0.2 | % | (0.1 | )% | |||||||||||||||||
| Total | 127,567 | 9,298 | (277 | ) | 117,992 | 175,105 | 6,078 | 9,340 | 178,367 | ||||||||||||||||||||
| Land Development Group | 7,386 | 819 | — | 6,567 | 886 | 485 | — | 401 | |||||||||||||||||||||
| The Nets | (50 | ) | — | — | (50 | ) | (7,477 | ) | — | — | (7,477 | ) | |||||||||||||||||
| Corporate Activities | (13,266 | ) | — | — | (13,266 | ) | (14,527 | ) | — | — | (14,527 | ) | |||||||||||||||||
| Grand Total | $ | 121,637 | $ | 10,117 | $ | (277 | ) | $ | 111,243 | $ | 153,987 | $ | 6,563 | $ | 9,340 | $ | 156,764 | ||||||||||||
| (1) | Includes write-offs of abandoned development projects, non-capitalizable development costs and unallocated management and service company overhead, net of tax credit income. |
21
Forest City Enterprises, Inc. and Subsidiaries
Supplemental Operating Information
Net Operating Income (in thousands) | |||||||||||||||||||||||||||||
| Nine Months Ended October 31, 2013 | Nine Months Ended October 31, 2012 | % Change | |||||||||||||||||||||||||||
Full Consolidation (GAAP) | Less Noncontrolling Interest | Plus Discontinued Operations | Pro-Rata Consolidation (Non-GAAP) | Full Consolidation (GAAP) | Less Noncontrolling Interest | Plus Discontinued Operations | Pro-Rata Consolidation (Non-GAAP) | Full Consolidation (GAAP) | Pro-Rata Consolidation (Non-GAAP) | ||||||||||||||||||||
| Commercial Group | |||||||||||||||||||||||||||||
| Retail | |||||||||||||||||||||||||||||
| Comparable | $ | 161,232 | $ | 3,836 | $ | — | $ | 157,396 | $ | 158,086 | $ | 4,055 | $ | — | $ | 154,031 | 2.0 | % | 2.2 | % | |||||||||
| Total | 175,954 | 2,832 | — | 173,122 | 180,932 | 5,645 | 3,021 | 178,308 | |||||||||||||||||||||
| Office Buildings | |||||||||||||||||||||||||||||
| Comparable | 166,070 | 6,623 | — | 159,447 | 174,443 | 6,175 | — | 168,268 | (4.8 | )% | (5.2 | )% | |||||||||||||||||
| Total | 173,947 | 7,862 | 4,905 | 170,990 | 179,222 | 6,374 | 12,703 | 185,551 | |||||||||||||||||||||
| Hotels | 1,391 | — | 2,628 | 4,019 | 2,922 | — | 6,087 | 9,009 | |||||||||||||||||||||
Land Sales (1) | 10,837 | — | — | 10,837 | 40,201 | — | — | 40,201 | |||||||||||||||||||||
Other (2) | (61,683 | ) | (694 | ) | 212 | (60,777 | ) | (16,529 | ) | (184 | ) | 1,168 | (15,177 | ) | |||||||||||||||
| Total Commercial Group | |||||||||||||||||||||||||||||
| Comparable | 327,302 | 10,459 | — | 316,843 | 332,529 | 10,230 | — | 322,299 | (1.6 | )% | (1.7 | )% | |||||||||||||||||
| Total | 300,446 | 10,000 | 7,745 | 298,191 | 386,748 | 11,835 | 22,979 | 397,892 | |||||||||||||||||||||
| Arena | 21,557 | 10,232 | — | 11,325 | (9,231 | ) | (3,507 | ) | — | (5,724 | ) | ||||||||||||||||||
| Residential Group | |||||||||||||||||||||||||||||
| Apartments | |||||||||||||||||||||||||||||
| Comparable | 109,422 | 1,891 | — | 107,531 | 104,517 | 1,877 | — | 102,640 | 4.7 | % | 4.8 | % | |||||||||||||||||
| Total | 117,709 | 2,640 | 220 | 115,289 | 109,131 | 2,342 | 4,995 | 111,784 | |||||||||||||||||||||
| Subsidized Senior Housing | 10,999 | 417 | — | 10,582 | 15,582 | 259 | — | 15,323 | |||||||||||||||||||||
| Military Housing | 17,414 | 341 | — | 17,073 | 21,433 | 529 | — | 20,904 | |||||||||||||||||||||
| Land Sales | 224 | — | — | 224 | — | — | — | — | |||||||||||||||||||||
Other (2) | (12,943 | ) | (1,838 | ) | 202 | (10,903 | ) | (6,007 | ) | 416 | 359 | (6,064 | ) | ||||||||||||||||
| Total Residential Group | |||||||||||||||||||||||||||||
| Comparable | 109,422 | 1,891 | — | 107,531 | 104,517 | 1,877 | — | 102,640 | 4.7 | % | 4.8 | % | |||||||||||||||||
| Total | 133,403 | 1,560 | 422 | 132,265 | 140,139 | 3,546 | 5,354 | 141,947 | |||||||||||||||||||||
| Total Rental Properties | |||||||||||||||||||||||||||||
| Comparable | 436,724 | 12,350 | — | 424,374 | 437,046 | 12,107 | — | 424,939 | (0.1 | )% | (0.1 | )% | |||||||||||||||||
| Total | 455,406 | 21,792 | 8,167 | 441,781 | 517,656 | 11,874 | 28,333 | 534,115 | |||||||||||||||||||||
| Land Development Group | 20,592 | 2,398 | — | 18,194 | 10,355 | 1,543 | — | 8,812 | |||||||||||||||||||||
| The Nets | (2,763 | ) | — | — | (2,763 | ) | (22,707 | ) | — | — | (22,707 | ) | |||||||||||||||||
| Corporate Activities | (40,729 | ) | — | — | (40,729 | ) | (41,390 | ) | — | — | (41,390 | ) | |||||||||||||||||
| Grand Total | $ | 432,506 | $ | 24,190 | $ | 8,167 | $ | 416,483 | $ | 463,914 | $ | 13,417 | $ | 28,333 | $ | 478,830 | |||||||||||||
| (1) | Includes $8,927 and $36,484 of NOI generated from certain non-outlot land sales at full and pro-rata consolidation for the nine months ended October 31, 2013 and 2012, respectively. |
| (2) | Includes write-offs of abandoned development projects, non-capitalizable development costs and unallocated management and service company overhead, net of tax credit income. |
22
Forest City Enterprises, Inc. and Subsidiaries
Supplemental Operating Information
Net Operating Income by Product Type
Pro-Rata Consolidation (dollars in thousands)
Nine Months Ended October 31, 2013 Nine Months Ended October 31, 2012
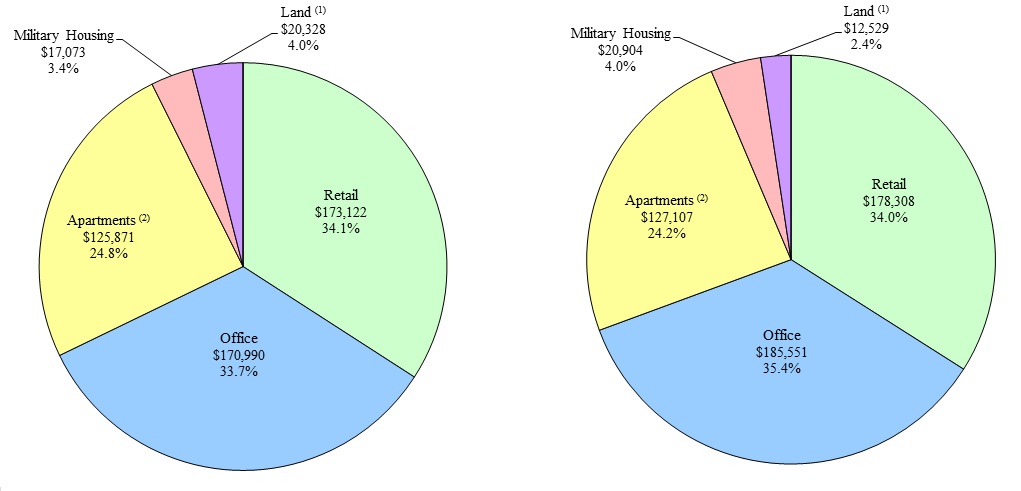
| NOI by Product Type | $ | 507,384 | NOI by Product Type | $ | 524,399 | |||
| Hotels | 4,019 | Hotels | 9,009 | |||||
| Non-outlot land sale | 8,927 | Casino land sale | 36,484 | |||||
| Arena | 11,325 | Arena | (5,724 | ) | ||||
| The Nets | (2,763 | ) | The Nets | (22,707 | ) | |||
| Corporate Activities | (40,729 | ) | Corporate Activities | (41,390 | ) | |||
Other (3) | (71,680 | ) | Other (3) | (21,241 | ) | |||
| Grand Total NOI | $ | 416,483 | Grand Total NOI | $ | 478,830 | |||
| (1) | Includes commercial and residential outlot land sales. |
| (2) | Includes limited-distribution subsidized senior housing. |
| (3) | Includes write-offs of abandoned development projects, non-capitalizable development costs and unallocated management and service company overhead, net of tax credit income. |
23
Forest City Enterprises, Inc. and Subsidiaries
Supplemental Operating Information
Net Operating Income by Core Market
Pro-Rata Consolidation (dollars in thousands)
Nine Months Ended October 31, 2013 Nine Months Ended October 31, 2012
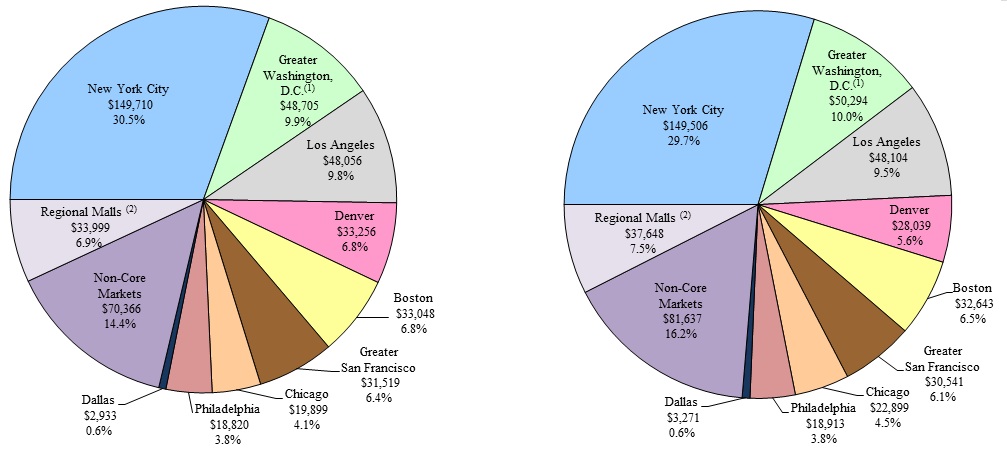
| NOI by Market | $ | 490,311 | NOI by Market | $ | 503,495 | |||
| Hotels | 4,019 | Hotels | 9,009 | |||||
| Non-outlot land sale | 8,927 | Casino land sale | 36,484 | |||||
| Arena | 11,325 | Arena | (5,724 | ) | ||||
| Military Housing | 17,073 | Military Housing | 20,904 | |||||
| The Nets | (2,763 | ) | The Nets | (22,707 | ) | |||
| Corporate Activities | (40,729 | ) | Corporate Activities | (41,390 | ) | |||
Other (3) | (71,680 | ) | Other (3) | (21,241 | ) | |||
| Grand Total NOI | $ | 416,483 | Grand Total NOI | $ | 478,830 | |||
| (1) | Includes Richmond, Virginia. |
| (2) | Represents Regional Malls located in Non-Core Markets. Regional Malls located in Core Markets are included in their applicable Core Markets. |
| (3) | Includes write-offs of abandoned development projects, non-capitalizable development costs and unallocated management and service company overhead, net of tax credit income. |
24
Forest City Enterprises, Inc. and Subsidiaries
Supplemental Operating Information
Reconciliation of Net Operating Income (non-GAAP) to Net Earnings (Loss) (GAAP) (in thousands)
| Three Months Ended October 31, 2013 | Three Months Ended October 31, 2012 | ||||||||||||||||||||||||||||||
Full Consolidation (GAAP) | Less Noncontrolling Interest | Plus Unconsolidated Investments at Pro-Rata | Plus Discontinued Operations | Pro-Rata Consolidation (Non-GAAP) | Full Consolidation (GAAP) | Less Noncontrolling Interest | Plus Unconsolidated Investments at Pro-Rata | Plus Discontinued Operations | Pro-Rata Consolidation (Non-GAAP) | ||||||||||||||||||||||
Net operating income (1) | $ | 121,637 | $ | 10,117 | $ | — | $ | (277 | ) | $ | 111,243 | $ | 153,987 | $ | 6,563 | $ | — | $ | 9,340 | $ | 156,764 | ||||||||||
| Interest expense | (72,126 | ) | (6,950 | ) | (26,158 | ) | (16 | ) | (91,350 | ) | (66,744 | ) | (4,004 | ) | (25,932 | ) | (2,712 | ) | (91,384 | ) | |||||||||||
| Interest expense of unconsolidated entities | (26,158 | ) | — | 26,158 | — | — | (25,932 | ) | — | 25,932 | — | — | |||||||||||||||||||
| Gain (loss) on extinguishment of debt | (13,096 | ) | — | (50 | ) | — | (13,146 | ) | 8,007 | (415 | ) | — | (192 | ) | 8,230 | ||||||||||||||||
| Gain (loss) on extinguishment of debt of unconsolidated entities | (50 | ) | — | 50 | — | — | — | — | — | — | — | ||||||||||||||||||||
| Equity in (earnings) loss of unconsolidated entities | (46,660 | ) | (162 | ) | 45,442 | — | (1,056 | ) | (3,906 | ) | (61 | ) | 11,187 | — | 7,342 | ||||||||||||||||
| Net gain (loss) on land held for divestiture activity | — | — | 186 | — | 186 | 807 | 247 | (283 | ) | — | 277 | ||||||||||||||||||||
| Net gain (loss) on land held for divestiture activity of unconsolidated entities | 186 | — | (186 | ) | — | — | (283 | ) | — | 283 | — | — | |||||||||||||||||||
| Net gain (loss) on disposition of rental properties and partial interests in rental properties | 491,160 | — | 34,281 | 1,114 | 526,555 | — | — | — | 19,299 | 19,299 | |||||||||||||||||||||
| Gain (loss) on disposition of unconsolidated entities | 34,281 | — | (34,281 | ) | — | — | — | — | — | — | — | ||||||||||||||||||||
| Impairment of consolidated and unconsolidated real estate | (200,155 | ) | (15,462 | ) | — | — | (184,693 | ) | (30,200 | ) | — | — | (164 | ) | (30,364 | ) | |||||||||||||||
| Depreciation and amortization—Real Estate Groups (a) | (83,999 | ) | (6,010 | ) | (18,620 | ) | — | (96,609 | ) | (54,442 | ) | (2,679 | ) | (19,145 | ) | (2,618 | ) | (73,526 | ) | ||||||||||||
| Amortization of mortgage procurement costs | (2,246 | ) | (178 | ) | (770 | ) | — | (2,838 | ) | (2,611 | ) | (74 | ) | (773 | ) | (54 | ) | (3,364 | ) | ||||||||||||
| Depreciation and amortization of unconsolidated entities | (19,390 | ) | — | 19,390 | — | — | (19,918 | ) | — | 19,918 | — | — | |||||||||||||||||||
| Straight-line rent adjustment | 4,906 | — | — | (20 | ) | 4,886 | 3,015 | — | — | 92 | 3,107 | ||||||||||||||||||||
| Earnings (loss) before income taxes | 188,290 | (18,645 | ) | 45,442 | 801 | 253,178 | (38,220 | ) | (423 | ) | 11,187 | 22,991 | (3,619 | ) | |||||||||||||||||
| Income tax benefit (expense) | (100,644 | ) | — | — | (261 | ) | (100,905 | ) | 20,025 | — | — | (10,142 | ) | 9,883 | |||||||||||||||||
| Equity in earnings (loss) of unconsolidated entities, gross of tax | 46,474 | 162 | (45,256 | ) | — | 1,056 | 4,189 | 61 | (11,470 | ) | — | (7,342 | ) | ||||||||||||||||||
| Net gain (loss) on land held for divestiture activity of unconsolidated entities, gross of tax | 186 | — | (186 | ) | — | — | (283 | ) | — | 283 | — | — | |||||||||||||||||||
| 46,660 | 162 | (45,442 | ) | — | 1,056 | 3,906 | 61 | (11,187 | ) | — | (7,342 | ) | |||||||||||||||||||
| Earnings (loss) from continuing operations | 134,306 | (18,483 | ) | — | 540 | 153,329 | (14,289 | ) | (362 | ) | — | 12,849 | (1,078 | ) | |||||||||||||||||
| Discontinued operations, net of tax | 668 | 128 | — | (540 | ) | — | 12,642 | (207 | ) | — | (12,849 | ) | — | ||||||||||||||||||
| Net earnings (loss) | 134,974 | (18,355 | ) | — | — | 153,329 | (1,647 | ) | (569 | ) | — | — | (1,078 | ) | |||||||||||||||||
| Noncontrolling interests | |||||||||||||||||||||||||||||||
| (Earnings) loss from continuing operations attributable to noncontrolling interests, gross of tax | 18,483 | 18,483 | — | — | — | 362 | 362 | — | — | — | |||||||||||||||||||||
| (Earnings) loss from discontinued operations attributable to noncontrolling interests | (128 | ) | (128 | ) | — | — | — | 207 | 207 | — | — | — | |||||||||||||||||||
| 18,355 | 18,355 | — | — | — | 569 | 569 | — | — | — | ||||||||||||||||||||||
| Net earnings (loss) attributable to Forest City Enterprises, Inc. | $ | 153,329 | $ | — | $ | — | $ | — | $ | 153,329 | $ | (1,078 | ) | $ | — | $ | — | $ | — | $ | (1,078 | ) | |||||||||
| Preferred dividends and inducements of preferred stock conversion | — | — | — | — | — | (17,731 | ) | — | — | — | (17,731 | ) | |||||||||||||||||||
| Net earnings (loss) attributable to Forest City Enterprises, Inc. common shareholders | $ | 153,329 | $ | — | $ | — | $ | — | $ | 153,329 | $ | (18,809 | ) | $ | — | $ | — | $ | — | $ | (18,809 | ) | |||||||||
| (a) Depreciation and amortization - Real Estate Groups | $ | 83,999 | $ | 6,010 | $ | 18,620 | $ | — | $ | 96,609 | $ | 54,442 | $ | 2,679 | $ | 19,145 | $ | 2,618 | $ | 73,526 | |||||||||||
| Depreciation and amortization - Non-Real Estate | 1,101 | — | — | — | 1,101 | 1,037 | — | — | — | 1,037 | |||||||||||||||||||||
| Total depreciation and amortization | $ | 85,100 | $ | 6,010 | $ | 18,620 | $ | — | $ | 97,710 | $ | 55,479 | $ | 2,679 | $ | 19,145 | $ | 2,618 | $ | 74,563 | |||||||||||
(1) For component detail of NOI by segment, see the Summary of FFO schedules for the three and nine months ended October 31, 2013, included elsewhere in this supplemental package.
25
Forest City Enterprises, Inc. and Subsidiaries
Supplemental Operating Information
Reconciliation of Net Operating Income (non-GAAP) to Net Earnings (Loss) (GAAP) (in thousands) (continued)
| Nine Months Ended October 31, 2013 | Nine Months Ended October 31, 2012 | ||||||||||||||||||||||||||||||
Full Consolidation (GAAP) | Less Noncontrolling Interest | Plus Unconsolidated Investments at Pro-Rata | Plus Discontinued Operations | Pro-Rata Consolidation (Non-GAAP) | Full Consolidation (GAAP) | Less Noncontrolling Interest | Plus Unconsolidated Investments at Pro-Rata | Plus Discontinued Operations | Pro-Rata Consolidation (Non-GAAP) | ||||||||||||||||||||||
Net operating income (1) | $ | 432,506 | $ | 24,190 | $ | — | $ | 8,167 | $ | 416,483 | $ | 463,914 | $ | 13,417 | $ | — | $ | 28,333 | $ | 478,830 | |||||||||||
| Interest expense | (250,100 | ) | (21,361 | ) | (75,431 | ) | (2,777 | ) | (306,947 | ) | (180,988 | ) | (9,400 | ) | (76,230 | ) | (10,057 | ) | (257,875 | ) | |||||||||||
| Interest expense of unconsolidated entities | (75,431 | ) | — | 75,431 | — | — | (76,230 | ) | — | 76,230 | — | — | |||||||||||||||||||
| Gain (loss) on extinguishment of debt | 6,335 | — | (57 | ) | (36 | ) | 6,242 | 7,288 | (603 | ) | (1,313 | ) | (192 | ) | 6,386 | ||||||||||||||||
| Gain (loss) on extinguishment of debt of unconsolidated entities | (57 | ) | — | 57 | — | — | (1,313 | ) | — | 1,313 | — | — | |||||||||||||||||||
| Equity in (earnings) loss of unconsolidated entities, including impairment | (60,682 | ) | 644 | 64,678 | — | 3,352 | 17,933 | (260 | ) | 1,413 | — | 19,606 | |||||||||||||||||||
| Net gain (loss) on land held for divestiture activity | (7,555 | ) | (720 | ) | 867 | — | (5,968 | ) | (5,651 | ) | 3,754 | (42,170 | ) | — | (51,575 | ) | |||||||||||||||
| Net gain (loss) on land held for divestiture activity of unconsolidated entities | 867 | — | (867 | ) | — | — | (42,170 | ) | — | 42,170 | — | — | |||||||||||||||||||
| Net gain (loss) on disposition of rental properties and partial interests in rental properties | 496,092 | — | 32,771 | 38,382 | 567,245 | — | — | 16,107 | 27,213 | 43,320 | |||||||||||||||||||||
| Gain (loss) on disposition of unconsolidated entities | 32,771 | — | (32,771 | ) | — | — | 16,107 | — | (16,107 | ) | — | — | |||||||||||||||||||
| Impairment of consolidated and unconsolidated real estate | (208,210 | ) | (15,462 | ) | — | — | (192,748 | ) | (30,660 | ) | — | (390 | ) | (4,254 | ) | (35,304 | ) | ||||||||||||||
| Impairment of unconsolidated real estate | — | — | — | — | — | (390 | ) | — | 390 | — | — | ||||||||||||||||||||
| Depreciation and amortization—Real Estate Groups (a) | (241,829 | ) | (15,367 | ) | (54,550 | ) | (2,000 | ) | (283,012 | ) | (153,481 | ) | (4,640 | ) | (57,992 | ) | (9,603 | ) | (216,436 | ) | |||||||||||
| Amortization of mortgage procurement costs | (7,572 | ) | (530 | ) | (2,334 | ) | (50 | ) | (9,426 | ) | (8,674 | ) | (303 | ) | (2,423 | ) | (546 | ) | (11,340 | ) | |||||||||||
| Depreciation and amortization of unconsolidated entities | (56,884 | ) | — | 56,884 | — | — | (60,415 | ) | — | 60,415 | — | — | |||||||||||||||||||
| Straight-line rent adjustment | 10,718 | — | — | 159 | 10,877 | 10,812 | — | — | 905 | 11,717 | |||||||||||||||||||||
| Earnings (loss) before income taxes | 70,969 | (28,606 | ) | 64,678 | 41,845 | 206,098 | (43,918 | ) | 1,965 | 1,413 | 31,799 | (12,671 | ) | ||||||||||||||||||
| Income tax benefit (expense) | (68,522 | ) | — | — | (19,306 | ) | (87,828 | ) | 19,888 | — | — | (13,718 | ) | 6,170 | |||||||||||||||||
| Net gain on change in control of interests | 2,762 | — | — | — | 2,762 | 6,766 | 2,702 | — | — | 4,064 | |||||||||||||||||||||
| Equity in earnings (loss) of unconsolidated entities, including impairment of depreciable real estate, gross of tax | 59,815 | (644 | ) | (63,811 | ) | — | (3,352 | ) | 24,237 | 260 | (43,583 | ) | — | (19,606 | ) | ||||||||||||||||
| Net gain (loss) on land held for divestiture activity of unconsolidated entities, gross of tax | 867 | — | (867 | ) | — | — | (42,170 | ) | — | 42,170 | — | — | |||||||||||||||||||
| 60,682 | (644 | ) | (64,678 | ) | — | (3,352 | ) | (17,933 | ) | 260 | (1,413 | ) | — | (19,606 | ) | ||||||||||||||||
| Earnings (loss) from continuing operations | 65,891 | (29,250 | ) | — | 22,539 | 117,680 | (35,197 | ) | 4,927 | — | 18,081 | (22,043 | ) | ||||||||||||||||||
| Discontinued operations, net of tax | 28,515 | 5,976 | — | (22,539 | ) | — | 19,439 | 1,358 | — | (18,081 | ) | — | |||||||||||||||||||
| Net earnings (loss) | 94,406 | (23,274 | ) | — | — | 117,680 | (15,758 | ) | 6,285 | — | — | (22,043 | ) | ||||||||||||||||||
| Noncontrolling interests | |||||||||||||||||||||||||||||||
| (Earnings) loss from continuing operations attributable to noncontrolling interests, gross of tax | 29,250 | 29,250 | — | — | — | (4,927 | ) | (4,927 | ) | — | — | — | |||||||||||||||||||
| (Earnings) loss from discontinued operations attributable to noncontrolling interests | (5,976 | ) | (5,976 | ) | — | — | — | (1,358 | ) | (1,358 | ) | — | — | — | |||||||||||||||||
| 23,274 | 23,274 | — | — | — | (6,285 | ) | (6,285 | ) | — | — | — | ||||||||||||||||||||
| Net earnings (loss) attributable to Forest City Enterprises, Inc. | $ | 117,680 | $ | — | $ | — | $ | — | $ | 117,680 | $ | (22,043 | ) | $ | — | $ | — | $ | — | $ | (22,043 | ) | |||||||||
| Preferred dividends and inducements of preferred stock conversion | (185 | ) | — | — | — | (185 | ) | (25,431 | ) | — | — | — | (25,431 | ) | |||||||||||||||||
| Net earnings (loss) attributable to Forest City Enterprises, Inc. common shareholders | $ | 117,495 | $ | — | $ | — | $ | — | $ | 117,495 | $ | (47,474 | ) | $ | — | $ | — | $ | — | $ | (47,474 | ) | |||||||||
| (a) Depreciation and amortization—Real Estate Groups | 241,829 | 15,367 | 54,550 | 2,000 | $ | 283,012 | 153,481 | 4,640 | 57,992 | 9,603 | $ | 216,436 | |||||||||||||||||||
| Depreciation and amortization—Non-Real Estate | 3,476 | — | — | — | 3,476 | 2,233 | — | — | — | 2,233 | |||||||||||||||||||||
| Total depreciation and amortization | $ | 245,305 | $ | 15,367 | $ | 54,550 | $ | 2,000 | $ | 286,488 | $ | 155,714 | $ | 4,640 | $ | 57,992 | $ | 9,603 | $ | 218,669 | |||||||||||
(1) For component detail of NOI by segment, see the Summary of FFO schedules for the three and nine months ended October 31, 2013, included elsewhere in this supplemental package.
26
Forest City Enterprises, Inc. and Subsidiaries
Supplemental Operating Information
Results of Operations
Net Earnings (Loss) Attributable to Forest City Enterprises, Inc. – Net earnings attributable to Forest City Enterprises, Inc. for the three months ended October 31, 2013 was $153,329,000 versus net loss of $1,078,000 for the three months ended October 31, 2012. Although we have substantial recurring revenue sources from our properties, we also enter into significant transactions, which create substantial variances in operating results between periods. This variance to the prior year period is primarily attributable to the following increases, which are net of noncontrolling interests:
| • | $491,160,000 related to the 2013 net gain on disposition of partial interests in rental properties; |
| • | $16,096,000 related to 2013 gains on disposition of rental properties and unconsolidated investments exceeding 2012 gains; |
| • | $7,427,000 related to a 2013 decrease in allocated losses from our equity investment in The Nets; and |
| • | $3,077,000 related to an increase in income recognized on the sale of state and federal historic preservation, Brownfield and new market tax credits in 2013 compared with 2012. |
These increases were partially offset by the following decreases, net of noncontrolling interests:
| • | $154,329,000 related to a 2013 increase in impairment charges of consolidated (including discontinued operations) entities; |
| • | $26,127,000 of increased write-offs and other expenses related to abandoned development projects in 2013 compared with 2012; |
| • | $23,147,000 related to an increase in depreciation and amortization expense primarily due to several large property openings in 2012 and 2011 and accelerated depreciation expense at Ten MetroTech Center, an office building in Brooklyn, New York, due to a change in the estimated useful life of the building, as a result of the planned demolition; |
| • | $8,200,000 related to non-capitalizable demolition costs at Ten MetroTech Center in 2013; |
| • | $21,376,000 related to increased losses on extinguishment of debt in 2013 compared with 2012; |
| • | $10,164,000 related to an increase in interest expense due to reduced capitalized interest on our projects under construction and development as we reduce our construction pipeline; |
| • | $4,239,000 related to decreased commercial outlot land sales in 2013 compared with 2012; |
| • | $3,146,000 related to increased interest expense due to several large property openings in 2012 and 2011; and |
| • | $110,788,000 due to increased income tax expense attributable to both continuing and discontinued operations primarily related to the fluctuations in pre-tax earnings, including gains included in discontinued operations. These fluctuations are primarily due to the various transactions discussed herein. |
Net earnings attributable to Forest City Enterprises, Inc. for the nine months ended October 31, 2013 was $117,680,000 versus net loss of $22,043,000 for the nine months ended October 31, 2012. This variance to the prior year period is primarily attributable to the following increases, which are net of noncontrolling interests:
| • | $496,092,000 related to the 2013 net gain on disposition of partial interests in rental properties; |
| • | $45,607,000 related to a decrease in the net loss on land held for divestiture activities for fully consolidated land projects and land projects accounted for under the equity method of accounting in 2013 compared with 2012; |
| • | $27,833,000 related to 2013 gains on disposition of rental properties and unconsolidated investments exceeding 2012 gains; |
| • | $19,944,000 related to a 2013 decrease in allocated losses from our equity investment in The Nets; and |
| • | $6,597,000 related to increased commercial outlot land sales in 2013 compared with 2012. |
These increases were partially offset by the following decreases, net of noncontrolling interests:
| • | $157,444,000 related to a 2013 increase in impairment charges of consolidated (including discontinued operations) and unconsolidated entities; |
| • | $67,819,000 related to an increase in depreciation and amortization expense primarily due to several large property openings in 2012 and 2011 and accelerated depreciation expense at Ten MetroTech Center due to a change in the estimated useful life of the building, as a result of the planned demolition; |
| • | $8,200,000 related to non-capitalizable demolition costs at Ten MetroTech Center in 2013; |
| • | $39,783,000 related to an increase in interest expense due to reduced capitalized interest on our projects under construction and development as we reduce our construction pipeline; |
27
Forest City Enterprises, Inc. and Subsidiaries
Supplemental Operating Information
| • | $36,484,000 related to the 2012 sale of an approximate 10-acre land parcel and air rights for development of a casino in downtown Cleveland, Ohio; |
| • | $17,263,000 related to increased interest expense due to several large property openings in 2012 and 2011; |
| • | $15,828,000 related to the change in fair market value of certain derivatives between the comparable periods, which was marked to market through interest expense as a result of the derivatives not qualifying for hedge accounting; |
| • | $15,550,000 of increased write-offs and other expenses related to abandoned development projects in 2013 compared with 2012; and |
| • | $93,998,000 due to increased income tax expense attributable to both continuing and discontinued operations primarily related to the fluctuations in pre-tax earnings, including gains included in discontinued operations. These fluctuations are primarily due to the various transactions discussed herein. |
Capital Expenditures for our Operating Portfolio—Our diversified real estate portfolio requires certain capital expenditures, including tenant improvements, to maintain and improve its operating performance. During the nine months ended October 31, 2013, we invested $72,886,000 at pro-rata consolidation ($56,883,000 at full consolidation) in capital expenditures for our operating portfolio as compared with $88,228,000 at pro-rata consolidation ($75,089,000 at full consolidation) during the nine months ended October 31, 2012. The decrease in capital expenditures from the prior period is primarily due to a reduction in significant tenant improvements at one of our Brooklyn office properties of $20,664,000 at pro-rata consolidation ($25,048,000 at full consolidation).
28
(THIS PAGE INTENTIONALLY LEFT BLANK)
29
Forest City Enterprises, Inc. and Subsidiaries
Supplemental Operating Information
| Reconciliation of Operating FFO to FFO - Pro-Rata Consolidation | Three Months Ended October 31, | Nine Months Ended October 31, | |||||||||||||
| 2013 | 2012 | % Change | 2013 | 2012 | % Change | ||||||||||
| Portfolio Pre-tax FFO: | (in thousands) | (in thousands) | |||||||||||||
| Commercial Group | $ | (89,909 | ) | $ | 77,336 | $ | 31,502 | $ | 235,268 | ||||||
| Residential Group | 34,266 | 33,042 | 81,594 | 96,547 | |||||||||||
| Arena | 662 | 2,278 | (2,906 | ) | 4,890 | ||||||||||
| Land Group | 6,596 | 615 | 12,147 | (46,927 | ) | ||||||||||
| Adjustments to Portfolio Pre-Tax FFO: | |||||||||||||||
| Net (gain) loss on land held for divestiture activity | (186 | ) | (277 | ) | 5,968 | 51,575 | |||||||||
| Impairment of non-depreciable real estate | 97,376 | — | 97,376 | — | |||||||||||
| Abandoned development project write-offs | 26,528 | 401 | 29,304 | 13,754 | |||||||||||
| Tax credit income | (6,780 | ) | (4,851 | ) | (18,149 | ) | (16,732 | ) | |||||||
| (Gain) loss on extinguishment of portfolio debt | 70 | (9,019 | ) | (24,344 | ) | (7,175 | ) | ||||||||
| Change in fair market value of nondesignated hedges | (4,043 | ) | (2,709 | ) | 5,778 | (10,570 | ) | ||||||||
| Net gain on change in control of interests | — | — | (2,762 | ) | (4,064 | ) | |||||||||
| Straight-line rent adjustments | (4,886 | ) | (3,107 | ) | (10,877 | ) | (11,717 | ) | |||||||
| Participation payments | 303 | — | 2,801 | — | |||||||||||
| Non-outlot land sales | — | — | (8,927 | ) | (36,484 | ) | |||||||||
| Non-capitalizable demolition costs | 8,200 | — | 8,200 | — | |||||||||||
| Adjustments to Portfolio Pre-Tax FFO subtotal | 116,582 | (19,562 | ) | 84,368 | (21,413 | ) | |||||||||
| Portfolio Pre-tax Operating FFO | 68,197 | 93,709 | (27.2)% | 206,705 | 268,365 | (23.0)% | |||||||||
| Corporate Group Pre-tax FFO | (39,960 | ) | (32,164 | ) | (102,927 | ) | (86,864 | ) | |||||||
| Loss on extinguishment of debt - Corporate Group | 13,076 | 789 | 18,102 | 789 | |||||||||||
| Operating FFO | 41,313 | 62,334 | (33.7)% | 121,880 | 182,290 | (33.1)% | |||||||||
| Nets Pre-tax FFO | (50 | ) | (7,477 | ) | (2,763 | ) | (22,707 | ) | |||||||
| Add back adjustments to Portfolio Pre-Tax FFO above | (116,582 | ) | 19,562 | (84,368 | ) | 21,413 | |||||||||
| Add back loss on extinguishment of debt - Corporate Group | (13,076 | ) | (789 | ) | (18,102 | ) | (789 | ) | |||||||
| Income tax benefit (expense) on FFO | 69,393 | 6,000 | 96,177 | 9,652 | |||||||||||
| FFO | $ | (19,002 | ) | $ | 79,630 | (123.9)% | $ | 112,824 | $ | 189,859 | (40.6)% | ||||
| Operating FFO Per Share - Diluted | |||||||||||||||
Numerator (in thousands): | |||||||||||||||
| Operating FFO | $ | 41,313 | $ | 62,334 | $ | 121,880 | $ | 182,290 | |||||||
| If-Converted Method (adjustments for interest, pre-tax): | |||||||||||||||
| 3.625% Puttable Senior Notes due 2014 | — | 1,812 | 2,083 | 5,438 | |||||||||||
| 5.00% Convertible Senior Notes due 2016 | 625 | 625 | 1,875 | 1,875 | |||||||||||
| 4.25% Convertible Senior Notes due 2018 | 3,719 | 3,719 | 11,157 | 11,157 | |||||||||||
| 3.625% Convertible Senior Notes due 2020 | 2,718 | — | 3,078 | — | |||||||||||
| Operating FFO for per share data | $ | 48,375 | $ | 68,490 | $ | 140,073 | $ | 200,760 | |||||||
| Denominator | |||||||||||||||
| Weighted average shares outstanding - Diluted | 235,442,842 | 222,444,795 | 227,387,739 | 222,063,138 | |||||||||||
| Operating FFO Per Share | $ | 0.21 | $ | 0.31 | $ | 0.62 | $ | 0.90 | |||||||
30
Forest City Enterprises, Inc. and Subsidiaries
Supplemental Operating Information
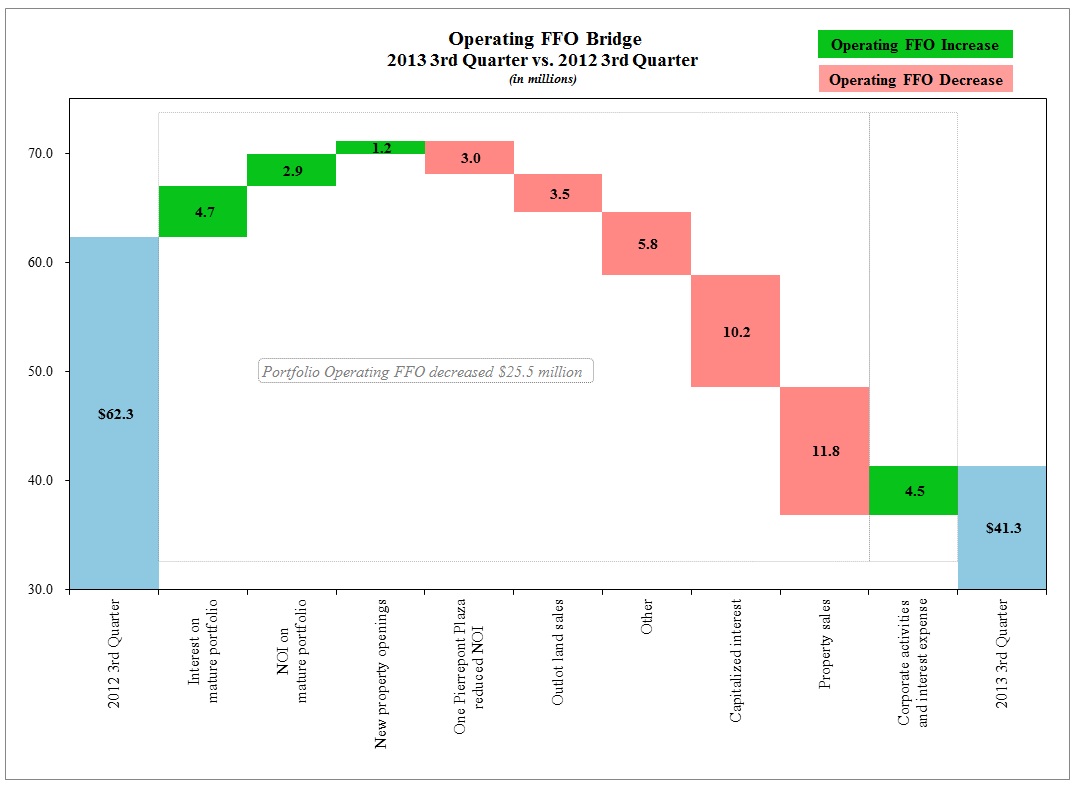
31
Forest City Enterprises, Inc. and Subsidiaries
Supplemental Operating Information
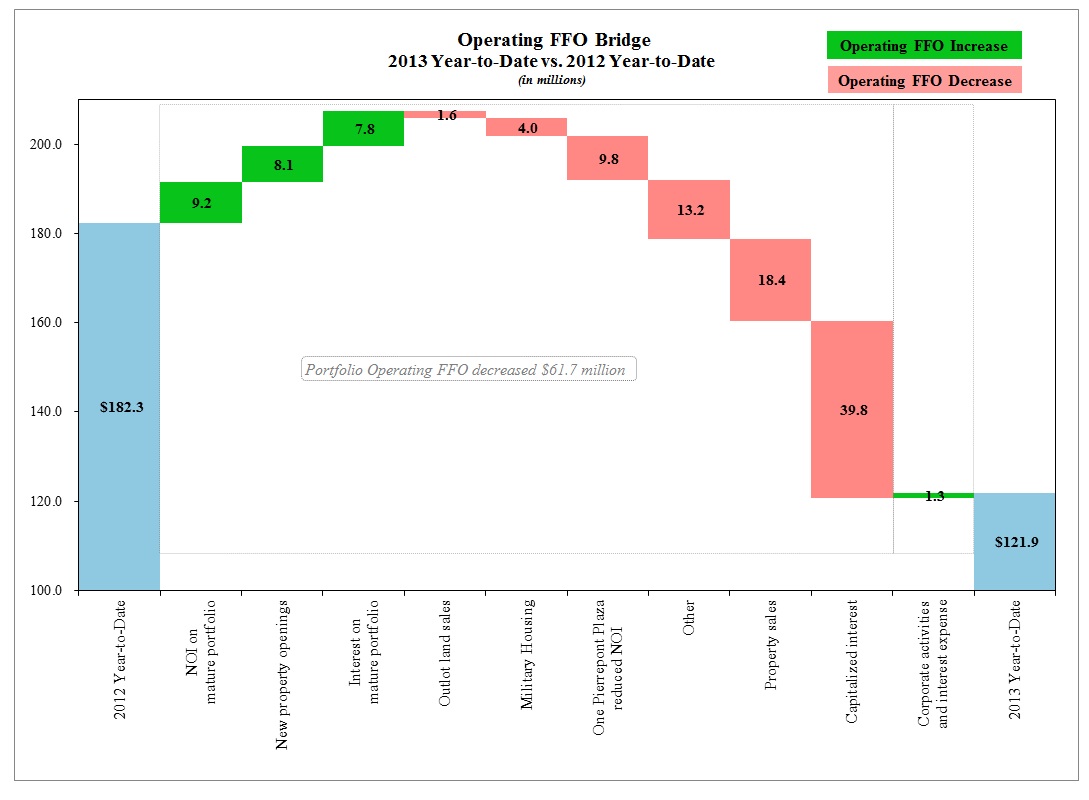
32
(THIS PAGE INTENTIONALLY LEFT BLANK)
33
Forest City Enterprises, Inc. and Subsidiaries
Supplemental Operating Information
Reconciliation of Net Earnings (Loss) to FFO
The table below reconciles net earnings (loss), the most comparable GAAP measure, to FFO, a non-GAAP measure.
| Three Months Ended October 31, | Nine Months Ended October 31, | ||||||||||||
| 2013 | 2012 | 2013 | 2012 | ||||||||||
| (in thousands) | |||||||||||||
| Net earnings (loss) attributable to Forest City Enterprises, Inc. | $ | 153,329 | $ | (1,078 | ) | $ | 117,680 | $ | (22,043 | ) | |||
| Depreciation and Amortization—Real Estate Groups | 96,609 | 73,526 | 283,012 | 216,436 | |||||||||
| Impairment of depreciable rental properties | 87,317 | 30,364 | 95,372 | 35,304 | |||||||||
| Gain on disposition of rental properties | (526,555 | ) | (19,299 | ) | (567,245 | ) | (43,320 | ) | |||||
Income tax expense (benefit) adjustments — current and deferred (2) | |||||||||||||
| Gain on disposition of rental properties | 204,162 | 7,893 | 220,993 | 17,174 | |||||||||
| Impairment of depreciable rental properties | (33,864 | ) | (11,776 | ) | (36,988 | ) | (13,692 | ) | |||||
| FFO | $ | (19,002 | ) | $ | 79,630 | $ | 112,824 | $ | 189,859 | ||||
| FFO Per Share - Diluted | |||||||||||||
Numerator (in thousands): | |||||||||||||
| FFO | $ | (19,002 | ) | $ | 79,630 | $ | 112,824 | $ | 189,859 | ||||
| If-Converted Method (adjustments for interest, net of tax): | |||||||||||||
| 3.625% Puttable Senior Notes due 2014 | — | 1,110 | 1,275 | 3,329 | |||||||||
| 5.000% Convertible Senior Notes due 2016 | — | 382 | 1,148 | 1,148 | |||||||||
| 4.250% Convertible Senior Notes due 2018 | — | 2,277 | 6,830 | 6,830 | |||||||||
| 3.625% Convertible Senior Notes due 2020 | — | — | 1,884 | — | |||||||||
| FFO for per share data | $ | (19,002 | ) | $ | 83,399 | $ | 123,961 | $ | 201,166 | ||||
| Denominator | |||||||||||||
| Weighted average shares outstanding—Basic | 197,721,350 | 170,777,898 | 192,512,992 | 169,817,482 | |||||||||
| Effect of stock options, restricted stock and performance shares | — | 1,220,010 | 1,460,461 | 965,683 | |||||||||
| Effect of convertible preferred stock | — | 13,300,629 | 108,334 | 14,133,715 | |||||||||
| Effect of convertible debt | — | 33,499,503 | 29,659,197 | 33,499,503 | |||||||||
| Effect of convertible Class A Common Units | — | 3,646,755 | 3,646,755 | 3,646,755 | |||||||||
Weighted average shares outstanding - Diluted (1) | 197,721,350 | 222,444,795 | 227,387,739 | 222,063,138 | |||||||||
| FFO Per Share | $ | (0.10 | ) | $ | 0.37 | $ | 0.55 | $ | 0.91 | ||||
(1) | For the three months ended October 31, 2013, the effect of 37,721,492 shares of dilutive securities was not included in the computation of diluted FFO per share because their effect is anti-dilutive due to the negative FFO for the quarter. As a result, an adjustment to FFO is not required for interest expense of $4,323,000 related to these securities. |
| (2) | The following table provides detail of Income Tax Expense (Benefit): |
| Three Months Ended October 31, | Nine Months Ended October 31, | ||||||||||||
| 2013 | 2012 | 2013 | 2012 | ||||||||||
| (in thousands) | |||||||||||||
| Current taxes | |||||||||||||
| Operating earnings | $ | (33,612 | ) | $ | (23,239 | ) | $ | (67,683 | ) | $ | (28,345 | ) | |
| Gain on disposition of rental properties | 62,763 | (565 | ) | 75,364 | (21,732 | ) | |||||||
| Subtotal | 29,151 | (23,804 | ) | 7,681 | (50,077 | ) | |||||||
| Discontinued operations | |||||||||||||
| Operating earnings | (79 | ) | 1,704 | 1,740 | 3,166 | ||||||||
| Gain on disposition of rental properties | (12,367 | ) | 15,961 | 4,616 | 21,592 | ||||||||
| Subtotal | (12,446 | ) | 17,665 | 6,356 | 24,758 | ||||||||
| Total Current taxes | 16,705 | (6,139 | ) | 14,037 | (25,319 | ) | |||||||
| Deferred taxes | |||||||||||||
| Operating earnings | (35,659 | ) | 15,743 | (29,836 | ) | 15,265 | |||||||
| Gain on disposition of full or partial interests in rental properties | 141,016 | (252 | ) | 127,665 | 26,966 | ||||||||
| Impairment of depreciable rental properties | (33,864 | ) | (11,712 | ) | (36,988 | ) | (12,042 | ) | |||||
| Subtotal | 71,493 | 3,779 | 60,841 | 30,189 | |||||||||
| Discontinued operations | |||||||||||||
| Operating earnings | (43 | ) | (208 | ) | (398 | ) | 262 | ||||||
| Gain on disposition of rental properties | 12,750 | (7,251 | ) | 13,348 | (9,652 | ) | |||||||
| Impairment of real estate | — | (64 | ) | — | (1,650 | ) | |||||||
| Subtotal | 12,707 | (7,523 | ) | 12,950 | (11,040 | ) | |||||||
| Total Deferred taxes | 84,200 | (3,744 | ) | 73,791 | 19,149 | ||||||||
| Grand Total | $ | 100,905 | $ | (9,883 | ) | $ | 87,828 | $ | (6,170 | ) | |||
34
Forest City Enterprises, Inc. and Subsidiaries
Supplemental Operating Information
Retail Lease Expirations as of October 31, 2013
| EXPIRATION YEAR | NUMBER OF EXPIRING LEASES | SQUARE FEET OF EXPIRING LEASES (1) | PERCENTAGE OF TOTAL LEASED GLA | CONTRACTUAL RENT EXPIRING (2) | PERCENTAGE OF TOTAL CONTRACTUAL RENT | AVERAGE CONTRACTUAL RENT PER SQUARE FEET EXPIRING (1) | |||||||||
| 2013 | 151 | 614,231 | 5.20 | % | $ | 12,054,884 | 4.32 | % | $ | 33.80 | |||||
| 2014 | 336 | 1,043,008 | 8.83 | 25,155,196 | 9.01 | 42.92 | |||||||||
| 2015 | 254 | 975,977 | 8.26 | 22,772,898 | 8.16 | 40.22 | |||||||||
| 2016 | 288 | 1,297,518 | 10.99 | 35,292,328 | 12.65 | 50.70 | |||||||||
| 2017 | 207 | 1,274,104 | 10.79 | 30,503,802 | 10.93 | 37.88 | |||||||||
| 2018 | 182 | 768,033 | 6.50 | 22,152,519 | 7.94 | 40.95 | |||||||||
| 2019 | 129 | 1,028,680 | 8.71 | 20,984,860 | 7.52 | 34.87 | |||||||||
| 2020 | 89 | 711,578 | 6.02 | 16,504,787 | 5.91 | 40.90 | |||||||||
| 2021 | 137 | 1,192,003 | 10.09 | 30,912,639 | 11.08 | 43.59 | |||||||||
| 2022 | 98 | 836,739 | 7.08 | 20,327,680 | 7.28 | 36.43 | |||||||||
| 2023 | 66 | 573,829 | 4.86 | 14,221,662 | 5.10 | 36.46 | |||||||||
| Thereafter | 47 | 1,496,741 | 12.67 | 28,202,779 | 10.10 | 28.75 | |||||||||
| Total | 1,984 | 11,812,441 | 100.00 | % | $ | 279,086,034 | 100.00 | % | $ | 39.08 | |||||
| (1) | Square feet of expiring leases and average contractual rent per square feet are operating statistics that represent 100% of the square footage and contractual rental income per square foot from expiring leases. |
| (2) | Contractual rent expiring is an operating statistic and is not comparable to rental revenue, a GAAP financial measure. The primary differences arise because contractual rent is determined using the tenant’s contractual rental agreements at our ownership share as determined within the rent agreement and it does not include adjustments such as the impact of straight-line rent, amortization of intangible assets related to in-place leases, above and below market leases, and contingent rental payments (which are not reasonably estimable). Contractual rent per square feet includes base rent, fixed additional charges for marketing/promotional charges, common area maintenance and real estate taxes. |
Retail Lease Expirations
Percentage of Contractual Rent Expiring
As of October 31, 2013
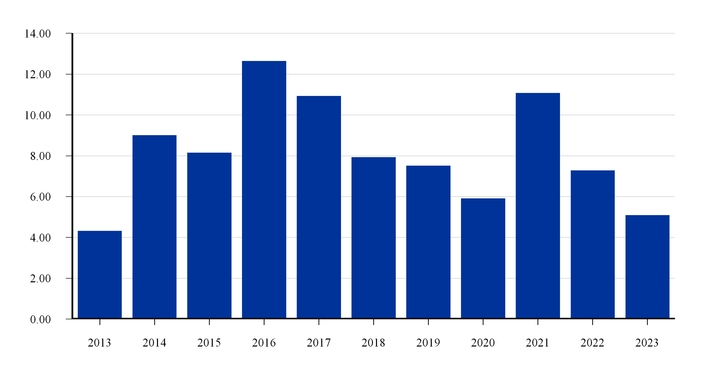
35
Forest City Enterprises, Inc. and Subsidiaries
Supplemental Operating Information
Office Lease Expirations as of October 31, 2013
| EXPIRATION YEAR | NUMBER OF EXPIRING LEASES | SQUARE FEET OF EXPIRING LEASES (1) | PERCENTAGE OF TOTAL LEASED GLA | CONTRACTUAL RENT EXPIRING (2) | PERCENTAGE OF TOTAL CONTRACTUAL RENT | AVERAGE CONTRACTUAL RENT PER SQUARE FEET EXPIRING (1) | |||||||||
| 2013 | 19 | 78,928 | 0.78 | % | $ | 2,012,050 | 0.59 | % | $ | 28.12 | |||||
| 2014 | 76 | 947,109 | 9.40 | 23,608,739 | 6.89 | 38.54 | |||||||||
| 2015 | 60 | 525,223 | 5.21 | 11,910,349 | 3.48 | 26.69 | |||||||||
| 2016 | 77 | 1,107,820 | 10.99 | 29,102,372 | 8.50 | 37.20 | |||||||||
| 2017 | 39 | 356,123 | 3.53 | 8,396,732 | 2.45 | 25.87 | |||||||||
| 2018 | 47 | 1,342,251 | 13.32 | 47,202,714 | 13.78 | 40.97 | |||||||||
| 2019 | 29 | 789,711 | 7.84 | 19,314,647 | 5.64 | 32.96 | |||||||||
| 2020 | 12 | 1,206,182 | 11.97 | 43,303,901 | 12.64 | 48.34 | |||||||||
| 2021 | 13 | 629,242 | 6.25 | 18,266,406 | 5.33 | 33.47 | |||||||||
| 2022 | 15 | 336,048 | 3.34 | 12,989,571 | 3.79 | 41.01 | |||||||||
| 2023 | 15 | 593,683 | 5.89 | 35,132,382 | 10.26 | 59.68 | |||||||||
| Thereafter | 28 | 2,164,309 | 21.48 | 91,282,097 | 26.65 | 45.06 | |||||||||
| Total | 430 | 10,076,629 | 100.00 | % | $ | 342,521,960 | 100.00 | % | $ | 40.72 | |||||
| (1) | Square feet of expiring leases and average contractual rent per square feet are operating statistics that represent 100% of the square footage and contractual rental income per square foot from expiring leases. |
| (2) | Contractual rent expiring is an operating statistic and is not comparable to rental revenue, a GAAP financial measure. The primary differences arise because contractual rent is determined using the tenant’s contractual rental agreements at our ownership share as determined within the rent agreement and it does not include adjustments such as the impact of straight-line rent, amortization of intangible assets related to in-place leases, above and below market leases, and contingent rental payments (which are not reasonably estimable). Contractual rent per square feet includes base rent, common area maintenance and real estate taxes. |
Office Lease Expirations
Percentage of Contractual Rent Expiring
As of October 31, 2013
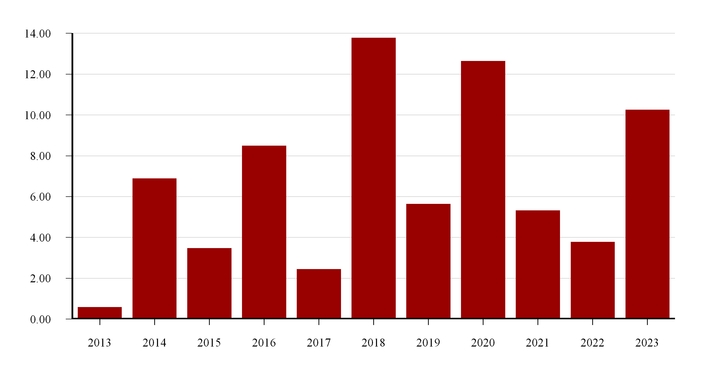
36
Forest City Enterprises, Inc. and Subsidiaries
Supplemental Operating Information
Development Pipeline
Property Openings and Projects Under Construction
as of October 31, 2013
| 2013 Property Openings | Location | Date Opened/Anticipated Opening | FCE Legal Ownership % (a) | Pro-Rata FCE % (a) (1) | Cost at Full Consolidation (GAAP) (b) | Total Cost at 100% (2) | Cost at FCE Pro-Rata Share (Non-GAAP) (c) (1) X (2) | Sq. ft./ No. of Units | Gross Leasable Area | Lease Commitment % (d) | |||||||||||||||
| (in millions) | |||||||||||||||||||||||||
| Residential: | |||||||||||||||||||||||||
| The Continental | Dallas, TX | Q1-13 | 100 | % | 100 | % | $ | 54.8 | $ | 54.8 | $ | 54.8 | 203 | 5,000 | 67% | ||||||||||
| 1111 Stratford | Stratford, CT | Q3-13/Q1-14 | 100 | % | 100 | % | 23.5 | 23.5 | 23.5 | 128 | — | 13% | |||||||||||||
| Aster Conservatory Green (Northfield) | Denver, CO | Q3-13/14 | 90 | % | 90 | % | 50.0 | 50.0 | 45.0 | 352 | — | 15% | |||||||||||||
| $ | 128.3 | $ | 128.3 | $ | 123.3 | 683 | 5,000 | ||||||||||||||||||
Retail Center: | |||||||||||||||||||||||||
| The Yards - Lumber Shed | Washington, D.C. | Q3-13 | 100 | % | 100 | % | $ | 15.7 | $ | 15.7 | $ | 15.7 | 32,000 | 32,000 | 80% | ||||||||||
| Total 2013 Openings | $ | 144.0 | $ | 144.0 | $ | 139.0 | |||||||||||||||||||
| Projects Under Construction | |||||||||||||||||||||||||
| Residential: | |||||||||||||||||||||||||
| Radian (120 Kingston) | Boston, MA | Q2-14 | 50 | % | (e) | 50 | % | $ | 0.0 | $ | 134.2 | $ | 67.1 | 240 | 5,000 | ||||||||||
| 2175 Market Street | San Francisco, CA | Q3-14 | 25 | % | 25 | % | 41.5 | 41.5 | 10.4 | 88 | 6,000 | ||||||||||||||
| The Yards - Twelve12 | Washington, D.C. | Q3-14 | 80 | % | (f) | 100 | % | 121.4 | 121.4 | 121.4 | 218 | 88,000 | Retail: 92% | ||||||||||||
| Winchester Lofts | New Haven, CT | Q3-14 | 90 | % | 90 | % | 58.8 | 58.8 | 53.0 | 158 | — | ||||||||||||||
| 3700M (West Village) | Dallas, TX | Q3-14/Q4-14 | 25 | % | (e) | 25 | % | 0.0 | 88.8 | 22.2 | 381 | — | |||||||||||||
| Atlantic Yards - B2 BKLYN | Brooklyn, NY | Q4-14 | 25 | % | 25 | % | 183.9 | 183.9 | 46.0 | 363 | 4,000 | ||||||||||||||
| Total Projects Under Construction | $ | 405.6 | $ | 628.6 | $ | 320.1 | 1,448 | 103,000 | |||||||||||||||||
| Fee Development Project (g) | |||||||||||||||||||||||||
| Dept. of Health & Mental Hygiene (DHMH) | Baltimore, MD | Q2-14 | - | - | $ | 0.0 | $ | 138.0 | $ | 0.0 | 234,000 | ||||||||||||||
| (a) | As is customary within the real estate industry, the Company invests in certain real estate projects through joint ventures. For certain projects, the Company provides funding at percentages that differ from the Company's legal ownership. |
| (b) | Amounts represent estimated project costs to achieve stabilization and are presented on the full consolidation method of accounting, a GAAP measure. Under full consolidation, costs are reported as consolidated at 100% if we are deemed to have control or to be the primary beneficiary of our investments in the Company's VIE. |
| (c) | Project cost at pro-rata share represents the Company's share of project cost, based on the Company's pro-rata ownership of each property (a non-GAAP measure). Under the pro-rata consolidation method of accounting, the Company determines its pro-rata share by multiplying its pro-rata ownership by the total project cost of the applicable property. |
| (d) | Lease commitments as of November 25, 2013. |
| (e) | Reported under the equity method of accounting. This method represents a GAAP measure for investments in which the Company is not deemed to have control or to be the primary beneficiary of our investments in a VIE. |
| (f) | Represents legal ownership of the residential units. Legal ownership for the retail space is 100%. |
| (g) | This is a fee development project in which the Company has no ownership interests. Therefore, these costs are not included on the full consolidation or pro-rata balance sheet. |
37
Forest City Enterprises, Inc. and Subsidiaries
Supplemental Operating Information
Development Pipeline
Projects Under Development
as of October 31, 2013
Below is a summary of our active large scale development projects, referred to as our “shadow pipeline,” which are crucial to our long-term growth. While we cannot make any assurances on the timing or delivery of these projects, our track record speaks to our ability to bring large, complex projects to fruition when there is demand and available construction financing. The projects listed below represent pro-rata costs of $678.9 million ($869.4 million at full consolidation) of Projects Under Development on our balance sheet and pro-rata mortgage debt of $180.0 million ($239.7 million at full consolidation).
| 1) | Atlantic Yards - Brooklyn, NY |
Atlantic Yards, a 22-acre mixed-use project, is located adjacent to the state-of-the-art arena, Barclays Center. At full build-out, Atlantic Yards is expected to feature more than 6,400 units of housing, including 2,250 affordable units, approximately 250,000 square feet of retail space, and more than 8 acres of landscaped open space. Construction is underway on the first residential tower, B2 BKLYN, which is expected to open in Q4-2014. We previously announced that we were seeking joint venture partners for the remaining future development. In October 2013, we announced the signing of a non-binding memorandum of understanding with an exclusivity period expiring December 15, 2013 (the “MOU”) with Shanghai-based Greenland Group Co. for a proposed joint venture to develop the full build-out of Atlantic Yards, including investments in infrastructure, a platform and residential units, but excluding the Barclays Center and B2 BKLYN.
Under the proposed joint venture, the Greenland Group would acquire 70% of the project, co-develop the project with Forest City, and share in the entire project costs going forward at the same percentage interest. Forest City would manage the day-to-day activities on behalf of the joint venture, which would develop the project consistent with the approved master plan. Negotiations are ongoing but we cannot give assurance that a binding agreement with the Greenland Group will be reached. Even if an agreement was reached, it would be subject to necessary regulatory approvals.
Whether we are successful in reaching agreement with the Greenland Group or another third party investor, there is a risk that we could grant joint control or otherwise lose control of the resulting joint venture. If that were to occur we may be required to deconsolidate the joint venture and its allocation of the site acquisition costs. Upon deconsolidation, our investment balance in the joint venture would be compared to estimated fair value and recorded at the lesser of fair value or book value. If this were to occur, we estimate that an impairment charge would be required ranging from $250 million to $350 million.
| 2) | The Yards - Washington, D.C. |
The Yards is a 42-acre mixed-use project, located in the neighborhood of the Washington Nationals baseball park in the Capitol Riverfront District. At full build-out, the project is expected to include up to 2,700 residential units, 1.8 million square feet of office space and 300,000 square feet of retail and dining space. The Yards features a 5.5-acre publicly funded public park that is a gathering place and recreational focus for the community. Current completed projects include Foundry Lofts, Boilermaker Shops and Lumber Shed. Additionally, Twelve12 is currently under construction.
| 3) | The Science + Technology Park at Johns Hopkins - Baltimore, MD |
The 31-acre Science + Technology Park at Johns Hopkins is a center for collaborative research directly adjacent to the world-renowned Johns Hopkins medical and research complex. Initial plans call for 1.1 million square feet in five buildings, with future phases that could support additional expansion. Current completed projects include 855 North Wolfe Street and a 492,000 square-foot parking garage for Johns Hopkins and the active buildings at the Science + Technology Park. Currently under construction is a 234,000 square-foot commercial building being developed on a fee basis which is expected to be fully leased by the Department of Health & Mental Hygiene (DHMH).
4) Waterfront Station - Washington, D.C.
Located in Southwest Washington, D.C., Waterfront Station is adjacent to the Waterfront/Southeastern University MetroRail station. Waterfront Station is expected to include 660,000 square feet of office space, an estimated 400 residential units and 40,000 square feet of retail stores and restaurants.
| 5) | 300 Massachusetts Avenue - Cambridge, MA |
Located in the science and technology hub of Cambridge, MA, the 300 Massachusetts Avenue block represents an expansion of University Park @ MIT. In a 50/50 partnership with MIT, Forest City is presently focused on a project that reflects a development program of approximately 260,000 square feet of lab and office space, which will be anchored by Millenium Pharmaceuticals. Demolition at the property commenced in November 2013. Potential redevelopment of the entire block is possible with the acquisition of adjacent parcels in future phases, and would result in an approximately 400,000 square-foot project.
38
Forest City Enterprises, Inc. and Subsidiaries
Supplemental Operating Information
Development Pipeline
Land Held for Development and Sale
as of October 31, 2013
Stapleton represents one of the nation’s largest urban redevelopments. At full build-out of 4,700 acres or 7.5 square miles, Stapleton is planned for more than 12,000 homes and apartments, a projected 3 million square feet of retail and 10 million square feet of office/research and development/industrial space. Centrally located 10 minutes east of Downtown Denver and 20 minutes from Denver International Airport, Stapleton is expected to be home to 30,000 residents and 35,000 workers when complete.
| Location | Gross Acres (1) | Saleable Acres (2) | Option Acres (3) | |||
| Stapleton - Denver, CO | 441 | 177 | 889 | |||
| (1) | Gross acres represent all acres currently owned, including those used for roadways, open spaces and parks. |
| (2) | Saleable acres represent the total of all acres owned and available for sale. We may choose to further develop some of the acres into completed sublots prior to sale. |
| (3) | Option acres are those acres we have a formal option to acquire. These options typically are in the form of purchase agreements with contingencies for the satisfaction of due diligence reviews. |
39
Forest City Enterprises, Inc. and Subsidiaries
Supplemental Operating Information
Military Housing
Property Openings and Projects Under Construction
as of October 31, 2013
The Company provides development, construction and management services for the following Military Housing projects and receives agreed upon fees for these services. The following summary includes Military Housing properties opened and those project phases having a percentage of units both opened and under construction:
| Property | Location | Dates Opened/Anticipated Opening | FCE Pro-Rata % | No. of Units | |
Military Housing | |||||
| Air Force Academy | Colorado Springs, CO | 2007-2011 | 50.00% | 427 | |
| Hawaii Phase IV (Under Construction) | Kaneohe, HI | 2007-2014 | * | 1,141 | |
| Marines, Hawaii Increment II | Honolulu, HI | 2007-2011 | * | 1,175 | |
| Midwest Millington | Memphis, TN | 2008-2011 | * | 318 | |
| Navy, Hawaii Increment III | Honolulu, HI | 2007-2011 | * | 2,520 | |
| Navy Midwest | Chicago, IL | 2006-2011 | * | 1,401 | |
| Ohana Military Communities, Hawaii Increment I | Honolulu, HI | 2005-2008 | * | 1,952 | |
| Pacific Northwest Communities | Seattle, WA | 2007-2011 | * | 2,985 | |
| Southern Group: | |||||
| Arnold Air Force Base | Tullahoma, TN | 2011-2013 | 0.0% | 22 | |
| Joint Base Charleston | Charleston, SC | 2011-2013 | 0.0% | 345 | |
| Keesler Air Force Base | Biloxi, MS | 2011-2012 | 0.0% | 1,188 | |
| Shaw Air Force Base (Under Construction) | Sumter, SC | 2011-2015 | 0.0% | 630 | |
| Total Military Housing Units | 14,104 | ||||
| *The Company's share of residual cash flow ranges from 0-20% during the life cycle of the project. | |||||
Summary of Military Housing Net Operating Income
Development and construction management fees related to our military housing projects are earned based on a contractual percentage of the actual development and construction costs incurred. We also recognize additional development and construction incentive fees upon successful completion of certain criteria, such as incentives to realize development cost savings, encourage small and local business participation, comply with specified safety standards and other project management incentives as specified in the development and construction agreements. NOI from development, construction and incentive fees was $3,279,000 and $5,666,000 for the three and nine months ended October 31, 2013, respectively, and $2,412,000 and $8,258,000 for the three and nine months ended October 31, 2012, respectively.
Property and asset management fees are earned based on a contractual percentage of the annual net rental income and annual operating income, respectively, that is generated by the military housing privatization projects as defined in the agreements. We also recognize certain property management incentive fees based upon successful completion of certain criteria as set forth in the property management agreements. Property management, management incentive and asset management fees generated NOI of $3,310,000 and $10,556,000 for the three and nine months ended October 31, 2013, respectively, and $3,555,000 and $10,786,000 for the three and nine months ended October 31, 2012, respectively.
40
Forest City Enterprises, Inc. and Subsidiaries
Supplemental Financial Information
Common Stock Data (NYSE: FCE A and FCE B)
The following summarizes information related to the Company’s Class A and Class B Common Stock based on information reported by the New York Stock Exchange:
| Quarter Ended | |||||||||||||||||||
October 31, 2013 | July 31, 2013 | April 30, 2013 | January 31, 2013 | October 31, 2012 | |||||||||||||||
| Class A Common Stock | |||||||||||||||||||
| Closing Price, end of quarter | $ | 20.26 | $ | 17.52 | $ | 18.67 | $ | 16.91 | $ | 16.05 | |||||||||
| High Closing Price | $ | 20.50 | $ | 20.25 | $ | 18.67 | $ | 17.33 | $ | 16.83 | |||||||||
| Low Closing Price | $ | 16.91 | $ | 17.15 | $ | 15.50 | $ | 13.97 | $ | 14.03 | |||||||||
| Average Closing Price | $ | 18.72 | $ | 18.58 | $ | 17.15 | $ | 15.95 | $ | 15.54 | |||||||||
| Total Volume | 67,320,220 | 71,921,030 | 72,555,200 | 56,909,509 | 47,754,037 | ||||||||||||||
| Average Volume | 1,035,696 | 1,123,766 | 1,189,430 | 917,895 | 758,001 | ||||||||||||||
| Common shares outstanding, end of quarter | 177,536,314 | 177,525,166 | 173,373,837 | 163,722,658 | 158,178,903 | ||||||||||||||
| Class B Common Stock | |||||||||||||||||||
| Closing Price, end of quarter | $ | 20.41 | $ | 17.75 | $ | 18.45 | $ | 16.90 | $ | 16.03 | |||||||||
| High Closing Price | $ | 20.41 | $ | 20.00 | $ | 18.45 | $ | 17.22 | $ | 16.86 | |||||||||
| Low Closing Price | $ | 16.87 | $ | 17.24 | $ | 15.73 | $ | 14.03 | $ | 14.06 | |||||||||
| Average Closing Price | $ | 18.66 | $ | 18.57 | $ | 17.10 | $ | 15.89 | $ | 15.50 | |||||||||
| Total Volume | 32,292 | 31,457 | 59,883 | 51,472 | 23,190 | ||||||||||||||
| Average Volume | 497 | 492 | 982 | 830 | 368 | ||||||||||||||
| Common shares outstanding, end of quarter | 20,191,151 | 20,194,160 | 20,216,683 | 20,235,273 | 20,251,569 | ||||||||||||||
| Common Equity Market Capitalization | $ | 4,008,987,114 | $ | 3,468,687,248 | $ | 3,609,887,338 | $ | 3,110,526,260 | $ | 2,863,404,044 | |||||||||
| Quarterly dividends declared per common share Class A and Class B | $ | — | $ | — | $ | — | $ | — | $ | — | |||||||||
Financial Covenants
The Company’s bank revolving credit facility contains certain restrictive financial covenants. A summary of the key financial covenants as defined in the agreement, all of which the Company is compliant with at October 31, 2013, follows:
Requirement Per Agreement | As of October 31, 2013 | As of July 31, 2013 | As of April 30, 2013 | As of January 31, 2013 | |||||||||||||||
| (dollars in thousands) | |||||||||||||||||||
Credit Facility Financial Covenants | |||||||||||||||||||
| Debt Service Coverage Ratio | 1.40x | 1.61x | 1.64x | 1.71x | 1.84x | ||||||||||||||
| Debt Yield Ratio | >9% | 11.82 | % | 11.29 | % | 11.29 | % | 12.32 | % | ||||||||||
| Cash Flow Coverage Ratio | 2.75x | 3.37x | 3.28x | 3.19x | 3.62x | ||||||||||||||
| Total Development Ratio | <17% | 8.90 | % | 8.89 | % | 8.53 | % | 8.61 | % | ||||||||||
| Minimum Consolidated Shareholders’ Equity, as defined | $ | 2,320,175 | $ | 3,845,750 | $ | 3,923,092 | $ | 3,812,603 | $ | 3,678,807 | |||||||||
Upon the redemption of the Senior Notes due 2034 on October 15, 2013, the Indenture dated May 19, 2003, which also contained certain restrictive financial covenants, was discharged by the Trustee. As a result, we no longer are required to comply with those financial covenants and therefore have excluded the applicable covenant results.
41
Forest City Enterprises, Inc. and Subsidiaries
Supplemental Financial Information
Scheduled Maturities Table: Nonrecourse Debt (dollars in thousands)
As of October 31, 2013
| Fiscal Year Ending January 31, 2014 | Fiscal Year Ending January 31, 2015 | ||||||||||||||||||||||||
| Full Consolidation | Less Noncontrolling Interest | Plus Unconsolidated Investments at Pro-Rata | Pro-Rata Consolidation | Full Consolidation | Less Noncontrolling Interest | Plus Unconsolidated Investments at Pro-Rata | Pro-Rata Consolidation | ||||||||||||||||||
| Fixed: | |||||||||||||||||||||||||
| Fixed-rate debt | $ | 8,417 | $ | 1,498 | $ | 10,023 | $ | 16,942 | $ | 151,734 | $ | 46,054 | $ | 326,305 | $ | 431,985 | |||||||||
| Weighted average rate | 5.73 | % | 9.09 | % | 5.45 | % | 5.27 | % | 7.01 | % | 10.85 | % | 5.54 | % | 5.49 | % | |||||||||
| Variable: | |||||||||||||||||||||||||
| Variable-rate debt | 3,473 | 24 | 524 | 3,973 | 604,548 | 98 | 26,341 | 630,791 | |||||||||||||||||
| Weighted average rate | 4.59 | % | 3.62 | % | 3.11 | % | 4.40 | % | 3.75 | % | 3.62 | % | 3.14 | % | 3.73 | % | |||||||||
| Tax-Exempt | 29,022 | 2,902 | 2,035 | 28,155 | 90,810 | — | — | 90,810 | |||||||||||||||||
| Weighted average rate | 1.58 | % | 1.58 | % | 1.45 | % | 1.57 | % | 2.71 | % | — | % | — | % | 2.71 | % | |||||||||
| Total variable-rate debt | 32,495 | 2,926 | 2,559 | 32,128 | 695,358 | 98 | 26,341 | 721,601 | |||||||||||||||||
| Total Nonrecourse Debt | $ | 40,912 | $ | 4,424 | $ | 12,582 | $ | 49,070 | $ | 847,092 | $ | 46,152 | $ | 352,646 | $ | 1,153,586 | |||||||||
| Weighted Average Rate | 2.69 | % | 4.13 | % | 4.70 | % | 3.08 | % | 4.23 | % | 10.83 | % | 5.36 | % | 4.31 | % | |||||||||
| Thereafter | Total | ||||||||||||||||||||||||
| Full Consolidation | Less Noncontrolling Interest | Plus Unconsolidated Investments at Pro-Rata | Pro-Rata Consolidation | Full Consolidation | Less Noncontrolling Interest | Plus Unconsolidated Investments at Pro-Rata | Pro-Rata Consolidation | ||||||||||||||||||
| Fixed: | |||||||||||||||||||||||||
| Fixed-rate debt | $ | 2,569,914 | $ | 399,364 | $ | 1,577,826 | $ | 3,748,376 | $ | 2,730,065 | $ | 446,916 | $ | 1,914,154 | $ | 4,197,303 | |||||||||
| Weighted average rate | 5.25 | % | 6.71 | % | 5.26 | % | 5.10 | % | 5.35 | % | 7.14 | % | 5.31 | % | 5.14 | % | |||||||||
| Variable: | |||||||||||||||||||||||||
| Variable-rate debt | 816,737 | 6,983 | 282,012 | 1,091,766 | 1,424,758 | 7,105 | 308,877 | 1,726,530 | |||||||||||||||||
| Weighted average rate | 5.67 | % | 3.10 | % | 3.06 | % | 5.01 | % | 4.85 | % | 3.11 | % | 3.06 | % | 4.54 | % | |||||||||
| Tax-Exempt | 364,608 | 36,183 | 217,837 | 546,262 | 484,440 | 39,085 | 219,872 | 665,227 | |||||||||||||||||
| Weighted average rate | 1.36 | % | 1.99 | % | 1.64 | % | 1.43 | % | 1.62 | % | 1.96 | % | 1.64 | % | 1.61 | % | |||||||||
| Total variable-rate debt | 1,181,345 | 43,166 | 499,849 | 1,638,028 | 1,909,198 | 46,190 | 528,749 | 2,391,757 | |||||||||||||||||
| Total Nonrecourse Debt | $ | 3,751,259 | $ | 442,530 | $ | 2,077,675 | $ | 5,386,404 | $ | 4,639,263 | $ | 493,106 | $ | 2,442,903 | $ | 6,589,060 | |||||||||
| Weighted Average Rate | 4.96 | % | 6.27 | % | 4.58 | % | 4.71 | % | 4.81 | % | 6.67 | % | 4.70 | % | 4.63 | % | |||||||||
42
Forest City Enterprises, Inc. and Subsidiaries
Supplemental Financial Information
Summary of Funds From Operations (FFO) - Three and Nine Months Ended October 31, 2013 (in thousands)
| Three Months Ended October 31, 2013 | Nine Months Ended October 31, 2013 | |||||||||||||||||||||||||||||||
Full Consolidation (GAAP) | Less Noncontrolling Interest | Plus Unconsolidated Investments at Pro-Rata | Plus Discontinued Operations | Pro-Rata Consolidation (Non-GAAP) | Full Consolidation (GAAP) | Less Noncontrolling Interest | Plus Unconsolidated Investments at Pro-Rata | Plus Discontinued Operations | Pro-Rata Consolidation (Non-GAAP) | |||||||||||||||||||||||
| Commercial Group | ||||||||||||||||||||||||||||||||
| Revenues from real estate operations | $ | 152,658 | $ | 5,146 | $ | 62,696 | $ | 137 | $ | 210,345 | $ | 534,412 | $ | 19,873 | $ | 177,391 | $ | 19,433 | $ | 711,363 | ||||||||||||
| Exclude straight-line rent adjustment | (4,689 | ) | — | — | 20 | (4,669 | ) | (12,076 | ) | — | — | (159 | ) | (12,235 | ) | |||||||||||||||||
| Adjusted revenues | 147,969 | 5,146 | 62,696 | 157 | 205,676 | 522,336 | 19,873 | 177,391 | 19,274 | 699,128 | ||||||||||||||||||||||
| Add interest and other income | 5,031 | 22 | 91 | — | 5,100 | 9,235 | 60 | 155 | 223 | 9,553 | ||||||||||||||||||||||
| Equity in earnings (loss) of unconsolidated entities | 40,498 | — | (40,641 | ) | — | (143 | ) | 48,135 | — | (49,959 | ) | — | (1,824 | ) | ||||||||||||||||||
| Net (gain) loss on land held for divestiture activity of unconsolidated entities | — | — | — | — | — | — | — | — | — | — | ||||||||||||||||||||||
| Exclude gain on disposition of unconsolidated entities | (34,281 | ) | — | 34,281 | — | — | (32,771 | ) | — | 32,771 | — | — | ||||||||||||||||||||
| Exclude depreciation and amortization of unconsolidated entities | 12,526 | — | (12,526 | ) | — | — | 33,342 | — | (33,342 | ) | — | — | ||||||||||||||||||||
| Exclude interest expense of unconsolidated entities | 18,228 | — | (18,228 | ) | — | — | 49,104 | — | (49,104 | ) | — | — | ||||||||||||||||||||
| Exclude (gain) loss on extinguishment of debt of unconsolidated entities | — | — | — | — | — | — | — | — | — | — | ||||||||||||||||||||||
| Adjusted total income | 189,971 | 5,168 | 25,673 | 157 | 210,633 | 629,381 | 19,933 | 77,912 | 19,497 | 706,857 | ||||||||||||||||||||||
| Operating expenses | 119,723 | 2,615 | 25,673 | 434 | 143,215 | 329,468 | 9,933 | 77,912 | 11,752 | 409,199 | ||||||||||||||||||||||
| Non-Real Estate depreciation and amortization | 221 | — | — | — | 221 | 713 | — | — | — | 713 | ||||||||||||||||||||||
| Exclude straight-line rent adjustment | 228 | — | — | — | 228 | (1,246 | ) | — | — | — | (1,246 | ) | ||||||||||||||||||||
| Adjusted operating expenses | 120,172 | 2,615 | 25,673 | 434 | 143,664 | 328,935 | 9,933 | 77,912 | 11,752 | 408,666 | ||||||||||||||||||||||
| Net operating income | 69,799 | 2,553 | — | (277 | ) | 66,969 | 300,446 | 10,000 | — | 7,745 | 298,191 | |||||||||||||||||||||
| Interest expense | (45,856 | ) | (1,793 | ) | (18,228 | ) | (16 | ) | (62,307 | ) | (152,611 | ) | (6,517 | ) | (49,104 | ) | (2,631 | ) | (197,829 | ) | ||||||||||||
| Interest expense of unconsolidated entities | (18,228 | ) | — | 18,228 | — | — | (49,104 | ) | — | 49,104 | — | — | ||||||||||||||||||||
| Gain (loss) on extinguishment of debt | — | — | — | — | — | 24,669 | — | — | — | 24,669 | ||||||||||||||||||||||
| Gain (loss) on extinguishment of debt of unconsolidated entities | — | — | — | — | — | — | — | — | — | — | ||||||||||||||||||||||
| Net gain (loss) on land held for divestiture activity | — | — | — | — | — | — | — | — | — | — | ||||||||||||||||||||||
| Net gain (loss) on land held for divestiture activity of unconsolidated entities | — | — | — | — | — | — | — | — | — | — | ||||||||||||||||||||||
| Impairment of consolidated non-depreciable real estate | (112,838 | ) | (15,462 | ) | — | — | (97,376 | ) | (112,838 | ) | (15,462 | ) | — | — | (97,376 | ) | ||||||||||||||||
| Amortization of mortgage procurement costs - Real Estate Groups | (2,092 | ) | — | — | — | (2,092 | ) | (7,094 | ) | — | — | (48 | ) | (7,142 | ) | |||||||||||||||||
| Net gain on change in control of interests | — | — | — | — | — | — | — | — | — | — | ||||||||||||||||||||||
| Straight-line rent adjustment | 4,917 | — | — | (20 | ) | 4,897 | 10,830 | — | — | 159 | 10,989 | |||||||||||||||||||||
| Noncontrolling interest in FFO | 14,702 | 14,702 | — | — | — | 11,979 | 11,979 | — | — | — | ||||||||||||||||||||||
| Pre-tax FFO from discontinued operations | (313 | ) | — | — | 313 | — | 5,225 | — | — | (5,225 | ) | — | ||||||||||||||||||||
| Pre-Tax FFO | (89,909 | ) | — | — | — | (89,909 | ) | 31,502 | — | — | — | 31,502 | ||||||||||||||||||||
| Income tax benefit (expense) on FFO | — | — | — | — | — | — | — | — | — | — | ||||||||||||||||||||||
| Funds From Operations (FFO) | $ | (89,909 | ) | $ | — | $ | — | $ | — | $ | (89,909 | ) | $ | 31,502 | $ | — | $ | — | $ | — | $ | 31,502 | ||||||||||
| Depreciation and amortization - Real Estate Groups | (67,665 | ) | — | — | — | (67,665 | ) | (198,741 | ) | — | — | (1,835 | ) | (200,576 | ) | |||||||||||||||||
| Gain (loss) on disposition of rental properties and partial interests in rental properties, net of noncontrolling interest | 491,160 | — | 34,281 | 1,114 | 526,555 | 496,092 | — | 32,771 | 22,354 | 551,217 | ||||||||||||||||||||||
| Gain (loss) on disposition of unconsolidated entities | 34,281 | — | (34,281 | ) | — | — | 32,771 | — | (32,771 | ) | — | — | ||||||||||||||||||||
| Impairment of consolidated and unconsolidated depreciable real estate | (87,317 | ) | — | — | — | (87,317 | ) | (94,187 | ) | — | — | — | (94,187 | ) | ||||||||||||||||||
| Non-FFO from discontinued operations | 1,114 | — | — | (1,114 | ) | — | 20,519 | — | — | (20,519 | ) | — | ||||||||||||||||||||
| Net earnings (loss) attributable to Forest City Enterprises, Inc. | $ | 281,664 | $ | — | $ | — | $ | — | $ | 281,664 | $ | 287,956 | $ | — | $ | — | $ | — | $ | 287,956 | ||||||||||||
43
Forest City Enterprises, Inc. and Subsidiaries
Supplemental Financial Information
Summary of Funds From Operations (FFO) - Three and Nine Months Ended October 31, 2013 (in thousands) (continued)
| Three Months Ended October 31, 2013 | Nine Months Ended October 31, 2013 | |||||||||||||||||||||||||||||||
Full Consolidation (GAAP) | Less Noncontrolling Interest | Plus Unconsolidated Investments at Pro-Rata | Plus Discontinued Operations | Pro-Rata Consolidation (Non-GAAP) | Full Consolidation (GAAP) | Less Noncontrolling Interest | Plus Unconsolidated Investments at Pro-Rata | Plus Discontinued Operations | Pro-Rata Consolidation (Non-GAAP) | |||||||||||||||||||||||
| Residential Group | ||||||||||||||||||||||||||||||||
| Revenues from real estate operations | $ | 73,814 | $ | 3,273 | $ | 40,755 | $ | — | $ | 111,296 | $ | 201,156 | $ | 7,685 | $ | 124,973 | $ | 1,231 | $ | 319,675 | ||||||||||||
| Exclude straight-line rent adjustment | 25 | — | — | — | 25 | 126 | — | — | — | 126 | ||||||||||||||||||||||
| Adjusted revenues | 73,839 | 3,273 | 40,755 | — | 111,321 | 201,282 | 7,685 | 124,973 | 1,231 | 319,801 | ||||||||||||||||||||||
| Add interest and other income | 5,054 | 144 | 32 | — | 4,942 | 17,600 | 432 | 199 | 1 | 17,368 | ||||||||||||||||||||||
| Equity in earnings (loss) of unconsolidated entities | 6,610 | 162 | (5,198 | ) | — | 1,250 | 15,235 | (644 | ) | (14,756 | ) | — | 1,123 | |||||||||||||||||||
| Net (gain) loss on land held for divestiture activity of unconsolidated entities | — | — | — | — | — | — | — | — | — | — | ||||||||||||||||||||||
| Exclude gain on disposition of unconsolidated entities | — | — | — | — | — | — | — | — | — | — | ||||||||||||||||||||||
| Exclude depreciation and amortization of unconsolidated entities | 6,843 | — | (6,843 | ) | — | — | 23,400 | — | (23,400 | ) | — | — | ||||||||||||||||||||
| Exclude interest expense of unconsolidated entities | 7,838 | — | (7,838 | ) | — | — | 26,048 | — | (26,048 | ) | — | — | ||||||||||||||||||||
| Exclude (gain) loss on extinguishment of debt of unconsolidated entities | 50 | — | (50 | ) | — | — | 57 | — | (57 | ) | — | — | ||||||||||||||||||||
| Adjusted total income | 100,234 | 3,579 | 20,858 | — | 117,513 | 283,622 | 7,473 | 60,911 | 1,232 | 338,292 | ||||||||||||||||||||||
| Operating expenses | 53,089 | 1,917 | 20,858 | — | 72,030 | 149,829 | 5,913 | 60,911 | 810 | 205,637 | ||||||||||||||||||||||
| Non-Real Estate depreciation and amortization | 120 | — | — | — | 120 | 376 | — | — | — | 376 | ||||||||||||||||||||||
| Exclude straight-line rent adjustment | 14 | — | — | — | 14 | 14 | — | — | — | 14 | ||||||||||||||||||||||
| Adjusted operating expenses | 53,223 | 1,917 | 20,858 | — | 72,164 | 150,219 | 5,913 | 60,911 | 810 | 206,027 | ||||||||||||||||||||||
| Net operating income | 47,011 | 1,662 | — | — | 45,349 | 133,403 | 1,560 | — | 422 | 132,265 | ||||||||||||||||||||||
| Interest expense | (2,647 | ) | (164 | ) | (7,838 | ) | — | (10,321 | ) | (25,306 | ) | (594 | ) | (26,048 | ) | (146 | ) | (50,906 | ) | |||||||||||||
| Interest expense of unconsolidated entities | (7,838 | ) | — | 7,838 | — | — | (26,048 | ) | — | 26,048 | — | — | ||||||||||||||||||||
| Gain (loss) on extinguishment of debt | (20 | ) | — | (50 | ) | — | (70 | ) | (232 | ) | — | (57 | ) | (36 | ) | (325 | ) | |||||||||||||||
| Gain (loss) on extinguishment of debt of unconsolidated entities | (50 | ) | — | 50 | — | — | (57 | ) | — | 57 | — | — | ||||||||||||||||||||
| Net gain (loss) on land held for divestiture activity | — | — | — | — | — | — | — | — | — | — | ||||||||||||||||||||||
| Net gain (loss) on land held for divestiture activity of unconsolidated entities | — | — | — | — | — | — | — | — | — | — | ||||||||||||||||||||||
| Impairment of consolidated non-depreciable real estate | — | — | — | — | — | — | — | — | — | — | ||||||||||||||||||||||
| Amortization of mortgage procurement costs - Real Estate Groups | (681 | ) | — | — | — | (681 | ) | (2,088 | ) | — | — | (2 | ) | (2,090 | ) | |||||||||||||||||
| Net gain on change in control of interests | — | — | — | — | — | 2,762 | — | — | — | 2,762 | ||||||||||||||||||||||
| Straight-line rent adjustment | (11 | ) | — | — | — | (11 | ) | (112 | ) | — | — | — | (112 | ) | ||||||||||||||||||
| Noncontrolling interest in FFO | (1,498 | ) | (1,498 | ) | — | — | — | (966 | ) | (966 | ) | — | — | — | ||||||||||||||||||
| Pre-tax FFO from discontinued operations | — | — | — | — | — | 238 | — | — | (238 | ) | — | |||||||||||||||||||||
| Pre-Tax FFO | 34,266 | — | — | — | 34,266 | 81,594 | — | — | — | 81,594 | ||||||||||||||||||||||
| Income tax benefit (expense) on FFO | — | — | — | — | — | — | — | — | — | — | ||||||||||||||||||||||
| Funds From Operations (FFO) | $ | 34,266 | $ | — | $ | — | $ | — | $ | 34,266 | $ | 81,594 | $ | — | $ | — | $ | — | $ | 81,594 | ||||||||||||
| Depreciation and amortization - Real Estate Groups | (21,754 | ) | — | — | — | (21,754 | ) | (64,952 | ) | — | — | (165 | ) | (65,117 | ) | |||||||||||||||||
| Gain (loss) on disposition of rental properties and partial interests in rental properties, net of noncontrolling interest | — | — | — | — | — | — | — | — | 16,028 | 16,028 | ||||||||||||||||||||||
| Gain (loss) on disposition of unconsolidated entities | — | — | — | — | — | — | — | — | — | — | ||||||||||||||||||||||
| Impairment of consolidated and unconsolidated depreciable real estate | — | — | — | — | — | (1,185 | ) | — | — | — | (1,185 | ) | ||||||||||||||||||||
| Non-FFO from discontinued operations | — | — | — | — | — | 15,863 | — | — | (15,863 | ) | — | |||||||||||||||||||||
| Net earnings (loss) attributable to Forest City Enterprises, Inc. | $ | 12,512 | $ | — | $ | — | $ | — | $ | 12,512 | $ | 31,320 | $ | — | $ | — | $ | — | $ | 31,320 | ||||||||||||
44
Forest City Enterprises, Inc. and Subsidiaries
Supplemental Financial Information
Summary of Funds From Operations (FFO) - Three and Nine Months Ended October 31, 2013 (in thousands) (continued)
| Three Months Ended October 31, 2013 | Nine Months Ended October 31, 2013 | |||||||||||||||||||||||||||||||
Full Consolidation (GAAP) | Less Noncontrolling Interest | Plus Unconsolidated Investments at Pro-Rata | Plus Discontinued Operations | Pro-Rata Consolidation (Non-GAAP) | Full Consolidation (GAAP) | Less Noncontrolling Interest | Plus Unconsolidated Investments at Pro-Rata | Plus Discontinued Operations | Pro-Rata Consolidation (Non-GAAP) | |||||||||||||||||||||||
| Arena | ||||||||||||||||||||||||||||||||
| Revenues from real estate operations | $ | 28,403 | $ | 12,808 | $ | — | $ | — | $ | 15,595 | $ | 78,687 | $ | 35,514 | $ | — | $ | — | $ | 43,173 | ||||||||||||
| Exclude straight-line rent adjustment | — | — | — | — | — | — | — | — | — | — | ||||||||||||||||||||||
| Adjusted revenues | 28,403 | 12,808 | — | — | 15,595 | 78,687 | 35,514 | — | — | 43,173 | ||||||||||||||||||||||
| Add interest and other income | — | — | — | — | — | — | — | — | — | — | ||||||||||||||||||||||
| Equity in earnings (loss) of unconsolidated entities | — | — | — | — | — | — | — | — | — | — | ||||||||||||||||||||||
| Net (gain) loss on land held for divestiture activity of unconsolidated entities | — | — | — | — | — | — | — | — | — | — | ||||||||||||||||||||||
| Exclude gain on disposition of unconsolidated entities | — | — | — | — | — | — | — | — | — | — | ||||||||||||||||||||||
| Exclude depreciation and amortization of unconsolidated entities | — | — | — | — | — | — | — | — | — | — | ||||||||||||||||||||||
| Exclude interest expense of unconsolidated entities | — | — | — | — | — | — | — | — | — | — | ||||||||||||||||||||||
| Exclude (gain) loss on extinguishment of debt of unconsolidated entities | — | — | — | — | — | — | — | — | — | — | ||||||||||||||||||||||
| Adjusted total income | 28,403 | 12,808 | — | — | 15,595 | 78,687 | 35,514 | — | — | 43,173 | ||||||||||||||||||||||
| Operating expenses | 17,646 | 7,725 | — | — | 9,921 | 57,130 | 25,282 | — | — | 31,848 | ||||||||||||||||||||||
| Non-Real Estate depreciation and amortization | — | — | — | — | — | — | — | — | — | — | ||||||||||||||||||||||
| Exclude straight-line rent adjustment | — | — | — | — | — | — | — | — | — | — | ||||||||||||||||||||||
| Adjusted operating expenses | 17,646 | 7,725 | — | — | 9,921 | 57,130 | 25,282 | — | — | 31,848 | ||||||||||||||||||||||
| Net operating income | 10,757 | 5,083 | — | — | 5,674 | 21,557 | 10,232 | — | — | 11,325 | ||||||||||||||||||||||
| Interest expense | (9,920 | ) | (4,968 | ) | — | — | (4,952 | ) | (28,282 | ) | (14,225 | ) | — | — | (14,057 | ) | ||||||||||||||||
| Interest expense of unconsolidated entities | — | — | — | — | — | — | — | — | — | — | ||||||||||||||||||||||
| Gain (loss) on extinguishment of debt | — | — | — | — | — | — | — | — | — | — | ||||||||||||||||||||||
| Gain (loss) on extinguishment of debt of unconsolidated entities | — | — | — | — | — | — | — | — | — | — | ||||||||||||||||||||||
| Net gain (loss) on land held for divestiture activity | — | — | — | — | — | — | — | — | — | — | ||||||||||||||||||||||
| Net gain (loss) on land held for divestiture activity of unconsolidated entities | — | — | — | — | — | — | — | — | — | — | ||||||||||||||||||||||
| Impairment of consolidated non-depreciable real estate | — | — | — | — | — | — | — | — | — | — | ||||||||||||||||||||||
| Amortization of mortgage procurement costs - Real Estate Groups | (60 | ) | — | — | — | (60 | ) | (174 | ) | — | — | — | (174 | ) | ||||||||||||||||||
| Net gain on change in control of interests | — | — | — | — | — | — | — | — | — | — | ||||||||||||||||||||||
| Straight-line rent adjustment | — | — | — | — | — | — | — | — | — | — | ||||||||||||||||||||||
| Noncontrolling interest in FFO | (115 | ) | (115 | ) | — | — | — | 3,993 | 3,993 | — | — | — | ||||||||||||||||||||
| Pre-tax FFO from discontinued operations | — | — | — | — | — | — | — | — | — | — | ||||||||||||||||||||||
| Pre-Tax FFO | 662 | — | — | — | 662 | (2,906 | ) | — | — | — | (2,906 | ) | ||||||||||||||||||||
| Income tax benefit (expense) on FFO | — | — | — | — | — | — | — | — | — | — | ||||||||||||||||||||||
| Funds From Operations (FFO) | $ | 662 | $ | — | $ | — | $ | — | $ | 662 | $ | (2,906 | ) | $ | — | $ | — | $ | — | $ | (2,906 | ) | ||||||||||
| Depreciation and amortization - Real Estate Groups | (7,143 | ) | — | — | — | (7,143 | ) | (17,090 | ) | — | — | — | (17,090 | ) | ||||||||||||||||||
| Gain (loss) on disposition of rental properties and partial interests in rental properties, net of noncontrolling interest | — | — | — | — | — | — | — | — | — | — | ||||||||||||||||||||||
| Gain (loss) on disposition of unconsolidated entities | — | — | — | — | — | — | — | — | — | — | ||||||||||||||||||||||
| Impairment of consolidated and unconsolidated depreciable real estate | — | — | — | — | — | — | — | — | — | — | ||||||||||||||||||||||
| Non-FFO from discontinued operations | — | — | — | — | — | — | — | — | — | — | ||||||||||||||||||||||
| Net earnings (loss) attributable to Forest City Enterprises, Inc. | $ | (6,481 | ) | $ | — | $ | — | $ | — | $ | (6,481 | ) | $ | (19,996 | ) | $ | — | $ | — | $ | — | $ | (19,996 | ) | ||||||||
45
Forest City Enterprises, Inc. and Subsidiaries
Supplemental Financial Information
Summary of Funds From Operations (FFO) - Three and Nine Months Ended October 31, 2013 (in thousands) (continued)
| Three Months Ended October 31, 2013 | Nine Months Ended October 31, 2013 | |||||||||||||||||||||||||||||||
Full Consolidation (GAAP) | Less Noncontrolling Interest | Plus Unconsolidated Investments at Pro-Rata | Plus Discontinued Operations | Pro-Rata Consolidation (Non-GAAP) | Full Consolidation (GAAP) | Less Noncontrolling Interest | Plus Unconsolidated Investments at Pro-Rata | Plus Discontinued Operations | Pro-Rata Consolidation (Non-GAAP) | |||||||||||||||||||||||
| Land Group | ||||||||||||||||||||||||||||||||
| Revenues from real estate operations | $ | 11,352 | $ | 1,198 | $ | 140 | $ | — | $ | 10,294 | $ | 39,681 | $ | 4,016 | $ | 651 | $ | — | $ | 36,316 | ||||||||||||
| Exclude straight-line rent adjustment | — | — | — | — | — | — | — | — | — | — | ||||||||||||||||||||||
| Adjusted revenues | 11,352 | 1,198 | 140 | — | 10,294 | 39,681 | 4,016 | 651 | — | 36,316 | ||||||||||||||||||||||
| Add interest and other income | 3,726 | 368 | 1 | — | 3,359 | 9,999 | 982 | 11 | — | 9,028 | ||||||||||||||||||||||
| Equity in earnings (loss) of unconsolidated entities | (398 | ) | — | 397 | — | (1 | ) | 75 | — | 37 | — | 112 | ||||||||||||||||||||
| Net (gain) loss on land held for divestiture activity of unconsolidated entities | (186 | ) | — | 186 | — | — | (867 | ) | — | 867 | — | — | ||||||||||||||||||||
| Exclude gain on disposition of unconsolidated entities | — | — | — | — | — | — | — | — | — | — | ||||||||||||||||||||||
| Exclude depreciation and amortization of unconsolidated entities | 21 | — | (21 | ) | — | — | 142 | — | (142 | ) | — | — | ||||||||||||||||||||
| Exclude interest expense of unconsolidated entities | 92 | — | (92 | ) | — | — | 279 | — | (279 | ) | — | — | ||||||||||||||||||||
| Exclude (gain) loss on extinguishment of debt of unconsolidated entities | — | — | — | — | — | — | — | — | — | — | ||||||||||||||||||||||
| Adjusted total income | 14,607 | 1,566 | 611 | — | 13,652 | 49,309 | 4,998 | 1,145 | — | 45,456 | ||||||||||||||||||||||
| Operating expenses | 7,162 | 747 | 611 | — | 7,026 | 28,547 | 2,600 | 1,145 | — | 27,092 | ||||||||||||||||||||||
| Non-Real Estate depreciation and amortization | 59 | — | — | — | 59 | 170 | — | — | — | 170 | ||||||||||||||||||||||
| Exclude straight-line rent adjustment | — | — | — | — | — | — | — | — | — | — | ||||||||||||||||||||||
| Adjusted operating expenses | 7,221 | 747 | 611 | — | 7,085 | 28,717 | 2,600 | 1,145 | — | 27,262 | ||||||||||||||||||||||
| Net operating income | 7,386 | 819 | — | — | 6,567 | 20,592 | 2,398 | — | — | 18,194 | ||||||||||||||||||||||
| Interest expense | (85 | ) | (25 | ) | (92 | ) | — | (152 | ) | 195 | (25 | ) | (279 | ) | — | (59 | ) | |||||||||||||||
| Interest expense of unconsolidated entities | (92 | ) | — | 92 | — | — | (279 | ) | — | 279 | — | — | ||||||||||||||||||||
| Gain (loss) on extinguishment of debt | — | — | — | — | — | — | — | — | — | — | ||||||||||||||||||||||
| Gain (loss) on extinguishment of debt of unconsolidated entities | — | — | — | — | — | — | — | — | — | — | ||||||||||||||||||||||
| Net gain (loss) on land held for divestiture activity | — | — | 186 | — | 186 | (7,555 | ) | (720 | ) | 867 | — | (5,968 | ) | |||||||||||||||||||
| Net gain (loss) on land held for divestiture activity of unconsolidated entities | 186 | — | (186 | ) | — | — | 867 | — | (867 | ) | — | — | ||||||||||||||||||||
| Impairment of consolidated non-depreciable real estate | — | — | — | — | — | — | — | — | — | — | ||||||||||||||||||||||
| Amortization of mortgage procurement costs - Real Estate Groups | (5 | ) | — | — | — | (5 | ) | (20 | ) | — | — | — | (20 | ) | ||||||||||||||||||
| Net gain on change in control of interests | — | — | — | — | — | — | — | — | — | — | ||||||||||||||||||||||
| Straight-line rent adjustment | — | — | — | — | — | — | — | — | — | — | ||||||||||||||||||||||
| Noncontrolling interest in FFO | (794 | ) | (794 | ) | — | — | — | (1,653 | ) | (1,653 | ) | — | — | — | ||||||||||||||||||
| Pre-tax FFO from discontinued operations | — | — | — | — | — | — | — | — | — | — | ||||||||||||||||||||||
| Pre-Tax FFO | 6,596 | — | — | — | 6,596 | 12,147 | — | — | — | 12,147 | ||||||||||||||||||||||
| Income tax benefit (expense) on FFO | — | — | — | — | — | — | — | — | — | — | ||||||||||||||||||||||
| Funds From Operations (FFO) | $ | 6,596 | $ | — | $ | — | $ | — | $ | 6,596 | $ | 12,147 | $ | — | $ | — | $ | — | $ | 12,147 | ||||||||||||
| Depreciation and amortization - Real Estate Groups | (47 | ) | — | — | — | (47 | ) | (229 | ) | — | — | — | (229 | ) | ||||||||||||||||||
| Gain (loss) on disposition of rental properties and partial interests in rental properties, net of noncontrolling interest | — | — | — | — | — | — | — | — | — | — | ||||||||||||||||||||||
| Gain (loss) on disposition of unconsolidated entities | — | — | — | — | — | — | — | — | — | — | ||||||||||||||||||||||
| Impairment of consolidated and unconsolidated depreciable real estate | — | — | — | — | — | — | — | — | — | — | ||||||||||||||||||||||
| Non-FFO from discontinued operations | — | — | — | — | — | — | — | — | — | — | ||||||||||||||||||||||
| Net earnings (loss) attributable to Forest City Enterprises, Inc. | $ | 6,549 | $ | — | $ | — | $ | — | $ | 6,549 | $ | 11,918 | $ | — | $ | — | $ | — | $ | 11,918 | ||||||||||||
46
Forest City Enterprises, Inc. and Subsidiaries
Supplemental Financial Information
Summary of Funds From Operations (FFO) - Three and Nine Months Ended October 31, 2013 (in thousands) (continued)
| Three Months Ended October 31, 2013 | Nine Months Ended October 31, 2013 | |||||||||||||||||||||||||||||||
Full Consolidation (GAAP) | Less Noncontrolling Interest | Plus Unconsolidated Investments at Pro-Rata | Plus Discontinued Operations | Pro-Rata Consolidation (Non-GAAP) | Full Consolidation (GAAP) | Less Noncontrolling Interest | Plus Unconsolidated Investments at Pro-Rata | Plus Discontinued Operations | Pro-Rata Consolidation (Non-GAAP) | |||||||||||||||||||||||
| The Nets Group | ||||||||||||||||||||||||||||||||
| Revenues from real estate operations | $ | — | $ | — | $ | — | $ | — | $ | — | $ | — | $ | — | $ | — | $ | — | $ | — | ||||||||||||
| Exclude straight-line rent adjustment | — | — | — | — | — | — | — | — | — | — | ||||||||||||||||||||||
| Adjusted revenues | — | — | — | — | — | — | — | — | — | — | ||||||||||||||||||||||
| Add interest and other income | — | — | — | — | — | — | — | — | — | — | ||||||||||||||||||||||
| Equity in earnings (loss) of unconsolidated entities | (50 | ) | — | — | — | (50 | ) | (2,763 | ) | — | — | — | (2,763 | ) | ||||||||||||||||||
| Net (gain) loss on land held for divestiture activity of unconsolidated entities | — | — | — | — | — | — | — | — | — | — | ||||||||||||||||||||||
| Exclude gain on disposition of unconsolidated entities | — | — | — | — | — | — | — | — | — | — | ||||||||||||||||||||||
| Exclude depreciation and amortization of unconsolidated entities | — | — | — | — | — | — | — | — | — | — | ||||||||||||||||||||||
| Exclude interest expense of unconsolidated entities | — | — | — | — | — | — | — | — | — | — | ||||||||||||||||||||||
| Exclude (gain) loss on extinguishment of debt of unconsolidated entities | — | — | — | — | — | — | — | — | — | — | ||||||||||||||||||||||
| Adjusted total income | (50 | ) | — | — | — | (50 | ) | (2,763 | ) | — | — | — | (2,763 | ) | ||||||||||||||||||
| Operating expenses | — | — | — | — | — | — | — | — | — | — | ||||||||||||||||||||||
| Non-Real Estate depreciation and amortization | — | — | — | — | — | — | — | — | — | — | ||||||||||||||||||||||
| Exclude straight-line rent adjustment | — | — | — | — | — | — | — | — | — | — | ||||||||||||||||||||||
| Adjusted operating expenses | — | — | — | — | — | — | — | — | — | — | ||||||||||||||||||||||
| Net operating income | (50 | ) | — | — | — | (50 | ) | (2,763 | ) | — | — | — | (2,763 | ) | ||||||||||||||||||
| Interest expense | — | — | — | — | — | — | — | — | — | — | ||||||||||||||||||||||
| Interest expense of unconsolidated entities | — | — | — | — | — | — | — | — | — | — | ||||||||||||||||||||||
| Gain (loss) on extinguishment of debt | — | — | — | — | — | — | — | — | — | — | ||||||||||||||||||||||
| Gain (loss) on extinguishment of debt of unconsolidated entities | — | — | — | — | — | — | — | — | — | — | ||||||||||||||||||||||
| Net gain (loss) on land held for divestiture activity | — | — | — | — | — | — | — | — | — | — | ||||||||||||||||||||||
| Net gain (loss) on land held for divestiture activity of unconsolidated entities | — | — | — | — | — | — | — | — | — | — | ||||||||||||||||||||||
| Impairment of consolidated non-depreciable real estate | — | — | — | — | — | — | — | — | — | — | ||||||||||||||||||||||
| Amortization of mortgage procurement costs - Real Estate Groups | — | — | — | — | — | — | — | — | — | — | ||||||||||||||||||||||
| Net gain on change in control of interests | — | — | — | — | — | — | — | — | — | — | ||||||||||||||||||||||
| Straight-line rent adjustment | — | — | — | — | — | — | — | — | — | — | ||||||||||||||||||||||
| Noncontrolling interest in FFO | — | — | — | — | — | — | — | — | — | — | ||||||||||||||||||||||
| Pre-tax FFO from discontinued operations | — | — | — | — | — | — | — | — | — | — | ||||||||||||||||||||||
| Pre-Tax FFO | (50 | ) | — | — | — | (50 | ) | (2,763 | ) | — | — | — | (2,763 | ) | ||||||||||||||||||
| Income tax benefit (expense) on FFO | — | — | — | — | — | — | — | — | — | — | ||||||||||||||||||||||
| Funds From Operations (FFO) | $ | (50 | ) | $ | — | $ | — | $ | — | $ | (50 | ) | $ | (2,763 | ) | $ | — | $ | — | $ | — | $ | (2,763 | ) | ||||||||
| Depreciation and amortization - Real Estate Groups | — | — | — | — | — | — | — | — | — | — | ||||||||||||||||||||||
| Gain (loss) on disposition of rental properties and partial interests in rental properties, net of noncontrolling interest | — | — | — | — | — | — | — | — | — | — | ||||||||||||||||||||||
| Gain (loss) on disposition of unconsolidated entities | — | — | — | — | — | — | — | — | — | — | ||||||||||||||||||||||
| Impairment of consolidated and unconsolidated depreciable real estate | — | — | — | — | — | — | — | — | — | — | ||||||||||||||||||||||
| Non-FFO from discontinued operations | — | — | — | — | — | — | — | — | — | — | ||||||||||||||||||||||
| Net earnings (loss) attributable to Forest City Enterprises, Inc. | $ | (50 | ) | $ | — | $ | — | $ | — | $ | (50 | ) | $ | (2,763 | ) | $ | — | $ | — | $ | — | $ | (2,763 | ) | ||||||||
47
Forest City Enterprises, Inc. and Subsidiaries
Supplemental Financial Information
Summary of Funds From Operations (FFO) - Three and Nine Months Ended October 31, 2013 (in thousands) (continued)
| Three Months Ended October 31, 2013 | Nine Months Ended October 31, 2013 | |||||||||||||||||||||||||||||||
Full Consolidation (GAAP) | Less Noncontrolling Interest | Plus Unconsolidated Investments at Pro-Rata | Plus Discontinued Operations | Pro-Rata Consolidation (Non-GAAP) | Full Consolidation (GAAP) | Less Noncontrolling Interest | Plus Unconsolidated Investments at Pro-Rata | Plus Discontinued Operations | Pro-Rata Consolidation (Non-GAAP) | |||||||||||||||||||||||
| Corporate Group | ||||||||||||||||||||||||||||||||
| Revenues from real estate operations | $ | — | $ | — | $ | — | $ | — | $ | — | $ | — | $ | — | $ | — | $ | — | $ | — | ||||||||||||
| Exclude straight-line rent adjustment | — | — | — | — | — | — | — | — | — | — | ||||||||||||||||||||||
| Adjusted revenues | — | — | — | — | — | — | — | — | — | — | ||||||||||||||||||||||
| Add interest and other income | 70 | — | — | — | 70 | 229 | — | — | — | 229 | ||||||||||||||||||||||
| Equity in earnings (loss) of unconsolidated entities | — | — | — | — | — | — | — | — | — | — | ||||||||||||||||||||||
| Net (gain) loss on land held for divestiture activity of unconsolidated entities | — | — | — | — | — | — | — | — | — | — | ||||||||||||||||||||||
| Exclude gain on disposition of unconsolidated entities | — | — | — | — | — | — | — | — | — | — | ||||||||||||||||||||||
| Exclude depreciation and amortization of unconsolidated entities | — | — | — | — | — | — | — | — | — | — | ||||||||||||||||||||||
| Exclude interest expense of unconsolidated entities | — | — | — | — | — | — | — | — | — | — | ||||||||||||||||||||||
| Exclude (gain) loss on extinguishment of debt of unconsolidated entities | — | — | — | — | — | — | — | — | — | — | ||||||||||||||||||||||
| Adjusted total income | 70 | — | — | — | 70 | 229 | — | — | — | 229 | ||||||||||||||||||||||
| Operating expenses | 12,635 | — | — | — | 12,635 | 38,741 | — | — | — | 38,741 | ||||||||||||||||||||||
| Non-Real Estate depreciation and amortization | 701 | — | — | — | 701 | 2,217 | — | — | — | 2,217 | ||||||||||||||||||||||
| Exclude straight-line rent adjustment | — | — | — | — | — | — | — | — | — | — | ||||||||||||||||||||||
| Adjusted operating expenses | 13,336 | — | — | — | 13,336 | 40,958 | — | — | — | 40,958 | ||||||||||||||||||||||
| Net operating income | (13,266 | ) | — | — | — | (13,266 | ) | (40,729 | ) | — | — | — | (40,729 | ) | ||||||||||||||||||
| Interest expense | (13,618 | ) | — | — | — | (13,618 | ) | (44,096 | ) | — | — | — | (44,096 | ) | ||||||||||||||||||
| Interest expense of unconsolidated entities | — | — | — | — | — | — | — | — | — | — | ||||||||||||||||||||||
| Gain (loss) on extinguishment of debt | (13,076 | ) | — | — | — | (13,076 | ) | (18,102 | ) | — | — | — | (18,102 | ) | ||||||||||||||||||
| Gain (loss) on extinguishment of debt of unconsolidated entities | — | — | — | — | — | — | — | — | — | — | ||||||||||||||||||||||
| Net gain (loss) on land held for divestiture activity | — | — | — | — | — | — | — | — | — | — | ||||||||||||||||||||||
| Net gain (loss) on land held for divestiture activity of unconsolidated entities | — | — | — | — | — | — | — | — | — | — | ||||||||||||||||||||||
| Impairment of consolidated non-depreciable real estate | — | — | — | — | — | — | — | — | — | — | ||||||||||||||||||||||
| Amortization of mortgage procurement costs - Real Estate Groups | — | — | — | — | — | — | — | — | — | — | ||||||||||||||||||||||
| Net gain on change in control of interests | — | — | — | — | — | — | — | — | — | — | ||||||||||||||||||||||
| Straight-line rent adjustment | — | — | — | — | — | — | — | — | — | — | ||||||||||||||||||||||
| Noncontrolling interest in FFO | — | — | — | — | — | — | — | — | — | — | ||||||||||||||||||||||
| Pre-tax FFO from discontinued operations | — | — | — | — | — | — | — | — | — | — | ||||||||||||||||||||||
| Pre-Tax FFO | (39,960 | ) | — | — | — | (39,960 | ) | (102,927 | ) | — | — | — | (102,927 | ) | ||||||||||||||||||
| Income tax benefit (expense) on FFO | 69,393 | — | — | — | 69,393 | 96,177 | — | — | — | 96,177 | ||||||||||||||||||||||
| Funds From Operations (FFO) | $ | 29,433 | $ | — | $ | — | $ | — | $ | 29,433 | $ | (6,750 | ) | $ | — | $ | — | $ | — | $ | (6,750 | ) | ||||||||||
| Depreciation and amortization - Real Estate Groups | — | — | — | — | — | — | — | — | — | — | ||||||||||||||||||||||
| Gain (loss) on disposition of rental properties and partial interests in rental properties, net of noncontrolling interest | — | — | — | — | — | — | — | — | — | — | ||||||||||||||||||||||
| Gain (loss) on disposition of unconsolidated entities | — | — | — | — | — | — | — | — | — | — | ||||||||||||||||||||||
| Impairment of consolidated and unconsolidated depreciable real estate | — | — | — | — | — | — | — | — | — | — | ||||||||||||||||||||||
| Non-FFO from discontinued operations | — | — | — | — | — | — | — | — | — | — | ||||||||||||||||||||||
| Income tax benefit (expense) on non-FFO: | ||||||||||||||||||||||||||||||||
| Gain on disposition of rental properties | (204,162 | ) | — | — | — | (204,162 | ) | (220,993 | ) | — | — | — | (220,993 | ) | ||||||||||||||||||
| Impairment of depreciable real estate | 33,864 | — | — | — | 33,864 | 36,988 | — | — | — | 36,988 | ||||||||||||||||||||||
| Net earnings (loss) attributable to Forest City Enterprises, Inc. | $ | (140,865 | ) | $ | — | $ | — | $ | — | $ | (140,865 | ) | $ | (190,755 | ) | $ | — | $ | — | $ | — | $ | (190,755 | ) | ||||||||
| Preferred dividends and inducements of preferred stock conversion | — | — | — | — | — | (185 | ) | — | — | — | (185 | ) | ||||||||||||||||||||
| Net earnings (loss) attributable to Forest City Enterprises, Inc. common shareholders | $ | (140,865 | ) | $ | — | $ | — | $ | — | $ | (140,865 | ) | $ | (190,940 | ) | $ | — | $ | — | $ | — | $ | (190,940 | ) | ||||||||
48
Forest City Enterprises, Inc. and Subsidiaries
Supplemental Financial Information
Summary of Funds From Operations (FFO) - Three and Nine Months Ended October 31, 2013 (in thousands) (continued)
| Three Months Ended October 31, 2013 | Nine Months Ended October 31, 2013 | |||||||||||||||||||||||||||||||
Full Consolidation (GAAP) | Less Noncontrolling Interest | Plus Unconsolidated Investments at Pro-Rata | Plus Discontinued Operations | Pro-Rata Consolidation (Non-GAAP) | Full Consolidation (GAAP) | Less Noncontrolling Interest | Plus Unconsolidated Investments at Pro-Rata | Plus Discontinued Operations | Pro-Rata Consolidation (Non-GAAP) | |||||||||||||||||||||||
| Total | ||||||||||||||||||||||||||||||||
| Revenues from real estate operations | $ | 266,227 | $ | 22,425 | $ | 103,591 | $ | 137 | $ | 347,530 | $ | 853,936 | $ | 67,088 | $ | 303,015 | $ | 20,664 | $ | 1,110,527 | ||||||||||||
| Exclude straight-line rent adjustment | (4,664 | ) | — | — | 20 | (4,644 | ) | (11,950 | ) | — | — | (159 | ) | (12,109 | ) | |||||||||||||||||
| Adjusted revenues | 261,563 | 22,425 | 103,591 | 157 | 342,886 | 841,986 | 67,088 | 303,015 | 20,505 | 1,098,418 | ||||||||||||||||||||||
| Add interest and other income | 13,881 | 534 | 124 | — | 13,471 | 37,063 | 1,474 | 365 | 224 | 36,178 | ||||||||||||||||||||||
| Equity in earnings (loss) of unconsolidated entities | 46,660 | 162 | (45,442 | ) | — | 1,056 | 60,682 | (644 | ) | (64,678 | ) | — | (3,352 | ) | ||||||||||||||||||
| Net (gain) loss on land held for divestiture activity of unconsolidated entities | (186 | ) | — | 186 | — | — | (867 | ) | — | 867 | — | — | ||||||||||||||||||||
| Exclude gain on disposition of unconsolidated entities | (34,281 | ) | — | 34,281 | — | — | (32,771 | ) | — | 32,771 | — | — | ||||||||||||||||||||
| Exclude depreciation and amortization of unconsolidated entities | 19,390 | — | (19,390 | ) | — | — | 56,884 | — | (56,884 | ) | — | — | ||||||||||||||||||||
| Exclude interest expense of unconsolidated entities | 26,158 | — | (26,158 | ) | — | — | 75,431 | — | (75,431 | ) | — | — | ||||||||||||||||||||
| Exclude (gain) loss on extinguishment of debt of unconsolidated entities | 50 | — | (50 | ) | — | — | 57 | — | (57 | ) | — | — | ||||||||||||||||||||
| Adjusted total income | 333,235 | 23,121 | 47,142 | 157 | 357,413 | 1,038,465 | 67,918 | 139,968 | 20,729 | 1,131,244 | ||||||||||||||||||||||
| Operating expenses | 210,255 | 13,004 | 47,142 | 434 | 244,827 | 603,715 | 43,728 | 139,968 | 12,562 | 712,517 | ||||||||||||||||||||||
| Non-Real Estate depreciation and amortization | 1,101 | — | — | — | 1,101 | 3,476 | — | — | — | 3,476 | ||||||||||||||||||||||
| Exclude straight-line rent adjustment | 242 | — | — | — | 242 | (1,232 | ) | — | — | — | (1,232 | ) | ||||||||||||||||||||
| Adjusted operating expenses | 211,598 | 13,004 | 47,142 | 434 | 246,170 | 605,959 | 43,728 | 139,968 | 12,562 | 714,761 | ||||||||||||||||||||||
| Net operating income | 121,637 | 10,117 | — | (277 | ) | 111,243 | 432,506 | 24,190 | — | 8,167 | 416,483 | |||||||||||||||||||||
| Interest expense | (72,126 | ) | (6,950 | ) | (26,158 | ) | (16 | ) | (91,350 | ) | (250,100 | ) | (21,361 | ) | (75,431 | ) | (2,777 | ) | (306,947 | ) | ||||||||||||
| Interest expense of unconsolidated entities | (26,158 | ) | — | 26,158 | — | — | (75,431 | ) | — | 75,431 | — | — | ||||||||||||||||||||
| Gain (loss) on extinguishment of debt | (13,096 | ) | — | (50 | ) | — | (13,146 | ) | 6,335 | — | (57 | ) | (36 | ) | 6,242 | |||||||||||||||||
| Gain (loss) on extinguishment of debt of unconsolidated entities | (50 | ) | — | 50 | — | — | (57 | ) | — | 57 | — | — | ||||||||||||||||||||
| Net gain (loss) on land held for divestiture activity | — | — | 186 | — | 186 | (7,555 | ) | (720 | ) | 867 | — | (5,968 | ) | |||||||||||||||||||
| Net gain (loss) on land held for divestiture activity of unconsolidated entities | 186 | — | (186 | ) | — | — | 867 | — | (867 | ) | — | — | ||||||||||||||||||||
| Impairment of consolidated non-depreciable real estate | (112,838 | ) | (15,462 | ) | — | — | (97,376 | ) | (112,838 | ) | (15,462 | ) | — | — | (97,376 | ) | ||||||||||||||||
| Amortization of mortgage procurement costs - Real Estate Groups | (2,838 | ) | — | — | — | (2,838 | ) | (9,376 | ) | — | — | (50 | ) | (9,426 | ) | |||||||||||||||||
| Net gain on change in control of interests | — | — | — | — | — | 2,762 | — | — | — | 2,762 | ||||||||||||||||||||||
| Straight-line rent adjustment | 4,906 | — | — | (20 | ) | 4,886 | 10,718 | — | — | 159 | 10,877 | |||||||||||||||||||||
| Noncontrolling interest in FFO | 12,295 | 12,295 | — | — | — | 13,353 | 13,353 | — | — | — | ||||||||||||||||||||||
| Pre-tax FFO from discontinued operations | (313 | ) | — | — | 313 | — | 5,463 | — | — | (5,463 | ) | — | ||||||||||||||||||||
| Pre-Tax FFO | (88,395 | ) | — | — | — | (88,395 | ) | 16,647 | — | — | — | 16,647 | ||||||||||||||||||||
| Income tax benefit (expense) on FFO | 69,393 | — | — | — | 69,393 | 96,177 | — | — | — | 96,177 | ||||||||||||||||||||||
| Funds From Operations (FFO) | $ | (19,002 | ) | $ | — | $ | — | $ | — | $ | (19,002 | ) | $ | 112,824 | $ | — | $ | — | $ | — | $ | 112,824 | ||||||||||
| Depreciation and amortization - Real Estate Groups | (96,609 | ) | — | — | — | (96,609 | ) | (281,012 | ) | — | — | (2,000 | ) | (283,012 | ) | |||||||||||||||||
| Gain (loss) on disposition of rental properties and partial interests in rental properties, net of noncontrolling interest | 491,160 | — | 34,281 | 1,114 | 526,555 | 496,092 | — | 32,771 | 38,382 | 567,245 | ||||||||||||||||||||||
| Gain (loss) on disposition of unconsolidated entities | 34,281 | — | (34,281 | ) | — | — | 32,771 | — | (32,771 | ) | — | — | ||||||||||||||||||||
| Impairment of consolidated and unconsolidated depreciable real estate | (87,317 | ) | — | — | — | (87,317 | ) | (95,372 | ) | — | — | — | (95,372 | ) | ||||||||||||||||||
| Non-FFO from discontinued operations | 1,114 | — | — | (1,114 | ) | — | 36,382 | — | — | (36,382 | ) | — | ||||||||||||||||||||
| Income tax benefit (expense) on non-FFO: | ||||||||||||||||||||||||||||||||
| Gain on disposition of rental properties | (204,162 | ) | — | — | — | (204,162 | ) | (220,993 | ) | — | — | — | (220,993 | ) | ||||||||||||||||||
| Impairment of depreciable real estate | 33,864 | — | — | — | 33,864 | 36,988 | — | — | — | 36,988 | ||||||||||||||||||||||
| Net earnings (loss) attributable to Forest City Enterprises, Inc. | $ | 153,329 | $ | — | $ | — | $ | — | $ | 153,329 | $ | 117,680 | $ | — | $ | — | $ | — | $ | 117,680 | ||||||||||||
| Preferred dividends and inducements of preferred stock conversion | — | — | — | — | — | (185 | ) | — | — | — | (185 | ) | ||||||||||||||||||||
| Net earnings (loss) attributable to Forest City Enterprises, Inc. common shareholders | $ | 153,329 | $ | — | $ | — | $ | — | $ | 153,329 | $ | 117,495 | $ | — | $ | — | $ | — | $ | 117,495 | ||||||||||||
49